Population genetic structure of Australian Galapagos reef
45
Final report to the Department of the Environment, Water, Heritage and the Arts Population genetic structure of Australian Galapagos reef sharks Carcharhinus galapagensis at Elizabeth and Middleton Reefs Marine National Nature Reserve and Lord Howe Island Marine Park Prepared by Lynne van Herwerden, Dareen Almojil, and Howard Choat Molecular Ecology and Evolution Laboratory, School of Marine and Tropical Biology, James Cook University
Transcript of Population genetic structure of Australian Galapagos reef

Final report to the Department of the Environment, Water, Heritage and the Arts
Population genetic structure of Australian Galapagos reef sharks Carcharhinus galapagensis at Elizabeth and
Middleton Reefs Marine National Nature Reserve and Lord Howe Island Marine Park
Prepared by Lynne van Herwerden, Dareen Almojil, and Howard Choat
Molecular Ecology and Evolution Laboratory, School of Marine and Tropical Biology, James Cook University

Carcharhinus galapagensis stocks: Elizabeth-Middleton Reefs and Lord Howe Island
2
© Commonwealth of Australia 2008 This work is copyright. Apart from any use as permitted under the Copyright Act 1968, no part
may be reproduced by any process without prior written permission from the Commonwealth. Requests and inquiries concerning reproduction and rights should be addressed to the Commonwealth Copyright Administration, Attorney General’s Department, Robert Garran Offices, National Circuit, Barton ACT 2600 or posted at http://www.ag.gov.au/cca
The views and opinions expressed in this publication are those of the authors and do not necessarily reflect those of the Australian Government or the Minister for the Environment, Heritage and the Arts or the Minister for Climate Change and Water. While reasonable efforts have been made to ensure that the contents of this publication are factually correct, the Commonwealth does not accept responsibility for the accuracy or completeness of the contents, and shall not be liable for any loss or damage that may be occasioned directly or indirectly through the use of, or reliance on, the contents of this publication.
Carcharhinus galapagensis stocks: Elizabeth-Middleton Reefs and Lord Howe Island
3
1. Executive summary The present study is the first to investigate genetic structure of the Galapagos reef
shark Carcharhinus galapagensis. The only Australian populations of this apex
predator occur at the Elizabeth and Middleton Reefs Marine National Nature Reserve
and Lord Howe Island Marine Park, which includes Balls Pyramid. An insight into the
Australian population genetic stock structure of this worldwide patchily distributed
shark will inform management and conservation strategies, specifically at the
Elizabeth and Middleton Reefs Marine National Nature Reserve and the Lord Howe
Island Marine Park.
The aim of this study was to determine if C. galapagensis present at Middleton Reef
(n=28), Elizabeth Reef (n=29) and Lord Howe Island (n=29) form a single or multiple
stocks. The non-coding mitochondrial DNA (mtDNA) control region was sequenced
for all individuals sampled and revealed 21 polymorphic sites and 36 haplotypes.
Significant population structure was identified by an analysis of molecular variance
(AMOVA), Fst = 0.5416, P<0.0001, confirming the presence of multiple Australian
stocks. The Elizabeth and Middleton Reefs population forms a single stock, which is
distinct from the Lord Howe Island population. Haplotype and nucleotide diversities
differed substantially between these stocks (h= 0.186; π = 0.29% + 0.002 and h=
0.933; π = 1.18% + 0.006 respectively) and suggest that the Elizabeth-Middleton Reef
population has low genetic resilience compared to the Lord Howe population. The
overall diversity of Australian C. galapagensis mtDNA control region was h =
0.5717, which is relatively high compared to other sharks but, low when compared to
marine teleosts. The low genetic diversity in sharks is attributed to various factors
such as their role as apex predators with low effective population size, their slow life
history, low fecundity and long generation time. Coalescence analyses suggested that
the Elizabeth - Middleton Reefs population was sourced from the Lord Howe Island
population during the late Pleistocene. This C. galapagensis genetic structure is based
on female mediated gene flow (mtDNA) alone and may therefore indicate philopatric
behaviour.
Whilst this report provides important management information, which implies that
Elizabeth-Middleton Reef and Lord Howe Island populations be managed as separate

Carcharhinus galapagensis stocks: Elizabeth-Middleton Reefs and Lord Howe Island
4
resources, which are unlikely to replenish each other in the event of the loss of either
population from the area, it also identifies two additional studies that are required to
ensure that management outcomes are optimal. These are:
1) It would be strategic to initiate a study that evaluates the impact of recreational and
charter fishing activities in partially fished and no take reserves at Elizabeth and
Middleton Reefs Marine National Nature Reserve and Lord Howe Island Marine
Park, in order to test the hypothesis that partially protected areas open to recreational
fishing will suffer reduced abundances and sizes of apex predators such as grouper
(black cod) and Galapagos sharks, as was found in Hawaii, even if they are not target
species.
2) Future genetic studies of C. galapagensis in the Tasman Sea will need to include
additional samples from these (ideally at least fifty individuals) and other populations
such as the Kermadecs, New Zealand, in order to identify what gene flow (if any)
exists between this nearest neighbour to the Australian populations. They will also
need to incorporate additional nuclear (microsatellite) markers to determine both the
scale of gene flow and evidence for male-mediated gene flow, since this study had
insufficient power to realise this.

Carcharhinus galapagensis stocks: Elizabeth-Middleton Reefs and Lord Howe Island
5
2. Introduction: Although sharks comprise more than 500 known species to date (Compagno, 1984),
few shark population genetic studies have been published (Table1). These studies
have been hindered by extremely low genetic differentiation at allozyme loci (Smith,
1982) and mtDNA (Nei, 1989). The low level of variation is considered to be due to
relatively low mutation rates in sharks compared to other vertebrates (Martin, 1995).
This in turn, may result from a number of shark properties, such as reproductive
success, body size and habitat preference (Table 2).
The Galapagos shark (Carcharhinus galapagensis) is a large shark (maximum
reported length = 370cm) that exhibits a patchy, circumglobal distribution in tropical
and temperate waters (Compagno, 1984). In Australia, this species only occurs on
coral reefs at the Elizabeth and Middleton Reefs Marine National Nature Reserve and
Lord Howe Island, the southernmost coral reefs in the world. In general, C.
galapagensis is characterized by a slow maturation time of approximately 10 years, a
long gestation period of 12 months and the production of few offspring (6-16
pups/litter) (Wetherbee et al., 1997). Moreover, as for all sharks, it lacks a dispersal
larval phase and parental care, therefore the use of nursery grounds is crucial to
achieve successful recruitment (Keeney et al., 2003). Kato and Carvallo (1967)
reported that C. galapagensis juveniles were limited to shallow water (<20m) at the
Revillagigedo Islands and that adults seldom occur with juveniles. Moreover
Wetherbee et al. (1997) noted a depth segregation based on sex and age displayed by
C. galapagensis. It is noteworthy that most individuals appeared too small to be
mature and it is therefore likely that larger Galapagos sharks occur in deeper
unsurveyed waters at these reefs and at Lord Howe Island (Choat et al, 2006, Speare
et al 2004). This suggests a capacity for philopatry, a common practice in most sharks
(Springer, 1967). Molecular tools, specifically targeting the mtDNA, which is
inherited exclusively from the mother, will therefore be useful to examine the
evidence for philopatry in this species.
Densities of Galapagos sharks at Elizabeth and Middleton Reefs and at Lord Howe
Island were almost an order of magnitude higher than on tropical coral reefs surveyed
using the same techniques elsewhere (Great Barrier Reef Marine Park along the east
Australian coast, oceanic atoll reefs of the Rowley Shoals Marine Park along the north

Carcharhinus galapagensis stocks: Elizabeth-Middleton Reefs and Lord Howe Island
6
east Australian coast and in subtropical reefs of the Great Australian Bight in South
Australian waters), indicating healthy populations at the times of survey (Oxley et al,
2004, Choat et al 2006, Speare et al 2004).
The current global distribution of C. galapagensis (Figure1) suggests a trans-oceanic
dispersal ability. Tagging studies, however show that movements spanned small
distances which ranged from 5 miles (Holzwarth et al., 2006) to 14 km (Kohler and
Turner, 2001). Compagno (1984) suggested that these sharks are fairly localised
around islands but are capable of travelling at least 50 km between islands. Genetic
data will allow us to determine whether there is migration at this spatial scale (50 km)
and further.
Figure 1. C. galapagensis geographic distribution.

Carcharhinus galapagensis stocks: Elizabeth-Middleton Reefs and Lord Howe Island
7
Common name Species name Method Population structure Author(s)
Gummy shark Mustelus antarcticus A No heterogeneity in southern and western Australia MacDonald (1988)
spottail shark Carcharhinus sorrah A No heterogeneity in northern Australia Lavery and Shakel (1989)
Australian Blacktip shark Carcharhinus tilsoni A No heterogeneity in northern Australia Lavery and Shakel (1989)
Sandbar shark Carcharhinus plumbeus A,M No heterogeneity between Gulf of mexico and mid Atlantic Heist et al. (1995)
Shortfin mako Isurus oxyrinchus M Significant heterogeniety between oceans Heist et al. (1996a)
Atlantic sharpnose shark Rhizoprionodon terraenovae M No heterogeniety btw mid Atlantic and Gulf of Mexico Heist et al. (1996b)
Pacific angel shark Squatina californica A Significant heterogeniety btw Channel Islands Gaida (1997)
Gummy shark Mustelus antarcticus A,M Significant allozyme heterogeniety btw east/south Australia Ward and Garden (1997)
School shark Galeorhinus galeus A,M No heterogeniety in Australia / heterogeniety among oceans Ward and Garden (1997)
Great white shark Carcharodon carcharius M heterogenety btw South Afric, Australia and New Zealand Pardini et al. (2001)
Blacktip shark Carcharius limbatus M,Mt heterogeneity btw w. Atlantic,Caribbean and Gulf of maxico Keeney et al. (2005)
Hammerhead shark Sphyrna lewini M heterogeneity btw Atlantic, Pacific and Indian Oceans. Duncan et al. (2006)
Basking shark Cetorhinus maximus M No heterogeneity btw ocean basins. Hoelzel et al. (2006)
Whale shark Rhincodon typus M heterogeneity btw Atlantic and Indo-Pacific. Castro et al. (2007)
Table1. Summary of past shark population studies and their main outcome. (A = Allozymes, M = Mitochondrial DNA, Mt = Microsatellites).

Carcharhinus galapagensis stocks: Elizabeth-Middleton Reefs and Lord Howe Island
8
Common name Species name Habitat Reproductive mode max.length H No.loci Reference
Gummy shark Mustelus antarcticus Continental shelf Aplacental viviparity 185cm TL 0.006 21 MacDonald (1988)
…. …. …. …. …. 0.096 28 Ward& Gardner(1997)
spottail shark Carcharhinus sorrah Continental shelf Placental viviparous 160cm TL 0.035 47 Lavery& Shakel (1989)
Australian Blacktip shark Carcharhinus tilsoni Continental shelf Placental viviparous 200cm TL 0.037 47 Lavery& Shakel (1989)
Sandbar shark Carcharhinus plumbeus Oceanic banks Placental viviparous 300cm TL 0.005 …. Heist et al. (1995)
Shortfin mako Isurus oxyrinchus Coastal and Oceanic Ovoviviparous 400cm TL …. …. Compagno (1984)
Atlantic sharpnose shark Rhizoprionodon terraenovae Continental shelf Placental viviparous 67cm TL …. …. Compagno (1984)
Pacific angel shark Squatina californica Continental shelf Unknown 152cm TL 0.056 29 Gaida (1997)
School shark Galeorhinus galeus Continental shelf Ovoviviparous 195cmTL 0.001 …. Ward and Garden (1997)
School shark ** ** ** ** 0.003 …. Smith (1986)
Great white shark Carcharodon carcharius Oceanic Aplacental viviparity 600cm TL 0.694 38 Pardini et al. (2001)
Blacktip shark Carcharius limbatus Continental shelf Placental viviparous 255cm TL 0.486 34 Keeney et al. (2005)
Scalloped hammerhead Sphyrna lewini Continental shelf Viviparous 420cm TL …. …. Compagno (1984)
Basking shark Cetorhinus maximus Continental shelf Presumed oophagous 1000cm TL …. …. Compagno (1984)
Whale shark Rhincodon typus Oceanic Ovoviviparous 2100cm TL …. …. Compagno (1984)
Table2. Summary of mean heterozygosity in correlation to habitat preference, reproductive strategy and body size between different shark species (H Mean heterozygosity, …. No data and ** repeated data).

Carcharhinus galapagensis stocks: Elizabeth-Middleton Reefs and Lord Howe Island
9
Two past population structure studies of worldwide distributed sharks showed
heterogeneity based on maternally inherited DNA. Ward and Garner (1997) studied
the school shark from the Indian Ocean, Bass Strait, North Atlantic, South Atlantic
and New Zealand and reported a significant variation in the haplotype frequencies
between samples, suggesting genetic partitioning within and among Ocean basins.
Likewise, Heist et al. (1996a) reported similar genetic heterogeneity in the shortfin
mako shark (Isurus oxyrinchus) from North and South Pacific and North and South
Atlantic populations.
Insight into the genetic structure of C .galapagensis at a relatively small geographical
scale (in the order of 50 km between Middleton and Elizabeth Reefs and 175 km
between Elizabeth Reef and Lord Howe Island) will inform us about connectivity at
these spatial scales and identify conservation strategies that are needed to manage
these important members of the marine ecosystem in a sustainable way.
In this study we test the null hypothesis that there is a single Australian population
that shares a common gene pool. The main aim of the study was therefore to
determine the population genetic structure of C. galapagensis from Middleton Reef,
Elizabeth Reef and Lord Howe Island by obtaining and comparing genetic data from
the non coding region of the mtDNA (M) with nuclear markers (Mt) in order to:
1. Confirm the identity of Australian C. galapagensis by comparison to Hawaiian C.
galapagensis and other sharks, using mtDNA sequence data and phylogenetic
analysis.
2. Determine population structure of C. galapagensis in Australia, using both mtDNA
and nuclear (microsatellite) markers in order to detect philopatry and/or connectivity
between sites.
3. Assess the level of genetic diversity of C. galapagensis and compare it to other
broadly distributed sharks, marine reptiles, marine mammals and teleosts. (M)
4. Identify challenges associated with the limited reproductive output and dispersal
ability of C. galapagensis.

Carcharhinus galapagensis stocks: Elizabeth-Middleton Reefs and Lord Howe Island
10
3. Materials and methods
3.1 Collection of tissues and study sites
Eighty six samples of C. galapagensis were collected randomly from Middleton and
Elizabeth Reefs Marine National Nature Reserve and Lord Howe Island Marine Park
(Figure 2).
Eighty samples were collected as dorsal fin clips from sharks caught by line fishing
and immediately released, while the remaining six were taken as skin and white
muscle tissues by in situ underwater biopsy probe following Robbins (2006). All
tissue samples were immediately placed in 80% EtOH, and stored at room
temperature.
Additional samples were included in the study through external collaboration (Table
3). From Hawaii two C. galapagensis were used as a comparative control to confirm
the Australian C. galapagensis species identity. Four sand bar shark (Carcharhinus
plumbeus), two from Hawaii and two from Australia; two bull sharks (Carcharhinus
leucus) and two whitetip reef sharks (Triaenodon obesus) were included as out groups
to root the phylogenetic tree.
Common name Scientific name Location Date of collection Sample size SourceGalapagos shark C.galapagensis Middleton Reef Feb.2006 28 JCU-DEWR survey
C.galapagensis Elizabeth Reef Feb.2006 29 JCU-DEWR surveyC.galapagensis Lord Howe Islad Jan.2007 29 Fisher men*C.galapagensis Hawaii Aug.2006 2 Ms. Toby Day Engel
Sandbar shark C.plumbeus Australia Feb.2006 2 Will RobbinsC.plumbeus Hawaii Feb.2006 2 Ms. Toby Day Engel
Bull shark C.leucus Australia Feb.2006 2 Will Robbins
Whitetip reef shark T.obesus Australia Feb.2006 2 Will Robbins
Table 3: Summary of sampling sites, date of collection, sample size and source. * Fishermen, S. Wilson, G. Johnson, K. Galloway and J. Shick

Carcharhinus galapagensis stocks: Elizabeth-Middleton Reefs and Lord Howe Island
11
3.2 DNA extraction
Total genomic DNA was extracted from approximately 15mg of tissue. Extractions
were performed using phenol/chloroform and precipitated using ethanol following
protocols of Sambrook et al (1989). DNA pellets were resuspended in 50 µl of TE
buffer. The quality and quantity of extracted DNA was checked against a size
standard (New England Biolabs, www.neb.com) using a 0.8% agarose gel.
Electrophoresis was performed for 20 minutes at 100 Volts (V). Elizabeth and
Middleton Reefs populations were screened using 1µl of neat DNA while the Lord
Howe population was screened using 1 µl of 1/4 diluted DNA for both mtDNA and
microsatellite PCR amplification reactions.
3.3 mt-DNA amplification and sequencing
The non-coding region of the mitochondrial DNA was selectively amplified using
Light strand ProL2 (5’-CTG CCC TTG GCT CCC AAA GC-3’) (Pardini et al. 2001)
and heavy strand 282H (5’-AAG GCT AGG ACC AAA CCT-3’) (Keeney et al.
2003) primers by polymerase chain reaction (PCR) using an MJ Research PTC-200
thermal cycler as follows:
Elizabeth and Middleton Reefs samples required different reaction conditions than
Lord Howe Island samples. In the former populations, reactions were carried out in a
total volume of 20 µl which consisted of, 2.0µl PCR buffer (10X), 1.3 µl of 2mM
deoxynucleotide triphosphates (DNTPs), 1µl of Forward primer (10 pmol/µl), 1µl of
Reverse primer (10 pmol/µl), 0.3 µl of Taq DNA polymerase (Qiagen kit) and 1 µl of
non- diluted DNA.
The Lord Howe Island samples had to be processed differently: reactions took place
in 30 µl aliquots and contained 3.0µl PCR buffer (10X), 2.0 µl deoxynucleotide
triphosphates (DNTPs) (2mM each), 1.5µl of each Forward and Reverse primers (10
pmol/µl), 0.5µl of Taq DNA polymerase (Qiagen kit) and 1 µl of 1/4 diluted DNA.

Carcharhinus galapagensis stocks: Elizabeth-Middleton Reefs and Lord Howe Island
12
Figure 2: Study site, A. South East Australia. B. Middleton Reef (Red) (latitude 29°27'S and longitude 159°07'E); Elizabeth Reef (Green) (latitude 29°56'S and longitude 159°05'E) and Lord Howe Island (Blue) (31°30'S latitude, some 700 km north-east of Sydney).
The PCR cycling conditions for all samples were an initial denaturation at 94 ºC for
2.0 minutes, 30 cycles of 94 ºC for 30 seconds, 53 ºC for 30 seconds, and 72 ºC for
1:30 minutes. A final extension of 72 ºC for 10 minutes was done.
PCR product was evaluated using 5µl of product, which was run on 1.5 % agarose gel
containing ethidium bromide. Products, which showed strong single bands on the
check gels, were cleaned up with 70% isopropanol, vacuumed and quantified before
being sent for sequencing. Sequencing was done by Macrogen (www.macrogen.com)
using the forward primer after confirming that Forward and Reverse sequences are
compatible.
Middleton Reef
Elizabeth Reef
Lord Howe Island
0
Kilometres
500
Middleton Reef
Elizabeth Reef
Lord Howe Island
0
Kilometres
500 1.000
Middleton Reef
Elizabeth Reef
Lord Howe Island
0
Kilometres
500
Middleton Reef
Elizabeth Reef
Lord Howe Island
0
Kilometres
500 1.000
Middleton Reef
Elizabeth Reef
Lord Howe Island
0
Kilometres
500
Middleton Reef
Elizabeth Reef
Lord Howe Island
0
Kilometres
500 1.000
Middleton Reef
Elizabeth Reef
Lord Howe Island
0
Kilometres
500
Middleton Reef
Elizabeth Reef
Lord Howe Island
0
Kilometres
500 1.000
A.
B.
Middleton Reef
Elizabeth Reef
Lord Howe Island
0
Kilometres
500
Middleton Reef
Elizabeth Reef
Lord Howe Island
0
Kilometres
500 1.000
Middleton Reef
Elizabeth Reef
Lord Howe Island
0
Kilometres
500
Middleton Reef
Elizabeth Reef
Lord Howe Island
0
Kilometres
500 1.000
Middleton Reef
Elizabeth Reef
Lord Howe Island
0
Kilometres
500
Middleton Reef
Elizabeth Reef
Lord Howe Island
0
Kilometres
500 1.000
Middleton Reef
Elizabeth Reef
Lord Howe Island
0
Kilometres
500
Middleton Reef
Elizabeth Reef
Lord Howe Island
0
Kilometres
500 1.000
Middleton Reef
Elizabeth Reef
Lord Howe Island
0
Kilometres
500
Middleton Reef
Elizabeth Reef
Lord Howe Island
0
Kilometres
500 1.000
Middleton Reef
Elizabeth Reef
Lord Howe Island
0
Kilometres
500
Middleton Reef
Elizabeth Reef
Lord Howe Island
0
Kilometres
500 1.000
Middleton Reef
Elizabeth Reef
Lord Howe Island
0
Kilometres
500
Middleton Reef
Elizabeth Reef
Lord Howe Island
0
Kilometres
500 1.000
Middleton Reef
Elizabeth Reef
Lord Howe Island
0
Kilometres
500
Middleton Reef
Elizabeth Reef
Lord Howe Island
0
Kilometres
500 1.000
A.
B.

Carcharhinus galapagensis stocks: Elizabeth-Middleton Reefs and Lord Howe Island
13
3.4 Microsatellite loci amplification, genotyping and analyses
3.4.1 Microsatellite amplification and genotyping
Six microsatellites were developed and used for the blacktip shark (Carcharhinus
limbatus) by Keeney and Heist (2003) (Table 4). These loci were tested for the
Galapagos shark (Carcharhinus galapagensis) by Daly-Engel et al. (2006). The PCR
conditions were as was followed in the mtDNA amplification with some
modifications (depending on locus) (Table 4).
Each microsatellite locus was amplified separately in 20 µl (Elizabeth and Middleton
Reefs) or 30µl (Lord Howe Island) reactions using the MJ Research PTC-200 Peltier
thermal cycle device and an optimized PCR recipe. PCR cycling conditions were as
follows: initial denaturation at 94 ºC for 2.0 min, 30-40 cycles of 94 ºC for 30 sec.,
52-60 ºC for 30 sec. (depending on primer set, see (Table 4), and 72 ºC for 1:30 min.
A final extension cycle of 72 ºC for 10 min was followed by an indefinite 11 ºC cycle.
Three loci (one of each fluorescent dye were combined together at a different ratio
depending on the strength of the PCR product, to a total volume of 30 µl of the PCR
fragment and treated as one set. Set.1 consisted of (Cli 12, Cli 108 and Cli 107) and
set.2 consisted of (Cli102, Cli103 and Cli106). The combined products of each set for
each individual was cleaned with Ethanol precipitation by adding 3 µl of ammonium
acetate and 90µl of cold 100% Ethanol and spin it for 20 min at full speed (4000
rpm). After that samples were inverted to tip out the solution and were spun upside
down on paper towel for one min. at (500rpm). After that 150µl of 70% cold Ethanol
from the freezer was added to the samples and inverted immediately on paper towel to
remove as much ethanol as possible and spin up side down on paper towel at a speed
of (500rpm) for one min., then samples were allowed to air dry for few minutes and
sent for genotyping at the Genetic Analysis Facility of James Cook University (GAF).
Despite extensive optimisations, only three of the six markers provided satisfactory
results (cli12, cli 107 and cli 108). As a result these three markers were the only
microsatellite markers included in population genetic analyses here.

Carcharhinus galapagensis stocks: Elizabeth-Middleton Reefs and Lord Howe Island
14
Locus 5' to 3' primer sequence Range
(bp)
Ta
(ºC)
Mg
Con.
Dye
label
Cycl
e#
Cli 12 F: TCCCAGTCACATTTACACATGC
R:GGAAGACCATTGAACCCAATC
184-194 58 1.5 TET 35
Cli 102 F:GACTGGCTGACCTAACTAAGC
R:ATCCTGTGGTCCTTCTATC
128-130 54 2.5 HEX 40
Cli 103 F:GCTTCATTCCATGAGAG
R:TTTCTCTGTCCTGGTGTTTC
118-124 52 1.5 FAM 40
Cli 106 F:GATTCTACAACCGCAACATTCG
R:GCTCCCCTAACTATTCCACGC
180-200 60 2.5 TET 40
Cli 107 F:GGATTCACAACACAGGGAAC
R:CTCATTCTTAGTTGCTCTCG
105-113 56 1.5 FAM 40
Cli 108 F:TCACTGGGTTAGACACTTCC
R;CCACAGTCAGAAAACAAATTG
126-142 56-
54
1.5 HEX 30
Table 4: Summarizes the microsatellite loci obtained from Keeney and Heist (2003),
their sequences, annealing temperature, Mg+2 concentration, fluorescent dye (Gene
work) label of forward primer and number of thermal cycles in each PCR reaction.
3.5 mtDNA data analysis:
Forward sequences were automatically aligned (CLUSTALW) then manually aligned
and edited using BioEdit (Hall, 1999). This was performed after the removal of
ambiguities in the beginning and the end of each sequence. Sequence alignment was
maintained by inserting gaps where required.
3.5.1 Phylogenetic analysis
Sequences were analysed using MEGA ver 3.0 (Kumar et al., 2004) and PAUP*
(Swofford, 2001) to construct phylogenetic trees. On the other hand Arlequin ver 3.1
(Excoffier et al., 2005) was used for population genetic analysis. All forward
sequences (822 bp) were included in phylogenetic analyses to identify genetically
distinct lineages and relationships between samples within lineages. The best
substitution model to fit the data was selected using Modeltest (Bohonak, 2002).

Carcharhinus galapagensis stocks: Elizabeth-Middleton Reefs and Lord Howe Island
15
Neighbour Joining (NJ) and Maximum parsimony (MP) trees using MEGA ver 3.0
(Kumar et al., 2004) and Maximum likelihood trees (ML) were constructed using
PAUP* version 4.10b (Swofford, 2001). Bootstrapping (Felsenstein, 1985) was used
to estimate the reliability of the trees by constructing consensus trees following 1000
replicates. The differences between individual sequences were determined for five
characters (A, G, T, C and gaps). The NJ and ML trees were rooted using the
outgroup shark species. These were, sand bar shark (Carcharhinus plumbeus), bull
shark (Carcharhinus leucus) and white tip reef shark (Triaenodon obesus).
3.5.2 Population genetic analysis
3.5.2.1 Minimum spanning tree (MST)
A Minimum Spanning Tree was constructed from Arlequin ver 3.1 (Excoffier et al.,
2005) to explore the amount of shared haplotypes between the three different
locations and the haplotype and nucleotide diversities of the data.
Nucleotide diversity (π) was obtained directly from the population genetic analysis
performed in Arlequin. This index is used to determine whether the population
exhibits a deep (many substitutions between haplotypes) or shallow (few substitutions
between haplotypes) population history. On the other hand, haplotype diversity (h)
was calculated using the following equation:
h= n (1- ∑ xi2)/ (n – 1) (Nei, 1989)
Where:
n = number of sampled individuals.
xi = frequency of the ith haplotype in the population.
This index (h) presents information about the number of shared haplotypes (Avise,
2004). In summary, the MST indicates the number of shared haplotypes and the
number of substitutions between haplotypes. Haplotype and nucleotide diversities
were then interpreted for both populations based on Grant and Bowen (1998) (Table
5).

Carcharhinus galapagensis stocks: Elizabeth-Middleton Reefs and Lord Howe Island
16
h π Small Large Small 1. Recent population
bottleneck or founder event by single or a few mtDNA lineages.
2. Population bottleneck followed by rapid population growth and accumulation of mutations.
Large 3. Divergence between geographically subdivided populations.
4. Large stable population with long evolutionary history or secondary contact between differentiated lineages.
Table 5: The four categories stated by Grant and Bowen (1998) to interpret haplotype and nucleotide diversities of marine fish.
3.5.2.2 Pairwise Fst and isolation by distance test (IBD)
The pairwise F-statistics fixation indices (Fst, Fct and Fsc) were measured to determine
evidence for gene flow between populations (Scheinder et al., 2000). The P-values of
these indices were also measured directly from Arlequin ver 3.0 following 10000
resampling of the data. Comparing the pairwise Fst among populations of different
locations should reveal if there is population subdivision, where this subdivision
occurs and whether it is likely that isolation by distance affects the genetic structure
(Bohonak 2002). Isolation by distance was tested formally using the Mantel test
(Bohonak, 2002). The program for isolation by distance, IBD ver.1.4, can be obtained
freely at http:// www.bio.sdsu.edu/pub/andy/IBD.html. This test plots genetic distance
(pairwise Fst) against geographic distance (km) (Bohonak, 2002). The IBD program
establishes if the two measures are significantly correlated or not. This is done using
both non-transformed and log-transformed analyses of both axes in order to determine
confidence intervals and statistical significance.
3.5.2.3 Hierarchical analyses
AMOVA (Analysis of Molecular Variance) (Weir and Cockerham 1984; Excoffier et
al. 1992) was performed to confirm if there is population genetic partitioning between
locations sampled. The partitioned data was initially identified using pairwise Fst
measured in Arlequin (Excoffier et al., 1992). The hierarchical AMOVA addressed
variation at two different levels. First approach, individuals were grouped into three

Carcharhinus galapagensis stocks: Elizabeth-Middleton Reefs and Lord Howe Island
17
populations (division by site: Middleton Reef vs. Elizabeth Reef vs. Lord Howe
Island) and second approach individuals were combined into two groups (a combined
Elizabeth and Middleton Reefs group and a Lord Howe Island group) to
accommodate the signal obtained from pairwise Fst values. This test is useful to
investigate the spatial differentiation within and between the structured groups.
3.5.3 Coalescence analyses
Coalescence is a powerful modelling approach that performs a backward tracing of
the genealogical relationships among gene copies (allele) at a locus from the offspring
to the parents until it reaches a common ancestor (Avise, 2004). Therefore, it provides
information about the age of the population and its demographic history (expanding or
stable population). Coalescence was measured by obtaining the raggedness indexes
and Tau values from Arlequin ver. 3.0. Then coalescence aging was estimated using
parameters obtained from Arlequin ver 3 and the following equations:
u = 2 µk (1) (Roger and Harpending, 1992)
Where:
u= mutation rate for the whole sequence.
µ= mutation rate per nucleotide.
k= total sequence length.
t = tau/2u (2) (Roger and Harpending, 1992)
Where:
t= generation divergence time.
tau= unit of mutational time.
u= mutation rate for the whole sequence.
After that the number of generations since divergence was calculated for the mean
Tau value as well as the upper and lower Tau limits by the following equation:
t = Nt x T (3) (Pianka, 1978)
Where:
Nt = Number of generations since divergence.

Carcharhinus galapagensis stocks: Elizabeth-Middleton Reefs and Lord Howe Island
18
t = divergence time (in years).
T= generation time (in years per generation).
The generation time was calculated from the following equation:
Generation time (T) = (α + ω/ 2) (4) (Adams et al., 2000)
Where:
α = age at maturation.
ω = longevity.
C. galapagensis was estimated to reach maturity at the age of ten years (Wetherbee et
al.,1997). On the other hand De Crosta et al. (1984) has reported different ages of
maturity (Females = 6.5-9 and Males= 6.5-8). In our calculation we considered
Wetherbee's findings, since mtDNA is maternally inherited and Wetherbee's study
was applied only to females.
The mutation rate of C. galapagensis was calculated for the conserved and variable
(slow and fast rate) sites along the sequence, these calculations were performed as
indicated below:
1. Mutation rate of the variable sites in sharks was obtained from (Martin et al., 1992),
and was calculated as follows:
tv = 0.072% Myr-1
ti = 2.3% Myr-1…… calculated for (Sphyrna tiburo)
Where:
tv = Transversion sites (slow rate).
ti = Transition sites (fast rate).
Due to a lack of studies reporting transition mutation rates in sharks in general and C.
galapagensis in particular, we used the fast mutation rate of the bonnethead shark,
(Sphyrna tiburo) to represent the fast mutation rate of the variable sites in C.
galapagensis.

Carcharhinus galapagensis stocks: Elizabeth-Middleton Reefs and Lord Howe Island
19
The total mutation rate was then calculated as follows:
Rate of mutation (total) = Proportion of ti to total variable sites x fast rate%
+
Proportion of tv to total variable sites x slow rate %
2. Mutation rate of the conserved sites (slow mutating rate) was calculated as follows:
Total sequence length – variable sites = X
Since we obtained the variable sites ratio we can calculate the conserved site ratio as
follows:
X / total sequence length= ratio of conserved sites in the sequence.
Mutation of shark mtDNA is 7 to 8 fold slower than other vertebrate mtDNA (Martin
et al., 1992). Therefore we represented C. galapagensis mtDNA mutation rate to be
7.5 times slower than vertebrates (7 + 8/ 2), and calculated the mutation rate as
follows:
(1.1 / 7.5)B + (12.5/7.5) D = 0.1467B + 1.6667D % /Myr-1
where 1.1% and 12.5% are the mtDNA mutation rates of conserved and variable sites
in vertebrates, respectively, per Million years (Alvarado et al., 1995).
Therefore the total mutation rate= (A x B) + (C x D).
A = mutation rate of conserved sites.
B = ratio of conserved sites in the whole sequence.
C= mutation rate of variable sites.
D= ratio of variable sites in the whole sequence.

Carcharhinus galapagensis stocks: Elizabeth-Middleton Reefs and Lord Howe Island
20
3.6 Microsatellite data analyses:
Heterozygosity was scored using Fragment profiler (Amersham Biosciences). Scored
data were transferred to Arlequin to be tested for adherence to assumptions for
population genetic structure analyses using microsatellite data. Specifically, do the
markers used conform to the expectation that they are not linked and are the markers
in Hardy Weinberg equilibrium or not. If any of the markers used does not conform to
these assumptions, it should be eliminated from population genetic structure analyses.
The probability that any of the loci were in Hardy-Weinberg equilibrium was tested
using Arlequin ver.3 (Excoffier et al., 2005). The test was performed using Chi-
squared test, which calculates the observed genotype frequencies obtained from the
data and the expected genotype frequencies obtained using Hardy-Weinberg principle.
The tested null hypothesis is that the population is in Hardy-Weinberg principle
(Excoffier et al., 2005). Hardy-Weinberg principle suggests that the genotype
frequencies in a population is in equilibrium when passed from generation to another
unless it was disturbed by introduced influences, such as non-random mating, new
mutations, random genetic drift, gene flow and selection. This principle is considered
as a basic concept of population genetics that should be maintained. Therefore any
data that does not meet this concept should be removed.
4. Results
4.1. Mitochondrial data
4.1.1 Phylogenetic analyses
The non coding region of the mt-DNA (822bp) was sequenced for 86 Carcharhinus
galapagensis individuals representing three samples. The nucleotide composition
showed an A-T base pair bias AT:GC of 3:1 (T= 36.02%, C= 19.77%, A=30.27%,
and G= 13.95%). Such bias is typical for marine fish mitochondrial DNA including
sharks (McMillan and Plumbi, 1995). Out of the 822 bp (including 50 gaps), twenty-
one variable nucleotide positions were detected consisting of ten parsimony
informative sites. This variability resulted in 36 different haplotypes among the
Australian C. galapagensis (Table 6.). Most of these changes were transitions (ti) (C-

Carcharhinus galapagensis stocks: Elizabeth-Middleton Reefs and Lord Howe Island
21
T or A-G), only one site at position 693bp was a transversion (tv) (A-C). The ti:tv
ratio was high, 7.5.
Both NJ and ML trees showed the same topology with the exception that the ML tree
had grouped C. leucus (outgroup) within the C. galapagensis ingroup. Therefore we
chose the NJ tree to display our first estimates of C. galapagensis population
structure. Importantly, the Hawaiian C. galapagensis was placed within the ingroup in
the NJ tree. Thus, confirming the identity of the sampled sharks as C. galapagensis
(aim 1). Although the NJ tree displayed a geographic subdivision between individuals
from Elizabeth and Middleton Reefs and the Lord Howe Island individuals (Figure 2,
explained by the shaded areas), few clusters were supported with high bootstrap
support, which produced only two strongly supported clades (I and II). Clade II
suggests that individuals (G: 22and 15; EG: 18;19and 25 and LH: 12;26 and 23)
shared more genetic similarities when compared to the other individuals from the
three different locations (Elizabeth/Middleton Reefs and Lord Howe Island). Whereas
clade I included the rest of the individuals obtained from these three locations and
displayed them as an intermixing single population. Individuals highlighted in bold
were also supported by the parsimony informative tree (Figure 3) which displayed a
close relation between the following individuals (G:22&15; EG: 19&25 and LH: 13,
23&26) as well as a sharing genetic similarity between (EG: 26 and LH: 8, 16, 17, 25,
31&32) which were not supported by the NJ tree. However, these data need to be
examined using population structure analyses, which were performed using Arlequin
ver 3.1 (Excoffier et al., 2005).

Carcharhinus galapagensis stocks: Elizabeth-Middleton Reefs and Lord Howe Island
22
Hapl. n. Polymorphic nucleotide sites: 14 43 81 90 168 186 223 241 262 263 298 316 323 356 418 646 656 684 693 696 700 709 719
1 1 A C ~ A G C G A C ~ C G T G A ~ T T A ~ ~ ~ ~2 31 . . . . A . C . . . . . . T . . . . . . . . .3 1 . . . . . . C . . . . . . T C . . . . . . . .4 14 . . . . . . C . T . . . . T . . . . . . . . .5 3 . . . . A T C . T . . . . T . . . . . . . . .6 1 . . . . . . C . T . . . . T . . . . . . . . .7 1 . T . . . T C G T . T A C T . . . . . . . . .8 1 . . . . . . C . . . . . . T . . . . . . . . .9 1 . . . . A . C . T . . . . T . . . . . . . . .
10 3 . . . . . . C . T . . . . T . . . G . . . . .11 1 . . . . . . . . . . . . . . . . . . . . . G12 1 . . . . . . . . . . . . . . . . . . . . . . .13 1 . . G . . . C . T . . . . T . . . . . C . . .14 4 G . . . . . C . . . . . . T . . . . . . . . .15 1 . . . . . . C . . . . . . T . . . . . . . . .16 1 . . . . . . C . . . . . . T . . . . . . . . .17 1 . . . . . . C . . . . . . T . . . . . . . . .18 1 . . . . . . C . T . . . . T . A . . . . A A .19 1 . . . . A T C . T . . . . T . . . . . . . . .20 1 R . . . . . C . . . . . . T . . . . . . . . .21 1 . . . . . . C . . . . . . T . . . . C . . . .22 1 G . . . . . . . T . . . . . . . . . . . . .23 1 G . . . . . C . . . . . . T . . . . . . . . .24 1 G . . . . . . . . . . . . . . . . . . . . . .25 1 G . . . . . C . . . . . . T . . . . . C . A G26 1 G . . . A T C G T . T A C T . . C . . . . . .27 1 . . . . A T . . T . . . . . . . . . . . . . .28 1 G . . C . . C . T . . . . T . . . . C . . . .29 1 . . . . . . C . T . . . T . . . . . . . . G30 1 . . . . . C . . . . . . T . . . . . . . . G31 1 G . . . . C . . . . . . . . . . . . . . G32 1 G . . . . . C . . . . . . . . . . . . . . . G33 1 G . . . . . C . . . . . . . . . . . . . . . .34 1 G . . . . . C . T . . . . . . . . . . . A . G35 1 G . . . . . C . . . . . . . . . . . . . . . .36 1 G . . . . . C . . . . . . T . . . . . . A . G
Table 6. Polymorphic nucleotide positions for the Australian C. galapagensis (822bp); Haplo = haplotype ID and n. = number of individuals
sharing a particular haplotype. The nucleotide at each position is given for haplotype 1, only nucleotides different from haplotype1 are listed for
all other haplotypes. Identical nucleotides between haplotypes are indicated by (.); Middleton Reef (Red), Elizabeth Reef (Green) and Lord
Howe Island (Blue). Parsimony informative sites highlighted in blue and Variable sites are in bold.

Carcharhinus galapagensis stocks: Elizabeth-Middleton Reefs and Lord Howe Island
23
Hapl. Polymorphic nucleotide sites: 736 737 746 750 753 759 768 769 771 778 781 785 789 795 805 806 807 811 818
1 ~ A ~ ~ ~ ~ ~ ~ ~ ~ ~ ~ A ~ A ~ ~ A ~2 . . . . . . . . . . . . . . . . . . .3 . . . . . . . . . . . . . . . . . .4 . . . . . . . . . . . . . . . . . .5 . . . . . . . . . . . . . G . . . .6 . . . . . . . . . . . . . . G . . . .7 . . . . . . . . . . . . . . G . . . .8 . . . . . . . . . . . . . G . . . .9 . . . . . . . . . . . . . . . . . . .
10 . . . . . . . . . . . . . . . . . . .11 . . . C . G T . G . . G . . . . . . .12 . . . . . . . . . . . . . . . . . . .13 . . . . . . . . . . . . . . . . . .14 . . . . . . . . . . . . . . . . . . .15 . . G . . . . . . . . . . . . . . . .16 . C . . . . . . . . . . . . . . . . .17 . . . . . . . . . . . . . . . . . . .18 . . . . . . . . . . G G . G . A A G19 . . . . . . . . . . . . . . . . . . .20 . . . . . . . . . . . . G . . . . . .21 . . . . . . . . . . . . . . . . . .22 . . . . . . . . . . . . . . . . . . .23 . . C . C . . . . . . . . . . A A G24 . . . . . . . . . . . . . . . . . .25 . . . C C G T T . . G G A . . . A . G26 . . A . . . . . . . . . . . A A . G27 . . . . . . . . . . . . . . . . . . .28 . . . . . . . . . . . . . . . . . . .29 C . . . . G . . . . . C . . . A . . G30 . . . . . G . . . . . . . . . A . G31 . . . . . . . . . . . . . . . A . . G32 . . . . . . . . . . . . . . . A . . .33 . . . . . . . . . . . . . . . A . . .34 . . . C . G T . . . . . . G . A . C .35 . . . . . . . . . . . . . . . A . . .36 . . . C C G . . G A . . . . . A . . .
Continue table 6.

Carcharhinus galapagensis stocks: Elizabeth-Middleton Reefs and Lord Howe Island
24
A.
1 0 0
5 3
1 0 0
1 0 0
1 0 0
7 7
8 9
5 5
5 8
5 4
9 9
55 substitutions
53
100/56
100
100/100
77
55 / -
89
54 /57
58/-
99
100/100
- / 87 LH31LH32EG26LH16LH8 LH17
100- / 62
Carcharhinus galapagensis:
Middleton Reef.Elizabeth Reef.Lord Howe Island.Hawaii.
Out – Group:
Carcharhinus leucus.
Carcharhinus plumbeus .
Triaenodon obesus.
EG18LH12LH26
LH23
EG25EG19
G22
G15
Out group
Clade II
Clade I
n= 2
n= 3
n= 3
n= 26
n= 26
n= 26
n= 19
n= 14
n= 4
a
bn= 2
n=19
cn= 7
n=10
n= 3
100
1 0 0
5 3
1 0 0
1 0 0
1 0 0
7 7
8 9
5 5
5 8
5 4
9 9
55 substitutions
53
100/56
100
100/100
77
55 / -
89
54 /57
58/-
99
100/100
- / 87 LH31LH32EG26LH16LH8 LH17
100- / 62
Carcharhinus galapagensis:
Middleton Reef.Elizabeth Reef.Lord Howe Island.Hawaii.
Out – Group:
Carcharhinus leucus.
Carcharhinus plumbeus .
Triaenodon obesus.
EG18LH12LH26
LH23
EG25EG19
G22
G15
Out group
Clade II
Clade I
1 0 0
5 3
1 0 0
1 0 0
1 0 0
7 7
8 9
5 5
5 8
5 4
9 9
5
1 0 0
5 3
1 0 0
1 0 0
1 0 0
7 7
8 9
5 5
5 8
5 4
9 9
55 substitutions
53
100/56
100
100/100
77
55 / -
89
54 /57
58/-
99
100/100
- / 87 LH31LH32EG26LH16LH8 LH17
100- / 62
Carcharhinus galapagensis:
Middleton Reef.Elizabeth Reef.Lord Howe Island.Hawaii.
Out – Group:
Carcharhinus leucus.
Carcharhinus plumbeus .
Triaenodon obesus.
Carcharhinus galapagensis:
Middleton Reef.Elizabeth Reef.Lord Howe Island.Hawaii.
Out – Group:
Carcharhinus leucus.
Carcharhinus plumbeus .
Triaenodon obesus.
EG18LH12LH26
LH23
EG25EG19
G22
G15
Out group
Clade II
Clade I
n= 2
n= 3
n= 3
n= 26
n= 26
n= 26
n= 19
n= 14
n= 4
a
bn= 2
n=19
cn= 7
n=10
n= 3
100

Carcharhinus galapagensis stocks: Elizabeth-Middleton Reefs and Lord Howe Island
25
B
Figure 3. mtDNA data analysis of the Carcharhinus galapagensis including all locations in Australia; Elizabeth and Middleton Reefs and Lord Howe Island. A. Rooted NJ bootstrapped Phylogenetic tree of C. galapagensis. NJ bootstrap support values (of 1000 bootstrap replicates) are indicated in black and majority rule support values for the Maximum Parsimony tree are indicated in purple, adjacent to relevant nodes that are supported by these respective analyses. Colour dots are used to identify the location and species identity of all samples, as indicated in accompanying key. Numbers of individuals in each clade are indicated by the values given for n. the blue clades indicate weakly supported clades which display a defined structure. B. Majority rule consensus tree of Maximum Parsimony analysis of same data presented in A above, refer to key in A above for location by colour codes.
100
100
100
85
28
28
28
57
28
56
28
100

Carcharhinus galapagensis stocks: Elizabeth-Middleton Reefs and Lord Howe Island
26
4.1.2 Population genetic analyses
4.1.2.1 Minimum spanning trees (MST)
The MST shows a total of 36 unique haplotypes, where 31 of these were not shared by
any others. The MST identifies the two most common haplotypes, both of which are
shared between Elizabeth and Middleton Reefs exclusively. The first haplotype was
shared by 31 individuals (17 from Middleton Reef and 14 from Elizabeth Reef), while
the second haplotype was shared between 14 individuals (six Middleton Reef and
eight Elizabeth Reef). Individuals from Lord Howe Island had unique haplotypes with
the exception of two shared haplotypes with Elizabeth and Middleton Reefs (Figure
4). The first of these was shared between two individuals from Lord Howe and one
from Elizabeth Reef, whereas the second haplotype was shared between four
individuals from Lord Howe exclusively.
The Elizabeth and Middleton Reefs population was dominated by haplotype 1 and 2,
resulting in a much lower haplotype diversity (h=0.185). The low level of mutations
between haplotypes resulted in a low nucleotide diversity of this population as well (π
= 0.3% +/- 0.2%). Whereas in case of the Lord Howe population, haplotype diversity
was very high (h= 0.983), as was nucleotide diversity (π = 1.2% +/- 0.6%) (Table 6).
This suggests that the Lord Howe population has a different history from the
Elizabeth and Middleton Reefs population. Moreover, the total genetic (haplotype and
nucleotide) diversity of C. galapagensis showed a relatively high genetic variability
when compared to other sharks. However, this genetic variability is still considered
low in relation to teleosts (table 8).
The substitution rate between most haplotypes was quite low, 86% of the haplotypes
were separated by <6 substitutions (base change) and only 14% of the haplotypes
were separated by >6 substitutions. The Lord Howe individuals had more
substitutions between haplotypes than the Elizabeth and Middleton Reefs population.

Carcharhinus galapagensis stocks: Elizabeth-Middleton Reefs and Lord Howe Island
27
Geographic region nhb na %Nucleotide diversity Haplotype diversity
Elizabeth & Middleton 11 29 0.00178+%.290 0.1858
Lord Howe Island 24 29 0.0062+%.181 0.9833
C. galapagensis (Total) 35 58 0.0031 +% .570 0.5717
Table 7: Carcharhinus galapagensis haplotype and nucleotide diversities per region
a number of samples per region; b number of haplotypes per region
h: Haplotype diversity (Nei 1989);
π: Nucleotide diversity as per Arlequin Ver.2.01
Scientific name Common name nucleotide diversity π haplotype diversity h Reference
Cetorhinua maximus Basking shark 0.13% +/- 0.0009 0.72 +/- 0.028 Hoelzel et al. (2006).
Carcharhinus limbatus Blacktip shark 0.21% +/- 0.0013 0.805 +/- 0.018 Keeney et al. (2005).
Carcharhinus taurus Sand tiger shark 0.3% +/- 0.0001 0.717+/- 0.01 Stow et al. (2006).
Carchardon carcharias Great White shark 2.03% ….. Pardini et al .(2001).
Sphyrna lewini Scalloped Hammerhead 1.3% +/- 0.0068 0.8 +/- 0.02 Duncan et al .(2006).
Caretta caretta loggerhead turtle 2.36% +/- 0.0121 0.579+/- 0.028 Bowen et al. (2004).
Delphinus delphis Common dolphin 1.2% +/- 0.021 0.853 -1.0 Natoli et al. (2006).
Orcinus orca Killer whale 0.53% +/- 0.0031 0.874+/- 0.013 Hoelzel et al. (2002).
Physeter macrocephalus Sperm whale 0.2% +/- 0.0003 0.86 Lyrholm et al. (1996).
Thunnus obesus Bigeye tuna 5.40% 0.98 - 1.0 Martinez et al. (2006).
Xiphias gladius Swordfish 1.48% +/- 0.0005 0.997 Lu et al . (2006).
Acanthocybium solandri Kingfish 5.30% 0.999 Garber et al. (2005).
Table 8. Summary of haplotype and nucleotide diversities reported from past studies of
sharks, turtles, marine mammals and teleosts.

Carcharhinus galapagensis stocks: Elizabeth-Middleton Reefs and Lord Howe Island
28
Haplotype.1
Haplotype.2
Most common haplotypes
Unique haplotypes of Lord Howe population
Middleton Reef.
Elizabeth Reef.
Lord Howe Island.
One substitution
Ten substitutions
Haplotype.1
Haplotype.2
Most common haplotypes
Unique haplotypes of Lord Howe population
Middleton Reef.
Elizabeth Reef.
Lord Howe Island.
One substitution
Ten substitutions
Haplotype.1
Haplotype.2
Most common haplotypes
Unique haplotypes of Lord Howe population
Middleton Reef.
Elizabeth Reef.
Lord Howe Island.
One substitution
Ten substitutions
Figure 4 Minimum spanning tree showing the relationships between haplotypes of C. galapagensis from Middleton, Elizabeth Reefs and Lord Howe Island. Sizes of the circles are proportional to the number of individuals sharing a particular haplotype and crosses on the connecting lines reflect numbers of substitutions separating different haplotypes. Each colour represents different location as indicated in the figure key. 4.1.2.2 Pairwise Fst and geographic distance
Assessment of the pairwise Fst values indicated that the haplotype differences between
Elizabeth and Middleton Reefs regions were quite low (Fst= 0.002) where as the Lord
Howe Island haplotypes were significantly different from those at Elizabeth and
Middleton Reefs (Fst= 0.52 and 0.45 respectively with P<0.05) (Table 9). These
results confirm the suggested structure obtained from the MST, which suggests high
female mediated gene flow within C. galapagensis at Elizabeth and Middleton Reefs
with limited gene flow to and from Lord Howe Island. This identifies Lord Howe as a
genetically distinct population from a single Elizabeth and Middleton Reefs
population. The Mantel test was then used to investigate the correlation between
genetic similarity and geographic distance (Manly, 1994). The two dimension test
compared the two variables which were the pairwise Fst matrix (genetic distance) and
the log transformed pairwise geographic distance (km) (Figure 5). The matrix
produced a non significant p-value (P> 1.000) with (r =0.9986, z=2.2454) which
indicates non significant correlations found in the Mantel analyses (Bohonak, 2002),
therefore an isolation by distance effect (increase in haplotype variability with

Carcharhinus galapagensis stocks: Elizabeth-Middleton Reefs and Lord Howe Island
29
increased distance) was not evident in the C. galapagensis populations, but this may
be limited by the limited number of locations sampled in this study.
M Elz LH
M -
Elz 0.00185 -
LH 0.5180* 0.44702* -
* P< 0.05, ** P<0.005, *** P<0.0001
Table 9 Pairwise Fst comparisons between C. galapagensis populations among three regions
supported with the P-values significant level which is indicated by asterisks as indicated in the
key.
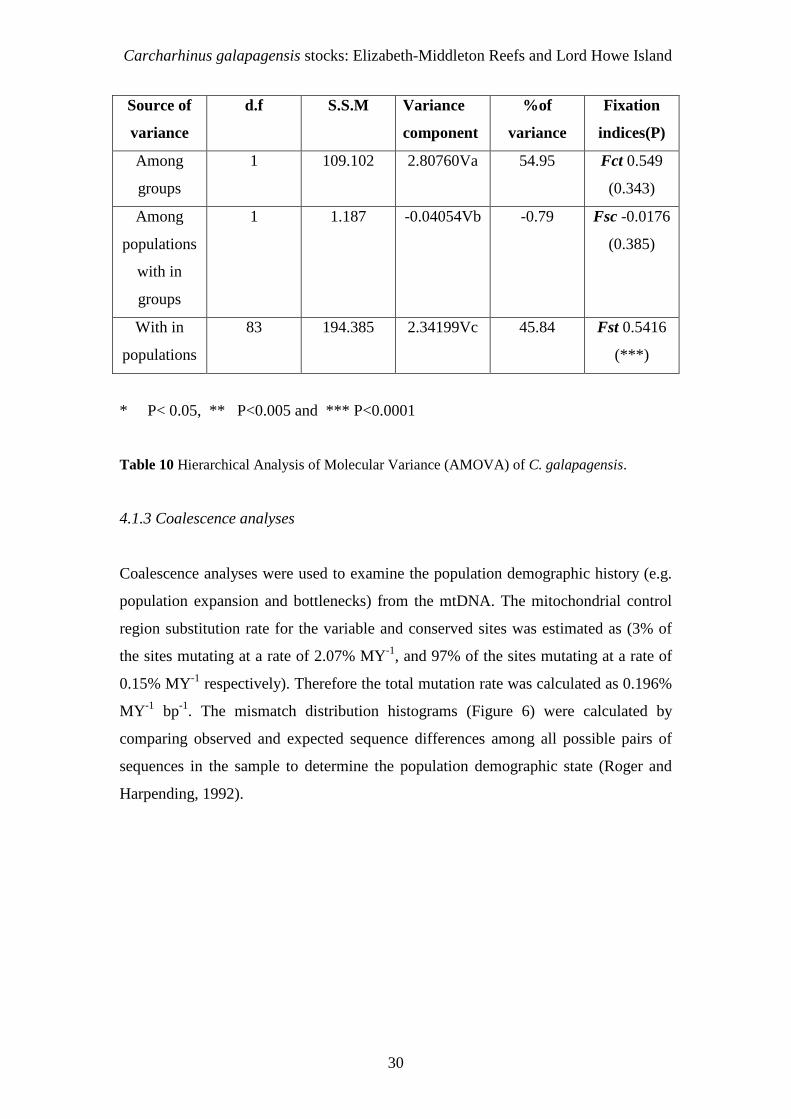
4.1.2.3 Hierarchical analyses
The AMOVA analysis is used to measure the proportion of genetic variation among
subdivided populations (Avise, 2004). These analyses have detected a strong structure
within the Australian population (Fst= 0.5416, P=0.000) when Elizabeth and
Middleton Reefs are grouped together and compared to the Lord Howe population, as
suggested by the pairwise Fsts (Table 9). There is confirmation of a statistically
significant variation among Australian C. galapagensis haplotypes from two
populations (Elizabeth and Middleton Reefs vs. Lord Howe Island). The Elizabeth
and Middleton Reefs individuals were genetically similar to each other, but distinct
from the Lord Howe Island population. This confirms that there are two, but not three
discrete populations. While 55% of the genetic variation was among locations
(Middleton Reef vs. Elizabeth Reef vs. Lord Howe Island), this was not significant
(Fct= 0.55, P= 0.34). Likewise, genetic variation among populations within regions
was not significant (Fsc= - 0.02, P= 0.38) and it accounted for none of the genetic
variation (negative value). Whereas genetic variation within populations relative to
the total sample was the only highly significant measure (Fst= 0.54, P<0.0001) and
accounted for 45% of the total observed genetic variation.
Carcharhinus galapagensis stocks: Elizabeth-Middleton Reefs and Lord Howe Island
30
Source of
variance
d.f S.S.M Variance
component
%of
variance
Fixation
indices(P)
Among
groups
1 109.102 2.80760Va 54.95 Fct 0.549
(0.343)
Among
populations
with in
groups
1 1.187 -0.04054Vb -0.79 Fsc -0.0176
(0.385)
With in
populations
83 194.385 2.34199Vc 45.84 Fst 0.5416
(***)
* P< 0.05, ** P<0.005 and *** P<0.0001
Table 10 Hierarchical Analysis of Molecular Variance (AMOVA) of C. galapagensis.
4.1.3 Coalescence analyses
Coalescence analyses were used to examine the population demographic history (e.g.
population expansion and bottlenecks) from the mtDNA. The mitochondrial control
region substitution rate for the variable and conserved sites was estimated as (3% of
the sites mutating at a rate of 2.07% MY-1, and 97% of the sites mutating at a rate of
0.15% MY-1 respectively). Therefore the total mutation rate was calculated as 0.196%
MY -1 bp-1. The mismatch distribution histograms (Figure 6) were calculated by
comparing observed and expected sequence differences among all possible pairs of
sequences in the sample to determine the population demographic state (Roger and
Harpending, 1992).

Carcharhinus galapagensis stocks: Elizabeth-Middleton Reefs and Lord Howe Island
31
2 3 0 .9 1 Km
Middleton Reef
A. B.
C.
2 3 0 .9 1 Km
Middleton Reef
2 3 0 .9 1 Km
Middleton Reef
A. B.
C.B.
2 3 0 .9 1 Km
Middleton Reef
A. B.
C.
2 3 0 .9 1 Km
Middleton Reef
2 3 0 .9 1 Km
Middleton Reef
A. B.
C.B.
2 3 0 .9 1 Km
Middleton Reef
A. B.
C.
2 3 0 .9 1 Km
Middleton Reef
2 3 0 .9 1 Km
Middleton Reef
A. B.
C.B.
Figure 5 Pairwise comparison of A) geographic distance (km) against B) Fst (genetic
distance). Sample locations are: (M: Middleton reef, Elz: Elizabeth reef and LH: Lord Howe
Island.
The mismatch distribution histogram of the Lord Howe population, displayed a
smooth unimodal graph, which is a characteristic of a long-term equilibrium
population expansion. The same expanding pattern is displayed by the Elizabeth and
Middleton Reefs populations, yet expansion in this population is likely more recent as
it represents fewer haplotypes with fewer mutations.

Carcharhinus galapagensis stocks: Elizabeth-Middleton Reefs and Lord Howe Island
32
By calculating years since population expansion of the two populations, we concluded
that the Lord Howe population is older than the Elizabeth and Middleton Reefs
population. High haplotype and nucleotide diversity result when more time has passed
since expansion started, allowing more mutations to accumulate. On the other hand,
the Elizabeth and Middleton Reefs population showed reduced haplotype and
nucleotide diversities, which indicates a more recent expansion with less time since
the expansion.
A.
B.
Figure 6 Mismatch distribution histogram for Australian C. galapagensis populations; A.
Lord Howe Island and B. Elizabeth and Middleton Reefs population. The observed frequency
of pairwise base pair differences are indicated by histogram bars and the expected values by
line. The null hypothesis for the expected values is that the populations are expanding.
Number of differences
Number of pairs
Number of differences
Number of pairs
Number of differences
Number of pairs
Number of differences
Number of pairs

Carcharhinus galapagensis stocks: Elizabeth-Middleton Reefs and Lord Howe Island
33
Estimates of the mtDNA expansion times were then calculated using the total
mutation rate and the C. galapagensis female generation time which was assumed
based on two longevity estimates (20 years or 15 years) (De Crosta et al., 1984),
therefore the female generation time is calculated as (15 years or 12.5 years
respectively).
Coalescence analyses suggest that the Lord Howe Island population started expanding
30577.9 years ago, with a range between (11 417.274 and 58 512.773 years ago),
whereas the Elizabeth and Middleton Reefs population started expanding 6 599.8
years ago ranging between (580.9 and 16 630.17 years ago) (Table 11). Therefore the
coalescence analyses and mismatch distribution both suggest that the Lord Howe
population appears to be older than the Middleton and Elizabeth Reefs population
when minimum, mean and maximum ages are considered.
Mean nr
of diff.
t divergence
(K year)
Raggedness
index
SSD Theta1 Theta 0 Tau
(95%CI)
1.562 Eliz
&
Mid
6599.8 (580.9-
16630.2)
0.0898ns 0.022ns 0.32 M=463.596 2.17
(0.191-
5.468)
9.587 LHI 30577.9
(11417.3-
58512.8)
0.0049ns 0.003ns 50.046 1.9 10.054
(3.754-
19.239)
Table 11 Coalescence analysis parameters for Carcharhinus galapagensis calculated from
Arlequin vr.3

Carcharhinus galapagensis stocks: Elizabeth-Middleton Reefs and Lord Howe Island
34
0.1 0.0 10 20 30 40 50 60 70 80 90
Age (thousand years)
Middleton & Elizabeth ReefsLord Howe Island
0.1 0.0 10 20 30 40 50 60 70 80 90
Age (thousand years)
0.0 10 20 30 40 50 60 70 80 90
Age (thousand years)
Middleton & Elizabeth ReefsLord Howe Island
Figure 7 Coalescence age range of Australian C .galapagensis populations obtained from
Elizabeth - Middleton Reefs and Lord Howe Island populations as indicated in the key. The
mean age is specified by an arrow.
4.2 Nuclear data:
The Hardy-Weinberg equilibrium test revealed significant P-values for the expected
and observed data for cli108 and cli107 among Lord Howe individuals. Therefore, the
null hypothesis that the population is in Hardy-Weinberg principle is rejected for
these two loci. Consequently the nuclear data are not presented due to insufficient
data, as a single microsatellite locus can not determine population genetic structure,
particularly for such limited sample sizes, as were available for this study.

Carcharhinus galapagensis stocks: Elizabeth-Middleton Reefs and Lord Howe Island
35
5. Discussion
The four specified aims of this study (listed below) were achieved and we consider
the relevance of these findings here.
5.1. Confirm the identity of Australian C. galapagensis
All phylogenetic analyses confirmed that Australian C. galapagensis are of the same
species as the Hawaiian C. galapagensis. However, these analyses did not partition C.
galapagensis populations into identifiable genetic clades. Population genetic analyses
were required to detect stock structure.
5.2 Population structure of C. galapagensis in Australia
Although genetic variability was extremely low in C. galapagensis sequences,
mtDNA analyses provided evidence to reject the null hypothesis that the samples
share a single gene pool. Significant structure, which grouped Elizabeth and
Middleton Reefs as a single population that is genetically distinct from the Lord Howe
Island population was detected. Specifically, the population structure was supported
by significant pairwise Fst measures, which were low for Elizabeth and Middleton
Reefs, but high for both these sites and Lord Howe. This was confirmed by more
statistically rigorous AMOVA analyses, which displayed a highly significant FST
value between the Elizabeth - Middleton Reefs population and the Lord Howe
population, with 55% of the total molecular variance attributable to variation among
the three regions.
The mantel test suggested a direct correlation between genetic and geographic
distances in all matrices (both standard and log transformed matrices), but was not
significant, probably due to a lack of power. Additional sample locations across a
wider geographical scale are needed to test this hypothesis more rigorously.
The observed geographic partitioning of C. galapagensis is not surprising, especially
in the absence of a pelagic dispersal phase. Yet, it is unexpected from a species that is
distributed worldwide. Similar findings were displayed in other widely distributed

Carcharhinus galapagensis stocks: Elizabeth-Middleton Reefs and Lord Howe Island
36
shark species such as the blacktip shark (Carcharhinus limbatus) (Keeney and Heist,
2006) and the Pacific angelshark (Squatina califorrnica) with limited gene flow in the
latter species being due to the restricted trans oceanic migration of adults (Gaida,
1997).
Although evidence for a strong structure of C. galapagensis in Australia is
significantly supported, this study could not fully resolve the population structure
question, as it did not account for male gene flow. Microsatellites were eliminated
from the study due to insufficient data, time and money. However, further analysis is
essential to determine if the currently identified genetic structure in C. galapagensis is
derived from restricted female mediated gene flow (philopatry) alone or if it is present
for the entire population. Similar degrees of population separation have been
recorded in female carcharhinids returning to nursery areas to give birth (Feldheim et
al. 2002, Keeney et al. 2003, Keeney et al. 2005). We suggest that the degree of
population separation between the study sites may represent nursery ground site
fidelity in C. galapagensis. In coral reef habitats, the high level of site fidelity has a
great advantage in increasing both foraging success and resource awareness of the
organism (Bradshaw et al. 2004). However, additional data from more nuclear
markers and ideally more individuals than were available for this study, are required
to evaluate this hypothesis further.
5.3 Level of genetic diversity in C. galapagensis
Grant and Bowen (1998) divided marine fishes into four groups depending on their
genetic (nucleotide and haplotype) diversity measures obtained from mtDNA
sequence analysis. Based on these criteria, the Elizabeth and Middleton Reefs
population fitted into the first category with low haplotype and nucleotide measures,
which suggests that the population represents a recent colonization and shallow
history or that this population experienced a recent bottleneck which produced the
observed low levels of genetic diversity. In contrast, the Lord Howe population, with
high haplotype and nucleotide diversities, fits the fourth category. This suggests that
high genetic diversity of this population is attributed to i) secondary contact between
previously differentiated allopatric lineages (e.g. receiving migrants from other
distinct populations such as Elizabeth - Middleton Reefs and/or the Kermadecs, New

Carcharhinus galapagensis stocks: Elizabeth-Middleton Reefs and Lord Howe Island
37
Zealand) or ii) a large stable population. Additional material from neighbouring
populations, such as the Kermadecs, is required to evaluate this.
Although little is known about the evolutionary history of C. galapagensis from –
Elizabeth - Middleton Reefs, their low genetic diversity indicates periods of low
effective population size within their recent past. This low genetic diversity suggests
that the Elizabeth - Middleton Reefs population has lower resilience and is more
susceptible to being adversely affected by anthropogenic and/or environmental
stresses, such as global warming and disease outbreaks, than is the Lord Howe
population. Comparing the genetic diversity of C. galapagensis to diversity indices
obtained for other globally distributed marine organisms, including other shark
species, other marine organisms including fishes, marine mammals and reptiles,
indicated that the overall level of diversity in C. galapagensis is relatively high
compared to other sharks, but low when compared to teleosts and is remarkably
similar to the genetic diversity of the killer whale (Orcinus orca), a cetacean which
exhibits a viviparous reproductive mode and a nektonic dispersal the same as C.
galapagensis.
Another possible reason for low genetic diversity in sharks is their life history. This
was investigated by Mitton and Lewis (1989), who stated a significant relationship
between genetic variability and generation time, maturation age and maximum size
(high genetic variability = short generation time, quick maturation and small
maximum size). As most sharks (including C. galapagensis) do not display any of
these features it may be that life history contributes to the low genetic diversities seen.
5.4 Challenges associated with limited reproductive output (fecundity) and dispersal
ability of C. galapagensis
Sharks in general display a slow life history pattern, which is suggested to be one
reason for their low genetic variability and slow mutation rate (Martine et al., 1992).
Since C. galapagensis reproduce at most once every two years, with the production of
relatively few offspring (6-16 pups per litter), they have a long generation time
(Compagno, 1984). In addition to this low fecundity, gene flow is limited to migration
by adults and/or juveniles. This is in stark contrast to high fecundities and dispersal
Carcharhinus galapagensis stocks: Elizabeth-Middleton Reefs and Lord Howe Island
38
abilities of most teleosts, which release orders of magnitude more offspring more
frequently, in the form of pelagic larvae, which are capable of extensive dispersal
(Hedgecock, 1986). Thus, the C. galapagensis life history is thought to constrain their
dispersal ability and consequently their ability to recover from population depletion,
whatever the cause.
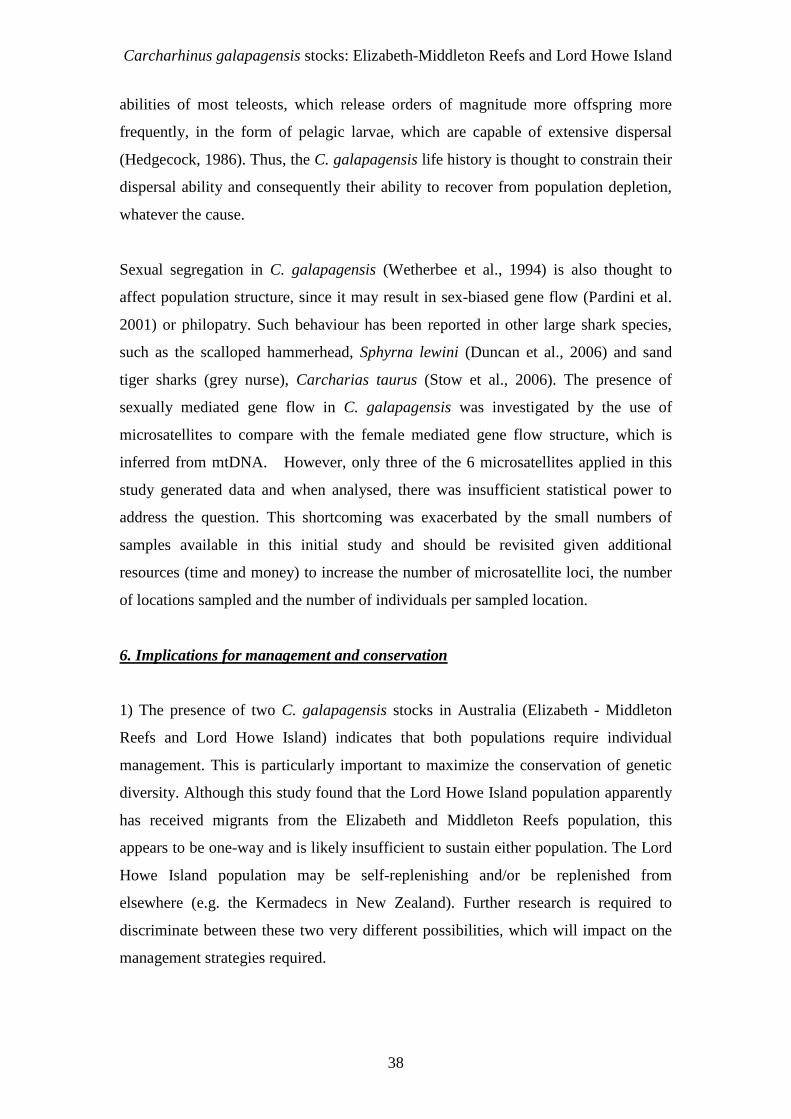
Sexual segregation in C. galapagensis (Wetherbee et al., 1994) is also thought to
affect population structure, since it may result in sex-biased gene flow (Pardini et al.
2001) or philopatry. Such behaviour has been reported in other large shark species,
such as the scalloped hammerhead, Sphyrna lewini (Duncan et al., 2006) and sand
tiger sharks (grey nurse), Carcharias taurus (Stow et al., 2006). The presence of
sexually mediated gene flow in C. galapagensis was investigated by the use of
microsatellites to compare with the female mediated gene flow structure, which is
inferred from mtDNA. However, only three of the 6 microsatellites applied in this
study generated data and when analysed, there was insufficient statistical power to
address the question. This shortcoming was exacerbated by the small numbers of
samples available in this initial study and should be revisited given additional
resources (time and money) to increase the number of microsatellite loci, the number
of locations sampled and the number of individuals per sampled location.
6. Implications for management and conservation
1) The presence of two C. galapagensis stocks in Australia (Elizabeth - Middleton
Reefs and Lord Howe Island) indicates that both populations require individual
management. This is particularly important to maximize the conservation of genetic
diversity. Although this study found that the Lord Howe Island population apparently
has received migrants from the Elizabeth and Middleton Reefs population, this
appears to be one-way and is likely insufficient to sustain either population. The Lord
Howe Island population may be self-replenishing and/or be replenished from
elsewhere (e.g. the Kermadecs in New Zealand). Further research is required to
discriminate between these two very different possibilities, which will impact on the
management strategies required.

Carcharhinus galapagensis stocks: Elizabeth-Middleton Reefs and Lord Howe Island
39
2) The low genetic diversity of the Elizabeth and Middleton Reefs population, which
was only established recently by a small founder population, is of particular concern
and suggests rare migration to this population from elsewhere. This results in a lower
genetic resilience of the Elizabeth and Middleton Reefs population than in the Lord
Howe Island population. The implication of these results for the long-term
conservation of C. galapagensis at the Elizabeth and Middleton Reef Marine National
Nature Reserve is that this population should be carefully managed to eliminate or
minimize impacts of fishing in the area, since recreational fishing is permitted at
Elizabeth Reef under the current Management Plan (Oxley 2006). This is particularly
important in light of the plight of shark populations world-wide (Myers et al 2007,
Ward and Myers 2005, Myers and Worm 2005, Shepard and Myers 2005), including
Australia (Robbins et al 2006), where shark abundances have plummeted, even if they
have not been targeted by fishermen. Given this, it is most likely that the healthy
populations of Galapagos sharks at Elizabeth and Middleton Reefs and at Lord Howe
Island will suffer reductions if fishing is permitted in these areas, since the sharks (and
black cod, Epinephelus daemelii) at these locations are not accustomed to human
activities and are very curious towards both divers and baited hooks, even if the
sharks or black cod are not themselves the target. Although this is an untested
hypothesis at Elizabeth and Middleton Reefs and at Lord Howe Island, it has been
tested in Hawaii, where there is striking evidence that fishing pressure (including
recreational and subsistence fishing) in the main Hawaiian Islands has led to drastic
reductions in number and size of a number of fish species, mainly apex predators,
including sharks and the Hawaiian grouper, Epinephelus quernus. In contrast, these
species are still common at the lightly fished remote North Hawaiian Islands
(Friedlander and DeMartini 2002). Importantly, the study by Friedlander and
DeMartini (2002) found that fully protected no take reserves in the main Hawaiian
Islands had higher standing stocks of apex predators and other reef fishes than areas
with partial or no protection from fishing, even if these areas were only fished
recreationally.
3) The genetic partitioning between these Australian populations must be taken into
account if any restocking between locations is to be considered.

Carcharhinus galapagensis stocks: Elizabeth-Middleton Reefs and Lord Howe Island
40
4) Finally, it is fundamental to realise that limited fecundity and dispersal abilities of
this species makes it highly susceptible to extirpation (the loss of the population from
an area), especially if exploited. As reproduction is the main recovery strategy for C.
galapagensis, this would be a very slow recovery at best. In general, the worldwide
decline in shark species (Myers et al 2007, Ward and Myers 2005, Myers and Worm
2005, Shepard and Myers 2005, Castro et al., 1984) highlights the increasing
importance of conserving these ecologically important apex predators.
7. Future research directions
1) Initiate a study to evaluate the impact of recreational and charter fishing activities
in partially fished and no take reserves at Elizabeth and Middleton Reefs Marine
National Nature Reserve and Lord Howe Island Marine Park. Partially protected
areas open to recreational fishing in both Hawaii and the GBR have suffered
substantial declines in shark numbers compared to areas with complete protection.
Fishing at Elizabeth Reef could deplete the abundances and sizes of apex predators
such as grouper (black cod) and (Galapagos) sharks even if they are not target species.
2) Future genetic studies of C. galapagensis in the Tasman Sea will need to include
additional samples and estimates of abundance from these and other populations such
as the Kermadecs, New Zealand, in order to identify what gene flow (if any) exists
between this nearest neighbour to the Australian populations. They will also need to
incorporate additional nuclear (microsatellite) markers to determine both the scale of
gene flow and evidence for male-mediated gene flow, since this study had insufficient
power to realise this. Lastly, the number of individuals per sampled location will need
to be increased to 50 if possible in order to improve the statistical power of analyses.
Acknowledgements: Thanks to Will Robbins and JP Hobbs for providing tissues for
all Elizabeth and Middleton Reef C. galapagensis specimens, Heather Patterson for
obtaining Lord Howe Island C. galapagensis samples from her fisher friends on Lord
Howe Island and Jenny Ovenden for providing the tissue samples for the outgroup
species. We are grateful for the transport to and from Elizabeth and Middleton Reefs
by the Capricorn Star crew, as well as excellent support provided by them for the
duration of the trip.
Carcharhinus galapagensis stocks: Elizabeth-Middleton Reefs and Lord Howe Island
41
8. References: Adams S, Mapstone, BD, Russ GR, and Davies CR(2000)Geographic variation in the sex ratio, sex specific, and age structure of Plectropomus leopardus (Serranidae) between reefs open and closed to fishing on the Great Barrier Reef. Can. J. Fish. Aquat. Sci. 57, 1448-1458.
Alvardo BJR, Baker AJ, Mejuto J(1995) Mitochondrial DNA control region sequences indicate extensive mixing of swordfish (Xiphias gladius) populations in the Atlantic Ocean. Can. J .Fish. Aquat. Sci. 52:1720-1732.
Amersham Biosciences. Fragment profiler.
Avise JC (2004) Molecular markers, natural history, and evolution. Second edition. Sinauer Associates, Inc. Sunderland, Massachusetts.
Bohonak AJ (2002) IBD (Isolation By Distance): A program for analyses of isolation by distance. J. Herd. 93:153-154.
Bowen BW, Bass AL, Chow S-M et al. (2004) Natal homing in juvenile loggerhead turtles (Caretta caretta). Mol. Ecol., 13, 3797–3808.
Bradshaw JM, Uszok A, Jeffers R, Suri N, Hayes P, Burstein MH, Acquisti A, Benyo B, Breedy MR, Carvalho M, Diller D, Johnson M, Kulkarni S, Lott J, Sierhuis M and Van Hoof R (2003). Representation and reasoning for DAML-based policy and domain services in KaoS and Nomads. Proceedings of the Autonomous Agents and Multi- Agent Systems Conference (AAMAS 2003), Melbourne, Australia. New York: ACM Press.
Castro AL, Stewart S, Wilson G, Hueter RE, Meekan MG, Motta PJ, Bowen BW and Karl S(2007)Population genetic structure of Earth's largest fish, the whale shark (Rhincodon typus). Mol. Ecol. 16:5183-5192.
Choat JH, van Herwerden L, Robbins WD, Hobbs JP (2006) A report on the ecological surveys undertaken at Middleton and Elizabeth Reefs, February 2006. School of Marine Biology and Aquaculture, James Cook University report for the Department of the Environment and Heritage.
Compagno LJV (1984) FAO species catalogue. Vol. 4. Sharks of the world. An annotated and illustrated catalogue of shark species known to date. Part 2.
Daly-Engel T.S, Grubbs R.D, Holland, K.N, Toonen, R.J and Bowe, B.W (2006) Assessment of multiple paternity in single litters from three species of carcharhinid sharks in Hawaii. Environ. Biol. Fishes, 76: 419-424.
De Crosta MA, Taylor LRJ, Parrish JD (1984) Age determination, growth, and energetics of three species of carcharhinid sharks in Hawaii. Proceedings of the second symposium on resource investigations of the NW Hawaiian Islands. University of Hawaii, Honolulu, p 75-95.
Director of National Parks (2006) Elizabeth and Middleton Reefs Marine National Nature Reserve Management Plan 2006 – 2013. Director of National Parks, Canberra.
Duncan KM, Martin AP, Bowen BW and Couet HG(2006) Global phylogeography of the scalloped hammerhead shark (Sphyrna lewini). Mol. Ecol.15:2239-2251.

Carcharhinus galapagensis stocks: Elizabeth-Middleton Reefs and Lord Howe Island
42
Excoffier L, Smouse PE, Quattro JM (1992) Analysis of molecular variance inferred from metric distances among DNA haplotypes: Application to human mitochondrial DNA restriction data. Genet. 131:479–491.
Excoffier L, Laval G, Schneider S (2005) Arlequin (version 3.0): an integrated software package for population genetics data analysis. Evolutionary Bioinformatics Online, 1, 47–50.
Felsensten J(1981) Evolutionary trees from DNA sequences: a maximum likelihood approach. J.Mol. Evol. 17: 368-376.
Felsenstein J(1985) Confidence limits on phylogenies: an approach using the bootstrap. Evol. 39(4): 783-791.
Flood. J. 1995. The archaeology of the dreamtime. Angus and Robertson, Sydney. Australia.
Friedlander AM, DeMartini EE (2002) Contrasts in density, size and biomass of reef fishes between the northwestern and the main Hawaiian Islands: the effects of fishing down apex predators. Mar. Ecol. Prog. Ser. 230, 253-264.
Gaida IH (1997) Population structure of the Pacific angel shark, Squatina californica (Squatiniformes, Squatinidae), around the California channel islands. Copeia1997:738-744.
Garber AF, Tringali, MD and Franks JS (2005) Population genetic and phylogeographic structure of wahoo, Acanthocybium solandri, from the western central Atlantic and central Pacific oceans. Mar. Biol. 147, 205–214.
Garcia VB, Lucifora LO and Ransom AM (2007) The importance of habitat and life history to extinction risk in sharks, skates, rays and chimaeras. Procd. Royl Soc. Published online.
Grant WS, and Bowen BM (1998). Shallow population histories in deep evolutionary lineages of marine fishes: insights from the sardines and anchovies and lessons for conservation. J. Hered. 89:415–426.
Goldman N, Anderson JB and Rodrigo AG (2000) Likelihood tests of topologies in phylogenetics. Syst. Biol. 49:652-670.
Hall T.A. (1999) - Nucleic Acids Symp Ser.
Harpending HC, Stephen CS and Allan RR (1993) The genetic structure of ancient human populations. Cut. Anthro..34:483-496.
Haq, B. U., Hardenbol, J., and Vail, P. R., 1988, Mesozoic and Cainozoic chronostratigraphy and cycles of sea level change, in Wilgus, C. K., Hastings, B. S., Posamentier, H., van Wagoner, J., Ross, C. A., and Kendall, C. G. S., eds., Sea level changes: An integrated approach: Society of Economic Palaeontologists and Mineralogists Special Publication 42, p. 71–108.
Hedgecock D. 1986. Is gene flow from pelagic larval dispersal important in the adaptation and evolution of marine invertebrates? Bull. Mar. Sci. 39:550–64.
Heist EJ, Graves JE and Musick JA (1995) Population genetics of the sandbar shark (Carcharhinus plumbeus) in the Gulf of Mexico and mid-Atlantic Bight. Copeia1995:555-562.

Carcharhinus galapagensis stocks: Elizabeth-Middleton Reefs and Lord Howe Island
43
Heist EJ, Musick JA and Graves JE (1996a) Genetic population structure of the shortfin mako (Isurus oxyrinchus) inferred from restriction fragment length polymorphism analysis of mitochondrial DNA. Can. J. Fish. Aquat. Science 53:583-588.
Heist EJ, Musick JA and Graves JE (1996b) Mitochondrial DNA Diversity and Divergence Among Sharpnose Sharks, Rhizoprionodon terraenovae, From the Gulf of Mexico and Mid-Atlantic Bight. Fish Bull 94:664-668.
Hoelzel AR, Natoli A, Dahlheim M, Olavarria C, Baird RW and Black N (2002) Low world-wide genetic diversity in the killer whale (Orcinus orca); implications for demographic history. Proc. R. Soc. B 269, 1467–1475.
Hoelzel AR, Shivji MS, Magnussen J and Malcolm PF(2006)Low worldwide genetic diversity in the basking shark (Cetorhinus maximus). Royal soc. Online publication.
Holzwarth SR, DeMartini EE, Zgliczynski BJ and Laughlin JL. (2004) Sharks and jacks in the Northwestern Hawaiian Islands from towed-diver surveys 200-2003. Northwestern Hawaiian Islands Third Scientific Symposium. No.543.
IUCN. (2006). 2006 IUCN Red List of Threatened Species. www.iucn.org/themes/ssc/redlist2006/redlist2006.htm
Kato S and Carvallo AH (1967) Shark tagging in the eastern Pacific Ocean, 1962-65. In Sharks, Skates and Rays, eds P.W.Gillbert, R.F.Mathewson and D.P.Rall, pp. 93-109. Johns Hopkins University Press, Baltimore.
Keeney DB, Heist EJ (2003) Characterization of microsatellite loci isolated from the blacktip shark and their utility in requiem and hammerhead sharks. Mol. Ecol .Notes 3:501-504.
Keeney DB, Heupel M, Hueter RE and Heist EJ (2003) Genetic heterogeneity among blacktip shark, Carcharhinus limbatus, continental nurseries along the U.S. Atlantic and Gulf of Mexico. Mar. Bio. 143:1039-1046.
Keeney DB, Heupel MR, Hueter RE, Heist EJ (2005) Microsatellite and mitochondrial DNA analyses of the genetic structure of blacktip shark (Carcharhinus limbatus) nurseries in the northwestern Atlantic, Gulf of Mexico, and Caribbean Sea. Mol. Ecol .14:1911-1923.
Koch PL, Zachos JC and Dettman DL (1995) Palaeogeogr. Palaeoclimatol. Palaeoecol. 115, 61.
Kohler NE and Turner PA (2001) Shark tagging a review of conventional methods and studies. Enval Biol Fish. 60: 191-223.
Kumar S., Tamura K., and Nei M. (2004). MEGA3: Integrated software for Molecular Evolutionary Genetics Analysis and sequence alignment. Briefings in Bioinformatics 5:150-163.
Lavery S and Shaklee B(1989) Population genetics of two tropical sharks, Carcharhinus tilstoni and C.sorrah, in Northern Australia. Australian. J. Mar. Fresh Res. 40:541-557.
Lu CL, Chen, CA, Hui CF, Tzeng TD and Yeh, SY (2006) Population genetic structure of the swordfish, Xiphias gladius (Linnaeus, 1758), in the Indian Ocean and

Carcharhinus galapagensis stocks: Elizabeth-Middleton Reefs and Lord Howe Island
44
west Pacific inferred from the complete DNA sequence of the mitochondrial control region. Zool. Stud. 45.
Manly BFJ(1994). Multivariate statistical methods: a primer, 2nd ed. New York: Chapman & Hall.
Martin AP (1995) Mitochondrial DNA sequence evolution in sharks: Rates, patterns, and phylogenetic inferences. Mol Biol Evol 12:1114-1123.
Martin AP, Naylor JP, Palumbi SR (1992) Rates of mitochondrial DNA evolution in sharks are slow compared with mammals. Nat. 357:153-155
Martinez P, Gonzalez EG, Castilho R and Zardoya R (2006) Genetic diversity and historical demography of Atlantic bigeye tuna (Thunnus obesus). Mol. Phylogen. Evol. 39, 404–416.
McDonald CN (1988) Genetic variation, breeding structure, and taxonomic status of the gummy shark Mustelus antarcticus in southern Australian waters. Aust. J. Mar. Fre.Res. 39:641-648.
McMillan WO, Palumbi SR (1995) Concordant evolutionary patterns among Indo-West Pacific butterflyfishes. P Roy Soc Lond B Bio 260:229-236.
Myers R A, Baum J K, Shepherd T D, Powers S P, Peterson C H. (2007) Cascading Effects of the loss of apex predatory sharks from a coastal ocean. Science. 315 (5820):1846-1850.
Myers R A, Worm B (2005) Extinction, survival, or recovery of large predatory fishes. Proceedings of the Royal Society B. 360, 13-20.
Mitton JB and LEWIS WM (1989). Relationships between genetic variability and life-history features of bony fishes. Evol.43: 17 12- 1723.
Natoli A, Can˜adas A, Peddemors V M, Aguilar A, Vaquero C, Ferna´ndez-Piqueras P and Hoelzel AR (2006) Phylogeography and alpha taxonomy of the common dolphin (Delphinus sp.). J. Evol. Biol. 19, 943–954.
Nei M (1989) Molecular evolutionary genetics. Columbia University Press, New York.
Oxley WG, Ayling AM, Cheale AJ and Osborne K (2004) Marine surveys undertaken in the Elizabeth and Middleton Reefs Marine National Nature Reserve December 2003. Australian Institute of Marine Science and Sea Research report to the Department of the Environment and Heritage.
Pardini AT, Jones CS, Noble LR, Kreiser B, Stevens JD, Cliff G, Scholl MC, Francis M, Duffy CAJ and Martin AP (2001) Sex-biased dispersal of great white sharks. Nat. 412:139-140.
Pianka ER (1978) In: Evolutionary ecology, seconded. Harper Rowe Publishers, NY,USA.
Robbins W (2006) Evaluation of two underwater probes for in situ collection of shark tissue samples. Mar.Ecol. Prog. Ser. 310:213-217.
Robbins W, Hisano M, Connolly S, Choat JH (2006) Ongoing Collapse of Coral-Reef Shark Populations. Current Biology 16, 2314 - 2319

Carcharhinus galapagensis stocks: Elizabeth-Middleton Reefs and Lord Howe Island
45
Rogers AR and Harpending B (1992). Population growth makes waves in the distribution of pairwise differences. Mol Biol Evol. 9: 552 - 6 9.
Sambrook J, Fritsch EF and Maniatis T (1989) Molecular Cloning: A laboratory Manual, 2nd edn. Cold Spring Harbor Laboratory Press, New York.
Salamy KM and Zachos JC(1999) Palaeogeogr. Palaeoclimatol. Palae. 145, 61.
Schneider S, Roessli D, Excoffier L (2000) Arlequin ver. 2.000: A software for population genetic data analysis. Genetics and Biometry Laboratory, University of Geneva, Switzerland.
Selander RK (1976). Genie variation in natural populations. In Molecular Evolution, ed. F. J. Ayala. Sunderland, Mass: Sinauer. 277 pp.
Shepard T D, Myers R A (2005) Direct and indirect fishery effects on small coastal elasmobranchs in the northern Gulf of Mexico. Ecology Letters. 8: 1095-1104.
Smith PJ (1986) Low genetic variation in sharks (Chondrichthyes). Copeia 1986:202-207.
Smith PJ and FujioY. (1982). Genetic variation in marine teleosts: high variability in habitat specialists and low variability in habitat generalists. Mar Biol. 69, 7–20.
Speare P, Cappo M, Reese M, Brownlie J and Oxley W (2004) Deeper water fish and benthic surveys in the Lord Howe Island Marine Park (Commonwealth waters) February 2004. Australian Institute of Marine Science and Sea Research report to the Department of the Environment and Heritage.
Springer S (1967) Social organization of shark populations. In: Sharks, Skates and Rays (eds Gilbert PW, Matheswon RF, Rall DP), pp. 149–174. Johns Hopkins University Press, Baltimore.
Stow A, Zenger K, Briscoe D, Gillings M, Peddemors V, Otway N and Harcourt R (2006) Isolation and genetic diversity of endangered grey nurse shark (Carcharias Taurus) populations. Biol. Lett. 2, 308–311. (doi:10. 1098/rsbl.2006.0441).
Swofford, D. L. 2001. PAUP*. Phylogenetic analysis using parsimony (and other methods), version 4.0b6. Sinauer Associates, Sunderland, Mass.
Ward RD and Gardner MG (1997) Stock structure and species identification of school and gummy sharks in Australian waters. CSIRO. Hobart, Tasmania.
Ward P, Myers R A (2005) Shifts in open-ocean fish communities coinciding with the commencement of commercial fishing. Ecology 86, 835-847.
Weir BS and Cockerham CC (1984). Estimating F-statistics for the analysis of population structure. Evol. 38:1358-1370.
Wetherbee BM, Crow GL and Lowe CG (1997). Distribution, reproduction and diet of the gray reef shark Carcharhinus amblyrhynchos in Hawaii. Mar. Ecol. Prog. Ser. 151, 181–189.