Population dynamics of toxic algal blooms in Lake Champlain Edmund M. Hart, Nicholas J. Gotelli,...
39
Population dynamics of toxic algal blooms in Lake Champlain Edmund M. Hart, Nicholas J. Gotelli, Rebecca Gorney, Mary Watzin
-
Upload
penelope-walker -
Category
Documents
-
view
222 -
download
3
Transcript of Population dynamics of toxic algal blooms in Lake Champlain Edmund M. Hart, Nicholas J. Gotelli,...

Population dynamics of toxic algal blooms in Lake Champlain
Edmund M. Hart, Nicholas J. Gotelli, Rebecca Gorney, Mary Watzin

If you bang your head against a wall long enough…

…sometimes you break through.

The problem…
Toxic algal blooms in Missisquoi Bay2003 - 2006

The problem…
Growth rates of toxic algal blooms in Missisquoi Bay2003 - 2006

The Question…
What controls toxic algal bloom population dynamics in Missisquoi Bay?

The Lake

The Algae
Microcystis Anabaena

The data
Julian Day
Highgate Cliffs
Chapman Bay
Route 78 Access
Highgate Springs Alburg
Tyler Place Boatdock
182747.885
11509.89
5 10350.72063.05
3NA NA188NA NA NA NA NA NA
195128876.
4 19597011626.4
2 19907.8NA NA
203NA NA111960.
5NA NA NA
21026196.8
960016.6
6 30515.17554.26
3NA NA
21726749.9
910106.4
35350.62
937092.1
4NA NA
22420330.2
818108.5
517739.1
79403.00
8NA NA
23129417.3
114473.7
724029.8
642584.2
9NA NA
23829852.4
432075.1
632581.5
1 10946.1NA NA
24738663.2
331373.1
840378.3
666791.3
7NA NA
25224605.8
68037.79
316097.4
5 16343.472621.9
5NA
25928372.9
8 14127513656.0
323240.4
7 13108.5NA
26713770.9
717851.1
125768.6
75911.27
4 18320.3NA
27319411.7
814821.5
18386.38
625066.4
212834.2
3NA
2803067.31
811353.2
76735.42
69277.93
81397.60
3NA
287NA NA3493.93
8NA NA14610.0
7
Julian Day
Microcystis (cells/ml)
182 3667.883188 46381.514195 89095.144
203111960.54
3210 31070.727217 19824.800224 16395.252231 27626.305238 26363.801247 44301.534252 27541.291259 43930.596267 16324.465273 16104.062280 6366.310287 9052.005
Microcystis 2003
• Data is from the Rubenstein Ecosystems Science Laboratory’s toxic algal bloom monitoring program
• Data from dominant taxa (Microcystis 2003-2005, Anabaena 2006)
• Averaged across all sites within Missisquoi bay for each year
• Included only sites that had ancillary nutrient data

Ancillary data
The nutrients The competitors
Chlorophyceae (green algae)
TP TN
TP
TN
SRP
Bacillariophyceae (diatoms)
Cryptophyceae

Mathematical Framework
Population models take on a general form of
Basic types include:
)( 1 ttNfN
Random Walk
Exponential Growth
Logistic Growth (Ricker form shown)
),0( 21 NormNN tt
),σΝorm(NrN tt2
10 0
),σΝorm(K
NrNN t
tt2
01 01exp

Mathematical Framework
Random walkDensity dependent
Exponential
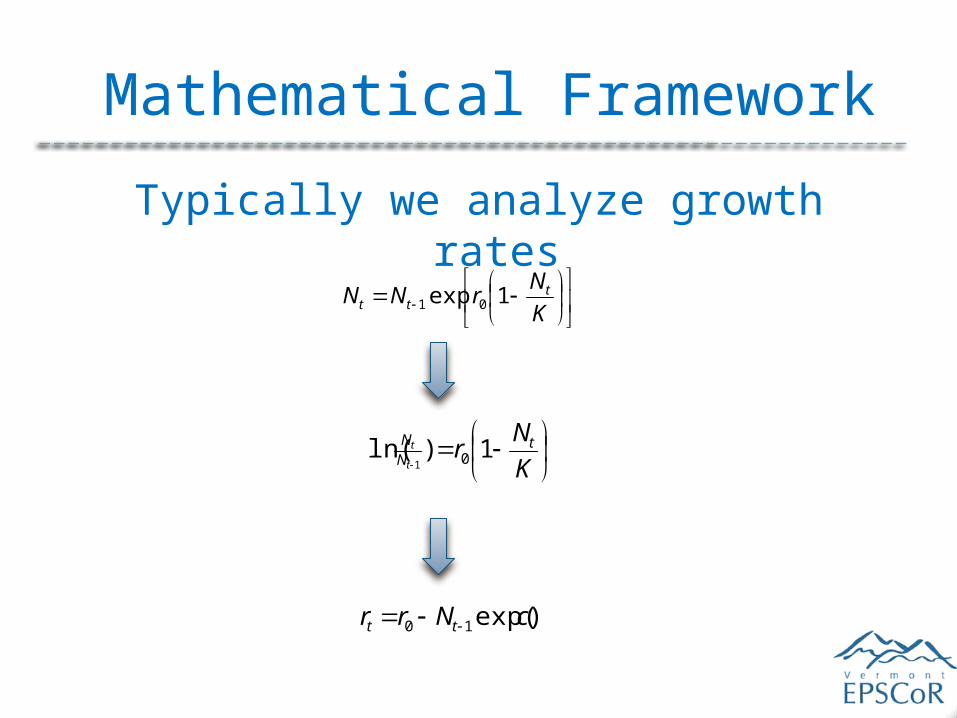
Mathematical Framework
Typically we analyze growth rates
K
NrNN t
tt 1exp 01
K
Nr t
NN
t
t 1)ln( 01
)exp(10 cNrr tt

Mathematical Framework
Random walkDensity dependent
Exponential

Mathematical Framework
Exogenous drivers
)1...11,...,,...,( 21121 dtttdtttdtttt CCCEEENNNfr

Mathematical Framework
Exogenous drivers
)1...11,...,,...,( 21121 dtttdtttdtttt CCCEEENNNfr
)exp()( 10 cNrNf tdt dtdt EEf 1)( dtdt CCf 1)1( 1
Ricker logistic growth Linear Linear
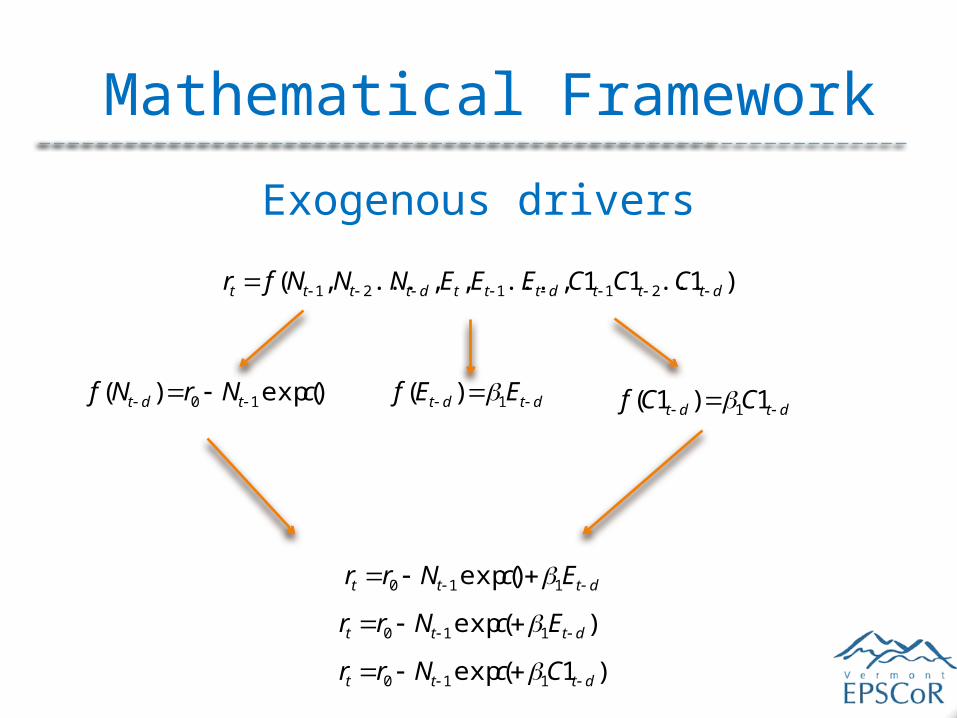
Mathematical Framework
Exogenous drivers
)1...11,...,,...,( 21121 dtttdtttdtttt CCCEEENNNfr
)exp()( 10 cNrNf tdt dtdt EEf 1)( dtdt CCf 1)1( 1
dttt EcNrr 110 )exp(
)exp( 110 dttt EcNrr
)1exp( 110 dttt CcNrr

A naïve analysis
For each year fit the following models
Assessed model fit with AICc (AIC + 2K(K+1)/n-K-1)
ttt EcNrr 110 )exp(
)exp( 110 ttt EcNrr
)1exp( 1110 ttt CcNrr
1110 )exp( ttt EcNrr
)exp( 1110 ttt EcNrr
)exp(10 cNrr tt 0rrt
Random walk / exponential growth
Density dependent (endogenous factors)
CompetitorsEnvironmental factors
tt Err 10
tt Err 10

A naïve analysis
Microcystis 2004

A naïve analysis
Microcystis 2004
Model AICc ∆AICc AIC weight
R2
29.7 0 0.33 0.45
30.5 0.81 0.22 0.41
32.2 2.45 0.10 0.49
32.3 2.57 0.09 0.48
33.3 3.58 0.05 0.44
110 tt TPrr
t
tt TP
TNrr 10
1110 )exp( ttt TNcNrr
t
ttt TP
TNcNrr 110 )exp(
1110 )exp( ttt TPcNrr

A Problem
Autocorrelation plot for Microcystis 2004
Not Stationary!

A solution?
Detrending!Microcystis 2004

A solution?
Probably not…
• Need to have evidence to assume an environmental change results in shifting carrying capacity.
• Can introduce spurious corellations
Microcystis 2004
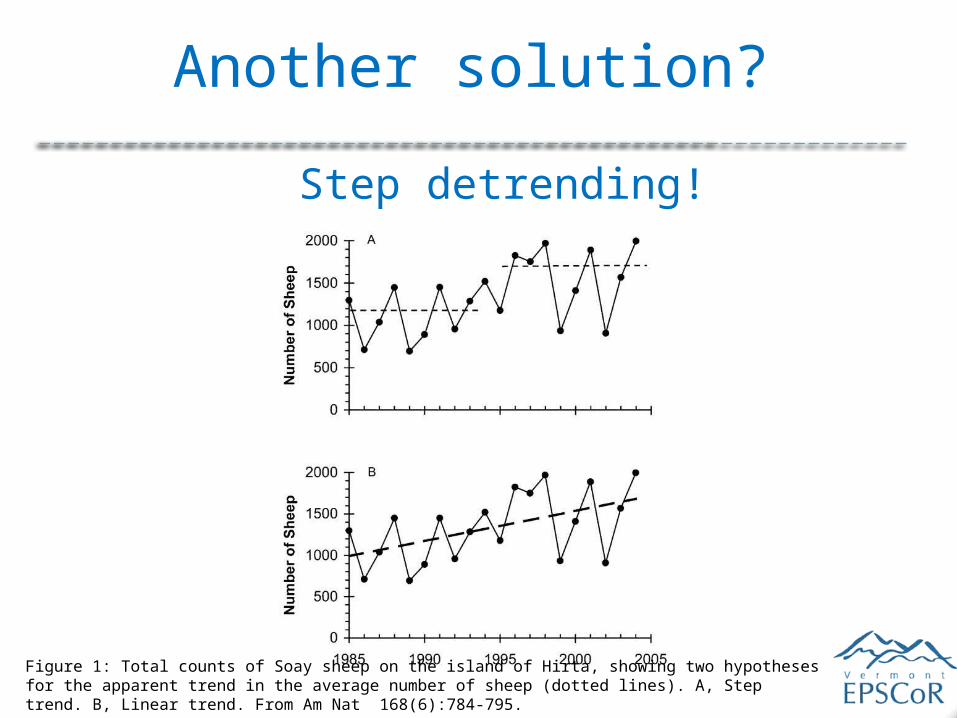
Figure 1: Total counts of Soay sheep on the island of Hirta, showing two hypotheses for the apparent trend in the average number of sheep (dotted lines). A, Step trend. B, Linear trend. From Am Nat 168(6):784-795.
Another solution?
Step detrending!

Another solution?
Step detrending!Microcystis 2004
Too short, only 5 points!

Julian Day
Growth Rate
Microcystis (cells/ml)
182 2.54 3667.88188 0.65 46381.51195 0.23 89095.14
203 -1.28111960.5
4210 -0.45 31070.73217 -0.19 19824.80224 0.52 16395.25231 -0.05 27626.31238 0.52 26363.80247 -0.48 44301.53252 0.47 27541.29259 -0.99 43930.60267 -0.01 16324.47273 -0.93 16104.06280 0.35 6366.31
Another solution!
Time series “stitching”
Julian Day
Microcystis (cells/ml)
182 3667.883188 46381.514195 89095.144
203111960.54
3210 31070.727217 19824.800224 16395.252231 27626.305238 26363.801247 44301.534252 27541.291259 43930.596267 16324.465273 16104.062280 6366.310287 9052.005
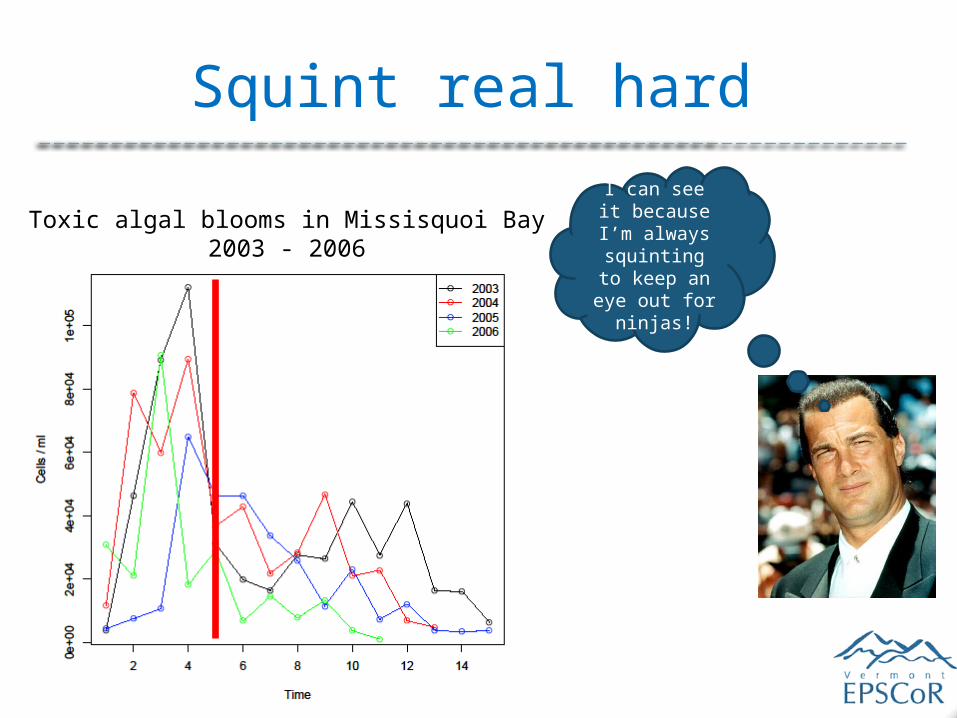
Squint real hard
Toxic algal blooms in Missisquoi Bay2003 - 2006
I can see it because I’m
always squinting to keep an eye
out for ninjas!

Phase portraits
2004 Microcystis

Phase portraits2003 Microcystis 2005 Microcystis
2004 Microcystis 2006 Anabaena

A naïve analysis revisited
For each year fit the following models
Assessed model fit with AICc (AIC + 2K(K+1)/n-K-1)
ttt EcNrr 110 )exp(
)exp( 110 ttt EcNrr
)1exp( 1110 ttt CcNrr
1110 )exp( ttt EcNrr
)exp( 1110 ttt EcNrr
)exp(10 cNrr tt 0rrt
Random walk / exponential growth
Density dependent (endogenous factors)
CompetitorsEnvironmental factors
tt Err 10
tt Err 10
Do all this again but with our two new series!

Model AICc ∆AICc AIC weight
R2
33.1 0 0.63 0.8
38.3 5.2 0.04 0.71
38.4 5.3 0.04 0.64
38.9 5.8 0.03 0.7
38.9 5.8 0.03 0.7
Bloom phase dynamics
1110 )exp( ttt TNcNrr
ttt TPcNrr 110 )exp(
t
ttt TP
TNcNrr 110 )exp(
)exp(10 cNrr tt
1110 )exp( ttt SRPcNrr
t
ttt TP
TNNr 08.0)8.10exp(28.0 1

Model AICc ∆AICc AIC weight
R2
78.8 0 0.21 0.18
81.2 2.4 0.06 -
81.4 2.6 0.06 0.13
81.6 2.8 0.05 0.12
81.7 2.9 0.05 0.04
Decline phase dynamics
)exp( 110 ttt TNcNrr
0rrt
)*1.3305.7exp(12.0 1 ttt TNNr
)exp(10 cNrr tt
)exp( 110 ttt TPcNrr
)exp( 1110 ttt CrcNrr *
* Cr = Cryptophyceae

The problem revisited…
Growth rates of toxic algal blooms in Missisquoi Bay2003 - 2006

Is it N:P then?

No, but what can we say then?
• Toxic algal blooms have two distinct dynamic phases, a pattern observed across years and genera.
• N:P important in the bloom phase, but not the decline, i.e. nutrients don’t always matter.
• Once a bloom starts, you can’t really do anything about it.
And one more thing about N:P

A final thought on N:P
Smith 1983Partial residual plot of bloomphase growth rate model
Population size and N:Pon bloom phase data

Thanks!
• VT EPSCoR
• My collaborators– Nicholas Gotelli– Rebecca Gorney– Mary Watzin
• The EPSCoR complex systems group
perfunctory comic to keep you entertained during questions

Mathematical Framework
Environmental Factors
Effect on growth rate
Effect on density dependence
XcNrr tt 110 )exp(
)exp( 110 XcNrr tt

Plankton Time Series Analysis
A naïve approach Complex population dynamic approach
Using a complex population dynamics modeling approach we parse four years of plankton time series into two distinct phases, bloom phase and decline phase, each with distinct dynamics. This method provides a far superior fit to traditional statistical correlative methods.