
Population Dynamics - McGill University School of …hv/classes/MS/lecture.systdyn.pdfPopulation...
33
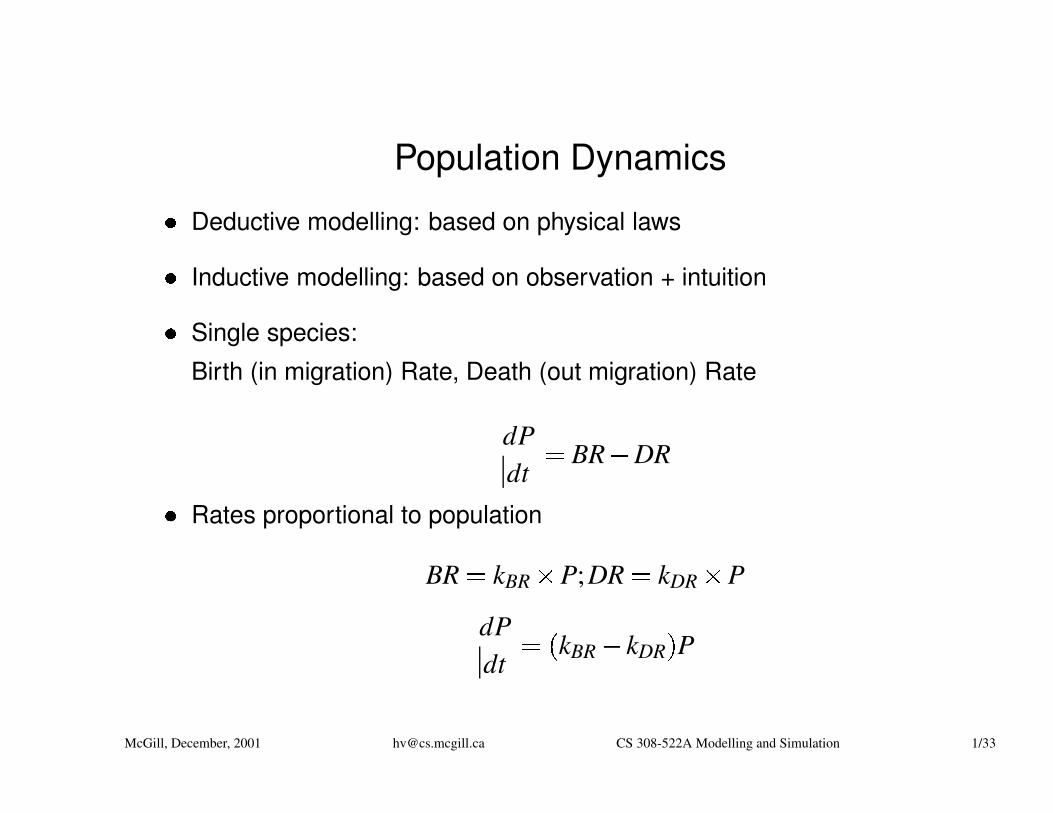
Population Dynamics Deductive modelling: based on physical laws Inductive modelling: based on observation + intuition Single species: Birth (in migration) Rate, Death (out migration) Rate dP dt BR DR Rates proportional to population BR k BR P; DR k DR P dP dt k BR k DR P McGill, December, 2001 [email protected] CS 308-522A Modelling and Simulation 1/33
-
Upload
truongkien -
Category
Documents
-
view
215 -
download
2
Transcript of Population Dynamics - McGill University School of …hv/classes/MS/lecture.systdyn.pdfPopulation...
Population Dynamics� Deductive modelling: based on physical laws
� Inductive modelling: based on observation + intuition
� Single species:
Birth (in migration) Rate, Death (out migration) Rate
dPdt
� BR � DR
� Rates proportional to population
BR � kBR � P;DR � kDR � P
dPdt
� � kBR � kDR � P
McGill, December, 2001 [email protected] CS 308-522A Modelling and Simulation 1/33
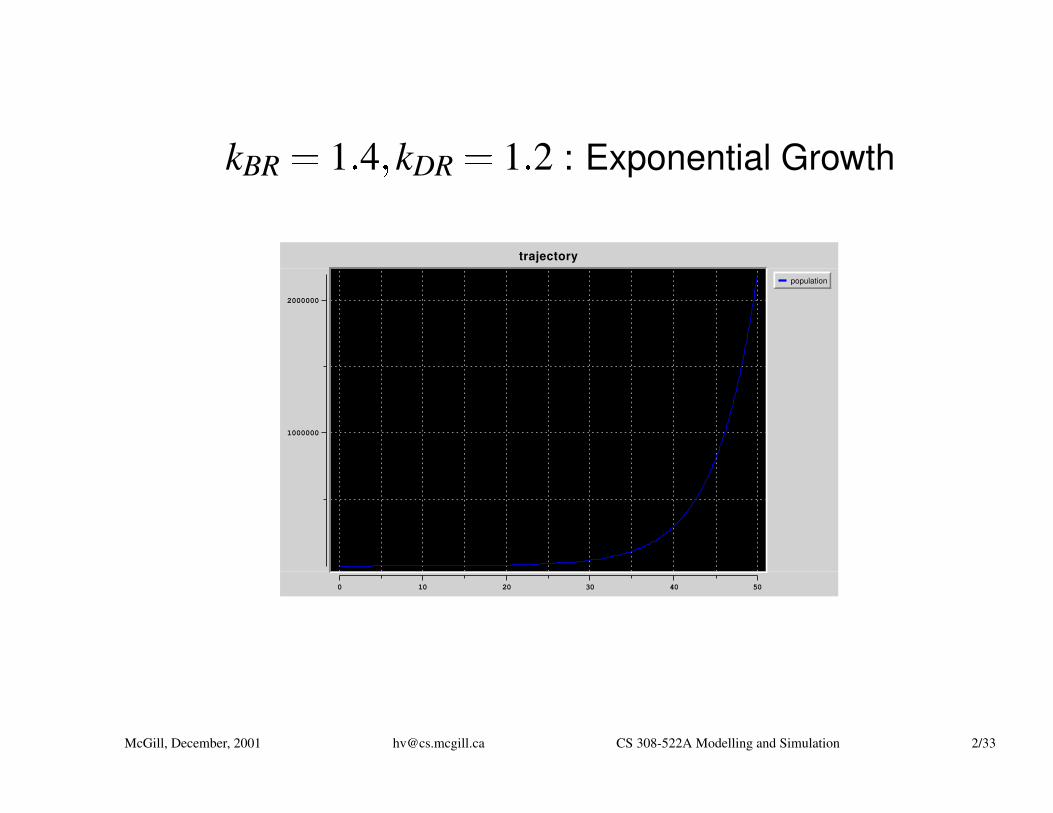
kBR � 1� 4 � kDR � 1� 2 : Exponential Growth
population
trajectory
0 10 20 30 40 50
1000000
2000000
McGill, December, 2001 [email protected] CS 308-522A Modelling and Simulation 2/33

kBR � 1� 4 � kDR � 1� 2 : log(Exponential Growth)
population
trajectory
0 10 20 30 40 50
1E2
1E3
1E4
1E5
1E6
1E7
McGill, December, 2001 [email protected] CS 308-522A Modelling and Simulation 3/33
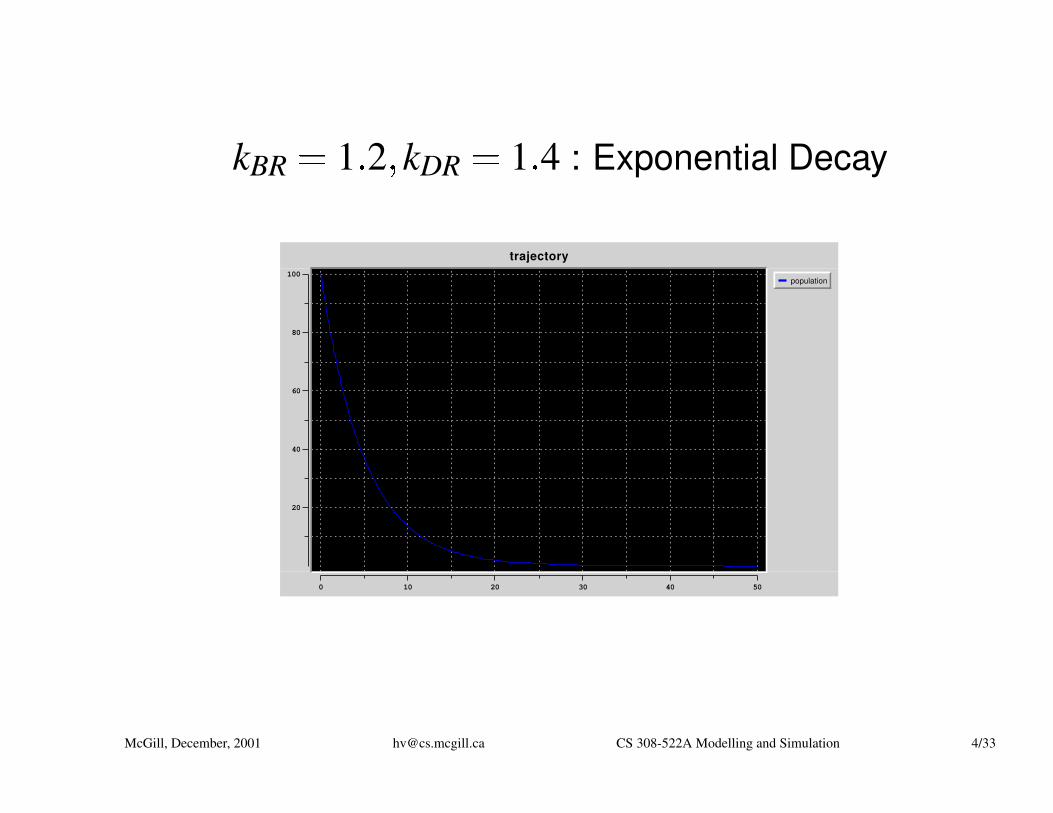
kBR � 1� 2 � kDR � 1� 4 : Exponential Decay
population
trajectory
0 10 20 30 40 50
20
40
60
80
100
McGill, December, 2001 [email protected] CS 308-522A Modelling and Simulation 4/33
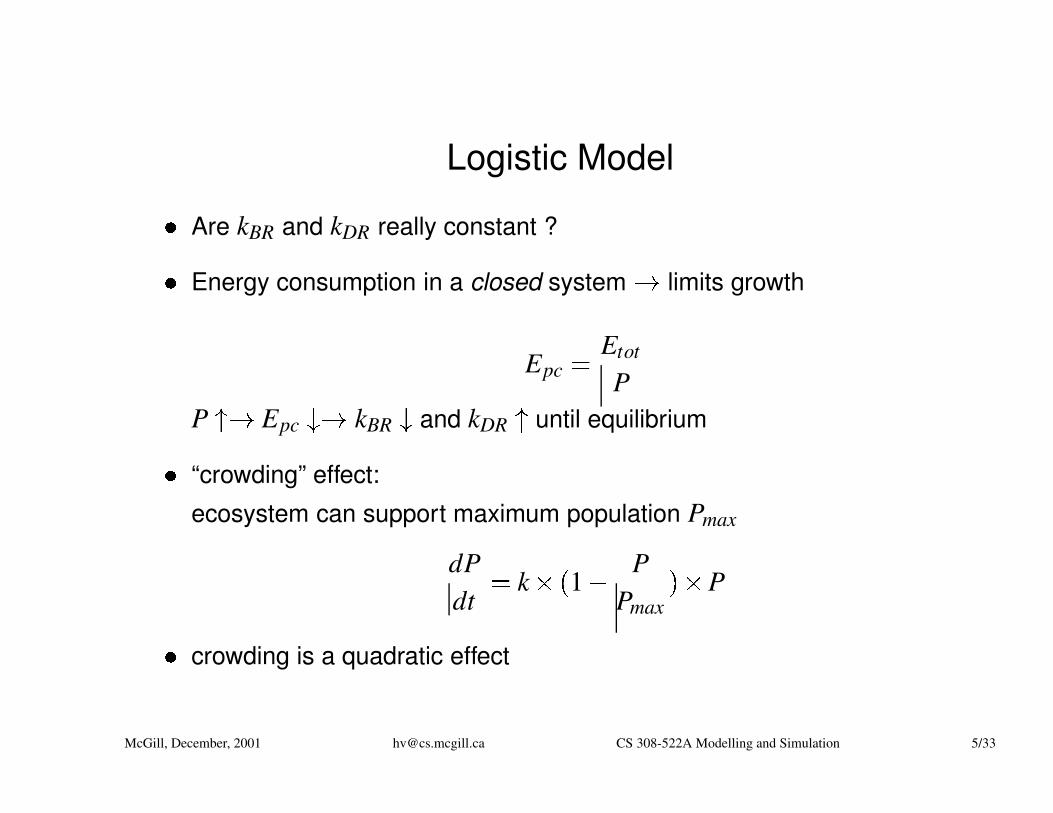
Logistic Model� Are kBR and kDR really constant ?
� Energy consumption in a closed system limits growth
Epc � Etot
PP Epc � kBR � and kDR until equilibrium
� “crowding” effect:
ecosystem can support maximum population Pmax
dPdt
� k � � 1 � PPmax
� � P
� crowding is a quadratic effect
McGill, December, 2001 [email protected] CS 308-522A Modelling and Simulation 5/33

kBR � 1� 2 � kDR � 1� 4 � crowding � 0� 001
population
trajectory
time0 20 40 60
po
pu
lati
on
0
100
200
McGill, December, 2001 [email protected] CS 308-522A Modelling and Simulation 6/33

Disadvantages� NO physical evidence for model structure !
� But, many phenomena can be well fitted by logistic model.
� Pmax can only be estimated once steady-state has been reached. Not
suitable for control, optimisation, . . .
� Many-species system: Pmax, steady-state ?
McGill, December, 2001 [email protected] CS 308-522A Modelling and Simulation 7/33
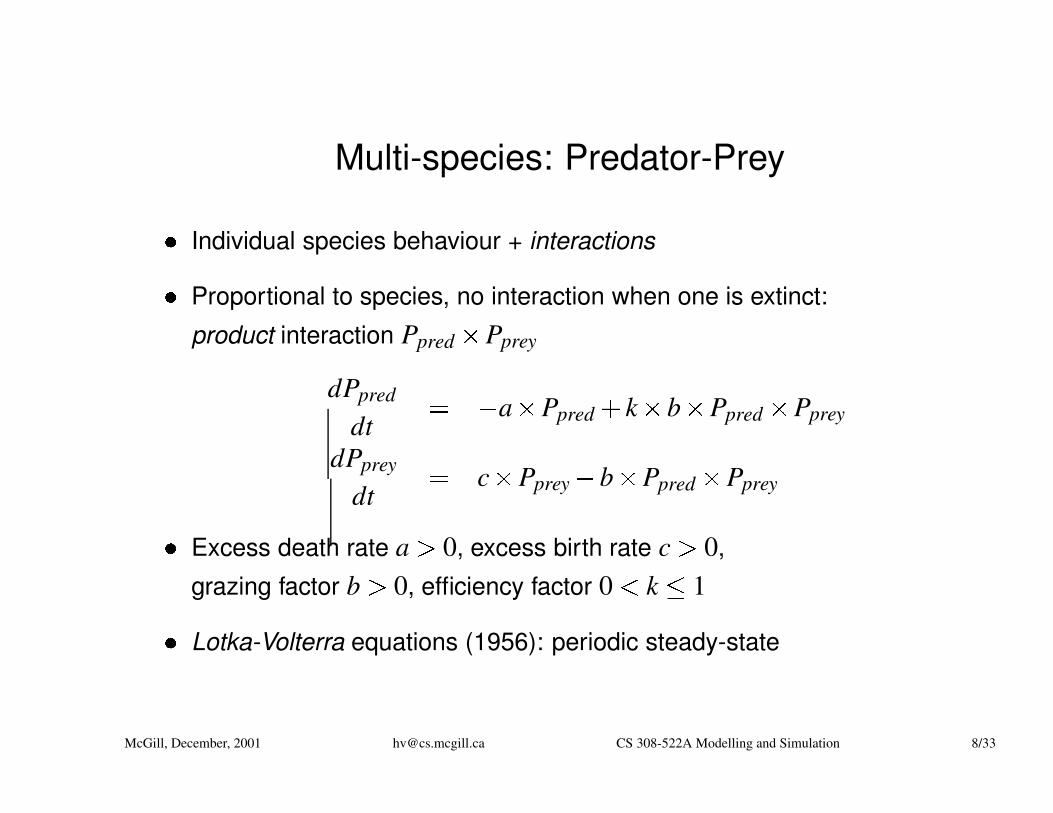
Multi-species: Predator-Prey� Individual species behaviour + interactions
� Proportional to species, no interaction when one is extinct:
product interaction Ppred � Pprey
dPpred
dt� � a � Ppred� k � b � Ppred � Pprey
dPprey
dt
� c � Pprey � b � Ppred � Pprey
� Excess death rate a 0, excess birth rate c 0,
grazing factor b 0, efficiency factor 0 � k � 1
� Lotka-Volterra equations (1956): periodic steady-state
McGill, December, 2001 [email protected] CS 308-522A Modelling and Simulation 8/33
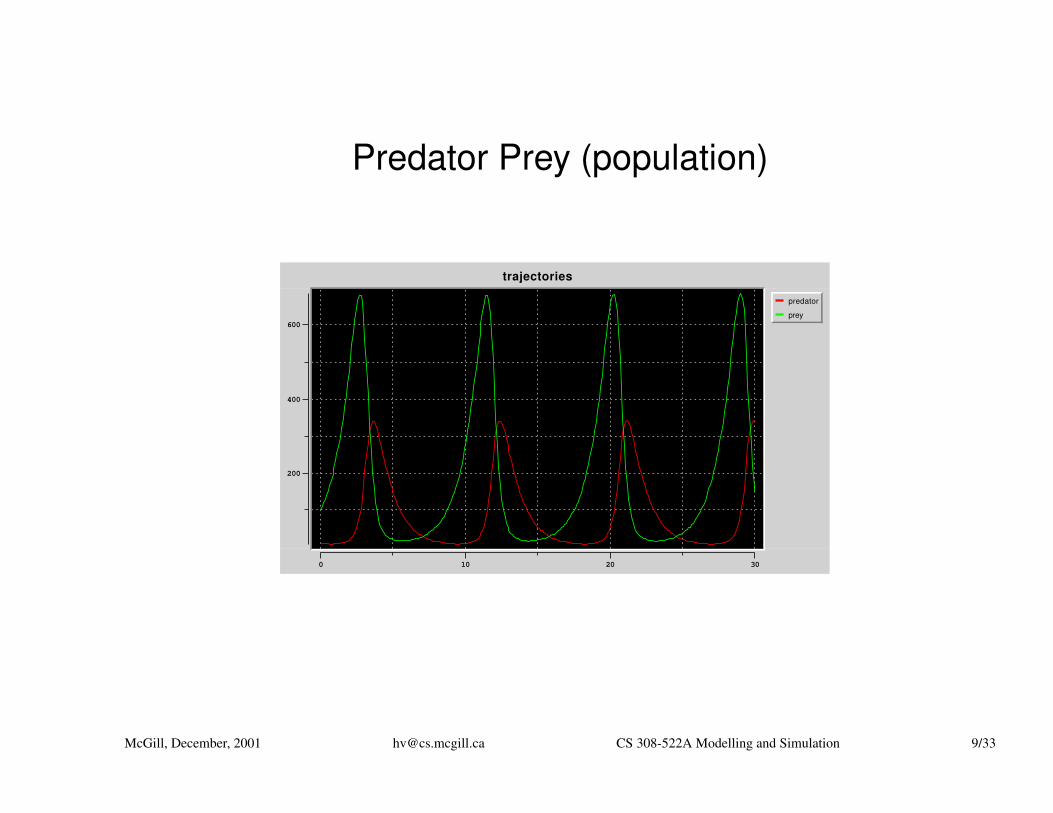
Predator Prey (population)
predator
prey
trajectories
0 10 20 30
200
400
600
McGill, December, 2001 [email protected] CS 308-522A Modelling and Simulation 9/33
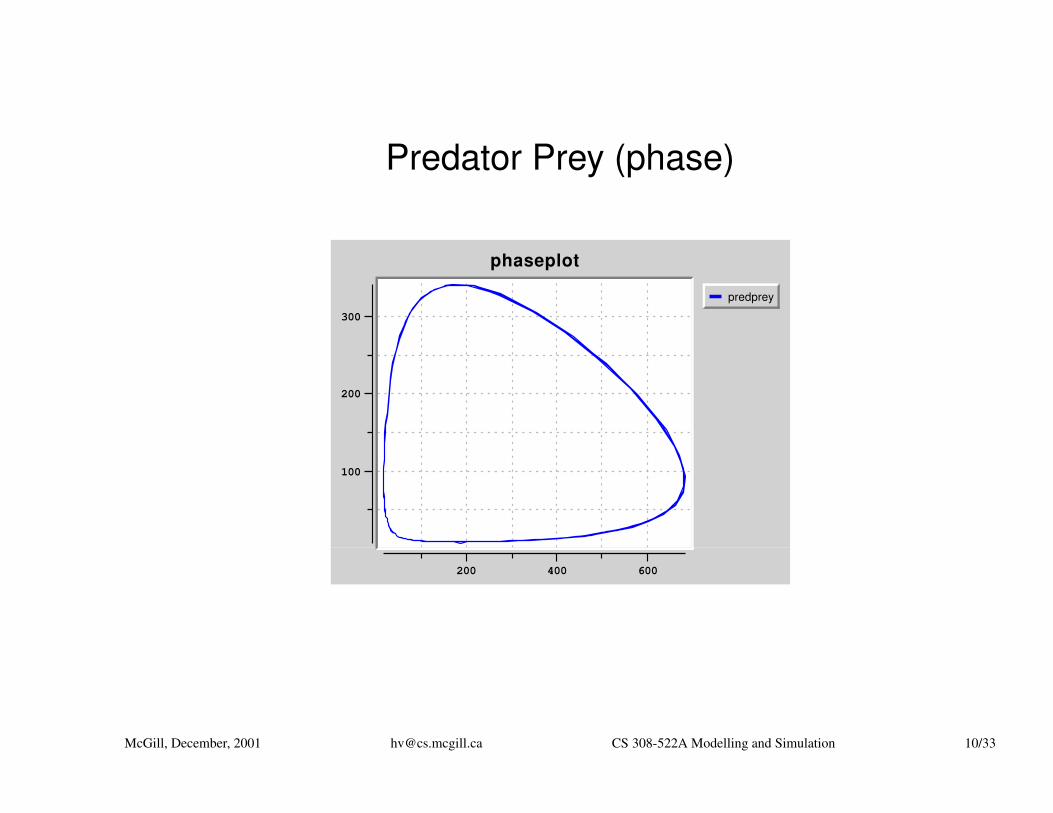
Predator Prey (phase)
predprey
phaseplot
200 400 600
100
200
300
McGill, December, 2001 [email protected] CS 308-522A Modelling and Simulation 10/33
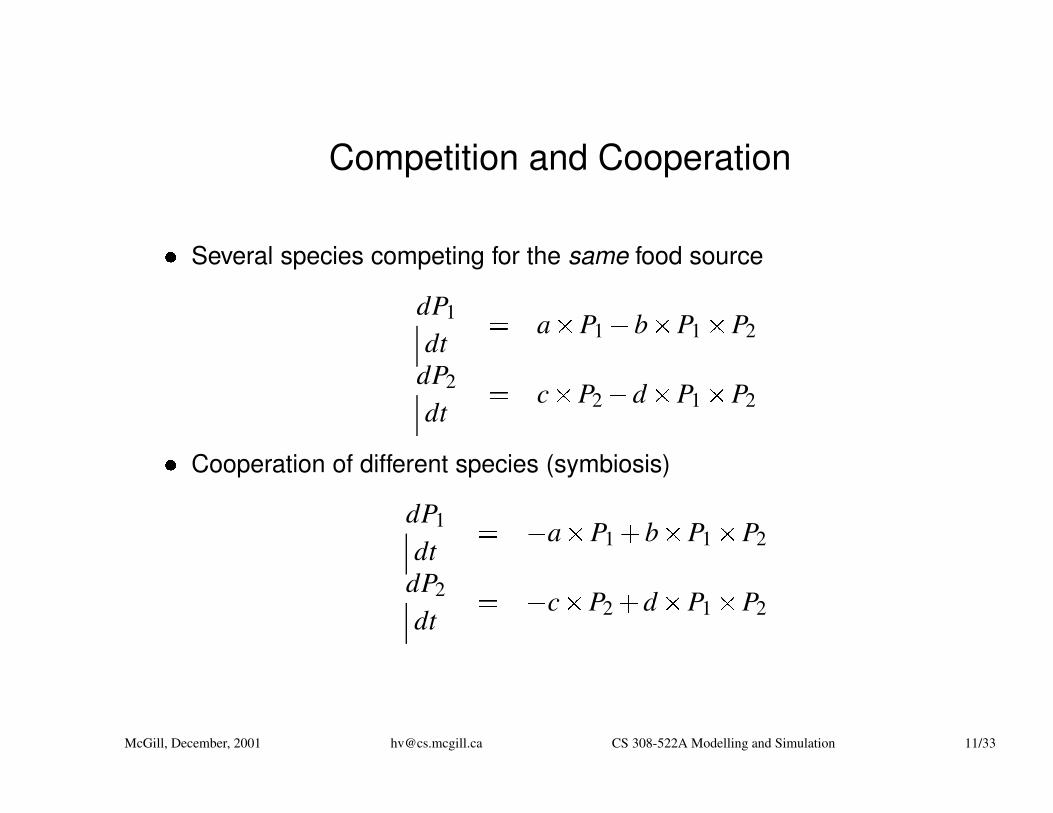
Competition and Cooperation� Several species competing for the same food source
dP1
dt
� a � P1 � b � P1 � P2
dP2
dt
� c � P2 � d � P1 � P2
� Cooperation of different species (symbiosis)
dP1
dt
� � a � P1� b � P1 � P2
dP2
dt
� � c � P2� d � P1 � P2
McGill, December, 2001 [email protected] CS 308-522A Modelling and Simulation 11/33
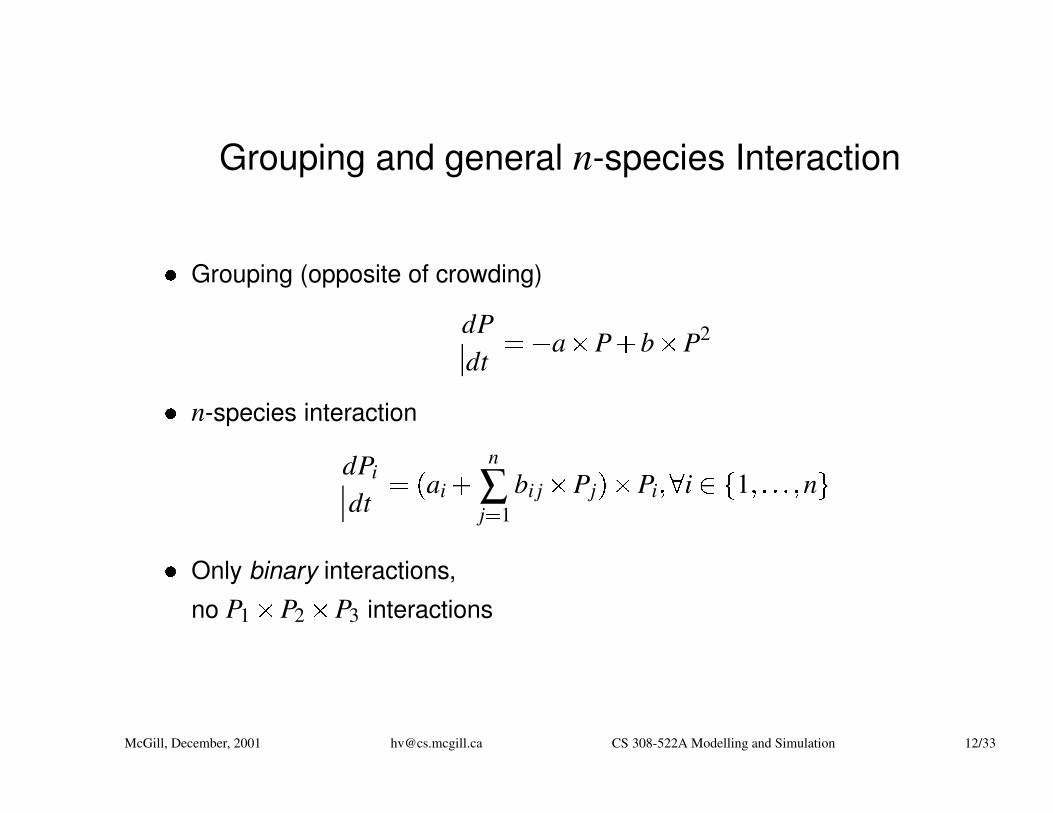
Grouping and general n-species Interaction� Grouping (opposite of crowding)
dPdt
� � a � P� b � P2
� n-species interaction
dPi
dt
� � ai�n
∑j� 1
bi j � Pj � � Pi ��� i � � 1 ��� � � � n �
� Only binary interactions,
no P1 � P2 � P3 interactions
McGill, December, 2001 [email protected] CS 308-522A Modelling and Simulation 12/33

Forrester System Dynamics� based on observation + physical insight
� semi-physical, semi-inductive methodology
McGill, December, 2001 [email protected] CS 308-522A Modelling and Simulation 13/33

Methodology
1. levels/stocks and rates/flows
Level Inflow Outflow
population birth rate death rate
inventory shipments sales
money income expenses
2. laundry list: levels, rates, and causal relationships
birth rate birth population
3. Influence Diagram (+ and -)
4. Structure DiagramdPdt
� BR � DR
McGill, December, 2001 [email protected] CS 308-522A Modelling and Simulation 14/33
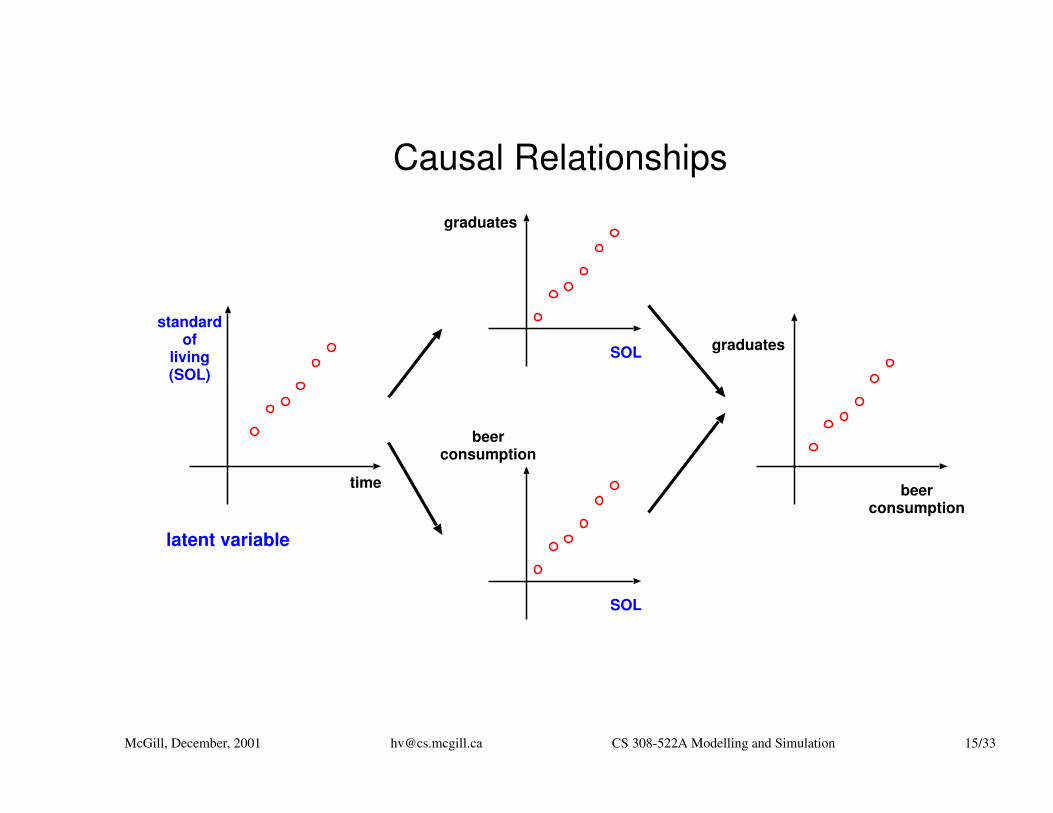
Causal Relationships
latent variable
beerconsumption
graduatesstandard
ofliving(SOL)
time
graduates
SOL
beerconsumption
SOL
McGill, December, 2001 [email protected] CS 308-522A Modelling and Simulation 15/33

Archetypes� Bellinger http://www.outsights.com/systems/
� influence diagrams
� Common combinations of reinforcing and balancing structures
McGill, December, 2001 [email protected] CS 308-522A Modelling and Simulation 16/33
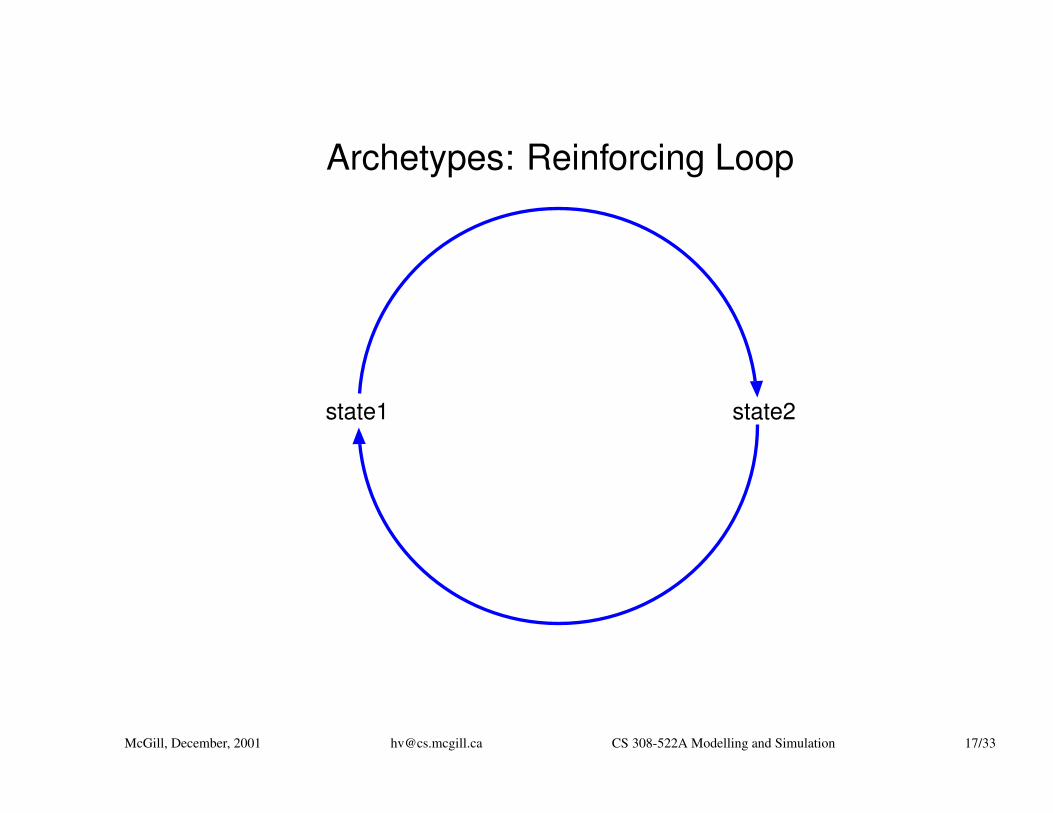
Archetypes: Reinforcing Loop
state1 state2
McGill, December, 2001 [email protected] CS 308-522A Modelling and Simulation 17/33
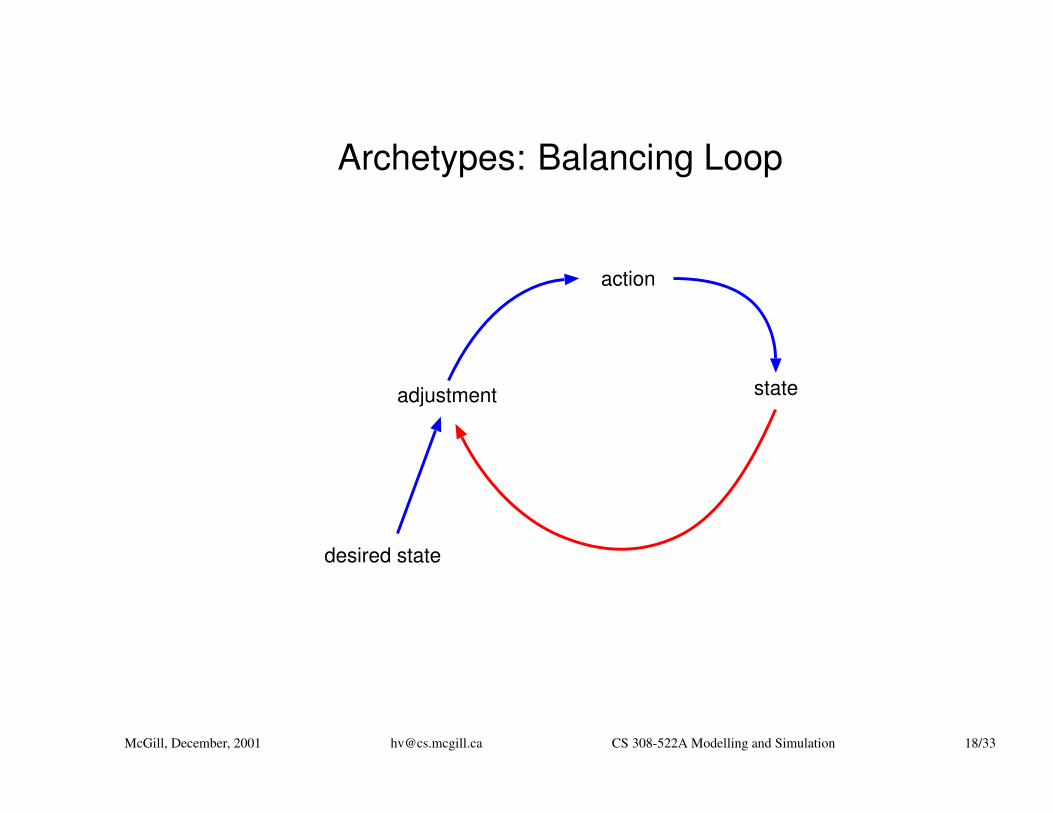
Archetypes: Balancing Loop
adjustment state
desired state
action
McGill, December, 2001 [email protected] CS 308-522A Modelling and Simulation 18/33

Forrester System Dynamics
Predator Prey
Grazing_efficiency
uptake_predatorloss_prey
predator_surplus_DR
prey_surplus_BR
2−species predator−prey system
McGill, December, 2001 [email protected] CS 308-522A Modelling and Simulation 19/33
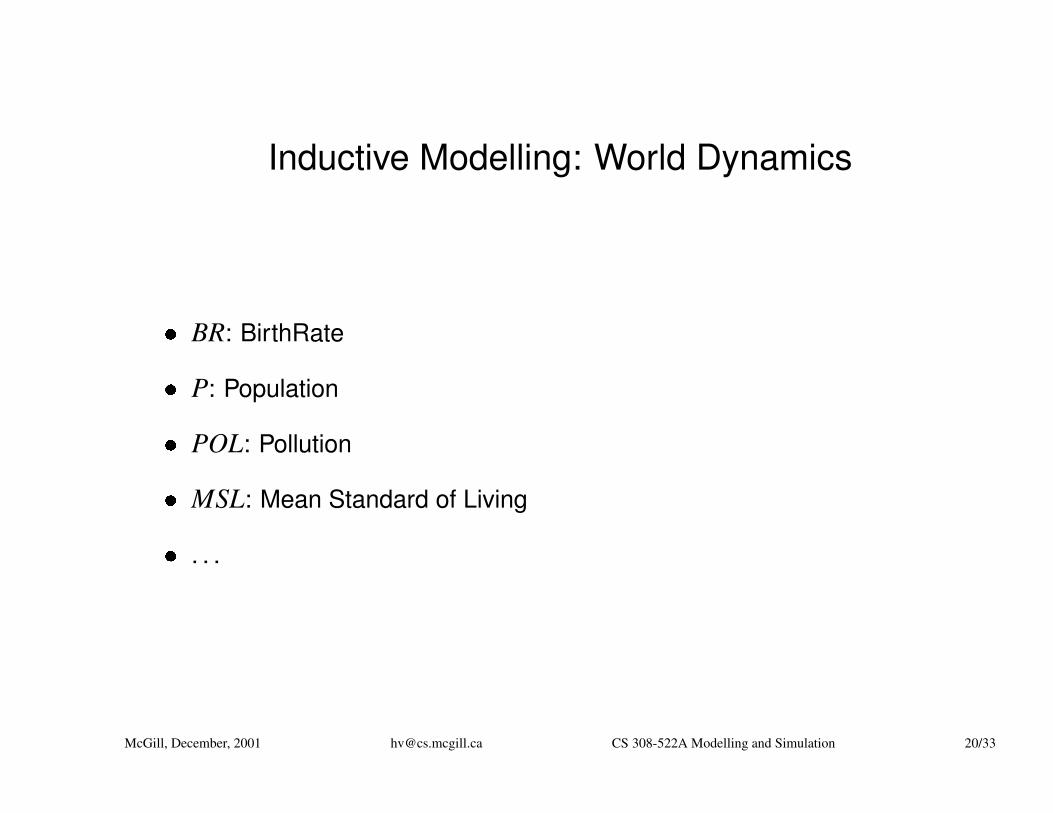
Inductive Modelling: World Dynamics� BR: BirthRate
� P: Population
� POL: Pollution
� MSL: Mean Standard of Living
� . . .
McGill, December, 2001 [email protected] CS 308-522A Modelling and Simulation 20/33
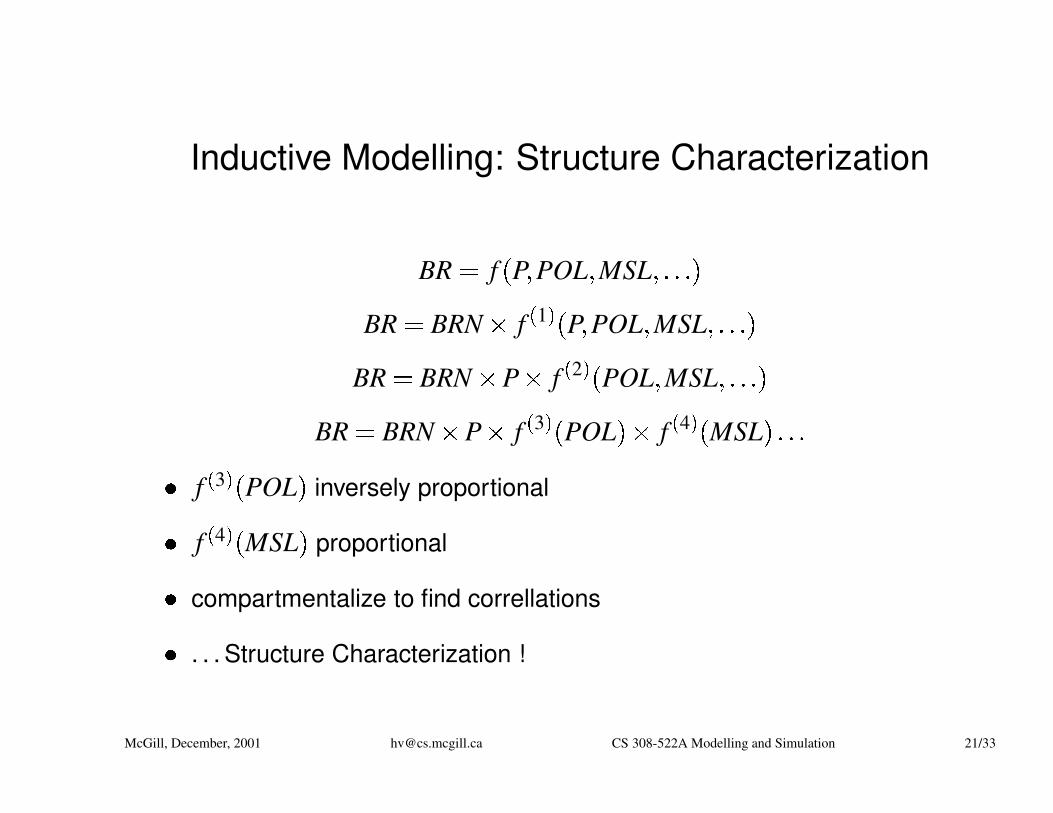
Inductive Modelling: Structure Characterization
BR � f � P� POL � MSL ��� � � �
BR � BRN � f� 1 � � P� POL � MSL � � � � �
BR � BRN � P � f� 2 � � POL � MSL � � � � �
BR � BRN � P � f� 3 � � POL � � f� 4 � � MSL � � � �
� f� 3 � � POL � inversely proportional
� f� 4 � � MSL � proportional
� compartmentalize to find correllations
� . . . Structure Characterization !
McGill, December, 2001 [email protected] CS 308-522A Modelling and Simulation 21/33
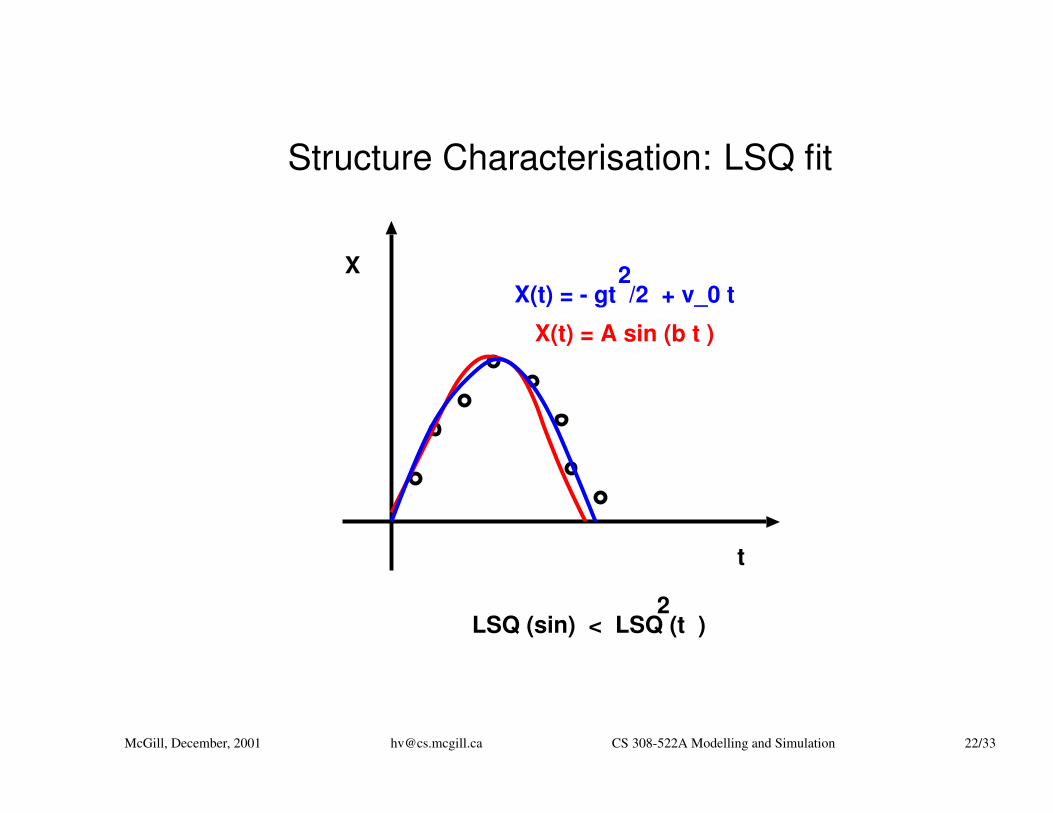
Structure Characterisation: LSQ fit
X(t) = - gt /2 + v_0 t2
X(t) = A sin (b t )
t
X
LSQ (sin) < LSQ (t ) 2
McGill, December, 2001 [email protected] CS 308-522A Modelling and Simulation 22/33

Feature Extraction
1. Measurement data and model candidates
2. Structure selection and validation
3. Parameter estimation
4. Model use
McGill, December, 2001 [email protected] CS 308-522A Modelling and Simulation 23/33

Feature Rationale
Minimum Sensitivity to Noise
Maximum Discriminating Power
McGill, December, 2001 [email protected] CS 308-522A Modelling and Simulation 24/33
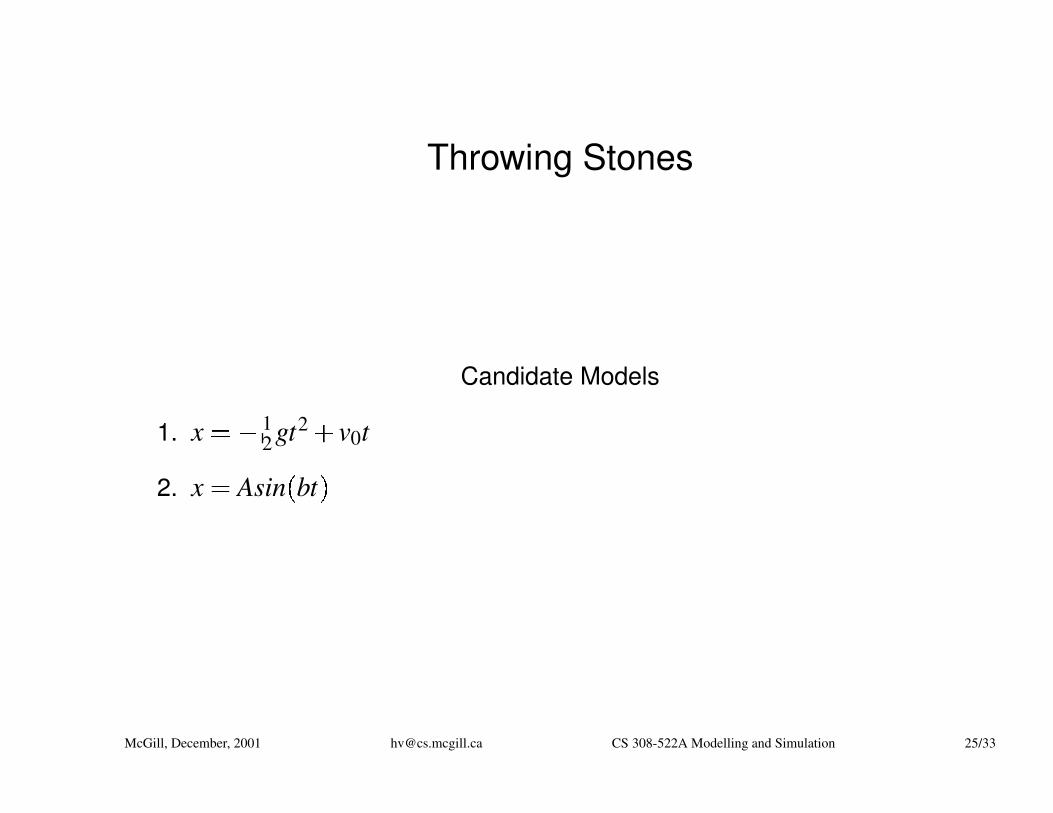
Throwing Stones
Candidate Models
1. x � � 12 gt2� v0t
2. x � Asin � bt �
McGill, December, 2001 [email protected] CS 308-522A Modelling and Simulation 25/33
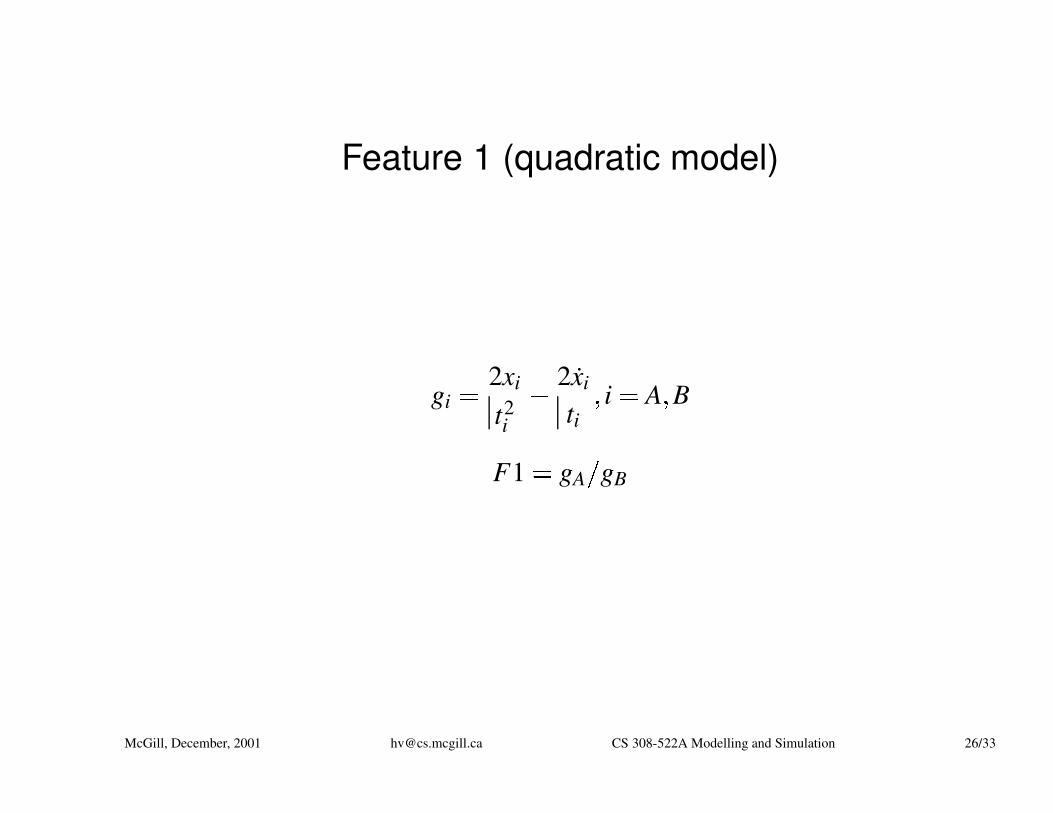
Feature 1 (quadratic model)
gi � 2xi
t2i
� 2xi
ti
� i � A � B
F1 � gA � gB
McGill, December, 2001 [email protected] CS 308-522A Modelling and Simulation 26/33
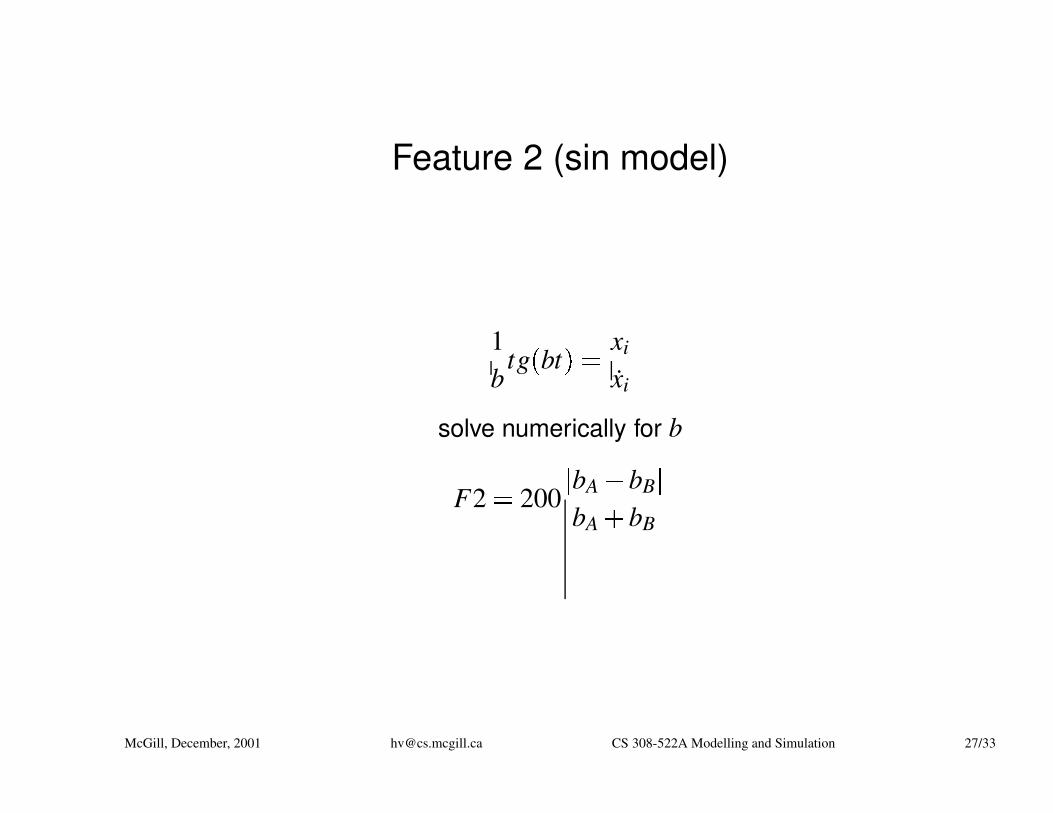
Feature 2 (sin model)
1b
tg � bt � � xi
xi
solve numerically for b
F2 � 200 � bA � bB �
bA� bB
McGill, December, 2001 [email protected] CS 308-522A Modelling and Simulation 27/33

Feature Space Classification
Feature t2
feature sin
F1 = gA/gBgi = 2xi/ti^2 - 2xi_der/ti
F2 = 200 |bA -bB|/(bA + bB)1/b(tg(bt)) = xi/xi_der
McGill, December, 2001 [email protected] CS 308-522A Modelling and Simulation 28/33
Forrester’s World Dynamics model� “Club of Rome” World Dynamics model
� Few “levels”, note the depletion of natural resources
� implemented in Vensim PLE (www.vensim.com)
McGill, December, 2001 [email protected] CS 308-522A Modelling and Simulation 29/33

Population
birth rate normalbirth rate normal 1
population initial
births crowdingmultiplier
births food multiplier
births deathsbirths material multiplier
births pollution multiplier
switch time 1<Time>
death rate normaldeath rate normal 1
deathscrowdingmultiplier
deaths food multiplier
deaths material multiplier
deaths pollution multiplier
switch time 3
crowding
land areapopulation
density normal
Population & Food
birthscrowdingmult tab
deathscrowdingmult tab
food ratio
food coefficientfood coefficient 1
food crowding multiplier
food percapita normal
food per capita potential
food pollutionmultiplier
switch time 7<Time>
foodpollutionmult tab
<pollution ratio>
<capital ratio agriculture>
food per capitapotential tab
<foodcrowdingmult tab>
<Time>
capital agriculture fraction indicated
births foodmult tab
deaths foodmult tab
capital agriculturefraction indicated tab
<material standard ofliving>
deathsmaterialmult tab
birthspollutionmult tab
births materialmult tab
<materialstandard of
living>
deaths pollutionmult tab
<pollution ratio>
McGill, December, 2001 [email protected] CS 308-522A Modelling and Simulation 30/33
Capital
capital initial
capital ratio
capital depreciation
capitalinvestment
rate normal 1
capital depreciationnormal
capital depreciationnormal 1
switch time 5
capital ratioagriculture
capitalagriculture
fraction normal
capitalinvestmentmultiplier
effective capital ratio
capitalinvestment
mult tab
capital investment
capitalinvestmentrate normal
<Population>
switch time 4<Time>
Capital & Quality of Life
CapitalAgriculture
Fraction
capital agriculturefraction adjustment
time
<capitalagriculture fraction
indicated>
capitalagriculture
fraction initial
capital investmentfrom quality ratio
<natural resource extraction multiplier>
quality material multiplier
qualitymaterialmult tab
material standard of living
effectivecapital ratio
normal
capitalinvestment
quality ratio tab
<quality foodmultiplier>
<natural resourceextraction
multiplier> quality of life
qualitycrowdingmultiplier quality food
multiplier
quality of lifenormal
quality pollutionmultiplier
<crowding>quality
crowdingmult tab
<food ratio>qualityfood
mult tab
<pollution ratio>quality
pollutionmult tab
<Time>
McGill, December, 2001 [email protected] CS 308-522A Modelling and Simulation 31/33
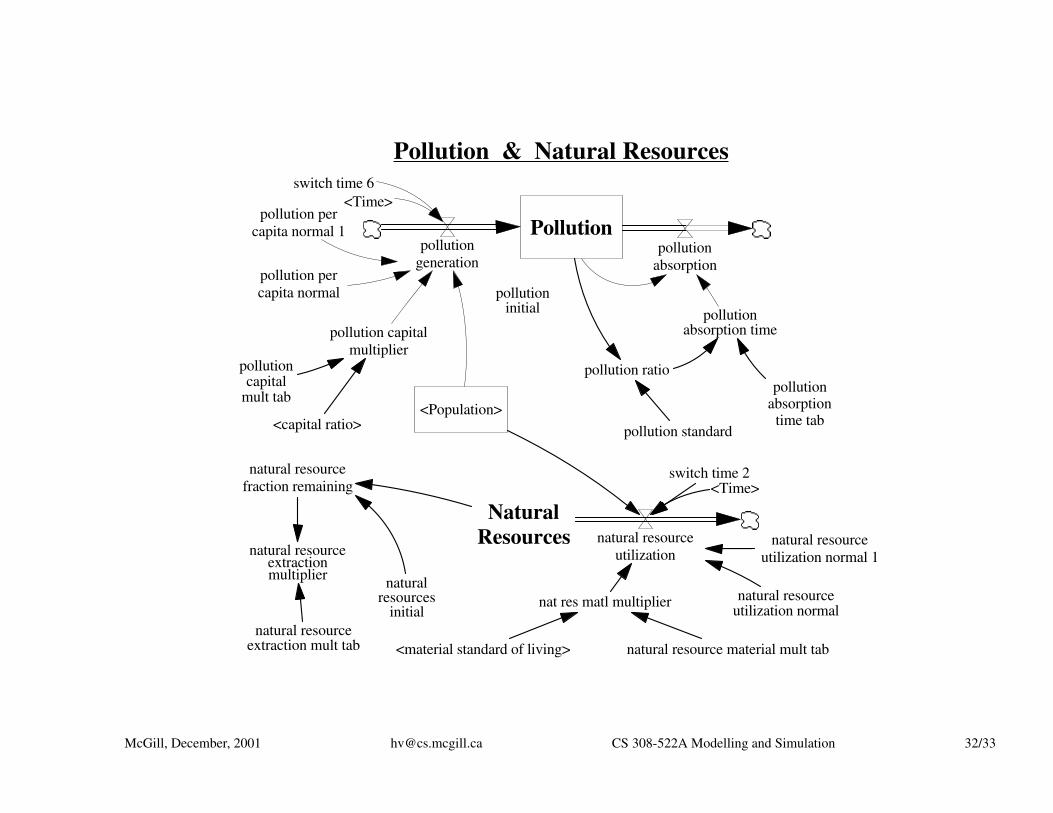
NaturalResources
pollutionabsorption
time tab
naturalresources
initial
pollution ratio
pollution standard
nat res matl multiplier natural resourceutilization normal
natural resourceutilization normal 1
<capital ratio>
switch time 2
pollutioncapital
mult tab
natural resourceutilization
Pollution & Natural Resources
Pollution
pollutioninitial
pollution capitalmultiplier
pollution percapita normal
pollution percapita normal 1
<Population>
switch time 6<Time>
pollutionabsorption time
pollutionabsorption
pollutiongeneration
<material standard of living> natural resource material mult tab
natural resourceextractionmultiplier
natural resourceextraction mult tab
natural resourcefraction remaining <Time>
McGill, December, 2001 [email protected] CS 308-522A Modelling and Simulation 32/33

World Model Results6 B Person
10 B Capital units40 B Pollution units
1e+012 Resource units2 Satisfaction units
0 Person0 Capital units0 Pollution units0 Resource units
0.4 Satisfaction units1900 1929 1957 1986 2014 2043 2071 2100
Time (Year)
Population : run1 PersonCapital : run1 Capital unitsPollution : run1 Pollution unitsNatural Resources : run1 Resource unitsquality of life : run1 Satisfaction units
McGill, December, 2001 [email protected] CS 308-522A Modelling and Simulation 33/33