Population dynamics and conservation biology of the over-exploited Mediterranean red coral
8
Journal of Theoretical Biology 244 (2007) 416–423 Population dynamics and conservation biology of the over-exploited Mediterranean red coral Giovanni Santangelo a, , Lorenzo Bramanti a , Mimmo Iannelli b a Department of Ethology, Ecology, Evolution, via A. Volta 6, I-56126 Pisa, Italy b Department of Mathematics, University of Trento, 38050 Povo, Trento, Italy Available online 16 September 2006 Abstract The main goal of ecologists is nowadays to foster habitat and species conservation. Life-history tables and Leslie–Lewis transition matrices of population growth can be powerful tools suitable for the study of age-structured over harvested and/or endangered species dynamics. Red coral (Corallium rubrum L 1758) is a modular anthozoan endemic to the Mediterranean Sea. This slow growing, long lived species has been harvested since ancient times. In the last decades harvesting pressure increased and the overall Mediterranean yield reduced by 2 3 . Moreover, mass mortality (putatively-linked to global warming) recently affected some coastal populations of this species. Red coral populations are discrete genetic units, gonochoric, composed by several overlapping generations and provided of a discrete (annual) reproduction. A population of this precious octocoral was studied in detail and its static life table was compiled. In order to simulate the trends overtime of the population under different environmental conditions and fishing pressures, a discrete, non-linear model, based on Leslie–Lewis transition matrix, was applied to the demographic data. In this model a bell-shaped curve, based on experimental data, representing the dependence of recruitment on adult colonies density was included. On these bases the stability of the population under different density, reproduction and mortality figures was analysed and simulations of the population trends overtime were set out. Some simulations were also carried out applying to the studied population the mortality values measured during the anomalous mass mortality event which really affected some red coral populations in 1999. The population under study showed high stability and a strong resilience capability, surviving to a 61% reduction of density, to a 27.7% reduction of reproduction rate and to an unselective harvesting affecting 95% of the reproductive colonies. r 2006 Elsevier Ltd. All rights reserved. Keywords: Red coral; Conservation biology; Global change; Age-structured discrete model; Population dynamics 1. Introduction Ecology can actually give a real contribution to biodiversity conservation (i.e. population, species, and habitat conservation) by means of methods and models suitable for this target (Dobson, 1998). Demography in particular, can supply useful tools for conservation and management of overexploited or endangered species (Dobson, 1998). A classic example is given by the demographic study on the bighorn (Ovis dalli; Bergher, 1990). Models based on life-history tables and Leslie–Lewis transition matrices of population growth can be powerful tools for the study of population trends overtime. Such models could help to assess population status, to examine the causes of poor performances, and to make predictions of population trends and viability overtime (Ebert, 1999; Beissinger and McCullough, 2002). Demographic population models, based on life-history tables and Leslie–Lewis transition matrices have been widely applied by conservation biologists to the study of population dynamics (Caswell, 2001) of several marine species: e.g. the loggerhead sea turtle Caretta caretta (Crouse et al., 1987) and the Right whale Eubalena glacialis (Fujiwara and Caswell, 2001). The precious red coral (Corallium rubrum L 1758) is a clear example of an over-harvested marine species which populations have been severely depleted (Santangelo and ARTICLE IN PRESS www.elsevier.com/locate/yjtbi 0022-5193/$ - see front matter r 2006 Elsevier Ltd. All rights reserved. doi:10.1016/j.jtbi.2006.08.027 Corresponding author. E-mail addresses: [email protected] (G. Santangelo), [email protected] (L. Bramanti), [email protected] (M. Iannelli).
-
Upload
giovanni-santangelo -
Category
Documents
-
view
215 -
download
1
Transcript of Population dynamics and conservation biology of the over-exploited Mediterranean red coral
ARTICLE IN PRESS
0022-5193/$ - se
doi:10.1016/j.jtb
�CorrespondE-mail add
(M. Iannelli).
Journal of Theoretical Biology 244 (2007) 416–423
www.elsevier.com/locate/yjtbi
Population dynamics and conservation biology of theover-exploited Mediterranean red coral
Giovanni Santangeloa,�, Lorenzo Bramantia, Mimmo Iannellib
aDepartment of Ethology, Ecology, Evolution, via A. Volta 6, I-56126 Pisa, ItalybDepartment of Mathematics, University of Trento, 38050 Povo, Trento, Italy
Available online 16 September 2006
Abstract
The main goal of ecologists is nowadays to foster habitat and species conservation. Life-history tables and Leslie–Lewis transition
matrices of population growth can be powerful tools suitable for the study of age-structured over harvested and/or endangered species
dynamics. Red coral (Corallium rubrum L 1758) is a modular anthozoan endemic to the Mediterranean Sea. This slow growing, long
lived species has been harvested since ancient times. In the last decades harvesting pressure increased and the overall Mediterranean yield
reduced by 23. Moreover, mass mortality (putatively-linked to global warming) recently affected some coastal populations of this species.
Red coral populations are discrete genetic units, gonochoric, composed by several overlapping generations and provided of a discrete
(annual) reproduction. A population of this precious octocoral was studied in detail and its static life table was compiled. In order to
simulate the trends overtime of the population under different environmental conditions and fishing pressures, a discrete, non-linear
model, based on Leslie–Lewis transition matrix, was applied to the demographic data. In this model a bell-shaped curve, based on
experimental data, representing the dependence of recruitment on adult colonies density was included. On these bases the stability of the
population under different density, reproduction and mortality figures was analysed and simulations of the population trends overtime
were set out. Some simulations were also carried out applying to the studied population the mortality values measured during the
anomalous mass mortality event which really affected some red coral populations in 1999. The population under study showed high
stability and a strong resilience capability, surviving to a 61% reduction of density, to a 27.7% reduction of reproduction rate and to an
unselective harvesting affecting 95% of the reproductive colonies.
r 2006 Elsevier Ltd. All rights reserved.
Keywords: Red coral; Conservation biology; Global change; Age-structured discrete model; Population dynamics
1. Introduction
Ecology can actually give a real contribution tobiodiversity conservation (i.e. population, species, andhabitat conservation) by means of methods and modelssuitable for this target (Dobson, 1998). Demography inparticular, can supply useful tools for conservation andmanagement of overexploited or endangered species(Dobson, 1998). A classic example is given by thedemographic study on the bighorn (Ovis dalli; Bergher,1990). Models based on life-history tables and Leslie–Lewis
e front matter r 2006 Elsevier Ltd. All rights reserved.
i.2006.08.027
ing author.
resses: [email protected] (G. Santangelo),
nipi.it (L. Bramanti), [email protected]
transition matrices of population growth can be powerfultools for the study of population trends overtime. Suchmodels could help to assess population status, to examinethe causes of poor performances, and to make predictionsof population trends and viability overtime (Ebert, 1999;Beissinger and McCullough, 2002).Demographic population models, based on life-history
tables and Leslie–Lewis transition matrices have beenwidely applied by conservation biologists to the study ofpopulation dynamics (Caswell, 2001) of several marinespecies: e.g. the loggerhead sea turtle Caretta caretta
(Crouse et al., 1987) and the Right whale Eubalena glacialis
(Fujiwara and Caswell, 2001).The precious red coral (Corallium rubrum L 1758) is a
clear example of an over-harvested marine species whichpopulations have been severely depleted (Santangelo and

ARTICLE IN PRESSG. Santangelo et al. / Journal of Theoretical Biology 244 (2007) 416–423 417
Abbiati, 2001). There is not the risk of an ecologicalextinction for this species but an economical extinction willbe possible (i.e. a population of a slow growing species,with positive density dependence, can survive to over-fishing but cannot reach again a size/age structure and adensity suitable for commercial harvesting).
Red coral is a colonial (modular) anthozoan endemic tothe Mediterranean Sea and neighbouring Atlantic areas,living on rocky bottoms between 20 and 200m depth(Zibrowius et al., 1984). Due to the high economic value ofits axial, carbonate skeleton, this species has beenharvested and traded world wide since ancient times.Nowadays a clear-cut, sharp reduction of overall fishingyield was recorded and in the last two decades theMediterranean yield reduced by 2
3(Santangelo and Abbiati,
2001).Red coral is a long-lived, gonochoric, brooder species,
whose lecithotrophic larvae (planulae) do not travel veryfar from their parent colonies (Vighi, 1972; Weinberg,1979). This species is structured in several geneticallydifferentiated, self-seeding units (populations) (Abbiati etal., 1993) that are composed by several overlappinggenerations. Reproduction is discrete and occurs within alimited time interval in early summer (Santangelo et al.,2003). Such populations can only decrease in number (dueto mortality) between two different reproductive cycles(Ricklefs and Miller, 1999).
As red coral has been harvested following a ‘‘bloomand burst’’ strategy in many countries, the main partof red coral populations have been now depleted. More-over, a mass mortality event affected in late summer 1999,the benthic fauna in some areas of the Western Mediterra-nean Sea (Cerrano et al., 2000) and the red coralpopulations in the Provence region (France) suffered awide mortality (Garrabou and Harmelin, 2002). Also ared coral population living in the Italian Ligurian Sea(Calafuria-Livorno), studied since several years, sufferedin the same period a sharp reduction of the net recruit-ment rate (Bramanti et al., 2005). These events co-occurredwith a thermal anomaly (DT4þ 4 �C) which affectedthe same geographic area in the same period. Suchanomaly was thus considered to be the cause of theseevents. As over-fishing could now be coupled withmass mortality, the co-occurrence of these two mortalitysources could dramatically depress population recovery. Inthis framework models suitable to project red coralpopulation trends overtime could supply highly usefulinsights into population dynamics and suggestions forspecies conservation.
In this paper we resume data for the red coral popu-lation of Calafuria, collected through the years, andformulate a Leslie-type model based on the specificmeasures. In Section 2 we present these data and inSection 3 we set up the model. Finally, in Section 4 we runvarious simulations of the model in order to discuss somequestions concerning conservation of the red coralpopulation.
2. Population features and data
For several years now, our research has been addressingthe genetic (Abbiati et al., 1993), demographic (Santangeloand Abbiati, 2001; Bramanti et al., 2003; Santangelo et al.,2004) and reproductive structure (Santangelo et al., 2003)of a red coral coastal population in the Western LigurianSea (Calafuria, Livorno, Italy, 430 300 N, 100 200 E). Redcoral patches dwell onto the vault of small crevices between20 and 45m depth. This population is made up of small,young, crowded colonies, 1
3of which are reproductive and
reach early sexual maturity (Santangelo et al., 2003). Thereproductive isolation of this population (Abbiati et al.,1993) allows us to set out realistic dynamic models in whichlarval output and recruitment occur locally and arecoupled (Caley et al., 1996). In this population a clear-cutpositive correlation between recruit and adult colonydensity has been also found (Santangelo et al., 2004). Inthe following we present the dataset of the studiedpopulation.
2.1. Demographic data
Data on population demographic structure have beencollected using two different sampling techniques. In a firstsampling all the colonies (1802), living in 20 squares,180 cm2 each were collected. Colonies were scraped with achisel by scuba diving from the vault of randomly selectedcrevices in which red coral settled. As scraping does notallow the identification of all recruits (they measure0:62mm in diameter) a micro-photographic (non-destruc-tive) sampling, was also performed on 28 squares, 180 cm2
each. On these last samples the relation between recruitsdensity and estimated number of planulae produced in thesame area (the control function in Section 2.3) wascalculated.There are several different estimates of red coral growth
rates (Garcia-Rodriguez and Masso, 1986; Abbiati et al.,1992; Cicogna et al., 1999; Garrabou and Harmelin, 2002;Marschall et al., 2004). Such variability could be due to thedifferent environments in which the populations dwell(caves, crevices, overhangs, cliffs). Also variable, all theseestimates indicate red coral is a slow growing long-livedspecies (the annual growth of colony diameter rangesbetween 1.32–0.24mm/y and the estimated life span rangesbetween 15 and 450 years).In order to obtain a reliable classification of the colonies
into size–age classes, we measured the growth rate ofcolonies settled on long-term artificial substrates (Bramantiet al., 2005). After four years we found that the coloniesexhibited an average diameter of 2:49� 0:48mm ð�SDÞ,corresponding to an average annual growth of0:62� 0:19mm=y. These findings allowed us to share allthe colonies into 13 different size/age classes on the basis oftheir diameters, as reported in Table 1. In Fig. 1 we presentthe population distribution that show a decreasing pattern,typical of populations in a steady state.

ARTICLE IN PRESS
Table 1
Static life-table of the red coral population
Size–age class i
(year)
Diameter (mm) Number of
colonies X i
Survival
Si ¼ X iþ1=X i
1 o0; 62 822 0,889
2 0,62-1,24 731 0,633
3 1,24-1,86 463 0,697
4 1,86-2,48 323 0,517
5 2,48-3,1 167 0,437
6 3,1-3,72 73 0,287
7 3,72-4,34 21 0,571
8 4,34-4,96 12 0,333
9 5,58-6,2 4 0,75
10 6,2-6,82 3 1
11 6,82-7,44 3 0,333
12 7,44-8,06 1 1
13 48; 06 1
Colonies were shared into 13 age–size classes.
Fig. 1. Size/age structure of the red coral population.
Table 2
Fecundity table of the red coral population
Age i F i qi sri Pi bi
1 0 0,87 0,58 0 0,00
2 0 0,87 0,58 6,20 0,00
3 0,36 0,87 0,58 15,91 2,89
4 0,64 0,87 0,58 31,07 10,03
5 0,82 0,87 0,58 52,18 21,59
6 0,97 0,87 0,58 79,72 39,02
7 0,98 0,87 0,58 114,07 56,41
8 0,99 0,87 0,58 155,58 77,72
9 1 0,87 0,58 204,57 103,23
10 1 0,87 0,58 261,33 131,87
11 1 0,87 0,58 326,14 164,57
12 1 0,87 0,58 399,24 201,46
13 1 0,87 0,58 480,87 242,65
Here Fi is the fertility, qi the fecundity, Pi the number of polypos, bi ¼
qi � Fi � sri � Pi the average number of planulae produced by one
colony.
G. Santangelo et al. / Journal of Theoretical Biology 244 (2007) 416–423418
2.2. Population reproductive structure
The structure of red coral populations is complex. Eachcolony is a modular animal composed by several geneti-cally identical modules (polyps). Each female and fertilepolyp can brood and release lecitothrophic larvae (planu-lae) which settle near their parent colonies producing a newindividual (recruit) (Vighi, 1972; Weinberg, 1979). Thus, tocalculate the average number of planulae produced by acolony (b) in a certain size–age class, the followingparameters have been estimated (Santangelo et al., 2004)
�
q is the fecundity (number of larvae produced by eachcolony), � F the fertility (percentage of fertile female colonies), � sr the sex ratio, � P the number of polyps in each colonyso that b is calculated as the product of all parametersabove
b ¼ q� F � sr� P.
All these reproductive parameters are summarizedin a fecundity table of the population under study(Table 2).
2.3. The control function
After their release planulae have a limited time intervalwithin which they must settle or die (Weinberg, 1979). Weestimated the larval survival, that is the ratio between thenumber of recruits found in the sampled area and theestimated number of planulae produced within the samearea (see Section 2.1). We note that the recruitment processresulted density dependent (Santangelo, 2004), accordingto the well-known mechanisms for which populationscannot grow exponentially for a long time, since density,regulating recruitment, maintains them around theircarrying capacity (Levin, 1986; Caley et al., 1996). Inmany cases negative intra-specific interactions (negativedensity dependence) can be effective; in some cases, also apositive density dependence may occur (e.g. Allee effect;Stephens and Sutherland, 1999).Data reported in Fig. 2 show that the reproductive
process of our coral population is really regulated by bothmechanisms. They have been obtained from the analysis ofthe photographic samples and have been fitted by thefollowing bell-shaped parameterized curve,
S0ðuÞ ¼2:94
uþ 520e�0:14u, (1)
where u is the adult density and is measured incolonies=dm2. According to this function, adult densityhas a two-fold effect on population reproductive success(recruits/planulae): a positive effect until a thresholddensity value and a negative effect above this value.

ARTICLE IN PRESS
Fig. 2. Experimental fitting of the larval survival (recruitment to larval-
output ratio) according with the parameterized function (1). The adult
density u is measured in colonies=dm2.
Fig. 3. Model sketch: life cycle graph of the coral population. X i is the
number of colonies in the class i, Si the survival from class i to class i þ 1,
bi the average number of planulae produced by one colony.
G. Santangelo et al. / Journal of Theoretical Biology 244 (2007) 416–423 419
3. The mathematical model
Here we propose a discrete dynamical model to describethe growth of the coral population, with the purpose ofcalibrating the model on the basis of experimental data andrealistic situations. We adopt a discrete age-structuredmodel because red coral has a discrete yearly reproductionin summer. Thus, we may use a discrete time (and age) unitof one year and denote by
X ni ¼ the number of colonies in the age class i at time n,
where i ¼ 1; . . . ;A. Moreover, we denote bybi ¼ the (average) number of planulae produced by each
colony in the age class i at each (yearly) reproduction event,Si ¼ the probability for a colony in the age class i, to
survive and enter the class i þ 1,S0ðuÞ ¼ the larval survival, i.e. the fraction of planulae
that survive and settle when the density of the population is u.Where the density u is the number of colonies per unit of
surface. Note that, since the recruits (class i ¼ 1) are notconsidered as ‘‘colonies’’, the density at time t is given by
un ¼Xi¼A
i¼2
X ni =S, (2)
where S is the surface of the site occupied by thepopulation.
With these definitions, the model follows the schemesketched in Fig. 3, and is formulated by the followingdifference equations:
ðiÞ X nþ11 ¼ S0ðu
nÞXi¼A
i¼1
biXni ,
ðiiÞ X nþ1iþ1 ¼ SiX
ni ; i ¼ 1; . . . ;A, (3)
where un is given by (2).
The search for equilibria of the model leads to thefollowing equations on the set ðX 1; . . . ;X AÞ:
ðiÞ X 1 ¼ S0ðuÞXi¼A
i¼1
biX i,
ðiiÞ X iþ1 ¼ SiX i; i ¼ 1; . . . ;A, (4)
that of course is satisfied by the trivial equilibriumX i ¼ 0; ði ¼ 1; . . . ;AÞ. The search for non-trivial equilibriacan actually be reduced to a single equation on X 1. In fact4(ii) yields
X i ¼ Si�1Si�2 � � �S1X 1 ¼ PiX 1 ði ¼ 2; . . . ;AÞ, (5)
where Pi ¼ Si�1Si�2 � � �S1 is the probability for a singlerecruit to survive to the age-class i. Plugging (5) into 4(i),we get
1 ¼ R0S0ðyX 1Þ, (6)
where
R0 ¼Xi¼A
i¼1
biPi; y ¼Xi¼A
i¼2
Pi=S.
R0 is the average number of planulae produced by a singlecolony during the whole life-span, while U ¼ yX 1 is theaverage density of the population. Thus, for any non-trivialsolution of (6) we get a non-trivial solution throughformula (5). Of course, solutions to (6) exist according withthe shape of the function S0ðxÞ and the values of theparameters involved. Our aim is now to calibratethe previous model on the specific situation arising fromthe data presented in the previous sections.Our starting point is the assumption that the observed
population (spread on a surface area S ¼ 36 dm2 andpartitioned into A ¼ 13 size–age classes) is described by theprevious model and has attained a non-trivial steady stateso that the observed abundances reported in the firstcolumn of Table 1 provide the components X �i of this
ARTICLE IN PRESS
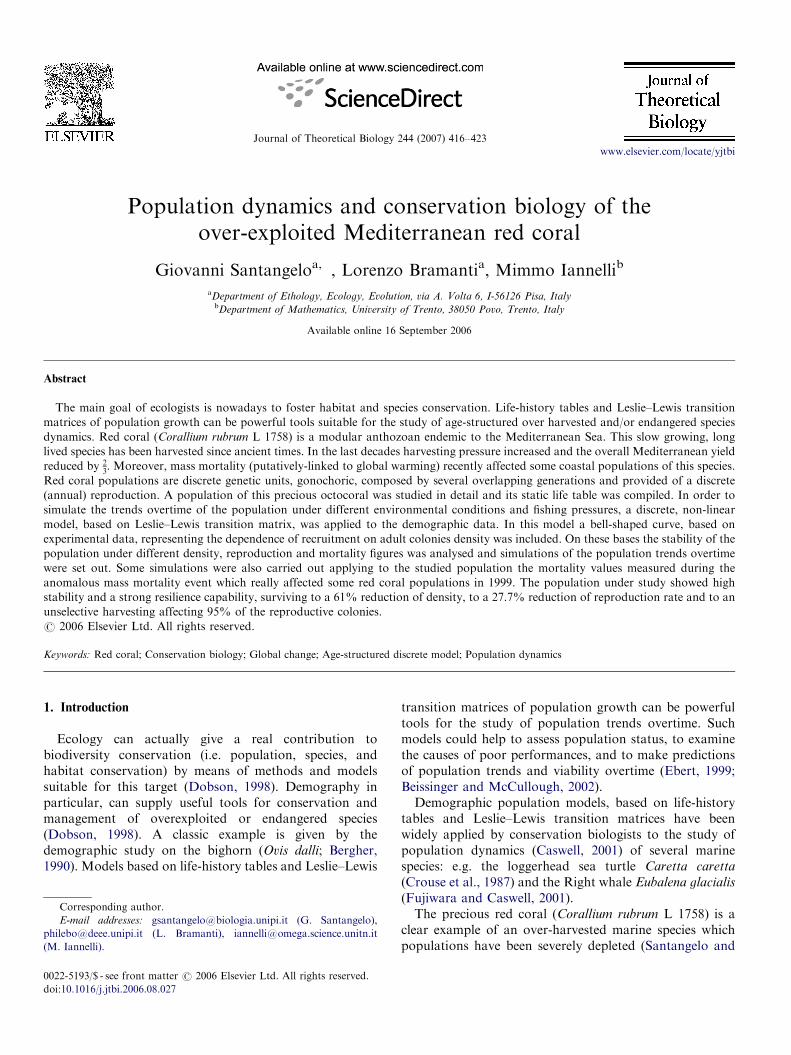
Fig. 4. Solution to Eq. (6), i.e. existence of two steady state with respective
density U� and U��. The solution with density U� corresponds to the
observed population.
Fig. 5. Simulations of the model showing the extinction time for different
values of R0.
Fig. 6. Simulations of the model showing the extinction time for different
values of U.
G. Santangelo et al. / Journal of Theoretical Biology 244 (2007) 416–423420
steady state and consequently allow to calculate theparameters Si by
Si ¼X �iþ1X �i
.
Furthermore, the parameters bi and the control functionS0ðxÞ are directly determined by the measures and,respectively, given by the last column in Table 2 and bythe function (1). We note that with these choices we have
R0 ¼ 18:12; y ¼ 0:061; X �1 ¼ 822.
so that
R0S0ðyX �1Þ ¼ 1:054 1
as expected, since the observed state ðX �1;X�2; . . . ;X
�AÞ has
been assumed to be a steady state. Furthermore, in Fig. 4we note that, indeed, Eq. (6) has a second solutioncorresponding to another steady state, given by X ��1 ¼
328 that we expect to be unstable.
4. Simulations
Six different sets of simulations, representing differentreproduction, density and mortality conditions have beencarried out as explained in the following:
(1) The reproductive coefficient R0 was reduced from itsoriginal value R0 ¼ 18:12, to R0 ¼ 13. With this value1=R0 ¼ 0; 0769 and is close to the maximum value attainedby the function S0ðuÞ over which Eq. (6) has no solutionand the model does not admit any steady state but thetrivial one. In Fig. 5 it is shown that for this value of R0 themodel still has a non-trivial steady state (at a lower density)that attracts the solution. On the other hand, if R0 isfurther reduced to R0 ¼ 12:5 the population falls down in95 years (Fig. 5). Moreover, we have seen that if R0 isreduced to R0 ¼ 12 and 10, the extinction time decreases to60 and 20 years, respectively.
(2) In order to test the extinction time under differentinitial conditions, we have performed a few simula-tions with an initial datum corresponding to an overallcolony density close to the value U�� ¼ 20 of the secondsteady state, but keeping the same proportions throughthe size–age classes. We found that with an initial valueU ¼ 19:5 col=dm2 the population is still attracted bythe stable non-trivial steady state (Fig. 6a), while atU ¼ 19, it falls irremediably down to extinction in 35years (Fig. 6 b).Another set of simulations was performed to test the
effect of selective mortality due to environmental changeslike that which really affected some red coral populationsin recent years (Garrabou et al., 2001).(3) We call ‘‘Calafuria mortality’’ a mortality affecting
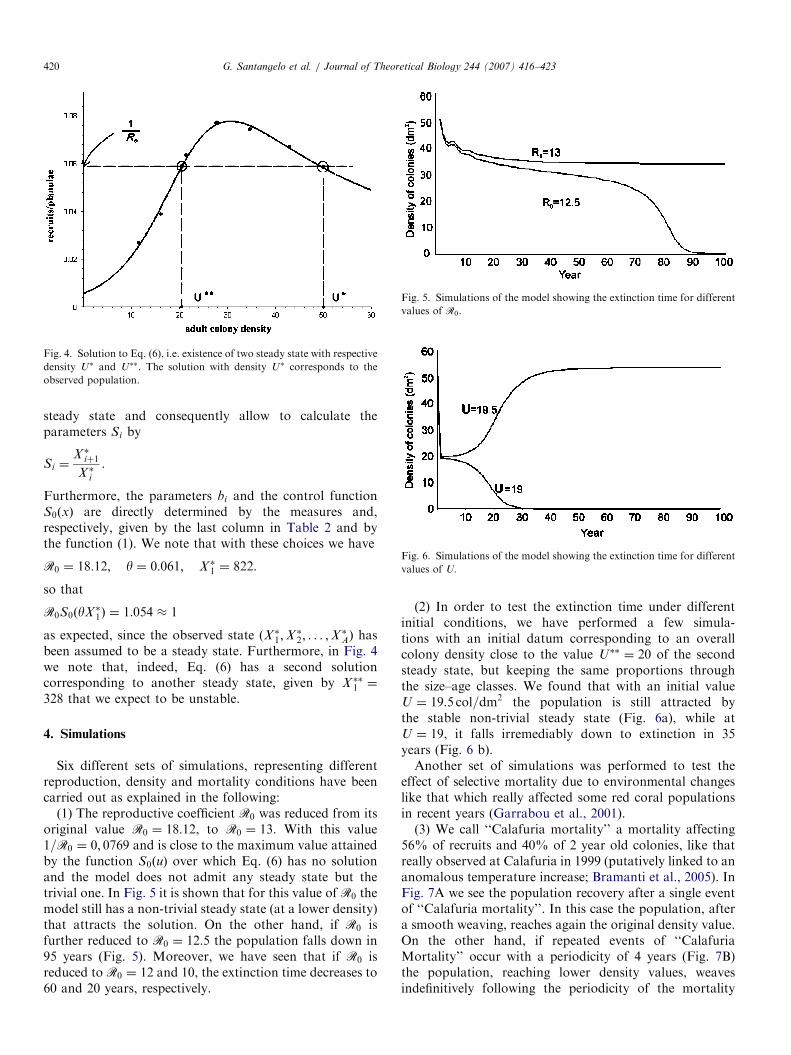
56% of recruits and 40% of 2 year old colonies, like thatreally observed at Calafuria in 1999 (putatively linked to ananomalous temperature increase; Bramanti et al., 2005). InFig. 7A we see the population recovery after a single eventof ‘‘Calafuria mortality’’. In this case the population, aftera smooth weaving, reaches again the original density value.On the other hand, if repeated events of ‘‘CalafuriaMortality’’ occur with a periodicity of 4 years (Fig. 7B)the population, reaching lower density values, weavesindefinitively following the periodicity of the mortality
ARTICLE IN PRESS
Fig. 7. Calafuria mortality: (A) single event; (B) repeated events 4 years
spaced; (C) repeated events 3 years spaced. In the square at right overall
colony densities are reported.
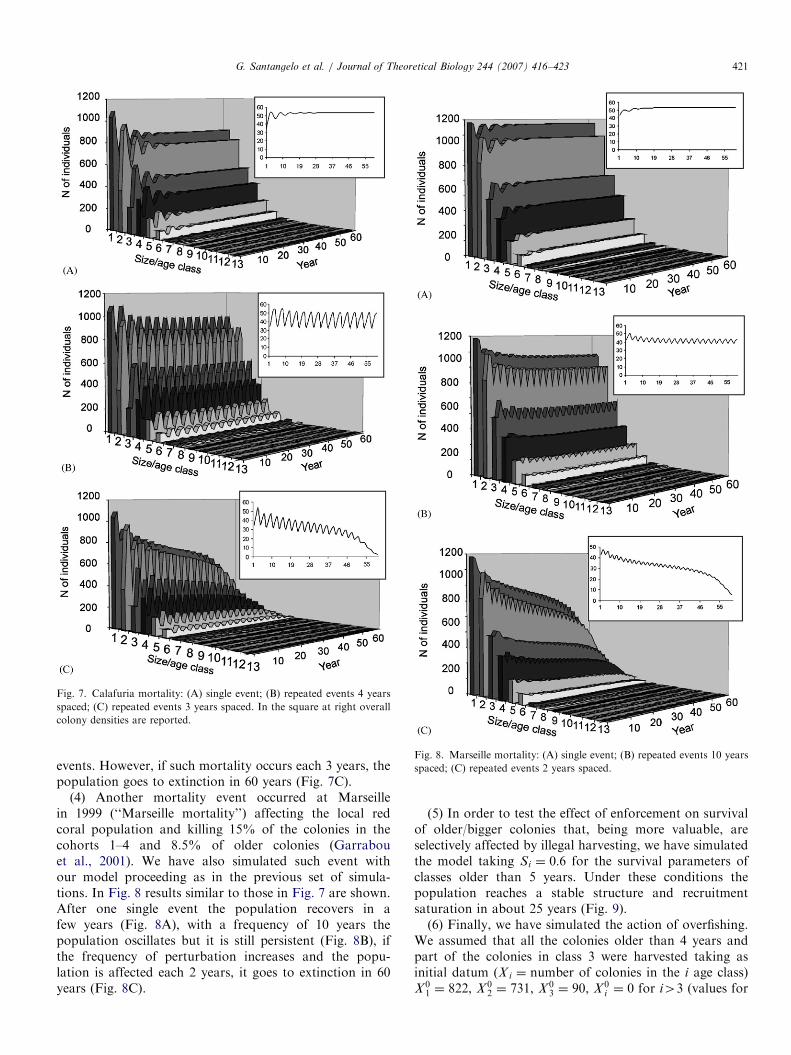
Fig. 8. Marseille mortality: (A) single event; (B) repeated events 10 years
spaced; (C) repeated events 2 years spaced.
G. Santangelo et al. / Journal of Theoretical Biology 244 (2007) 416–423 421
events. However, if such mortality occurs each 3 years, thepopulation goes to extinction in 60 years (Fig. 7C).
(4) Another mortality event occurred at Marseillein 1999 (‘‘Marseille mortality’’) affecting the local redcoral population and killing 15% of the colonies in thecohorts 1–4 and 8.5% of older colonies (Garrabouet al., 2001). We have also simulated such event withour model proceeding as in the previous set of simula-tions. In Fig. 8 results similar to those in Fig. 7 are shown.After one single event the population recovers in afew years (Fig. 8A), with a frequency of 10 years thepopulation oscillates but it is still persistent (Fig. 8B), ifthe frequency of perturbation increases and the popu-lation is affected each 2 years, it goes to extinction in 60years (Fig. 8C).
(5) In order to test the effect of enforcement on survivalof older/bigger colonies that, being more valuable, areselectively affected by illegal harvesting, we have simulatedthe model taking Si ¼ 0:6 for the survival parameters ofclasses older than 5 years. Under these conditions thepopulation reaches a stable structure and recruitmentsaturation in about 25 years (Fig. 9).(6) Finally, we have simulated the action of overfishing.
We assumed that all the colonies older than 4 years andpart of the colonies in class 3 were harvested taking asinitial datum (X i ¼ number of colonies in the i age class)X 0
1 ¼ 822, X 02 ¼ 731, X 0
3 ¼ 90, X 0i ¼ 0 for i43 (values for

ARTICLE IN PRESS
Fig. 9. Increase of survival (by enforcement) for classes 5–13. For these
classes we set Si ¼ 0:6.
Fig. 10. The effect of overfishing selectively affecting all the colonies in
older classes. (A) X 01 ¼ 822, X 0
2 ¼ 731, X 03 ¼ 90, X 0
i ¼ 0 for i43;
(B) X 01 ¼ 822, X 0
2 ¼ 731, X 03 ¼ 80, X 0
i ¼ 0 for i43.
G. Santangelo et al. / Journal of Theoretical Biology 244 (2007) 416–423422
the first two classes are those of the original population inTable 1). The result is that the population survives andrecovers in 60 years (Fig. 10A). If instead the class 3 isfurther harvested taking X 3 ¼ 80, the population goes toextinction in 20 years (Fig. 10B).
5. Conclusions
Demographic approaches, based on Leslie–Lewis transi-tion matrix, are widely applied to over-harvested or/andendangered species with complex life cycles and popula-tions structured into several age classes with discrete
reproduction and semi-overlapped generations (Tupulja-nupur and Caswell, 1997; Caswell, 2001). Nevertheless,only a few such demographic analyses on marine, modular,slow growing, long lived species have been carried out. Wetried to apply this approach to a population of the over-harvested, precious, Mediterranean red coral. The actualfishing and demographic patterns clearly indicate aregression for this species (Santangelo and Abbiati,2001). The availability of reliable demographic data andof an exhaustive life-history table of one red coralpopulation studied since several years, allowed us to setout a discrete, age-structured population model in whichnon-linearities occurs only in the first age class (recruit-ment) survival.Our field data indicated that some density dependence
regulation of recruitment actually occurs in the populationunder study (Santangelo et al., 2004). Such densitydependence, indicated by the relationship between theestimated larval survival and adult colony density, ispositive at low and negative at high adult densities (duepresumably to the reduced availability of free space), suchcontrol of colony density on recruitment is included intothe dynamic model.The mathematical model that we have set up in order to
describe red coral growth falls within a general class ofnon-linear discrete models that has received much attentionin connection with population dynamics (Caswell, 2001).The specific features of our model are drawn from theexperimental situation and the parameters are calibratedby the data. In particular, due to the particular cut-offfunction (1), the model exhibits backward bifurcation andexistence of three steady states.With this model we are able to have a new insight into
the problems of conservation policies for the red coral. Infact we have used the model to make predictions undervarious different occurrences that are suggested by realevents, simulating population trends over time andpopulation responses to variation of density, reproductionand mortality. Some simulations were also carried outapplying the mortality values measured on the samepopulation, during the 1999 anomalous temperatureincrease (Bramanti et al., 2005), or on another red coralpopulation affected by mass mortality at the same time(Garrabou et al., 2001). All this allowed us to analyse thestability of the population demographic parameters (survi-val and reproduction rates) and will allow us to set outsuggestions for suitable management.Red coral coastal populations, like that examined in this
paper, showed a good resilience capability, to density andreproduction reduction and to mortality increase. Thisbehaviour is typical of a species provided of an early sexualmaturity, which is structured into several overlappinggenerations, slow growing and showing high reproductionrates. For such species a sporadic negative reproductiveevent (negative net recruitment rate or a mass mortalityevents) could have a limited effect on survival (Kwit et al.,2004) but, as our simulations showed, a clouded future for

ARTICLE IN PRESSG. Santangelo et al. / Journal of Theoretical Biology 244 (2007) 416–423 423
red coral could be forecasted if such mass mortality eventswill frequently occur.
References
Abbiati, M., Buffoni, G., Caforio, G., Di Cola, G., Santangelo, G., 1992.
Harvesting, predation and competition effects on a red coral
population. Neth. J. Sea Res. 30, 219–228.
Abbiati, M., Santangelo, G., Novelli, S., 1993. Genetic variation within
and between two Tyrrhenian populations of the Mediterranean
alcyonarian Corallium rubrum. Mar. Ecol. Prog. Ser. 95, 245–250.
Beissinger, S.R., McCullough, D.R., 2002. Population Viability Analysis.
The University of Chicago Press, Chicago.
Bergher, J., 1990. Persistence of different-sized populations: an em-
pirical assessment of rapid extinction of bighorn sheep. Cons. Biol. 4,
91–98.
Bramanti, L., Magagnini, G., Santangelo, G., 2003. Settlement and
recruitment: the first stages in the life cycle of two epibenthic
suspension feeders. Ital. J. Zool. 70, 175–178.
Bramanti, L., Magagnini, G., DeMaio, L., Santangelo, G., 2005.
Recruitment, early survival and growth of the Mediterranean Red
Coral Corallium rubrum (L 1758), a four-year study. J. Exp. Mar.
Biol. Ecol. 314, 67–78.
Caley, M.J., Carr, M.H., Hixon, M.A., Huges, T.P., Jones, G.P., Menge,
B.A., 1996. Recruitment and the local dynamics of open marine
populations. Annu. Rev. Ecol. Syst. 27, 477–500.
Caswell, H., 2001. Matrix Population Models, second ed. Sinauer
Associates, Sunderland, MA.
Cerrano, C., Bavestrello, G., Bianchi, C.N., Cattaneo-Vietti, R., Bava, S.,
Morganti, C., Morri, C., Picco, P., Sara, G., Schiapparelli, S., Siccardi,
A., Sponga, F., 2000. A catastrophic mass mortality episode of
gorgonians and other organisms in the ligurian Sea, summer 1999.
Ecol. Lett. 3, 284–293.
Cicogna, F., Bavestrello, C., Cattaneo-Vietti, R., 1999. Red Coral and
other Mediterranean octocorals, biology and protection. Min. Ris.
Agr. Al., For. Roma.
Crouse D.T., Crowder, L.B., Caswell, H., 1987. A stage-based population
model for loggherhead sea turtles and implications for conversation.
Ecology 68, 1412–1423.
Dobson, A.P., 1998. Conservation and Biodiversity. Scientific American
Library, New York.
Ebert, T.A., 1999. Plant and Animal Populations. Methods in Demo-
graphy. Academic Press, San Diego, CA.
Fujiwara, M., Caswell, H., 2001. Demography of endangered North
Atlantic right whale. Nature 414, 537–541.
Garcia-Rodriguez, M., Masso, C., 1986. Estudio Biometrico de pobla-
ciones de coral rojo del litoral de Gerona. Biol. Inst. Esp. Oceanogr. 3,
65–74.
Garrabou, J., Harmelin, J.G., 2002. A 20-year study on life-history traits
of a harvested long-lived temperate coral in NW Mediterranean:
insights into conservation and management needs. J. Anim. Ecol. 71,
966–968.
Garrabou, J., Perez, T., Santoretto, S., Harmelin, J.G., 2001. Mass
mortality event in red coral Corallium rubrum populations in the
Provence region (France, NW Mediterranean). Mar. Ecol. Prog. Ser.
217, 263–272.
Kwit, C., Horvitz, C.C., Platt, W.J., 2004. Conservation of slow-growing,
long-lived tree species: input from the demography of a rare
understory conifer, Taxus floridana. Cons. Biol. 18, 432–443.
Levin, R., 1986. Supply-side ecology. Science 234, 25–27.
Marschall, C., Garrabou, J., Harmelin, J.G., Pichon, M., 2004. A new
method for measuring growth and age of the precious red coral
Corallium rubrum (L). Coral Reef 23, 423–432.
Ricklefs, R.E., Miller, G.L., 1999. Ecology, fourth ed. Freeman, New
York.
Santangelo, G., Abbiati, M., 2001. Red coral: conservation and manage-
ment of an overexploited Mediterranean species. Aquat. Conserv.
Mar. Freshwater Ecosyst. 11, 253–259.
Santangelo, G., Carletti, E., Maggi, E., Bramanti, L., 2003. Reproduction
and population sexual structure of the overexploited Mediterranean
red coral Corallium rubrum. Mar. Ecol. Prog. Ser. 248, 99–108.
Santangelo, G., Maggi, E., Bramanti, L., Bongiorni, L., 2004. Demo-
graphy of the overexploited Mediterranean red coral Corallium
rubrum. Sci. Mar. 68, 199–204.
Stephens, W.J., Sutherland, W.J., 1999. Consequences of the Allee effect
for behaviour ecology and conservation. Trends Ecol. Evol. 14,
401–405.
Tupuljanupur, S., Caswell, H., 1997. Structured-population Models in
Marine, Terrestrial and Freshwater Systems. Chapman & Hall, New
York.
Vighi, M., 1972. Etude sur la reproduction du Corallium rubrum. Vie et
Mileu 203, 21–32.
Weinberg, S., 1979. The light dependent behaviour of planulae-larvae of
Eunicella singularis and Corallium rubrum and its implications for
octocorallian ecology. Bijdr. Dierkd. 49, 16–30.
Zibrowius, H., Montero, M., Grashoff, M., 1984. La ripartition du
Corallium rubrum dans l’Atlantique. Thetis 11, 163–170.