
Population Connectivity and Management of an Emerging Commercial Fishery Crow White ESM 242...
63
Population Connectivity and Management of an Emerging Commercial Fishery Crow White ESM 242 Project May 31, 2007
-
date post
19-Dec-2015 -
Category
Documents
-
view
215 -
download
0
Transcript of Population Connectivity and Management of an Emerging Commercial Fishery Crow White ESM 242...

Population Connectivity and Management of an Emerging
Commercial Fishery
Crow White ESM 242 Project May 31, 2007

Adult (15 cm)
Recruits
Kellet’s whelk
Kelletia kelletii

Focus of developing fishery
Sold to US domestic Asian market (mostly in LA)
Mean price = $1.43/kg = ~$0.15/whelk
Ase
ltin
e-N
eils
on
et
al.
200
6

Caught as by-catch by commercial trap fishermen

Research questions:
What is the optimal harvest path that maximizes net present value of the Kellet’s whelk fishery?
Short-term.
Long-term.
How do they differ?

SBA
NCI
Focus on Santa Barbara area
Two patches:
SBA: Santa Barbara mainland
NCI: Northern Channel Islands
Patches differ with respect to:
Habitat area, stock size & density
Intra- and inter-patch dispersal dynamics
Protection in reserves
Santa Barbara

)(...
)...)()()...(
...)((
,,
)1(/
1
tAttA
TmKAg
ABTt
AATttt
HAmH
eeCB
CAAA
jAjTtA
j
j
EQUATION OF MOTION (patch A):
Adult stock [mt] Growth rate “Connectivity” = probability of dispersal
Harvest [mt] Annual natural mortality rate
Density dependent recruitment K = kelp [km2]
Juvenile mortality
t = time in years
Tj = time until reproductively mature = age of legal size for fishery

CONSTRAINTS:
tt NH 0Harvest in a patch must be equal or greater than zero, as well as equal or less than the current stock in that patch
*, 2.0 BBH tBt
In Northern Channel Islands patch harvest may not reduce stock below 20% of its virgin size

12 reserves constituting ~20% of the NCI coastline

)(...
)...)()()...(
...)((
,,
)1(/
1
tAttA
TmKAg
ABTt
AATttt
HAmH
eeCB
CAAA
jAjTtA
j
j
EQUATION OF MOTION (patch A):
Adult stock [mt] Growth rate “Connectivity” = probability of dispersal
Harvest [mt] Annual natural mortality rate
Density dependent recruitment K = kelp [km2]
Juvenile mortality
t = time in years
Tj = time until reproductively mature = age of legal size for fishery

SBA
NCI
Thanks Mike!


SBA NCI
0.00
0.20
0.40
0.60
0.80D
en
sit
y +
/- S
E [
#/m
^2
]
(N = 4) (N = 4)
Pattern supported by lobster/Kellet’s whelk fisherman (John Wilson, per. comm. 16 May 2007)

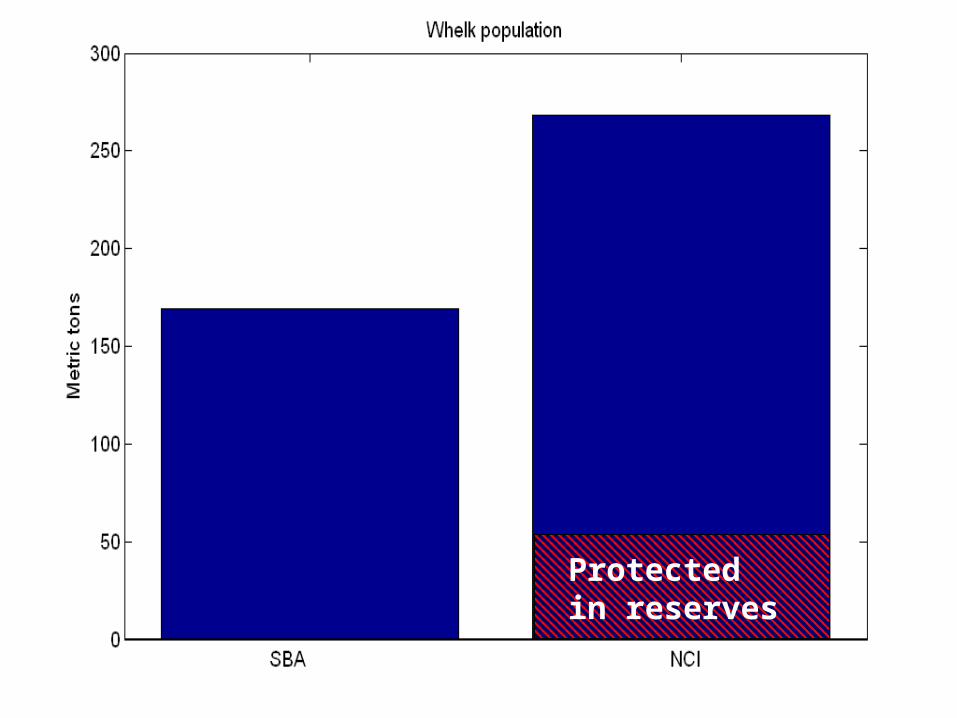
Protected in reserves

)(...
)...)()()...(
...)((
,,
)1(/
1
tAttA
TmKAg
ABTt
AATttt
HAmH
eeCB
CAAA
jAjTtA
j
j
EQUATION OF MOTION (patch A):
Adult stock [mt] Growth rate “Connectivity” = probability of dispersal
Harvest [mt] Annual natural mortality rate
Density dependent recruitment K = kelp [km2]
Juvenile mortality
t = time in years
Tj = time until reproductively mature = age of legal size for fishery

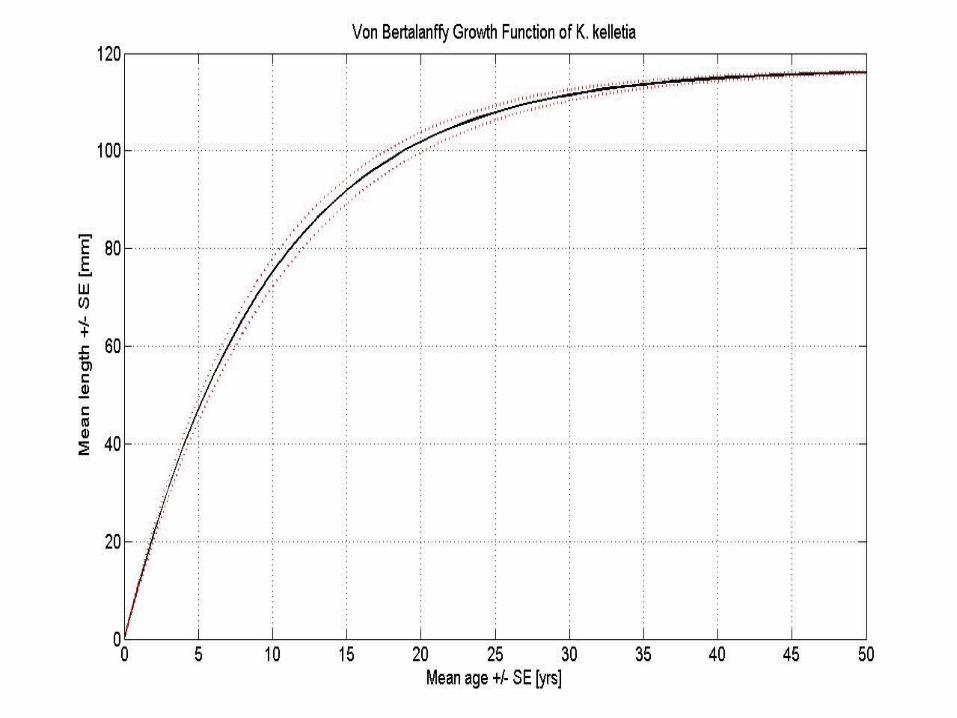
Mean size (n = 1000+)
m = 1/mean age = 0.068
Tj = ~6 years
Annual natural mortality rate:
Time until mature:
Mature:
(Growth data from D. Zacherl 2006 unpub. Res.)

)(...
)...)()()...(
...)((
,,
)1(/
1
tAttA
TmKAg
ABTt
AATttt
HAmH
eeCB
CAAA
jAjTtA
j
j
EQUATION OF MOTION (patch A):
Adult stock [mt] Growth rate “Connectivity” = probability of dispersal
Harvest [mt] Annual natural mortality rate
Density dependent recruitment K = kelp [km2]
Juvenile mortality
t = time in years
Tj = time until reproductively mature = age of legal size for fishery
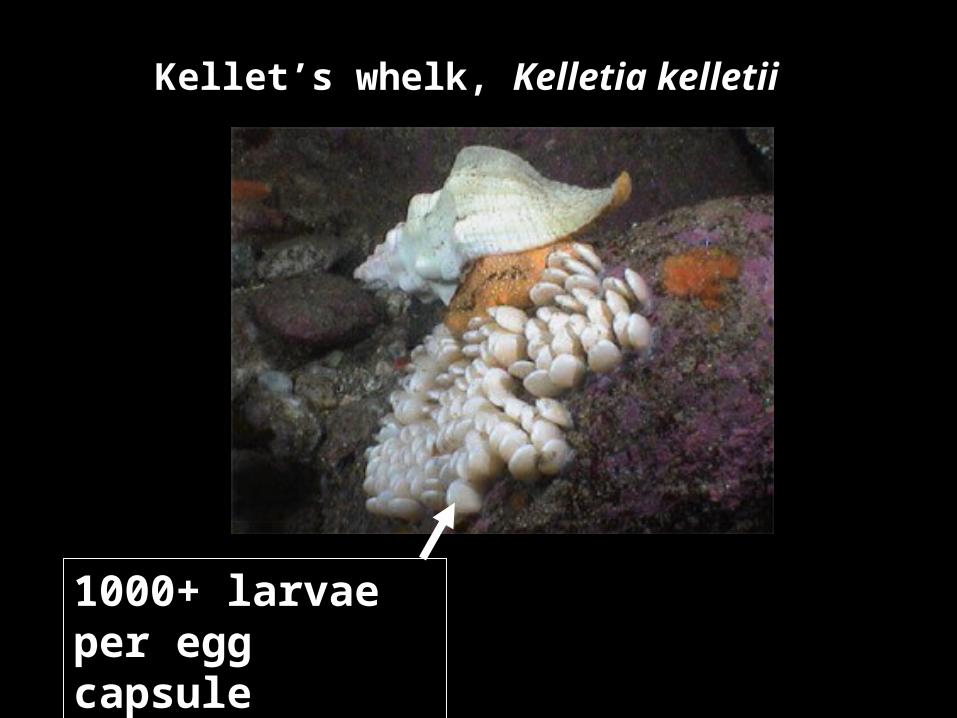
Kellet’s whelk, Kelletia kelletii
1000+ larvae per egg capsule

mLog
K
Ng
1*
Density dependence coefficient
Given each patch is a closed system and Tj = 1:
N* = virgin carrying capacity.

)(...
)...)()()...(
...)((
,,
)1(/
1
tAttA
TmKAg
ABTt
AATttt
HAmH
eeCB
CAAA
jAjTtA
j
j
EQUATION OF MOTION (patch A):
Adult stock [mt] Growth rate “Connectivity” = probability of dispersal
Harvest [mt] Annual natural mortality rate
Density dependent recruitment K = kelp [km2]
Juvenile mortality
t = time in years
Tj = time until reproductively mature = age of legal size for fishery

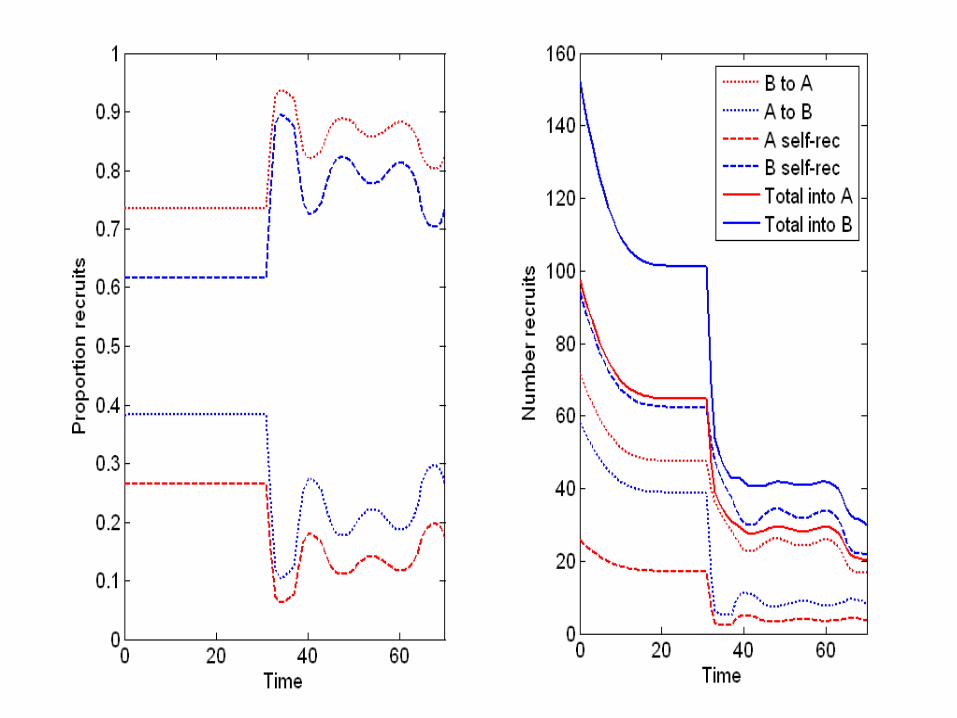
Csource-destination:
CSBA-SBA = 0.15
CSBA-NCI = 0.34
CNCI-NCI = 0.35
CNCI-SBA = 0.27
Gastropod larva K. kelletia settler
(OIPL 2007) (Koch 2006)
SBA
NCI
Thanks James!
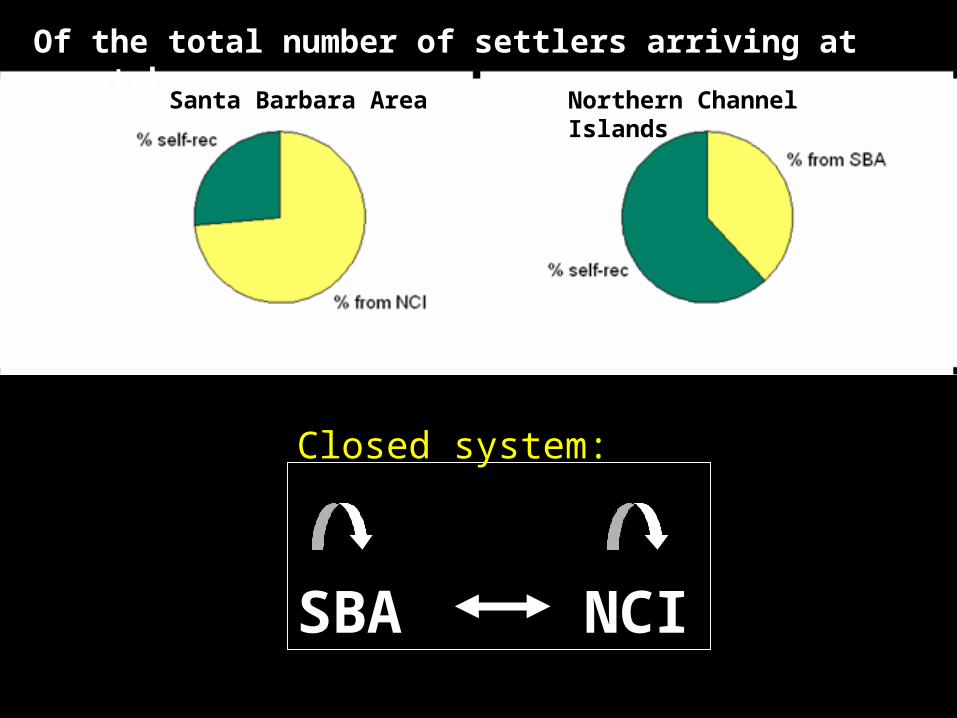
Of the total number of settlers arriving at a patch:
Santa Barbara Area Northern Channel Islands
SBA NCI
Closed system:

Economics:
Revenue based on demand curve:
revenue(t) = choke price – (Harvest[t])(slope)
Cost based on stock effect:
cost(t) = θ / stock density
π(t) = (revenue[t] – cost[t])(1 – r)^-t
r = discount rate = 0.05
∫
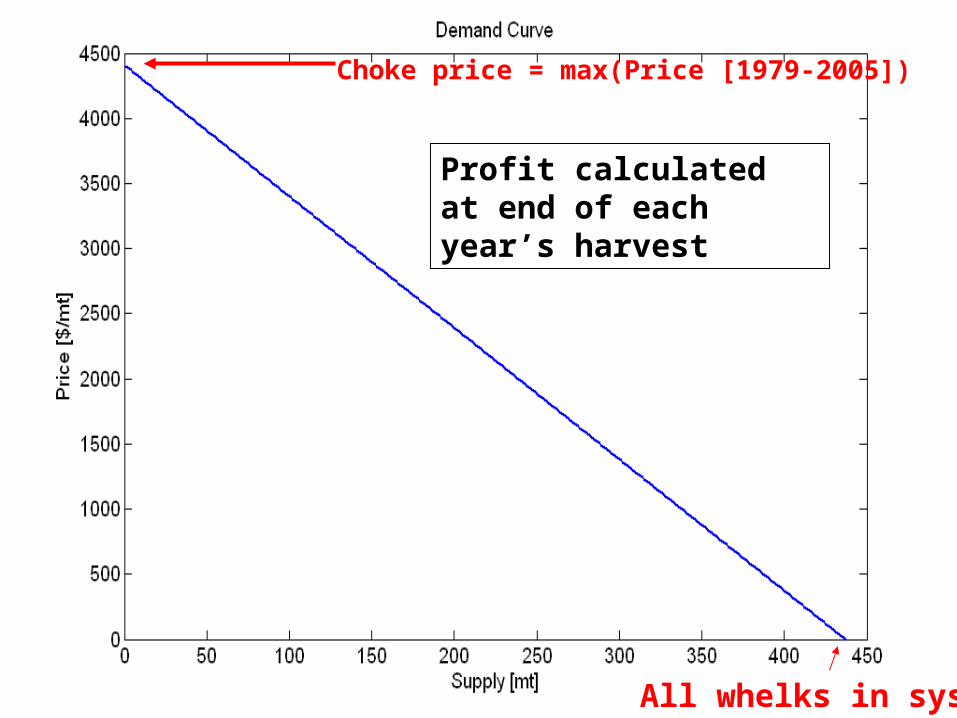
Choke price = max(Price [1979-2005])
All whelks in system
Profit calculated at end of each year’s harvest

mr = mc = θ / density, when
density = 0.1*min(SBA* or NCI*)

mr, given supply = 1 mt
Marginal profit calculated during harvest

Optimization procedure
Short-term: 40 years of harvest
Let un-harvested system equilibrate
Search for optimal harvest path: employ constrained nonlinear optimization function (derivative-based algorithm) in program Matlab.
Goal: find optimal H that maximizes NPV = ∑ π(t)
Long-term: Steady state (t → ∞)
Iterative exploration of all combinations of constant escapement (A – H ≈ 0 – 100%) in each patch.
run until system equilibrates
Goal: identify escapement combination that maximizes π at t = final.

Short-term (40-year) optimal harvest path


Harvest path is variable and different in the two patches

HigherLower

Initial spike in harvest

Harvest limited by NCI reserve constraint
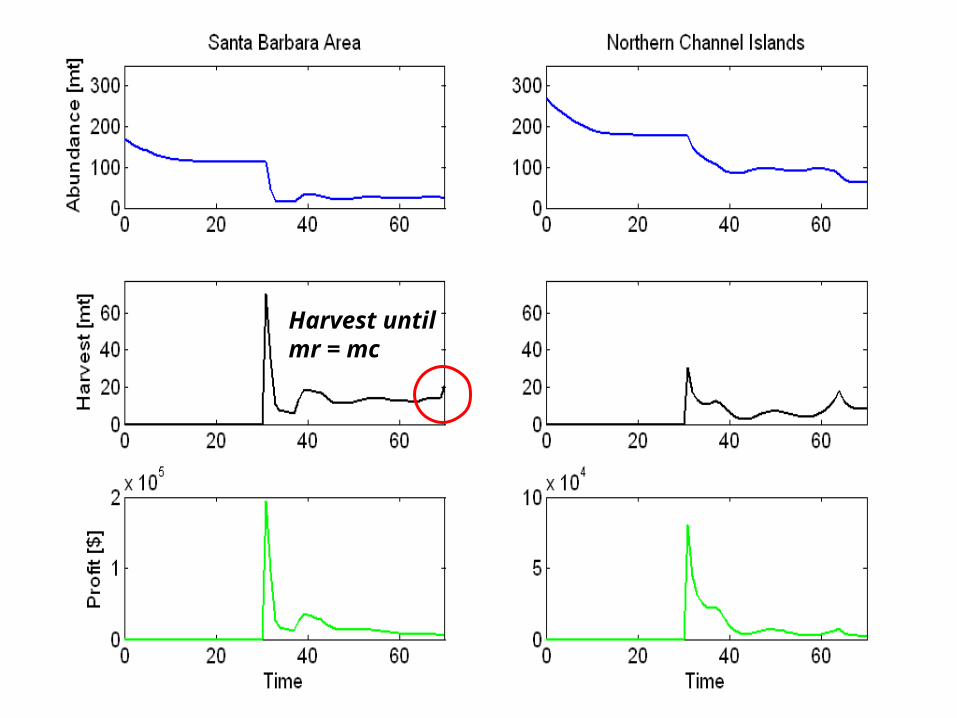
Harvest until mr = mc

Harvest path is semi-cyclic: due to delayed development?

NPV = ∑ π(t) = $1,279,900
~$32,000/year

10,000 simulations:NPV
H*H* - (v/2)(H*) H* + (v/2)(H*)
H(t) = H* + U[-v/2, +v/2](H*)

10,000 simulations:
90% NPVH*H* - (v/2)(H*) H* + (v/2)(H*)
NPV
H(t) = H* + U[-v/2, +v/2](H*)

Long-term optimal harvest

Harvest everything

Harvest everything
$68,067/year

Harvest everything
$68,067/year
40-year horizon and r = 0.05: ~$31,000/year

Harvest everything
$68,067/year
40-year horizon and r = 0.05: ~$31,000/year

Harvest everything
$68,067/year
40-year horizon and r = 0.05: ~$31,000/year
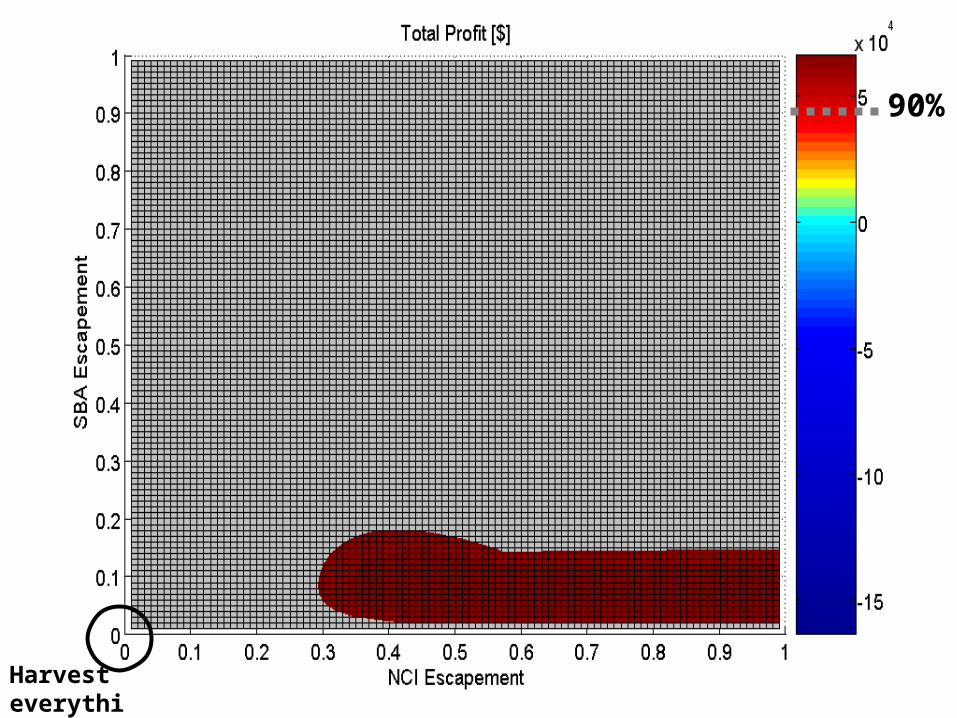
Harvest everything
90%

90%
Harvest everything
Plenty
Room for uncertainty:
Little

90%
NCI reserve constraint
Harvest everything
NCI used as a source, regardless of regulation!

Future research:
1.Improve accuracy in parameter estimates (e.g., λ, population density) and re-run analysis.
1.Relevance of NCI reserve constraint?
2.Incorporate known variability (e.g., connectivity across years) and uncertainty (e.g., in λ and form of density dependence function) into analysis.
3.Apply model to a variety of systems characterized by different levels of connectivity.

Currents
Oceanographic boundaries
(Gaylord & Gaines 2000)
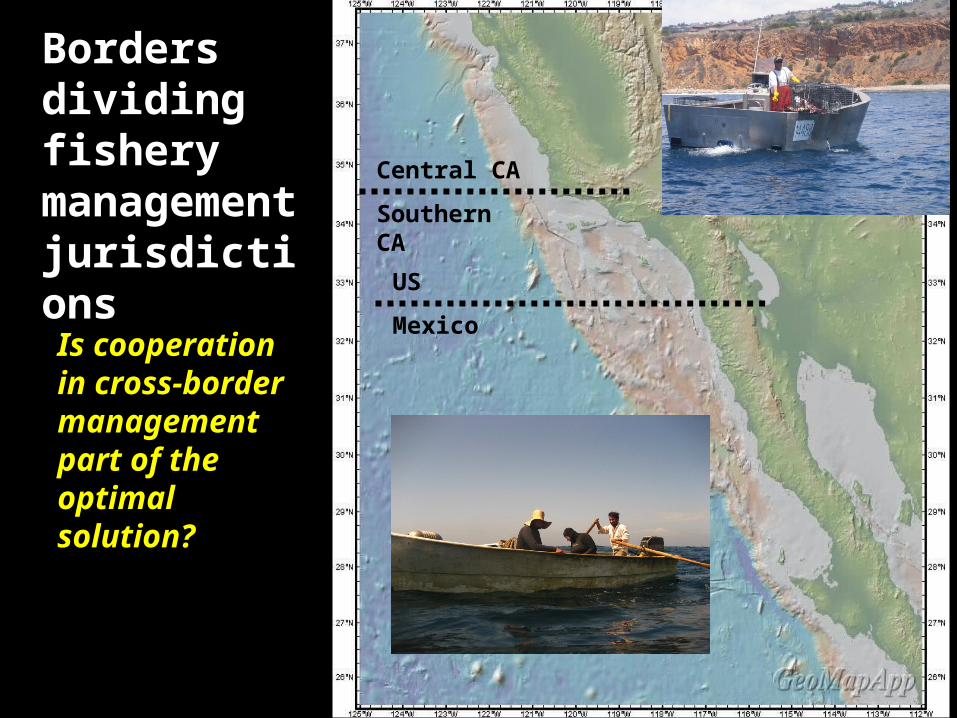
Central CA
Southern CA
US
Mexico
Borders dividing fishery management jurisdictions
Is cooperation in cross-border management part of the optimal solution?

Thank you!

Thank you!

10,000 simulations:
90% net present value
H*H* - U[1-v,1+v](H*)
H* + U[1-v,1+v](H*)

Southern hemisphere cetaceans (Hilborn et al. 2003)
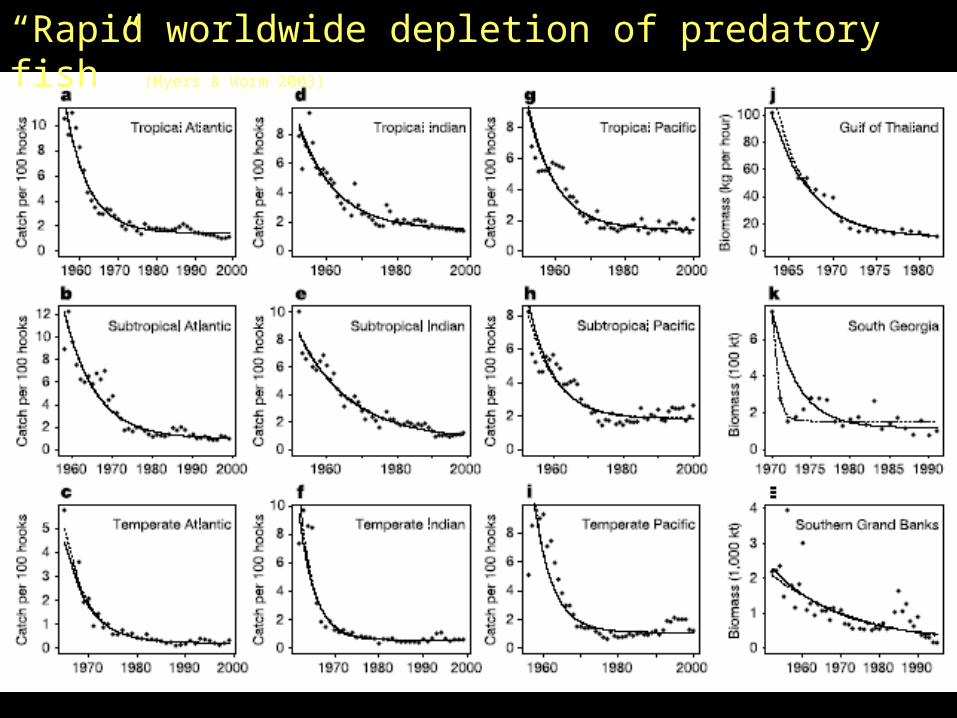
“Rapid worldwide depletion of predatory fish” (Myers &
Worm 2003)

Mean size (n = 1000+)
m = 1/mean age = 0.068
Annual natural mortality rate:

Excellent for lawn art (match gnomes beautifully!)

Thank you!


![ESM [Final]](https://static.fdocuments.in/doc/165x107/5871aebd1a28abda6a8b62d9/esm-final-58be1bd4990bf.jpg)


![Crow Indians. [Crow Indian camp]. Metadata for:](https://static.fdocuments.in/doc/165x107/56649cee5503460f949bc20c/crow-indians-crow-indian-camp-httpmtmemoryorgcdmrefcollectionp267301coll3id2445item.jpg)