Population and Settlement along the Victorian Coast€¦ · Population and Settlement along the...
29
Population and Settlement along the Victorian Coast Background Research Paper to inform the Victorian Coastal Strategy 2013 Prepared for the Victorian Coastal Council by DTPLI Spatial Analysis and Research Branch August 2013
Transcript of Population and Settlement along the Victorian Coast€¦ · Population and Settlement along the...

Population and Settlement along the Victorian CoastBackground Research Paper to inform the Victorian Coastal Strategy 2013
Prepared for the Victorian Coastal Council by DTPLI Spatial Analysis and Research Branch
August 2013

i
Table of contents
List of Figures List of Tables Executive Summary
1. Introduction
2. Population
2.1 Population distribution and settlement patterns 2.2 Population change 2.3 Age structure 2.4 Migration to the coast 2.5 Part‐time coastal populations
3. Settlement
3.1 Coastal building activity 3.2 Housing and population 3.2 Coastal house prices
4. Issues associated with population and settlement
4.1 Population ageing 4.2 Population fluctuations and peak populations 4.3 Population carrying capacity 4.4 Housing affordability 4.5 Coastal settlement boundaries and house prices 4.6 Population and risk
5. Conclusion References

ii
List of Figures
1. Population concentration along the Victorian coast, 2011
2. Average annual population change, Victorian coastal Statistical Local Areas (SLAs), 2001 to 2010
3. Average annual population change, selected Australian coastal areas by SA2, 2001‐06 and 2006‐11
4. Age structure of Victorian coastal regions, aggregated Statistical Areas (SA2s), 2011
5. Sources of in‐migration to selected coastal regions in Victoria, 2006 to 2011
6. Net migration by age, coastal Statistical Local Areas by region, 2006 to 2011
7. Locations in regional Victoria with greatest appeal, RDV survey respondents, 2006
8. Reasons for selecting locations with greatest appeal, RDV survey respondents, 2006
9. Proportion of dwellings that were unoccupied on census night 2011, Statistical Areas (SA2) along Victoria’s Coast, West to East
10. Dwelling vacancy rates, SA1, 2011
11. Proportion of non‐resident ratepayers in coastal Local Government Areas, 2007
12. Peak population estimates for selected coastal towns (overnight capacity in residential buildings and tourist accommodation), 2011
13. Monthly water consumption, Phillip Island and Torquay, 2001 to 2006
14. Torquay visitor centre enquiries, 2000 to 2007
15. Dwelling approvals for houses and units 2004 to 2009, coastal Statistical Local Areas
16. Dwelling approvals, 1997 to 2010, coastal, regional and metropolitan Statistical Local Areas
17. Median house price, coastal towns and suburbs, 2009‐10
18. Median house prices, coastal Statistical Local Areas1991 to 2010
19. Range of sales prices for houses, selected coastal settlements, 2009
20. Range of sales prices for houses, Torquay, 2001 and 2009
21. Proportion of households in privately rented dwellings in 2011
22. Fire risk rating for human settlements along the Victorian coast, 2011
23. Coastal settlements ranking highly on selected vulnerability indicators 2011
List of Tables
1. Largest coastal settlements in Victoria 2011, excluding Melbourne and Geelong
2. Population change, coastal and non‐coastal Victoria, 2001 to 2011
3. Victorian coastal towns with dwelling vacancy rates above 50% on census night, August 2011
4. Types of part‐time and mobile populations
5. Implications of coastal population fluctuations
6. Median house prices in selected coastal towns prior to and after the introduction of a settlement boundary

1
1 INTRODUCTION
This background paper provides information on the demographic and socio‐economic characteristics of the Victorian coast. It aims to provide an up to date evidence base for informing the Victorian Coastal Strategy 2013. Most of the Victorian coast (96%) is public land (VCC 2012), unlike coastal areas in most other Australian States. At the most basic level the coast is where land and ocean meet. For legal purposes the coast may be defined by high or low water mark, for landscape assessment purposes it may be regarded as the area which can be viewed from the beach ‐ in some cases a limited littoral zone bounded by cliffs, in other cases a broad landscape with long views inland (DSE 2006, pp. 1, 3). In the Victorian Coastal Strategy, “Coast” is defined as: “the sea and the seabed to the state limit three nautical miles or 5.5 km; land and inland waters in the coastal catchment” (VCC 2008, p. 73). Researchers have used other definitions, often constrained by the pattern of administrative data units such as Census Collection Districts (CCDs), Statistical Areas (SAs) or Local Government Areas (LGAs). Any one of these geographical units can vary in their inward extent and, for this reason, some care needs to be taken in analysing ‘coastal’ data. This paper presents data at many different levels of geography. In some cases the geography is determined by level at which data are available. Where possible, the most detailed level is provided, however for some variables a broader level of aggregation was chosen for presentation purposes.
This report utilises time series data for population and housing. Most of these data area sourced from ABS census and Office of the Valuer‐General housing data, with time‐series databases that have been developed by the DPCD Spatial Analysis and Research Branch.
2 POPULATION
2.1 Population distribution and settlement patterns
Population density provides a useful measure of concentration. Figure 1 clearly shows the dominance of Melbourne as a population centre. Centres like Geelong, Warrnambool and Ballarat are also evident on the map. Outside of these centres, the coastal regions of Victoria show areas of population concentration closer to Melbourne – Bellarine and Mornington Peninsulas, Surf Coast and Phillip Island. But many areas of the coastline are actually sparsely settled, in part because of public lands (Otways, Wilsons Promontory and Far East Gippsland National Parks as well as numerous foreshore reserve and state parks). Victoria has a number of large cities located on the coast. Melbourne itself is located on Port Phillip Bay, although most of the metropolitan area and its population lie inward from the coast. The population of Melbourne was 3,707,530 in 2011. Geelong also has bay‐side frontage and extends inland, containing a total population of 143,922. Apart from these two cities, Warrnambool, Ocean Grove‐Barwon Heads and Torquay‐Jan Juc are the largest coastal cities in Victoria (Table 1).

2
Figure 1: Population concentration along the Victorian coast, 2011
Source: ABS Estimated Resident Population, customised report
The Bellarine and Surf Coasts are located in close proximity to Geelong which makes them increasingly popular as commuter locations as well as maintaining their traditional role as holiday destinations for Melbourne and Geelong residents. The resident population of towns on the Bellarine Peninsula amounts to around 50,000 people (figure 1). Other concentrations of population are found around Westernport (8,600) Phillip Island (9,000) and further east around the Gippsland Lakes (12,700). Table 1: Largest coastal settlements in Victoria 2011, excluding Melbourne and Geelong
Source: ABS Census 2011 Urban Centre/Rural Locality
2.2 Population change
During the 2000s, some of the fastest regional population growth rates in Victoria were in coastal areas close to Melbourne – the coastal parts of the City of Greater Geelong and the Shires of Surf Coast and Bass Coast (figure 2). More distant coastal areas have generally had lower population growth rates with the exception of the Gippsland Lakes region which remains a popular retirement destination, and areas around Warrnambool which is a major regional centre for the western district.

3
Figure 2: Average annual population change, Victorian coastal Statistical Local Areas (SLAs), 2001 to 2010
Source: ABS Regional Population Growth Australia, cat. no. 3218.0
It is often assumed that coastal areas are growing much faster than non‐coastal areas. In Victoria this is not the case. During the decade to 2011, rates of growth along the coast were similar to, but lower than, non coastal areas and Victoria as a whole with average annual growth rates in the range of 1.3% (coastal) to 1.4% (non‐coastal) (table 2). This is due, in part to the rapid growth seen in Melbourne over that decade, particularly to the north and west, and also to growth of inland centres such as Bendigo and Ballarat and the non‐coastal suburbs of Geelong. Table 2: Population change, coastal and non‐coastal Victoria, 2001 to 2011
Population Average Annual
Population Change(%)
2001 2006 2011 2001‐06 2006‐11 2001‐2011
Coastal Victoria* 733,467 774,717 837,362 1.10 1.57 1.33
Non Coastal Victoria 3,911,483 4,140,626 4,513,846 1.15 1.74 1.44
Total Victoria 4,644,950 4,915,346 5,351,222 1.14 1.71 1.43
Coastal population as % of Victoria’s population 15.79 15.76 15.65
* As measured using ABS Statistical Areas (SA2)
Source: ABS Census 2011 Time Series Profile Table T01
The coastal areas of Victoria differ from those in other States. Much of the coastline is in public ownership and population growth is generally lower than that found in New South Wales, Queensland or Western Australia. Figure 3 shows growth rates along the eastern seaboard and south west coast of Australia. Between 2001 and 2011, Victorian coastal areas showed lower rates of growth than in central NSW and southern coastal areas of Queensland. In the 2006‐11 period, many coastal areas in central Queensland showed lower levels of growth than earlier in the decade. Much of this was due to the mining boom with inland areas of central Queensland growing strongly. Western Australia has also grown as a result of the mining boom and this has affected growth rates across the state, including coastal areas.

4
Figure 3: Average annual population change, selected Australian coastal areas by SA2, 2001‐06 and 2006‐11
Source: ABS Census 2011 Time Series Database
2.3 Age structure
Coastal settlements sit within a broader context of population characteristics. Overall, there is a general difference between the age structure profiles of rural and urban areas. Rural areas in Victoria are characterised by large gaps in the young adult age groups due to net out‐migration of this age group, many of whom move to larger centres for education and employment opportunities. Regional centres such as Warrnambool and Geelong are more likely to retain this age group while Melbourne is a net attractor of young adults (figure 4). On average, metropolitan coastal SLAs have higher proportions of working age (15‐64 years) than regional coastal SLAs, but lower proportions of children and retirement age populations.

5
Figure 4: Age structure of Victorian coastal regions, aggregated Statistical Areas (SA2s), 2011
Source: ABS Census 2011
Some coastal areas display a much older age structure because of their attraction to retirees – Bass Coast and Far East Gippsland show this pattern quite distinctly with the highest proportion of their population being in the 55 to 64 year old category. In Far East Gippsland this represents more than 15 per cent of the population. Within these regions there are towns with much higher proportions of older people. In East Gippsland, Raymond Island, Paynesville and Loch Sport have more than 20 percent of their population aged 70 years and over. Smaller coastal towns and more remote towns will often have higher proportions in young retirement age groups (60‐70 years) but older age groups are more likely to move to centres with more services as they age. Centres like Bairnsdale are particularly important for providing health and aged care services for a broad hinterland including the Gippsland Lakes and East Gippsland region. The remote location of Mallacoota displays this type of age profile. Compared to Bairnsdale, it has higher proportions in the 60 to 69 year age bracket (22.4% compared to 12%). This difference lessens for older age groups and, by age 90, Bairnsdale has a higher proportion.
2.4 Migration to the coast
Migration includes movement at a variety of geographical scales: within a local area or region; to or from Melbourne; interstate, or overseas. Along the Victorian coast, Melbourne is a key source for in‐migration (figure 5). This is particularly the case for areas close to the metropolitan areas such as Surf Coast and Bass Coast. The Bellarine Peninsula also receives a high proportion of people from Geelong. Far east and west coasts attract people from Melbourne but also from their regional hinterlands. Interestingly, there are flows between the far west and far east of the state, suggesting that such areas maintain an attraction for people who prefer the less settled coastal regions. Relative housing prices may also limit flows from the outer regions into areas closer to Melbourne.

6
Figure 5: Sources of in‐migration to selected coastal regions in Victoria, 2006 to 2011
Source: ABS Census 2011
Two types of migration are often associated with coastal areas. The first is retirement migration. Towns along the Bellarine Peninsula, Surf Coast and Mornington Peninsula have long attracted such movement from Melbourne. At a regional scale, the Gippsland Lakes have attracted retirees from eastern regions as well as Melbourne while Port Fairy has provided a retirement destination for those living inland in the western district. The second type of movement is ‘seachange’ migration which generally refers to people who move to high amenity areas along the coast. An equivalent inland movement has been called ‘treechange’. The motivation for this migration is usually presented in terms of seeking a more relaxed lifestyle. However, the term is used widely, often as a catch all phrase for a number of categories of people including:
commuters with city‐based employment;
part‐time commuters who may work in both their coastal location as well as travelling to the city on business;
retirees; and,
those seeking a lifestyle change. Within regional Victoria there are distinct patterns of age‐specific movement. Teenagers show a pattern of movement to the regional centres – mostly for education. Post‐school adults have consistent patterns of net migration loss from regional areas as many move to Melbourne for education and employment. However, regional Victoria gains population from Melbourne in older age groups. Coastal areas tend to follow this general pattern of regional‐urban migration. Coastal regions other than Melbourne and Geelong have a net loss of young people in the 15 to 24 year old age groups. To varying degrees this is counterbalanced by gains in other age groups, either working age groups or retirees. The scale of Melbourne’s coastal gain in young adults is much greater (8 times higher) than that for Geelong (figure 6).

7
Figure 6: Net migration by age, coastal Statistical Local Areas by region, 2006 to 2011
Source: DPCD unpublished data based on ABS Census 2011
In Victoria, the State Government has undertaken surveys of people in order to gauge the interest of metropolitan residents in moving to regional Victoria, and the experience of those who have moved there already. A total of 410 Melbourne residents were interviewed by phone in 2006. In terms of locations with most appeal, there were a mix of both inland and coastal locations, with major regional cities like Ballarat and Bendigo being prominent (figure 7). Coastal locations of greatest appeal included Geelong and Surf Coast, Gippsland, Mornington Peninsula and Warrnambool. The survey highlighted the importance of lifestyle and coastal amenity in many people’s decision to move. Nevertheless many people still wanted the convenience of services and thus proximity to larger centres was rated as important (figure 8).

8
Figure 7: Locations in regional Victoria with greatest appeal, RDV survey respondents, 2006
Source: ASCET and CRIC 2006
Figure 8: Reasons for selecting locations with greatest appeal, RDV survey respondents, 2006
Source: ASCET and CRIC 2006
A follow up online survey was undertaken in 2011 with a sample of 2020 Victorians, 1414 (70%) of these being based in Melbourne (Shopscience 2011). The survey showed that, while living and working in a country town was a preferred option for many, the option of living in a regional area and commuting to Melbourne was also attractive to many. This aligns with the pattern of population growth around Melbourne – both coastal and inland. It also suggests that the improvement of commuting times through improved infrastructure (such as the Geelong bypass or Bass Highway duplication) enables a broader area to be included within a practical commuting range of the metropolitan area. The Community Attitudes and Behaviour Study (Ipsos 2012, p. 34) found that 7 per cent of those living further than five kilometres from the coast (N=594) were considering moving to the Victorian coast within the next 5 years. Given that the study sample was representative of Victoria, this may equate to 300,000 persons at the State level. Nevertheless, consideration of moving may not result in an actual move.

9
2.5 Part‐time coastal populations
A key characteristic of most coastal settlements is the relatively high proportion of houses which are vacant for periods of time during the year (figures 9 and 10). These are usually holiday homes, with non‐residents visiting for various lengths of time. The Community Attitudes and Behaviour Study (Ipsos 2012, p. 34) found that 17 per cent of survey respondents reported having access to a Victorian beach house owned by themselves or family. Qualitative research indicated that many also have access to beach houses owned by friends. Typically these dwellings will be inhabited during summer time and key holiday periods. There may also be considerable changes in levels of habitation between week day and weekends. Because the ABS Census is conducted during winter time on a week night, the data on unoccupied dwellings can be used as a general proxy for holiday homes on the coast1. Figure 9: Proportion of dwellings that were unoccupied on census night 2011, Statistical Areas (SA2) along Victoria’s Coast, West to East
Source: ABS Census 2011, table B31
1 It should be noted that even urban areas will have a level of dwelling vacancy – usually around 8‐10 per cent while areas
which have seen population decline may show higher than average levels of vacant dwellings. On the coast, however, high
vacancy levels are more commonly associated with holiday homes.

10
Figure 10: Dwelling vacancy rates, SA1, 2011
Source: ABS Census 2011 Table B34
A total of 35,800 unoccupied dwellings were counted in Victorian coastal towns and cities (excluding Melbourne and Geelong) by the 2011 census. This represents an average winter vacancy rate of around 37 per cent. This compares to around 10 per cent for non‐coastal towns and cities and 8.6% and 7.8% for Melbourne and Geelong respectively. Towns with the highest levels of housing vacancy are shown in table 3. Table 3: Victorian coastal towns with dwelling vacancy rates above 50% on census night, August 2011
Source: ABS Census 2011, Urban Centre / Rural Locality
The number of vacant dwellings along the coast reflects the importance of beach houses or second homes in the total dwelling stock. This housing stock will have different levels of residency depending on the season or time of the week, hence coastal population numbers can vary greatly. Part‐time populations may comprise different groups of people (table 4). For example, those who own holiday homes, those who visit and stay in commercial accommodation and those who are day visitors.

11
Table 4: Types of part‐time and mobile populations
In the Coastal Attitudes and Behaviour Study (Ipsos 2012), 84 percent of those surveyed (N=971) reported having made at least one day trip to the coast in the previous year with the average number of day trips being 23.4. Over half the respondents (57%) had made an overnight trip to the Victorian coast in the same period. The average number of overnight trips was 5.6. Of those who had visited the coast, around a quarter had visited the regional encompassing Geelong, Bellarine Peninsula and Surf Coast while around 20 percent had visited the Mornington Peninsula. Visitation was higher among those living close to the coast (within 5 kilometres) with 26 percent visiting daily and 86 percent at least once a month (Ipsos 2012, p. 17).
One way of measuring part‐time populations is through local government rates data where the primary address of the ratepayer may be outside of the municipality – in other words these are people who own land in the municipality (and hence pay rates) but who live elsewhere. In a survey of local governments undertaken in 2007, DPCD found that non‐resident ratepayers (who owned residential property in the shire) could account for half of all ratepayers in some municipalities. Areas with the highest proportions tended to be in proximity to Melbourne and in Gippsland coastal areas (figure 11). Figure 11: Proportion of non‐resident ratepayers in coastal Local Government Areas, 2007
Source: DPCD 2007 primary data collected from local government officers

12
Research on non‐resident ratepayers indicated that around a third plan to move to such locations in coming decades (DPCD 2006 and 2008). This may represent a significant number of people for areas which currently contain high proportions of non‐resident populations.
Peak population estimates take into account potential population should unoccupied dwellings and tourist accommodation be utilised. A count of unoccupied dwellings is provided by the ABS Census and this number has been multiplied by the average household size for regional Victoria in 2011 (2.4 persons). Tourist accommodation data has been obtained from AAA Tourism and the number of persons in tourist accommodation determined on the basis of either 2 persons per bedroom, or a person capacity where this was stated (figure 12).
Figure 12: Peak population estimates for selected coastal towns (overnight capacity in residential buildings and tourist accommodation), 2011
Sources: ABS Census 2011; AAA Tourist accommodation data 2012
In a study examining the population dynamics of Phillip Island and Torquay (SGS 2007), it was found that both locations have a strong summer‐time population peak owing to the number of holiday homes and attractiveness for day‐trippers. In order to estimate the scale of population fluctuations a number of proxy indicators were examined and their suitability for informing population estimations determined. Indicators included: rubbish collection; tourist centre enquiries; water consumption; traffic counts; tourist visitor survey data, survey of tourist accommodation; ABS census (unoccupied dwellings), and non‐resident home owners. Of these indicators, water consumption and visitor centre enquiries provided some of the best indications of the pattern of annual peaks and troughs (figures 13 and 14).
Figure 13: Monthly water consumption, Phillip Island and Torquay, 2001 to 2006
Source: SGS 2007 using data from Westernport Water and Barwon Water

13
Figure 14: Torquay visitor centre enquiries, 2000 to 2007
Source: SGS 2007
3 COASTAL SETTLEMENT
3.1 Coastal building activity
Dwelling approvals data indicate that the greatest construction activity along the coast in recent years has been in areas close to Melbourne and near regional cities such as Geelong, Warrnambool and Bairnsdale (figure 15). Approvals for units are much lower than for houses. Metropolitan coastal areas show activity, as do popular holiday and retirement destinations such as Phillip Island, Surf Coast and Bass Coast. Although not all dwelling approvals progress to completion stage, the drop off rate is generally below 10 per cent. Also, there is often a time lag between approvals and completions, so the data presented below may not necessarily reflect the number of houses built during the period. Figure 15: Dwelling approvals for houses and units 2004 to 2009, coastal Statistical Local Areas
Source: ABS Building Approvals, customised data request
14
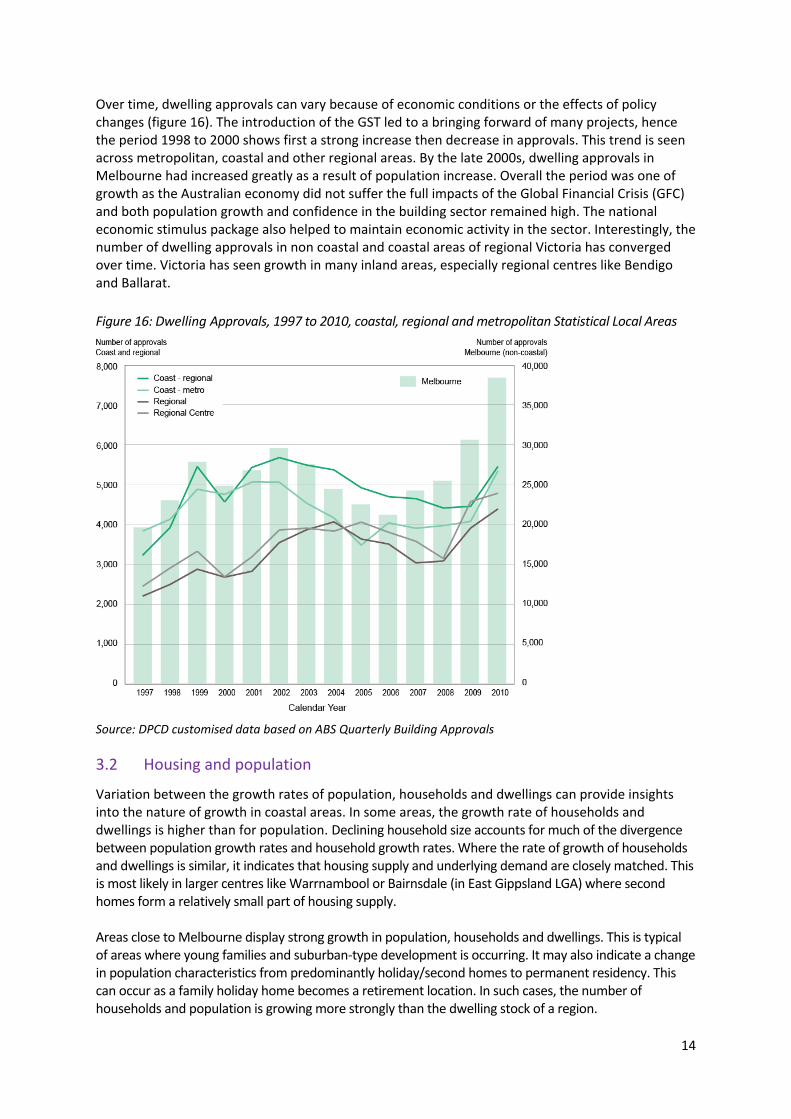
Over time, dwelling approvals can vary because of economic conditions or the effects of policy changes (figure 16). The introduction of the GST led to a bringing forward of many projects, hence the period 1998 to 2000 shows first a strong increase then decrease in approvals. This trend is seen across metropolitan, coastal and other regional areas. By the late 2000s, dwelling approvals in Melbourne had increased greatly as a result of population increase. Overall the period was one of growth as the Australian economy did not suffer the full impacts of the Global Financial Crisis (GFC) and both population growth and confidence in the building sector remained high. The national economic stimulus package also helped to maintain economic activity in the sector. Interestingly, the number of dwelling approvals in non coastal and coastal areas of regional Victoria has converged over time. Victoria has seen growth in many inland areas, especially regional centres like Bendigo and Ballarat.
Figure 16: Dwelling Approvals, 1997 to 2010, coastal, regional and metropolitan Statistical Local Areas
Source: DPCD customised data based on ABS Quarterly Building Approvals
3.2 Housing and population
Variation between the growth rates of population, households and dwellings can provide insights into the nature of growth in coastal areas. In some areas, the growth rate of households and dwellings is higher than for population. Declining household size accounts for much of the divergence between population growth rates and household growth rates. Where the rate of growth of households and dwellings is similar, it indicates that housing supply and underlying demand are closely matched. This is most likely in larger centres like Warrnambool or Bairnsdale (in East Gippsland LGA) where second homes form a relatively small part of housing supply. Areas close to Melbourne display strong growth in population, households and dwellings. This is typical of areas where young families and suburban‐type development is occurring. It may also indicate a change in population characteristics from predominantly holiday/second homes to permanent residency. This can occur as a family holiday home becomes a retirement location. In such cases, the number of households and population is growing more strongly than the dwelling stock of a region.

15
Areas where the growth rate for dwellings is higher than for households or population usually display a growth in second homes.
3.3 Coastal house prices
While coastal areas are often assumed to have higher house prices, there is actually a great deal of variety depending on: proximity to urban centres; accessibility and services; landscape qualities, and even historical factors. Brighton, Queenscliff and Portsea for example have been the favoured location for wealthy Melbournians for over a century (figure 17). Low lying wetland areas around Westernport Bay are relatively close to Melbourne, yet they do not have the amenity value of locations with ocean frontage such as Inverloch. There is also variation in infrastructure provision and a coastal location such as Venus Bay, while popular for holiday makers, does not have the highest housing prices. The lack of infrastructure and services, as well as lower housing quality may account for this. Figure 17: Median house price, coastal towns and suburbs, 2009‐10
Source: Office of the Valuer General, Victoria
Coastal areas which are more isolated such as Loch Sport are also cheaper than areas closer to Melbourne. In the 2009‐10 financial year, the highest median house prices along the Victorian ocean‐facing coast were in Portsea ($1.2 million) and Fairhaven ($905,000), while the lowest were in Loch Sport ($140,000) and Golden Beach ($172,000) (Office of the Valuer General, Victoria). Bayside suburbs of Melbourne have maintained levels of price growth above the metropolitan average. By contrast, coastal regions in the far east and far west display house prices and levels of house price growth at or below the regional average. Surf Coast and Queenscliff display some of the highest regional house prices and price growth over the past decade (figure 18).

16
Figure 18: Median house prices, coastal Statistical Local Areas, 1991 to 2010
Source: Office of the Valuer General, Victoria

17
Housing markets in coastal locations can attract a wide range of competing buyers such as locals, second home buyers, investors, and retirees. This creates a more competitive housing market than would be expected in most regional locations. Apart from creating a high demand for properties, the market can be distorted by the sources of wealth which flow into the local market. Incomes generated in Melbourne may be much higher than local incomes and thus pressure can be placed on prices as a range of people compete for property. Research by Kelly and Haslam‐McKenzie (2005, p. 232) also notes that part‐time residents are not just interested in such housing for investment reasons – rather they have an interest in the amenity and environment of the region in which they have chosen to have a second home. One implication is that, once such people buy into an area, they may become very protective of it and work towards limiting further expansion. Limitations on development may then affect housing supply and subsequently contribute to increases in housing prices as demand exceeds supply. Victoria, unlike its interstate counterparts has large areas of its coastline protected by national or state parks. Given the premium paid for property with ocean views, this can effectively limit the area in which such development can take place, thus leading to inflationary pressure, especially where there are multiple competitors for the land and housing. This can lead to problems of affordability for lower‐income households and first time buyers (Paris 2006, p. 6).
4 ISSUES ASSOCIATED WITH POPULATION AND SETTLEMENT
4.1 Population ageing
For many coastal communities, the issue of an ageing population is particularly significant as such areas often attract a large number of retiree migrants. This, along with the out‐migration of young adults from many regional locations, can result in coastal communities with very high proportions in older age groups. Over the past two decades, the proportion of population living in coastal towns and aged 75 years or more has increased greatly. Seven per cent of the Victorian population is aged 75 years or more. Of the 56 settlements along the coast (excluding Melbourne), 41 have above average proportions aged 75 years or more. Twenty‐one towns along the coast have more than 10 per cent of their population in this age category. An ageing population creates specific service demands, particularly around health care and transport. While the vast majority of retirees will have many active years, older age can increase the likelihood of health or mobility constraints. In locational terms, most services are found in larger centres like Geelong or Bairnsdale. Popular retirement locations near these centres (for example, Portarlington or Paynesville) have the advantage of access to natural amenity as well as the convenience of urban services nearby. However, other locations may provide natural beauty with much more limited services due to their small populations and remote locations. While locations such as Loch Sport or Mallacoota may be attractive for active retirees, reduced mobility and higher service needs associated with frail old age may necessitate a move to a larger centre. For some, this may involve financial challenges or the breaking of social bonds and networks. Another aspect of ageing is that retired people are likely to have lower incomes than those still in the workforce. Contrary to the notion that coastal areas are the preserve of the wealthy, they may actually comprise a large proportion of residents who are asset‐rich but income poor.
18
4.2 Population fluctuations and peak populations
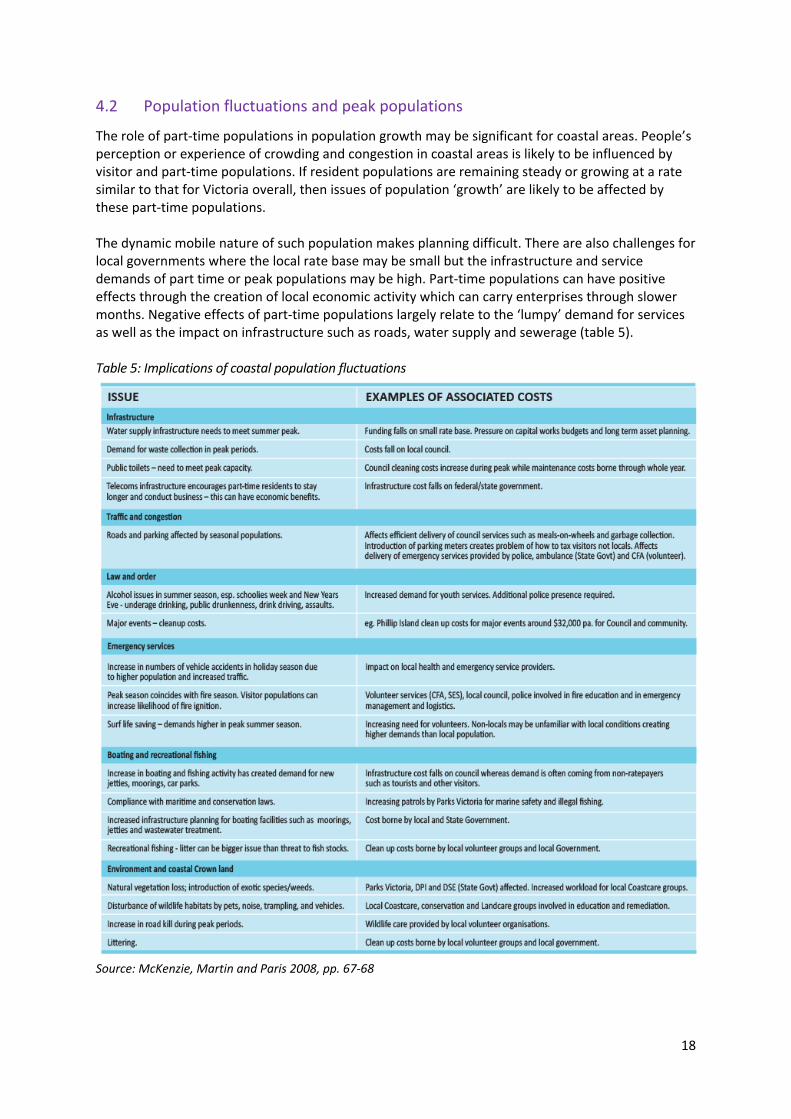
The role of part‐time populations in population growth may be significant for coastal areas. People’s perception or experience of crowding and congestion in coastal areas is likely to be influenced by visitor and part‐time populations. If resident populations are remaining steady or growing at a rate similar to that for Victoria overall, then issues of population ‘growth’ are likely to be affected by these part‐time populations. The dynamic mobile nature of such population makes planning difficult. There are also challenges for local governments where the local rate base may be small but the infrastructure and service demands of part time or peak populations may be high. Part‐time populations can have positive effects through the creation of local economic activity which can carry enterprises through slower months. Negative effects of part‐time populations largely relate to the ‘lumpy’ demand for services as well as the impact on infrastructure such as roads, water supply and sewerage (table 5). Table 5: Implications of coastal population fluctuations
Source: McKenzie, Martin and Paris 2008, pp. 67‐68

19
4.3 Population carrying capacity
While land use planning has been used to direct and influence settlement planning, it is less suited to addressing issues of mobile or visiting populations. In fact dealing with crowding and congestion may better be understood as a people management task rather than a land use planning issue. There are precedents for dealing with visitor populations in response to concerns about overcrowding and avoidance of negative impacts on delicate environmental or cultural assets. Controlling access, limiting numbers and applying fees are potential tools, however the more difficult question is how impacts can be assessed and measured in order to refine prevention measures. In this regard, the concept of ‘carrying capacity’ is often used with the aim of understanding the limits which a particular area may have in relation to visitor numbers. Tourism carrying capacity has been defined as “the level of human activity an area can accommodate without the area deteriorating, the resident community being adversely affected or the quality of visitor experience declining” (Chamberlain 1997). While this definition reflects a widely held aspiration, it is a concept which is difficult to define in practice, largely because coasts are highly dynamic. Visitors can have very different impacts depending on their concentration or individual behaviours. Areas can also have variable ‘limits’ depending on a range of environmental factors (weather, seasons, extreme events). In other words, people have unequal impacts on environments depending on their behaviour, age, and density. Environments themselves are dynamic and may be more or less vulnerable at different times. For these reasons the determination of a single ‘population capacity’ is impossible. The concept of carrying capacity, in terms of a definable number of people, is not only problematic for visitor levels but also for resident populations. Questions like ‘how many is too many residents?’ or ‘what is the optimal size of a settlement?’ fail to recognise to recognise that different populations living in different types of dwellings can have small or large impacts on an area. A good example of this is in relation to infrastructure provision such as sewerage services. Until recently, many of Victoria’s very small coastal settlements relied on septic systems rather than reticulated sewerage. As such populations grow, the environmental impact of organic pollution is likely to become a major problem. Introduction of reticulated systems and treatment plants will vastly change the level of pollution impact. Thus a higher population could be supported with a lower level of pollution. Another aspect of this carrying capacity discussion can be seen through the example of large coastal gatherings. Having 60,000 people in a coastal location over a weekend may be expected to have some negative environmental impact, yet socially, culturally and economically, the benefits of events like surf swims, bike races and folk festivals are extremely high. This is the community context against which the concept of ‘carrying capacity’ becomes difficult to apply in practice. Because of these conceptual limitations, alternative approaches have been developed. There are examples from around the world where particular features – environmental or cultural – have required protection from being ‘loved to death’. This site‐specific approach to the issue of population capacity provides some clearer management pathways. A number of frameworks have been developed for impact management such as Limits of Acceptable Change (LAC) and Visitor Impact Management (VIM) (for a review of these and other approaches see The Market Research Group 1997). Rather than focussing on simply numbers, such approaches rely on identification of concerns and issues; development of resource management objectives; management options; implementation actions and monitoring of conditions. The process of identifying issues and monitoring responses provides an important dynamic process of evaluation and adjustment rather than simply aiming for a particular number of visitors to a sensitive location. Many of these approaches developed into sustainable tourism and ecotourism practices.

20
4.4 Housing affordability
Information on house prices presented earlier in this report indicated that there is some variation across different coastal areas. Different coastal settlements will have different median house prIces, but also a different range of house prices. Figure 19 shows these range patterns for four coastal towns. Figure 20 also shows change over time for Torquay. While median prices can be seen to have risen in all cases, there are differences in the housing market profile. Torquay, for example, has seen a doubling in median house price, yet it has also seen a strong increase in house sales as new housing has been built and come onto the market. While the price profile of sales has risen overall, the largest rises have been in the middle and upper end of the market rather than at the cheaper end. Figure 19: Range of sales prices for houses, selected coastal settlements, 2009
Source: Office of the Valuer General, Victoria, unpublished data
Figure 20: Range of sales prices for houses, Torquay, 2001 and 2009
Source: Office of the Valuer General, Victoria, unpublished data
Concerns are often raised that poorer households are being squeezed out of the market by rising prices and in many cases being displaced from areas like the high value coastal areas. Displacement is more likely to occur in the second generation as cheaper housing for first home buyers becomes scarce. If coastal locations have nearby inland towns, then there may be opportunities for the children of those living in

21
coastal areas where prices have risen strongly to live in more affordable hinterland areas – Colac, for example, has reportedly become a location for those working in Lorne. Data from the 2011 Census indicate that, of those working in the Lorne‐Anglesea region, 67 (4%) had travelled from Colac and 117 (6%) from Winchelsea. The majority of workers in Lorne Anglesea (64%) came from within the region itself. It may be difficult to disentangle the causal effects leading to out migration of residents. Such migration may have happened irrespective of second home owners buying available housing stock. Thus it is not necessarily a ‘forced decision’, especially with young adults who are likely to move out of regional areas for work or education opportunities. Furthermore, the willingness of newcomers to pay higher prices may provide a convenient opportunity for some locals to capitalise their asset and move to another location – perhaps a larger house or one in a regional centre offering greater access to services. The growth in local service economies brought by tourists and second homeowners may be seasonal, casual and may offer little long term career development for existing residents. Many young adults in these areas would be choosing to leave their regional location to move to larger cities in any case, so the argument of ‘displacement’ needs to be considered carefully against this backdrop. Areas with high visitor populations, particularly those which experience peak visitation at specific times of the year, face short‐term competition for housing. The economic outcome of this competition is usually high rental premiums rather than high house prices. During the peak tourist season, all forms of accommodation, from small apartments to resorts and beach houses are highly sought after with those having annual holidays willing to pay high weekly rents. Rental markets of this type can have significant impacts on residents seeking permanent accommodation. If demand is high enough then peak time rental premiums can equal or exceed annual rental which could be gained through longer term leasing. The Residential Tenancies Act 1997 does not apply to “premises … ordinarily used for holiday purposes” (Section 10), hence short term renting agreements need not involve formal lease arrangements. In addition, part‐time rental arrangements can benefit owners by reducing maintenance over the year and/or by allowing owners to access their beach housing for their own use at various other times of the year. Therefore, some coastal communities can have high levels of housing vacancy concurrent with demands for affordable housing. The pattern of rental properties recorded by the Census may be indicative of long term leasing arrangements (as winter time holiday rentals are likely to be low). In all but one coastal LGA, Warrnambool, levels of private rental are below the Victorian average (figure 21).
Figure 21: Proportion of households in privately rented dwellings in 2011
Source: DPCD Spatial Analysis and Research Branch based on ABS Census 2011

22
Concerns around affordability need to be understood in the context of local and regional housing markets. Growth in coastal house prices has generally followed patterns of price increase for Victoria overall. At one level, coastal prices are affected by general cycles of the property market. At a more local level, they may be affected by supply and demand factors and variation in attractiveness of different areas (either physical attractiveness or features such as access to regional centres or Melbourne). Tracking house prices over 30 years shows there are locations with relatively cheap or relatively expensive in any given year. Brighton, Portsea, Lorne and Queenscliff have remained expensive; Westernport towns and Ninety Mile Beach have remained relatively inexpensive over the last three decades. Nevertheless, there are peculiarities with coastal housing markets, for example the pattern of peak season rental pricing, which can contribute to a lack of long term rental availability in more popular coastal locations.
4.5 Coastal settlement boundaries and house prices
The assumption that the introduction of town boundaries in coastal areas has inflated house prices is not evident in the data. This can be explained in a number of ways:
Setting a boundary does not usually create a drop in existing supply (because it is normally set at the limits of, or beyond, the existing township). The magnitude of that supply over time may affect house prices but only where demand remains high and if there are few alternatives. The introduction of coastal town boundaries has occurred in a wider planning context with other locations being identified as locations of preferred growth. For example inland of Torquay or Inverloch rather than along the coastline. Hence, future supply (and expressed demand) is being channelled to preferred area, thus lessening the risk of inflationary pressures.
The relative importance of different factors in house prices is significant. Trends in broader property market cycles and investment patterns are likely to have a much greater influence on prices, for example, the downward trend in prices after 2011 was seen in coastal housing markets as it was in state and national markets.
Local characteristics of supply, demand and housing type or quality will have an impact on prices. Table 6 reveals the variety of patterns in the direction of house prices following the introduction of settlement boundaries. Where there is an upward trend in prices following the introduction of a settlement boundary, local market conditions would need to be investigated before any causal linkage could be determined.

23
Table 6: Median house prices in selected coastal towns prior to and after the introduction of a settlement boundary
Town Settlement boundary
introduced Average annual change in median house price
Price Direction
2 years prior 2 years after
Port Fairy 2000 4.36 22.40 Rise
Victoria 98‐00/00‐02 10.10 12.64 Rise
Warrnambool 2006 6.09 3.80 Fall
Anglesea 2006 3.41 7.51 Rise
Victoria 04‐06/06‐08 4.61 8.28 Rise
Inverloch 2008 6.67 9.41 Rise
Lorne 2008 5.56 ‐1.00 Fall
Victoria 06‐08/08‐10 8.28 8.47 Rise
Sandy Point 2009 0.66 21.42 Rise
Victoria 07‐09/09‐11 4.61 12.13 Rise
Coronet Bay 2010 8.97 3.66 Fall
Grantville 2010 8.93 ‐7.68 Fall
Cape Paterson 2010 6.89 10.71 Rise
Ventnor 2010 1.65 1.17 Fall
Cowes 2010 4.88 3.54 Fall
Indented Head 2010 7.48 5.09 Fall
Corinella 2010 12.87 ‐1.81 Fall
Barwon Heads 2010 4.93 9.32 Rise
Newhaven 2010 0.00 ‐1.18 Fall
Aireys Inlet 2010 5.26 6.90 Rise
Drysdale 2010 2.47 13.32 Rise
Skenes Creek 2010 17.85 ‐7.80 Fall
Ocean Grove 2010 4.67 7.87 Rise
Apollo Bay 2010 2.97 1.41 Fall
Marengo 2010 28.88 ‐13.75 Fall
Fairhaven 2010 9.58 ‐3.96 Fall
Wye River 2010 19.82 ‐2.37 Fall
Victoria 08‐10/10‐12 8.47 1.85 Fall
Source: Office of the Valuer General Victoria
4.6 Population and risk
Coastal areas may be subject to environmental hazards such as fire, flood, erosion or storm surge. Where these hazards occur near populations or assets, the concept of risk becomes important. Risk can be defined as the probability or likelihood of a hazard multiplied by the consequence of social, economic or environmental loss. As outlined earlier in this report, many coastal areas are attractive to retiree populations. As populations age into very old age groups, there is likely to be an increasing level of community vulnerability as safety and evacuation risks emerge. The Royal Commission into the Black Saturday

24
fires of 2009 found that 30% of fatalities were aged 60 years or more. An additional 22 per cent were in the 50 to 59 year age group (CRCS & Bushfire CRC 2010). Fire risk analysis has been undertaken for Victoria (CFA Victoria 2011). Eighteen of the 52 towns determined to be at greatest risk of bushfire are located along the coast (figure 22). Some of these towns rank highly on indicators such as old age populations, single person households and households without internet connection or cars (figure 23). Coastal areas are also at greater risk of hazards such as storm surge and the potential effects of increasing sea levels (VCC 2011, pp. 2‐3). Figure 22: Fire risk rating for human settlements along the Victorian coast, 2011
Source: CFA 2011, Victorian Fire Risk Register
Figure 23: Coastal settlements* ranking highly on selected vulnerability indicators 2011
* excluding Melbourne and Geelong
Source: ABS Census 2011
Because coastal areas can have large fluctuations in their populations through part‐time residents or visitor populations, risk profiles may vary. In peak holiday periods, the risk of fire ignition often increases. Education can be an issue as many visitors are unfamiliar with fire ‐ for example, most (urban) visitors will be unfamiliar with fire prevention or fire evacuation procedures. An additional risk arises simply because of the large volume of people and traffic as evacuation is likely to be more difficult. This can be exacerbated in locations that have limited road access, are surrounded by bushland or located in more remote parts of the State. Towns that have small resident populations and high peaks will often have a limited pool of volunteers and professionals to cope with a high demand for services. Some aspects of vulnerability are more difficult to determine. It is often thought that communities with high levels of disadvantage may be more vulnerable to coastal hazards because they are deprived of resources or opportunities that underpin social and economic wellbeing. However, material
25
resources such as income or education are only part of the equation and even poorer communities may have strong social capital resources which can assist in dealing with natural hazards and risks. Medical and emergency services are particularly important for communities with older populations and in areas at risk of particular hazards such as bushfire, flood or storm. CFA Brigades and SES units are common along the Victorian coast, although regional and district headquarters are only found in larger centres like Geelong and Sale. There are few 24‐hour police stations on the coast itself, exceptions being larger centres like Portland, Warrnambool and Geelong. Inland from the coast, centres such as Hamilton and Colac in the west and Latrobe Valley, Sale and Bairnsdale to the east provide this higher level service. Some coastal towns have good access to these centres ‐ for example Paynesville is close to Bairnsdale. However other centres may be much more remote (eg. Mallacoota) or may have greater challenges in accessing services due to topographic barriers such as the Strezlecki or Otway Ranges. Major medical facilities like hospitals are found in the larger centres. Smaller coastal settlements generally have health centres and community ambulance branches rather than larger or more comprehensive services. Access to medical and emergency services becomes more significant during times of peak population. While additional personnel may be deployed to coastal locations, (eg. police during large events), maintaining services can be difficult where population fluctuates. This is particularly the case for local volunteer‐based services such as CFA brigades. Furthermore, peak populations which create traffic may affect the ease with which emergency services can attend a range of emergencies (SGS 2007).
5 CONCLUSION
The Victorian coast is different to that of other States in Australia. Population growth along the Victorian coast is generally not as high as in parts of Queensland or New South Wales. Settlement planning has introduced limitations on where growth can occur and many coastal settlements have been encouraged to grow inland rather than sprawling along the coast. Victoria has most of its coastal foreshore in public ownership and, while this does not necessarily limit visitor populations, it does prevent settlement sprawl. Placing limitations on urban development has sometimes been assumed to cause an increase in housing prices. The relationship is more complex as house prices are determined by many factors including local supply and demand, natural amenity, and quality and type of housing. Furthermore, town boundaries need to be seen in a wider context as they have usually been determined within a wider planning strategy that highlights where growth can occur. Concerns around population growth on the coast may reflect perceptions of crowding that can occur where visitor populations are high. Understanding the role of resident and visitor populations is important for planning along the coast. It is important to note that planning for visitor populations may require non land use planning solutions such as people management strategies. One issue that may increase in importance in the future is that of populations at risk of natural hazards along the coast. Victorian coastal areas have always faced risks of fire, flood and storm. But with concentrations of older age groups along the coast and increasing risk due to climate change, these risks may be faced by a larger number of people. Pressure placed on volunteer and non‐volunteer services may increase in the future as populations age, and the risk profile of coastal areas changes.

26
References
AAA Tourist Accommodation Data 2012
Australian Bureau of Statistics (ABS), Census of Population and Housing 2011
Australian Bureau of Statistics (ABS), Regional Population Growth Australia, cat. no. 3218.0
Australian Bureau of Statistics (ABS), Building Approvals Australia, cat. no. 8731
CFA Victoria 2011, Victorian Fire Risk Register.
Chamberlain K. 1997, “Carrying capacity”, UNEP Industry and Environment No. 8, UNEP, Paris.
CRCS and Bushfire CRC 2010, Review of Fatalities in the February 7, 2009, Bushfires.
Department of Planning and Community Development (DPCD) 2006 “Survey of non‐resident ratepayers in Mansfield”, Victorian Government, Melbourne.
Department of Planning and Community Development (DPCD) 2008, “Survey of non‐resident ratepayers in Queenscliffe”, Victorian Government, Melbourne.
Department of Sustainability and Environment (DSE) 2006, Coastal Spaces Landscape Assessment Study, Victorian Government, Melbourne.
Ipsos‐Eureka Social Research Institute, 2012, Coastal and Marine Environment Community Attitudes & Behaviour (Wave Four) Report, prepared for Victorian Coastal Council, Ipsos Project: 11‐000498‐01 Melbourne.
Kelly G. and Haslam‐McKenzie, F. 2005, “Housing Affordability in a Sea Change Community: Market and Policy Responses to Changing Socio‐Demographics” paper presented to the Building for Diversity National Housing Conference, Perth Australia, 26‐28 October 2005.
McKenzie, F., Martin, J. and Paris, C. 2008, “Fiscal policy and mobility: the impact of multiple residences on the provision of place‐based service funding”, Australasian Journal of Regional Studies, Vol. 14, No. 1, pp. 53‐70.
Office of the Valuer General Victoria, “Residential land price data”
Paris, C. 2006, “Multiple ‘homes’, dwelling & hyper‐mobility: emergent transnational second home ownership”, paper presented at the European Network for Housing Research (ENHR) conference Housing in an Expanding Europe: theory, policy, participation and implementation, Ljubljana, Slovenia, 2‐5 July 2006.
Parliament of Victoria 1997, Residential Tenancies Act 1997, No. 109 of 1997, version No. 070 incorporating amendments as at 14 November 2012.
SGS Economics and Planning 2007, Impacts of Coastal Population Fluctuations, report prepared for Department of Sustainability and Environment, Victorian Government. Melbourne.
Shopscience 2011, Attitudes and Target Profiling. Market Research Study for Regional Development Victoria, prepared by Mark Fletcher, Melbourne.
The Market Research Group 1997, The Purbeck Section of the Dorset and East Devon World Heritage Site Carrying Capacity Evaluation Report, prepared for the World Heritage Steering Group, the Purbeck Heritage Committee and the Dorset AONB, Bournemouth.
Victorian Coastal Council (VCC) 2008, Victorian Coastal Strategy, Victorian Government, Melbourne.
Victorian Coastal Council (VCC) 2011, Emerging Scientific Issues on Victoria’s Coast, Victorian Government, Melbourne.
Victorian Coastal Council (VCC) 2012, website accessed January 2012. www.vcc.vic.gov.au