POPULATION AND MORPHOLOGICAL CHANGES IN AMERICAN …
72
University of Nebraska - Lincoln DigitalCommons@University of Nebraska - Lincoln Dissertations and eses in Biological Sciences Biological Sciences, School of Spring 4-22-2016 POPULATION AND MORPHOLOGICAL CHANGES IN AMERICAN KESTRELS THROUGH SPACE AND TIME Teresa E. Ely University of Nebraska-Lincoln, [email protected] Follow this and additional works at: hp://digitalcommons.unl.edu/bioscidiss Part of the Biology Commons , Ornithology Commons , Population Biology Commons , and the Poultry or Avian Science Commons is Article is brought to you for free and open access by the Biological Sciences, School of at DigitalCommons@University of Nebraska - Lincoln. It has been accepted for inclusion in Dissertations and eses in Biological Sciences by an authorized administrator of DigitalCommons@University of Nebraska - Lincoln. Ely, Teresa E., "POPULATION AND MORPHOLOGICAL CHANGES IN AMERICAN KESTRELS THROUGH SPACE AND TIME" (2016). Dissertations and eses in Biological Sciences. 82. hp://digitalcommons.unl.edu/bioscidiss/82
Transcript of POPULATION AND MORPHOLOGICAL CHANGES IN AMERICAN …

University of Nebraska - LincolnDigitalCommons@University of Nebraska - Lincoln
Dissertations and Theses in Biological Sciences Biological Sciences, School of
Spring 4-22-2016
POPULATION AND MORPHOLOGICALCHANGES IN AMERICAN KESTRELSTHROUGH SPACE AND TIMETeresa E. ElyUniversity of Nebraska-Lincoln, [email protected]
Follow this and additional works at: http://digitalcommons.unl.edu/bioscidiss
Part of the Biology Commons, Ornithology Commons, Population Biology Commons, and thePoultry or Avian Science Commons
This Article is brought to you for free and open access by the Biological Sciences, School of at DigitalCommons@University of Nebraska - Lincoln. Ithas been accepted for inclusion in Dissertations and Theses in Biological Sciences by an authorized administrator of DigitalCommons@University ofNebraska - Lincoln.
Ely, Teresa E., "POPULATION AND MORPHOLOGICAL CHANGES IN AMERICAN KESTRELS THROUGH SPACE ANDTIME" (2016). Dissertations and Theses in Biological Sciences. 82.http://digitalcommons.unl.edu/bioscidiss/82

!!
POPULATION AND MORPHOLOGICAL CHANGES IN AMERICAN KESTRELS
THROUGH SPACE AND TIME
by
Teresa E. Ely
A THESIS
Presented to the Faculty of
The Graduate College at the University of Nebraska
In Partial Fulfillment of Requirements
For the Degree of Master of Science
Major: Biological Sciences
Under the Supervision of Professor John P. DeLong
Lincoln, Nebraska
April, 2016

!!
POPULATION AND MORPHOLOGICAL CHANGES IN AMERICAN KESTRELS
THROUGH SPACE AND TIME
Teresa E. Ely, M.S.
University of Nebraska, 2016
Advisor: John P. DeLong
A once common raptor, the American kestrel (Falco sparverius) has experienced
population declines in the last two decades throughout North America. Many hypotheses
exist about the decline, including mortality from West Nile virus, rodenticide poisoning,
climate change, an increase in predators, and core habitat loss or degradation, which
could influence food availability. Food availability is key to raptor survival and
reproduction, and changes in food availability throughout the year can have lifelong
effects on size and body condition. Here we examine how morphology, specifically mass
and wing chord, has changed at seven migration sites throughout North America as
kestrel populations have declined. We hypothesized that if kestrel populations were
declining due to lower food availability, there would also be declines in body size. Our
results show a decrease in kestrel populations at all sites and a decline in mass and wing
chord at five and four sites, respectively. We examined fat scores at two intermountain
region migration sites and found that fat scores increased at one site and decreased at
another. These results implicate a role for food availability in driving declines in kestrel
populations, most likely during the breeding season. We also found differences in body
mass and wing chord among migration sites. Despite being correlated within sites,
variation in body mass and wing chord across sites differed, giving rise to variation in
sexual size dimorphism and wing loading across sites. This variation may be due to

!!
selective forces acting on traits, though random divergence due to low gene flow may be
driving variation in wing chord. For body mass, regional variation in males and females
could be a response to ecological processes. Overall, we can conclude that lower food
availability is affecting some sites and not others, and that kestrels show regional
morphological variation.

iv!!
ACKNOWLEDGEMENTS
I would especially like to thank my advisor Dr. John DeLong. He has been an
excellent mentor would helped me transition from a wandering seasonal wildlife biologist
into a budding raptor biologist. He taught me how to take what I have learned in the field
and apply it to meaningful research. I would like to thank my committee members Dr.
Gwen Bachman and Dr. T.J. Fontaine for providing additional help and guidance. I
would also like to thank SBS special funds for providing addition help.
I would like to thank the graduate students in the School of Biological Sciences
for providing support, entertainment and sanity. I would especially thank Jean Philippe
Gibert, Shivani Jadeja, and Anna Tatarko for helping me code, lending an ear, and
thoughtful discussions about life. I would like to thank the entire Shizuka Lab for keeping
me on my toes in the office.
I would like to thank my family for their love and support from hundreds of miles
away. I would like to thank Erica, Jenny, Helen, and Laura for providing stories from
their graduate school experiences as we all decided to go back to school at the same time.
Finally, I would like to thank Ben Dudek for his patience, support, and understanding
during the last two years.

v!!
TABLE OF CONTENTS
CHAPTER 1: Morphological Changes in American Kestrels (Falco sparverius) Suggest
Multiple Causes Contribute to Widespread Population Declines.
Abstract …………………………………………………………………….……..1
Introduction ………………………………………………………………….……2
Methods ………………………………………………………………………….. 6
Results …………………………………………………………………………...10
Discussion ……………………………………………………………………… 12
Acknowledgments………………………………………………………………. 18
References ……………………………………………………………………… 19
Multimedia Objects
Table 1. List of Possible Causes for Decline…………………………… 24
Figure 1. American Kestrel Life Cycle ………………………………… 25
Figure 2. Map of Migration Sites and Flyways ………………………... 26
Figure 3. RpH, Mass, and Wing Chord Graphs of Trends.…………….. 27
Figure 4. Trends in Fat Scores Over Time ……………………………... 28
Table 2. Summary of Population Decline ……………………………… 29
Table 3a. Summary of Mass and Wing Chord Change ............................30
Table 3b. Summary of Mass or Wing Chord Change From Models with
Two-way Interaction………………………………………......... 31
Table 4. Summary of Wing Pit Fat Change…………………………….. 32

vi!!
Table 5. Model List per Site for RpH, Mass,
Wing Chord and Wing Pit Fat………………………………………… 33
Appendix………………………………....……………………………. 34
Table S1: Size Parameters ...................................................................... 34
Table S2: Breakpoint Slopes .................................................................. 35
Table S3: Output Tables from Models
A. Cape May Point, NJ................................................................. 36
B. Hawk Mountain Sanctuary, PA................................................ 37
C. Hawk Ridge Bird Observatory, MN........................................ 38
D. Manzano Mountains, NM........................................................ 39
E. Goshute Mountains, NV........................................................... 40
F. Lucky Peak, ID......................................................................... 41
G. Golden Gate Raptor Observatory, CA..................................... 42
CHAPTER 2: Geographic Variation in Morphology of the American Kestrel (Falco
sparverius) Across North America.
Abstract ……………………………………………………………………….... 43
Introduction …………………………………………………………………...... 43
Methods ………………………………………………………………………… 46
Results ………………………………………………………………………….. 47
Discussion ……………………………………………………………………… 49
Acknowledgments………………………………………………………………. 52
References ……………………………………………………………………… 52

vii! !
Multimedia Objects
Table 1. Mass and Wing Chord ANOVA ……………………………… 56
Table 2. Summary of Mass and Wing Chord Means.............………….. 57
Table 3. Summary of Tukey HSD Mass Results……………………….. 58
Table 4. Summary of Tukey HSD Wing Chord Results……….……….. 59
Table 5. Mass and Wing Chord Longitudinal Differences…...………… 60
Table 6. Summary of Tukey HSD Wing Loading Results……….…….. 61
Figure 1. Mass, Wing Chord, Sexual Size Dimorphism Averages..…… 62
Figure 2. Wing Chord vs. Longitudinal Differences …………………... 63
Figure 3. Wing Loading Boxplot .......................................…………….. 64
!!

!
!
1!
Chapter 1: Morphological Changes in American Kestrels (Falco sparverius)
Suggest Multiple Causes Contribute to Widespread Population Declines.
ABSTRACT
Many American kestrel (Falco sparverius) populations are declining across North
America. Potential causes include mortality from West Nile Virus, anticoagulant
rodenticide exposure, climate change, an increase in avian predators, habitat degradation,
and reduction in food availability. We analyzed American kestrel count and banding data
from seven raptor migration sites throughout North America with at least 20 years of
migration data. We used count data to determine the year at which the kestrel population
began a significant decline and then used banding records to determine whether body
mass and wing chord declined after this point. We found reductions in mass at five sites
and wing chord at four sites. We also assessed wing pit fat for two sites, and this metric
of energy reserves declined at one site and increased at another site. Our results indicate
declines in body size at the majority of sites are consistent with the hypotheses that food
availability, change in climate, predation risk, or increases in the use of anticoagulant
rodenticides are causing population declines. In contrast, the sites that do not show
significant trends in body size could indicate that West Nile virus is contributing to
population declines.

!
!
2!
INTRODUCTION
Raptors are top predators that are vulnerable to environmental change because
they often occur at low densities, have low reproductive rates, and establish large home
ranges (Bildstein 2001; Hoffman & Smith 2003). In addition, direct threats from humans
include habitat loss, shooting, poisoning, electrocution, and collisions with wind turbines,
vehicles and windows (DeLong 2000). Not surprisingly populations of many raptor
species are declining and subsequently are of conservation concern, including Peregrine
falcons (Falco peregrinus), Bald eagles (Haliaeetus leucocephalus), Swainson’s hawks
(Buteo swainsoni), and Osprey (Pandion haliaetus) during the last half-century (Cade et
al. 1988; Bednarz et al. 1990; Hoffman & Smith 2003; McCarty & Bildstein 2005;
Farmer & Smith 2009). Although some declining species have recovered due to intensive
reintroduction programs, habitat protection, and efforts to limit direct threats, other
species, including the American kestrel (Falco sparverius), are showing more recent
declines (Farmer & Smith 2009).
American kestrels (hereafter referred to as kestrels) are the smallest North
American falcon and are widely distributed across North America. Kestrels forage on a
wide variety of small prey, including insects, lizards, birds, and mammals (Smallwood &
Bird 2002). To take advantage of seasonal prey abundances, most kestrel populations
migrate south of their breeding range for the winter (Smallwood & Bird 2002). Migration
is an energetically expensive undertaking, and raptors frequently use thermals and
orographic lift along prominent ridges and coastlines to save energy, generating
concentration points where many raptors pass through particular sites each year
(Kerlinger 1989; Bohrer et al. 2012).
!
!
3!
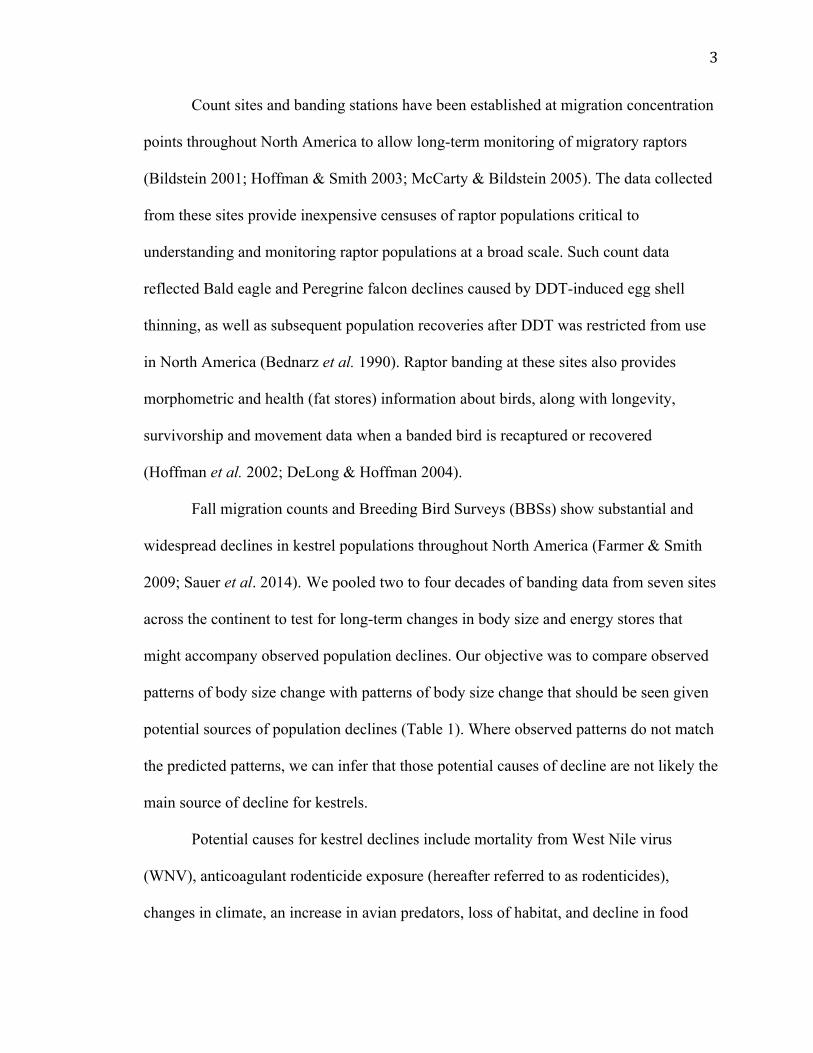
Count sites and banding stations have been established at migration concentration
points throughout North America to allow long-term monitoring of migratory raptors
(Bildstein 2001; Hoffman & Smith 2003; McCarty & Bildstein 2005). The data collected
from these sites provide inexpensive censuses of raptor populations critical to
understanding and monitoring raptor populations at a broad scale. Such count data
reflected Bald eagle and Peregrine falcon declines caused by DDT-induced egg shell
thinning, as well as subsequent population recoveries after DDT was restricted from use
in North America (Bednarz et al. 1990). Raptor banding at these sites also provides
morphometric and health (fat stores) information about birds, along with longevity,
survivorship and movement data when a banded bird is recaptured or recovered
(Hoffman et al. 2002; DeLong & Hoffman 2004).
Fall migration counts and Breeding Bird Surveys (BBSs) show substantial and
widespread declines in kestrel populations throughout North America (Farmer & Smith
2009; Sauer et al. 2014). We pooled two to four decades of banding data from seven sites
across the continent to test for long-term changes in body size and energy stores that
might accompany observed population declines. Our objective was to compare observed
patterns of body size change with patterns of body size change that should be seen given
potential sources of population declines (Table 1). Where observed patterns do not match
the predicted patterns, we can infer that those potential causes of decline are not likely the
main source of decline for kestrels.
Potential causes for kestrel declines include mortality from West Nile virus
(WNV), anticoagulant rodenticide exposure (hereafter referred to as rodenticides),
changes in climate, an increase in avian predators, loss of habitat, and decline in food

!
!
4!
availability (Table 1; Smallwood et al. 2009). Although numerous bird species have been
affected by WNV since 1999 throughout North America, it is unlikely to be causing long-
term kestrel declines because northeastern kestrel populations began to decline prior to
the arrival of WNV (Farmer & Smith 2009). There is currently little evidence that WNV
affects smaller or larger kestrels more severely, and thus if WNV is causing population
declines in kestrels, there should not be a concomitant decline in body size.
Anticoagulant rodenticides negatively effects populations of raptors that forage on
small mammals (Murray 2011; Rattner et al. 2011; Stansley et al. 2014). There is little
information about how rodenticides influence body size, but Barn owl (Tyto alba)
nestlings in areas where rodenticides were deployed grew to smaller sizes and had shorter
wing chords than nestlings in control areas (Naim et al. 2010). Thus, sublethal
rodenticide poisoning could potentially affect the size of kestrels as well, generating a
parallel decrease in body size as populations decline.
In North America, wing lengths have been getting larger on the West coast but
smaller in the East (Van Buskirk et al. 2010; Goodman et al. 2011). The link between
wing length and climate in these studies is correlational, but overall this suggests that no
consistent pattern of body size change should arise if climate is the direct cause of
population declines. It is also unclear how population declines in kestrels would be linked
directly to climate, such that effects of temperature per se, might be inconsistent as well.
Indirectly, changes in climate could alter the availability of prey (see below).
Avian predators such as Cooper’s hawks (Accipiter cooperii) and Peregrine
falcons could have a negative impact on kestrel populations and have an effect on kestrel
body size. Cooper’s hawk populations have been steadily increasing in urban
!
!
5!
environments in the last decade (Fish 2003; Stout & Rosenfield 2010). After the ban of
DDT use and successful large-scale reintroduction programs, Peregrine falcon
populations began to steadily increase throughout North America (Cade et al.1988;
Bildstein 2001). Cooper’s hawks and Peregrine falcons will feed on a variety of prey, but
birds make up a majority of their diets (Storer 1966; White et al. 2002; Ellis et al. 2004;
Curtis et al. 2006). Few studies have analyzed prey remains in Cooper’s hawk and
Peregrine falcon nests, and very few kestrels have been taken as prey (Storer 1966; Ellis
et al. 2004). However, an increase in avian predators may put stress on kestrel
populations, causing body size selection (Scharf et al. 2000). Selecting for body size
could drive kestrel body size to increase or decrease over time.
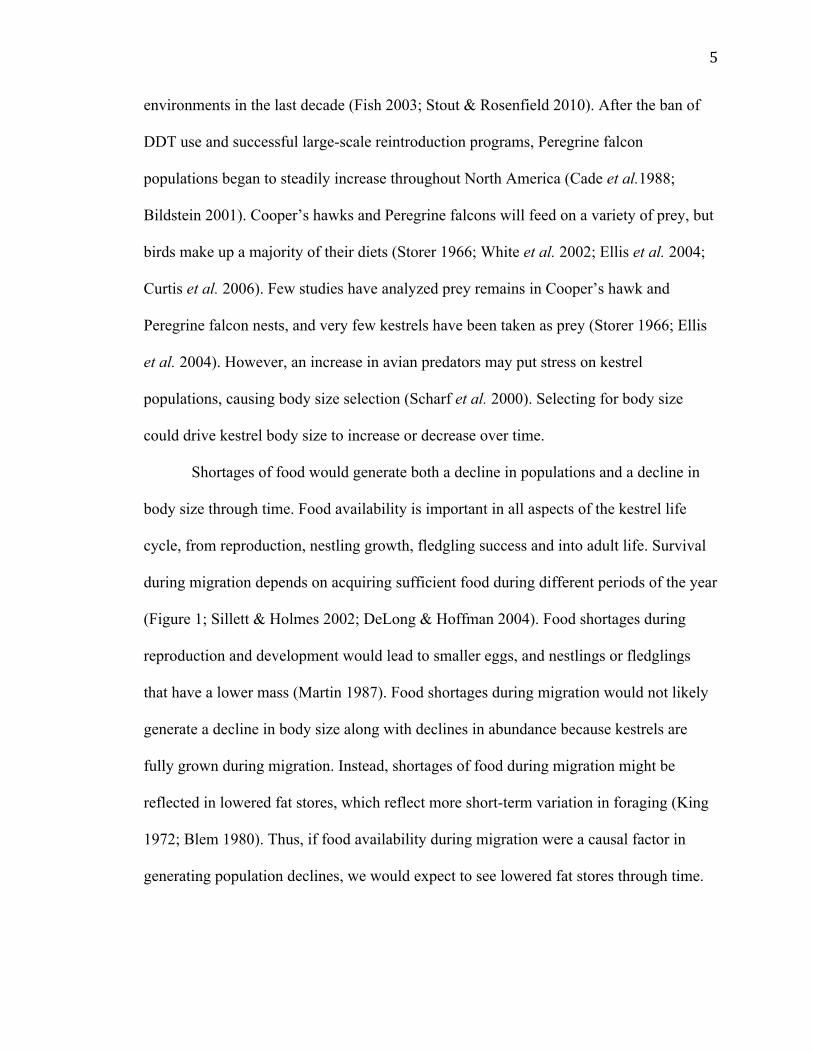
Shortages of food would generate both a decline in populations and a decline in
body size through time. Food availability is important in all aspects of the kestrel life
cycle, from reproduction, nestling growth, fledgling success and into adult life. Survival
during migration depends on acquiring sufficient food during different periods of the year
(Figure 1; Sillett & Holmes 2002; DeLong & Hoffman 2004). Food shortages during
reproduction and development would lead to smaller eggs, and nestlings or fledglings
that have a lower mass (Martin 1987). Food shortages during migration would not likely
generate a decline in body size along with declines in abundance because kestrels are
fully grown during migration. Instead, shortages of food during migration might be
reflected in lowered fat stores, which reflect more short-term variation in foraging (King
1972; Blem 1980). Thus, if food availability during migration were a causal factor in
generating population declines, we would expect to see lowered fat stores through time.
!
!
6!
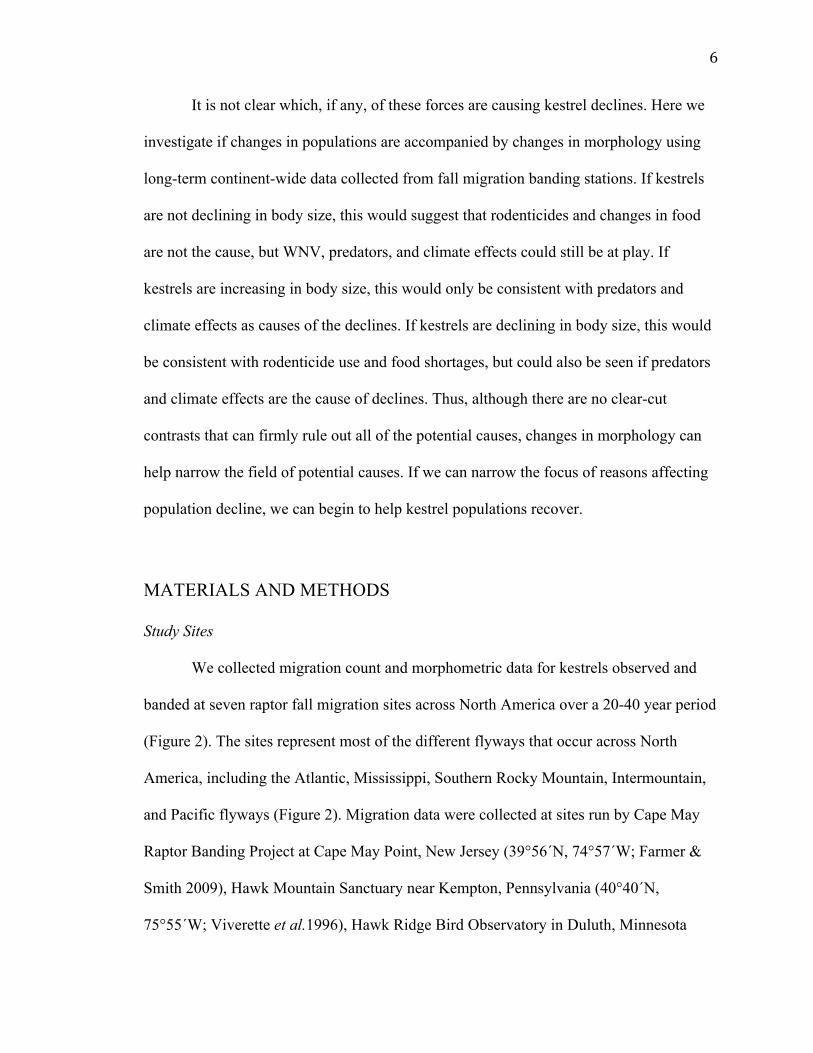
It is not clear which, if any, of these forces are causing kestrel declines. Here we
investigate if changes in populations are accompanied by changes in morphology using
long-term continent-wide data collected from fall migration banding stations. If kestrels
are not declining in body size, this would suggest that rodenticides and changes in food
are not the cause, but WNV, predators, and climate effects could still be at play. If
kestrels are increasing in body size, this would only be consistent with predators and
climate effects as causes of the declines. If kestrels are declining in body size, this would
be consistent with rodenticide use and food shortages, but could also be seen if predators
and climate effects are the cause of declines. Thus, although there are no clear-cut
contrasts that can firmly rule out all of the potential causes, changes in morphology can
help narrow the field of potential causes. If we can narrow the focus of reasons affecting
population decline, we can begin to help kestrel populations recover.
MATERIALS AND METHODS
Study Sites
We collected migration count and morphometric data for kestrels observed and
banded at seven raptor fall migration sites across North America over a 20-40 year period
(Figure 2). The sites represent most of the different flyways that occur across North
America, including the Atlantic, Mississippi, Southern Rocky Mountain, Intermountain,
and Pacific flyways (Figure 2). Migration data were collected at sites run by Cape May
Raptor Banding Project at Cape May Point, New Jersey (39°56´N, 74°57´W; Farmer &
Smith 2009), Hawk Mountain Sanctuary near Kempton, Pennsylvania (40°40´N,
75°55´W; Viverette et al.1996), Hawk Ridge Bird Observatory in Duluth, Minnesota

!
!
7!
(46°51´N, 92°02´W; Evans et al. 2012), HawkWatch International at the Manzano
Mountains in central New Mexico (34°42´N, 106°25´W; DeLong 2006) and the Goshute
Mountains in eastern Nevada (40°25´N, 114°16´W; (DeLong & Hoffman 1999),
Intermountain Bird Observatory at Lucky Peak near Boise, Idaho (43°36´N, 116°04´W,
Farmer & Smith 2009), and the Golden Gate Raptor Observatory (GGRO) in the Marin
Headlands, California (37°49´N, 122°29´W; Hull et al. 2010).
Data collection
We used raptors per hour (RpH; the total number of birds counted divided by the
total observation hours each year) to assess kestrel population trends through time.
Although the data collection procedures vary slightly between sites, procedures are
standardized within each site giving a robust index of kestrel population sizes each year
(Hoffman & Smith 2003; Farmer et al. 2007; Hull et al. 2010; Evans et al. 2012).
Kestrels were trapped at the different sites using similar trapping procedures. A
combination of bow nets, mist nets, or dho-gaza nets were used to capture raptors, and
non-native avian species such as rock pigeons (Columba livia), Eurasian collared doves
(Streptopelia decaocto), house sparrows (Passer domesticus), and European starlings
(Sturnus vulgaris) were used as lures. Kestrels were fitted with a uniquely numbered,
U.S. Geological Survey aluminum leg band (Hoffman et al. 2002).
Kestrels were sexed and aged by plumage (Smallwood 1989; Clark & Wheeler
2001). Males have slate-blue wings and females have reddish brown wings. Females can
be aged by the size of the subterminal band on their tail. The adult female subterminal
band is ~1.75 times wider than the next dark band on their feathers, whereas the juvenile
subterminal bands are less than 1.75 times the next dark band on their feathers

!
!
8!
(Smallwood 1989). Hatching-year females were termed “juvenile” and AHY (After
hatching-year), SY (Second year) and ASY (After second year) females were grouped
together as “adult”. Due to difficulties and inconsistences in aging males during
migration, all males were assigned as “unknown” age for this analysis. We used a
combined age/sex category that included juvenile females, adult females, and males. At
Lucky Peak and Hawk Mountain Sanctuary, however, the majority of female kestrels that
were captured were of unknown age so all females were assigned “unknown” at these
sites.
Birds were weighed to the nearest gram and a standard ruler was used to measure
wing chord to the nearest millimeter. Body mass and wing chord are both measures of
overall body size, but wing chord is relatively fixed after feather growth ceases, except
for minor wear, while body mass can vary through time to a greater extent. In addition to
genetic effects, wing chord reflects energetic conditions of a bird while the feather is
growing, while body mass reflects energetic conditions during nestling growth and
through time after the bird stops growing. Kestrels that had food in their crops equivalent
to being about half full or fuller, were not included in the analysis (approximately 300)
because the crop contains undigested material such as bones, feathers, and fur, which
would cause overestimation of the mass of the bird. If individuals were recaptured at the
original banding location within the same banding season, we only used the initial mass
and wing chord measurements in the analysis. Distributions of mass and wing chord were
analyzed to identify and remove major errors in measurements of mass and wing chord.
Birds with mass and wing chord measurements greater than 3 standard deviations (SD) of
the mean mass and wing chord for each sex were excluded from the analysis due to the
!
!
9!
high likelihood that these measurements were incorrectly recorded, and eliminated
approximately 250 individuals out of a sample size of about 16,300.
Wing pit fat is a good proxy for total body fat in raptors (DeLong & Gessaman
2001). At the Manzano Mountain and Goshute Mountain sites, wing pit fat scores were
assigned with a 4-point scoring technique (DeLong and Hoffman 2004). A score of 0 was
for kestrels with no visible fat, 1 for birds with a shallow streak of fat, 2 for birds with fat
that was approximately flush with surrounding muscle tissue, and 3 for birds with fat that
exceeded the depth of the surrounding muscle tissue.
Statistical Analysis
Data were analyzed by site due to regional differences in kestrel body size and
wing chord (Table S1). We used a breakpoint regression for RpH against year to identify
when populations switched from a period of stable or increasing population size to a
statistically significant decline. Once the breakpoint year was determined, we subset the
data into “before” and “after” datasets, with the before dataset covering the initial period
of stable or increasing population size and the “after” dataset covering the period of
recent population decline (Table S2).
We then used linear regression to determine whether the mass and wing chord
length of the kestrels changed over time after declines began. A global model was
developed for each site for the periods before and after the breakpoint year, or the whole
time-period if there was no breakpoint. Predictor variables included year, Julian date
(JD), a combined age/sex class (SA), and all two-way interactions. SA was included
because kestrels differ by sex in size and morphology. We included Julian date in the
analyses because later migrating raptors may have higher fat and protein reserves than

!
!
10!
earlier migrating birds (Gessaman 1979; DeLong 2006). We used backward model
selection with the ‘drop’ function to remove non-significant predictor variables and
obtain a minimum model. We carried out all statistical analyses in R version 3.1.2 (R
Core Development Team 2014) and package ‘Segmented’ for the breakpoint regressions
(Muggeo 2003; Muggeo 2008).
We used linear regression to assess changes in wing pit fat scores through time for
the Goshute Mountains and the Manzano Mountains sites. These data were available for
shorter periods of time, from 1993 to 2013 in the Manzano Mountains and 1992 to 2014
in the Goshute Mountains. As before, we developed a global model for each period
before and after the breakpoint year. The response variable was wing pit fat and the
predictor variables were year, SA, JD, and two-way interactions between year and SA,
and JD and SA. We used the same breakpoint year described earlier to subset the data
and then used backward model selection to drop non-significant terms.
RESULTS
Population declines
The rate of raptor passage (RpH) significantly declined at all seven migration sites
during the last decade, with some sites showing declines for much longer periods (Table
2; Figure 3). Declines in RpH ranged across sites from 12.6% to 42.7 % per ten years
(Table 2). Cape May, Hawk Mountain, and Lucky Peak did not show a breakpoint in
their population trends, with declines evident during the entire period analyzed.

!
!
11!
Mass
During the periods when RpH declined significantly, mass also declined
significantly at most sites (Table 3a). In some cases, mass declined significantly for all
age and sex groups, and in other cases only certain classes declined. The mass of juvenile
females, adult females and males declined significantly at Cape May, Hawk Mountain,
Goshute Mountains and Lucky Peak. The declines in kestrel mass over a period of 10
years ranged from 0.7% to 2.4% of their average mass, which corresponds to 1 g to 2.7 g
decrease in mass (Table 3a). Juvenile females had a significant decrease in mass at
Goshute Mountains and GGRO. Juvenile female kestrels at the Goshute Mountains lost
1.3% of their mass or 1.5 g whereas juvenile female kestrels at GGRO lost 0.89% of their
mass or 1 g during a ten-year period (Table 3b).
Wing Chord
At Hawk Ridge, Manzano Mountains, Goshute Mountains, and Lucky Peak, wing
chord declined from 0.2% to 0.7%, or 0.4-1.2 mm, per ten years across sites (Table 3a).
At Cape May, wing chord did not decline significantly overall but juvenile female wing
chords showed a decline of 0.52% of wing chord, or ~1 mm per ten years.
Wing Pit Fat
At Manzano Mountains, there was a non-significant increasing trend in fat scores
before the breakpoint, and after the breakpoint year, wing pit fat increased significantly
(Table 4). At the Goshute Mountains, wing pit fat showed a non-significant decreasing
trend before the breakpoint and a significant decline after the breakpoint, at a rate 5-6%
per ten years (Table 4).

!
!
12!
DISCUSSION
Migration counts and breeding bird surveys have documented declines in kestrel
populations beginning in the mid 1990s (Sauer et al. 2014; Farmer & Smith 2009). Our
results show that in addition to population declines, kestrels are showing declines in body
size and wing morphology at the majority of migration sites we analyzed. Kestrel mass
has systematically been decreasing by about a gram or more per decade at five of the
seven migration sites across North America, and wing chord has been decreasing by 0.4
mm to 1 mm per decade at four of seven migration sites.
Birds undergo significant changes in body mass, and both fat and non-fat tissue,
throughout their annual life cycle (Lindström & Piersma 1993). The ability to accumulate
pre-migratory fat reserves is important for migrating birds because it allows them to store
energy needed while on migration when foraging might be limited (King 1972; Blem
1980; DeLong & Gessaman 2001; Delong & Hoffman 2004). We observed a decrease in
wing pit fat over time in kestrels migrating through the Goshute Mountains, whereas fat
stores increased for kestrels moving through the Manzano Mountains. These results
suggest that it is not primarily migration-season food availability driving wide-spread
declines, although declines in energy stores may play a role in survival or migration
strategies for birds migrating through the Goshute Mountains.
The kestrel population at Hawk Ridge Bird Observatory and the Manzano
Mountains did not show significant changes in the trends of mass throughout time. Our
first hypothesis, that kestrel decline was due to mortality from West Nile virus, could
explain the population decline at Hawk Ridge. From our population analysis, we
determined that kestrel populations declined in 2002 at Hawk Ridge, which is consistent
!
!
13!
with when WNV entered North America (Reisen 2013). In contrast, our results from
Manzano Mountains do not support the WNV hypothesis. From our breakpoint analysis,
we determined the population began declining in 1996, which is well before the arrival of
WNV in North America.!
Rodenticide poisoning, climate change, avian predators, food availability and loss
of habitat, cannot be ruled out as possible causes for kestrel decline at the Cape May,
Hawk Mountain, Manzano Mountains, Goshute Mountains, Lucky Peak, and Golden
Gate Raptor Observatory sites. These factors would have a negative effect on kestrel
populations as well as an effect on body size. The secondary effects of rodenticide
poisoning have recently gained more attention and further studies are needed to
understand their sublethal effects. Raptors are relatively sensitive to anticoagulants, and
can die from secondary poisoning (Rattner et al. 2011), and body size is stunted when
young are exposed to rodenticides (Naim et al. 2010). However, further research is
needed to determine if the nestlings that survive exposure to rodenticides (if any), and go
on to produce smaller young.
Other factors that affect body size, such as climate change, food availability, and
changes in habitat, are related and we analyzed the changes in size likely as a result of a
combination of these hypotheses. We specifically focused on how food availability could
be the main driver of decline. Changes in morphology can be expected if food availability
is contributing to the declines, as resource availability affects clutch number, egg size and
quality, nestling growth rate, fledgling success and survival, and the effects would be
reflected in an overall decrease in body size over time (Martin 1987; Lindström 1999).
Declines in food availability could affect kestrels during any time of the year (Figure 1,
!
!
14!
Segment A; Dawson & Bortolotti 2000). During egg production, energy and nutrients are
required for the female to produce eggs and provision them with energy. The larger the
caloric density of the eggs, the larger and more well-developed a young kestrel will be
when it hatches (Martin 1987). Incubation of the young can be energetically costly
because the more time a female spends on a nest, the less time she has to forage. A
heavier and better-fed female should be able to sustain the loss of more weight during
incubation, which would allow her to spend more time on the nest and increase nestling
survival (Martin 1987). Kestrel clutches hatch asynchronously, creating a size difference
among nestlings resulting in the last nestling being the smallest in size. When food is
limited, the last hatched bird may not survive, reducing the brood size; this may however
free up resources for the remaining young, potentially allowing the remaining nestlings to
survive. Nestling growth depends on food provisioning (Dawson & Bortolotti 2000), and
young birds reach their full structural size about a month after hatching. Better-fed
fledglings will be larger, stronger, and more successful at hunting and preparing for fall
migration, enabling higher survival (Dawson & Bortolotti 2000). In short, because food
availability during the breeding season influences both growth and survivorship, declines
in population size that are caused by lower food availability would likely be accompanied
by declines in body size and we see this at the majority of study sites.
Factors such as climate and land-use change could cause decreases in food
availability. Drought has been prevalent in the interior west of North America during a
substantial portion of the kestrel declines (Hoffman & Smith 2003; Farmer & Smith
2009). Hoffman and Smith (2003) suggested that as drought has increased, raptor hunger
levels and mortality have also increased in these regions. Changes in land-use also may
!
!
15!
be affecting the habitat structure in areas where kestrels hunt. Many northeastern
farmlands have been reforested or developed, replacing open foraging habitats with
forests or suburban land cover (Farmer & Smith 2009). Changes in landscape provide
fewer nesting sites and foraging locations and potentially fewer opportunities for
migration stopovers (Farmer & Smith 2009). Thus, changes in climate and land-use could
be the cause of decreased resource supply, impacting kestrel growth and survival.
Alternatively, behavioral changes in response to warming or change in precipitation
could alter access to food resources. For kestrels, variation in weather may affect food
availability and parental provisioning behavior (Dawson & Bortolotti 2000). In one
study, young kestrels that were exposed to inclement weather were smaller, lighter, and
less likely to survive to fledgling stage than those that were raised in better weather
conditions (Dawson & Bortolotti 2000). The results suggest it may not be food
abundance per se driving lower food intake, but potentially also food availability or
behavioral changes that limit provisioning rates.
Other studies in Europe and North America have shown long-term changes in
body size for other birds and have attributed these changes to changes in climate and food
availability. The body size of Danish goshawks (Accipiter gentilis) was examined in
museum specimens collected between 1854 and 1941 and between 1979 and 1998. In
these birds wing chord, tarsi length and bill size decreased over time and the trends were
linked to changes in diet because the decrease in body size was not uniform across age
and sex class and immature birds were more affected than adults. Similarly, a study of
passerines in western Pennsylvania from 1961 to 2006 showed that fat-free mass and
wing chord were steadily decreasing over time (Van Buskirk et al. 2010). In contrast,
!
!
16!
wing chord and mass for a wide variety of passerine species at two sites in central
California over 3-4 decades steadily increased over time, although not all changes were
significant for all species (Goodman et al. 2011). Studies by Goodman et al. (2011) and
Van Buskirk et al. (2010) both show changes in body size of a similar magnitude but in
different directions. Changes in body size in both studies have been attributed to a
changing climate, but Goodman et al. (2011) note that different biomes will respond
differently to climate change because warming and changes in precipitation in mesic and
arid environments may have different effects on body size. Our analysis is continental in
scope, and we see changes in morphology at sites in different directions, which could
suggest that the breeding areas from which migrants originate are responding differently
to climate change, and also suggests different factors are driving population declines.
Although migration counts have clearly documented population declines in
migratory raptors in the past, current declines and body size changes also could reflect
shifting migratory patterns or migratory short stopping – when birds migrate shorter
distances when conditions are good. Migratory short stopping could contribute to the
pattern of fewer birds being counted at migration sites. For example, population declines
were recorded in sharp-shinned hawks (Accipiter striatus) in the 1980s and 1990s in
eastern North American, at Cape May Point and Hawk Mountain Sanctuary (Viverette et
al. 1996). Band recovery data and CBS data indicate, however, that there was a
significant increase in the number of birds observed north of the two sites over time,
suggesting that sharp-shinned hawks in eastern North America may not be migrating as
far as they once did. Food availability is known to influence migration distances
(McClelland et al. 1994), altering distances or changing patterns and flyways. So,

!
!
17!
changes in food resources could be altering how far kestrels migrate. However, evidence
for kestrel declines also comes from Breeding Bird Surveys (Sauer et al. 2014) and
Christmas Bird Counts (Sauer et al. 1996b), indicating that short-stopping is an unlikely
cause of reduced numbers of kestrels seen at migration sites.
Declines in kestrel body size do not necessarily imply a maladaptive change in
phenotype. Indeed, body size is highly plastic and subject to rapid evolution, and theory
suggests that body size may shift as an adaptive response to resource supply (DeLong
2012). For example, smaller animals require less food than larger animals and thus may
be able to survive longer at lower food densities (Kooijman 1986). Smaller size may also
make migratory travel less costly. Falcons predominately use flapping flight instead of
soaring behavior during migration (Fuller et al. 1998; Dunne et al. 2012). Falcons will
forage while flying and if they are able to do so during migration, they may be able to
migrate faster because they do not have to stop to refuel. In general, flapping flight
performance improves as body size decreases, suggesting that smaller birds would not
have to feed agration and could migrate to wintering or spring grounds more quickly than
larger birds (Hedenstrom & Alerstam 1998; La Sorte et al. 2013).
In addition to changing how far they migrate, kestrels could be migrating earlier
or later. For example, in 2011 at Manzano Mountains, the average median passage date
for all raptor species was 10 days later than the median passage date from 1985-2010
(Mika et al. 2011). Changes in the growing season could be driving shifts in seasonal
food and resource availability. Such changes could influence the mass of kestrels during
migration because kestrels migrating later would be heavier, so banding stations would
be catching heavier and older birds. We accounted for this possible variation by including

!
!
18!
Julian date in our analysis, such that any shift in migration timing would not influence
our results.
The American kestrel might be the next canary in the coalmine, reflecting
widespread changes in climate and habitat quality that may affect many avian species.
Analyzing regional climate data during the fall migration season would be able to give us
a better understanding of how temperature change might affect migration patterns and
food availability. More research on West Nile virus is needed in the region around the
Great Lakes, where Hawk Ridge Bird Observatory is located, to understand the impacts
on kestrels specifically. More research is needed on the impacts of increasing populations
of Cooper’s hawks and Peregrine falcons in regions where there is overlap with kestrel
populations. Also, there has not been a comprehensive study on prey remains in Cooper’s
hawk nests and this research could provide insight into why kestrel populations are
declining. We suggest that efforts to understand how kestrel breeding and foraging
behaviors change in response to climate and land-use changes are crucial to understand
the mechanisms of kestrel declines, and how and whether we need to take steps to ensure
that kestrels remain common.
ACKNOWLEDGEMENTS
We thank Christopher W. Briggs, Allen Fish, Shawn E. Hawks, Gregory S.
Kaltenecker, Dave L. Evans, Frank J. Nicoletti, Jean-Francois Therrien, Paul A. Napier,
and all the hardworking raptor banders and counters, volunteers, and staff that helped
collect data over the last five decades and beyond. This paper would not have been
possible without the data from Cape May Raptor Banding Project, HawkWatch

!
!
19!
International, Golden Gate Raptor Observatory, Intermountain Bird Observatory, Hawk
Ridge Bird Observatory, and Hawk Mountain Sanctuary.
REFERENCES
Bednarz JC, Klem DJ, Goodrich LJ, Senner SE. 1990. Migration Counts of Raptors at Hawk Mountain, Pennsylvania, as Indicators of Population Trends, 1934-1986. The Auk 107:96–109. Bildstein KL. 2001. Why Migratory Birds of Prey Make Great Biological Indicators. Hawkwatching in the Americas. Hawk Migration Association of North America, North Wales, Pennsylvania, USA:169–179. Blem CR. 1980. The Energetics of Migration. Animal Migration, Orientation and Navigation. p. 175–213. Bohrer G, Brandes D, Mandel JT, Bildstein KL, Miller TA, Lanzone M, Katzner T, Maisonneuve C, Tremblay JA. 2012. Estimating Updraft Velocity Components Over Large Spatial Scales: Contrasting Migration Strategies of Golden Eagles and Turkey Vultures. Ecology letters, 15:96–103. Cade TJ, Enderson JH, Thelander CG, White CM. 1988. Peregrine Falcon Populations: Their Management and Recovery. 297–306. Clark WS, Wheeler BK. 2001. A Field Guide to Hawks of North America. Houghton Mifflin Harcourt. Curtis OE, Rosenfield RN, Bielefeldt J. 2006. Cooper’s Hawk (Accipiter cooperii), The Birds of North America Online. Ithaca: Cornell Lab Of Ornithology. Dawson RD, Bortolotti GR. 2000. Reproductive Success of American Kestrels: The Role of Prey Abundance and Weather. The Condor, 102:814–822. DeLong JP. 2000. Hawkwatch International Raptor Conservation Program!: Issues and Priorities. DeLong JP. 2006. Pre-Migratory Fattening and Mass Gain in Flammulated Owls in Central New Mexico. The Wilson Journal of Ornithology, 118:187–193. DeLong JP. 2012. Experimental Demonstration of a “ Rate – Size ” Trade-Off Governing Body Size Optimization. Evolutionary Ecology Research, 14:343–352. DeLong JP, Gessaman JA. 2001. A Comparison of Noninvasive Techniques for

!
!
20!
Estimating Total Body Fat in Sharp-shinned and Cooper’s Hawks. Journal of Field Ornithology, 72:349–364. DeLong JP, Hoffman SW. 1999. Differential Autumn Migration of Sharp-Shinned and Cooper ’s Hawks in Western North America. The Condor, 101:674–678. DeLong JP, Hoffman SW. 2004. Fat Stores of Migrant Sharp-shinned and Cooper’s Hawks in New Mexico. Journal of Raptor Research, 38:163–168. Dunne P, Sutton C, Sibley D. 2012. Hawks in Flight. Houghton Mifflin Harcourt. Ellis DH, Ellis CH, Sabo BA, Rea AM, Dawson J, Fackler JK, Larue CT, Grubb TG, Schmitt J, Smith DG, et al. 2004. Summer Diet of the Peregrine Falcon in Faunistically Rich and Poor Zones of Arizona Analyzed With Capture-Recapture Modeling. The Condor, 106:873–886. Evans DL, Niemi GJ, Etterson MA. 2012. Autumn Raptor Banding at Hawk Ridge, Duluth, Minnesota U.S.A., 1972–2009: An Overview. Journal of Raptor Research, 46:36–49. Farmer CJ, Hussell DJT, Mizrahi D. 2007. Detecting Population Trends in Migratory Birds of Prey. The Auk, 124:1047–1062. Farmer CJ, Smith JP. 2009. Migration Monitoring Indicates Widespread Declines of American Kestrels (Falco sparverius) in North America. Journal of Raptor Research, 43:263–273. Fish AM. 2003. Desperately Seeking Coops, the Urban Accipiter in Berkeley. Pacific Raptor Report 25. Golden Gate Raptor Observatory, SF, CA. Fuller MR, Seegar WS, Schueck LS. 1998. Routes and Travel Rates of Migrating Peregrine Falcons Falco peregrinus and Swainson’s Hawks Buteo swainsonii in the Western Hemisphere. Journal of Avian Biology, 29:433–440. Gessaman JA. 1979. Premigratory Fat in the American Kestrel. The Wilson Bulletin, 91:625–626. Goodman RE, Lebuhn G, Seavy NE, Gardali T, Bluso-Demers JD. 2011. Avian Body Size Changes and Climate Change: Warming or Increasing Variability? Global Change Biology, 18:63–73. Hedenstrom A, Alerstam T. 1998. How Fast Can Birds Migrate? Journal of Avian Biology, 29:424–432. Hoffman SW, Smith JP. 2003. Population Trends of Migratory Raptors in Western North American, 1977-2001. The Condor, 105:397–419.

!
!
21!
Hoffman SW, Smith JP, Meehan TD. 2002. Breeding Grounds, Winter Ranges, and Migratory Routes of Raptors in the Mountain West. Journal of Raptor Research, 36:97–110. Hull JM, Fish AM, Keane JJ, Mori SR, Sacks BN, Hull AC. 2010. Estimation of Species Identification Error: Implications for Raptor Migration Counts and Rrend Estimation. Journal of Wildlife Management, 74:1326–1334. Kerlinger P. 1989. Flight Strategies of Migrating Hawks. University of Chicago Press. King JR. 1972. Adaptive Periodic Fat Storage by Birds. Proceedings of the International Ornithological Congress, 15:200–217. Kooijman SALM. 1986. Energy Budgets Can Explain Body Size Relations. Journal of Theoretical Biology, 121:269–282. La Sorte FA, Fink D, Hochachka WM, Delong JP, Kelling S. 2013. Population-Level Scaling of Avian Migration Speed With Body Size and Migration Distance for Powered Fliers. Ecology, 94:1839–1847. Lindström Å, Piersma T. 1993. Mass Changes in Migrating Birds: the Evidence for Fat and Protein Storage Re-examined. Ibis, 135:70–78. Lindström J. 1999. Early Development and Fitness in Birds and Mammals. Trends in Ecology and Evolution, 14:343–348. Martin TE. 1987. Food as a Limit on Breeding Birds: A Life-History Perspective. Annual Review of Ecology and Systematics. p 453–487. McCarty K, Bildstein KL. 2005. Using Autumn Hawk Watch to Track Raptor Migration and to Monitor Populations of North American Birds of Prey. USDA Forest Service Gen. Tech. Rep. PSW-GTR-191. p 718-725. McClelland RB, Young LS, McClelland PT, Crenshaw JG, Allen HL, Shea DS. 1994. Migration Ecology of Bald Eagles from Autumn Concentration in Glacier National Park, Montana. Wildlife Monographs:3–61. Mika M, Neal MC, Hawks S. 2011. Fall 2011 Raptor Migration Studies in the Manzano Mountains of Central New Mexico. HawkWatch International, SLC, UT. Muggeo VMR. 2003. Estimating Regression Models with Unknown Break-Points. Statistics in Medicine. p. 3055–3071. Muggeo VMR. 2008. Segmented: an R Package to Fit Regression Models with Broken-Line Relationships. R News. p. 20–25.

!
!
22!
Murray M. 2011. Anticoagulant Rodenticide Exposure and Toxicosis in Four Species of Birds of Prey Presented to a Wildlife Clinic in Massachusetts, 2006–2010. Journal of Zoo and Wildlife Medicine, 42:88–97. Naim M, Noor HM, Kasim A, Abu J. 2010. Growth Performance of Nestling Barn Owls, Tyto alba javanica in Rat Baiting Area in Malaysia. ARPN Journal of Agricultural and Biological Science, 5:1–13. R Core Team. 2014. R: A Language and Environment for Statistical Computing. R Foundation for Statistical Computing, Vienna, Austria. URL http://www.R-project.org/. Rattner BA, Horak KE, Warner SE, Day DD, Meteyer CU, Volker SF, Eisemann JD, Johnston JJ. 2011. Acute Toxicity, Histopathology, and Coagulopathy in American kestrels (Falco sparverius) Following Administration of the Rodenticide Diphacinone. Environmental Toxicology and Chemistry, 30:1213–1222. Reisen WK. 2013. Ecology of West Nile Virus in North America. Viruses 5:2079–2105. Sauer JR, Hines JE, Fallon JE, Pardieck KL, Ziolkowski JDJ, Link WA. 2014. The North American Breeding Bird Survey, Results and Analysis 1966-2013. Version 01.30.2015. USFS Patuxent Wildlife Research Center. Sauer JR, Schwartz S, Hoover B. 1996a. Bird Count Home Page. Version 95.1. Patuxent Wildlife Research Center, Laurel, MD. Sauer JR, Schwartz S, Hoover B. 1996b. The Christmas Bird Count Home Page. Version 95.1. Patuxent Wildlife Research Center, Laurel, MD. Scharf FS, Juanes F, Rountree RA. 2000. Predator Size Prey Size Relationships of Marine Fish Predators: Interspecific Variation and Effects of Ontogeny and Body Size on Trophic-Niche Breadth. Marine Ecology Progress Series, 208:229–248. Sillett ST, Holmes RT. 2002. Variation in Survivorship of a Migratory Songbird Throughout its Annual Cycle. Journal of Animal Ecology, 71:296–308. Smallwood JA. 1989. Age Determination of American Kestrels: A Revised key. Journal of Field Ornithology, 60:510–519. Smallwood JA, Bird DM. 2002. American Kestrel (Falco sparverius), The Birds of North America Online. Ithaca: Cornell Lab Of Ornithology. Smallwood JA, Causey MF, Mossop DH, Klucsarits JR, Robertson B, Robertson S, Mason J, Maurer MJ, Melvin RJ, Dawson RD, et al. 2009. Why Are American Kestrel ( Falco sparverius ) Populations Declining in North America? Evidence from Nest-Box Programs. Journal of Raptor Research.

!
!
23!
Stansley W, Cummings M, Vudathala D, Murphy LA. 2014. Anticoagulant Rodenticides in Red-tailed hawks, Buteo jamaicensis, and Great Horned Owls, Bubo virginianus, from New Jersey, USA, 2008-2010. Bulletin of Environmental Contamination and Toxicology, 92:6–9. Storer RW. 1966. Sexual Dimorphism and Food Habits in Three North American Accipiters. The Auk, 83:423–436. Stout WE, Rosenfield RN. 2010. Colonization, Growth, and Density of a Pioneer Cooper’s Hawk Population in a Large Metropolitan Environment. Journal of Raptor Research, 44:255–267. Van Buskirk J, Mulvihill RS, Leberman RC. 2010. Declining Body Sizes in North American Birds Associated with Climate Change. Oikos, 119:1047–1055. Viverette CB, Struve S, Goodrich LJ, Bildstein KL. 1996. Decreases in Migrating Sharp-Shinned Hawks (Accipiter Striatus) At Traditional Raptor-Migration Watch Sites in Eastern North America. The Auk, 113:32–40. White CM, Clum NJ, Cade TJ, Hunt WG. 2002. Peregrine Falcon (Falco peregrinus), The Birds of North America Online. Ithaca: Cornell Lab Of Ornithology.

!
!
24!
Table 1. List of potential causes of American kestrel declines and the effect each
potential cause could have on population and body size. Up and down arrows indicate
positive and negative effects, respectively. Circle indicates no effect, and question mark
indicates that effect is unknown.
Potential!cause!for!decline! Effect!on!population! Effect!on!body!size!
West!Nile!Virus! ↓! ⦰!
Rodenticide!poison! ↓! ↓!
Climate! ?! ↓↑!
Predators! ↓! ↓↑!
Food/habitat!decrease! ↓! ↓!
!

!
!
25!
Figure 1. A. Food needed during breeding season affects the number of eggs in a clutch,
the growth of nestlings, and fledgling success. B. Available food during fall migration
influences fat reserves, mass, and survival during spring migration.
!
!
!
!!
Spring'Migra*on
Fall'Migra*on'
Winter'
Courtship'
Incuba*on'
Breeding'
Nestling'
Fledgling'B.'
A.'

! 26!
!
!
!
Figure 2. Fall migration station locations (black dots). The major raptor flyways from
west to east (shaded areas): A. Pacific Coast, B. Intermountain, C. Southern Rocky
Mountain, D. Mississippi, E. Atlantic Coast.!!
Golden'Gate''Raptor'Observatory'
Goshute''Mountains'
Manzano'Mountains'
Intermountain'Bird'Observatory' Hawk'Ridge'Bird'Observatory' Hawk'Mountain'Sanctuary''
Cape'May''Bird'Observatory'
A B D C E

!
!
27!
!Figure 3. RpH (row 1), mass (row 2), and wing chord (row 3) graphs during period of population decline with 95% confidence
intervals. Columns A-E are sites as follows: A: Cape May Raptor Banding Project, NJ. B: Hawk Mountain Sanctuary, PA. C: Hawk
Ridge Bird Observatory, MN. D: Manzano Mountains, NM. E: Goshute Mountains, NV. F: Lucky Peak, ID. G: Golden Gate Raptor
Observatory, CA. Row 1: RpH, 2: Mass (g), 3: Wing Chord (mm). Unknown males represented by a solid line, juvenile females
represented by a dotted line, adult females represented by a dotted line with 95% confidence intervals.
510
1520
2530
0.20.30.40.50.60.70.80.9
1.0
1.5
2.0
2.5
3.0
3.5
95100
110
120
130
95100
110
120
130
95100
110
120
130
1970 1980 1990 2000 2010
180
185
190
195
200
1980 1990 2000 2010
180
185
190
195
200
180
185
190
195
200
2000 2003 2006 2009 2012
0.5
1.0
1.5
2.0
12
34
5
1.0
1.5
2.0
2.5
3.0
95100
110
120
130
95100
110
120
130
95100
110
120
130
180
185
190
195
200
1996 2000 2004 2008 2012
180
185
190
195
200
1997 2001 2005 2009 2013 1995 2000 2005 2010 2015
180
185
190
195
200
0.6
0.8
1.0
1.2
1.4
0.6
0.8
1.0
1.2
1.4
0.6
0.8
1.0
1.2
1.4
95100
110
120
130
0.6
0.8
1.0
1.2
1.4
0.6
0.8
1.0
1.2
1.4
180
185
190
195
200
2002 2005 2008 2011 2014
A C B D E G F
1
2
3
Year

!
!
28!
Figure 4. Change in average wing pit fat score at the (A) Manzano Mountains and (B)
Goshute Mountains with 95% confidence intervals.
1.0
1.2
1.4
1.6
1997 1999 2001 2003 2005 2007 2009 2011 2013
0.6
0.8
1.0
1.2
1.4
1.6
1.8
1996 1998 2000 2002 2004 2006 2008 2010 2012
A B
Year
Juvenile Female
Adult Female
Unknown Male
Ave
rage
Fat
Sco
re

!
!
29!
Table 2: Summary of sites, years available, and declines for seven sites across North
America. Years refer to the span of time for which both banding and count data were
available. Year declines detected are the beginning of the data window, if declines were
apparent the entire time or the beginning of the decline as detected by breakpoint
regression (see text).
Site Years Year declines detected
Decline % per 10 yrs
Decline p-value
Cape May 1976-2015 1976 20.2% <0.001
Hawk Mountain 1979-2015 1979 12.6% <0.001
Hawk Ridge 1972-2015 2000 37.5% <0.006
Manzano Mountains 1985-2014 1996 38.7% <0.001
Goshute Mountains 1983-2014 1997 42.7% <0.001
Lucky Peak 1994-2015 1994 20.6% 0.001
Golden Gate Raptor Observatory
1989-2015 2002 35.7% 0.001

!
!
30!
Table 3a. Summary of changes in mass (g) and wing chord (mm) from seven sites, during
periods of decline determined by the breakpoint regression. (*) indicates that the model
included a two way interaction. See Table 3b. for output tables.
Mass changes per 10 years Wing chord changes per 10 years
Site Years Slope g/yr % Gram p-val Slope
mm/yr % mm p-val
Cape May
1969-2014 -0.11
0.8% -
0.9% 1 g <0.001 -0.03 0.1% -
0.4%
0.3 - 0.7 mm
0.4*
Hawk Mt.
1979-2014 -0.3
2.2% -
2.4% 2.7 g 0.01 -0.01 0.04% 0.08
mm 0.9
Hawk Ridge
2000-2014 0.08
0.6% -
0.7% 0.7 g 0.34 0.14 0.7% 1.2
mm 0.009
Manzano Mts.
1996-2014 -0.12 0.9%
-1% 1.1 g 0.09 -0.09 0.5% 0.9mm 0.04
Goshute Mts.
1997-2014 -0.17
1.3% -
1.5% 1.5 g <0.0002* -0.06 0.3% 0.5
mm 0.03
Lucky Peak
1994-2015 -0.10
0.7% -
0.8% .9 g 0.0002 -0.04 0.2% 0.4
mm 0.008
GGRO 2002-2015 -0.11 0.9%
- 1% 1 g 0.12* 0.09 0.4% 0.8mm 0.09

!
!
31!
Table 3b. Summary of changes in mass or wing chord from models with a two way
interaction after the breakpoint regression with change in size as percent and
measurement.
Site Mass or WC Interaction Slope % Size change p-val
Cape May Wing Chord Year: J F -0.08 mm/yr 0.52 1 mm 0.02 Goshute Mts. Mass J F: Julian Date -0.18 g/yr 1.3 1.5 g 0.006
GGRO Mass J F: Julian Date -0.13 g/yr 0.89 1 g 0.02

!
!
32!
Table 4. Summary of changes in wing pit fat output table after the determined breakpoint
with slope, p-value and the change in score per 10 year interval.
Site Years Slope Score Change p-val
Manzano Mts. 1996-2013 0.03 0.23 0.0008
Goshute Mts. 1997-2014 -0.008 0.08 0.03

!
!
33!
Table 5. Model used for each site for RpH, mass, wing chord, and wing pit fat (Manzano
Mountains and Goshute Mountains only) during the period of decline.
Site Response After
Cape May
RpH lm(RpH ~ Year)
Mass lm(Mass ~ Year + Age + Julian Date)
Wing Chord lm(Wing Chord ~ Year + Age + Year*Age +
Julian Date)
Hawk Mt.
RpH lm(RpH ~ Year)
Mass lm(Mass ~ Year + Sex)
Wing Chord lm(Wing Chord ~ Year + Sex)
Hawk Rd
RpH lm(RpH ~ Year)
Mass lm(Mass ~ Year + Age)
Wing Chord lm(Wing Chord ~ Year + Age)
Manzano Mts.
RpH lm(RpH ~ Year)
Mass lm(Mass ~ Year + Age + Julian Date)
Wing Chord lm(Wing Chord ~ Year + Age)
Fat lm(Wing Fat ~ Year + Age + Julian Date)
Goshute Mts.
RpH lm(RpH ~ Year)
Mass lm(Mass ~ Year + Age + Julian Date +
Age*Julian Date)
WC lm(Wing Chord ~ Year + Age)
Fat lm(Wing Fat ~ Year + Age + Julian Date)
Lucky Peak
RpH lm(RpH ~ Year)
Mass lm(Mass ~ Year + Sex)
WC lm(Wing Chord ~ Year + Sex + Julian Date)
GGRO
RpH lm(RpH ~ Year)
Mass lm(Mass ~ Year + Age + Julian Date +
Age*Julian Date)
WC lm(Wing Chord ~ Year + Age + Julian Date)

!
!
34!
Appendix (Supporting Information)
Table S1: Size parameters for each site using 3 SD from the mean mass, mean wing
chord, Julian dates, and sample size for each migration season.
Mass Wing Chord
Site Julian Date Male Female Male Female n
Cape May 226-302 80-140 88-147 163-200 170-207 5194
Hawk Mt. 243-301 80-135 85-140 170-210 172-210 101
Hawk Ridge 227-319 80-135 85-140 170-210 175-213 1750
Manzano Mts. 227-319 85-125 90-137 175-200 180-210 616
Goshute Mts. 227-319 80-130 82-142 170-210 175-213 3201
Lucky Peak 226-302 80-130 90-155 163-210 175-215 3012
GGRO 213-344 80-135 90-140 170-200 175-217 1265

!
!
35!
Table S2. Slope of RpH before and after determined breakpoint with standard errors, t-
values, upper and lower 95% confidence intervals for Hawk Ridge, Manzano Mountains,
Goshute Mountains, Golden Gate Raptor Observatory.
Site Breakpoint Estimate SE t-value CI 95 Lower CI 95 Upper
Hawk Ridge
Before 2000 0.077 0.015 5.07 0.046 0.11
After 2000 -0.13 0.035 -3.59 -0.2 -0.055
Manzano Mts.
Before 1996 0.012 0.024 0.48 -0.038 0.062
After 1996 -0.049 0.011 -4.61 -0.071 -0.027
Goshute Mts.
Before 1997 0.22 0.05 4.44 0.12 0.32
After 1997 -0.2 0.034 -5.78 -0.27 -0.13
GGRO
Before 2000 0.032 0.015 2.14 0.00091 0.063
After 2000 -0.052 0.017 -3.1 -0.087 -0.017

!
!
36!
Table S3 A - G. Output tables from models with response variables RpH, Mass, Wing
chord, estimates, standard errors, t and p values, F-statistic, multiple R-squared, adjusted
r-squared, f-statics and p-values for each model. Significant p-values are in bold.
A. Cape May Point, NJ.
Term Estimate SE t-value p -value
RpH
(Intercept) RpH 872.6 120.0 7.3 <0.0001 Year -0.4 0.1 -7.2 <0.0001
F-statistic: 51.62 on 1 and 38 DF Multiple R-squared: 0.576 Adjusted R-squared: 0.5648 F-statistic: 51.62 on 1 and 38 DF p-value: 1.386e-08
Mass
(Intercept) Adult Female 312.1 22.0 14.2 <0.0001 Year -0.1 0.0 -10.1 <0.0001
Juvenile Female -1.4 0.5 -2.5 0.01 Male -12.3 0.5 -23.5 <0.0001
Julian Date 0.1 0.0 11.7 <0.0001 Residual standard error: 9.015 on 5173 degrees of freedom Multiple R-squared: 0.2769 Adjusted R-squared: 0.2764 F-statistic: 495.3 on 4 and 5173 DF p-value: < 2.2e-16
Wing Chord
(Intercept) Adult Female 252.8 64.4 3.9 0.00009 Year 0.0 0.0 -0.9 0.36
Juvenile Female 162.8 67.0 2.4 0.015 Male 97.6 66.8 1.5 0.14
Julian Date 0.0 0.0 -3.0 0.003 Year: Juvenile Female -0.1 0.0 -2.4 0.016
Year: Male -0.1 0.0 -1.6 0.12 Residual standard error: 5.163 on 5171 degrees of freedom Multiple R-squared: 0.3859 Adjusted R-squared: 0.3852 F-statistic: 541.5 on 6 and 5171 DF p-value: < 2.2e-16
!
!
37!
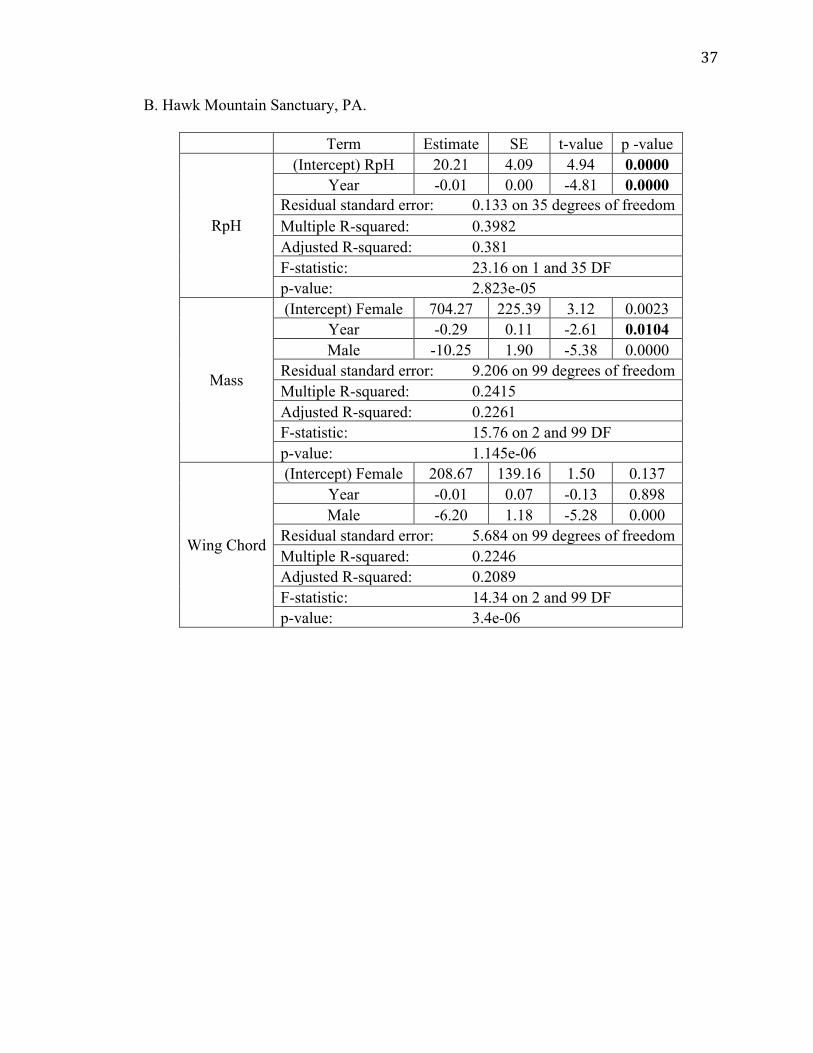
B. Hawk Mountain Sanctuary, PA.
Term Estimate SE t-value p -value
RpH
(Intercept) RpH 20.21 4.09 4.94 0.0000 Year -0.01 0.00 -4.81 0.0000
Residual standard error: 0.133 on 35 degrees of freedom Multiple R-squared: 0.3982 Adjusted R-squared: 0.381 F-statistic: 23.16 on 1 and 35 DF p-value: 2.823e-05
Mass
(Intercept) Female 704.27 225.39 3.12 0.0023 Year -0.29 0.11 -2.61 0.0104 Male -10.25 1.90 -5.38 0.0000
Residual standard error: 9.206 on 99 degrees of freedom Multiple R-squared: 0.2415 Adjusted R-squared: 0.2261 F-statistic: 15.76 on 2 and 99 DF p-value: 1.145e-06
Wing Chord
(Intercept) Female 208.67 139.16 1.50 0.137 Year -0.01 0.07 -0.13 0.898 Male -6.20 1.18 -5.28 0.000
Residual standard error: 5.684 on 99 degrees of freedom Multiple R-squared: 0.2246 Adjusted R-squared: 0.2089 F-statistic: 14.34 on 2 and 99 DF p-value: 3.4e-06

!
!
38!
C. Hawk Ridge Bird Observatory, MN.
Term Estimate SE t-vale p-value
RpH
(Intercept) RpH 3.03 0.35 8.76 <0.0001 Year -0.13 0.04 -3.22 0.0062
Residual standard error: 0.7232 on 14 degrees of freedom Multiple R-squared: 0.4252 Adjusted R-squared: 0.3842 F-statistic: 10.36 on 1 and 14 DF p-value: 0.006191
Mass
(Intercept) Adult Female 119.43 1.84 64.85 <0.0001 Year 0.08 0.08 0.95 0.34
Juvenile Female -7.56 1.84 -4.11 0.00005 Male -17.25 1.83 -9.45 0.0000
Residual standard error: 7.262 on 432 degrees of freedom Multiple R-squared: 0.3546 Adjusted R-squared: 0.3501 F-statistic: 79.1 on 3 and 432 DF p-value: < 2.2e-16
Wing Chord
(Intercept) Adult Female 188.78 1.20 156.92 0.0000 Year 0.14 0.05 2.64 0.009
Juvenile Female 1.84 1.20 1.53 0.13 Male -6.51 1.19 -5.46 0.0000
Residual standard error: 4.743 on 432 degrees of freedom Multiple R-squared: 0.4372 Adjusted R-squared: 0.4333 F-statistic: 111.8 on 3 and 432 DF p-value: < 2.2e-16

!
!
39!
D. Manzano Mountains, NM.
Term Estimate SE t-value p-value
RpH
(Intercept) RpH 1.33 0.10 13.26 <0.0001 Year -0.06 0.01 -6.01 0.00001
Residual standard error: 0.2268 on 17 degrees of freedom Multiple R-squared: 0.6799 Adjusted R-squared: 0.6611 F-statistic: 36.11 on 1 and 17 DF p-value: 1.409e-05
Mass
(Intercept) Adult Female 63.70 8.74 7.29 <0.0001 Year -0.12 0.07 -1.69 0.09
Juvenile Female -4.42 1.50 -2.95 0.003 Male -14.23 1.39 -10.25 <0.0001
Julian Date 0.20 0.03 6.16 <0.0001 Residual standard error: 6.914 on 469 degrees of freedom Multiple R-squared: 0.3517 Adjusted R-squared: 0.3462 F-statistic: 63.6 on 4 and 469 DF p-value: < 2.2e-16
Wing Chord
(Intercept) Adult Female 198.88 0.98 203.84 <0.0001 Year -0.10 0.05 -2.11 0.036
Juvenile Female -1.46 1.02 -1.42 0.16 Male -9.19 0.96 -9.60 <0.0001
Residual standard error: 4.769 on 470 degrees of freedom Multiple R-squared: 0.383 Adjusted R-squared: 0.379 F-statistic: 97.24 on 3 and 470 DF p-value: < 2.2e-16

!
!
40!
E. Goshute Mountains, NV.
Term Estimate SE t-value p-value
RpH
(Intercept) RpH 4.15 0.34 12.23 <0.0001 Year -0.20 0.03 -5.78 0.00003
Residual standard error: 0.7505 on 16 degrees of freedom Multiple R-squared: 0.6765 Adjusted R-squared: 0.6563 F-statistic: 33.47 on 1 and 16 DF p-value: 2.79e-05
Mass
(Intercept) Adult Female 40.68 13.72 2.96 0.003 Year -0.17 0.04 -3.77 0.00017
Juvenile Female 41.36 16.62 2.49 0.01 Male -13.87 14.92 -0.93 0.35
Julian Date 0.30 0.05 5.57 <0.0001 Juvenile Female : Julian Date -0.18 0.07 -2.77 0.006
Male : Julian Date 0.00 0.06 -0.05 0.96 Residual standard error: 8.049 on 1521 degrees of freedom Multiple R-squared: 0.3472 Adjusted R-squared: 0.3446 F-statistic: 134.8 on 6 and 1521 DF p-value: < 2.2e-16
Wing Chord
(Intercept) Adult Female 196.72 0.48 413.44 <0.0001 Year -0.06 0.03 -2.16 0.03
Juvenile Female 0.52 0.49 1.07 0.29 Male -7.81 0.47 -16.74 <0.0001
Residual standard error: 5.041 on 1524 degrees of freedom Multiple R-squared: 0.402 Adjusted R-squared: 0.4008 F-statistic: 341.5 on 3 and 1524 DF p-value: < 2.2e-16

!
!
41!
F. Lucky Peak, ID.
Term Estimate SE t-value p-value
RpH
(Intercept) RpH 132.87 34.70 3.83 0.001 Year -0.07 0.02 -3.77 0.0012
Residual standard error: 0.5152 on 20 degrees of freedom Multiple R-squared: 0.415 Adjusted R-squared: 0.3857 F-statistic: 14.19 on 1 and 20 DF p-value: 0.001214
Mass
(Intercept) Female 320.50 53.70 5.97 <0.0001 Year -0.10 0.03 -3.71 0.0002 Male -11.78 0.31 -37.64 <0.0001
Residual standard error: 8.705 on 3184 degrees of freedom Multiple R-squared: 0.3092 Adjusted R-squared: 0.3088 F-statistic: 712.6 on 2 and 3184 DF p-value: < 2.2e-16
Wing Chord
(Intercept) Female 283.58 31.31 9.06 <0.0001 Year -0.04 0.02 -2.65 0.0080 Male -7.45 0.18 -41.23 <0.0001
Julian Date -0.02 0.01 -2.63 0.009 Residual standard error: 4.942 on 3183 degrees of freedom Multiple R-squared: 0.362 Adjusted R-squared: 0.3614 F-statistic: 602.1 on 3 and 3183 DF p-value: < 2.2e-16
!
!
42!
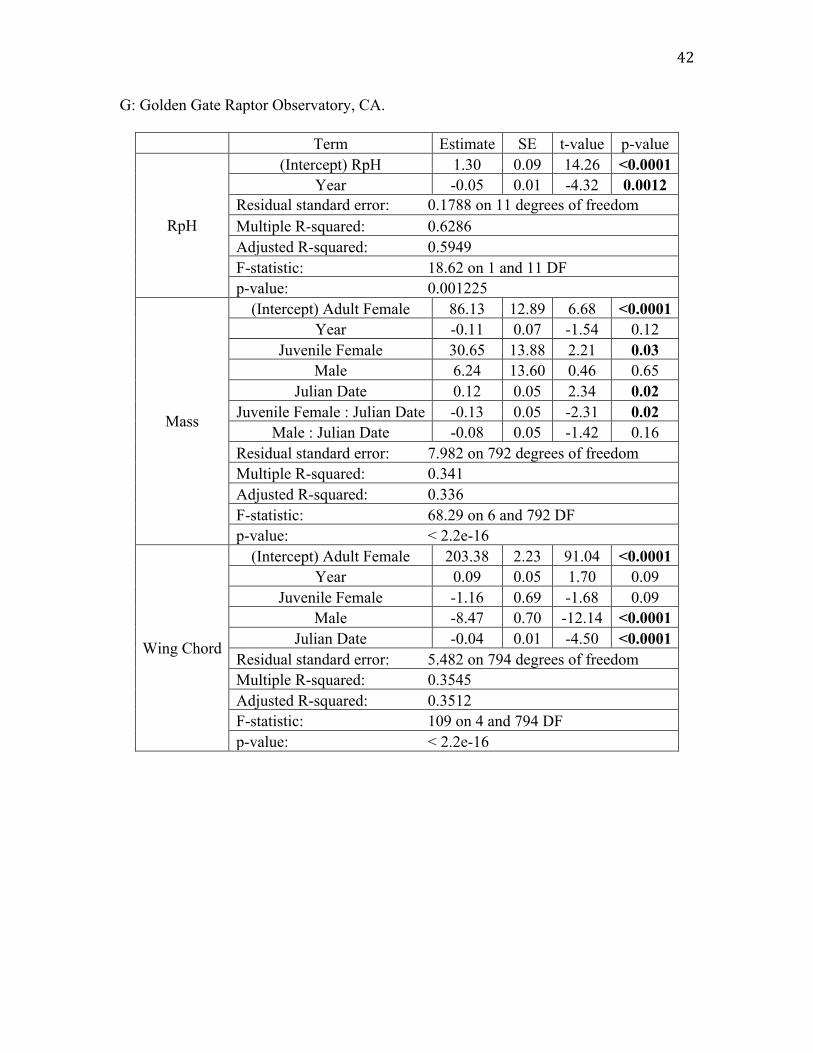
G: Golden Gate Raptor Observatory, CA.
Term Estimate SE t-value p-value
RpH
(Intercept) RpH 1.30 0.09 14.26 <0.0001 Year -0.05 0.01 -4.32 0.0012
Residual standard error: 0.1788 on 11 degrees of freedom Multiple R-squared: 0.6286 Adjusted R-squared: 0.5949 F-statistic: 18.62 on 1 and 11 DF p-value: 0.001225
Mass
(Intercept) Adult Female 86.13 12.89 6.68 <0.0001 Year -0.11 0.07 -1.54 0.12
Juvenile Female 30.65 13.88 2.21 0.03 Male 6.24 13.60 0.46 0.65
Julian Date 0.12 0.05 2.34 0.02 Juvenile Female : Julian Date -0.13 0.05 -2.31 0.02
Male : Julian Date -0.08 0.05 -1.42 0.16 Residual standard error: 7.982 on 792 degrees of freedom Multiple R-squared: 0.341 Adjusted R-squared: 0.336 F-statistic: 68.29 on 6 and 792 DF p-value: < 2.2e-16
Wing Chord
(Intercept) Adult Female 203.38 2.23 91.04 <0.0001 Year 0.09 0.05 1.70 0.09
Juvenile Female -1.16 0.69 -1.68 0.09 Male -8.47 0.70 -12.14 <0.0001
Julian Date -0.04 0.01 -4.50 <0.0001 Residual standard error: 5.482 on 794 degrees of freedom Multiple R-squared: 0.3545 Adjusted R-squared: 0.3512 F-statistic: 109 on 4 and 794 DF p-value: < 2.2e-16
!

! 43!
CHAPTER 2: Geographic Variation in Morphology of the American Kestrel
(Falco sparverius) Across North America.
ABSTRACT
We assessed geographical variation in American kestrel mass, wing chord, sexual
size dimorphism, and wing loading index across seven fall migration sites. Although
previous research suggested that eastern kestrels are larger than western kestrels, our
results suggest a more complex pattern of variation. To address the potential for limited
east-west gene flow to influence patterns of variation, we tested whether the magnitude of
longitudinal distance between sites was related to the magnitude of differences in kestrel
morphology between sites. Wing chord differed between sites to a greater extent when
sites were farther apart, but there was no effect of longitudinal distance between sites on
differences in body mass. This differential pattern suggests that wing chord and body
mass vary across North America in response to different processes, even though wing
chord and body mass are generally correlated with each other. Selective forces may drive
variation in body size, and thus sexual size dimorphism and wing loading, across sites,
while variation in wing chord may also be linked to genetic drift.
INTRODUCTION
Geographic variation in body size and morphology could reflect variation in the
ecological and evolutionary processes that determine these traits (Mitchell-Olds et al.
2007). For example, species from more distant or isolated geographic regions may exhibit
greater longitudinal divergence in body size resulting from reduced gene flow between

! 44!
populations (Chakraborty & Nei 1982; Storz 2002; González et al. 2011). Alternatively,
regional variation in selective pressures may drive variation in morphology between
regions (Johansson et al. 1998; Edelaar et al. 2008). Given the importance of body size in
determining ecological and evolutionary processes (Calder 1984; Peters 1986),
understanding geographic variation in size and morphology can inform our understanding
of variation in ecological processes in different regions. Variation in body size and
morphology is expected to periodically undergo selection and is generally assumed to
represent adaptation to local environments, but the degree to which this variation occurs
is still poorly understood (Wigginton & Dobson 1999; Stillwell & Fox 2009).
Evolutionary pressures influencing body size are now changing as the climate
responds to greenhouse gas inputs (IPCC 2001). Although some species are able to cope
with changing environments by moving to new locations (Parmesan et al.1999), others
may display flexibility in traits that enable them to maintain fitness in the face of change
(Bell & Gonzalez 2009). In particular, changes in body size and morphology are
becoming a common response to climate change, specifically warming temperatures
(Ozgul et al. 2010; Goodman et al. 2011; Sheridan & Bickford 2011; DeLong 2012).
Developing a clear baseline about current geographic variation in size could facilitate
understanding future changes in body size of widespread species.
Many avian species with widespread geographic distributions show
morphological variation, including raptors such as sharp-shinned hawks (Accipiter
striatus), cooper’s hawks (Accipiter cooperii), northern goshawks (Accipiter gentilis),
red-tailed hawks (Buteo jamaicensis) (Johansson 1998 ; Hull et al. 2008; Smith et al.
2013), great horned owls (Bubo virginianus), flammulated owls (Otus flammeolus)

! 45!
(McGillivray 1989; Smith et al. 2011), passeriformes (Gardner et al. 2014), and
Anseriformes (Larsson & Forslund 1991). There are some general patterns in this
geographic variation. For example, raptors in the western parts of North America often
show significantly longer wings and tails than conspecifics from eastern flyways
(Pearlstine & Thompson 2004), and inland migrants tend to have lower flight-surface
loading compared to coastal conspecifics (Smith et al. 1990).
American kestrels (Falco sparverius) are the smallest North American falcon and
can be found in many habitats throughout North America south of the arctic tree line
(Clark & Wheeler 2001). Kestrels show geographic variation in morphology, including
body mass (Pearlstine & Thompson 2004). Previous studies have focused on data
collected at only a few migration flyways such as Cape May Point, Goshute Mountains,
Manzano Mountains, and have not included kestrel populations from the west coast or
mid-west in their analysis. Furthermore, kestrel populations have been declining since the
mid-1990s, and kestrels have shown concomitant changes in body mass and wing chord
in most locations across North America (Ely et al. (in prep.), Chapter 1).
Here we use a continental-scale, multi-decadal database on kestrels captured
during fall migration to evaluate regional patterns of body size, wing chord, sexual size
dimorphism, and wing loading in kestrels. We also test the hypothesis that differences in
size across the continent might have arisen through random divergence, which would be
supported by a negative correlation between distance in space and difference in size.

! 46!
MATERIALS AND METHODS
Study Sites
Kestrel banding data came from the study sites described in Chapter l (Figure 2;
Ely et al. 2016) and include Golden Gate Raptor Observatory, Intermountain Bird
Observatory, HawkWatch International, Hawk Ridge Bird Observatory, Hawk Mountain
Sanctuary, and Cape May Raptor Banding Project ( Viverette et al. 1996; Farmer &
Smith 2009; Hull et al. 2010; Evans et al. 2012). Kestrels pass through these sites during
fall migration from northern breeding areas to southern wintering grounds. Thus, birds
from the different sampling sites vary in their longitudinal origin, though the latitudinal
origin of the birds is unknown. We analyzed all data available over the entire period.
Data collection
Kestrels were trapped, banded, and measured using the methods described in Ely
Chapter 1. The data were cleaned by removing birds with a crop score above ½ and birds
where wing chord and body mass measurements were greater than 3 SD of the mean
mass and wing chord measurements for each sex (Table 2). Only the first encounter
measurements of an individual during a season were used in analysis. We report the mean
mass and wing chord differences between males and females at each site (Table 2).
Although adult kestrels tend to be heavier than juveniles, HY (Hatch year), AHY (After
hatch year), SY (Second year), and ASY (After second year) were grouped together for
this study because we were interested in the regional patterns rather than how they differ
between ages. Male and female kestrels were sexed by wing and tail color (Clark &
Wheeler 2001).
! 47!
Data analysis
We used two-way analysis of variance (ANOVA) to test for differences in the
mass and wing chord of kestrels among sites and sex (Table 1). We then used a post-hoc
Tukey HSD (honest significant difference) test to determine significant differences
between all pair-wise site and sex combinations (Table 3 and 4). The differences in
longitude between each site were calculated by subtracting the longitudinal minutes, with
the more western site subtracted from the eastern site so that the difference was negative
(Table 3).
We then used linear regression to assess whether wing chord and mass differed to
a greater extent when longitudinal differences were greater, suggesting random
divergence in size across kestrel populations. The response variable was mass or wing
chord and the predictor variable was longitudinal difference (Table 5).
The degree of sexual size dimorphism (SSD) for each site was calculated as the
within-site ratio of the average male and female mass and wing chord. Standard errors
were computed with the pooled standard error for males and females as follows (Figure
1; Ku 1966): (!"!! )! + (!"!! )!.
Wing loading is the ratio of total wing and tail area to body mass. In the absence
of measurements of total wing area and tail, we used the wing loading index of Temple
(1972), which is strongly correlated with wing loading. We calculated the wing loading
index by dividing the cube root of body mass by wing chord. We used ANOVA (Table 1)
to test for differences between sites and used a post-hoc Tukey HSD test to identify
significant differences between all pair-wise site and sex combinations.

! 48!
RESULTS
Kestrel mass differed significantly among sites, sexes, and the interaction between
site and sex, as seen in Table 1. The female kestrels at Lucky Peak were 8% to 9% larger,
and males were 6% larger than those of the same sex at Hawk Ridge, Manzano
Mountain, and the Goshute Mountain sites. Female birds from Lucky Peak and Cape
May Point were 5% and 3% larger, and, males were 3% larger than the birds found at
Hawk Mountain and Golden Gate Raptor Observatory (Figure 1).
Wing chord also differed between sites and sexes (Table 1, Figure 1), but the
interaction of site and sex was not significant. Female and male wing chords at the
Manzano Mountains were approximately 1% longer than those at Lucky Peak and the
Goshute Mountains. Wing chords in the Manzano Mountain were approximately 2%
longer than those at Golden Gate, and approximately 3% longer than for birds at Hawk
Ridge, Hawk Mountain, and Cape May.
Wing loading index differed between sites and sexes (Table 1; Figure 4). Wing
loading index was higher in females than males across sites (p <0.0001). Overall, kestrels
at Cape May Point and Lucky Peak had the highest wing loading index (p <0.0001),
while kestrels in the Manzano and Goshute Mountains had the lowest wing loading index
(p < 0.0001) (Table 6).
As a result of variation in male and female wing chord and body size across sites,
sexual size dimorphism (SSD) also varied across sites (Figure 1), but the pattern of
spatial variation in SSD was not the same for wing chord and body mass. SSD for mass
was greatest in the two western most sites, Golden Gate Raptor Observatory and Luck
Peak. The other five states had lower but similar SSD for mass. Wing chord SSD was

! 49!
similar for all seven sites (Figure 1). Variation in body mass was not associated with how
far apart sampling locations were from each other (Table 5; Figure 2). In contrast,
differences in wing chord across sites were larger the farther the sites were from each
other (Table 5; Figure 2).
DISCUSSION
American kestrels showed variation in mass, wing chord, sexual size dimorphism,
and wing loading index across flyways in North America. Patterns of variation across
sites, however, were different for mass and wing chord. This variation in morphological
traits could be linked to different climates, food resources, or migration strategies used
across North America (Kerlinger 1989; Smith et al. 1990; DeLong et al. 2005; Hull et al.
2008). Alternatively, phenotypic variation across large spatial scales could arise through
random divergence, where the farther apart populations are, the less chance there is for
gene flow and the greater the resulting differences (Mitchell-Olds et al. 2007). We tested
for such a relationship between longitudinal distance and the difference in mass or wing
chords between sites and found that more spatially separated populations of kestrels
showed greater divergence in wing chord but not body mass. As both wing chord and
body mass are highly heritable (Brown & Brown 2013), this result suggests that wing
chord variation arises in part due to genetic drift, while body size may be under more
regional selection. However, because both wing chord and body size respond to variation
in energetic conditions during growth, the differences might also reflect phenotypically
plastic responses to conditions across longitude.

! 50!
Body size may evolve in response to temperature, resource availability, and
predation risk (Goodman et al. 2011; Lima 1986; Yom-Tov & Yom-Tov 2006).
Unfortunately, migration sites sample migrating birds originating to the north of the sites,
so the latitudinal origin of these kestrels is unknown. As such, breeding areas of the
kestrels used in our study are unknown, and it is difficult to assess how any of these
factors actually affect body mass variation across sites. However, it is possible to use
differential wing loading, which is correlated with body mass, to infer something about
different kestrel populations.
Wing loading is especially important for raptors that spend substantial time in the
air and capture prey in flight (Mueller et al. 2002), and travel long migratory distances.
Birds that use coastal flyways have different flight strategies than birds that use flyways
through inland regions (Mueller et al. 1981; Smith et al. 1990; Mueller et al. 2002). The
kestrels found moving along coastal migration sites, Cape May, N.J., and Golden Gate
Raptor Observatory, CA, are generally heavier and shorter winged, and have heavier
wing loading. Birds with heavier wing loading have increased maneuverability (Mueller
et al. 1981), which aids in flying through forested areas typical of these regions. Kestrels
that migrate through the central North America or Great Basin region, such as the
Goshute Mountains and Manzano Mountains, are typically longer winged, weigh less,
and have lighter wing loading. Birds with light wing loading can glide more slowly and
rise more rapidly with updrafts, which are common in the open, warm, and dry
Intermountain West. We expect to see birds in the Intermountain and Southern Rockies
flyways with light wing loading because regions with vast deserts lined by mountains

! 51!
should have increased updrafts and thermal patterns (Smith et al. 1990; Hoffman &
Smith 2003).
Raptors generally show reversed sexual size dimorphism where the male is
smaller than the female (Reynolds 1972). Our results show that kestrel variation in sexual
size dimorphism across regions takes on different patterns for mass and wing chord.
Kestrels at the two most western sites show greater dimorphism in mass than birds east of
the Rocky Mountains, but the sexual size dimorphism in wing chord is similar across the
sites, which may be consistent with the idea of random divergence in wing chord but
selective forces operating on body mass. There are many hypotheses about the origin of
reversed sexual size dimorphism (Reynolds 1972). For example, females may be under
selection to be larger to prevent the occurrence of filicidal behavior by the male (Brown
& Amadon 1968). Alternatively, sexual size dimorphism might have arisen as an
adaptation that reduces intraspecific competition (Reynolds 1972). Although it is still not
understood what drives SSD in general, our results indicate that the mechanisms may
vary in magnitude regionally.
Our research provides a new perspective on the geographical variation of
American kestrel mass and wing chord. Previous studies suggest that raptors found in
eastern North America are generally larger than western birds, but we show some regions
in the west have larger birds and birds with longer wing chord. Most importantly, the
interacting forces acting on body mass and wing chord across the continent have
generated a complex pattern of variation in sexual size dimorphism and wing loading that
remains poorly understood.

! 52!
ACKNOWLEDGEMENTS
I thank Christopher W. Briggs, Allen M. Fish, Shawn E. Hawks, Markus Mika,
Gregory S. Kaltenecker, Dave L. Evans, Frank J. Nicoletti, Jean-Francois Therrien, Paul
A. Napier, and all the hard working raptor banders and counters, volunteers, and staff that
helped collect data over the last five decades and beyond. This paper would not have
been possible without the data from Cape May Raptor Banding Project, HawkWatch
International, Golden Gate Raptor Observatory, Intermountain Bird Observatory, Hawk
Ridge Bird Observatory, and Hawk Mountain Sanctuary.
REFERENCES
Bell G, Gonzalez A. 2009. Evolutionary Rescue Can Prevent Extinction Following Environmental Change. Ecology Letters, 12:942–948. Brown CR, Brown MB. 2013. Where Has All The Road Kill Gone? Current Biology, 23:R233–R234. Calder WA. 1984. Size, Function, and Life History. Courier Corporation. Chakraborty R, Nei M. 1982. Genetic Differentiation of Quantitative Characters Between Populations of Species. Genetics Research, 39:303–314. Clark WS, Wheeler BK. 2001. A Field Guide to Hawks of North America. Houghton Mifflin Harcourt. DeLong JP. 2012. Experimental Demonstration of a “ Rate – Size ” Trade-Off Governing Body Size Optimization. Evolutionary Ecology Research, 14:343–352. DeLong JP, Cox SW, Cox NS. 2005. A Comparison of Avian Use of High- and Low-Elevation Sites During Autumn Migration in Central New Mexico. Journal of Field Ornithology, 76:326–333. Edelaar P, Siepielski AM, Clobert J. 2008. Matching Habitat Choice Causes Directed Gene Flow: A Neglected Dimension in Evolution and Ecology. Evolution, 62:2462–2472.

! 53!
Evans DL, Niemi GJ, Etterson MA. 2012. Autumn Raptor Banding at Hawk Ridge, Duluth, Minnesota U.S.A., 1972–2009: An Overview. Journal of Raptor Research, 46:36–49. Farmer CJ, Smith JP. 2009. Migration Monitoring Indicates Widespread Declines of American Kestrels (Falco sparverius) in North America. Journal of Raptor Research, 43:263–273. Gardner JL, Amano T, Backwell PRY, Ikin K, Sutherland WJ, Peters A. 2014. Temporal Patterns of Avian Body Size Reflect Linear Size Responses to Broadscale Environmental Change Over the Last 50 Years. Journal of Avian Biology, 45:529–535. González C, Ornelas JF, Gutiérrez-Rodríguez C. 2011. Selection and Geographic Isolation Influence Hummingbird Speciation: Genetic, Acoustic and Morphological Divergence in the Wedge-tailed Sabrewing (Campylopterus curvipennis). BMC Evolutionary Biology, 11:38. Goodman RE, Lebuhn G, Seavy NE, Gardali T, Bluso-Demers JD. 2011. Avian Body Size Changes and Climate Change: Warming or Increasing Variability? Global Change Biology, 18:63–73. Hoffman SW, Smith JP. 2003. Population Trends of Migratory Raptors in Western North American, 1977-2001. The Condor, 105:397–419. Hull JM, Fish AM, Keane JJ, Mori SR, Sacks BN, Hull AC. 2010. Estimation of Species Identification Error: Implications for Raptor Migration Counts and Rrend Estimation. Journal of Wildlife Management, 74:1326–1334. Hull JM, Hull AC, Sacks BN, Smith JP, Ernest HB. 2008. Landscape Characteristics Influence Morphological and Genetic Differentiation in a Widespread Raptor (Buteo jamaicensis). Molecular ecology, 17:810–24. Ipcc. 2001. Model Evaluation. working group I Scientific basis:54. Johansson C, Linder E, Hardin P, White C. 1998. Bill and Body Size in the Peregrine Falcon, North Versus South: Is Size Adaptive? Journal of Biogeography, 25:265–273. Kerlinger P. 1989. Flight Strategies of Migrating Hawks. University of Chicago Press. Ku HH. 1966. Notes On the Use of Propagation of Error Formulas. Journal of Research of the National Bureau of Standards, 70C:262. Larsson K, Forslund P. 1991. Environmentally Induced Morphological Variation in the Barnacle Goose, Branta-Leucopsis. Journal of Evolutionary Biology, 4:619–636.

! 54!
Lima SL. 1986. Predation Risk and Unpredicatable Feeding Conditions: Determinants of Body Mass in Birds. Ecology, 67:377–385. McGillivray BW. 1989. Geographic Variation in Size and Reverse Size Dimorphism of the Great Horned Owl in North America. The Condor, 91:777–786. Mitchell-Olds T, Willis JH, Goldstein DB. 2007. Which Evolutionary Processes Influence Natural Genetic Variation for Phenotypic Traits? Nature Reviews Genetics, 8:845–856. Mueller HC, Berger DD, Allez G. 1981. Age and Sex Differences in Wing Loading and Other Aerodynamic Characteristics of Sharp-Shinned Hawks. Wildlife Society Bulletin, 93:491–499. Mueller HC, Berger DD, Mueller NS. 2002. Age and Sex Differences in Wing Loading and Other Aerodynamic Characteristics of Merlins. The Wilson Bulletin, 93:491–499. Ozgul A, Childs DZ, Oli MK, Armitage KB, Blumstein DT, Olson LE, Tuljapurkar S, Coulson T. 2010. Coupled Dynamics of Body Mass and Population Growth in Response to Environmental Change. Nature, 466:482–5. Pearlstine EV, Thompson B. 2004. Geographic Variation in Morphology of Four Species of Migratory Raptors. Journal of Raptor Research, 38:334–342. Peters RH. 1986. The Ecological Implications of Body Size. Cambridge University Press. Sheridan JA, Bickford D. 2011. Shrinking Body Size as an Ecological Response to Climate Change. Nature Climate Change, 1:401–406. Smith JP, Hoffman SW, Gessaman JA. 1990. Regional Size Differences Among Fall-Migrant Accipiters in North America. Journal of Field Ornithology, 61:192–200. Stillwell RC, Fox CW. 2009. Geographic Variation in Body Size, Sexual Size Dimorphism and Fitness Components of a Seed Beetle: Local Adaptation Versus henotypic plasticity. Oikos, 118:703–712. Storz JF. 2002. Contrasting Patterns of Divergence in Quantitative Traits and Neural DNA Markers: Analysis in Clinal Variation. Molecular Ecology, 11:2537–2551. Tingley MW, Monahan WB, Beissinger SR, Moritz C. 2009. Birds Track Their Grinnellian Niche Through a Century of Climate Change. Proceedings of the National Academy of Sciences, 106:19637–19643.

! 55!
Viverette CB, Struve S, Goodrich LJ, Bildstein KL. 1996. Decreases in Migrating Sharp-Shinned Hawks (Accipiter Striatus) At Traditional Raptor-Migration Watch Sites in Eastern North America. The Auk, 113:32–40. Wigginton JD, Dobson FS. 1999. Environmental Influences On Geographic Variation in Body Size of Western Bobcats. Canadian Journal of Zoology, 77:802–813. Yom-Tov Y, Yom-Tov S. 2006. Decrease in Body Size of Danish Goshawks During the Twentieth Century. Journal of Ornithology, 147:644–647.

! 56!
Table 1. Output of ANOVA of kestrel mass, wing chord and wing loading index. Degrees
of freedom (df), sum of squares (sum of sq), and mean square (mean sq). Significant p-
values (<0.05) are in bold.
Term df sum of sq mean sq p-value Mass
Site 6 236768 39461 <0.0001 Sex 1 445557 445557 <0.0001
Site:Sex 6 5025 838 <0.0001 Residuals 16207 1292569 80 NA
Wing chord Site 6 104073 17346 <0.0001 Sex 1 246552 246552 <0.0001
Site:Sex 1 193 32 0.24 Residuals 16207 437912 27 NA
Wing Loading Index Site 6 1.037 0.1728 <0.0001 Sex 1 0.437 0.4369 <0.0001
Site:Sex 6 0.014 0.0023 <0.0001 Residuals 16207 3.842 0.0002 NA

! 57!
Table 2. Sample size (n), mean mass (g), and mean wing chord (mm) and standard error
for female and male kestrels at seven migration sites.
Location Sex n Mass Wing Chord GGRO, CA (GG) M 623 103.3 ± 0.31 185.5 ± 0.23
F 682 115.1 ± 0.34 193.5 ± 0.21 Lucky Peak, ID (LP) M 1865 109.8 ± 0.2 189.2 ± 0.11
F 1322 122.1 ± 0.28 196.7 ± 0.14 Goshute Mountains, NV (GO) M 1844 102.1 ± 0.2 188.9 ± 0.12
F 1692 111.3 ± 0.23 196.8 ± 0.13 Manzano Mountains, NM (MA) M 415 102.1 ± 0.34 189.5 ± 0.24
F 230 112.1 ± 0.53 197.1. ± 0.34 Hawk Ridge, MN (HR) M 920 102.4 ± 0.23 183.6 ± 0.15
F 844 112.1 ± 0.29 191.8 ± 0.17 Hawk Mountain, PA (HM) M 62 106.6 ± 1.2 184.6 ± 0.7
F 40 115.9 ± 1.5 190.8 ± 0.92 Cape May, NJ (CM) M 2571 108.8 ± 0.17 182.9 ± 0.1
F 2980 119.2 ± 0.18 190.8 ± 0.1

! 58!
Table 3. Differences in mean mass (g) within sexes across different sites from the Tukey
HSD test. L. Diff is the longitudinal difference between sites in minutes. Difference is the
difference in observed means, Lwr is the lower end point of the interval, Upr is the upper
end point of the interval and p –value is the value after adjustment for the multiple
comparisons. Significant p-values (<0.05) are in bold. See Table 2 for site acronyms.
Female Male Site L. Diff Diff Lwr Upr p-val Diff Lwr Upr p-val
LP-GG -6 6.95 5.55 8.34 <0.0001 6.55 5.17 7.93 <0.0001 GO-LP -2 -10.84 -11.92 -9.75 <0.0001 -7.76 -8.74 -6.78 <0.0001 GO-GG -8 -3.89 -5.24 -2.54 <0.0001 -1.21 -2.59 0.18 0.17 MA-LP -10 -10.01 -12.12 -7.89 <0.0001 -7.72 -9.31 -6.13 <0.0001 MA-GG -16 -3.06 -5.32 -0.80 0.0005 -1.16 -3.03 0.71 0.71 MA-GO -8 0.83 -1.26 2.91 0.99 0.04 -1.55 1.64 1.00 HR-LP -24 -10.03 -11.34 -8.72 <0.0001 -7.40 -8.60 -6.19 <0.0001 HR-GG -30 -3.08 -4.62 -1.55 <0.0001 -0.84 -2.39 0.71 0.87 HR-GO -22 0.81 -0.46 2.07 0.67 0.37 -0.84 1.57 1.00 HR-MA -14 -0.02 -2.23 2.19 1.00 0.32 -1.42 2.06 1.00 HM-LP -41 -6.25 -11.05 -1.44 0.001 -3.25 -7.11 0.62 0.22 HM-GG -47 0.70 -4.17 5.57 1.00 3.31 -0.68 7.29 0.23 HM-GO -39 4.59 -0.20 9.38 0.08 4.51 0.65 8.38 0.007 HM-HR -17 3.78 -1.06 8.63 0.33 4.15 0.22 8.08 0.027 HM-MA -31 3.76 -1.36 8.88 0.44 4.47 0.40 8.54 0.016 CM-LP -42 -2.90 -3.88 -1.93 <0.0001 -1.09 -2.00 -0.18 0.0044 CM-GG -48 4.04 2.77 5.31 <0.0001 5.46 4.13 6.80 <0.0001 CM-GO -40 7.93 7.02 8.84 <0.0001 6.67 5.76 7.59 <0.0001 CM-HM -1 3.34 -1.43 8.11 0.52 2.16 -1.69 6.01 0.84 CM-HR -18 7.13 5.96 8.29 <0.0001 6.31 5.16 7.45 <0.0001 CM-MA -32 7.10 5.07 9.13 <0.0001 6.63 5.08 8.18 <0.0001

! 59!
Table 4. Differences in mean wing chord (mm) within sexes across different sites from
the Tukey HSD test. L. Diff is the longitudinal difference between sties in minutes. Diff
is the difference in observed means between sites, Lwr is the lower end point of the
interval, Upr is the upper end point of the interval and p –value is the value after
adjustment for the multiple comparisons. Significant p-values (<0.05) are in bold. See
Table 2 for site acronyms.
Female Male Site L. Diff Diff Lwr Upr P-val Diff Lwr Upr p-val
LP-GG -6 3.22 2.40 4.04 <0.0001 3.64 2.83 4.45 <0.0001 GO-LP -2 0.05 -0.58 0.69 1.00 -0.29 -0.86 0.28 0.92 GO-GG -8 3.27 2.48 4.07 <0.0001 3.35 2.54 4.16 <0.0001 MA-LP -10 0.40 -0.83 1.64 1.00 0.36 -0.57 1.30 0.99 MA-GG -16 3.62 2.30 4.95 <0.0001 4.00 2.91 5.10 <0.0001 MA-GO -8 0.35 -0.87 1.57 1.00 0.65 -0.28 1.59 0.52 HR-LP -24 -4.94 -5.70 -4.17 <0.0001 -5.52 -6.23 -4.82 <0.0001 HR-GG -30 -1.72 -2.62 -0.82 <0.0001 -1.89 -2.79 -0.98 <0.0001 HR-GO -22 -4.99 -5.73 -4.25 <0.0001 -5.24 -5.94 -4.53 <0.0001 HR-MA -14 -5.34 -6.63 -4.05 <0.0001 -5.89 -6.91 -4.87 <0.0001 HM-LP -41 -5.93 -8.74 -3.12 <0.0001 -4.54 -6.80 -2.27 <0.0001 HM-GG -47 -2.71 -5.56 0.13 0.08 -0.90 -3.23 1.44 0.99 HM-GO -39 -5.99 -8.79 -3.19 <0.0001 -4.25 -6.51 -1.98 <0.0001 HM-HR -17 -1.00 -3.83 1.84 1.00 0.99 -1.31 3.29 0.98 HM-MA -31 -6.34 -9.33 -3.34 <0.0001 -4.90 -7.28 -2.52 <0.0001 CM-LP -42 -5.99 -6.56 -5.42 <0.0001 -6.32 -6.85 -5.79 <0.0001 CM-GG -48 -2.77 -3.51 -2.03 <0.0001 -2.68 -3.46 -1.90 <0.0001 CM-GO -40 -6.05 -6.58 -5.51 <0.0001 -6.03 -6.56 -5.49 <0.0001 CM-HM -1 -0.06 -2.85 2.73 1.00 -1.78 -4.03 0.47 0.31 CM-HR -18 -1.06 -1.74 -0.37 <0.0001 -0.79 -1.46 -0.12 0.006 CM-MA -32 -6.39 -7.58 -5.21 <0.0001 -6.68 -7.59 -5.77 <0.0001

! 60!
Table 5. Summary of wing chord (WC) and mass change with longitudinal differences
(Long). Est is the estimate, SE is standard error, t-val is the t-value and p-val is p-value.
Significant p-values (<0.05) are in bold.
Term Male Female
Est SE t-val p-val Est SE t-val p-val
Intercept (Mass) -1.37 1.88 -0.73 0.47 -1.97 2.41 -0.82 0.43
Long -0.1 0.067 -1.48 -1.48 -0.08 0.086 -0.96 0.34
Intercept (WC) 0.95 1.19 0.8 0.44 1.28 1.05 1.22 0.24
Long 0.13 0.042 3.06 0.007 0.16 0.03 4.16 0.0005

! 61!
Table 6. Significant differences in wing loading index within sexes across different sites
from the Tukey HSD test. Diff is the difference in observed means between sites, Lwr is
the lower end point of the interval, Upr is the upper end point of the interval and p –value
is the value after adjustment for the multiple comparisons Significant p-values (<0.05)
are in bold. See Table 2 for site acronyms.
Female Male Site Diff Lwr Upr p-val Diff Lwr Upr p-val
LP-GG 0.01 0.01 0.01 <0.0001 0.008 0.006 0.010 <0.0001 GO-LP -0.02 -0.02 -0.02 <0.0001 -0.01341 -0.02 -0.012 <0.0001 GO-GG -0.01 -0.01 -0.01 <0.0001 -0.00550 -0.01 -0.003 <0.0001 MA-LP -0.02 -0.02 -0.01 <0.0001 -0.01394 -0.02 -0.011 <0.0001 MA-GG -0.01 -0.01 0.00 <0.0001 -0.00603 -0.01 -0.003 <0.0001 MA-GO 0.00 0.00 0.00 1.00 -0.00053 -0.003 0.002 1.00 HR-LP -0.01 -0.01 -0.01 <0.0001 -0.00760 -0.01 -0.006 <0.0001 HR-GG 0.00 -0.01 0.00 0.0003 0.00031 -0.002 0.003 1.00 HR-GO 0.01 0.00 0.01 <0.0001 0.00581 0.004 0.008 <0.0001 HR-MA 0.01 0.00 0.01 0.0004 0.00634 0.003 0.009 <0.0001 HM-LP 0.00 -0.01 0.00 0.91 -0.00107 -0.008 0.006 1.00 HM-GG 0.00 0.00 0.01 0.92 0.00684 <0.001 0.014 0.05 HM-GO 0.01 0.01 0.02 <0.0001 0.01233 0.006 0.019 <0.0001 HM-HR 0.01 0.00 0.02 0.086 0.00652 <0.001 0.013 0.07 HM-MA 0.01 0.00 0.02 0.0001 0.01287 0.006 0.020 <0.0001 CM-LP 0.00 0.00 0.00 0.20 0.00469 0.003 0.006 <0.0001 CM-GG 0.01 0.01 0.01 <0.0001 0.01260 0.01 0.015 <0.0001 CM-GO 0.02 0.02 0.02 <0.0001 0.01810 0.02 0.020 <0.0001 CM-HM 0.01 0.00 0.01 0.55 0.00577 -0.001 0.012 0.17 CM-HR 0.01 0.01 0.02 <0.0001 0.01229 0.01 0.014 <0.0001 CM-MA 0.02 0.02 0.02 <0.0001 0.01863 0.02 0.021 <0.0001

! 62!
Figure 1. Average mass and wing chord for males and females with standard error bars,
sexual size dimorphism for mass and wing chord with standard error bars for each site.
Column and rows are as follows: Sites are as follows: GG: Golden Gate Raptor
Observatory; LP: Lucky Peak; GO: Goshute Mountains; MA: Manzano Mountains; HR:
Hawk Ridge; HM: Hawk Mountain; CM: Cape May.
112
114
116
118
120
122
190
192
194
196
102
104
106
108
110
183
185
187
189
GG BR GO MA HR HM CM
1.07
1.08
1.09
1.10
1.11
1.12
GG BR GO MA HR HM CM
1.030
1.035
1.040
1.045
Fem
ale
Mass
Mal
e Se
xual
Siz
e
Dim
orph
ism
Wing Chord
Sites GG LP GO MA HR HM CM GG LP GO MA HR HM CM

! 63!
Figure 2. Difference in average wing chord (mm) by difference in longitudinal minutes
with best-fit line. The dots represent the male and female pair-wise comparisons from
Tukey HSD, see Table 4.
-40 -30 -20 -10 0
-6-4
-20
24 Female
Male
Longitudinal (min) Differences
Win
g C
hord
(mm
) Diff
eren
ces

! 64!
Figure 3. Wing loading index for female and male kestrel for each site with upper and
lower hinges (similar to first and third quartile), whiskers extend +/-1.58 IQR (inter-
quartile range) of the hinge. Data beyond the end of the whiskers are outliers.
0.16
0.20
0.24
GG LP GO MA HR HM CM
Sex
F
M
Sites
Win
g Lo
adin
g In
dex
(g/m
m)