Population and family based association study on TPH1, TPH2 and ITGB3 genes indicate serotonergic...
18
Population and family based association study on TPH1, TPH2 and ITGB3 genes indicate serotonergic system involvement in autism spectrum disorder Asem Surindro Singh, Ph. D. Email: [email protected]
-
Upload
irene-jenkins -
Category
Documents
-
view
213 -
download
0
Transcript of Population and family based association study on TPH1, TPH2 and ITGB3 genes indicate serotonergic...

Population and family based association study on TPH1, TPH2
and ITGB3 genes indicate serotonergic system involvement
in autism spectrum disorder
Asem Surindro Singh, Ph. D.Email: [email protected]

ASD: childhood onset, genetic, neurodevelopmental disorder. (autism, asperger’s syndrom, PDD-NOS)
Behaviorally defined1. Lack of social interaction2. Lack of communication3. Restricted, repetitive behaviors and interests.
Introduction
Cerebral Cortex
Basal Ganglia
Corpus Callosum
CerebellumBrain stem
Hippocampus
Amygdala
Pic: Jacob Bartnett
Figure 1. Parts of brain affected by autism

High Prevalence: 1 in 68 children, (CDC, 2014).
Concordance: 3 - 8% (dizygotic twins) and 69 – 95% (monozygotic twins) (Dawson G, 2008).
Serotonin system abnormality in ASD: Brain and peripheral
Serotonergic system: TPH1, TPH2, SLC6A4, SLC18A2, ITGB3.
Serotonin abnormality: Synthesis, degradation, transport.
Candidate gene association studies.
Prevalence and cure: Urgently needed, pathophysiology unclear.
Present study: TPH1, TPH2 and ITGB3 genes
Two approaches: genetic association & gene-gene interaction analysis.
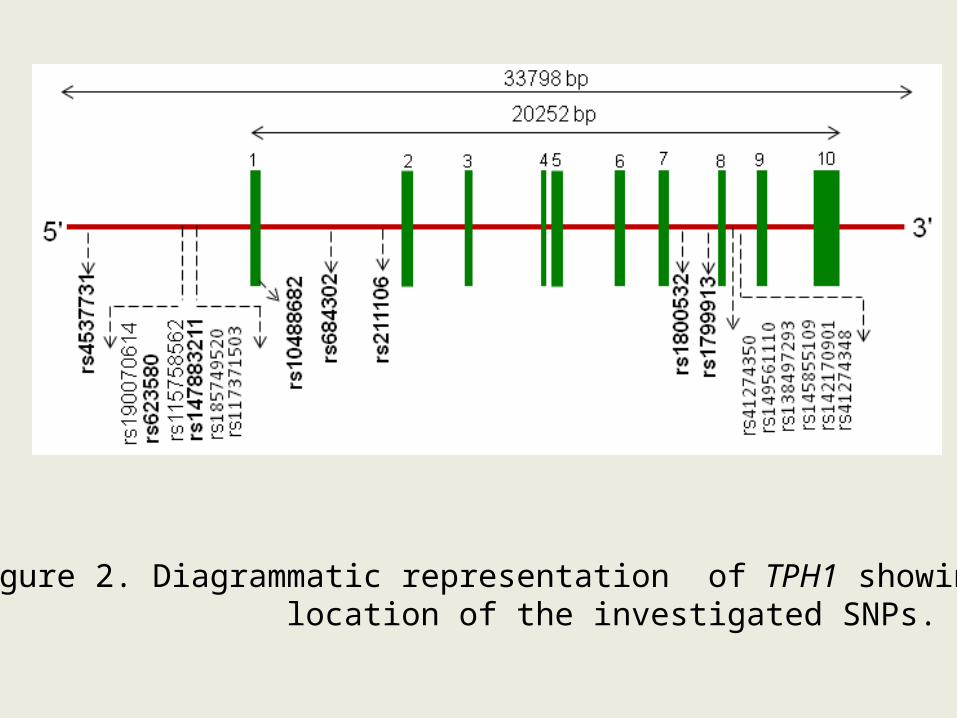
Figure 2. Diagrammatic representation of TPH1 showing the location of the investigated SNPs.

Figure 3. Diagrammatic representation of TPH2 showing the location of the investigated SNPs.
Singh AS et al., PROG NEURO-PSYCHOPH, 2014

Figure 4. Diagrammatic representation of ITGB3 showing the location of the investigated SNPs.
Singh AS et al., PROG NEURO-PSYCHOPH, 2014

Study Designs
Blood collection
Recruitment of subjects
WBC separation
DNA extraction
Genetic association studies
Approval of human ethics committee
Genotyping analysis
Gene-gene interaction analysis
Bioinformatics analysis

Results in briefTable 1. Genotypic and allelic frequencies of ITGB3 and TPH2 Markers
SNP ID Study group Genotypic frequency Allelic frequency
HWEχ2
p_value
ITGB3rs15908 CC CA AA C A
Case (n = 139) 0.20 0.58 0.23 0.48 0.52 3.740 0.053Parent (n = 260) 0.22 0.48 0.31 0.45 0.55 0.413 0.520Control (n = 165) 0.24 0.56 0.21 0.52 0.48 2.112 0.146
rs5918 TT TC CC T CCase (n = 139) 0.76 0.23 0.01 0.87 0.13 0.043 0.834Parent (n = 260) 0.81 0.18 0.01 0.90 0.10 0.148 0.700Control (n = 163) 0.76 0.23 0.01 0.87 0.13 0.141 0.707
TPH2
rs4570625 GG GT TT G TCase (n = 136) 0.56 0.32 0.13 0.72 0.28 6.892 0.008Parent (n = 254) 0.48 0.45 0.07 0.71 0.29 2.068 0.150Control (n = 129) 0.57 0.36 0.07 0.75 0.25 0.299 0.584
rs11179000 AA AT TT A TCase (n = 136) 0.46 0.38 0.15 0.65 0.35 3.416 0.064Parent (n = 252) 0.45 0.44 0.11 0.67 0.33 0.099 0.752Control (n = 131) 0.44 0.45 0.11 0.66 0.34 0.000 0.998
rs11179001 GG GA AA G ACase (n = 136) 0.68 0.30 0.03 0.82 0.18 0.009 0.923Parent (n = 252) 0.71 0.25 0.04 0.84 0.16 2.208 0.137Control (n = 130) 0.68 0.30 0.02 0.83 0.17 0.256 0.612
rs4290270 TT TA AA T ACase (n = 132) 0.33 0.46 0.20 0.56 0.44 0.540 0.462Parent (n = 245) 0.31 0.48 0.21 0.55 0.45 0.201 0.653Control (n = 125) 0.31 0.48 0.21 0.55 0.45 0.140 0.707
rs7305115 GG GA AA G ACase (n = 131) 0.33 0.44 0.24 0.55 0.45 2.087 0.148Parent (n = 243) 0.29 0.51 0.21 0.54 0.46 0.071 0.788Control (n = 159) 0.25 0.51 0.24 0.51 0.49 0.040 0.841

Table 2. Population wise data on the allele frequencies obtained from the HapMap dbSNP database and present study population from India
Population
TPH2 ITGB3
rs4570625 rs11179000 rs11179001 rs7305115 rs4290270 rs15908 rs5918
G T A T G A A G A T C A C T
ASW 0.675 0.325 NA NA 0.868 0.132 0.360 0.640 NA NA 0.342 0.658 0.123 0.877
CEU 0.792 0.208 0.784 0.216 0.912 0.088 0.357 0.643 0.285 0.715 0.336 0.664 0.137 0.863
CHB 0.482 0.518 0.488 0.512 0.836 0.164 0.478 0.522 0.511 0.489 0.554 0.456 0.007 0.993
CHD 0.445 0.555 NA NA 0.839 0.161 0.583 0.417 NA NA 0.628 0.372 0.005 0.995
GIH 0.782 0.218 NA NA 0.851 0.149 0.460 0.540 NA NA 0.431 0.569 0.089 0.911
JPT 0.504 0.496 0.456 0.544 0.894 0.106 0.434 0.566 0.411 0.589 0.504 0.496 0.011 0.989
LWK 0.560 0.440 NA NA 0.873 0.127 0.514 0.486 NA NA 0.545 0.455 0.145 0.855
MEX 0.675 0.325 NA NA 0.836 0.164 0.509 0.491 NA NA 0.379 0.621 0.112 0.888
MKK 0.580 0.420 NA NA 0.939 0.061 0.478 0.522 NA NA 0.641 0.359 0.173 0.827
TSI 0.750 0.250 NA NA 0.911 0.089 0.475 0.525 NA NA 0.426 0.574 0.162 0.838
YRI 0.619 0.381 0.548 0.452 0.894 0.106 0.337 0.663 0.587 0.413 0.493 0.507 0.128 0.872
Study from INDIA
0.750 0.250 0.660 0.340 0.830 0.170 0.550 0.450 0.510 0.490 0.520 0.480 0.130 0.870

Figure 5. Linkage analysis.

Figure 6. Multifactor dimensionality reduction test for case control

Marker combination HR LR M (Fix P)
T NT T NT
rs4537731-rs211106 58 31 67 88 37.1 (0.026)
rs623580-rs10488682 80 51 48 75 25.5 (0.043)
rs623580- rs4570625 54 30 71 93 31.0 (0.024)
rs623580- rs4290270 78 47 50 78 22.4 (0.050)
rs623580-rs1799913- rs4570625 69 35 56 88 52.7 (0.026)
rs623580- rs1799913- rs4290270 69 32 57 90 45.7 (0.041)
Table 3. MDR-phenomics analysis for TPH1 and TPH2 interaction using all trio families

Figure 7. Radial diagram showing genetic interaction pattern between the SNPs of the genes.

Figure 8. Bioinformatic analysis for protein-protein interaction

Interacting Proteins Text mining score
SLC6A4 and TPH1 0.956
TPH2 and SLC6A4 0.889
HTR2A and TPH2 0.908
HTR2A and TPH1 0.963
HTR2A and SLC6A4 0.926
ITGB3 and SLC6A4 0.960
Table 4. Interacting proteins with the text mining scores resulted by online database resource Search Tool “STRING”

Table 5. Transcription factor and transcription factor binding site changes due to single nucleotide polymorphism
SNP ID Alleles TFB sites TF Score
rs4570625 G TAGAATA ← CdxA 85.7
T AATTATA → CdxA 98.6
TATAATA ← CdxA 91.4
TATAATA → CdxA 91.4
rs11179000 A ACACGTGT → USF 94.1
ACACGTGT ← USF 94.1
GTACACGTGTTG → N-Myc 90.8
TGTACACGTGTTGA ← USF 88.2
TGTACACGTGTTGA → USF 88.2
GTACACGTGTTG ← N-Myc 87.6
GTACACGTGTTG → c-Myc 86.8
GTACACGTGTTG ← MyoD 86.0
T NA NA NA
rs11179001 A ACTGGAAGCA → c-Ets- 90.2
G ACTGGAAGCG → c-Ets- 89.2
ACTGGAAGCG → NRF-2 86.0

LD variation pattern was observed between the SNPs of case, control and parents.
Pair-wise haplotype analysis reveal over-transmission ofTPH1.
Pair-wise haplotype analysis showed under-expression of TPH2.
MDR and MDRP showed significant interaction of TPH1 & TPH2
Indirect interaction of TPH1,TPH2 and ITGB3 was shown by bioinformatic analysis; and the SNP markers were shown to have functional (from low to moderate) role in gene regulation.
Summary of the result

The present study using genetic association and gene-gene interaction analyses of TPH1, TPH2 and ITGB3 variants support the serotonergic abnormality in ASD.
The three genes are likely involve in the etiology of the disorder.
However further studies using cellular and animal models are required to validate the finding which may provide some important information in the disease pathophysiology and in the future therapeutic development of ASD.
Conclusion