Population Ageing: Pomp or Circumstance€¦ · 6 Summary and Conclusions The title of this report,...
42
Population Ageing: Pomp or Circumstance Dylan Kneale, Mark Mason, Sally-Marie Bamford April 2012 ww.ilcuk.org.uk
Transcript of Population Ageing: Pomp or Circumstance€¦ · 6 Summary and Conclusions The title of this report,...
Population Ageing: Pomp or Circumstance
Dylan Kneale, Mark Mason, Sally-Marie Bamford
April 2012 ww.ilcuk.org.uk

The International Longevity Centre - UK (ILC-UK) is an independent, non-partisan think-tank
dedicated to addressing issues of longevity, ageing and population change. It develops ideas,
undertakes research and creates a forum for debate.
The ILC-UK is a registered charity (no. 1080496) incorporated with limited liability in England
and Wales (company no. 3798902).
ILC–UK
11 Tufton Street
London
SW1P 3QB
Tel: +44 (0) 20 7340 0440
www.ilcuk.org.uk
This report was first published in April 2012
© ILC-UK 2012
Acknowledgements
This report was researched and written by Dylan Kneale, Mark Mason and Sally-Marie Bamford
(ILC-UK). It was funded by an unconditional grant from Alliance Boots. ILC-UK has editorial
responsibility for this publication, and for any errors or omissions.
We are grateful to Trinley Walker and Lyndsey Mitchell for research assistance and assistance
with formatting. We are grateful to Professor David Taylor (UCL) and to Andrew Bonser for
assistance with question design and for stimulating discussions. Fieldwork was carried out by GfK-
NOP, although any mistakes or inaccuracies in the analysis are the responsibility of ILC-UK as are
any errors in the question design. Feedback is welcome and any comments will be gratefully
received ([email protected]).
Table of Contents
Executive Summary ................................................................................ 4
Introduction ............................................................................................. 7
Data and Methodology .......................................................................... 12
Healthier Ageing and a Healthy Society ............................................... 14
The Economics of Living Longer ......................................................... 21
Is the UK an ageing population ............................................................ 27
Summary and discussion ..................................................................... 31
References ............................................................................................. 33
Appendix ................................................................................................ 36
4
Executive summary
Introduction
The UK’s population is unquestionably ageing, leading to anticipated social changes that are
already becoming apparent in policy. Health and the workplace are two areas of major projected
change. While there is some degree of understanding of people’s attitudes towards older people,
which are almost invariably negative, there is less understanding on people’s awareness and
attitudes on some of the macro-level changes associated with an ageing society.
Data and Methodology
This report examines some of these issues through specially commissioned polling data as well as
employing data from the British Social Attitudes Survey. We use a combination of bivariate and
regression analyses to offer insight on public attitudes towards: health and personal responsibility
for health; older people and the workplace; as well as general opinions on an ageing society.
Results
Health behaviours and healthy ageing
Most people (almost nine-in-ten) believe that if people stop smoking and eat a balanced diet, they
can not only live to an older age, but live a healthier life in old age.
Control over health
Most people (just over three-quarters) believe that they are in charge of their own health more than
other parties including the government, their hospital or GP. People in lower social classes are
around 40 per cent less likely than those in the highest social class to agree that they are more in
charge of their own health more than other parties including the government, their hospital or GP,
after controlling for other factors.
Healthy ageing and control over health
When we combine information on health behaviours and perceptions of who is in charge of day-to-
day health, we find two-thirds of adults are categorised as being both ‘aware’ (that a healthy
lifestyle can lead to a healthier old age) and ‘in charge’ of their health (of their day-to-day health
compared to other parties such as the government, hospital or GP). Those who are in the
youngest age groups and who are in the lower social classes are those least likely to fall within the
‘aware and in charge’ group and may be those who may be naturally least prepared for an era of
personal responsibility for health.
The future of the NHS in an ageing society
Almost half of adults (45%) believe that the NHS will not be able to provide a service that is free at
the point of use because of population ageing. One of the strongest predictors of whether people
5
thought the NHS would change in delivery because of population ageing was their attitudes
regarding their own influence over their day-to-day health. Respondents who thought that they
were in charge of their day-to-day health more than other parties were 50 per cent more likely than
those who did not to also express scepticism over the future continuation of the NHS, after
controlling for other factors.
Living and working longer
Should people work longer before claiming the state pension?
Just over two-fifths of people agree that because people are living longer and healthier it is right
that people work longer before they can claim a state pension by age group. People aged 45-54
years and people in social class C2 (‘skilled working class’) are those least likely to agree with this
sentiment above.
Older people and economic prosperity
Only one in six people agree that retired people play no part in the economic prosperity of the
country (17%). Social class continued to significantly pattern responses after accounting for other
factors (listed in the data and methods section), and those in the lowest social class were twice as
likely as those in the highest social class to agree that retirees play no part in the economic
prosperity of the country.
Older people and economic competitiveness
Almost two-fifths of adults think that the UK’s ageing population is a threat to our economic
competitiveness with other nations (38%). Responses to this question were significantly influenced
by other attitudes to the economic impact of living longer, although were not statistically
significantly influenced by socioeconomic and demographic factors.
Perceptions of an ageing society
How many older people can we expect in the future?
Over three-fifths of adults indicated that the proportion of oldest old (85+ years) in 2050 would lie
between 3-10% (62%); these were close to the projected estimate of 6 per cent. One-in-ten people
did not think that the proportion of older people aged 85 and above would rise from the current two
per cent, while a further one-in-ten respondents thought that as much as a quarter of the
population would be aged 85 and over in 2050.
Are we overestimating the impact of an ageing society?
Just over two-fifths (42%) of the population think that as a society, we overestimate the impact of
an ageing society. This perception did not vary statistically significantly by socioeconomic and
demographic characteristics.
6
Summary and Conclusions
The title of this report, ‘Population Ageing: Pomp or Circumstance’, refers to the debate as to
whether the public believe that population ageing is pomp (or hype) or is circumstance. Perhaps
the most direct evidence on this issue comes from agreement with the statement ‘as a society, we
overestimate the effect of an ageing society’. We can observe that over two-in-five adults agree
with this statement.
A report launched in conjunction with this paper (Gill and Taylor 2012) critically examines this
issue in a broader sense, and questions whether the ‘apocalyptic’ demographic scenarios that are
sometimes predicted will become reality. The results in this paper suggest that public opinion does
often tend towards a similar view in a number of cases. Further positive glimmers do appear
among attitudes to planning an older Britain of the future through high levels of understanding of
the link between healthy behaviours and living longer and healthier, and flexible attitudes towards
older people and the workplace, particularly among younger people in the latter case. Our results
also give some cause for consideration, as we find that those in lower socioeconomic groups may
also be those least prepared for new policy directions aimed at improving the health of our ageing
population, particularly in terms of taking greater personal responsibility for health.
Overall, our results also highlight the complexity among the attitudes held on an ageing society.
The results in this report suggest that in reality, as with many social issues, the consequences of
an ageing society are framed through political debate leaving a complex, and sometimes fraught,
process for the public in disentangling the facts from the fiction.
7
Introduction
The ageing UK population has been central to discourse among demographers for some time,
impacting on the decisions of policy-makers and seeping into the public consciousness in recent
years. However, the debates have reached something of a crescendo lately, as some of the
implications of an ageing society, such as a lower dependency ratio and higher numbers of
retirees, are manifested through changes to the pensions system and proposed changes to the
funding of long-term care. These changes, pertaining as much to an ageing society as to older
people per se, have received much attention from policy-makers and the media, bringing the issue
of population ageing to the forefront of the public’s attention. Greater numbers of older people are
an outcome of an ageing society; however, the macro-level changes that results from an ageing
society will affect members of all ages, and not just older people. In this respect, understanding
public opinion on an ageing society is related, although somewhat distinct to understanding public
opinion on older people. While public opinion on older people may reflect attitudes to
discrimination or having older neighbours for example, attitudes on population ageing may reflect
concerns about wider economic and social changes that follow an ageing society, and may reflect
the decision and choices we all have to consider as a result of the UK’s changing demography.
However, as is expanded upon below, there is a shortage of evidence that examines this theme,
as well as the interrelatedness of perceptions of an ageing society and older people. This report
provides some new indicative evidence on these themes. The collection of longitudinal (or time-
series) information, beyond the scope of this study, will enable researchers to link changes in
opinion to shifts in the debate on an ageing society; the evidence presented in this report provides
a snapshot of opinion from a week at the end of March 2012 and instead provides a valuable
stepping stone for further research into this area.
Public perceptions on older people
People’s perceptions of age and ageing affect all members of society and they have an impact on
everyone, shaping people’s views about themselves and others. These perceptions in turn have
important implications for individual welfare, social equality and inclusion. Perceptions of older
people have been described as diverse, complex and multivariate (Lyons, 2009). In public
discourse older people are commonly represented according to their age and are often negatively
portrayed. A UK study in 2002 reported that older people felt not only under-represented on the
television, but the few portrayals there were of older people were ‘marginal’ or stereotypical – older
people were seldom at the heart of key storylines or blended to the background through an
adherence to conventional portrayals (Healy and Ross 2002). Another study in 2004 conducted by
TNS for Age Concern revealed a perception among a majority of adults (58% per cent of those
aged 16 and over) in Great Britain that newspapers and television portray older people in a
predominantly negative way (Age Concern 2004). Such negative discourse, or the absence of
older people, particularly pervasive in the media and public parlance, has led to reductive
conceptions of older people’s identity based on the themes of ‘burden’, ’dependency’ and
‘vulnerability’. If we consider the representation of the ageing population more widely, this has also
become synonymous with pejorative phrases such as ‘demographic time bomb’ or ’rising tide’,
thus giving rise to and engraining discriminatory and negative attitudes towards older people.
8
The discernible tendency to treat older people as a monolithic entity is not only a descriptive
misrepresentation, but theoretically flawed in that it effectively ignores the plurality of our affiliations
and attachments as individuals involving class, gender, profession, language, science, sexuality,
morals and politics. Being old has become an all-purpose explanation eschewing the complex
realities of an individual’s myriad attachments and affiliations by the simplifying process of
stereotyping. A study on the ‘voice’ of older people suggests there is little evidence that the
widespread perception of the older population as a homogeneous entity is shared by older people
themselves, or is backed up by the evidences (Help the Aged 2009). Simplistic views of older
people may provide a shorthand label, but critically the individuals concerned invariably fail to
recognise, or adhere to, the prescribed characterisation.
Such perceptions of older people can and do have positive and negative impacts in a wide range
of interactions such as contact with family, friends and members of the community. These
perceptions impact on older people in employment, education, health services and daily life. While
people seem to disapprove of ageism there is evidence to suggest that it is experienced widely
and is manifested in an array of different ways (Abrams, et al, 2009). HSE (2009) highlighted how
people’s negative attitudes and perceptions can have an important impact on older people’s lives:
‘Ageism and ageist attitudes are not the sole factors contributing to elder abuse but can give rise to
a culture which creates a fertile environment in which elder abuse can develop, leading to age
discrimination, and devaluing and disempowering older people’ (HSE, 2009, p.21)
This becomes even more important considering the changing nature of the UK’s demography and
there is now a clear need to understand these attitudes are formed and how they are shaped (e.g.
Narayan, 2008; Raman, et al, 2008). Lyons (2009) found that age, gender, level of knowledge,
culture, modernisation and the media all play a role in shaping people’s perceptions (of ageing and
of older people), although perhaps the most important of these is personal multi- and
intergenerational contact (Abrams, et al, 2009; Lyons 2009). While people in mid-life may have
friends who are younger than 30 and older than 70, less than a third (28%) of people within those
two age ranges have regular contact with people in the other; as a result it is not surprising that
misconceptions prevail.
Further work is required to understand attitudes towards older people in society, particularly as the
expected contribution of older people is undergoing change through initiatives such as the Big
Society and through changes in workplace policies. Until there is clear and reliable evidence on
the perceptions of ageing, and the outcomes of these perceptions, then successful interventions to
promote a more positive view of ageing may not be successful (Allan & Johnson, 2009; Arnold-
Cathalifaud, et al, 2008). Part of this gathering of evidence may involve the exploration of both
attitudes to older people as well as attitudes to an ageing society, and examining any potential
distinctions between these areas. While attitudes towards an ‘ageing society’ and ‘older people’
are clearly interrelated, framing debates through the lens of an ageing society as opposed to older
people may lead to different results. It is possible to imagine that macro-level debates on
population ageing may lead to different responses in attitudes to debates surrounding older people
per se. In addition, different components of the consequences of an ageing society, such as the
health or economic aspects, may elicit substantially different responses in public opinion. Such
opinion is also liable to rapid change as a result of actual or proposed changes in policy, or
9
circumstances or events such as the recession. The need to understand some of these issues
through recent and representative evidence is one of the motivators for this study. Consequently,
we explore some of the extant evidence on public opinion in the areas of health and longer life, as
well as extended working lives, below, while in the remainder of this report we present evidence
from a nationally representative polling exercise that included questions on these as well as
broader perceptions of an ageing society.
Health ageing and public perceptions
With the ageing structure of national and local populations it is becoming increasingly important for
policy makers and professionals to promote healthy ageing (Alongi, Benson, Harris, Moore, &
Aldrich, 2009; Räftegård Fäggren & Wilson, 2009; World Health Organization, 2002). Healthy
ageing is a broad concept which aims to develop and maintain optimal health and well-being in
older adults. It has been more specifically defined by Räftegård and colleagues (2009) as ‘the
process of optimizing opportunities for physical, social and mental health to enable older people to
take an active part in society without discrimination and to enjoy an independent and good quality
of life’.
However the perception of what constitutes healthy ageing is not straightforward. There have been
observed differences among different groups, nationally and locally. For example, Laditka, et al
(2009) asked focus group participants across the USA to consider what ‘ageing well’ meant to
them. They found important differences depending on the ethnicity of the participants. In the case
of Chinese-Americans, participants were more likely than other ethnic groups to consider healthy
ageing to be represented by cognition and physicality (a healthy mental outlook and physical
abilities); Vietnamese-American participants were less likely than other ethnic groups to
emphasize independent living (stressing instead positive social inter-generational integration);
finally, Native Americans did not relate ‘ageing well’ to anything connected to diet or physical
activity (they stressed leisure activities as important in healthy ageing). Such differences across
ethnicity, region or country, or socioeconomic group may also prevail in the UK context.
Some researchers have explored behaviour as well as attitudes, creating a number of typologies
of older people in the general population based on a combination of these. Huy, et al (2010)
identify three different styles of health behaviour among older adults including those identified as
‘fit and performance-hungry’ who engage in more regular exercise and were more likely to follow a
healthy diet; ‘conventional’ older people were those who believe that exercise and healthy eating
were positive towards health, but were engaged less frequently in healthy behaviours, while ‘easy-
going and committed’ people were those who viewed physical exercise and diet as important but
not key to health and fitness in old age. A group that did not view exercise and diet as unimportant
was not explicitly identified, although those in the latter ‘easy going and committed’ group were
those who placed less important on health behaviours. They found that the different identified
groups followed diets which matched their health beliefs, so the more that people believed in
positive health behaviour (such as regular exercising and non-smoking), the more likely they would
be to undertake them. While establishing a link between attitudes and behaviour may ostensibly
appear to adhere to conventional wisdom, understanding typologies of older people in this was is
useful for targeting and intervention.
10
Arguably, however, good health in older age is a product of healthy behaviour across the
lifecourse. For example, studies of centenarians show that healthy behaviours, such as moderate
intake of alcohol, good diet, not smoking, and regular exercise, not only increase the chances of
surviving to a hundred, but are also linked to improved health status on becoming a centenarian
(Hitt et al, 1999, Engberg et al, 2009, Galioto et al, 2010). It is therefore important to understand
the depth of knowledge of the link between healthy behaviours and healthy ageing across different
age groups (and other social groupings). This is of particular relevance in the current policy
landscape of increased personal responsibility for health. Recent statements from the current
coalition government place a renewed emphasis on people to take charge of changing their own
behaviours to improve the prevention of ill-health, as opposed to relying on state intervention and
treatment. Public health campaigns, such as the ‘Change for Life’ campaign, have developed to
inform the public on the results of adopting healthy behaviour on long term health outcomes.
However, while public health campaigns may improve levels of knowledge, the stress on personal
responsibility for health may be met with limited success among groups that do not feel in charge
of their own health destinies. Recent work demonstrates the multifaceted nature of public
perceptions of the value of public health intervention campaigns, with the results indicating that
lifestyle related interventions were given less weight by the public compared to other intervention
types (Singh et al 2012). A further layer of complexity is added when the effectiveness of
interventions is considered, which is likely, in part, to depend on the amount of control that people
feel they have over their own health. These are issues that we present indicative evidence on in
this report through the results of questions on ‘whether people feel in charge of their day-to-day
health’ as well as whether people are aware of the links between ‘stopping smoking and eating a
balanced diet and not only living to an older age, but also living a healthier life in older age’. We
also examine the way that population ageing specifically might impact on the public perception on
health services through a question on the continuation of the NHS as being free at the point of use
in the future.
Public perceptions on the role of older people in the
workplace
There is a growing body of research that signals a positive relationship between older workers and
measures of performance and productivity at work (e.g. Pitt, et al, 2008; Ng and Feldman, 2008;
Meadows, 2004). However the public perception of older people in the workplace is often mixed
and older people are seen as possessing wisdom and reliability while at the same time being seen
as less productive than younger people, resistant to change, and slow to learn (e.g. Thornton,
2002; TNS, 2012). Research by Age UK (2011) across Europe discovered relatively high levels of
negative perceptions of older people in the workplace, with the majority of respondents surveyed
saying they would find it easier to accept a 30 year than a 70 year old as their manager even if
both were equally qualified. Furthermore, around half of all respondents over 50 felt that employers
would always hire a person in their 20s rather than someone older. This level of perceived ageism
was recently supported but the Eurobarometer report on ‘Active Ageing’ which found that the
proportion of respondents reporting age discrimination as ‘quite rare’ had fallen from 52% in 2008
to 37% in 2012, with 58% now regarding it as ‘widespread’. The rise was identified as being driven
by the rising proportion of respondents in their 40s who were increasingly encountering age
11
discrimination. One explanation for high levels of negativity towards older people in the workplace
could be related to instances of economic scarcity, where older workers as are viewed as
competition to younger workers (HSBC, 2006). The effects of the financial crisis and the protracted
recovery may serve to heighten such opinion.
However attitudes and perceptions among employers and younger workers potentially keeping
older workers out of the workplace could be counter-productive. With the ageing population comes
a shifting of the ‘worker –retiree ratio’ where fewer people of current working age will be active in
the economy to support those receiving pensions. One of the potential ways of offsetting the costs
associated with an ageing population is to extend individuals working lives for as long as possible.
This might be done by raising the retirement age, pension reforms, or supporting initiatives which
aim to keep employees in the workforce for longer (e.g. Euwals, De Mooij & Van Vuuren, 2009), or
bring them back into the workplace through initiatives such as ‘career re-entry schemes’ (e.g.
Mutual Learning Programme). The majority of respondents to the 2012 Eurobarometer on ‘Active
Ageing’ felt that there was no need for a compulsory retirement age, with a third (33%) said they
would like to continue working beyond retirement (this varied most significantly by education, with
those having a higher level of education wanting to work for longer). There was also a general
level of support for the possibility of combining part-time work with partial pension (which almost
two thirds of Europeans felt would be preferable to full retirement). However this was not the case
among all European countries, suggesting strong cultural differences in the perceptions of older
adults in the workplace. In addition, recent changes in the age of eligibility for the UK state pension
makes further exploration of the UK context particularly pertinent.
However, limiting opportunities for an early exit from the work place, or incentivising working for
longer might only be part of the solution, particularly when employers are often sceptical about
measures imposed by government (van Dalen, et at, 2010). Perhaps the main challenge for hiring
and retaining older people in the workforce is one of perception. Without changes in the
perceptions of employers and workers on older colleagues, any intervention aimed at coping with
an ageing workforce is unlikely to be effective (van Dalen, et at, 2010). As a result employers need
to consider how negative perceptions of older people in the workforce might impact on their ability
to retain and, or hire, older employees (Vickerstaff, Cox and Ken, 2003). We begin to explore
these and other issues, through a limited number of questions presented to a survey of 1000
individuals, and further outline the methods below.
12
Data and Methodology
Commissioned survey
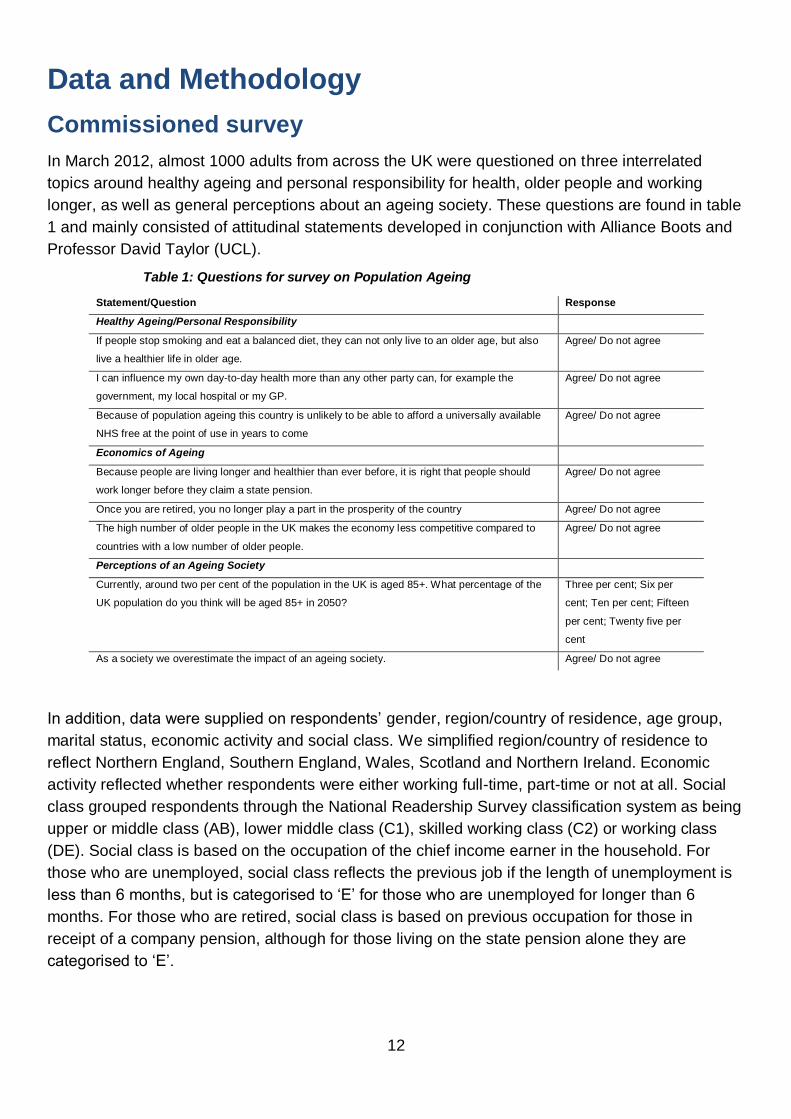
In March 2012, almost 1000 adults from across the UK were questioned on three interrelated
topics around healthy ageing and personal responsibility for health, older people and working
longer, as well as general perceptions about an ageing society. These questions are found in table
1 and mainly consisted of attitudinal statements developed in conjunction with Alliance Boots and
Professor David Taylor (UCL).
Table 1: Questions for survey on Population Ageing
Statement/Question Response
Healthy Ageing/Personal Responsibility
If people stop smoking and eat a balanced diet, they can not only live to an older age, but also
live a healthier life in older age.
Agree/ Do not agree
I can influence my own day-to-day health more than any other party can, for example the
government, my local hospital or my GP.
Agree/ Do not agree
Because of population ageing this country is unlikely to be able to afford a universally available
NHS free at the point of use in years to come
Agree/ Do not agree
Economics of Ageing
Because people are living longer and healthier than ever before, it is right that people should
work longer before they claim a state pension.
Agree/ Do not agree
Once you are retired, you no longer play a part in the prosperity of the country Agree/ Do not agree
The high number of older people in the UK makes the economy less competitive compared to
countries with a low number of older people.
Agree/ Do not agree
Perceptions of an Ageing Society
Currently, around two per cent of the population in the UK is aged 85+. What percentage of the
UK population do you think will be aged 85+ in 2050?
Three per cent; Six per
cent; Ten per cent; Fifteen
per cent; Twenty five per
cent
As a society we overestimate the impact of an ageing society. Agree/ Do not agree
In addition, data were supplied on respondents’ gender, region/country of residence, age group,
marital status, economic activity and social class. We simplified region/country of residence to
reflect Northern England, Southern England, Wales, Scotland and Northern Ireland. Economic
activity reflected whether respondents were either working full-time, part-time or not at all. Social
class grouped respondents through the National Readership Survey classification system as being
upper or middle class (AB), lower middle class (C1), skilled working class (C2) or working class
(DE). Social class is based on the occupation of the chief income earner in the household. For
those who are unemployed, social class reflects the previous job if the length of unemployment is
less than 6 months, but is categorised to ‘E’ for those who are unemployed for longer than 6
months. For those who are retired, social class is based on previous occupation for those in
receipt of a company pension, although for those living on the state pension alone they are
categorised to ‘E’.
13
Methods
We utilised a combination of bivariate and regression analyses to investigate the results. Bivariate
analyses were conducted through cross-tabulation techniques and interpretation of measures of
association. Regression analyses were conducted through either logistic regression models for
binary outcomes or through multinomial logistic regression models for categorical outcomes. We
pay consideration to some patterns that may be conventionally deemed as borderline statistically
significant (p<0.08), in addition to those that fall within the traditional five per cent cut-off point. One
caveat of the results worthy of highlighting here is the relatively low statistical power from a sample
size of 1000 and the increased potential to fail to reject a false null hypothesis. A fuller set of
caveats is outlined in the appendix. Results were analysed using weights provided by GfK-NOP
and all analyses were conducted by ILC-UK1.
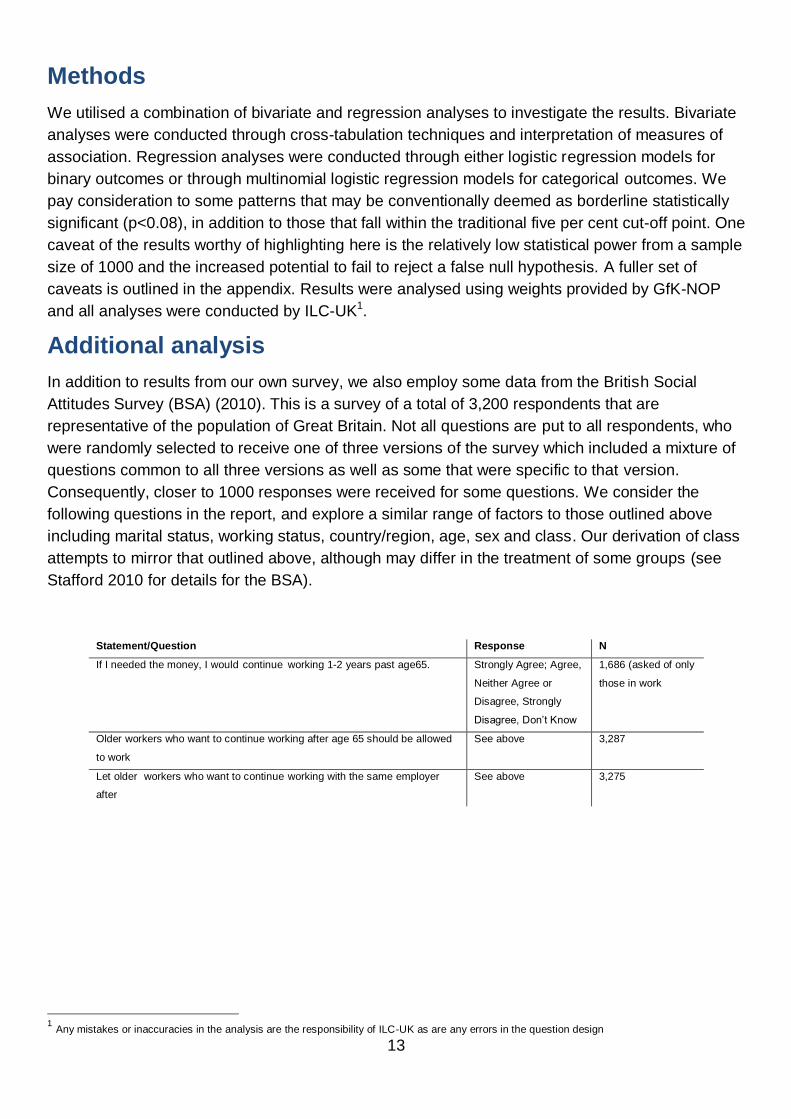
Additional analysis
In addition to results from our own survey, we also employ some data from the British Social
Attitudes Survey (BSA) (2010). This is a survey of a total of 3,200 respondents that are
representative of the population of Great Britain. Not all questions are put to all respondents, who
were randomly selected to receive one of three versions of the survey which included a mixture of
questions common to all three versions as well as some that were specific to that version.
Consequently, closer to 1000 responses were received for some questions. We consider the
following questions in the report, and explore a similar range of factors to those outlined above
including marital status, working status, country/region, age, sex and class. Our derivation of class
attempts to mirror that outlined above, although may differ in the treatment of some groups (see
Stafford 2010 for details for the BSA).
Statement/Question Response N
If I needed the money, I would continue working 1-2 years past age65. Strongly Agree; Agree,
Neither Agree or
Disagree, Strongly
Disagree, Don’t Know
1,686 (asked of only
those in work
Older workers who want to continue working after age 65 should be allowed
to work
See above 3,287
Let older workers who want to continue working with the same employer
after
See above 3,275
1 Any mistakes or inaccuracies in the analysis are the responsibility of ILC-UK as are any errors in the question design

14
Healthier Ageing and a Healthy Society
Can people influence their health and live a healthier older
age?
Most people (almost nine-in-ten) believe that if people stop smoking and eat a balanced diet,
they can not only live to an older age, but live a healthier life in old age.
Data from a representative sample of UK adults show that the majority of people agree that ‘if
people stop smoking and eat a balanced diet, they can not only live to an older age, but live a
healthier life in old age’. Almost nine-in-ten people surveyed (88%) agreed with this statement,
although one-in-ten people did not agree (12%). There were few socioeconomic or demographic
factors that statistically significantly influenced response patterns. Region did exert some influence
over response patterns, with people in Scotland less likely to agree (81%) that people’s lifestyle
could enable them to live a longer and healthier older age than other regions, and those in Wales
more likely to agree (94%); while regional effects as a whole contributed little to explaining
response patterns, the difference between Welsh and Scottish people’s attitudes on this factor did
achieve borderline statistical significance – a larger sample may have detected stronger
differences.
How much relative influence do people feel they have on
their health?
Most people (just over three-quarters) believe that they are in charge of their own health more
than other parties including the government, their hospital or GP.
Social class and age are two significant influencers on the way people perceive their degree of
control over their own health
People in lower social classes are around 40 per cent less likely than those in the highest
social class to agree that they are more in charge of their own health more than other parties
including the government, their hospital or GP, after controlling for other factors.
People aged 45-64 years are around twice as likely as younger people aged 16-24 years to
agree that they are more in charge of their own health more than other parties including the
government, their hospital or GP, after controlling for other factors.
Survey participants were asked whether they exerted greater influence over their own day-to-day
health more than any other party, for example the government, local hospital or GP. This question
was formed in response to a greater emphasis on personal responsibility in public health policy
with the expectation and that the public become more active consumers in taking care of their own
health. Overall, three-quarters of respondents believe that they are in charge of their own health
more than other parties (76%). Bivariate analyses indicated that several factors did statistically
influence response patterns to this question, although these differences were not always
statistically significant. One factor that did statistically significantly influence was social class
15
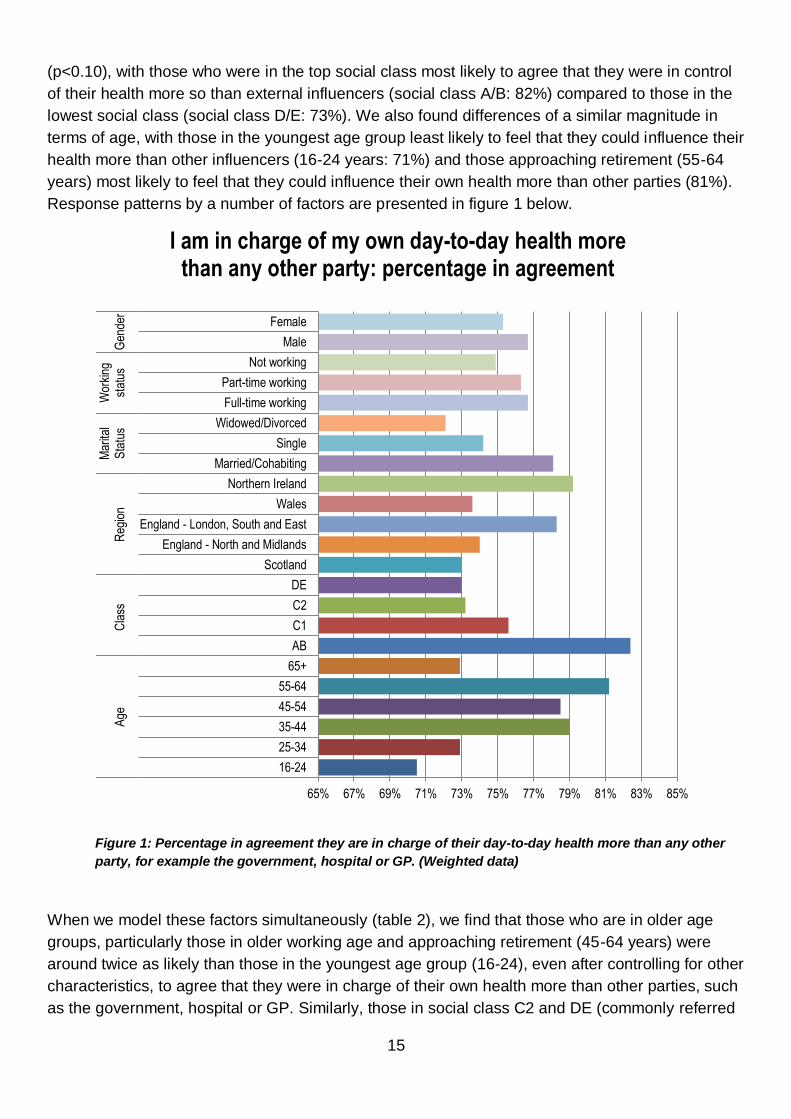
(p<0.10), with those who were in the top social class most likely to agree that they were in control
of their health more so than external influencers (social class A/B: 82%) compared to those in the
lowest social class (social class D/E: 73%). We also found differences of a similar magnitude in
terms of age, with those in the youngest age group least likely to feel that they could influence their
health more than other influencers (16-24 years: 71%) and those approaching retirement (55-64
years) most likely to feel that they could influence their own health more than other parties (81%).
Response patterns by a number of factors are presented in figure 1 below.
Figure 1: Percentage in agreement they are in charge of their day-to-day health more than any other
party, for example the government, hospital or GP. (Weighted data)
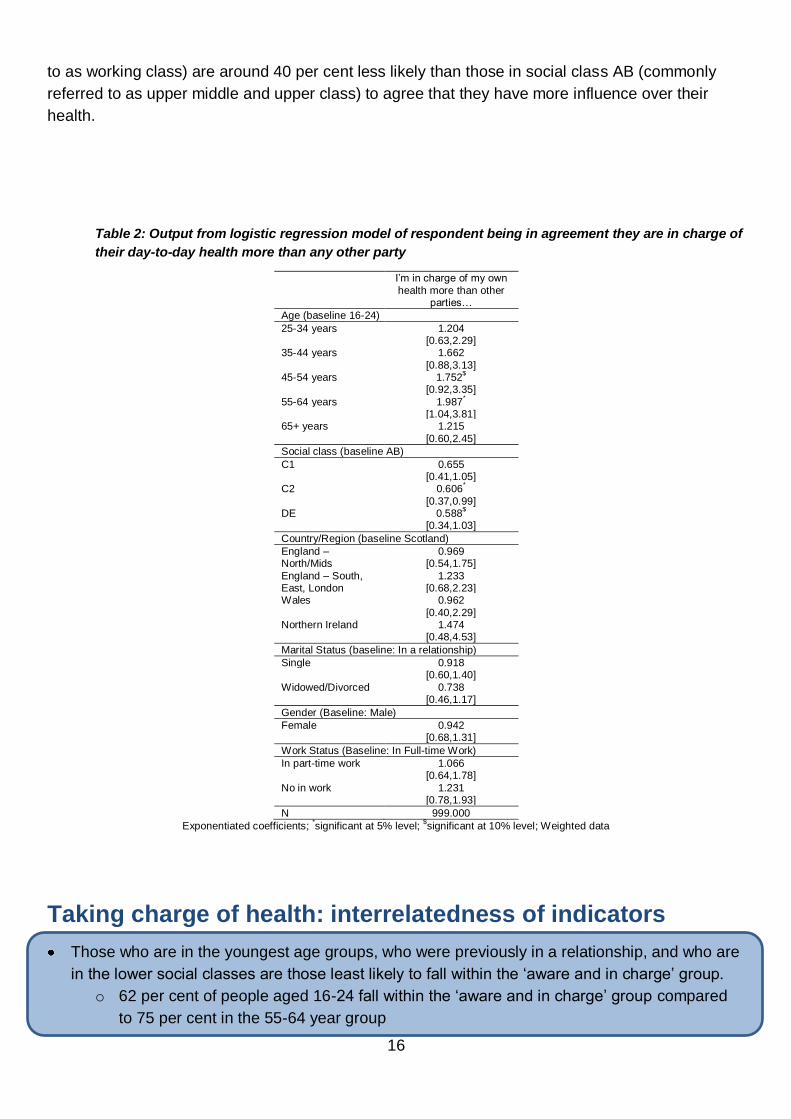
When we model these factors simultaneously (table 2), we find that those who are in older age
groups, particularly those in older working age and approaching retirement (45-64 years) were
around twice as likely than those in the youngest age group (16-24), even after controlling for other
characteristics, to agree that they were in charge of their own health more than other parties, such
as the government, hospital or GP. Similarly, those in social class C2 and DE (commonly referred
65% 67% 69% 71% 73% 75% 77% 79% 81% 83% 85%
16-24
25-34
35-44
45-54
55-64
65+
AB
C1
C2
DE
Scotland
England - North and Midlands
England - London, South and East
Wales
Northern Ireland
Married/Cohabiting
Single
Widowed/Divorced
Full-time working
Part-time working
Not working
Male
Female
Age
Cla
ssR
egio
nM
arita
lS
tatu
sW
orki
ngst
atus
Gen
der
I am in charge of my own day-to-day health more than any other party: percentage in agreement
16
to as working class) are around 40 per cent less likely than those in social class AB (commonly
referred to as upper middle and upper class) to agree that they have more influence over their
health.
Table 2: Output from logistic regression model of respondent being in agreement they are in charge of
their day-to-day health more than any other party
I’m in charge of my own
health more than other parties…
Age (baseline 16-24)
25-34 years 1.204 [0.63,2.29] 35-44 years 1.662
[0.88,3.13] 45-54 years 1.752
$
[0.92,3.35]
55-64 years 1.987*
[1.04,3.81] 65+ years 1.215
[0.60,2.45]
Social class (baseline AB)
C1 0.655 [0.41,1.05] C2 0.606
*
[0.37,0.99] DE 0.588
$
[0.34,1.03]
Country/Region (baseline Scotland)
England – North/Mids
0.969 [0.54,1.75]
England – South, East, London
1.233 [0.68,2.23]
Wales 0.962
[0.40,2.29] Northern Ireland 1.474 [0.48,4.53]
Marital Status (baseline: In a relationship)
Single 0.918 [0.60,1.40]
Widowed/Divorced 0.738 [0.46,1.17]
Gender (Baseline: Male)
Female 0.942 [0.68,1.31]
Work Status (Baseline: In Full-time Work)
In part-time work 1.066 [0.64,1.78]
No in work 1.231 [0.78,1.93]
N 999.000
Exponentiated coefficients; *significant at 5% level;
$significant at 10% level; Weighted data
Taking charge of health: interrelatedness of indicators
Those who are in the youngest age groups, who were previously in a relationship, and who are
in the lower social classes are those least likely to fall within the ‘aware and in charge’ group.
o 62 per cent of people aged 16-24 fall within the ‘aware and in charge’ group compared
to 75 per cent in the 55-64 year group
17
o 75 per cent of those in the top social class (AB) were classed as ‘aware and in charge
compared to 63% in social class C2.
These are groups who may be the least prepared for an era of personal responsibility for
health.
We would expect some degree of association between those who felt that adapting lifestyle factors
would lead to a healthier life later on, and those who believed that they were more influential over
their day to day health than other parties (including the government, local hospital and GP). Those
who agreed with both statements may be those who we could hypothesise are most likely to follow
the advice of public health campaigns and/or health related initiatives and take steps to look after
their own health. When we combine the information, we find that the majority (two-thirds) of the
overall sample agreed with both statements; we label this group as those who believe that their
health can be influenced and is most influenced by their own actions, the ‘aware and in charge’.
Unusually, we found that there wasn’t a strong association between the two indicators with, for
example, those who believed that they were in charge of their own health more than other parties
being no more likely than those who didn’t also agree that a healthy lifestyle can lead to a healthier
old age. However, when we examine the probability of being ‘aware and in charge’, finding through
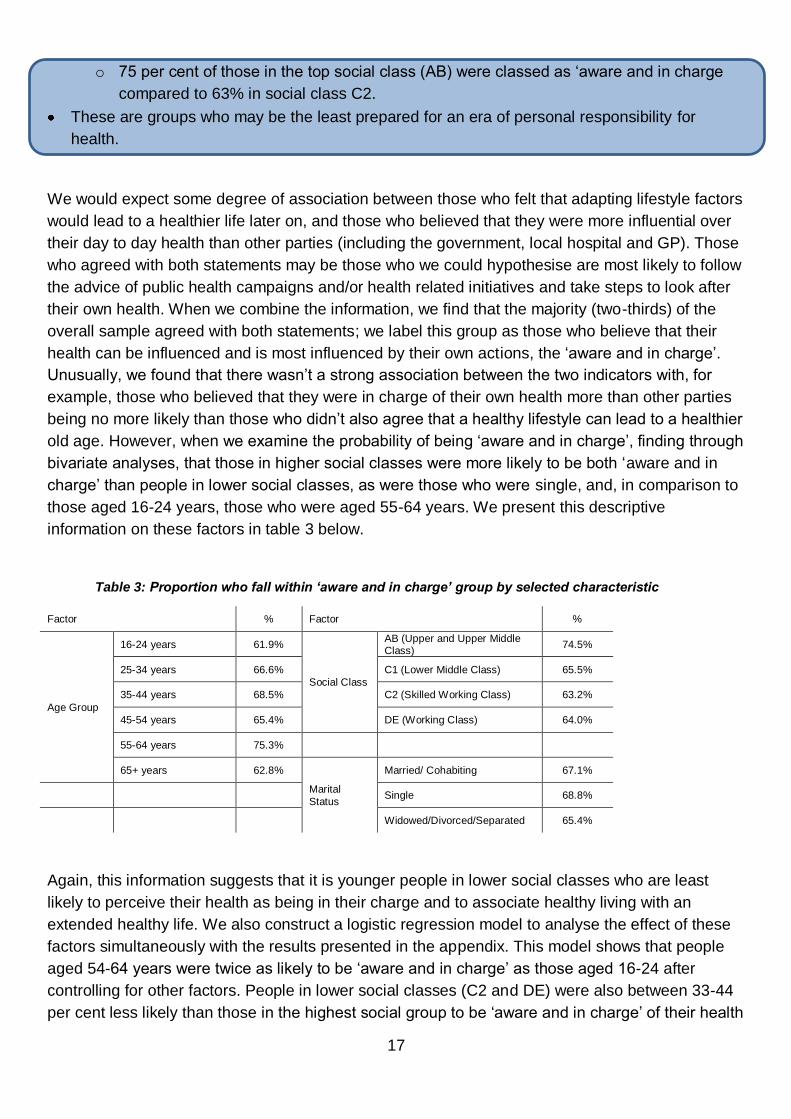
bivariate analyses, that those in higher social classes were more likely to be both ‘aware and in
charge’ than people in lower social classes, as were those who were single, and, in comparison to
those aged 16-24 years, those who were aged 55-64 years. We present this descriptive
information on these factors in table 3 below.
Table 3: Proportion who fall within ‘aware and in charge’ group by selected characteristic
Factor % Factor %
Age Group
16-24 years 61.9%
Social Class
AB (Upper and Upper Middle Class)
74.5%
25-34 years 66.6% C1 (Lower Middle Class) 65.5%
35-44 years 68.5% C2 (Skilled Working Class) 63.2%
45-54 years 65.4% DE (Working Class) 64.0%
55-64 years 75.3%
65+ years 62.8%
Marital
Status
Married/ Cohabiting 67.1%
Single 68.8%
Widowed/Divorced/Separated 65.4%
Again, this information suggests that it is younger people in lower social classes who are least
likely to perceive their health as being in their charge and to associate healthy living with an
extended healthy life. We also construct a logistic regression model to analyse the effect of these
factors simultaneously with the results presented in the appendix. This model shows that people
aged 54-64 years were twice as likely to be ‘aware and in charge’ as those aged 16-24 after
controlling for other factors. People in lower social classes (C2 and DE) were also between 33-44
per cent less likely than those in the highest social group to be ‘aware and in charge’ of their health
18
in a regression model. Finally, marital status remained a significant predictor2, with those who had
been in a relationship but were no longer (widowed, divorced or separated) around 30 per cent
less likely than those who were in a relationship to be categorised in the aware and in charge
group.
From a public health perspective while it is encouraging that the majority of the sample do fall
within the ‘aware and in charge’ group, the results also signal that the likelihood of being in this
group remains significantly patterned by socioeconomic status, which are known to lead to
substantial health inequalities (for example Marmot 2010). These pronounced differences by social
group represent a substantial cause for concern as those in lower socioeconomic groups are
known to be most vulnerable to adopting negative behaviours (for example Mackenbach et al
2008, McMunn et al 2006). Furthermore early adoption of these behaviours is known to have
negative consequences across the lifecourse, reaching into older age. In addition, younger people
and those from lower socioeconomic groups are more likely to deem other parties to be in charge
of their day to day health, these groups are also likely to be those that engage the least with
healthcare providers (Mercer and Watt 2007). In summary, those who are at greatest risk of
adverse health outcomes are also those who are highlighted here as being unlikely to view
themselves as the prime influences of their day-to-day health status, and are less likely to view
good health in later life to rest on the adoption of healthy lifestyle behaviours. In an era of
increasing personal responsibility for health those who are younger and in lower social classes
may find the new ‘responsibility deal’ to be a significant challenge. However, two-thirds of adults
are categorised as being both aware (that a healthy lifestyle can lead to a healthier old age) and in
charge of their health (of their day-to-day health compared to other parties such as the
government, hospital or GP).
The future of a free health service
Almost half of adults (45%) believe that the NHS will not be able to provide a service that is free
at the point of use because of population ageing.
Those in the lowest social class3 and those in Northern Ireland are some of the groups who are
most likely to believe that the NHS will not continue in the same fashion in the future because
of an ageing population - over half of both groups express this attitude.
One of the strongest predictors of whether people thought the NHS would change in delivery
because of population ageing was their attitudes regarding their own influence over their day-
to-day health. Those who thought that they were in charge of their day-to-day health more than
other parties were 50 per cent more likely than those who did not to express scepticism over
the future continuation of the NHS after controlling for other factors.
Respondents were asked to consider the consequences of population ageing on the health
service. Specifically, they were asked whether they agreed with the statement that ‘because of
population ageing this country is unlikely to be able to afford a universally available NHS free at
the point of use in years to come’. There was an almost even split of responses among the adults
surveyed, slightly fewer agreeing with the statement (45%) than did not agree with the statement
2 At the ten per cent level.
3 Differences by social class achieved borderline significance which may reflect sample size.
19
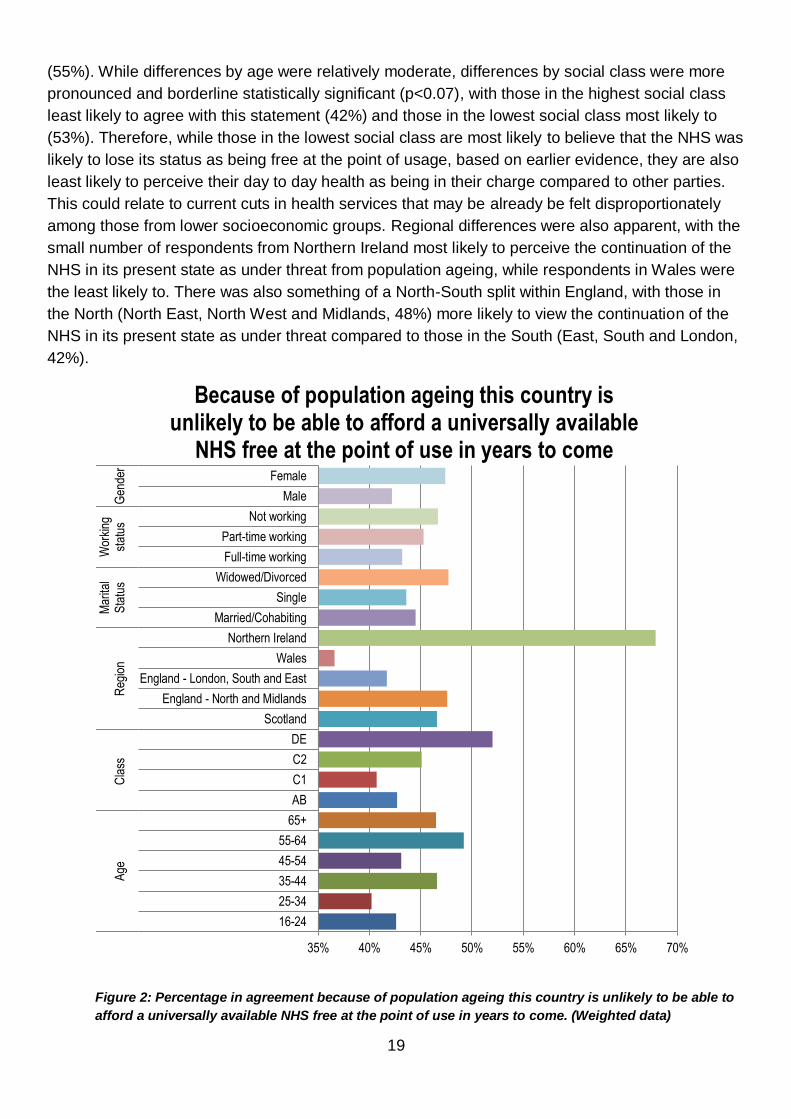
(55%). While differences by age were relatively moderate, differences by social class were more
pronounced and borderline statistically significant (p<0.07), with those in the highest social class
least likely to agree with this statement (42%) and those in the lowest social class most likely to
(53%). Therefore, while those in the lowest social class are most likely to believe that the NHS was
likely to lose its status as being free at the point of usage, based on earlier evidence, they are also
least likely to perceive their day to day health as being in their charge compared to other parties.
This could relate to current cuts in health services that may be already be felt disproportionately
among those from lower socioeconomic groups. Regional differences were also apparent, with the
small number of respondents from Northern Ireland most likely to perceive the continuation of the
NHS in its present state as under threat from population ageing, while respondents in Wales were
the least likely to. There was also something of a North-South split within England, with those in
the North (North East, North West and Midlands, 48%) more likely to view the continuation of the
NHS in its present state as under threat compared to those in the South (East, South and London,
42%).
Figure 2: Percentage in agreement because of population ageing this country is unlikely to be able to
afford a universally available NHS free at the point of use in years to come. (Weighted data)
35% 40% 45% 50% 55% 60% 65% 70%
16-24
25-34
35-44
45-54
55-64
65+
AB
C1
C2
DE
Scotland
England - North and Midlands
England - London, South and East
Wales
Northern Ireland
Married/Cohabiting
Single
Widowed/Divorced
Full-time working
Part-time working
Not working
Male
Female
Age
Cla
ssR
egio
nM
arita
lS
tatu
sW
orki
ngst
atus
Gen
der
Because of population ageing this country is unlikely to be able to afford a universally available
NHS free at the point of use in years to come
20
When we considered the factors in figure 2 simultaneously, we found that country/region continued
to exhibit some influence in dictating responses. However, we also considered earlier results, and
examined whether perceptions of who was most in charge of respondents’ day-to-day health
(themselves or another party) were also significant predictors of people’s scepticism about the
ability of the NHS to continue to be free at the point of use in light of population ageing, and found
a significant association. Those who viewed themselves as being more in charge of their day-to-
day health were also those who were more likely to agree that population ageing would push the
NHS to charge at the point of usage (47%) compared to those who did not see themselves as
primarily in charge of their day-to-day health (38%). This could suggest that those who lay the
main responsibility for their own health on themselves do so alongside higher levels of pessimism
about the future of the NHS; this may even be related to current perceptions of the NHS, although
we are unable to explore such a notion here. When we model all factors simultaneously through a
logistic regression model, we find that this latter result holds, and that those who feel that they are
in charge of their day-to-day health are 50 per cent more likely (than those who do not) to think
that the continuation of the NHS being free at the point of contact is under threat due to population
ageing.
21
The Economics of Living Longer
Living Longer and Working Longer?
Just over two-fifths of people agree that because people are living longer and healthier it is
right that people work longer before they can claim a state pension by age group.
People aged 45-54 years and people in social class C2 (‘skilled working class’) are those least
likely to agree with this sentiment.
Despite the rapidly increased pension aged for women in the age group 55-64 years, they were
not significantly less likely than women of other age groups, or men of the same age group, to
agree that people should work longer before claiming a state pension.
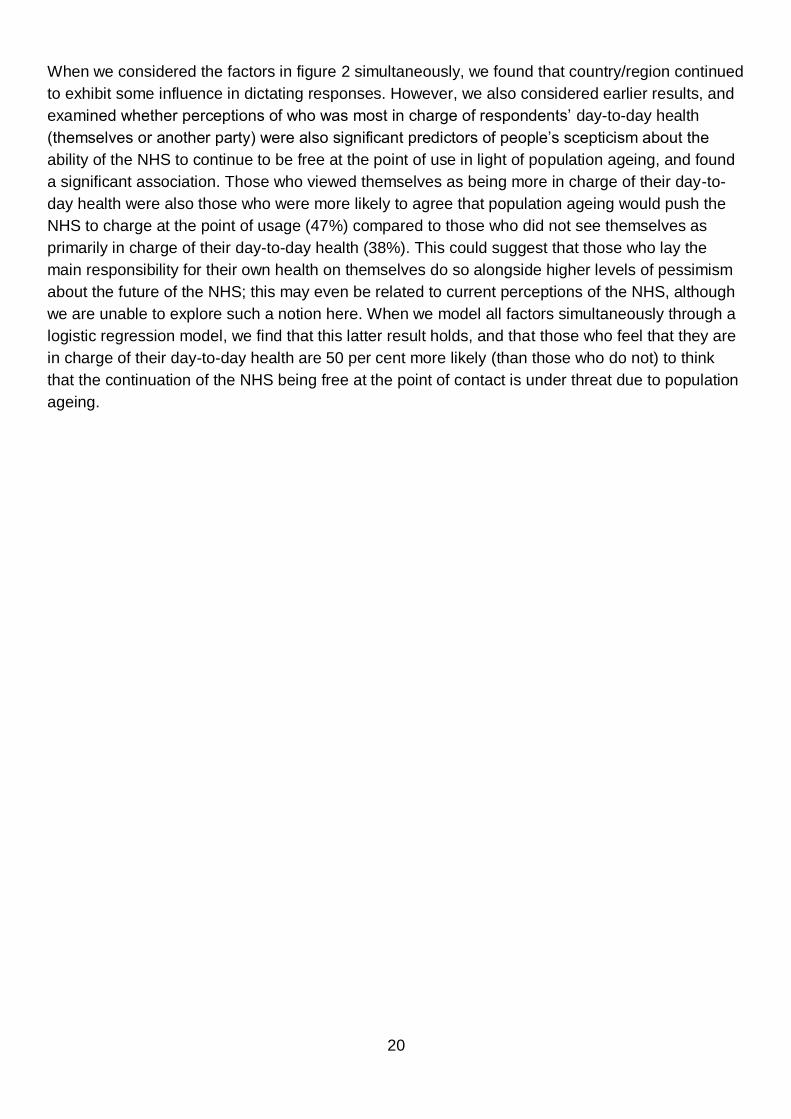
When a representative population of UK adults were asked about their opinions on whether
‘because people are living longer and healthier than ever before, it is right that people should work
longer before they claim a state pension’, less than half agreed with this statement (42%). The
response pattern exhibited an unusual pattern by age group, with those in the youngest (16-24)
and oldest age groups (65+) most likely to agree with this statement (47% in both cases, figure 3).
Figure 3: Percentage in agreement because of population ageing it is right that people work longer
before they can claim a state pension by age group (Weighted data)
Social class significantly predicted response patterns, with those in the highest social class most
likely to agree that people should work longer before claiming a pension (49%) and those in social
class C2 (skilled working class) the least likely to (34%). People in Southern England (South, East
and London) were also more likely to agree (46%) than those in other countries/areas, for example
0.0%
5.0%
10.0%
15.0%
20.0%
25.0%
30.0%
35.0%
40.0%
45.0%
50.0%
16-24 25-34 35-44 45-54 55-64 65+ Total
Because of population ageing, it is right that people work longer before they can claim a
state pension (% in agreement)
22
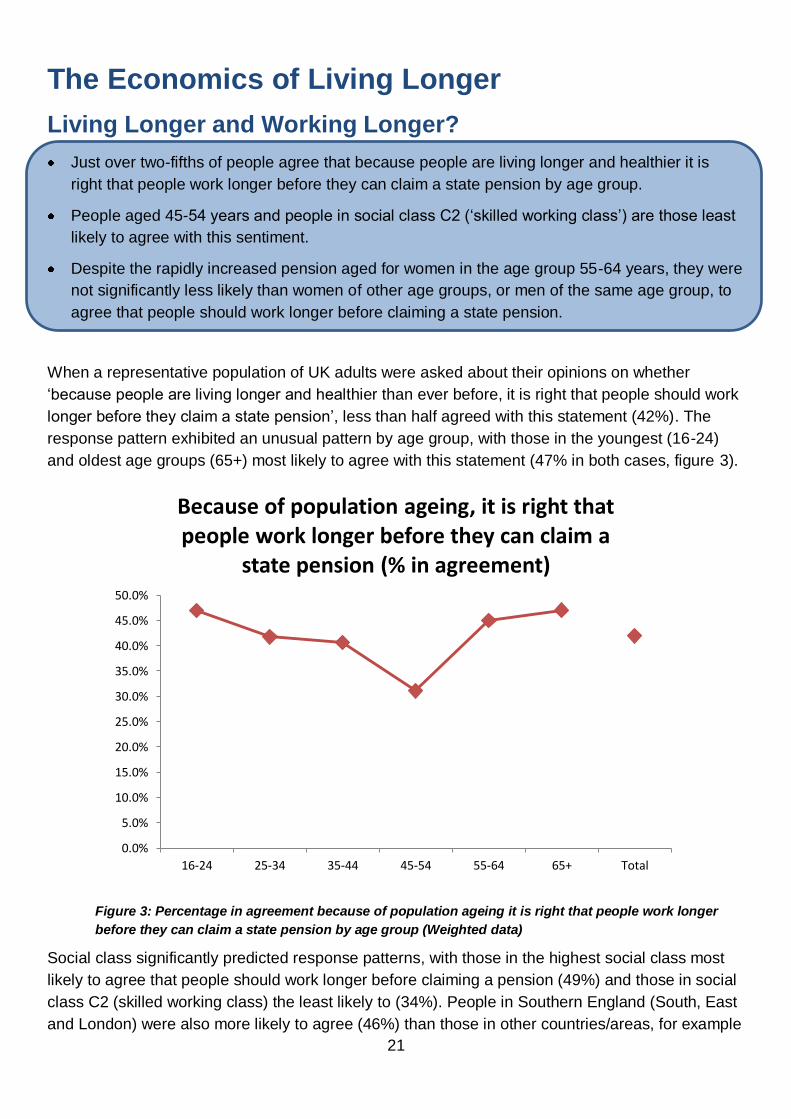
Scotland (29%), that people should work longer before claiming the state pension, although
regional effects on the whole were not statistically significant4. While the age of eligibility for the
state pension has risen relatively quickly for women born 1950-1953 from 60 to 65 years (for
women aged 55-64 in this sample), there was no evidence that women in this age group were
significantly more likely to agree (or not to agree) with a rising pension age than women of other
ages or men of the same age. However, people aged 45-54 years, who will be among the first
group to see the pension age rise from 66 to 67 years, were those least likely to agree that people
should work longer. When we examine the effect of these factors simultaneously through a logistic
regression model (see figure 4 for depiction of odds ratios), we find that this latter age group
remained around half as likely to agree that people should work longer than those in the youngest
age group; similarly those in social group C2 were around half as likely to agree that people should
work longer than those in the top social group.
Figure 4: Odds of being in agreement that because people are living longer and healthier it is
right that people work longer before they can claim a state pension by age group (Weighted
data)
4 Sample size was perhaps a factor contributing to a lack of overall statistical significance.
0 1 1 2 2
16-24
25-34
35-44
45-54
55-64
65+
AB
C1
C2
DE
Scotland
England - North and Midlands
England - London, South and East
Wales
Northern Ireland
Married/Cohabiting
Single
Widowed/Divorced
Full-time working
Part-time working
Not working
Male
Female
Age
Cla
ssR
egio
nM
arita
lS
tatu
sW
orki
ngst
atus
Gen
der
People are living longer and healthier than ever before, people should work longer before they
claim a state pension: Odds of Agreement

23
Older people and economic prosperity
• Those who agree that retirees play no part in the economic prosperity of the country are in the
minority (17%).
• Social class continued to significantly pattern responses after accounting for other factors
(listed in the data and methods section), and those in the lowest social class were twice as
likely as those in the highest social class to agree that retirees play no part in the economic
prosperity of the country.
Less than a fifth of people (17%) agreed that once people retire, they play no part in the economic
prosperity of the country. This could suggest that the majority of the population view the unpaid
work that is often associated with older people, such as volunteering, caring and grandparental
childcare, as being necessary to the economic prosperity of the country. Interestingly, older people
themselves were the most likely to agree that retirees played no part in the economic prosperity of
the country (65+ years, 22% agree), while younger age groups were the least likely (<16% among
those aged 44 years and under), although this difference was not statistically significant. People in
the lowest social class were more likely compared to those in the highest to agree (DE group:27%
versus AB group:14%), as were those who were not working (including retired people: 24%)
compared to those who in some form of work (15-16%)5. Our use of logistic regression (see
appendix) showed that social class continued to be a significant factor in influencing people’s
perceptions about the country’s economic prosperity after controlling for a number of factors; those
in the lowest social class (DE: unskilled working class) were approximately twice as likely as those
in the top social class (AB: upper and upper middle class) to agree that retirees did not play a part
in the economic prosperity of the country.
Older people and economic competitiveness
Almost two-fifths of adults think that the UK’s ageing population is a threat to our economic
competitiveness with other nations (38%).
Responses to this question were not statistically significantly influenced by socioeconomic and
demographic factors, although were significantly influenced by other responses.
When we analysed responses to questions on whether people should be eligible for state
pension age at a later age and whether the UK demography interfered with the economic
competitiveness jointly, we found that most adults (57%) agreed with neither sentiment.
While only a minority of people thought that retirees held no part to play in the economic prosperity
of the country, greater numbers of people agreed that the high number of older people in the UK
makes the economy less competitive compared to countries with a low number of older people,
with almost two-fifth (38%) agreeing with this statement. Responses to this statement were not
5 Borderline significant results (p<0.06). Further investigations revealed that this difference was generally not attributable to age effects.
24
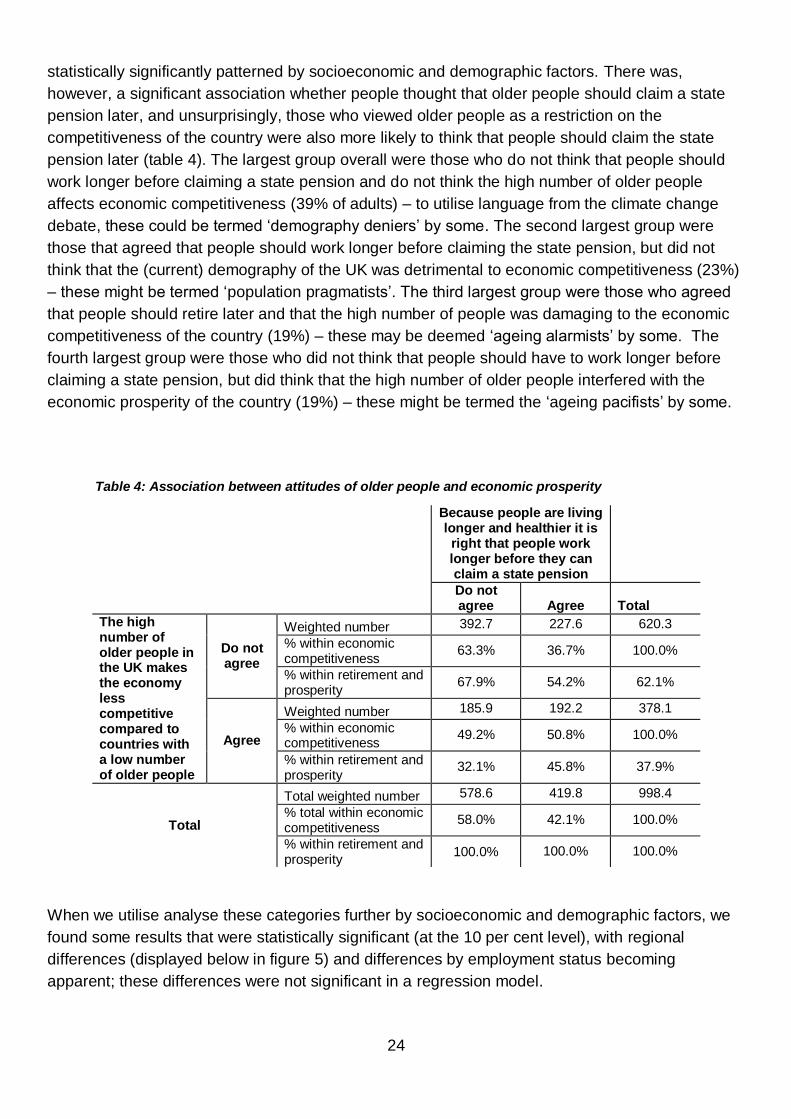
statistically significantly patterned by socioeconomic and demographic factors. There was,
however, a significant association whether people thought that older people should claim a state
pension later, and unsurprisingly, those who viewed older people as a restriction on the
competitiveness of the country were also more likely to think that people should claim the state
pension later (table 4). The largest group overall were those who do not think that people should
work longer before claiming a state pension and do not think the high number of older people
affects economic competitiveness (39% of adults) – to utilise language from the climate change
debate, these could be termed ‘demography deniers’ by some. The second largest group were
those that agreed that people should work longer before claiming the state pension, but did not
think that the (current) demography of the UK was detrimental to economic competitiveness (23%)
– these might be termed ‘population pragmatists’. The third largest group were those who agreed
that people should retire later and that the high number of people was damaging to the economic
competitiveness of the country (19%) – these may be deemed ‘ageing alarmists’ by some. The
fourth largest group were those who did not think that people should have to work longer before
claiming a state pension, but did think that the high number of older people interfered with the
economic prosperity of the country (19%) – these might be termed the ‘ageing pacifists’ by some.
Table 4: Association between attitudes of older people and economic prosperity
Because people are living longer and healthier it is right that people work longer before they can claim a state pension
Do not agree Agree Total
The high number of older people in the UK makes the economy less competitive compared to countries with a low number of older people
Do not agree
Weighted number 392.7 227.6 620.3
% within economic competitiveness
63.3% 36.7% 100.0%
% within retirement and prosperity
67.9% 54.2% 62.1%
Agree
Weighted number 185.9 192.2 378.1
% within economic competitiveness
49.2% 50.8% 100.0%
% within retirement and prosperity
32.1% 45.8% 37.9%
Total
Total weighted number 578.6 419.8 998.4
% total within economic competitiveness
58.0% 42.1% 100.0%
% within retirement and prosperity
100.0% 100.0% 100.0%
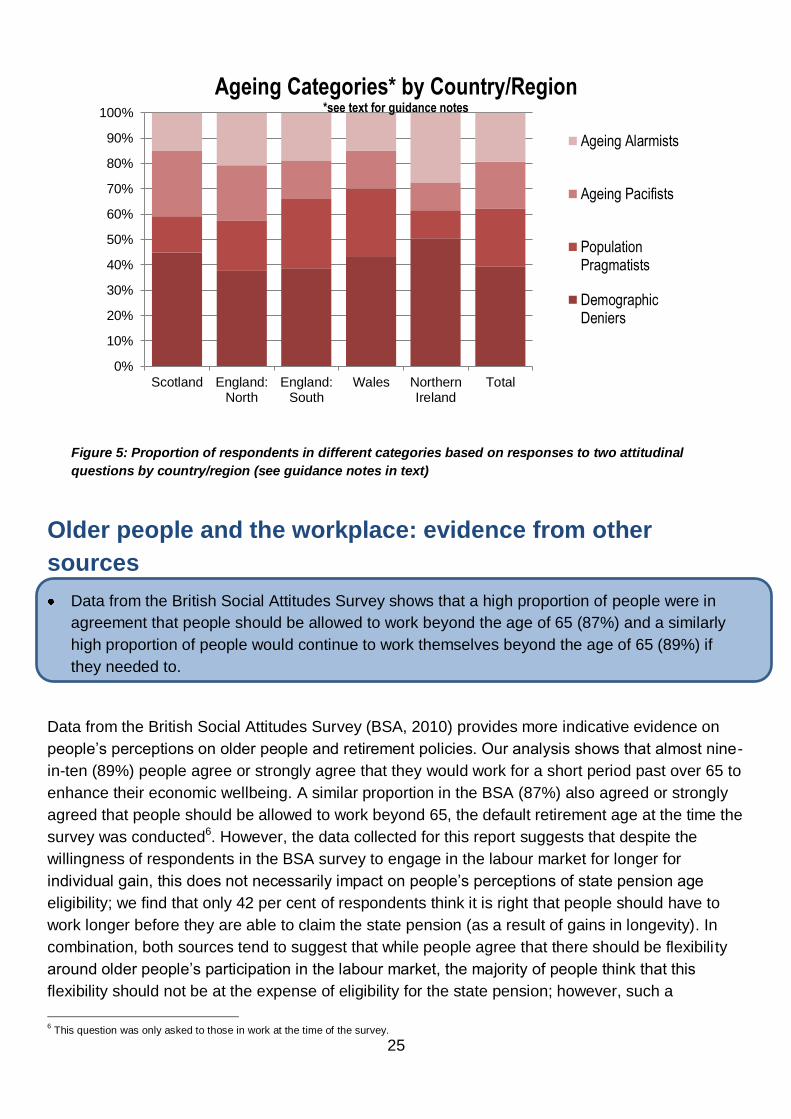
When we utilise analyse these categories further by socioeconomic and demographic factors, we
found some results that were statistically significant (at the 10 per cent level), with regional
differences (displayed below in figure 5) and differences by employment status becoming
apparent; these differences were not significant in a regression model.
25
Figure 5: Proportion of respondents in different categories based on responses to two attitudinal
questions by country/region (see guidance notes in text)
Older people and the workplace: evidence from other
sources
Data from the British Social Attitudes Survey shows that a high proportion of people were in
agreement that people should be allowed to work beyond the age of 65 (87%) and a similarly
high proportion of people would continue to work themselves beyond the age of 65 (89%) if
they needed to.
Data from the British Social Attitudes Survey (BSA, 2010) provides more indicative evidence on
people’s perceptions on older people and retirement policies. Our analysis shows that almost nine-
in-ten (89%) people agree or strongly agree that they would work for a short period past over 65 to
enhance their economic wellbeing. A similar proportion in the BSA (87%) also agreed or strongly
agreed that people should be allowed to work beyond 65, the default retirement age at the time the
survey was conducted6. However, the data collected for this report suggests that despite the
willingness of respondents in the BSA survey to engage in the labour market for longer for
individual gain, this does not necessarily impact on people’s perceptions of state pension age
eligibility; we find that only 42 per cent of respondents think it is right that people should have to
work longer before they are able to claim the state pension (as a result of gains in longevity). In
combination, both sources tend to suggest that while people agree that there should be flexibili ty
around older people’s participation in the labour market, the majority of people think that this
flexibility should not be at the expense of eligibility for the state pension; however, such a
6 This question was only asked to those in work at the time of the survey.
0%
10%
20%
30%
40%
50%
60%
70%
80%
90%
100%
Scotland England:North
England:South
Wales NorthernIreland
Total
Ageing Categories* by Country/Region *see text for guidance notes
Ageing Alarmists
Ageing Pacifists
PopulationPragmatists
DemographicDeniers
26
statement does come with caveats, many of which are outlined in the concluding section. In
addition, while data from the BSA suggests that there is support for allowing older people to
continue in the workplace, there was less enthusiasm for allowing older people to continue with the
same employer, with 63 per cent of respondents agreeing or strongly agreeing that older workers
(65+) who want to continue working with the same employer should be able to do so. This could
suggest that while the majority of people do agree with individual flexibility in terms of the ability of
older people to continue in the workplace, they are less sure how this flexibility should be afforded
in terms of employer policies.
Some interesting differences were also apparent in the BSA sample by age and class. Those
classified in the highest social class were more inclined to agree that they would continue to work
beyond the age of 65 if they needed the money than those in the lowest social class (92% (AB)
compared to 85% (DE)). However, those in the lowest social class were more likely to agree or
strongly agree that people over the age of 65 should be allowed to continue to work with the same
employer (64% (DE) compared to 58% (AB)), although there were no significant differences by
class in terms of agreement as to whether older people should be allowed to work over the age of
65 if they wanted to in general. Younger age groups were significantly more likely than older age
groups to agree or strongly that older people should be allowed to work over the age of 65 if they
wanted to (for example 93% of those aged 16-24 compared to 84% aged 65 and over). However,
younger and older attitudes did not significantly differ as to whether they would personally work
longer or whether they thought older workers should continue with the same employer.
Together, both the BSA data and data from our own survey point to some interesting trends by age
and class. We find that younger people are more likely than middle aged people to think that
people should work longer before claiming state pension, and are more likely than older people to
think that workplace policies should allow for older people to continue to work beyond the age of
65 years. However, it is not possible to disaggregate from these data whether this is an artefact of
a change in attitudes across different age cohorts, or whether this is a reflection of the way that
attitudes naturally change with age. In the case of social class, those in lower social classes were
less likely to think people should have to work longer before being eligible for the state pension
and were less likely to say that they would want to work beyond the age of 65 years themselves.
Several factors may explain these differences that are known to vary by social class, which are not
fully explored here, including differences in health and industry of occupation may alter people’s
ability to continue in the labour market.
27
Is the UK an ageing population?
How many oldest old will there be?
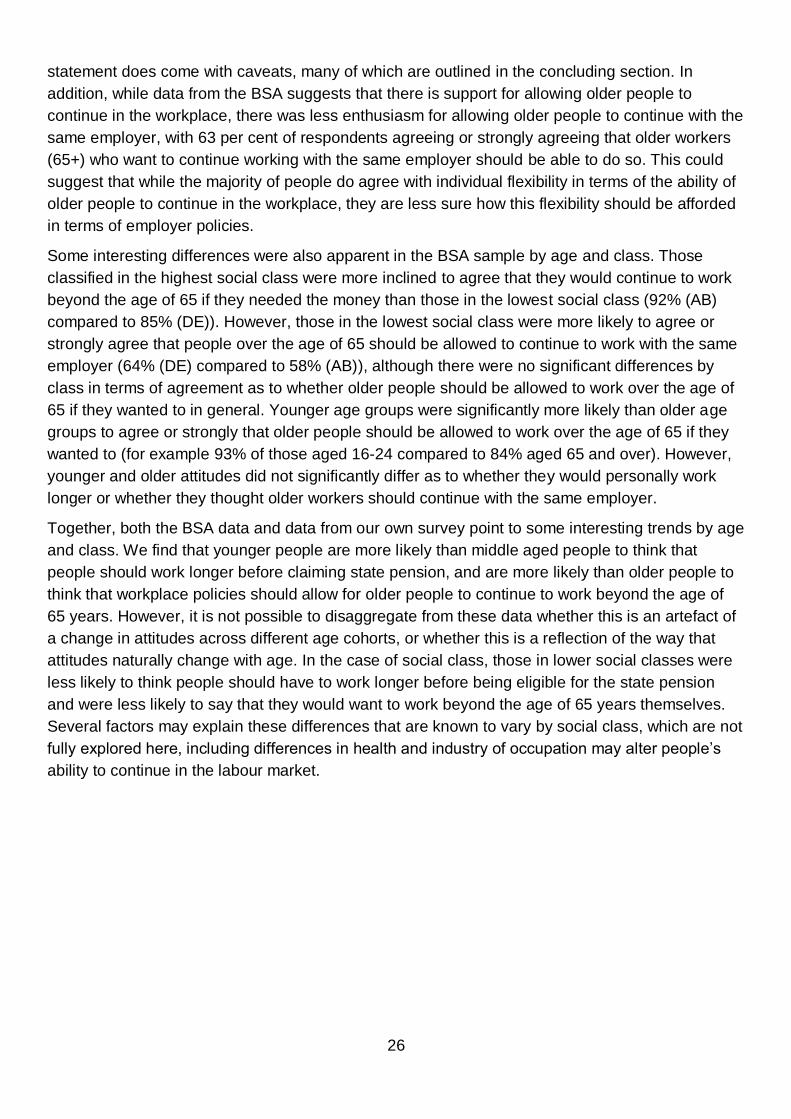
Over three-fifths of adults indicated that the proportion of oldest old (85+ years) in 2050 would
lie between 3-10%; these were close to the projected estimate of 6 per cent.
One-in-ten people did not think that the proportion of older people would rise from the current
two per cent, while a further one-in-ten respondents thought that as much as a quarter of the
population would be aged 85 and over in 2050.
Age was one of the few influencers over responses to this question; older people were more
likely to significantly overestimate the future population of oldest old while younger people were
significantly more likely to state that there would be no growth in this population.
Population ageing can be expressed through numerous current and projected statistics, including
the population of the ‘oldest old’ (aged 85 and over). Currently, just over 2% of the UK population
is aged 85 and over, although by 2050 the population is expected to rise to six per cent (Office for
National Statistics 2011), including over 300,000 centenarians. Respondents to the survey were
given the current proportion of the population aged 85 and over and were asked what the
proportion would be in 2050. Responses were clustered around six per cent (29%), and if we take
those who guessed either three or ten per cent, the next closest answers, over three fifths of
respondents gave an answer that was within a close range to the projected number (62%).
Interestingly, over one-in-ten people did not anticipate any growth in the population aged 85 and
over, while a similar proportion expected a quarter of the total population to fall within the ‘oldest
old’ age group.
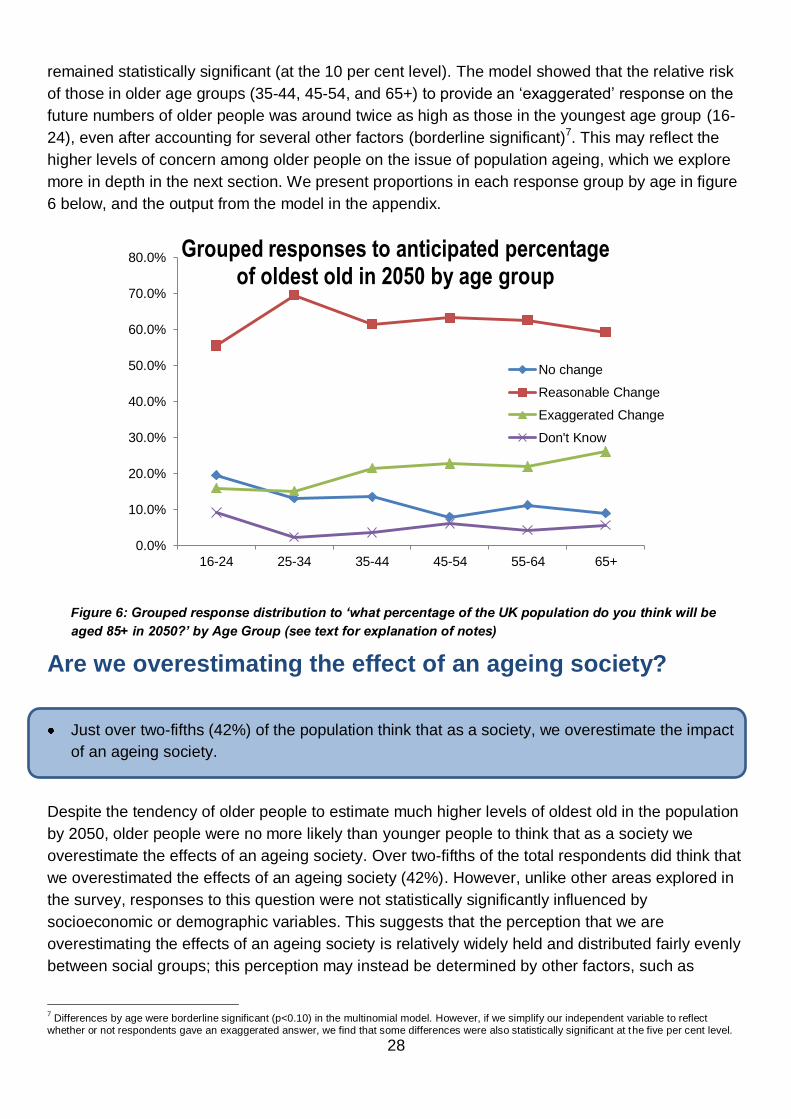
To assist in our interpretation, we group respondents to reflect respondents that don’t anticipate
any growth in the population aged 85 and above (12% of the total responses), those that predict
growth within a reasonable range (62% of the total), those that predict exaggerated growth (22%),
and those were not able to provide an answer (5%). We examined how socioeconomic and
demographic characteristics influenced responses, finding a statistically significant trend for older
people to exaggerate the anticipated proportion of older people in the UK compared to younger
groups. For example, 26 per cent of those in the oldest group thought that older people aged 85
and over would account for 15-25% of the population in 2050, compared to 16% of those aged 16-
24 years. Conversely, almost a fifth (19%) of those in the youngest group thought that the
proportion of those aged 85 and above would not rise, compared to less than one-in-ten of those
aged 65 and over (9%). If we view responses to this question as an interpretation of perceptions of
different age groups have over the ageing population, it would appear that those in the youngest
group are least concerned and those in the oldest age groups most concerned.
Other socioeconomic and demographic factors did not appear to statistically significantly pattern
responses to this question, although we examined whether any of the effects described above for
age could be related to other characteristics through constructing a multinomial logistic regression
models (output in appendix). The results described above in terms of patterns by age generally
28
remained statistically significant (at the 10 per cent level). The model showed that the relative risk
of those in older age groups (35-44, 45-54, and 65+) to provide an ‘exaggerated’ response on the
future numbers of older people was around twice as high as those in the youngest age group (16-
24), even after accounting for several other factors (borderline significant)7. This may reflect the
higher levels of concern among older people on the issue of population ageing, which we explore
more in depth in the next section. We present proportions in each response group by age in figure
6 below, and the output from the model in the appendix.
Figure 6: Grouped response distribution to ‘what percentage of the UK population do you think will be
aged 85+ in 2050?’ by Age Group (see text for explanation of notes)
Are we overestimating the effect of an ageing society?
Just over two-fifths (42%) of the population think that as a society, we overestimate the impact
of an ageing society.
Despite the tendency of older people to estimate much higher levels of oldest old in the population
by 2050, older people were no more likely than younger people to think that as a society we
overestimate the effects of an ageing society. Over two-fifths of the total respondents did think that
we overestimated the effects of an ageing society (42%). However, unlike other areas explored in
the survey, responses to this question were not statistically significantly influenced by
socioeconomic or demographic variables. This suggests that the perception that we are
overestimating the effects of an ageing society is relatively widely held and distributed fairly evenly
between social groups; this perception may instead be determined by other factors, such as
7 Differences by age were borderline significant (p<0.10) in the multinomial model. However, if we simplify our independent variable to reflect
whether or not respondents gave an exaggerated answer, we find that some differences were also statistically significant at the five per cent level.
0.0%
10.0%
20.0%
30.0%
40.0%
50.0%
60.0%
70.0%
80.0%
16-24 25-34 35-44 45-54 55-64 65+
Grouped responses to anticipated percentage of oldest old in 2050 by age group
No change
Reasonable Change
Exaggerated Change
Don't Know
29
educational or personality characteristics, ethnicity, family structure, media exposure or political
persuasion. Similarly, had we have asked whether society or government is prepared for an
ageing society, we may have garnered a very different response distribution. However, the
response to this question suggests that policies aimed at helping society respond to an ageing
society, such as raising of the pension age or new proposals to fund social care in the future, may
be viewed as unnecessary by a fairly large proportion of adults from all walks of life.
Summarising responses
Additional analyses reveal the complexity around measuring attitudes on ageing. We observe
differences in attitudes across different outcomes that may be affected by an ageing society.
We posit that concerns about an ageing society may be tied with wider concerns on some
societal issues, and further work is needed to untangle people’s attitudes towards an ageing
society specifically.
When we examined the relatedness of our indicators of people’s perceptions of ageing further, we
found some unexpected results. For example, we might have expected those who thought that it is
right that people should work longer because of an ageing society (those who see a problem and a
solution) to be much less inclined to also agree that we overestimate the impact of an ageing
society, although we found no evidence to support this notion here. Similarly, we may expect those
who think that population ageing is likely to interrupt the future continuation of the NHS in its
present form to also be less inclined to agree that we overestimate the impact of an ageing
society; in fact, we found a conflicting result where 48 per cent of those who thought population
ageing would interrupt the future continuation of the NHS in its present form also thinking that we
overestimated the effects of population ageing, compared to 38 per cent among those who did not
see population ageing as a threat to the NHS being free at the point of use (a statistically
significant difference). Furthermore, those who overestimated the proportion aged 85 and above
were also more likely to think that the effects of population ageing had been overestimated;
conventionally, we might expect those who give an inflated population estimate to also feel that the
impacts of an ageing society were actually underestimated.
Several reasons may explain these apparent discrepancies. One explanation may revolve around
the way people interpreted the final question on overestimating population ageing from a societal
level, given that many of the patterns suggest that some may have interpreted the question as
being about their own concerns about an ageing society. Similarly, questions about the NHS may
reflect concern and an emotive response from respondents about its future continuation in general,
as opposed to a direct reflection of ageing directly.
We had originally intended to combine some indicators to produce a single score to reflect
attitudes to an ageing population. However, apparent discrepancies suggest that understanding
the interrelatedness of the attitudes on ageing may require further investigation (with a larger
sample), as well as further refining (and piloting) of our questions and indicators. Moreover, these
results suggest that people’s attitudes to ageing may be sensitive in different ways to the future
numbers of older people, the economic consequences, the health consequences, and the
multitude of other domains affected by increased longevity. This analysis throws into doubt the

30
validity of a blanket statement or opinion on ‘the ageing’ population, and highlights some of the
complexities in attempting to understand people’s opinions on the impact of the longevity
revolution.
31
Summary and discussion
Summary
Health behaviours and healthy ageing
Most people (almost nine-in-ten) believe that if people stop smoking and eat a balanced diet, they
can not only live to an older age, but live a healthier life in old age. Similarly, most people (just over
three-quarters) believe that they are in charge of their own health more than other parties including
the government, their hospital or GP. Combined, these suggest that many people may be not only
aware of the health implications brought home by public health campaigns such as ‘Change 4
Life’, but also may be in a position to influence their own day-to-day health through feeling in
charge of their own health. However, these results also point to groups – the young and the less
socioeconomically advantaged – who are less likely to be receptive to movements towards
personal responsibility for health. At a time where people are expected to take greater personal
responsibility for their health, these results suggest that those from lower socioeconomic
backgrounds who already endure significant health inequalities, may be left behind.
Living and working longer
Just over two-fifths of people agree that because people are living longer and healthier it is right
that people work longer before they can claim a state pension by age group, which could suggest
that the majority of people disagree with changes to the pension system. This group varied by age
and social class so that people aged 45-54 years and people in social class C2 (‘skilled working
class’) were those least likely to think that people should have to work longer before being eligible
for the state pension. For the majority of people, retired people continued to play a part in the
economic prosperity of the country (83%), suggesting that most people do place an (economic)
value on the roles that are frequently adopted to retired people, for example volunteering or caring
duties. However, there was greater discord among respondents in terms of higher levels who
thought that the high numbers of older people in the UK were a threat to the nation’s economic
competitiveness (38%) signalling that while people do put an economic value on the role of older
people may take, this role may still not be perceived as (economically) valuable as the role
younger people and younger workers may take.
Perceptions of an ageing society
Over three-fifths of adults indicated that the proportion of oldest old (85+ years) in 2050 would lie
between 3-10%; these were close to the projected estimate of 6 per cent. However, one-in-ten
people did not think that the proportion of older people aged 85 and above would rise from the
current two per cent, while a further one-in-ten respondents thought that as much as a quarter of
the population would be aged 85 and over in 2050. Older people were more likely to significantly
overestimate the future population of oldest old while younger people were significantly more likely
to state that there would be no growth in this population. Crucially, just over two-fifths (42%) of the
population think that as a society, we overestimate the impact of an ageing society. For
organisations that aim to raise awareness of the impacts of rising longevity, and those
organisations that wish to encourage people to plan for the future, these results suggest some
degree of saturation or complacency among the public. The debate on population ageing has been
32
compared to the debate on climate change by some. Climate change deniers have become an
increasingly vilified group, although data from a Department for Environment and Rural Affairs
study suggests that 23 per cent of the population agree or strongly agree that the effects of the ‘so-
called environmental crisis facing humanity have been greatly exaggerated’8. In this respect,
should we believe that the effects of an ageing society have not be overestimated, ‘demographic
deniers’ appear to far outnumber ‘climate change deniers’.
Conclusion
The title of this report, ‘Population Ageing: Pomp or Circumstance’, refers to the debate as to
whether the public believe that population ageing is pomp (or hype) or is circumstance. Perhaps
the most direct evidence on this issue comes from agreement with the statement ‘as a society, we
overestimate the effect of an ageing society’. We can observe that over two-in-five adults agree
with this statement, although unfortunately we do not have the proportions who think that we
‘correctly estimate’ the effects of an ageing society or who think that we ‘underestimate’ an ageing
society. However, we also found that those who hold this view are also those who are more likely
to overestimate the future population of the oldest old (those aged 85 and above). This may be
counterintuitive in one sense, as we could expect those who think that the effect of an ageing
society has been overestimated to also underestimate the future number of older people.
However, in another sense, this may reflect some conflation in public opinion between what is
quite often a negative press about and ageing society and the actual projected reality of an ageing
society. A report launched in conjunction with this paper (Gill and Taylor 2012) highlights this issue
in a broader sense, and questions whether the ‘apocalyptic’ demographic scenarios that are
sometimes predicted will become reality. The results in this paper suggest that public opinion does
often tend towards a similar view in a number of cases. However, it should also be remembered
that a similar proportion of people who thought that the effects of an ageing society had been
overestimated also thought that the NHS would not remain free at the point of use because of an
ageing society, emphasising that that attitudes towards an ageing society appear both complex
and context specific.
The results in this report suggest that in reality, as with many social issues, the consequences of
an ageing society are framed through political debate and presented in the popular media, which
leaves a complex, and sometimes fraught, process for the public in disentangling the facts from
the fiction. Positive glimmers do appear among attitudes to planning an older Britain of the future
through high levels of understanding of the link between healthy behaviours and living longer and
healthier, and flexible attitudes towards older people and the workplace, particularly among
younger people in the latter case. Nevertheless, as an old Italian proverb states, ‘between saying
and doing many a pair of shoes is worn out’ (Brandom 2008), emphasising that the gulf between
attitudes and behaviour is one that has preoccupied social scientists and philosophers alike for
some time. The context of these analysis at a time, for example, of rising levels of obesity (for
example Kneale 2010) and with the level of smoking in the UK stubbornly above the 20% mark
(NHS 2010), suggest that there is still much work to be carried out in bridging this gulf. The
analyses also suggest that such a gulf may be most apparent among those in lower
socioeconomic groups.
8 Own analysis of 2009 Omnibus Questionnaire Addition.
33
References
Abrams, D., Eilola, T., and Swift, H. (2009) Attitudes to age in Britain 2004-08, Research Report No 599,
London: Department for Work and Pensions.
Age Concern (2004) How Ageist Is Britain? London: Age Concern England
Age UK (2011) A Snapshot of Ageism in the UK and across Europe. Age UK. London. England.
Allen, L.J., and Johnson, J.A., (2009) Undergraduate attitudes towards the elderly: The role of knowledge,
contact and aging anxiety. Educational Gerontology, 35 (1), 1-14.
Alongi, J.B., Benson, W.F., Harris, A..C., Moore, M., & Aldrich, N. (2009) Meeting the challenges of an
ageing society: The experience of state health departments. Atlanta, GA: National Association of Chronic
Disease Directors.
Arnold-Cathalifaud, M., Thumala, D., Urquiza, A., and Ojeda, A. (2008) Young people’s images of old age in
Chile. Exploratory Research. Educational Gerontology, 34 (2), 105-123.
Engberg H., Oksuzyan A., Jeune B., Vaupel J.W., Christensen K. (2009) Centenarians--a useful model for
healthy aging? A 29-year follow-up of hospitalizations among 40,000 Danes born in 1905, Aging Cell, 8(3):
270-276
Euwals, R., de Mooij, R., and van Vuuren, D. (2009) Rethinking Retirement. From participation towards
allocation. CPB Netherlands Bureau for Economic Policy Analysis. Number 80. The Hague. The
Netherlands.
Galioto A., Dominguez L.J., Pineo A., Ferlisi A., Putignano E., Belvedere M., Costanza G., Barbagallo M.
(2008) Cardiovascular Risk Factors in Centenarians, Experimental Gerontology, 43(2):106-13
Gill, J. and Taylor, D. (2012) Active Ageing: Live longer and prosper. London: University College London.
Health Service Executive (HSE) (2009) Open Your Eyes HSE Elder Abuse Service Developments 2008.
Health Service Executive, Dublin.
Healy, T. and Ross, K. (2002) Growing old invisibly: older viewers talk television. Media, Culture & Society
24:105-120
Help the Aged (2009) Voice: A briefing paper on the voice of older people in society.
http://www.ilcuk.org.uk/index.php/news/news_posts/voice_-_a_briefing_paper
Hitt R., Young-Xu Y., Silder M., Perls,T. (1999) Centenarians: the Older You Get, the Healthier You Have
Been, Lancet, 354(9179):652
HSBC (2006). The future of retirement. What businesses want. London: HSBC.
Huy, C., Schneider, S., Thiel, A (2010) Perceptions of aging and health behaviour: determinants of a
healthy diet in an older German population. Journal of Nutrition Health and Aging. Volume, 14, Issue 5, pp.
381-385.
Kneale, D (2010) Parental Health in Hansen, K., Jones, E., Joshi, H. and Budge, D (eds.) Millennium
Cohort Study Fourth Survey: A User’s Guide to Initial Findings. London: Centre for Longitudinal Studies,
Institute of Education, University of London.
Laditka, S.B., Corwin, S.J., Laditka, J.N., Liu, R., Tseng, W., Wu, B., Beard, R.L., Sharkey, J.R., Ivey, S.L.
(2009) Attitudes About Aging Well Among a Diverse Group of Older Americans: Implications for Promoting
Cognitive Health. The Gerontologist, 49, (S1): S30-S39

34
Lee, Y.A., (2009) Measures of student attitudes on aging. Educational Gerontology, 35 (2), 121-134.
Lyons, I. (2009) Public perceptions of older people and ageing: A literature review. National Centre for the
Protection of Older people. Review 1. November 2009. University college, Dublin. Dublin: Ireland.
McMunn, A., Breeze, E., Goodman, A., Nazroo, J. and Oldfield, Z. (2006) Social Determinants of health in
older age in Marmot, M. and Wilkinson, R. (eds.) Social Determinants of Health. Oxford: Oxford University
Press
Mackenbach, J. P., Stirbu, I., Roskam, A-J. R., Schapp, M. M., Menvielle, G., Leinsalu, M. and Kunst, A. E.
(2008) Socioeconomic Inequalities in Health in 22 Countries. The New England Journal of Medicine.
358(23): 2648-2681
Marmot M. (2010) Fair society, healthy lives. University College: London
Meadows, P. (2004). Retirement ages in the UK: A review of the literature. London, 18: DTI.
Mercer, S. W. and Watt, G. C. M. (2007) The Inverse Care Law: Clinical Primary Care Encounters in
Deprived and Affluent Areas of Scotland. The Annals of Family Medicine, 5(6):503-510
Narayan, C., (2008) Is there a double standard of aging?: Older men and women and ageism. Educational
Gerontology, 34 (9), 782-787.
Ng., T. W. H., & Feldman, D.C. (2008). The relationship of age to ten dimensions of job performance.
Journal of Applied Psychology, 93 (2), 32-423.
NHS (2010) Statistics on Smoking: England, 2010. London: NHS
http://www.ic.nhs.uk/webfiles/publications/Health%20and%20Lifestyles/Statistics_on_Smoking_2010.pdf
Office for National Statistics (2011) National Population Projections, 2010-based projections.
http://www.ons.gov.uk/ons/rel/npp/national-population-projections/2010-based-projections/index.html
Pitt-Catsouphes, M., Taylor, P., Flynn, M., Lewis S., Matz-Costa, C., Sheaks, C., and Besen, E., (2008)
Sand Pictures: Perceptions of Older Workers at the 21st Century Workplace. A Working Paper Prepared for
the 2008 AARP International Forum on the Future Workforce New Strategies for New Demographics.
European Commission. Brussels. Belgium.
Räftegård Fäggren, T., and Wilson, G., (2009) Healthy Ageing in Europe: lessons learnt and ways forward:
Stromberg. Stockholm.
Raman, P., Harwood, I., Weiss, D., Anderson, J.L., and Miller, G. (2008) Portrayals of older adults in U.S.
and Indian magazine advertisements: A cross-cultural comparison. Howard Journal of Communications, 19
(3), 221-240.
Singh, J., Lord, J., Longworth, L., Orr, S., McGarry, T., Sheldon, R. and Buxton, M. (2012) Does
Responsibility Affect the Public’s Valuation of Health Care interventions? A Relative Valuation Approach to
Health Care Safety. Value in Health. http://dx.doi.org/10.1016/j.jval.2012.02.005
Stafford, R. (2010) British Social Attitudes 2010 User Guide. London: National Centre for Social Research
Thornton, J.E. (2002). Myths of aging or ageist stereotypes. Educational Gerontology, 28, 301-312.
TNS Opinion and Social (2012) Active Ageing. Special Eurobarometer 378 / Wave EB76.2. European
Commission. Brussels. Belgium.
van Dalen, H.P., Henkens, K., and Schippers, J. (2010) Productivity of Older Workers: Perceptions of
Employers and Employees. Population and Development Review, Volume 36, Issues 2, pp309-330.
35
Vickerstaff, S., Cox, J., and Keen, L. (2003). Employers and the management of retirement. Social Policy &
Administration 37: 271-287.
WHO (2002) Active ageing: A policy framework. WHO/NMH/NPH/02.8. Geneva: World Health Organisation.
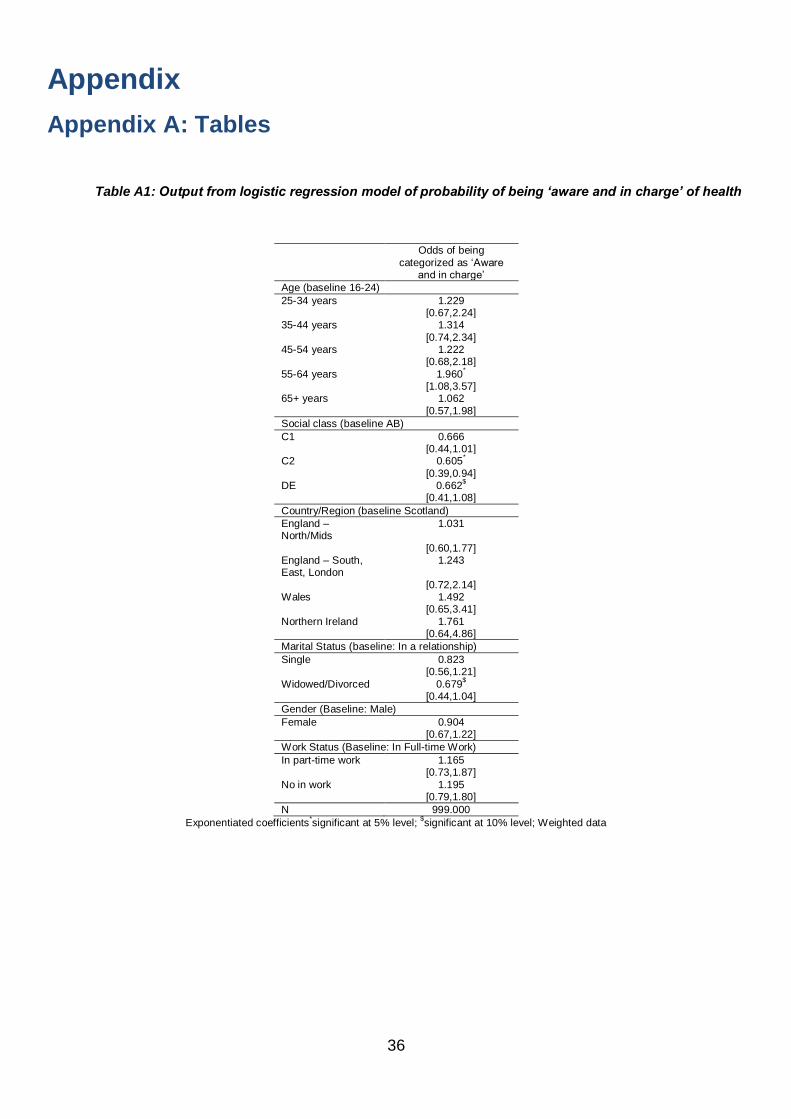
36
Appendix
Appendix A: Tables
Table A1: Output from logistic regression model of probability of being ‘aware and in charge’ of health
Odds of being
categorized as ‘Aware and in charge’
Age (baseline 16-24)
25-34 years 1.229 [0.67,2.24] 35-44 years 1.314
[0.74,2.34] 45-54 years 1.222 [0.68,2.18]
55-64 years 1.960*
[1.08,3.57] 65+ years 1.062
[0.57,1.98]
Social class (baseline AB)
C1 0.666 [0.44,1.01] C2 0.605
*
[0.39,0.94] DE 0.662
$
[0.41,1.08]
Country/Region (baseline Scotland)
England – North/Mids
1.031
[0.60,1.77] England – South, East, London
1.243
[0.72,2.14] Wales 1.492 [0.65,3.41]
Northern Ireland 1.761 [0.64,4.86]
Marital Status (baseline: In a relationship)
Single 0.823 [0.56,1.21]
Widowed/Divorced 0.679$
[0.44,1.04]
Gender (Baseline: Male)
Female 0.904 [0.67,1.22]
Work Status (Baseline: In Full-time Work)
In part-time work 1.165 [0.73,1.87]
No in work 1.195 [0.79,1.80]
N 999.000
Exponentiated coefficients*significant at 5% level;
$significant at 10% level; Weighted data
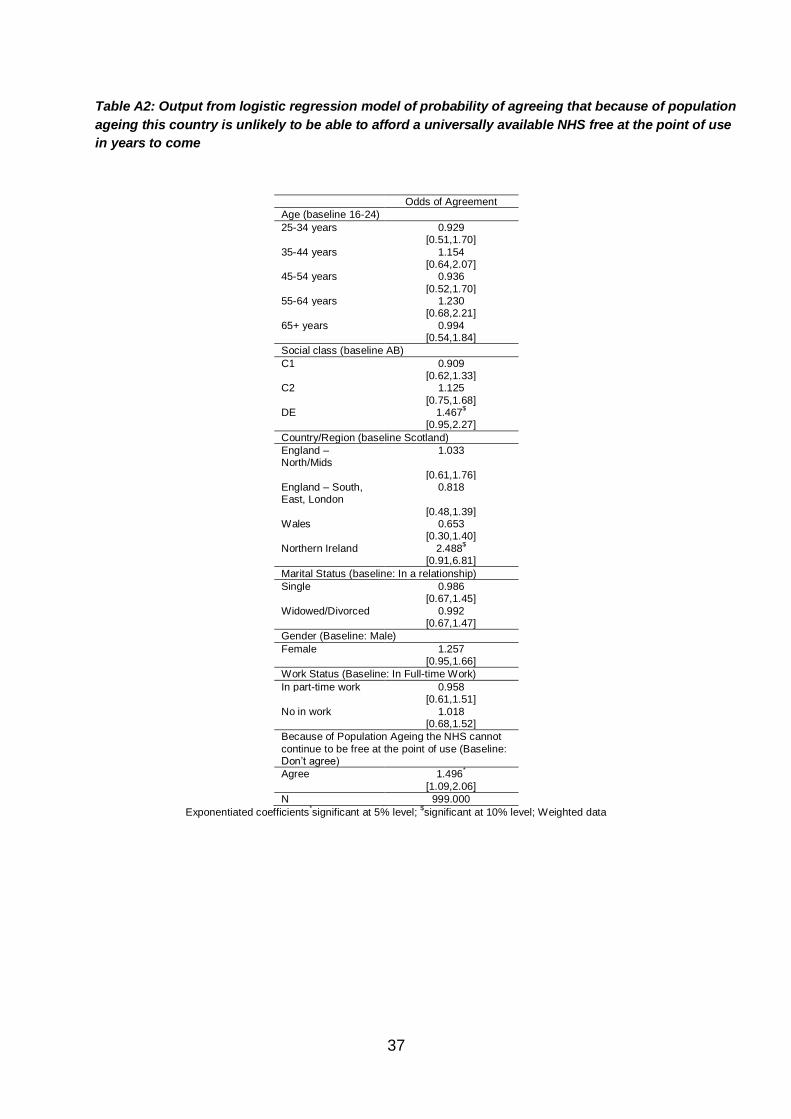
37
Table A2: Output from logistic regression model of probability of agreeing that because of population
ageing this country is unlikely to be able to afford a universally available NHS free at the point of use
in years to come
Odds of Agreement
Age (baseline 16-24)
25-34 years 0.929 [0.51,1.70]
35-44 years 1.154 [0.64,2.07] 45-54 years 0.936
[0.52,1.70] 55-64 years 1.230 [0.68,2.21]
65+ years 0.994 [0.54,1.84]
Social class (baseline AB)
C1 0.909 [0.62,1.33] C2 1.125
[0.75,1.68] DE 1.467
$
[0.95,2.27]
Country/Region (baseline Scotland)
England – North/Mids
1.033
[0.61,1.76] England – South, East, London
0.818
[0.48,1.39] Wales 0.653 [0.30,1.40]
Northern Ireland 2.488$
[0.91,6.81]
Marital Status (baseline: In a relationship)
Single 0.986 [0.67,1.45]
Widowed/Divorced 0.992 [0.67,1.47]
Gender (Baseline: Male)
Female 1.257 [0.95,1.66]
Work Status (Baseline: In Full-time Work)
In part-time work 0.958 [0.61,1.51]
No in work 1.018 [0.68,1.52]
Because of Population Ageing the NHS cannot
continue to be free at the point of use (Baseline: Don’t agree)
Agree 1.496*
[1.09,2.06]
N 999.000
Exponentiated coefficients*significant at 5% level;
$significant at 10% level; Weighted data
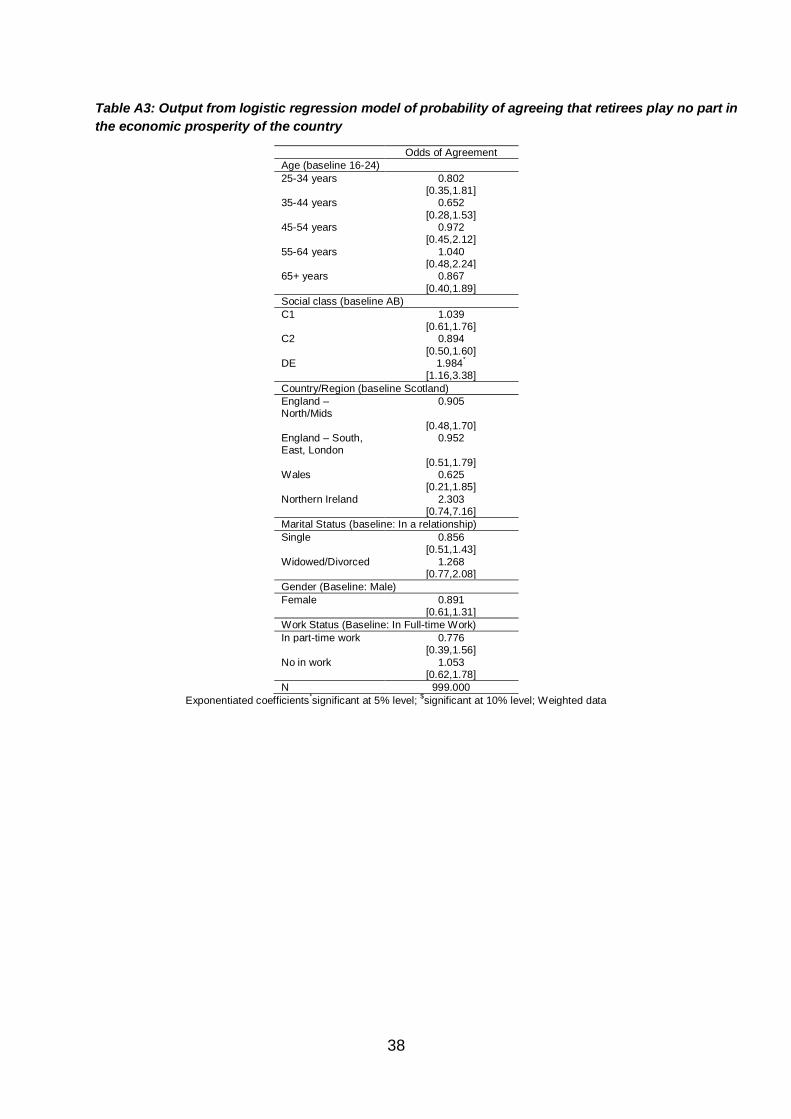
38
Table A3: Output from logistic regression model of probability of agreeing that retirees play no part in
the economic prosperity of the country
Odds of Agreement
Age (baseline 16-24)
25-34 years 0.802 [0.35,1.81] 35-44 years 0.652
[0.28,1.53] 45-54 years 0.972 [0.45,2.12]
55-64 years 1.040 [0.48,2.24] 65+ years 0.867
[0.40,1.89]
Social class (baseline AB)
C1 1.039 [0.61,1.76] C2 0.894
[0.50,1.60] DE 1.984
*
[1.16,3.38]
Country/Region (baseline Scotland)
England – North/Mids
0.905
[0.48,1.70] England – South, East, London
0.952
[0.51,1.79] Wales 0.625 [0.21,1.85]
Northern Ireland 2.303 [0.74,7.16]
Marital Status (baseline: In a relationship)
Single 0.856 [0.51,1.43]
Widowed/Divorced 1.268 [0.77,2.08]
Gender (Baseline: Male)
Female 0.891 [0.61,1.31]
Work Status (Baseline: In Full-time Work)
In part-time work 0.776 [0.39,1.56]
No in work 1.053 [0.62,1.78]
N 999.000
Exponentiated coefficients*significant at 5% level;
$significant at 10% level; Weighted data
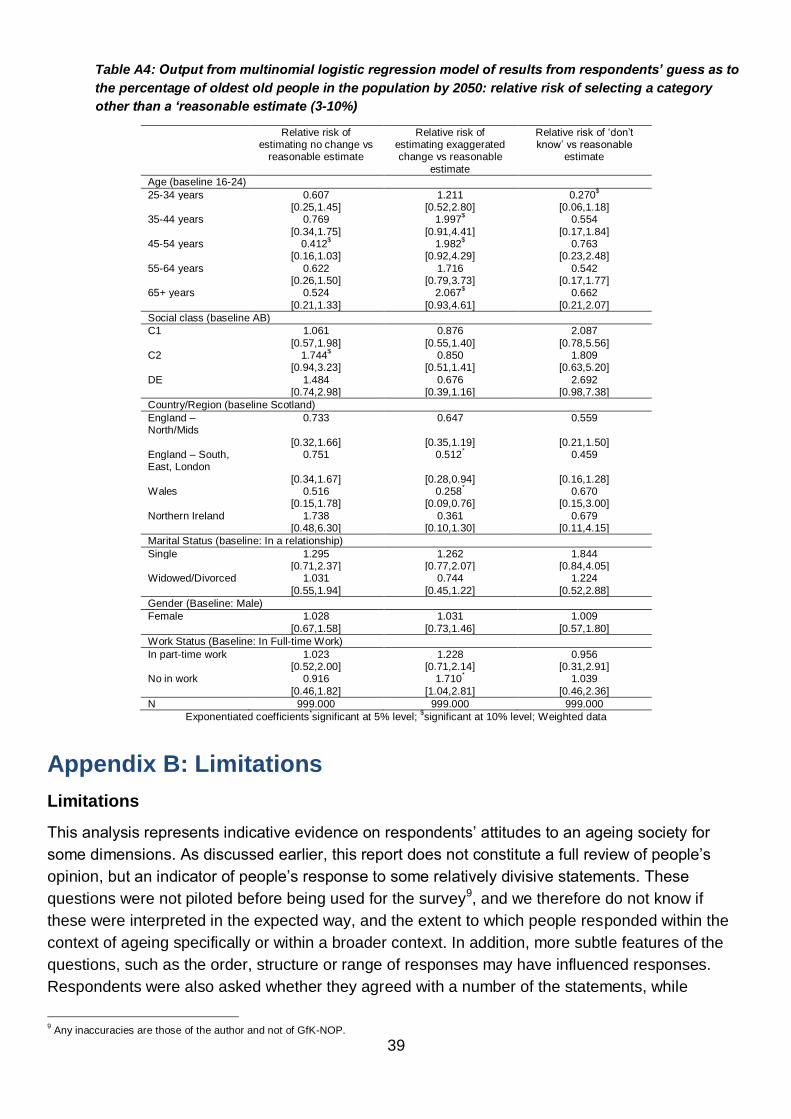
39
Table A4: Output from multinomial logistic regression model of results from respondents’ guess as to
the percentage of oldest old people in the population by 2050: relative risk of selecting a category
other than a ‘reasonable estimate (3-10%)
Relative risk of estimating no change vs
reasonable estimate
Relative risk of estimating exaggerated change vs reasonable
estimate
Relative risk of ‘don’t know’ vs reasonable
estimate
Age (baseline 16-24)
25-34 years 0.607 1.211 0.270$
[0.25,1.45] [0.52,2.80] [0.06,1.18] 35-44 years 0.769 1.997
$ 0.554
[0.34,1.75] [0.91,4.41] [0.17,1.84] 45-54 years 0.412
$ 1.982
$ 0.763
[0.16,1.03] [0.92,4.29] [0.23,2.48]
55-64 years 0.622 1.716 0.542 [0.26,1.50] [0.79,3.73] [0.17,1.77] 65+ years 0.524 2.067
$ 0.662
[0.21,1.33] [0.93,4.61] [0.21,2.07]
Social class (baseline AB)
C1 1.061 0.876 2.087
[0.57,1.98] [0.55,1.40] [0.78,5.56] C2 1.744
$ 0.850 1.809
[0.94,3.23] [0.51,1.41] [0.63,5.20]
DE 1.484 0.676 2.692 [0.74,2.98] [0.39,1.16] [0.98,7.38]
Country/Region (baseline Scotland)
England – North/Mids
0.733 0.647 0.559
[0.32,1.66] [0.35,1.19] [0.21,1.50] England – South, East, London
0.751 0.512* 0.459
[0.34,1.67] [0.28,0.94] [0.16,1.28] Wales 0.516 0.258
* 0.670
[0.15,1.78] [0.09,0.76] [0.15,3.00]
Northern Ireland 1.738 0.361 0.679 [0.48,6.30] [0.10,1.30] [0.11,4.15]
Marital Status (baseline: In a relationship)
Single 1.295 1.262 1.844 [0.71,2.37] [0.77,2.07] [0.84,4.05] Widowed/Divorced 1.031 0.744 1.224
[0.55,1.94] [0.45,1.22] [0.52,2.88]
Gender (Baseline: Male)
Female 1.028 1.031 1.009
[0.67,1.58] [0.73,1.46] [0.57,1.80]
Work Status (Baseline: In Full-time Work)
In part-time work 1.023 1.228 0.956 [0.52,2.00] [0.71,2.14] [0.31,2.91] No in work 0.916 1.710
* 1.039
[0.46,1.82] [1.04,2.81] [0.46,2.36]
N 999.000 999.000 999.000
Exponentiated coefficients*significant at 5% level;
$significant at 10% level; Weighted data
Appendix B: Limitations
Limitations
This analysis represents indicative evidence on respondents’ attitudes to an ageing society for
some dimensions. As discussed earlier, this report does not constitute a full review of people’s
opinion, but an indicator of people’s response to some relatively divisive statements. These
questions were not piloted before being used for the survey9, and we therefore do not know if
these were interpreted in the expected way, and the extent to which people responded within the
context of ageing specifically or within a broader context. In addition, more subtle features of the
questions, such as the order, structure or range of responses may have influenced responses.
Respondents were also asked whether they agreed with a number of the statements, while
9 Any inaccuracies are those of the author and not of GfK-NOP.
40
ordinarily they may have been asked to respond according to a Likert scale (Strongly Agree to
Strongly Disagree). While the analysis would likely have examined those that agreed or strongly
disagreed as one group, and grouped all other responses as a single category, there remains the
possibility that the response distribution may have been affected by not having a Likert scale.
Other factors also constitute limitations to this study and caveats to the results. These include the
controlling factors available. While age, gender, region/country, economic activity, and social class
were included, others such as education, income, family structure, ethnicity, and household
composition may have affected the results. We use social class essentially as a proxy for some of
these variables above, namely education and income, although social class does not always
correlate closely with these variables. Finally, while close to 1000 people were surveyed (999), this
represents a relatively small sample compared to some other data sources (including the BSA
featured in our analyses earlier). One consequence of a small sample size is to increase the size
of our standard errors, which may mean that we overlook significant trends10. These are caveats to
the results which we discuss further below.
10
The relatively small sample is one reason why we consider some results that only achieve borderline statistical significance.

41

ILC–UK
11 Tufton Street
London
SW1P 3QB
Tel : +44 (0) 20 7340 0440
www.ilcuk.org.uk