
Pondy Oxides & Chemicals Ltd. -...
18
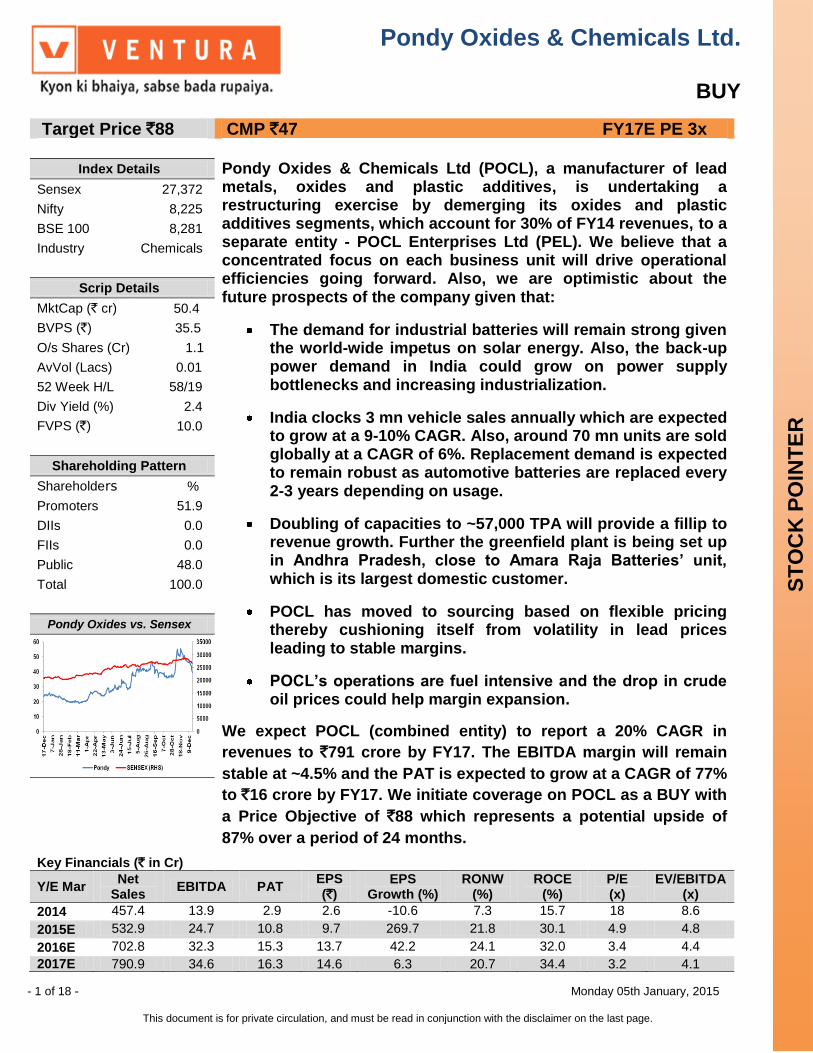
Pondy Oxides & Chemicals Ltd. BUY - 1 of 18 - Monday 05th January, 2015 This document is for private circulation, and must be read in conjunction with the disclaimer on the last page. STOCK POINTER Target Price `88 CMP `47 FY17E PE 3x Index Details Pondy Oxides & Chemicals Ltd (POCL), a manufacturer of lead metals, oxides and plastic additives, is undertaking a restructuring exercise by demerging its oxides and plastic additives segments, which account for 30% of FY14 revenues, to a separate entity - POCL Enterprises Ltd (PEL). We believe that a concentrated focus on each business unit will drive operational efficiencies going forward. Also, we are optimistic about the future prospects of the company given that: The demand for industrial batteries will remain strong given the world-wide impetus on solar energy. Also, the back-up power demand in India could grow on power supply bottlenecks and increasing industrialization. India clocks 3 mn vehicle sales annually which are expected to grow at a 9-10% CAGR. Also, around 70 mn units are sold globally at a CAGR of 6%. Replacement demand is expected to remain robust as automotive batteries are replaced every 2-3 years depending on usage. Doubling of capacities to ~57,000 TPA will provide a fillip to revenue growth. Further the greenfield plant is being set up in Andhra Pradesh, close to Amara Raja Batteries’ unit, which is its largest domestic customer. POCL has moved to sourcing based on flexible pricing thereby cushioning itself from volatility in lead prices leading to stable margins. POCL’s operations are fuel intensive and the drop in crude oil prices could help margin expansion. We expect POCL (combined entity) to report a 20% CAGR in revenues to `791 crore by FY17. The EBITDA margin will remain stable at ~4.5% and the PAT is expected to grow at a CAGR of 77% to `16 crore by FY17. We initiate coverage on POCL as a BUY with a Price Objective of `88 which represents a potential upside of 87% over a period of 24 months. Sensex 27,372 Nifty 8,225 BSE 100 8,281 Industry Chemicals Scrip Details MktCap (` cr) 50.4 BVPS (`) 35.5 O/s Shares (Cr) 1.1 AvVol (Lacs) 0.01 52 Week H/L 58/19 Div Yield (%) 2.4 FVPS (`) 10.0 Shareholding Pattern Shareholders % Promoters 51.9 DIIs 0.0 FIIs 0.0 Public 48.0 Total 100.0 Pondy Oxides vs. Sensex Key Financials (` in Cr) Y/E Mar Net Sales EBITDA PAT EPS (`) EPS Growth (%) RONW (%) ROCE (%) P/E (x) EV/EBITDA (x) 2014 457.4 13.9 2.9 2.6 -10.6 7.3 15.7 18 8.6 2015E 532.9 24.7 10.8 9.7 269.7 21.8 30.1 4.9 4.8 2016E 702.8 32.3 15.3 13.7 42.2 24.1 32.0 3.4 4.4 2017E 790.9 34.6 16.3 14.6 6.3 20.7 34.4 3.2 4.1
Transcript of Pondy Oxides & Chemicals Ltd. -...
Pondy Oxides & Chemicals Ltd.
BUY
- 1 of 18 - Monday 05th January, 2015
This document is for private circulation, and must be read in conjunction with the disclaimer on the last page.
ST
OC
K P
OIN
TE
R
Target Price `88 CMP `47 FY17E PE 3x
Index Details Pondy Oxides & Chemicals Ltd (POCL), a manufacturer of lead metals, oxides and plastic additives, is undertaking a restructuring exercise by demerging its oxides and plastic additives segments, which account for 30% of FY14 revenues, to a separate entity - POCL Enterprises Ltd (PEL). We believe that a concentrated focus on each business unit will drive operational efficiencies going forward. Also, we are optimistic about the future prospects of the company given that:
The demand for industrial batteries will remain strong given the world-wide impetus on solar energy. Also, the back-up power demand in India could grow on power supply bottlenecks and increasing industrialization.
India clocks 3 mn vehicle sales annually which are expected to grow at a 9-10% CAGR. Also, around 70 mn units are sold globally at a CAGR of 6%. Replacement demand is expected to remain robust as automotive batteries are replaced every 2-3 years depending on usage.
Doubling of capacities to ~57,000 TPA will provide a fillip to revenue growth. Further the greenfield plant is being set up in Andhra Pradesh, close to Amara Raja Batteries’ unit, which is its largest domestic customer.
POCL has moved to sourcing based on flexible pricing thereby cushioning itself from volatility in lead prices leading to stable margins.
POCL’s operations are fuel intensive and the drop in crude oil prices could help margin expansion.
We expect POCL (combined entity) to report a 20% CAGR in
revenues to `791 crore by FY17. The EBITDA margin will remain
stable at ~4.5% and the PAT is expected to grow at a CAGR of 77%
to `16 crore by FY17. We initiate coverage on POCL as a BUY with
a Price Objective of `88 which represents a potential upside of
87% over a period of 24 months.
Sensex 27,372
Nifty 8,225
BSE 100 8,281
Industry Chemicals
Scrip Details
MktCap (` cr) 50.4
BVPS (`) 35.5
O/s Shares (Cr) 1.1
AvVol (Lacs) 0.01
52 Week H/L 58/19
Div Yield (%) 2.4
FVPS (`) 10.0
Shareholding Pattern
Shareholders %
Promoters 51.9
DIIs 0.0
FIIs 0.0
Public 48.0
Total 100.0
Pondy Oxides vs. Sensex
Key Financials (` in Cr)
Y/E Mar Net
Sales EBITDA PAT
EPS (`)
EPS Growth (%)
RONW (%)
ROCE (%)
P/E (x)
EV/EBITDA (x)
2014 457.4 13.9 2.9 2.6 -10.6 7.3 15.7 18 8.6
2015E 532.9 24.7 10.8 9.7 269.7 21.8 30.1 4.9 4.8
2016E 702.8 32.3 15.3 13.7 42.2 24.1 32.0 3.4 4.4
2017E 790.9 34.6 16.3 14.6 6.3 20.7 34.4 3.2 4.1
- 2 of 18- Monday 05th January, 2015
This document is for private circulation, and must be read in conjunction with the disclaimer on the last page.
Company Background
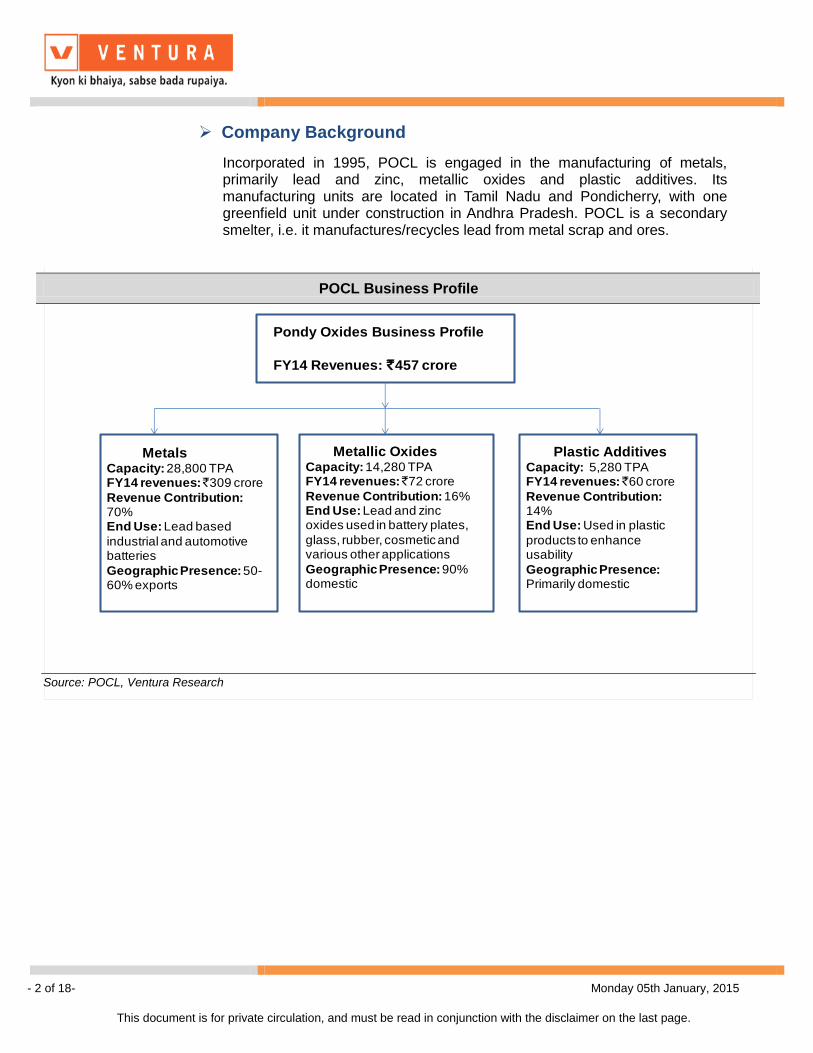
Incorporated in 1995, POCL is engaged in the manufacturing of metals, primarily lead and zinc, metallic oxides and plastic additives. Its manufacturing units are located in Tamil Nadu and Pondicherry, with one greenfield unit under construction in Andhra Pradesh. POCL is a secondary smelter, i.e. it manufactures/recycles lead from metal scrap and ores.
POCL Business Profile
Pondy Oxides Business Profile
FY14 Revenues: `457 crore
Metals Capacity: 28,800 TPAFY14 revenues: ̀ 309 crore
Revenue Contribution: 70%End Use: Lead based
industrial and automotive batteries
Geographic Presence: 50-60% exports
Metallic Oxides Capacity: 14,280 TPAFY14 revenues: ̀ 72 crore
Revenue Contribution: 16%End Use: Lead and zinc oxides used in battery plates,
glass, rubber, cosmetic and various other applications
Geographic Presence: 90% domestic
Plastic AdditivesCapacity: 5,280 TPAFY14 revenues: ̀ 60 crore
Revenue Contribution: 14%End Use: Used in plastic
products to enhance usability
Geographic Presence: Primarily domestic
Source: POCL, Ventura Research
- 3 of 18- Monday 05th January, 2015
This document is for private circulation, and must be read in conjunction with the disclaimer on the last page.
Key Investment Highlights
Capacity expansion to propel revenue growth
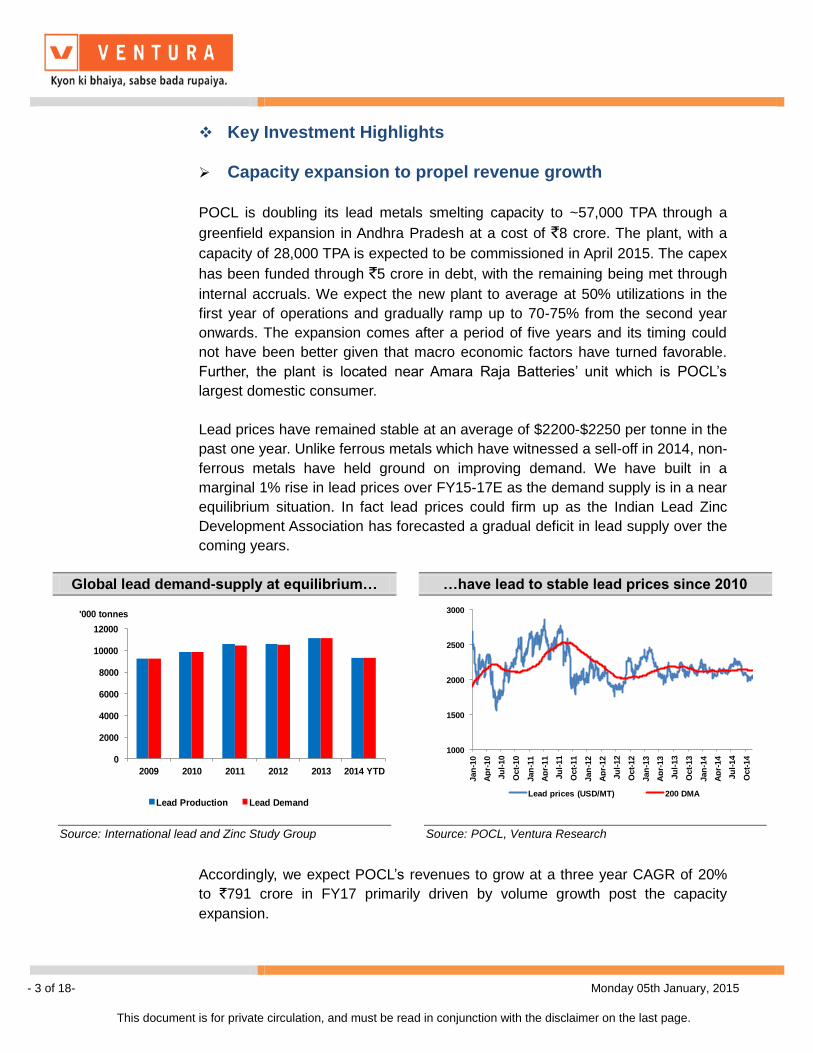
POCL is doubling its lead metals smelting capacity to ~57,000 TPA through a
greenfield expansion in Andhra Pradesh at a cost of `8 crore. The plant, with a
capacity of 28,000 TPA is expected to be commissioned in April 2015. The capex
has been funded through `5 crore in debt, with the remaining being met through
internal accruals. We expect the new plant to average at 50% utilizations in the
first year of operations and gradually ramp up to 70-75% from the second year
onwards. The expansion comes after a period of five years and its timing could
not have been better given that macro economic factors have turned favorable.
Further, the plant is located near Amara Raja Batteries’ unit which is POCL’s
largest domestic consumer.
Lead prices have remained stable at an average of $2200-$2250 per tonne in the
past one year. Unlike ferrous metals which have witnessed a sell-off in 2014, non-
ferrous metals have held ground on improving demand. We have built in a
marginal 1% rise in lead prices over FY15-17E as the demand supply is in a near
equilibrium situation. In fact lead prices could firm up as the Indian Lead Zinc
Development Association has forecasted a gradual deficit in lead supply over the
coming years.
Accordingly, we expect POCL’s revenues to grow at a three year CAGR of 20%
to `791 crore in FY17 primarily driven by volume growth post the capacity
expansion.
Global lead demand-supply at equilibrium… …have lead to stable lead prices since 2010
0
2000
4000
6000
8000
10000
12000
2009 2010 2011 2012 2013 2014 YTD
'000 tonnes
Lead Production Lead Demand
1000
1500
2000
2500
3000
Jan
-10
Ap
r-10
Ju
l-10
Oct-
10
Jan
-11
Ap
r-11
Ju
l-11
Oct-
11
Jan
-12
Ap
r-12
Ju
l-12
Oct-
12
Jan
-13
Ap
r-13
Ju
l-13
Oct-
13
Jan
-14
Ap
r-14
Ju
l-14
Oct-
14
Lead prices (USD/MT) 200 DMA
Source: International lead and Zinc Study Group
Source: POCL, Ventura Research

- 4 of 18- Monday 05th January, 2015
This document is for private circulation, and must be read in conjunction with the disclaimer on the last page.
Macro economic factors turning favorable
POCL’s products - lead and zinc ingots - are primarily used in the manufacture of
lead acid batteries i.e. automotive and industrial batteries.
Break-down of battery demand
Domestic lead storage batteries ` 300 bn
Automotive Batteries ` 200 bn
Industrial Battery
` 100 bn
OEM market
`60 bn (30%)
Replacement demand
`140 bn (70%)
Largely Organized 50% Organized
50% Unorganized
Source: Ventura Research
Revenue growth to be driven by capacity expansion
0%
10%
20%
30%
40%
50%
60%
70%
80%
90%
100%
0
10000
20000
30000
40000
50000
60000
FY10 FY11 FY12 FY13 FY14 FY15E FY16E FY17E
in TPA
Capacity Capacity Utilization (RHS)
Source: \ Source: POCL, Ventura Research

- 5 of 18- Monday 05th January, 2015
This document is for private circulation, and must be read in conjunction with the disclaimer on the last page.
Favorable macro-economic factors are expected to support POCL’s revenue
growth.
Battery replacement demand to grow at a robust pace
The automobile sector is the major consumer of lead ingots and oxides, which is
the key raw material for its batteries. A large part of the demand for automative
batteries stems from replacement demand, since the typical life of a battery is 2-3
years depending on the extent of usage. Given that 3-3.5 mn vehicles are sold
annually in India, the replacement demand will remain robust.
Automobile sales of both passenger and commercial vehicles fell 5% and 19%
respectively in FY14 owing to
i) slowdown in economy
ii) halt in capex cycle following policy logjam and
iii) high inflation which lowered consumer discretionary spending.
However, the situation has started to improve since the beginning of FY15 as
inflation has softened and economic activity is witnessing a revival post reforms
initiated by the newly elected government. In the first 7 months of the current
fiscal, passenger vehicle sales stood at 58% of FY14 sales, while commercial
vehicle sales are marginally lower at 56%.
Around 3-3.5 mn vehicles sold annually in India
0
500000
1000000
1500000
2000000
2500000
3000000
Passenger Vehicles Commercial Vehicles
2008-09 2009-10 2010-11 2011-12 2012-13 2013-14
S Source: SIAM

- 6 of 18- Monday 05th January, 2015
This document is for private circulation, and must be read in conjunction with the disclaimer on the last page.
According to the "India Automotive Battery Market Forecast & Opportunities,
2018", the Indian automotive battery market is projected to grow at a CAGR
of approximately 13% during 2013-18, in value terms. The key reason being
the recent launches of Medium Utility Vehicles and Sports Utility Vehicles
(SUV) such as Renault's Duster, Mahindra's XUV, Maruti's Ertiga and Ford's
Eco Sports. As a result, the utility vehicles battery market segment is
expected to witness the fastest growth in automobile battery market, followed
by two wheeler batteries and light commercial vehicle battery market
segments, over the next five years. The demand for automotive battery has
largely emerged from northern region of India due to increasing automobile
sales in various states such as Uttar Pradesh, Delhi, Rajasthan, etc., and
presence of large automobile manufacturers like Honda and Tata.
According to industry sources, passenger vehicle sales are expected to clock a 9-
10% growth in FY15 led by general improvement in sentiments, falling petrol and
diesel prices, discounts offered on various car models by manufacturers to pep
up sales and slew of new launches bundled with attractive schemes such as a
complementary insurance and maintenance contracts.
After three consecutive years of declining sales, commercial vehicles are
expected to grow at a rate of 3% in FY15 given the gradual improvement in
economic activity, lifting up the ban on mining by Supreme Court and increase in
freight rates. Further, decline in oil prices is expected to drive auto sales higher in
POCL’s key exports markets, which have been growing at a 6% CAGR.
Revival in economy and impetus on solar energy to drive growth
Demand prospects of industrial batteries hinge on the overall macro economic
situation. The specific applications of industrial batteries include batteries for
back-up power, telecom and solar energy.
With the election of a reform oriented government, India’s GDP growth is
expected to revive in the coming years. Further, a majority of the export markets
of POCL i.e. Indonesia, Japan, Korea, Malaysia, Sri Lanka and Vietnam are
expected to report higher GDP growth in 2014 and 2015. Given the revival in
capex cycle coupled with the on-going power supply issues in large parts of India,
the requirement for back-up power is bound to increase. The other major driver of
industrial batteries is the growing emphasis on the energy efficient solar energy.
Historically, the market for industrial batteries has grown at a CAGR of 20% and
is expected to clock a similar growth rate in the coming years.

- 7 of 18- Monday 05th January, 2015
This document is for private circulation, and must be read in conjunction with the disclaimer on the last page.
StatPlan Energy estimates there are 4 million telecom towers installed in
the world, growing at a CAGR of 4.1% to 2020. In 2014, the market for
tower construction is estimated at $20.3 billion globally. By 2020, the total
installed base will have risen to 5 million towers.
Amara Raja Batteries on a growth trajectory
POCL’s major domestic customers include Amara Raja Batteries and TATA
Batteries, with Amara Raja Batteries accounting for ~30%-40% of POCL’s
domestic sales. Amara Raja Batteries has clocked a 23% YoY growth in H1FY15,
and according to street estimates is expected to clock revenue CAGR of 21%
IMF estimates of GDP growth
Country 2012 2013 2014 2015
India 4.7 5.0 5.6 6.4
Exports
Indonesia 6.3 5.8 5.2 5.5
Japan 1.5 1.5 0.9 0.8
Korea 2.3 3.0 3.7 4.0
Malaysia 5.6 4.7 5.9 5.2
Sri Lanka 6.3 7.3 7.0 6.5
Vietnam 5.2 5.4 5.5 5.6
Source: \ Source: IMF
Solar power capacities to grow substantially Growth in telecom infra driven by mobile phone
penetration
0
50
100
150
200
United States
European Union
China India Rest of World
GW
2012 2020 2035
0.0
100.0
200.0
300.0
400.0
500.0
600.0
2010-11 2011-12 2012-13 2013-14 2014-15 2015-16
Rs bn
Investments in Telecom infrastructure --India
Source: World Energy Report, Ventura Research
Source: CMIE, Ventura Research

- 8 of 18- Monday 05th January, 2015
This document is for private circulation, and must be read in conjunction with the disclaimer on the last page.
over FY15-FY16E. Further, Amara Raja has the following capacity expansion
plans:
Capacity of 2.4mn batteries commissioning operations by Dec’14 and
capacity of 1.2mn batteries commissioning operations by Mar-15, and it is
also
Setting-up a tubular battery plant (outsourced currently) of ~1.4mn
batteries which would start operations in Dec-15 (1mn) and Dec-16
(0.4mn)
With a combination of favorable macro factors and expansion in capacity, POCL
is expected to clock a healthy revenue growth going forward.
Change in sourcing strategy provides stability
Earlier, the company’s raw material prices i.e. battery scrap was fixed at the time
of raw material purchase. This exposed POCL to volatility in lead prices from the
time the raw material was purchased till the time of sale. For instance in FY09,
when lead prices dropped drastically, POCL reported a consolidated EBITDA
margin of 0.44% and a loss of `7 crore at the PAT level.
Consequently, the company changed its sourcing strategy and moved to flexible
pricing. The pricing is determined anytime between placing the supply order and
arrival at the port based on the prevailing LME pricing and previous month’s
average lead contract price. This provides a cushion to the operating margins as
the spreads, which are in the range of $400-$500 remain fixed irrespective of the
fluctuations in raw material costs. EBITDA margins have remained in the range of
3-3.5% from FY12-FY14. Accordingly, the company is unlikely to make abnormal
Sharp volatility in lead prices… …led to steep drop in EBITDA margins
0
500
1000
1500
2000
2500
3000
3500
4000
4500
Jan
-06
Ju
n-0
6
No
v-0
6
Ap
r-07
Sep
-07
Feb
-08
Ju
l-08
Dec-0
8
May-0
9
Oct-
09
Mar-
10
Au
g-1
0
Jan
-11
Ju
n-1
1
No
v-1
1
Ap
r-12
Sep
-12
Feb
-13
Ju
l-13
Dec-1
3
May-1
4
Oct-
14
Lead prices (USD/MT) 200 DMA
0%
1%
2%
3%
4%
5%
6%
7%
8%
9%
10%
FY04 FY05 FY06 FY07 FY08 FY09 FY10 FY11 FY12 FY13 FY14
Pondy Oxides EBITDA margin
Source: POCL, Ventura Research
Source :POCL, Ventura Research

- 9 of 18- Monday 05th January, 2015
This document is for private circulation, and must be read in conjunction with the disclaimer on the last page.
gains or losses and the EBITDA margins will remain stable in the long run.
However, this stability has come at a cost as EBITDA margin at 3.5% are much
lower than 9.8% they reported in FY10, when lead prices recovered from the fall
in 2009.
Fall in crude oil prices to aid margin expansion
POCL’s manufacturing processes i.e. smelting, meting and refining are not power
intensive. The major requirement is fuel required to keep the smelters burning.
Of the total power and fuel cost of `12.4 crore in FY14 (2.7% of revenues), `9.6
crore was spent on diesel and furnace oil. With crude oil prices falling as much as
44% YTD to $59 a barrel, we expect substantial fuel savings to accrue to POCL
in the coming quarters.
In H1FY15, the company has reported an EBITDA margin of 4.1% as the
company managed to increase spreads through higher sales of specialized lead
products. The company plans to increase the proportion of specialized lead
products to 60% from 40% in the current year. Further, coupled with lower fuel
costs, we believe the company will be able to sustain EBITDA margins at ~4.5%
from FY15-FY17.
Export focus to reap long term benefits
POCL commenced exports in FY09 in order to diversify and cater to large players
globally instead of catering to only domestic organized and unorganized players.
Further, since a majority of the raw materials are imported, exports provide a
natural hedge. Also, export sales are secured against a Letter of Credit thereby
minimizing credit risks. Consequently, POCL’s dependence on Amara Raja
Batteries has greatly reduced. Further, POCL’s strategy of supplying to large
customers provides comfort as these players have the financial strength to
withstand a downturn.

- 10 of 18- Monday 05th January, 2015
This document is for private circulation, and must be read in conjunction with the disclaimer on the last page.
De-merging to unlock value
In March 2013, POCL had applied for de-merging its metallic oxides and plastic
additives segments into a different entity, PEL. The management has indicated
that they should receive the necessary court approvals by end December 2014.
Post the de-merger, for every 2 shares of POCL, 1 share of POCL (de-merged
entity) and 1 share of PEL will be allotted.
Export focus has de-risked business model
-10%
0%
10%
20%
30%
40%
50%
60%
70%
80%
90%
FY05 FY06 FY07 FY08 FY09 FY10 FY11 FY12 FY13 FY14
Amara Raja Batteries YoY Sales growth
Pondy Oxides YoY sales growth
100% domestic 50% domestic, 50% exports
Sourc Source: Ventura Research
POCL post de-merger
Pondy Oxides & Chemicals Ltd
De-merger
Pondy Oxides &
Chemicals Ltd
Business: Metals
Plant locations: 1 unit
in Chennai , 1 in AP and
1.36 acres land acquired
in Chennai for future
expansions
Pondy Oxides
Enterprises Ltd
Business: Metallic
Oxides + PVC additives
Plant locations: 2 units
in Chennai, 2 in
Pondicherry
For every 2 shares of
POCL 1 share of POCL
(de-merged entity) and 1
share of PEL will be
allotted
Source: \ Source: Ventura Research

- 11 of 18- Monday 05th January, 2015
This document is for private circulation, and must be read in conjunction with the disclaimer on the last page.
Key Risks
Cyclicality in end-user industries:
As the demand for lead ingots and oxides stems primarily from automotive and
industrial batteries, POCL’s growth prospects are heavily linked to the overall
macro economic situation. A slow-down in the economy will result in idle
capacities and hurt POCL’s financial performance; especially post the doubling of
capacities in April 2015.
Client concentration:
Amara Raja Batteries accounts for 30-40% of domestic sales, which is effectively
17-18% of POCL’s total sales. Any company specific issues will adversely impact
20% of revenues exposed to Amara Raja Batteries.
Thin margins:
The company has reported an average EBITDA margin of 3.2% and average
PAT margin of 0.8% from FY12-FY14 given the commoditized nature of POCL’s
products. While the company has cushioned itself with a flexible raw material
sourcing strategy, any increase in employee or fuel costs will hit the company’s
profitability.
Stricter pollution control norms:
Lead being a highly hazardous metal can cause significant environmental
damage. Accordingly, all recyclers have to adhere to pollution control norms set
out by the Central Pollution Control Board at the manufacturing facilities.
According to the management, nearly 15% of the capex requirements are
towards meeting the pollution control norms. Any changes in these norms could
mean higher funds requirements for future capacity expansion. However, the
strict pollution control norms also act like an entry barrier, thereby preventing an
influx of small unorganized players into the industry.

- 12 of 18- Monday 05th January, 2015
This document is for private circulation, and must be read in conjunction with the disclaimer on the last page.
Financial Performance
In Q2FY15, POCL reported a 16% YoY increase in revenues to `153.8 crore led
by volume growth as demand scenario has improved considerably over the past
one year. EBITDA grew 37% YoY to `6.3 crore in Q2FY15; EBITDA margin
expanded 60 bps YoY to 4.1% with increase in sales proportion of high margin
specialized lead products. PAT grew 85% YoY to `2.3 crore; PAT margin
expanded 60 bps to 1.5% owing to improvement in operational performance.
Quarterly Financial Performance (` in crore)
Particulars Q2FY15 Q2FY14 FY14 FY13
Net Sales 153.4 132.5 448.2 342.4
Growth % 15.8 30.9
Total Expenditure 147.1 127.9 434.9 332.9
EBIDTA 6.3 4.6 13.3 9.5
EBDITA Margin % 4.1 3.5 3.0 2.8
Depreciation 0.6 0.6 2.1 2.2
EBIT (EX OI) 5.7 4.0 11.2 7.3
Other Income 0.2 0.02 1.4 3.8
EBIT 6.0 4.0 12.6 11.1
Margin % 3.9 3.0 2.8 3.2
Interest 2.6 2.2 8.3 7.6
Exceptional items 0 0 0.0 0.6
PBT 3.3 1.8 4.2 4.0
Margin % 2.2 1.4 0.9 1.2
Provision for Tax 1.1 0.6 1.4 1.3
PAT 2.3 1.2 2.8 2.8
PAT Margin (%) 1.5 0.9 0.6 0.8
Source: POCL, Ventura Research

- 13 of 18- Monday 05th January, 2015
This document is for private circulation, and must be read in conjunction with the disclaimer on the last page.
Financial Outlook
We expect POCL to report a three year CAGR of 20% in revenues to `791 crore
by FY17 driven by doubling of metals smelting capacity which is slated to
commission at the start of FY16. We expect EBITDA to grow at a three year
CAGR of 36% to `34.6 crore; EBITDA margin is expected to consolidate at 4.5%
for the coming years as the company sells higher proportion of specialized lead
products. We expect the company to clock a PAT growth of 77% to `16 crore
owing to expansion in operating margins. We expect POCL to report a PAT
margin of 2.1% and an EPS of `14.6 in FY17.
POCL consolidated revenues and margin trend RoE on an uptrend; gearing comfortable
0.0%
1.0%
2.0%
3.0%
4.0%
5.0%
6.0%
7.0%
0
100
200
300
400
500
600
700
800
900
FY11 FY12 FY13 FY14 FY15E FY16E FY17E
in Rs crore
Revenues EBITDA margin (RHS) PAT margin (RHS)
0.0%
5.0%
10.0%
15.0%
20.0%
25.0%
30.0%
0.0
0.5
1.0
1.5
2.0
2.5
FY11 FY12 FY13 FY14 FY15E FY16E FY17E
%(x)
D/E RoE (RHS)
Source: POCL, Ventura Research
Source: POCL, Ventura Research
POCL (Metals) revenues to jump on expansion RoE to improve substantially
0.0%
0.5%
1.0%
1.5%
2.0%
2.5%
3.0%
3.5%
4.0%
4.5%
5.0%
0
100
200
300
400
500
600
700
FY13 FY14 FY15E FY16E FY17E
in Rs crore
Revenues EBITDA margin (RHS) PAT margin (RHS)
0.0%
5.0%
10.0%
15.0%
20.0%
25.0%
30.0%
0.0
0.2
0.4
0.6
0.8
1.0
1.2
1.4
1.6
FY13 FY14 FY15E FY16E FY17E
%(x)
D/E RoE (RHS)
Source: POCL, Ventura Research
Source: POCL, Ventura Research

- 14 of 18- Monday 05th January, 2015
This document is for private circulation, and must be read in conjunction with the disclaimer on the last page.
PEL revenues to remain stable RoE and leverage will remain range bound
-1.0%
0.0%
1.0%
2.0%
3.0%
4.0%
5.0%
6.0%
0.0
50.0
100.0
150.0
200.0
250.0
FY13 FY14 FY15E FY16E FY17E
in Rs crore
Revenues EBITDA margin (RHS) PAT margin (RHS)
-10.0%
-5.0%
0.0%
5.0%
10.0%
15.0%
20.0%
25.0%
30.0%
0.0
0.5
1.0
1.5
2.0
2.5
3.0
3.5
4.0
FY13 FY14 FY15E FY16E FY17E
%(x)
D/E RoE (RHS)
Source: POCL, Ventura Research
Source: POCL, Ventura Research

- 15 of 18- Monday 05th January, 2015
This document is for private circulation, and must be read in conjunction with the disclaimer on the last page.
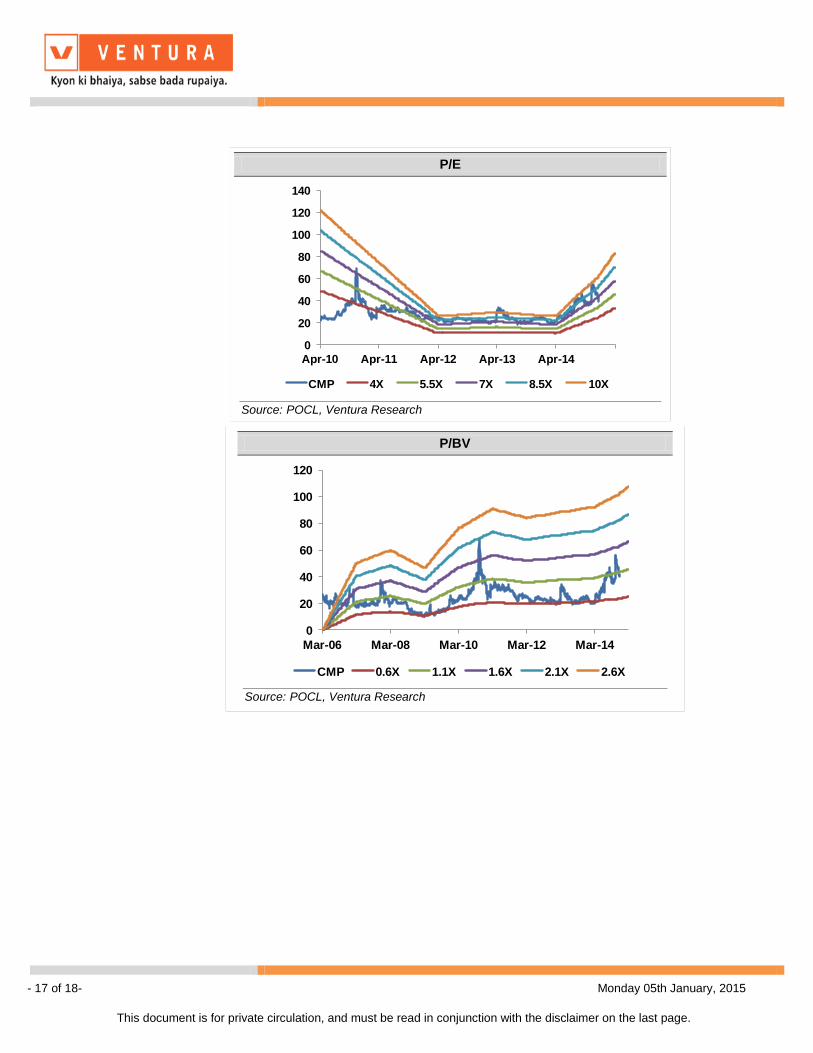
Valuation
We initiate coverage on POCL as a BUY with a Price Objective of `88
representing a potential upside of ~87% over a period of 24 months. The target
price is arrived at by assigning a PE multiple of a conservative 3x each on the
FY17 EPS of `23.6 for POCL (de-merged entity) and `5.7 for PEL Enterprises.
The company has traded at an average multiple of 6x since 2010.
POCL post de-merger
Pondy Oxides & Chemicals Ltd
De-merger
FY17 revenues: Rs 791 crore
PondyOxides & Chemicals
Ltd
FY17
Metals Capacity: 56800 TPACapacity Utilization: 75%
Revenues: Rs 593 crore
Pondy Oxides Enterprises
LtdFY17
Lead Oxides Capacity: 14280
TPACapacity Utilization: ~90%
(50% is used internally)
Plastic Additives Capacity:
5280 TPACapacity Utilization: 88%
Revenues: Rs 197.8 crore
For every 2 shares of POCL
1 share of POCL (de-merged entity) and 1 share
of PEL will be allotted
EBITDA: Rs 27.5 crore
EBITDA margin: 4.6%
PAT: Rs 13 crore
PAT margin: 2.2%
EPS: Rs 23.6
Target PE: 3x
Target: Rs 71
EBITDA: Rs 7.1 crore
EBITDA margin: 3.6%
PAT: Rs 3.2 crore
PAT margin: 1.6%
EPS: Rs 5.7
Target PE: 3x
Target: Rs 17
Consolidated Target:
Rs 88
Upside: 94%
Source: Ventura Research

- 16 of 18- Monday 05th January, 2015
This document is for private circulation, and must be read in conjunction with the disclaimer on the last page.
At the CMP of `47, the stock is trading at a PE multiple of 3.2x FY17
consolidated EPS.
Key Monitorables:
The listing price of the de-merged entity, PEL is not known as of now; if
the valuations at the time of listing are steep, the stock may witness a
correction
Even though the company does not supply to Russia and other oil
dominated economies, the spill-over effect of sharp decline in crude oil
prices may cause a economic slowdown thereby adversely impacting
demand
Peer Comparison
Company Business CMP M Cap Sales
EBITDA
margin
PAT
margin RoE
Dividend
Yield FY15E FY16E FY15E FY16E FY15E FY16E
Hindustan Zinc Primary Smelter 164 70605 12163.4 52.0% 51.1% 19.4% 2.7% 9.3 8.7 1.6 1.4 5.5 4.4
Pondy Oxides Secondary Smelter 47.0 53 457.4 3.0% 0.6% 7.3% 2.4% 4.9 3.4 1.1 0.8 4.8 4.4
Nile Secondary Smelter 289 101 278.2 6.0% 1.9% 9.0% 3.9% 0.0 4.3 NA NA 0.0 0.0
Gravita Secondary Smelter 63 505 641.2 6.3% 3.1% 17.6% 2.4% 17.1 14.6 3.7 3.0 5.5 4.4
EV/EBITDAFY14 PE P/B
Source: POCL, Ventura Research
- 17 of 18- Monday 05th January, 2015
This document is for private circulation, and must be read in conjunction with the disclaimer on the last page.
P/E
0
20
40
60
80
100
120
140
Apr-10 Apr-11 Apr-12 Apr-13 Apr-14
CMP 4X 5.5X 7X 8.5X 10X
Source: POCL, Ventura Research
P/BV
0
20
40
60
80
100
120
Mar-06 Mar-08 Mar-10 Mar-12 Mar-14
CMP 0.6X 1.1X 1.6X 2.1X 2.6X
Source: POCL, Ventura Research

- 18 of 18- Monday 05th January, 2015
This document is for private circulation, and must be read in conjunction with the disclaimer on the last page.
Financials and Projections
Y/E Mar, Fig in ` Cr FY 2014 FY 2015E FY 2016E FY 2017E Y/E Mar, Fig in Rs. Cr FY 2014 FY 2015E FY 2016E FY 2017E
Profit & Loss Statement Per Share Data (Rs)
Net Sales 457.4 532.9 702.8 790.9 EPS 2.6 9.7 13.7 14.6
% Chg. 27.5 16.5 31.9 12.5 Cash EPS 4.6 11.9 16.3 17.2
Total Expenditure 443.5 508.2 670.5 756.3 DPS 1.0 1.0 1.0 1.0
% Chg. 27.4 14.6 31.9 12.8 Book Value 35.6 44.3 57.0 70.6
EBITDA 13.9 24.7 32.3 34.6 Capital, Liquidity, Returns Ratio
EBITDA Margin % 3.0 4.6 4.6 4.4 Debt / Equity (x) 1.9 1.5 1.4 1.2
Other Income 1.3 1.6 2.1 2.4 Current Ratio (x) 1.3 1.4 1.6 1.7
Exceptional items 0.0 0.0 0.0 0.0 ROE (%) 7.3 21.8 24.1 20.7
PBDIT 15.1 26.3 34.4 36.9 ROCE (%) 15.7 30.1 32.0 34.4
Depreciation 2.3 2.4 2.8 2.9 Dividend Yield (%) 2.1 2.1 2.1 2.1
Interest 8.5 7.8 8.7 9.7 Valuation Ratio (x)
PBT 4.4 16.1 22.9 24.3 P/E (x) 18.0 4.9 3.4 3.2
Tax Provisions 1.5 5.3 7.6 8.0 P/BV (x) 1.3 1.1 0.8 0.7
Reported PAT 2.9 10.8 15.3 16.3 EV/Sales (x) 0.3 0.2 0.2 0.2
Minority Interest 0.0 0.0 0.0 0.0 EV/EBIDTA (x) 8.6 4.8 4.4 4.1
Share of profit associate 0 0.0 0.0 0.0 Efficiency Ratio (x)
PAT 2.9 10.8 15.3 16.3 Inventory (days) 33.3 32.0 32.1 32.1
PAT Margin (%) 0.6 2.0 2.2 2.1 Debtors (days) 38.8 40.0 40.0 40.0
RM cost as a % of sales 88.7 86.9 86.9 86.9 Creditors (days) 15.8 17.0 17.0 17.0
Balance Sheet Cash Flow statement
Share Capital 11.2 11.2 11.2 11.2 Profit Before Tax 4.4 16.1 22.9 24.3
Reserves & Surplus 28.6 38.2 52.4 67.6 Depreciation & Amortisation 2.3 2.4 2.8 2.9
Minority Interest 0.0 0.0 0.0 0.0 Working Capital Changes 3.7 -5.6 -23.0 -9.3
Long-Term Provisions 4.2 7.9 10.1 10.6 Direct Taxes Paid and Others -1.3 -5.3 -7.6 -8.0
Long-Term Borrowings 74.1 74.1 92.1 92.1 Operating Cash Flow 9.1 7.7 -4.9 10.0
Other Long-Term Liabilities 23.3 27.2 36.3 39.9 Capital Expenditure -1.4 -0.5 -8.0 -2.0
Total Liabilities 141 159 202 221 Dividend Received 0.1 1.6 2.1 2.4
Gross Block 22.0 21.6 24.8 23.9 Others -0.6 0.0 0.0 0.0
Less: Acc. Depreciation 0.0 0.0 0.0 0.0 Cash Flow from Investing -2.0 1.1 -5.9 0.4
Net Block 22.0 21.6 24.8 23.9 Inc/(Dec) in Loan Fund 1.9 0.0 18.0 0.0
Capital Work in Progress 3.0 1.5 1.5 1.5 Others -6.8 -1.3 -1.3 -1.3
Goodwill on Consolidation 0 0 0 0 Interest Paid -8.5 -7.8 -8.7 -9.7
Non-Current Investments 0.4 0.4 0.4 0.4 Cash Flow from Financing -13.3 -9.1 8.0 -11.0
Net Current Assets 115.3 134.4 172.5 192.6 Net Change in Cash -6.2 -0.3 -2.8 -0.6
Other Non-Current Assets 0.5 0.5 0.5 0.5 Opening Cash Balance 13.2 7.0 6.7 3.9
Total Assets 141 159 202 221 Closing Cash Balance 7.0 6.7 3.9 3.3
Ventura Securities Limited Corporate Office: C-112/116, Bldg No. 1, Kailash Industrial Complex, Park Site, Vikhroli (W), Mumbai – 400079 This report is neither an offer nor a solicitation to purchase or sell securities. The information and views expressed herein are believed to be reliable, but no responsibility (or liability) is accepted for errors of fact or opinion. Writers and contributors may be trading in or have positions in the securities mentioned in their articles. Neither Ventura Securities Limited nor any of the contributors accepts any liability arising out of the above information/articles. Reproduction in whole or in part without written permission is prohibited. This report is for private circulation.


![PONDY OXIDES AND CHEMICALS LIMITED...190 [Old No.150/5] Govindappa Naicken Street, Chennai – 600 001 Phone No : 91-044-25369245 BANKER Canara Bank – Anna Nagar East Branch REGISTRAR](https://static.fdocuments.in/doc/165x107/5edd7f53ad6a402d66689cbb/pondy-oxides-and-chemicals-limited-190-old-no1505-govindappa-naicken-street.jpg)


![PONDY OXIDES AND CHEMICALS LIMITED · 2012-10-22 · Sri. K. Kumaravel FACTORY DIVISIONS Metallic Oxides Division [ M O D ] Behind A-73 & 74, PIPDIC Industrial Est ate Mettupalayam,](https://static.fdocuments.in/doc/165x107/5f08c4ce7e708231d423a18c/pondy-oxides-and-chemicals-limited-2012-10-22-sri-k-kumaravel-factory-divisions.jpg)


