pomania w customer - Yum! Brands – A World with More Yum!€¦ · · 2018-03-20Global Facts (a)...
20
customer mania w pow “
Transcript of pomania w customer - Yum! Brands – A World with More Yum!€¦ · · 2018-03-20Global Facts (a)...

customer mania wpow“

wer”w

We think we have the
most talented Customer Maniacsin the industry. Meet some of them!
Top, left to right: Van Hang, Ramona Macias
Middle: Roxie Padot, Jeff Stricklin,
Brenda Lederer Bottom: Mitch McCulloch
Speed
Cleanliness
Accuracy
Product Quality
Hospitality
Maintenance
26.
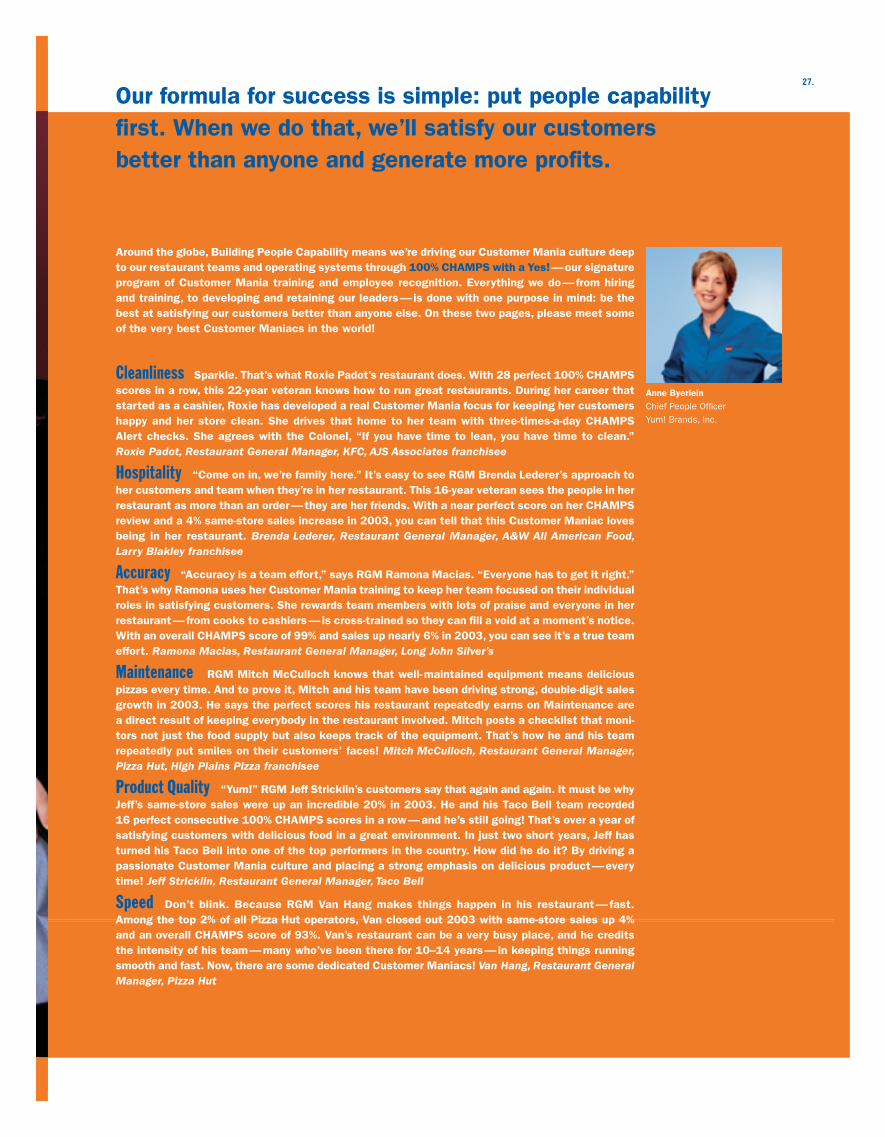
Our formula for success is simple: put people capability first. When we do that, we’ll satisfy our customers better than anyone and generate more profits.
Around the globe, Building People Capability means we’re driving our Customer Mania culture deep to our restaurant teams and operating systems through 100% CHAMPS with a Yes! — our signature program of Customer Mania training and employee recognition. Everything we do — from hiring and training, to developing and retaining our leaders — is done with one purpose in mind: be the best at satisfying our customers better than anyone else. On these two pages, please meet some of the very best Customer Maniacs in the world!
Cleanliness Sparkle. That’s what Roxie Padot’s restaurant does. With 28 perfect 100% CHAMPS scores in a row, this 22-year veteran knows how to run great restaurants. During her career that started as a cashier, Roxie has developed a real Customer Mania focus for keeping her customers happy and her store clean. She drives that home to her team with three-times-a-day CHAMPS Alert checks. She agrees with the Colonel, “If you have time to lean, you have time to clean.” Roxie Padot, Restaurant General Manager, KFC, AJS Associates franchisee
Hospitality “Come on in, we’re family here.” It’s easy to see RGM Brenda Lederer’s approach to her customers and team when they’re in her restaurant. This 16-year veteran sees the people in her restaurant as more than an order — they are her friends. With a near perfect score on her CHAMPS review and a 4% same-store sales increase in 2003, you can tell that this Customer Maniac loves being in her restaurant. Brenda Lederer, Restaurant General Manager, A&W All American Food, Larry Blakley franchisee
Accuracy “Accuracy is a team effort,” says RGM Ramona Macias. “Everyone has to get it right.” That’s why Ramona uses her Customer Mania training to keep her team focused on their individual roles in satisfying customers. She rewards team members with lots of praise and everyone in her restaurant — from cooks to cashiers — is cross-trained so they can fill a void at a moment’s notice. With an overall CHAMPS score of 99% and sales up nearly 6% in 2003, you can see it’s a true team effort. Ramona Macias, Restaurant General Manager, Long John Silver’s
Maintenance RGM Mitch McCulloch knows that well- maintained equipment means delicious pizzas every time. And to prove it, Mitch and his team have been driving strong, double-digit sales growth in 2003. He says the perfect scores his restaurant repeatedly earns on Maintenance are a direct result of keeping everybody in the restaurant involved. Mitch posts a checklist that moni-tors not just the food supply but also keeps track of the equipment. That’s how he and his team repeatedly put smiles on their customers’ faces! Mitch McCulloch, Restaurant General Manager, Pizza Hut, High Plains Pizza franchisee
Product Quality “Yum!” RGM Jeff Stricklin’s customers say that again and again. It must be why Jeff’s same-store sales were up an incredible 20% in 2003. He and his Taco Bell team recorded 16 perfect consecutive 100% CHAMPS scores in a row — and he’s still going! That’s over a year of satisfying customers with delicious food in a great environment. In just two short years, Jeff has turned his Taco Bell into one of the top performers in the country. How did he do it? By driving a passionate Customer Mania culture and placing a strong emphasis on delicious product — every time! Jeff Stricklin, Restaurant General Manager, Taco Bell
Speed Don’t blink. Because RGM Van Hang makes things happen in his restaurant — fast. Among the top 2% of all Pizza Hut operators, Van closed out 2003 with same-store sales up 4% and an overall CHAMPS score of 93%. Van’s restaurant can be a very busy place, and he credits the intensity of his team — many who’ve been there for 10–14 years — in keeping things running smooth and fast. Now, there are some dedicated Customer Maniacs! Van Hang, Restaurant General Manager, Pizza Hut
Anne ByerleinChief People Offi cerYum! Brands, Inc.
27.

At Yum! Brands we’re building an operating culture of 840,000 Customer Maniacs with one purpose: satisfying our customers better than any other restaurant company. The true power of Running Great Restaurants is in giving a trusted customer experience — each and every time. To do that, we must live and breathe 100% CHAMPS with a Yes! attitude. When you are a customer in our restaurants, we want you to receive every letter of CHAMPS: Cleanliness, Hospitality, Accuracy, Maintenance, Product Quality and Speed. If we miss one of the letters, your service isn’t as good as it should be.
This is the beginning of our fourth year of utilizing our operational framework, and we are beginning our third year of customer and sales mania training each quarter in every restaurant. Our Chief Operating Officers are fully vested in driving our operational culturedeep into each of our companies. We recognize that it is our daily leadership intentionsaround the basics that will allow us to achieve the Run Great Restaurant vision.
I’m proud of the progress we made in 2003: Our CHAMPS scores are increasing and our customer complaints are down. Our external measures are beginning to improve and italso shows in our people. Our turnover rates are among the lowest in the industry andwe are more confident than ever that a stable environment is so important to continueto drive our Run Great Restaurant mission around the globe.
While we still have work to do to fulfill our vision of being the best restaurant opera-tors in the industry, our path to greatness is very clear. Hire, train and promote onlyCustomer Maniacs. Execute the basics with passion and urgency. Lead and coach eachrestaurant in a one-system fashion as if it were our only one. We know that when weexecute 100% CHAMPS with a Yes! attitude, our people become an unstoppable forcefor growing the business
Aylwin B. LewisPresident, Chief Multibranding and Operating OfficerYum! Brands, Inc.
Aylwin B. LewisPresident, Chief Multibranding and Operating OfficerYum! Brands, Inc.
Customer Mania means delivering 100% CHAMPS with a Yes! attitude every day. It’s the smile on our face and the smile in our voice. It’s putting the customer fi rst in everything we do.When we do that, our people become an unstoppable force for growing the business.
Running Great Restaurants
100% CHAMPS with a Yes! and Same-Store Sales Growth in Every Store
28.

®
•Dinner 59% •Lunch 34% •Dine Out 80%•Snacks/Breakfast 7% •Dine In 20%
U.S. Sales by Daypart U.S. Sales by Distribution Channel
•Dinner 64% •Lunch 27% •Dine Out 72%•Snacks/Breakfast 9% •Dine In 28%
•Dinner 43% •Lunch 45% •Dine Out 73%•Snacks/Breakfast 12% •Dine In 27%
•Dinner 54% •Lunch 40% •Dine Out 58%•Snacks/Breakfast 6% •Dine In 42%
•Dinner 27% •Lunch 49% •Dine Out 43%•Snacks/Breakfast 24% •Dine In 57%
Source: Crest
Yum! At-a-glance29.

International Operating Profit by Key MarketYear ended 2003 (in millions)
China $ 157Franchise Markets(b) 109Japan/Canada 60U.K. 97Australia/New Zealand 44South Korea 33Other 21Mexico 10Future Growth Markets(c) (30)Headquarters General & Administrative Costs (60)
$ 441
China 12%
Franchise Markets(b) 28%
Japan/Canada 20%
U.K. 15%
Australia/New Zealand 9%
South Korea 4%
Other 7%
Mexico 3%
Future Growth Markets(c) 2%
International System Sales(a) by Key MarketYear ended 2003
Global Facts
(a) System sales represents the combined sales of Company, unconsolidated affiliates, franchise and license restaurants.
(b) Includes franchise-only markets in the remainder of Asia, Continental Europe, Carribean/Latin America, Middle East/Southern Africa.
(c) Includes KFC Germany, KFC Netherlands, KFC France, KFC Brazil and India.
Worldwide Sales(in billions) 5-year
2003 2002 2001 2000 1999 growth(a)
United States
KFC Company sales $ 1.4 $ 1.4 $ 1.4 $ 1.4 $ 1.5 (3%) Franchisee sales(b) 3.5 3.4 3.3 3.0 2.8 7%
Pizza Hut Company sales $ 1.6 $ 1.5 $ 1.5 $ 1.8 $ 2.1 (8%) Franchisee sales(b) 3.5 3.6 3.5 3.2 2.9 8%
Taco Bell Company sales $ 1.6 $ 1.6 $ 1.4 $ 1.4 $ 1.6 (5%) Franchisee sales(b) 3.8 3.6 3.5 3.7 3.6 4%
Long John Silver’s(c) Company sales $ 0.5 $ 0.3 NM Franchisee sales(b) 0.3 0.2 NM
A&W(c) Company sales $ — $ — NM Franchisee sales(b) 0.2 0.2 NM
Total U.S. Company sales $ 5.1 $ 4.8 $ 4.3 $ 4.6 $ 5.2 (5%) Franchisee sales(b) 11.3 11.0 10.3 9.9 9.3 6%
International
KFC Company sales $ 1.7 $ 1.5 $ 1.2 $ 1.1 $ 1.1 8% Franchisee sales(b) 4.6 3.9 3.8 3.9 3.5 10%
Pizza Hut Company sales $ 0.6 $ 0.6 $ 0.6 $ 0.6 $ 0.7 (1%) Franchisee sales(b) 2.4 2.2 2.0 2.0 1.9 6%
Taco Bell Company sales $ — $ — $ — $ — $ — NM Franchisee sales(b) 0.1 0.2 0.1 0.1 0.1 3%
Long John Silver’s(c) Company sales $ — $ — NM Franchisee sales(b) — — NM
A&W(c) Company sales $ — $ — NM Franchisee sales(b) 0.1 — NM
Total International Company sales $ 2.3 $ 2.1 $ 1.8 $ 1.7 $ 1.8 5% Franchisee sales(b) 7.2 6.3 5.9 6.0 5.5 8%
Worldwide
Company sales $ 7.4 $ 6.9 $ 6.1 $ 6.3 $ 7.0 (3%) Franchisee sales(b) 18.5 17.3 16.2 15.9 14.8 7%
(a) Compounded annual growth rate; totals for U.S., International and Worldwide exclude the impact of Long John Silver’s and A&W.
(b) Franchisee sales represents the combined estimated sales of unconsolidated affiliate and franchise and license restaurants. Franchisee sales, which are not included in our Company sales, generate franchise and license fees (typically at rates between 4% and 6%) that are included in our revenues.
(c) Beginning May 7, 2002, includes Long John Silver’s and A&W, which were added when we acquired Yorkshire Global Restaurants, Inc.
30.
China has achieved
double-digit system sales
growth for the
fifth consecutive year.
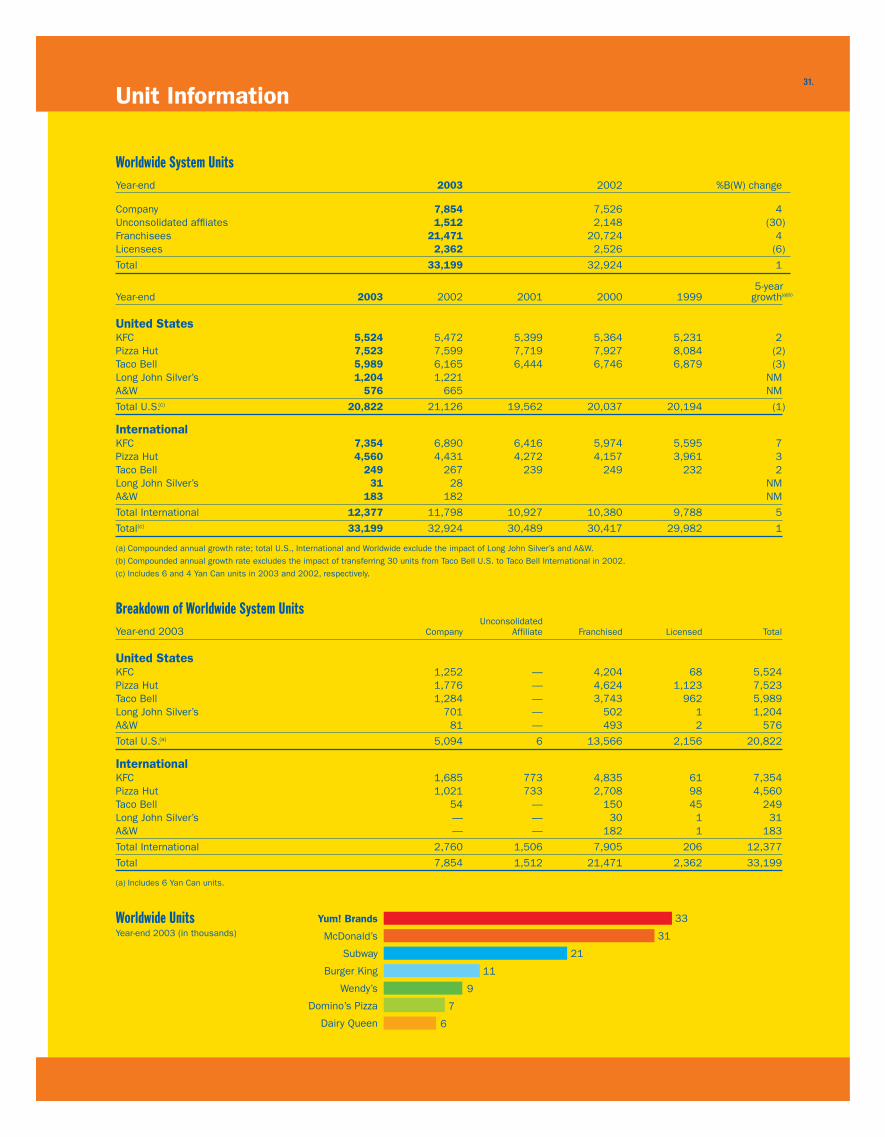
Worldwide System UnitsYear-end 2003 2002 %B(W) change
Company 7,854 7,526 4Unconsolidated affl iates 1,512 2,148 (30)Franchisees 21,471 20,724 4Licensees 2,362 2,526 (6)
Total 33,199 32,924 1
5-year. Year-end 2003 2002 2001 2000 1999 growth.(a)(b)
United StatesKFC 5,524 5,472 5,399 5,364 5,231 2Pizza Hut 7,523 7,599 7,719 7,927 8,084 (2)Taco Bell 5,989 6,165 6,444 6,746 6,879 (3)Long John Silver’s 1,204 1,221 NMA&W 576 665 NM
Total U.S.(c) 20,822 21,126 19,562 20,037 20,194 (1)
InternationalKFC 7,354 6,890 6,416 5,974 5,595 7Pizza Hut 4,560 4,431 4,272 4,157 3,961 3Taco Bell 249 267 239 249 232 2Long John Silver’s 31 28 NMA&W 183 182 NM
Total International 12,377 11,798 10,927 10,380 9,788 5
Total(c) 33,199 32,924 30,489 30,417 29,982 1
(a) Compounded annual growth rate; total U.S., International and Worldwide exclude the impact of Long John Silver’s and A&W.
(b) Compounded annual growth rate excludes the impact of transferring 30 units from Taco Bell U.S. to Taco Bell International in 2002.
(c) Includes 6 and 4 Yan Can units in 2003 and 2002, respectively.
Breakdown of Worldwide System Units UnconsolidatedYear-end 2003 Company Affiliate Franchised Licensed Total
United StatesKFC 1,252 — 4,204 68 5,524Pizza Hut 1,776 — 4,624 1,123 7,523Taco Bell 1,284 — 3,743 962 5,989Long John Silver’s 701 — 502 1 1,204A&W 81 — 493 2 576
Total U.S.(a) 5,094 6 13,566 2,156 20,822
InternationalKFC 1,685 773 4,835 61 7,354Pizza Hut 1,021 733 2,708 98 4,560Taco Bell 54 — 150 45 249Long John Silver’s — — 30 1 31A&W — — 182 1 183
Total International 2,760 1,506 7,905 206 12,377
Total 7,854 1,512 21,471 2,362 33,199
(a) Includes 6 Yan Can units.
Worldwide UnitsYear-end 2003 (in thousands)
33
31
21
11
9
7
6
Yum! Brands
McDonald’s
Subway
Burger King
Wendy’s
Domino’s Pizza
Dairy Queen
Unit Information31.
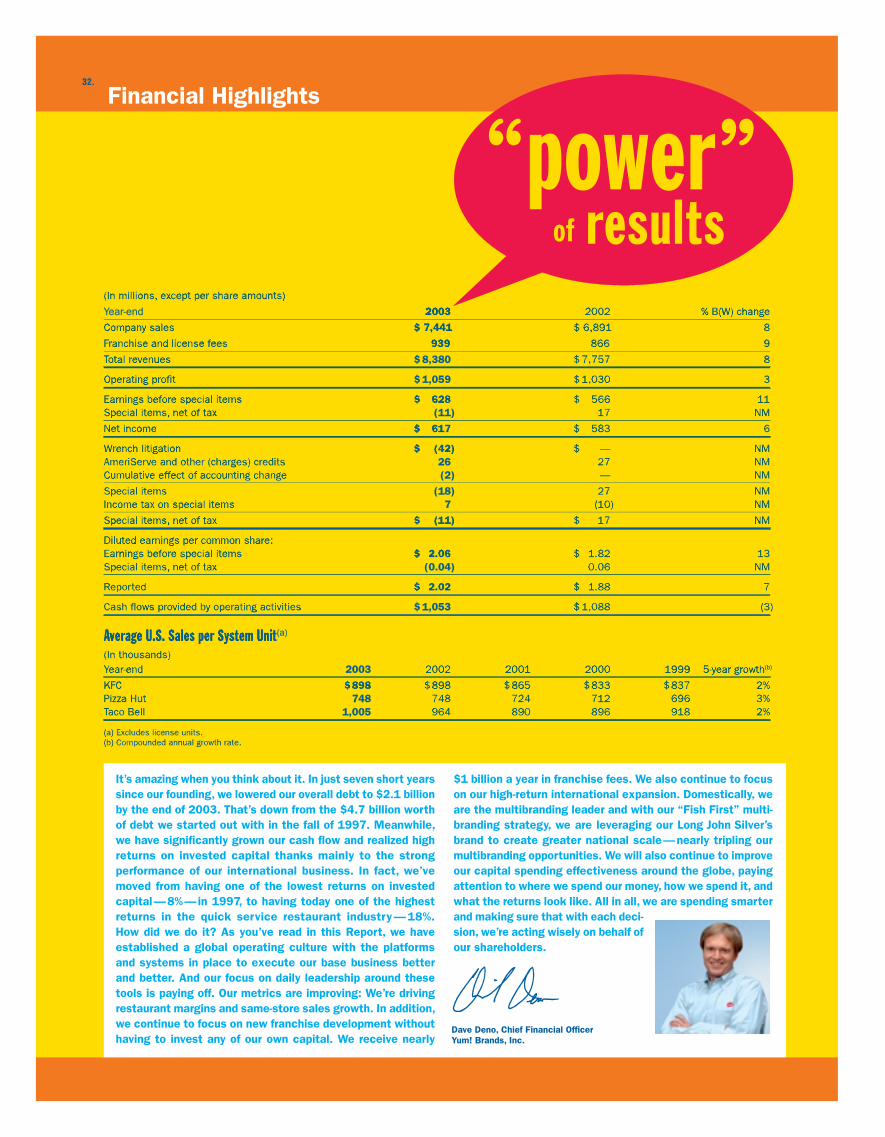
Financial Highlights
Year-end 2003 2003 2003 2002 2002 2002 % B(W) change % B(W) change % B(W) change
Company sales Company salesCompany sales $ 7,441 $ 7,441 $ 7,441 $ 6,891 $ 6,891 $ 6,891 8 8 8
Franchise and license fees Franchise and license feesFranchise and license fees 939 939 939 866 866 866 9 9 9
Total revenues Total revenuesTotal revenues $ 8,380 $ 7,757 8 $ 7,757 8 $ 7,757 8
Operating profit Operating profitOperating profit $ 1,059 $ 1,030 3 $ 1,030 3 $ 1,030 3
Earnings before special items Earnings before special itemsEarnings before special items $ 628 $ 628$ 628 $ 566 11 $ 566 11 $ 566 11Special items, net of tax Special items, net of taxSpecial items, net of tax (11) 17 17 17 NM NM NM
Net income Net incomeNet income $ 617 $ 617$ 617 $ 583 6 $ 583 6 $ 583 6
Wrench litigation Wrench litigationWrench litigation $ (42) $ (42)$ (42) $ — NM $ — NM $ — NMAmeriServe and other (charges) credits AmeriServe and other (charges) creditsAmeriServe and other (charges) credits 26 27 27 27 NM NM NMCumulative effect of accounting change Cumulative effect of accounting changeCumulative effect of accounting change (2) — — — NM NM NM
Special items Special itemsSpecial items (18) 27 27 27 NM NM NMIncome tax on special items Income tax on special itemsIncome tax on special items 7 (10) (10) (10) NM NM NM
Special items, net of tax Special items, net of taxSpecial items, net of tax $ (11) $ (11)$ (11) $ 17 NM $ 17 NM $ 17 NM
Diluted earnings per common share: Diluted earnings per common share:Diluted earnings per common share:Earnings before special items Earnings before special itemsEarnings before special items $ 2.06 $ 2.06$ 2.06 $ 1.82 13 $ 1.82 13 $ 1.82 13Special items, net of tax Special items, net of taxSpecial items, net of tax (0.04) 0.06 0.06 0.06 NM NM NM
Reported ReportedReported $ 2.02 $ 2.02$ 2.02 $ 1.88 7 $ 1.88 7 $ 1.88 7
Cash flows provided by operating activities Cash flows provided by operating activitiesCash flows provided by operating activities $ 1,053 $ 1,088 (3) $ 1,088 (3) $ 1,088 (3)
Average U.S. Sales per System Unit Average U.S. Sales per System UnitAverage U.S. Sales per System Unit(a)
(In thousands) (In thousands)(In thousands)Year-end Year-endYear-end 2003 2002 2001 2000 2002 2001 2000 2002 2001 2000 1999 5-year growth 1999 5-year growth 1999 5-year growth(b)
KFC KFCKFC $ 898 $898$ 898 $ 898 $ 865 $ 833 $898 $865 $833 $ 898 $ 865 $ 833 $ 837 2% $837 2% $ 837 2%Pizza Hut Pizza HutPizza Hut 748 748 724 712 748 724 712 748 724 712 696 3% 696 3% 696 3%Taco Bell Taco BellTaco Bell 1,005 964 890 896 964 890 896 964 890 896 918 2% 918 2% 918 2%
(a) Excludes license units. (a) Excludes license units.(a) Excludes license units.(b) Compounded annual growth rate. (b) Compounded annual growth rate.(b) Compounded annual growth rate.
$1 billion a year in franchise fees. We also continue to focus on our high-return international expansion. Domestically, we are the multibranding leader and with our “Fish First” multi-branding strategy, we are leveraging our Long John Silver’s brand to create greater national scale — nearly tripling our multibranding opportunities. We will also continue to improve our capital spending effectiveness around the globe, paying attention to where we spend our money, how we spend it, and what the returns look like. All in all, we are spending smarterand making sure that with each deci-sion, we’re acting wisely on behalf of our shareholders.
It’s amazing when you think about it. In just seven short yearssince our founding, we lowered our overall debt to $2.1 billionby the end of 2003. That’s down from the $4.7 billion worth of debt we started out with in the fall of 1997. Meanwhile, we have significantly grown our cash flow and realized high returns on invested capital thanks mainly to the strong performance of our international business. In fact, we’ve moved from having one of the lowest returns on invested capital — 8% — in 1997, to having today one of the highest returns in the quick service restaurant industry — 18%. How did we do it? As you’ve read in this Report, we have established a global operating culture with the platforms and systems in place to execute our base business better and better. And our focus on daily leadership around these tools is paying off. Our metrics are improving: We’re driving restaurant margins and same-store sales growth. In addition, we continue to focus on new franchise development without having to invest any of our own capital. We receive nearly
Dave Deno, Chief Financial Offi cerYum! Brands, Inc.
(In millions, except per share amounts) (In millions, except per share amounts)(In millions, except per share amounts)
32.
““powerpower””resultsofof

Yum! Brands Inc. 33.Management’s Discussion and Analysis of Financial Conditionand Results of Operations
INTRODUCTION AND OVERVIEWYUM! Brands, Inc. and Subsidiaries (collectively referred to as “YUM” or the “Company”) comprises the worldwide operations of KFC, Pizza Hut, Taco Bell, Long John Silver’s (“LJS”) and A&W All-American Food Restaurants (“A&W”) (collectively “the Concepts”) and is the world’s largest quick service restaurant (“QSR”) company based on the number of system units. LJS and A&W were added when YUM acquired Yorkshire Global Restaurants, Inc. (“YGR”) on May 7, 2002. With 12,377 international units, YUM is the second largest QSR company outside the U.S. YUM became an independent, publicly-owned company on October 6, 1997 (the “Spin-off Date”) via a tax-free distribu-tion of our Common Stock (the “Distribution” or “Spin-off”) to the shareholders of our former parent, PepsiCo, Inc. (“PepsiCo”).
Through its Concepts, YUM develops, operates, franchises and licenses a system of both traditional and non-traditional QSR restaurants. Traditional units feature dine-in, carryout and, in some instances, drive-thru or delivery services. Non-traditional units, which are typically licensed outlets, include express units and kiosks which have a more limited menu and operate in non-traditional locations like malls, airports, gasoline service stations, convenience stores, stadiums, amusement parks and colleges, where a full-scale traditional outlet would not be practical or efficient.
The retail food industry, in which the Company competes, is made up of supermarkets, supercenters, warehouse stores, convenience stores, coffee shops, snack bars, delicatessens and restaurants (including the QSR segment), and is intensely competitive with respect to food quality, price, service, convenience, location and concept. The industry is often affected by changes in consumer tastes; national, regional or local economic condi-tions; currency fluctuations; demographic trends; traffic patterns; the type, number and location of competing food retailers and products; and disposable purchasing power. Each of the Concepts competes with international, national and regional restaurant chains as well as locally-owned restaurants, not only for customers, but also for manage-ment and hourly personnel, suitable real estate sites and qualified franchisees.
The Company is focused on five long-term measures identified as essential to our growth and progress. These five measures and related key performance indicators are as follows:
International expansion• International system-sales growth (local currency)• Number of new international restaurant openings• Net international unit growth
Multibrand innovation and expansion• Number of multibrand restaurant locations• Number of multibrand units added• Number of franchise multibrand units added
Portfolio of category-leading U.S. brands• U.S. blended same-store sales growth• U.S. system-sales growth
Global franchise fees• New restaurant openings by franchisees• Franchise fee growth
Strong cash generation and returns• Cash generated from all sources• Cash generated from all sources after capital
spending• Restaurant marginsOur progress against these measures is discussed
throughout the Management’s Discussion and Analysis (“MD&A”).
All references to per share and share amounts in the following MD&A have been adjusted to reflect the two-for-one stock split distributed on June 17, 2002.
This MD&A should be read in conjunction with our Consolidated Financial Statements on pages 48 through 51 and the Cautionary Statements on page 47. All Note references herein refer to the Notes to the Consolidated Financial Statements on pages 52 through 74. Tabular amounts are displayed in millions except per share and unit count amounts, or as otherwise specifically identified.
FACTORS AFFECTING COMPARABILITY OF 2003 RESULTS TO 2002 RESULTS AND 2002 RESULTS TO 2001 RESULTS
YGR AcquisitionOn May 7, 2002, the Company completed its acquisition of YGR, the parent company of LJS and A&W. See Note 4 for a discussion of the acquisition.
As of the date of the acquisition, YGR consisted of 742 and 496 company and franchise LJS units, respectively, and 127 and 742 company and franchise A&W units, respec-tively. In addition, 133 multibranded LJS/A&W restaurants were included in the LJS unit totals. Except as discussed in certain sections of the MD&A, the impact of the acquisition on our results of operations in 2003 and 2002 was not significant relative to the comparable prior year period.
Amendment of Sale-Leaseback AgreementsAs discussed in Note 14, on August 15, 2003 we amended two sale-leaseback agreements assumed in our 2002 acquisition of YGR such that the agreements now qualify for sale-leaseback accounting. There was no gain or loss recorded as a result of this transaction; however, restau-rant margins decreased by approximately $3 million for the year ended December 27, 2003 as a result of the two amended agreements being accounted for as operating leases subsequent to the amendment. The decrease in restaurant margin was largely offset by a similar decrease in interest expense.
34.
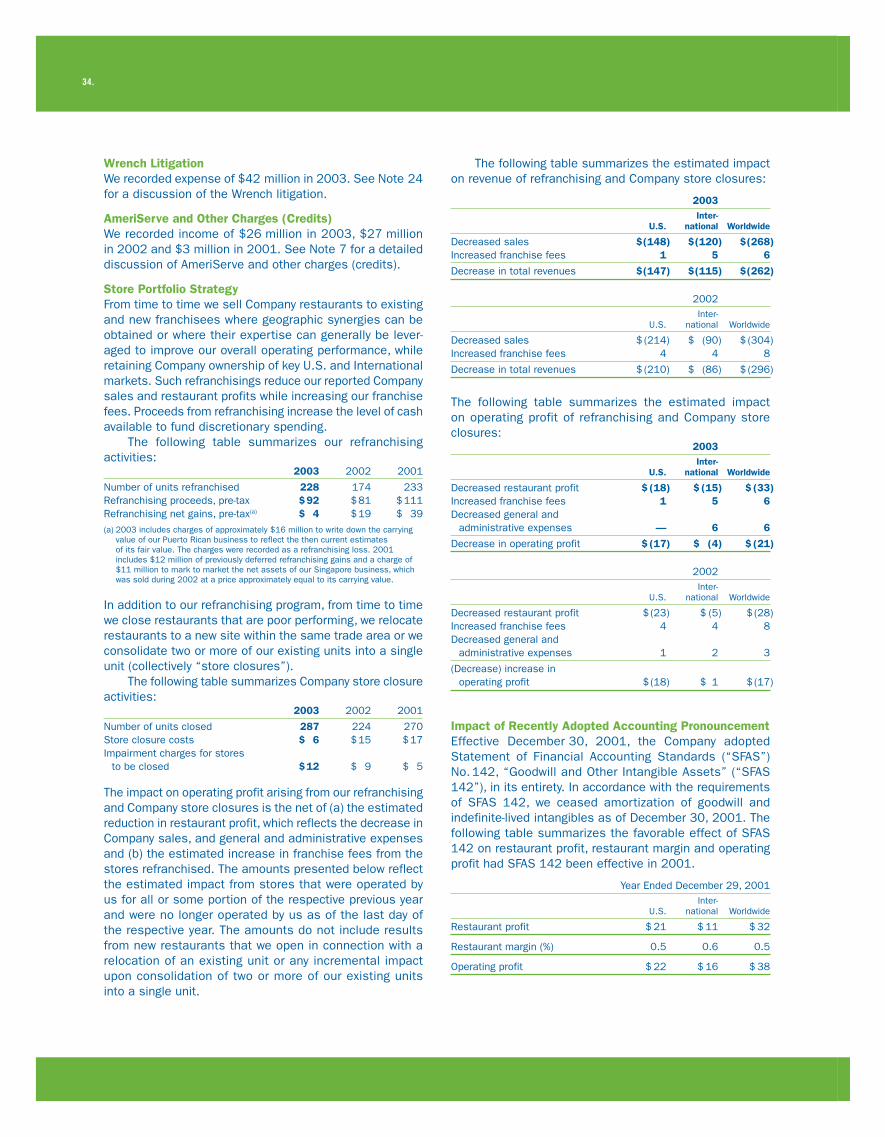
Wrench LitigationWe recorded expense of $42 million in 2003. See Note 24 for a discussion of the Wrench litigation.
AmeriServe and Other Charges (Credits)We recorded income of $26 million in 2003, $27 million in 2002 and $3 million in 2001. See Note 7 for a detailed discussion of AmeriServe and other charges (credits).
Store Portfolio StrategyFrom time to time we sell Company restaurants to existing and new franchisees where geographic synergies can be obtained or where their expertise can generally be lever-aged to improve our overall operating performance, while retaining Company ownership of key U.S. and International markets. Such refranchisings reduce our reported Company sales and restaurant profits while increasing our franchise fees. Proceeds from refranchising increase the level of cash available to fund discretionary spending.
The following table summarizes our refranchising activities: 2003 2002 2001
Number of units refranchised 228 174 233Refranchising proceeds, pre-tax $ 92 $ 81 $ 111Refranchising net gains, pre-tax(a) $ 4 $ 19 $ 39(a) 2003 includes charges of approximately $16 million to write down the carrying
value of our Puerto Rican business to reflect the then current estimates of its fair value. The charges were recorded as a refranchising loss. 2001 includes $12 million of previously deferred refranchising gains and a charge of $11 million to mark to market the net assets of our Singapore business, which was sold during 2002 at a price approximately equal to its carrying value.
In addition to our refranchising program, from time to time we close restaurants that are poor performing, we relocate restaurants to a new site within the same trade area or we consolidate two or more of our existing units into a single unit (collectively “store closures”).
The following table summarizes Company store closure activities: 2003 2002 2001
Number of units closed 287 224 270Store closure costs $ 6 $ 15 $ 17Impairment charges for stores
to be closed $ 12 $ 9 $ 5
The impact on operating profit arising from our refranchising and Company store closures is the net of (a) the estimated reduction in restaurant profit, which reflects the decrease in Company sales, and general and administrative expenses and (b) the estimated increase in franchise fees from the stores refranchised. The amounts presented below reflect the estimated impact from stores that were operated by us for all or some portion of the respective previous year and were no longer operated by us as of the last day of the respective year. The amounts do not include results from new restaurants that we open in connection with a relocation of an existing unit or any incremental impact upon consolidation of two or more of our existing units into a single unit.
The following table summarizes the estimated impact on revenue of refranchising and Company store closures:
2003 Inter- U.S. national Worldwide
Decreased sales $ (148) $ (120) $ (268)Increased franchise fees 1 5 6
Decrease in total revenues $ (147) $ (115) $ (262)
2002 Inter- U.S. national Worldwide
Decreased sales $ (214) $ (90) $ (304)Increased franchise fees 4 4 8
Decrease in total revenues $ (210) $ (86) $ (296)
The following table summarizes the estimated impact on operating profit of refranchising and Company store closures: 2003 Inter- U.S. national Worldwide
Decreased restaurant profit $ (18) $ (15) $ (33)Increased franchise fees 1 5 6Decreased general and
administrative expenses — 6 6
Decrease in operating profit $ (17) $ (4) $ (21)
2002 Inter- U.S. national Worldwide
Decreased restaurant profit $ (23) $ (5) $ (28)Increased franchise fees 4 4 8Decreased general and
administrative expenses 1 2 3
(Decrease) increase in operating profit $ (18) $ 1 $ (17)
Impact of Recently Adopted Accounting PronouncementEffective December 30, 2001, the Company adopted Statement of Financial Accounting Standards (“SFAS”) No. 142, “Goodwill and Other Intangible Assets” (“SFAS 142”), in its entirety. In accordance with the requirements of SFAS 142, we ceased amortization of goodwill and indefinite-lived intangibles as of December 30, 2001. The following table summarizes the favorable effect of SFAS 142 on restaurant profit, restaurant margin and operating profit had SFAS 142 been effective in 2001.
Year Ended December 29, 2001 Inter- U.S. national Worldwide
Restaurant profit $ 21 $ 11 $ 32
Restaurant margin (%) 0.5 0.6 0.5
Operating profit $ 22 $ 16 $ 38

Yum! Brands Inc. 35.
Additionally, if SFAS 142 had been effective in 2001, reported net income would have increased approximately $26 million and diluted earnings per common share (“EPS”) would have increased $0.09.
SFAS 142 requires that goodwill and indefinite-lived intangibles be evaluated for impairment on an annual basis or as impairment indicators exist. In accordance with this requirement, we recognized impairment of approximately $5 million in both 2003 and 2002.
WORLDWIDE RESULTS OF OPERATIONS % B/(W) % B/(W) vs. vs. 2003 2002 2002 2001
Revenues Company sales $ 7,441 8 $ 6,891 12 Franchise and license fees 939 9 866 6
Total revenues $ 8,380 8 $ 7,757 12
Company restaurant margin $ 1,104 — $ 1,101 22
% of Company sales 14.8% (1.2)ppts. 16.0% 1.2)ppts.
Operating profit 1,059 3 1,030 16Interest expense, net 173 (1) 172 (8)Income tax provision 268 3 275 (15)
Income before cumulative effect of accounting change 618 6 583 18
Cumulative effect of accounting change, net of tax (1) NM — —
Net income $ 617 6 $ 583 18
Diluted earnings per share(a) $ 2.02 7 $ 1.88 16
(a) See Note 6 for the number of shares used in this calculation. See Note 12 for a discussion of the proforma impact of SFAS 142 on EPS in 2001.
WORLDWIDE RESTAURANT UNIT ACTIVITY Unconsolidated Company Affiliates Franchisees Licensees Total
Balance at Dec. 29, 2001 6,435 2,000 19,263 2,791 30,489New Builds 585 165 748 146 1,644Acquisitions(a) 905 41 1,164 (3) 2,107Refranchising (174) (14) 188 — —Closures (224) (46) (649) (409) (1,328)Other (1) 2 10 1 12
Balance at Dec. 28, 2002 7,526 2,148 20,724 2,526 32,924New Builds 454 176 868 272 1,770Acquisitions 389 (736) 345 2 —Refranchising (228) (1) 227 2 —Closures (287) (75) (691) (388) (1,441)Other — — (2) (52) (54)
Balance at Dec. 27, 2003 7,854 1,512 21,471 2,362 33,199
% of Total 24% 4% 65% 7% 100%
(a) Includes units that existed at the date of the acquisition of YGR on May 7, 2002.
Worldwide Multibrand Restaurants Company Franchise Total
Balance at Dec. 28, 2002 888 1,087 1,975
Balance at Dec. 27, 2003 1,096 1,249 2,345
The franchise unit counts include both franchisee and unconsolidated affiliate multibrand units. Multibrand conver-sions increase the sales and points of distribution for the second brand added to a restaurant but do not result in an additional unit count. Similarly, a new multibrand restaurant, while increasing sales and points of distribution for two brands, results in just one additional unit count.
For 2003 and 2002, Company multibrand unit gross additions were 235 and 216, respectively. For 2003 and 2002, franchise multibrand unit gross additions were 194 and 166, respectively.
WORLDWIDE SYSTEM SALES GROWTHSystem Sales Growth 2003 2002
Worldwide 7% 8%
System sales growth includes the results of all restaurants regardless of ownership, including company-owned, fran-chise, unconsolidated affiliate and license restaurants. Sales of franchise, unconsolidated affiliate and license restaurants generate franchise and license fees for the company (typically at a rate of 4% to 6% of sales). Franchise, unconsolidated affiliate and license restaurants sales are not included in company sales on the Consolidated Statements of Income; however, the fees are included in the Company’s revenues. We believe system sales growth

36.
is useful to investors as a significant indicator of the overall strength of our business as it incorporates all of our revenue drivers, company and franchise same store sales as well as net unit development.
System sales increased 7% for 2003, after a 2% favor-able impact from foreign currency translation. Excluding the favorable impact of both foreign currency translation and the YGR acquisition, system sales increased 3%. The increase was driven by new unit development, partially offset by store closures.
System sales increased 8% in 2002. The impact from foreign currency translation was not significant. Excluding the favorable impact of the YGR acquisition, system sales increased 5%. The increase resulted from new unit devel-opment and same store sales growth, partially offset by store closures.
WORLDWIDE REVENUESCompany sales increased $550 million or 8% in 2003, after a 1% favorable impact from foreign currency translation. Excluding the favorable impact of both foreign currency translation and the YGR acquisition, Company sales increased 4%. The increase was driven by new unit develop-ment, partially offset by store closures and refranchising.
Franchise and license fees increased $73 million or 9% in 2003, after a 3% favorable impact from foreign currency translation. Excluding the impact of foreign currency translation and the favorable impact of the YGR acquisition, franchise and license fees increased 5%. The increase was driven by new unit development, royalty rate increases and same store sales growth, partially offset by store closures.
Company sales increased $753 million or 12% in 2002. The impact from foreign currency translation was not significant. Excluding the favorable impact of the YGR acquisition, Company sales increased 6%. The increase was driven by new unit development and same store sales growth. The increase was partially offset by refranchising and store closures.
Franchise and license fees increased $51 million or 6% in 2002. The impact from foreign currency translation was not significant. Excluding the favorable impact of the YGR acquisition, franchise and license fees increased 4%. The increase was driven by new unit development and same store sales growth, partially offset by store closures.
WORLDWIDE COMPANY RESTAURANT MARGIN 2003 2002 2001
Company sales 100.0% 100.0% 100.0%Food and paper 30.9 30.6 31.1Payroll and employee benefits 27.2 27.2 27.1Occupancy and other
operating expenses 27.1 26.2 27.0
Company restaurant margin 14.8% 16.0% 14.8%
Restaurant margin as a percentage of sales decreased approximately 120 basis points in 2003. U.S. restaurant margin decreased approximately 140 basis points and International restaurant margin decreased approximately 50 basis points.
Restaurant margin as a percentage of sales increased approximately 120 basis points in 2002. The increase included the favorable impact of approximately 50 basis points from the adoption of SFAS 142, partially offset by the unfavorable impact of approximately 15 basis points from the YGR acquisition. U.S. restaurant margin increased approximately 80 basis points and International restaurant margin increased approximately 210 basis points.
The changes in U.S. and International restaurant margin for 2003 and 2002 are discussed in the respec-tive sections.
WORLDWIDE GENERAL AND ADMINISTRATIVE EXPENSESGeneral and administrative expenses increased $32 million or 3% in 2003, including a 1% unfavorable impact from foreign currency translation. Excluding the unfavorable impact from both foreign currency translation and the YGR acquisition, general and administrative expenses were flat year to date. Lower management incentive compensation costs were offset by increases in expenses associated with international restaurant expansion and pension expense.
General and administrative expenses increased $117 million or 15% in 2002. Excluding the unfavorable impact of the YGR acquisition, general and administra-tive expenses increased 10%. The increase was driven by higher compensation-related costs and higher corporate and project spending.
WORLDWIDE FRANCHISE AND LICENSE EXPENSESFranchise and license expenses decreased $21 million or 42% in 2003. The decrease was primarily attributable to lower allowances for doubtful franchise and license fee receivables, primarily at Taco Bell.
Franchise and license expenses decreased $10 million or 18% in 2002. The decrease was primarily attributable to lower allowances for doubtful franchise and license fee receivables and the favorable impact of lapping support costs related to the financial restructuring of certain Taco Bell franchisees in 2001. The decrease was partially offset by higher marketing support costs in certain inter-national markets.
WORLDWIDE OTHER (INCOME) EXPENSE 2003 2002 2001
Equity income from investments in unconsolidated affiliates $ (39) $ (29) $ (26)
Foreign exchange net (gain) loss (2) (1) 3
Other (income) expense $ (41) $ (30) $ (23)

Yum! Brands Inc. 37.
The increase in other (income) expense in 2003 was primarily driven by the improved operating performance of our unconsolidated affiliates, particularly in China.
WORLDWIDE FACILITY ACTIONSWe recorded a net loss from facility actions of $36 million, $32 million and $1 million in 2003, 2002 and 2001, respectively. See the Store Portfolio Strategy section for more detail of our refranchising and closure activities and Note 7 for a summary of the components of facility actions by reportable operating segment.
WORLDWIDE OPERATING PROFIT % B/(W) % B/(W) vs. vs. 2003 2002 2002 2001
United States $ 812 1 $ 802 15International 441 22 361 19Unallocated and corporate
expenses (179) — (178) (20)Unallocated other income
(expense) (3) NM (1) NMUnallocated facility actions gain 4 NM 19 NMWrench litigation (42) NM — —AmeriServe and other (charges)
credits 26 NM 27 NM
Operating profit $ 1,059 3 $ 1,030 16
The changes in U.S. and International operating profit for 2003 and 2002 are discussed in the respective sections.
Unallocated and corporate expenses increased $1 million in 2003 and $30 million or 20% in 2002. The 2002 increase was primarily driven by higher compensation-related costs and higher corporate and project spending.
Unallocated facility actions comprises refranchising gains (losses) which are not allocated to the U.S. or International segments for performance reporting purposes. See Note 7 for further discussion.
WORLDWIDE INTEREST EXPENSE, NET 2003 2002 2001
Interest expense $ 185 $ 180 $ 172Interest income (12) (8) (14)
Interest expense, net $ 173 $ 172 $ 158
Interest expense increased $5 million or 3% in 2003. Excluding the impact of the YGR acquisition, interest expense decreased 6%. The decrease was primarily due to a decrease in our average debt outstanding.
Interest expense increased $8 million or 5% in 2002. Excluding the impact of the YGR acquisition, interest expense decreased 12%. The decrease was driven by a reduction in our average debt balance partially offset by an increase in our average interest rate. Our average interest rate increased due to a reduction in our variable-rate borrowings using proceeds from the issuance of longer term, fixed-rate notes.
WORLDWIDE INCOME TAXES 2003 2002 2001
Reported Income taxes $ 268 $ 275 $ 241 Effective tax rate 30.2% 32.1% 32.8%
The reconciliation of income taxes calculated at the U.S. federal tax statutory rate to our effective tax rate is set forth below: 2003 2002 2001
U.S. federal statutory tax rate 35.0% 35.0% 35.0%State income tax, net of federal
tax benefit 1.8 2.0 2.1Foreign and U.S. tax effects
attributable to foreign operations (3.6) (2.8) (0.7)Adjustments to reserves and prior years (1.7) (1.8) (1.8)Foreign tax credit amended
return benefit (4.1) — —Valuation allowance additions
(reversals) 2.8 — (1.7)Other, net — (0.3) (0.1)
Effective tax rate 30.2% 32.1% 32.8%
Income taxes and the effective tax rate as shown above reflect tax on all amounts included in our results of opera-tions except for the income tax benefit of approximately $1 million on the $2 million cumulative effect adjustment recorded in the year ended December 27, 2003 due to the adoption of SFAS 143.
The 2003 effective tax rate decreased 1.9 percentage points to 30.2%. The decrease in the effective tax rate was primarily due to a 4.1 percentage point benefit of amending certain prior U.S. income tax returns to claim credit for foreign taxes paid in prior years. The returns were amended upon our determination that it was more beneficial to claim credit for such taxes than to deduct such taxes, as had been done when the returns were originally filed. In future years, we anticipate continuing to claim credit for foreign taxes paid in the then current year, as we have done in 2003 and 2002. However, the amended return benefit recognized in 2003 is non-recurring.
The decrease in the 2003 effective tax rate was partially offset by the recognition of valuation allowances for certain deferred tax assets whose realization is no longer considered more likely than not. The valuation allowances recognized primarily related to deferred tax assets in Mexico and Thailand. See Note 22 for a discussion of valuation allowances.
The 2002 effective tax rate decreased 0.7 percentage points to 32.1%. The decrease in the effective tax rate was primarily due to our claiming credit against our current and future U.S. income tax liability for foreign taxes paid in 2002, as opposed to deducting such taxes on our U.S. income tax returns as was done in 2001. This decrease was partially offset by the impact of lapping valuation allowance reversals recorded in 2001.
In 2003 and 2002, the effective tax rate attributable to foreign operations was lower than the U.S. federal statutory

38.
rate primarily due to the benefit of claiming credit against our current and future U.S. income tax liability for foreign taxes paid.
Adjustments to reserves and prior years include the effects of the reconciliation of income tax amounts recorded in our Consolidated Statements of Income to amounts reflected on our tax returns, including any adjust-ments to the Consolidated Balance Sheets. Adjustments to reserves and prior years also includes changes in tax reserves established for potential exposure we may incur if a taxing authority takes a position on a matter contrary to our position. We evaluate these reserves, including interest thereon, on a quarterly basis to insure that they have been appropriately adjusted for events that we believe may impact our exposure.
U.S. RESULTS OF OPERATIONS % B/(W) % B/(W) vs. vs. 2003 2002 2002 2001
Revenues Company sales $ 5,081 6 $ 4,778 11 Franchise and license fees 574 1 569 5
Total revenues $ 5,655 6 $ 5,347 11
Company restaurant margin $ 739 (3) $ 764 18
% of Company sales 14.6% (1.4)ppts. 16.0% 0.8)ppts.
Operating profit $ 812 1 $ 802 15
U.S. RESTAURANT UNIT ACTIVITY Unconsolidated Company Affiliates.(a) Franchisees Licensees Total
Balance at Dec. 29, 2001 4,284 — 12,733 2,545 19,562New Builds 210 4 233 136 583Acquisitions(b) 899 — 1,001 (3) 1,897Refranchising (47) — 47 — —Closures (153) — (351) (382) (886)Other(c) — — — (30) (30)
Balance at Dec. 28, 2002 5,193 4 13,663 2,266 21,126New Builds 142 3 245 259 649Acquisitions 106 — (108) 2 —Refranchising (150) — 148 2 —Closures (197) (1) (386) (373) (957)Other — — 4 — 4
Balance at Dec. 27, 2003 5,094 6 13,566 2,156 20,822
% of Total 25% — 65% 10% 100%
(a) Represents Yan Can units.
(b) Includes units that existed at the date of the acquisition of YGR on May 7, 2002.
(c) Represents licensee units transferred from U.S. to International.
U.S. Multibrand Restaurants Company Franchise Total
Balance at Dec. 28, 2002 844 973 1,817
Balance at Dec. 27, 2003 1,032 1,116 2,148
For 2003 and 2002, Company multibrand unit gross addi-tions were 222 and 212, respectively. For 2003 and 2002, franchise multibrand unit gross additions were 160 and 153, respectively.
U.S. SYSTEM SALES GROWTHSystem Sales Growth 2003 2002
U.S. 3% 9%
System sales increased 3% for 2003. Excluding the favor-able impact of the YGR acquisition, system sales increased
1%. The increase was driven by new unit development, partially offset by store closures.
System sales increased 9% in 2002. Excluding the favor-able impact of the YGR acquisition, system sales increased 4%. The increase resulted from same store sales growth and new unit development, partially offset by store closures.
U.S. REVENUESCompany sales increased $303 million or 6% in 2003. Excluding the favorable impact of the YGR acquisition, company sales increased 2%. The increase was driven by new unit development, partially offset by store closures and refranchising.
Franchise and license fees increased $5 million or 1% in 2003. Excluding the favorable impact of the YGR acquisi-tion, franchise and license fees remained essentially flat
Yum! Brands Inc. 39.
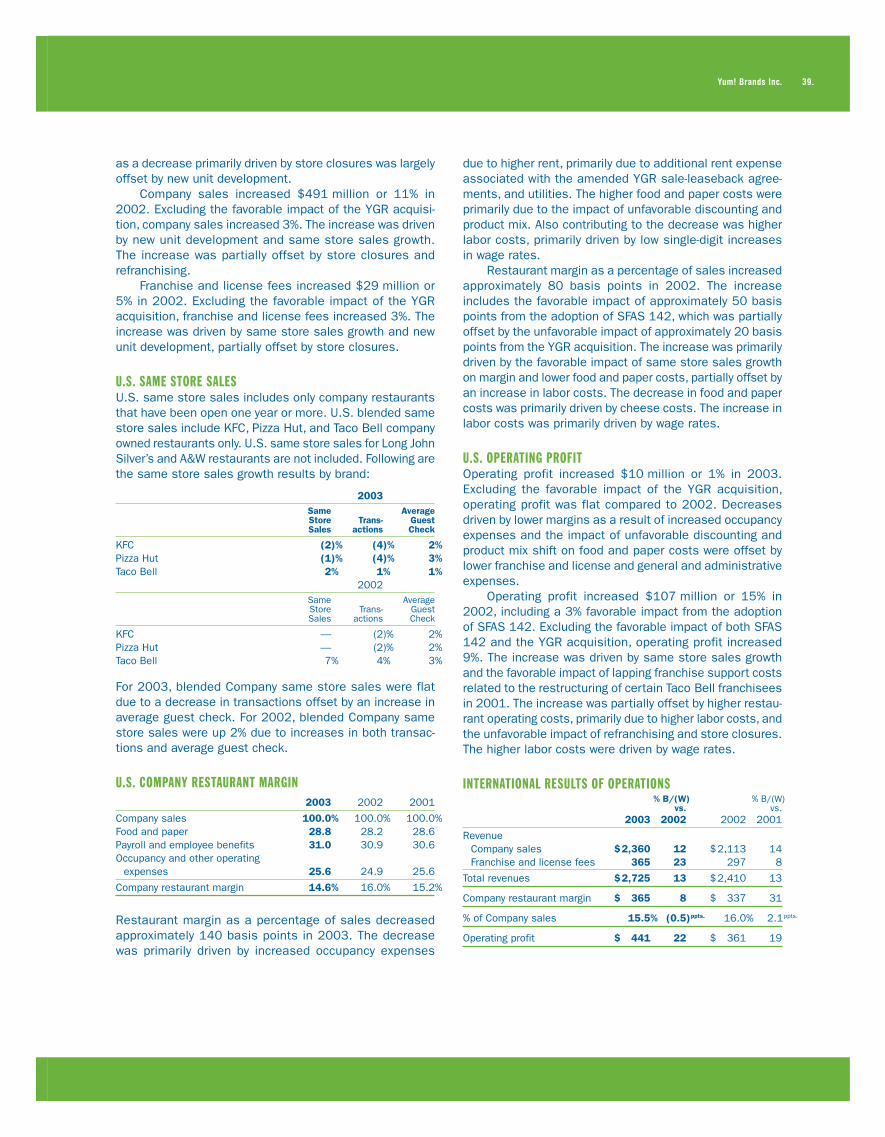
as a decrease primarily driven by store closures was largely offset by new unit development.
Company sales increased $491 million or 11% in 2002. Excluding the favorable impact of the YGR acquisi-tion, company sales increased 3%. The increase was driven by new unit development and same store sales growth. The increase was partially offset by store closures and refranchising.
Franchise and license fees increased $29 million or 5% in 2002. Excluding the favorable impact of the YGR acquisition, franchise and license fees increased 3%. The increase was driven by same store sales growth and new unit development, partially offset by store closures.
U.S. SAME STORE SALESU.S. same store sales includes only company restaurants that have been open one year or more. U.S. blended same store sales include KFC, Pizza Hut, and Taco Bell company owned restaurants only. U.S. same store sales for Long John Silver’s and A&W restaurants are not included. Following are the same store sales growth results by brand:
2003 Same Average Store Trans- Guest Sales actions Check
KFC (2)% (4)% 2%Pizza Hut (1)% (4)% 3%Taco Bell 2% 1% 1% 2002 Same Average Store Trans- Guest Sales actions Check
KFC — (2)% 2%Pizza Hut — (2)% 2%Taco Bell 7% 4% 3%
For 2003, blended Company same store sales were flat due to a decrease in transactions offset by an increase in average guest check. For 2002, blended Company same store sales were up 2% due to increases in both transac-tions and average guest check.
U.S. COMPANY RESTAURANT MARGIN 2003 2002 2001
Company sales 100.0% 100.0% 100.0%Food and paper 28.8 28.2 28.6Payroll and employee benefits 31.0 30.9 30.6Occupancy and other operating
expenses 25.6 24.9 25.6
Company restaurant margin 14.6% 16.0% 15.2%
Restaurant margin as a percentage of sales decreased approximately 140 basis points in 2003. The decrease was primarily driven by increased occupancy expenses
due to higher rent, primarily due to additional rent expense associated with the amended YGR sale-leaseback agree-ments, and utilities. The higher food and paper costs were primarily due to the impact of unfavorable discounting and product mix. Also contributing to the decrease was higher labor costs, primarily driven by low single-digit increases in wage rates.
Restaurant margin as a percentage of sales increased approximately 80 basis points in 2002. The increase includes the favorable impact of approximately 50 basis points from the adoption of SFAS 142, which was partially offset by the unfavorable impact of approximately 20 basis points from the YGR acquisition. The increase was primarily driven by the favorable impact of same store sales growth on margin and lower food and paper costs, partially offset by an increase in labor costs. The decrease in food and paper costs was primarily driven by cheese costs. The increase in labor costs was primarily driven by wage rates.
U.S. OPERATING PROFITOperating profit increased $10 million or 1% in 2003. Excluding the favorable impact of the YGR acquisition, operating profit was flat compared to 2002. Decreases driven by lower margins as a result of increased occupancy expenses and the impact of unfavorable discounting and product mix shift on food and paper costs were offset by lower franchise and license and general and administrative expenses.
Operating profit increased $107 million or 15% in 2002, including a 3% favorable impact from the adoption of SFAS 142. Excluding the favorable impact of both SFAS 142 and the YGR acquisition, operating profit increased 9%. The increase was driven by same store sales growth and the favorable impact of lapping franchise support costs related to the restructuring of certain Taco Bell franchisees in 2001. The increase was partially offset by higher restau-rant operating costs, primarily due to higher labor costs, and the unfavorable impact of refranchising and store closures. The higher labor costs were driven by wage rates.
INTERNATIONAL RESULTS OF OPERATIONS % B/(W) % B/(W) vs. vs. 2003 2002 2002 2001
Revenue Company sales $ 2,360 12 $ 2,113 14 Franchise and license fees 365 23 297 8
Total revenues $ 2,725 13 $ 2,410 13
Company restaurant margin $ 365 8 $ 337 31
% of Company sales 15.5% (0.5)ppts. 16.0% 2.1)ppts.
Operating profit $ 441 22 $ 361 19

40.
INTERNATIONAL RESTAURANT UNIT ACTIVITY Unconsolidated Company Affiliates Franchisees Licensees Total
Balance at Dec. 29, 2001 2,151 2,000 6,530 246 10,927New Builds 375 161 515 10 1,061Acquisitions(a) 6 41 163 — 210Refranchising (127) (14) 141 — —Closures (71) (46) (298) (27) (442)Other(b) (1) 2 10 31 42
Balance at Dec. 28, 2002 2,333 2,144 7,061 260 11,798New Builds 312 173 623 13 1,121Acquisitions 283 (736) 453 — —Refranchising (78) (1) 79 — —Closures (90) (74) (305) (15) (484)Other(c) — — (6) (52) (58)
Balance at Dec. 27, 2003 2,760 1,506 7,905 206 12,377
% of Total 22% 12% 64% 2% 100%
(a) Includes units that existed at the date of the acquisition of YGR on May 7, 2002.
(b) Primarily represents licensee units transferred from U.S. to International in 2002.
(c) Represents an adjustment of previously reported amounts.
INTERNATIONAL REVENUESCompany sales increased $247 million or 12% in 2003, after a 4% favorable impact from foreign currency transla-tion. The increase was driven by new unit development, partially offset by refranchising, same store sales declines and store closures.
Franchise and license fees increased $68 million or 23% in 2003, after a 9% favorable impact from foreign currency translation. The increase was driven by new unit development, royalty rate increases and same store sales growth, partially offset by store closures.
Company sales increased $262 million or 14% in 2002, after a 1% favorable impact from foreign currency translation. The increase was driven by new unit development, partially offset by refranchising and store closures. The unfavorable impact of refranchising primarily resulted from the sale of the Singapore business in the third quarter of 2002.
Franchise and license fees increased $22 million or 8% in 2002, after a 1% unfavorable impact from foreign currency translation. Excluding the impact of foreign currency translation and the favorable impact of the YGR acquisition, franchise and license fees increased 8%. The increase was driven by new unit development and same store sales growth, partially offset by store closures.
INTERNATIONAL COMPANY RESTAURANT MARGIN 2003 2002 2001
Company sales 100.0% 100.0% 100.0%Food and paper 35.5 36.1 36.9Payroll and employee benefits 19.0 18.7 19.1Occupancy and other
operating expenses 30.0 29.2 30.1
Company restaurant margin 15.5% 16.0% 13.9%
International Multibrand Restaurants Company Franchise Total
Balance at Dec. 28, 2002 44 114 158
Balance at Dec. 27, 2003 64 133 197
For 2003 and 2002, Company multibrand unit gross addi-tions were 13 and 4, respectively. Company multibrand restaurants at December 27, 2003 also include 9 units acquired during the year from an unconsolidated affiliate. For 2003 and 2002, franchise multibrand unit gross addi-tions were 34 and 13, respectively.
INTERNATIONAL SYSTEM SALES GROWTHSystem Sales Growth 2003 2002
International 14% 8%
System sales increased 14% in 2003, after a 7% favorable impact from foreign currency translation. The increase was driven by new unit development, partially offset by store closures.
System sales increased 8% in 2002, after a 1% unfa-vorable impact from foreign currency translation. Excluding the impact of foreign currency translation and the favorable impact of the YGR acquisition, system sales increased 8%. The increase was driven by new unit development and same store sales growth, partially offset by store closures.
Yum! Brands Inc. 41.
Restaurant margin as a percentage of sales decreased approximately 50 basis points in 2003, including a 20 basis points unfavorable impact from foreign currency translation. The remaining decrease was driven by the impact on margin of same store sales declines. These decreases were partially offset by the impact of supply chain savings initiatives on the cost of food and paper (principally in China), and the cessa-tion of depreciation expense of approximately $9 million for the Puerto Rico business which is held for sale.
Restaurant margin as a percentage of sales increased approximately 210 basis points in 2002, including the favorable impact of approximately 60 basis points from the adoption of SFAS 142. The increase was primarily driven by the favorable impact of lower restaurant operating costs and the elimination of lower average margin units through store closures. Lower restaurant operating costs primarily resulted from lower food and paper costs, partially offset by higher labor costs.
INTERNATIONAL OPERATING PROFITOperating profit increased $80 million or 22% in 2003, including a 7% favorable impact from foreign currency translation. The remaining increase was driven by new unit development and the impact of supply chain savings initia-tives on the cost of food and paper, partially offset by the impact of same store sales declines on margins and higher general and administrative expenses.
Operating profit increased $56 million or 19% in 2002. Excluding the impact of foreign currency translation and the favorable impact from the adoption of SFAS 142, operating profit increased 13%. The increase was driven by new unit development and the favorable impact of lower restaurant operating costs, primarily lower cost of food and paper. The increase was partially offset by higher general and adminis-trative expenses, primarily compensation-related costs.
CONSOLIDATED CASH FLOWSNet cash provided by operating activities was
$1,053 million compared to $1,088 million in 2002. The decrease was primarily driven by $130 million in voluntary contributions to our funded pension plan in 2003, partially offset by higher net income.
In 2002, net cash provided by operating activities was $1,088 million compared to $832 million in 2001. Excluding the impact of the AmeriServe bankruptcy reorga-nization process, cash provided by operating activities was $1,043 million versus $704 million in 2001. The increase was driven by higher net income and timing of tax receipts and payments.
Net cash used in investing activities was $519 million versus $885 million in 2002. The decrease in cash used was driven by the $275 million acquisition of YGR in 2002 and lower capital spending in 2003.
In 2002, net cash used in investing activities was $885 million versus $503 million in 2001. The increase in cash used was primarily due to the acquisition of YGR and higher capital spending in 2002, partially offset by the acqui-sition of fewer restaurants from franchisees in 2002.
Net cash used in financing activities was $475 million versus $187 million in 2002. The increase was driven by higher net debt repayments and higher shares repurchased in 2003.
In 2002, net cash used in financing activities was $187 million versus $352 million in 2001. The decrease is primarily due to lower debt repayments and higher proceeds from stock option exercises versus 2001, partially offset by higher shares repurchased in 2002.
CONSOLIDATED FINANCIAL CONDITIONAssets increased $220 million or 4% to $5.6 billion
primarily due to a net increase in property, plant and equipment, driven by capital expenditures in excess of depreciation and asset dispositions. The decrease in the allowance for doubtful accounts from $42 million to $28 million was primarily the result of the write-off of receiv-ables previously fully reserved.
Liabilities decreased $306 million or 6% to $4.5 billion primarily due to the repayment of amounts under our Credit Facility, decreased short-term borrowings and the reduc-tion in long-term debt as a result of the amendment of certain sale-leaseback agreements (see Note 14). These decreases were partially offset by an increase in accounts payable and other current liabilities primarily due to the accrual of $42 million related to the Wrench litigation.
LIQUIDITY AND CAPITAL RESOURCESOperating in the QSR industry allows us to generate substantial cash flows from the operations of our company stores and from our franchise operations, which require a limited YUM investment. In each of the last two fiscal years, net cash provided by operating activities has exceeded $1 billion. These cash flows have allowed us to fund our discretionary spending, while at the same time reducing our long-term debt balances. We expect these levels of net cash provided by operating activities to continue in the fore-seeable future. Our discretionary spending includes capital spending for new restaurants, acquisitions of restaurants from franchisees and repurchases of shares of our common stock. Though a decline in revenues could adversely impact our cash flows from operations, we believe our operating cash flows, our ability to reduce discretionary spending, and our borrowing capacity will allow us to meet our cash requirements in 2004 and beyond.
Our primary bank credit agreement comprises a senior unsecured Revolving Credit Facility (the “Credit Facility”) which matures on June 25, 2005. On December 26, 2003, we voluntarily reduced our maximum borrowings

42.
under the Credit Facility from $1.2 billion to $1.0 billion. At December 27, 2003, our unused Credit Facility totaled $737 million, net of outstanding letters of credit of $263 million. There were no borrowings outstanding under the Credit Facility at December 27, 2003. Our Credit Facility contains financial covenants relating to maintenance of leverage and fixed charge coverage ratios. The Credit Facility also contains affirmative and negative covenants including, among other things, limitations on certain addi-tional indebtedness, guarantees of indebtedness, level of cash dividends, aggregate non-U.S. investment and certain other transactions as defined in the agreement. We were in compliance with all covenants at December 27, 2003, and do not anticipate that the covenants will impact our ability to borrow under our Credit Facility for its remaining term.
The remainder of our long-term debt primarily comprises senior unsecured notes. Amounts outstanding under senior
unsecured notes were $1.85 billion at December 27, 2003. The first of these notes, in the amount of $350 million, matures in 2005. We currently anticipate that our net cash provided by operating activities will permit us to make a significant portion of this $350 million payment without borrowing additional amounts.
We estimate that capital spending will be approximately $770 million and refranchising proceeds will be approxi-mately $100 million in 2004. In November 2003, our Board of Directors authorized a new $300 million share repur-chase program. At December 27, 2003, we had remaining capacity to repurchase, through May 21, 2005, up to $294 million of our outstanding Common Stock (excluding applicable transaction fees) under this program.
In addition to any discretionary spending we may choose to make, significant contractual obligations and payments as of December 27, 2003 included:
Less than More than Total 1 Year 1–3 Years 3–5 Years 5 Years
Long-term debt(a) $ 1,930 $ 1 $ 553 $ 254 $ 1,122Capital leases(b) 192 15 29 26 122Operating leases(b) 2,484 320 540 431 1,193Purchase obligations(c) 162 124 26 7 5Other long-term liabilities reflected on our
Consolidated Balance Sheet under GAAP 31 — 17 5 9
Total contractual obligations $ 4,799 $ 460 $ 1,165 $ 723 $ 2,451
(a) Excludes a fair value adjustment of $29 million included in debt related to interest rate swaps that hedge the fair value of a portion of our debt. See Note 14.
(b) These obligations, which are shown on a nominal basis, relate to approximately 5,900 restaurants. See Note 15.
(c) Purchase obligations include agreements to purchase goods or services that are enforceable and legally binding on us and that specify all significant terms, including: fixed or minimum quantities to be purchased; fixed, minimum or variable price provisions; and the approximate timing of the transaction. We have excluded agreements that are cancelable without penalty. Purchase obligations relate primarily to purchases of property, plant and equipment as well as marketing, information technology, maintenance, consulting and other agreements.
We have not included obligations under our pension and postretirement benefit plans in the contractual obligations table. Our funding policy regarding our funded pension plan is to contribute amounts necessary to satisfy minimum pension funding requirements plus such additional amounts from time to time as are determined to be appropriate to improve the plan’s funded status. The pension plan’s funded status is affected by many factors including discount rates and the performance of plan assets. We are not required to make minimum pension funding payments in 2004, but we may make discretionary contributions during the year based on our estimate of the plan’s expected September 30, 2004 funded status. During 2003, we made voluntary pension contributions of $130 million to our funded plan, none of which represented minimum funding requirements. Our postretirement plan is not required to be funded in advance, but is pay as you go. We made postretirement benefit payments of $4 million in 2003.
Also excluded from the contractual obligations table are payments we may make for employee health and prop-erty and casualty losses for which we are self-insured. The majority of our recorded liability for self-insured employee health and property and casualty losses represents
estimated reserves for incurred claims that have yet to be filed or settled.
OFF-BALANCE SHEET ARRANGEMENTSAt December 27, 2003, we had provided approximately $32 million of partial guarantees of two franchisee loan pools, both of which were implemented prior to spin-off, related primarily to the Company’s historical refranchising programs and, to a lesser extent, franchisee development of new restaurants. The total loans outstanding under these loan pools were approximately $123 million at December 27, 2003. In support of these guarantees, we have posted $32 million of letters of credit. We also provide a standby letter of credit of $23 million under which we could potentially be required to fund a portion of one of the franchisee loan pools. Any funding under the guarantees or letters of credit would be secured by the franchisee loans and any related collateral. We believe that we have appropri-ately provided for our estimated probable exposures under these contingent liabilities. These provisions were primarily charged to facility actions. New loans are not currently being added to either loan pool.
Yum! Brands Inc. 43.
We have guaranteed certain lines of credit and loans of Unconsolidated Affiliates totaling $28 million at December 27, 2003. Our Unconsolidated Affiliates had total revenues of over $1.5 billion for the year ended December 27, 2003 and assets and debt of approximately $858 million and $41 million, respectively, at December 27, 2003.
OTHER SIGNIFICANT KNOWN EVENTS, TRENDS OR UNCERTAINTIES EXPECTED TO IMPACT 2004 OPERATING PROFIT COMPARISONS WITH 2003
New Accounting Pronouncements Not Yet AdoptedSee Note 2.
Canada Unconsolidated Affiliate DissolutionOn November 10, 2003 our Unconsolidated Affiliate that previously operated 479 KFC, 236 Pizza Hut and 18 Taco Bell restaurants in Canada was dissolved. We owned 50% of this Unconsolidated Affiliate prior to its dissolution and accounted for our interest under the equity method. Upon dissolution, the Company assumed operation and acquired all associated assets of the Pizza Huts, as well as 17 Taco Bells and 5 KFCs. The Company also acquired the real estate associated with 140 KFCs for which the Company will not be the operator. Our former partner in the Unconsolidated Affiliate acquired full ownership of all other assets, as well as the franchise rights to operate 474 KFCs and one Taco Bell. Our former partner retained 10 KFCs and sold the remainder of these assets and franchise rights acquired to a newly-formed, publicly-held Income Trust in Canada, of which our former partner now holds a minority interest. The Company leases land and buildings for KFCs it does not operate to the Income Trust under operating and capital lease agreements through 2018. The Company will continue to receive a franchise royalty from the KFCs oper-ated by our former partner and the Income Trust.
The Company realized an immaterial gain upon dissolu-tion of the Unconsolidated Affiliate. This gain was realized as the fair value of our increased ownership in the assets received was greater than our carrying value in those assets, and was net of expenses associated with the dissolution of the Unconsolidated Affiliate.
The impact of the restructuring on our 2003 results of operations was not significant. As a result of the restruc-turing, 2004 Company sales are expected to increase by approximately $165 million and franchise fees are expected to decrease by approximately $10 million. The impact on net income is not expected to be material.
Amendment of Sale-Leaseback AgreementsAs discussed in Note 14 and on page 33 of this MD&A, in 2003 we amended two sale-leaseback agreements assumed in our 2002 acquisition of YGR. We estimate the impact of these amendments in 2004 to be a decrease in restaurant profit of $8 million and a decrease in interest expense of $10 million.
Puerto Rico Business Held for SaleOur Puerto Rican business has been held for sale since the fourth quarter of 2002. While a sale of the Puerto Rican business has not yet occurred, we continue to believe that it is probable that a sale will occur during 2004. Sales and restaurant profits of the Puerto Rican business were $187 million and $34 million in 2003.
Contingent Lease GuaranteesUnder terms of our separation agreements at the time of the Spin-off, we indemnified PepsiCo for any losses incurred related to their guarantees of lease agreements of certain non-core businesses which were sold prior to the Spin-off. Two of these businesses, Chevys Mexican Restaurant (Chevys) and Hot ’n Now (HNN) filed for bankruptcy protec-tion in October 2003 and January 2004, respectively. While we cannot presently determine our liability under these indemnities, if any, we do not expect the amount to have a material impact on our Consolidated Financial Statements. Any costs incurred will be charged to AmeriServe and other charges (credits). See Note 24 for further discussion.
Pension Plan Funded StatusCertain of our employees are covered under noncontributory defined benefit pension plans. The most significant of these plans was amended in 2001 such that employees hired after September 30, 2001 are no longer eligible to partici-pate. As of our September 30, 2003 measurement date, these plans had a projected benefit obligation (“PBO”) of $629 million, an accumulated benefit obligation (“ABO”) of $563 million and a fair value of plan assets of $438 million. As a result of the $125 million underfunded status of the plans relative to the ABO at September 30, 2003, we have recorded a $101 million charge to shareholders’ equity (net of tax of $61 million) as of December 27, 2003.
The PBO and ABO reflect the actuarial present value of all benefits earned to date by employees. The PBO incorporates assumptions as to future compensation levels while the ABO reflects only current compensation levels. Due to the relatively long time frame over which benefits earned to date are expected to be paid, our PBO and ABO are highly sensitive to changes in discount rates. We measured our PBO and ABO using a discount rate of 6.25% at September 30, 2003. A 50 basis point increase in this discount rate would have decreased our PBO by approximately $58 million at September 30, 2003. Conversely, a 50 basis point decrease in this discount rate would have increased our PBO by approximately $60 million at September 30, 2003.
Our expected long-term rate of return on plan assets is 8.5%. We believe that this assumption is appropriate given the composition of our plan assets and historical market returns thereon. Given no change to the market-related value of our plan assets as of September 30, 2003, a one percentage point increase or decrease in our expected rate of return on plan assets assumption would decrease or