POM - Chapter 5 Capacity Management 271113
28
1 MITSOB/AA/OM/Ch5/#31/271113 1
-
Upload
amar-vaman -
Category
Documents
-
view
12 -
download
2
description
Capacity Management
Transcript of POM - Chapter 5 Capacity Management 271113

1
MITSOB/AA/OM/Ch5/#31/271113 1

22
Strategic Capacity Strategic Capacity Strategic Capacity Strategic Capacity ManagementManagementgg
©The McGraw-Hill Companies, Inc., 2006McGraw-Hill/Irwin

3
OBJECTIVES
Strategic Capacity Planning Defined Capacity Utilization & Best Operating Level Economies & Diseconomies of Scale The Experience Curve Capacity Focus, Flexibility & Planning Determining Capacity Requirements Decision Trees
l l Capacity Utilization & Service Quality
MITSOB/AA/OM/Ch5/#31/271113 3

4
Strategic Capacity PlanningStrategic Capacity Planning
Capacity can be defined as the ability to hold, receive, store, or accommodate
Strategic capacity planning is an approach for determining the overall approach for determining the overall capacity level of capital intensive resources, including facilities, resources, including facilities, equipment, and overall labor force size
MITSOB/AA/OM/Ch5/#31/271113 4

5
Capacity Utilization
usedCapacitylevel operating Best
usedCapacity ratenutilizatioCapacity
Where Capacity usedCapacity used
rate of output actually achieved
Best operating levelp g capacity for which the process was designed
MITSOB/AA/OM/Ch5/#31/271113 5

6
Best Operating Level
Example: Engineers design engines and assembly lines to operate at an ideal or “best operating level” to maximize output and minimize wareoutput and minimize ware
Averageunit cost
Underutilization
of output
Overutilization
Best OperatingLevel
MITSOB/AA/OM/Ch5/#31/271113 6Volume

7
Example of Capacity Utilization
During one week of production, a plant d d 8 i f d I hi i produced 83 units of a product. Its historic
highest or best utilization recorded was 120 units per week. What is this plant’s capacity pe wee . at s t s p a t s capac tyutilization rate?
Answer: Capacity utilization rate = Capacity used .
B i l lBest operating level
= 83/120
MITSOB/AA/OM/Ch5/#31/271113 7
=0.69 or 69%

8
Economies & Diseconomies of Scale
Economies of Scale and the Experience Curve workingp g
100-unitplant
200-unitAverageunit cost 200 unit
plant 300-unitplant
400-unitplant
of output
Diseconomies of Scale start working
MITSOB/AA/OM/Ch5/#31/271113 8Volume

9
The ExperienceAs plants produce more products, they
The Experience Curve
gain experience in the best production methods and reduce their costs per unit
Yesterday
Cost orprice
it
TodayTomorrow
per unit
T t l l t d d ti f it
MITSOB/AA/OM/Ch5/#31/271113 9
Total accumulated production of units

10
C i FCapacity Focus
The concept of the focused factory holds e co cept o t e focused facto y o dsthat production facilities work best when they focus on a fairly limited set of
d i bj iproduction objectives
Plants Within Plants (PWP) Plants Within Plants (PWP) Extend focus concept to operating level
MITSOB/AA/OM/Ch5/#31/271113 10

11
Capacity Flexibility
Flexible plants
Flexible processes Flexible processes
Flexible workers
MITSOB/AA/OM/Ch5/#31/271113 11

12
Capacity Planning: Balance
Stage 1 Stage 2 Stage 3Units
Unbalanced stages of production
Stage 1 Stage 2 Stage 3permonth
6,000 7,000 5,000Maintaining System Balance: Output of one stage is the
exact input requirements for the next stage
6,000 7,000 5,000
St 1 St 2 St 3Units
Balanced stages of production
Stage 1 Stage 2 Stage 3permonth
6 000 6 000 6 000
MITSOB/AA/OM/Ch5/#31/271113 12
6,000 6,000 6,000

13
Capacity Planning
Frequency of Capacity Additions
External Sources of Capacity
MITSOB/AA/OM/Ch5/#31/271113 13
14
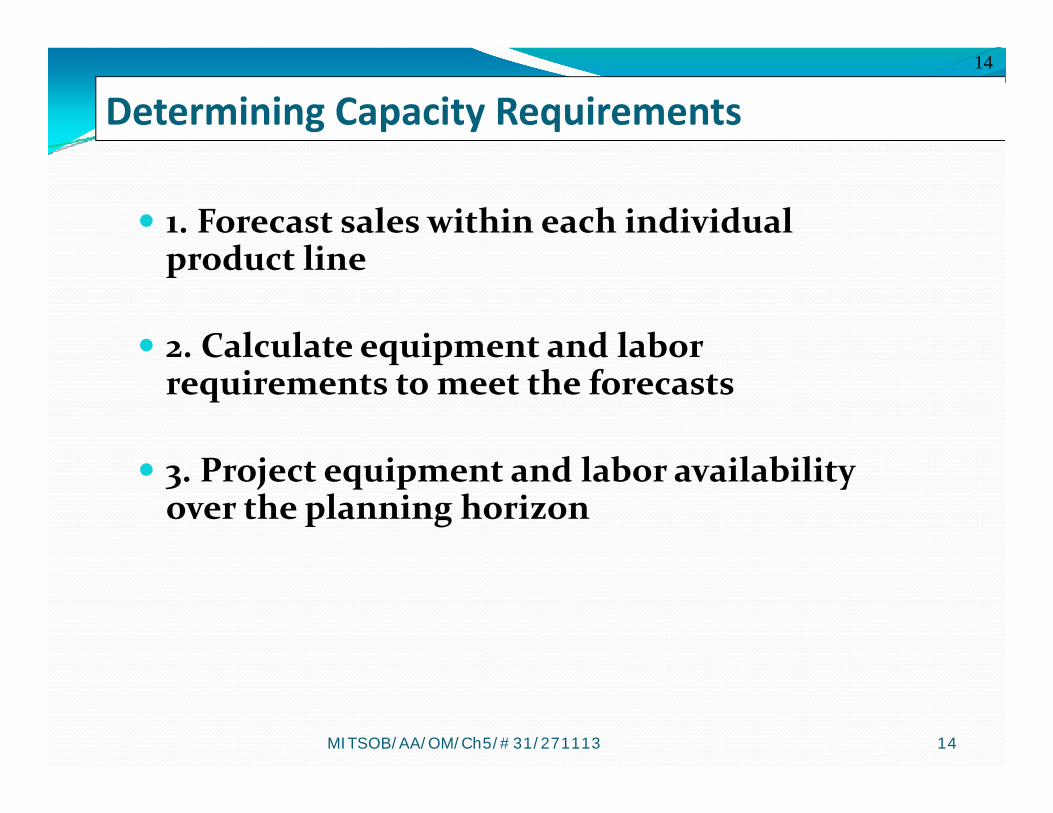
Determining Capacity Requirements
1. Forecast sales within each individual d t liproduct line
2. Calculate equipment and labor 2. Calculate equipment and labor requirements to meet the forecasts
P j i d l b il bili 3. Project equipment and labor availability over the planning horizon
MITSOB/AA/OM/Ch5/#31/271113 14
15
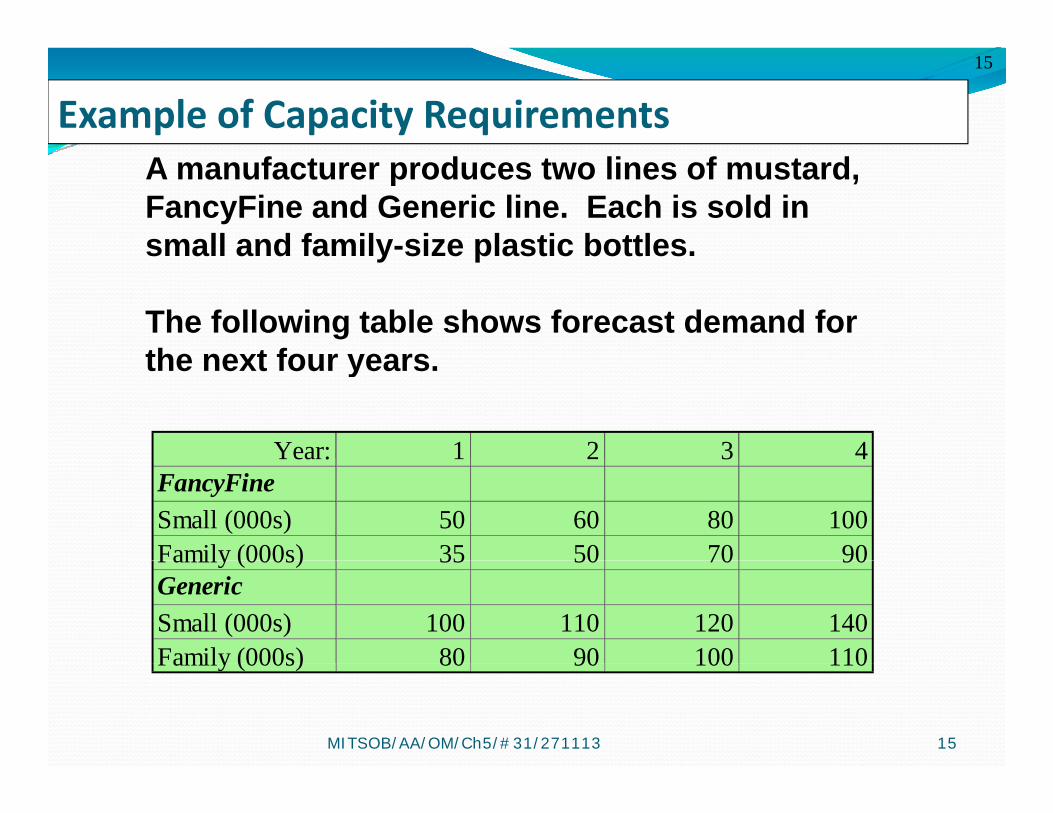
Example of Capacity RequirementsA manufacturer produces two lines of mustard, FancyFine and Generic line. Each is sold in small and family-size plastic bottles.small and family size plastic bottles.
The following table shows forecast demand for the next four yearsthe next four years.
Year: 1 2 3 4Year: 1 2 3 4FancyFineSmall (000s) 50 60 80 100Family (000s) 35 50 70 90Family (000s) 35 50 70 90GenericSmall (000s) 100 110 120 140Family (000s) 80 90 100 110
MITSOB/AA/OM/Ch5/#31/271113 15
Family (000s) 80 90 100 110

16
Example of Capacity Requirements (Continued): Product from a Capacity Viewpoint
Question: Are we really producing two Question: Are we really producing two different types of mustards from the standpoint of capacity requirements?
Answer: No, it’s the same product just packaged differently.
MITSOB/AA/OM/Ch5/#31/271113 16

17
Example of Capacity Requirements (Continued) : Equipment and Labor Requirements
Year: 1 2 3 4Small (000s) 150 170 200 240Family (000s) 115 140 170 200
•Three 100,000 units-per-year machines are available f ll b ttl d ti T t i dfor small-bottle production. Two operators required per machine.
•Two 120,000 units-per-year machines are available for family-sized-bottle production. Three operators required per machine.
MITSOB/AA/OM/Ch5/#31/271113 17
required per machine.

Question: What are the Year 1 values for capacity, machine, and labor?
18
Year: 1 2 3 4Small (000s) 150 170 200 240Family (000s) 115 140 170 200Family (000s) 115 140 170 200
Small Mach. Cap. 300,000 Labor 6Family-size Mach. Cap. 240,000 Labor 6
Small150,000/300,000=50% At 1 machine for 100,000, it
SmallPercent capacity used 50.00%Machine requirement 1.50
takes 1.5 machines for 150,000
Labor requirement 3.00Family-sizePercent capacity used 47 92%
At 2 operators for 100,000, it takes 3 operators for 150 000Percent capacity used 47.92%
Machine requirement 0.96Labor requirement 2.88
operators for 150,000
©The McGraw-Hill Companies, Inc., 2004MITSOB/AA/OM/Ch5/#31/271113 18

Year: 1 2 3 4
Question: What are the values for columns 2, 3 and 4 in the table below?19
Year: 1 2 3 4Small (000s) 150 170 200 240Family (000s) 115 140 170 200
Small Mach. Cap. 300,000 Labor 6Family-size Mach Cap 240 000 Labor 6Family size Mach. Cap. 240,000 Labor 6
SmallPercent capacity used 50.00%Machine requirement 1.50Labor requirement 3 00
56.67%1.703.40
66.67%2.004.00
80.00%2.404.80Labor requirement 3.00
Family-sizePercent capacity used 47.92% 58.33%
1 1770.83%1 42
83.33%1 67Machine requirement 0.96
Labor requirement 2.881.173.50
1.424.25
1.675.00
©The McGraw-Hill Companies, Inc., 2004MITSOB/AA/OM/Ch5/#31/271113 19

20
Example of a Decision Tree Problem
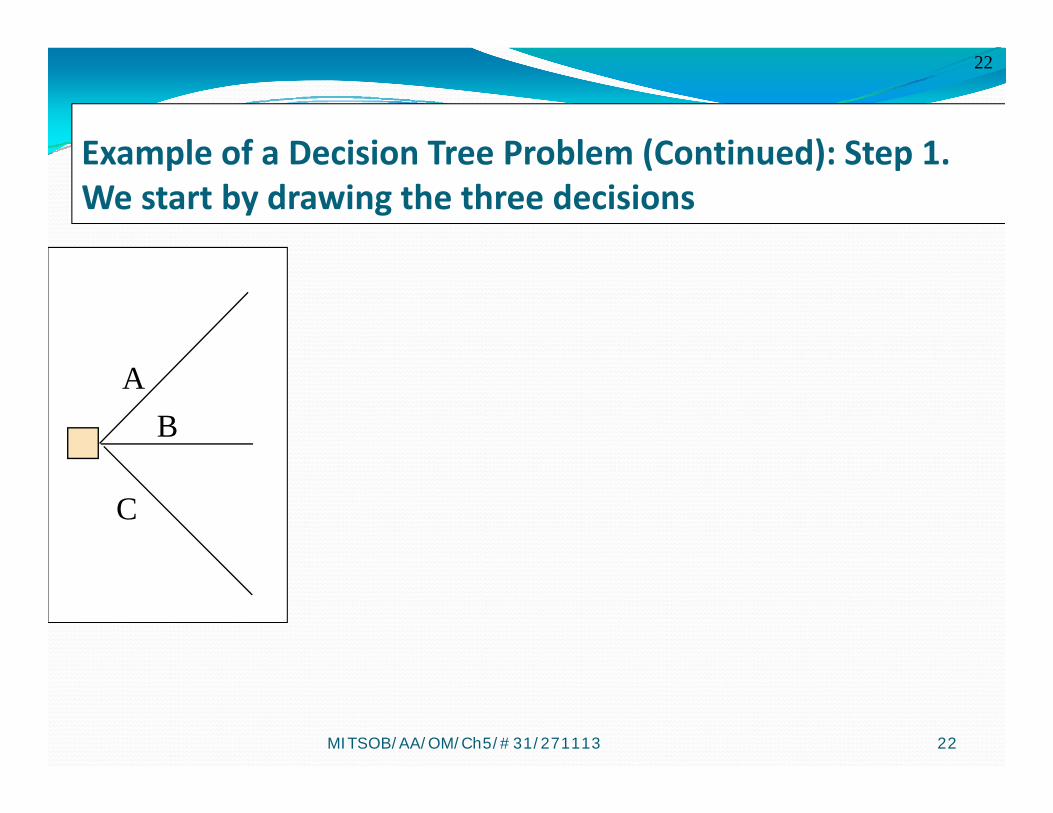
A glass factory specializing in crystal is experiencing a substantial backlog, and the firm's management is considering three courses of action:
A) Arrange for subcontractingB) Construct new facilitiesC) Do nothing (no change)C) Do nothing (no change)
The correct choice depends largely upon demand, which may be low medium or high By consensus managementmay be low, medium, or high. By consensus, management estimates the respective demand probabilities as 0.1, 0.5, and 0.4.
MITSOB/AA/OM/Ch5/#31/271113 20

21
Example of a Decision Tree Problem (Continued): The ff blPayoff Table
The management also estimates the profits h h i f th th lt ti (Awhen choosing from the three alternatives (A,
B, and C) under the differing probable levels of demand These profits in thousands of dollarsdemand. These profits, in thousands of dollars are presented in the table below:
0.1 0.5 0.4Low Medium High
A 10 50 90B -120 25 200
MITSOB/AA/OM/Ch5/#31/271113 21
C 20 40 60
22
Example of a Decision Tree Problem (Continued): Step 1Example of a Decision Tree Problem (Continued): Step 1. We start by drawing the three decisions
AB
C
MITSOB/AA/OM/Ch5/#31/271113 22

23
Example of Decision Tree Problem (Continued): Step 2. Add p ( ) pour possible states of nature, probabilities, and payoffs
High demand (0.4)
Medium demand (0.5)
L d d (0 1)
$90k$50k$10k
A
Low demand (0.1) $10k
High demand (0.4) $200k$25kB
C
Medium demand (0.5)
Low demand (0.1)
$25k-$120k
CHigh demand (0.4)
Medium demand (0.5)$60k$40k$20k
MITSOB/AA/OM/Ch5/#31/271113 23
Low demand (0.1) $20k

24
Example of Decision Tree Problem (Continued): Step 3. Determine the expected value of each decision
High demand (0.4)
Medium demand (0.5)$90k$50k
$62k Low demand (0.1)
A
$10k$62k
EVA=0.4(90)+0.5(50)+0.1(10)=$62k
MITSOB/AA/OM/Ch5/#31/271113 24

25
Example of Decision Tree Problem (Continued): Step 4. p ( ) pMake decision
High demand (0.4) $90kMedium demand (0.5)
Low demand (0.1)
$50k$10k$62k
High demand (0.4)
Medium demand (0.5)
d d ( )
AB
$200k$25k
$120k
$80.5k
Low demand (0.1)C
High demand (0.4)
-$120k
$60kMedium demand (0.5)
Low demand (0.1)
$40k$20k
$46k
MITSOB/AA/OM/Ch5/#31/271113 25
Alternative B generates the greatest expected profit, so our choice is B or to construct a new facility

26
Planning Service Capacity vs. ManufacturingPlanning Service Capacity vs. Manufacturing Capacity
Time: Goods can not be stored for later use and capacity must be available to provide a service h it i d d when it is needed
Location: Service goods must be at the customer gdemand point and capacity must be located near the customer
Volatility of Demand: Much greater than in manufacturingg
MITSOB/AA/OM/Ch5/#31/271113 26
27
Capacity Utilization &Capacity Utilization & Service Quality
Best operating point is near 70% of p g p 7capacity
From 70% to 100% of service capacity, what do you think happens to service what do you think happens to service quality?
MITSOB/AA/OM/Ch5/#31/271113 27

2828
©The McGraw-Hill Companies, Inc., 2006McGraw-Hill/Irwin