Polytec InFocus 2014 (english)
48
Optical Measurement Solutions InFocus ISSUE 2014 Big on Small Things Polytec explores the barely visible Serving Healthcare Page 5 Extremely Versatile Page 10 Competence Center for Laser Doppler Vibrometry Page 33 Visible Music Page 36 Fascination of Hearing Page 40 Register for our Newsletter now: www.polytec.com/ newsletter
description
Magazine for Polytec’s optical measurement systems
Transcript of Polytec InFocus 2014 (english)

Optical Measurement Solutions
InFocusISSUE 2014
Big on Small ThingsPolytec explores the barely visible
Serving Healthcare Page 5
Extremely Versatile Page 10
Competence Center for Laser Doppler Vibrometry
Page 33
Visible Music Page 36
Fascination of Hearing Page 40
Register for our Newsletter now:
www.polytec.com/newsletter

2 |
Editorial
Dear Readers,
Just like a Watch – only smaller
The term MEMS is getting more popular, but not everyone knows what it means.
MEMS are mechanical structures as finely engineered as those found in a watch but
way smaller. MEMS dimensions are roughly four times tinier than a human hair.
Technical structures are getting so minute that understanding them with our own
senses is impossible. Without technological help they are invisible. The microphones
in our smartphones are only about 3 to 4 millimeters wide. And this is surely not the
end of this development.
In this edition you will learn how Polytec’s instruments help in different ways to
improve the performance and reliability of these microstructures.
Eric WinklerHead of Optical Measurement Systems
Polytec News Page 3
Serving Healthcare Page 5
How do Microstructures Vibrate? – MSA-100-3D Page 8
Extremely Versatile Page 10
Good Vibrations Page 16
Better Switching Page 20
Tailored Modeling of MEMS Page 23
Developing Biosensors Page 27
Big Time for Small Singers Page 30
To Improve Hearing Page 33
Interview Page 34
Visible Music Page 36
Fascination of Hearing Page 40
Unlimited Possibilities – HSV-100 Page 43
Surface Metrology in a New Dimension Page 44
Very High Frequency Scanning Vibrometer – PSV-500-V Page 46

| 3
News
Charity YogaEmployees exercise for a good cause
Our purchasing manager Thomas Schott offered a beginners course in traditional Ashtanga Vinyasa Yoga on the 4th of December. All 15 participants were sweating for a very good cause. The money collected was donated in full to support victims of the flooding in the Philippines. Polytec honored the social commitment by doubling the donations with matching funds.
Nils Schmid at PolytecMinister visits world market leader
The Minister of Finance and Economy of Baden-Wurttem-berg, Nils Schmid, visited Polytec on the 18th of November. Employees showed the Minister several measurement technolo-gies. A wrap-up tour of the facility ended with the highlight of the day – a visit to the RoboVib Test-Center which caused him to remark: ”Wow, this is really impressive!“
Polytec Promotes ResearchYoung scientist wins prize
Polytec first honored a young scientist with the ‘Polytec Young Researcher Award’ in 2013. This award is given to a young scientist for an outstanding presentation. Taina Conrad from the University of Ulm won with her presentation: “He’s giving me good vibrations – The role of vibrations in mason bees”. She earned the prize during a 2013 entomologist meeting in Goettingen.
You can find an interesting article about this topic on page 30.

4 |
News
Meet at Polytec13th User meeting in Waldbronn
The largest meeting for users of laser vibrometry will take place in Waldbronn from the 18th through the 19th of November, 2014.
The main goal of this event is an intensive exchange of ideas and experience in applications and new developments. Debate with experienced users and Polytec-Experts.
More information at: www.polytec.de/anwenderkonferenz
Be a Presenter!MEMS Testing and Metrology Workshop
This international event will take place during SEMICON in Grenoble, France on the 7th and 8th of October 2014. It deals with current requirements and trends of MEMS development as well as measurement technology and testing possibilities.Learn about the latest ways to characterize MEMS and discuss Wafer-Level-Test strategies and standardization issues.
Alternatively you can say a few words and share your own results with everyone.
More information at: www.memunity.org
Sign up now!

| 5
Healthcare
Advanced diagnostic systems are required in both developed and developing countries
to test patients outside the centralized facilities of hospital laboratories. In the devel-
oping world especially, diseases such as Malaria, sleeping sickness (Human African
Trypanosomiasis or HAT), and tuberculosis, still take a significant toll on the popula-
tion. Professor Jon Cooper’s group at the University of Glasgow has developed
a technology based on ultrasonics and the nanometer vibrations they generate at the
surface of microchips, to manipulate liquid samples and integrate diagnostic tests onto
disposable portable systems. Laser vibrometry critically enables us to characterize the
vibrations on the surfaces with a high spatial resolution and on large scales,
to validate our designs. ►
Serving HealthcareUsing acoustic vibrations to manipulate liquids
for handheld diagnostic devices
6 |
Healthcare
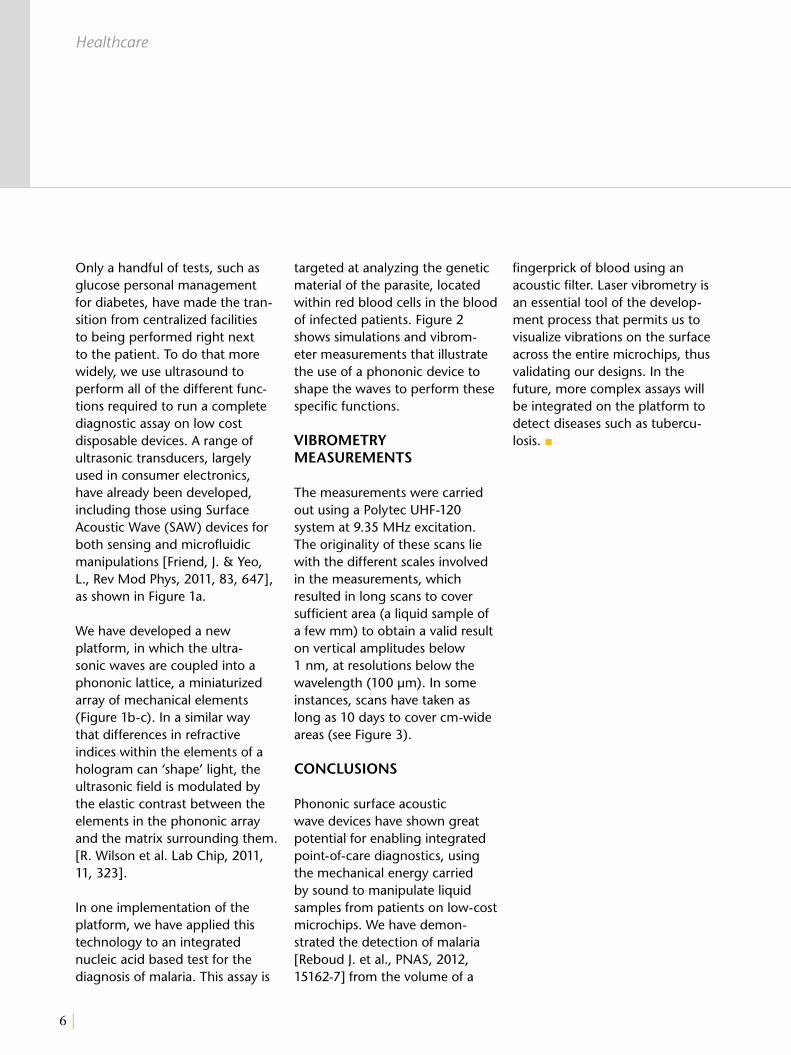
Only a handful of tests, such as glucose personal management for diabetes, have made the tran-sition from centralized facilities to being performed right next to the patient. To do that more widely, we use ultrasound to perform all of the different func-tions required to run a complete diagnostic assay on low cost disposable devices. A range of ultrasonic transducers, largely used in consumer electronics, have already been developed, including those using Surface Acoustic Wave (SAW) devices for both sensing and microfluidic manipulations [Friend, J. & Yeo, L., Rev Mod Phys, 2011, 83, 647], as shown in Figure 1a.
We have developed a new platform, in which the ultra-sonic waves are coupled into a phononic lattice, a miniaturized array of mechanical elements (Figure 1b-c). In a similar way that differences in refractive indices within the elements of a hologram can ‘shape’ light, the ultrasonic field is modulated by the elastic contrast between the elements in the phononic array and the matrix surrounding them. [R. Wilson et al. Lab Chip, 2011, 11, 323].
In one implementation of the platform, we have applied this technology to an integrated nucleic acid based test for the diagnosis of malaria. This assay is
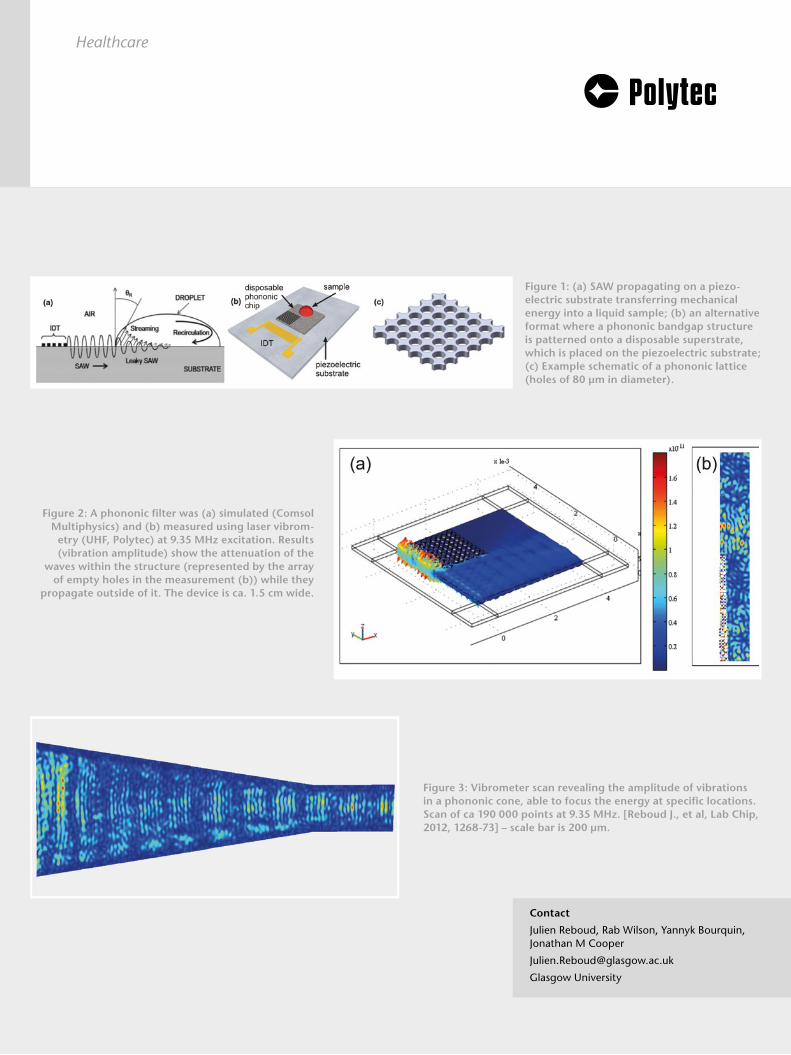
targeted at analyzing the genetic material of the parasite, located within red blood cells in the blood of infected patients. Figure 2 shows simulations and vibrom-eter measurements that illustrate the use of a phononic device to shape the waves to perform these specific functions.
VIBROMETRY MEASUREMENTS
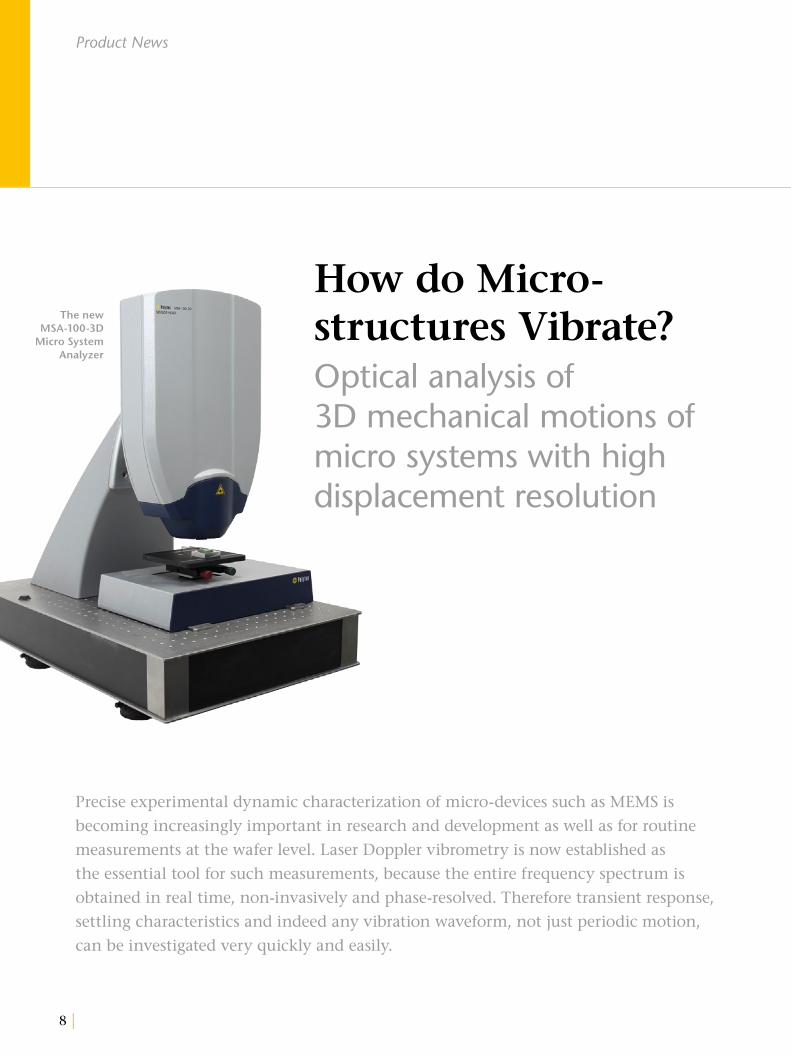
The measurements were carried out using a Polytec UHF-120 system at 9.35 MHz excitation. The originality of these scans lie with the different scales involved in the measurements, which resulted in long scans to cover sufficient area (a liquid sample of a few mm) to obtain a valid result on vertical amplitudes below 1 nm, at resolutions below the wavelength (100 µm). In some instances, scans have taken as long as 10 days to cover cm-wide areas (see Figure 3).
CONCLUSIONS
Phononic surface acoustic wave devices have shown great potential for enabling integrated point-of-care diagnostics, using the mechanical energy carried by sound to manipulate liquid samples from patients on low-cost microchips. We have demon-strated the detection of malaria [Reboud J. et al., PNAS, 2012, 15162-7] from the volume of a
fingerprick of blood using an acoustic filter. Laser vibrometry is an essential tool of the develop-ment process that permits us to visualize vibrations on the surface across the entire microchips, thus validating our designs. In the future, more complex assays will be integrated on the platform to detect diseases such as tubercu-losis. ■
| 7
Figure 1: (a) SAW propagating on a piezo-electric substrate transferring mechanical energy into a liquid sample; (b) an alternative format where a phononic bandgap structure is patterned onto a disposable superstrate, which is placed on the piezoelectric substrate; (c) Example schematic of a phononic lattice (holes of 80 µm in diameter).
Figure 3: Vibrometer scan revealing the amplitude of vibrations in a phononic cone, able to focus the energy at specific locations. Scan of ca 190 000 points at 9.35 MHz. [Reboud J., et al, Lab Chip, 2012, 1268-73] – scale bar is 200 µm.
Figure 2: A phononic filter was (a) simulated (Comsol Multiphysics) and (b) measured using laser vibrom-
etry (UHF, Polytec) at 9.35 MHz excitation. Results (vibration amplitude) show the attenuation of the
waves within the structure (represented by the array of empty holes in the measurement (b)) while they
propagate outside of it. The device is ca. 1.5 cm wide.
Healthcare
Contact
Julien Reboud, Rab Wilson, Yannyk Bourquin, Jonathan M Cooper
Glasgow University
8 |
Product News
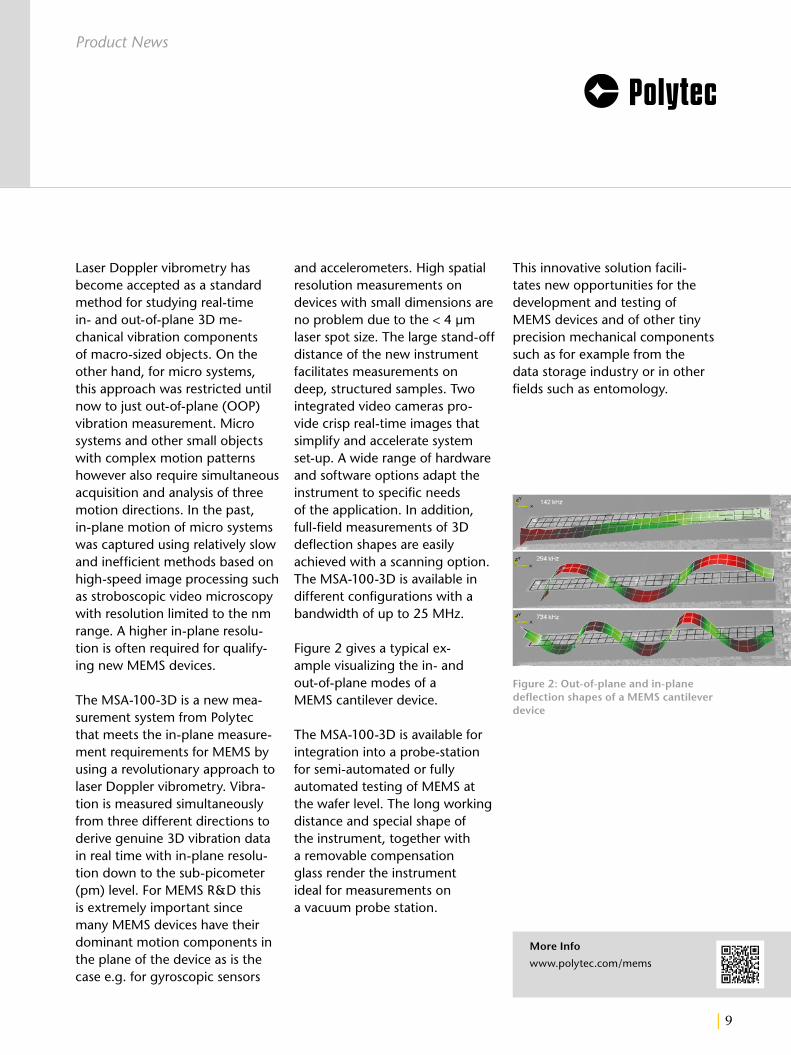
How do Micro- structures Vibrate?Optical analysis of 3D mechanical motions of micro systems with high displacement resolution
The new MSA-100-3D
Micro System Analyzer
Precise experimental dynamic characterization of micro-devices such as MEMS is
becoming increasingly important in research and development as well as for routine
measurements at the wafer level. Laser Doppler vibrometry is now established as
the essential tool for such measurements, because the entire frequency spectrum is
obtained in real time, non-invasively and phase-resolved. Therefore transient response,
settling characteristics and indeed any vibration waveform, not just periodic motion,
can be investigated very quickly and easily.
| 9
Product News
Laser Doppler vibrometry has become accepted as a standard method for studying real-time in- and out-of-plane 3D me-chanical vibration components of macro-sized objects. On the other hand, for micro systems, this approach was restricted until now to just out-of-plane (OOP) vibration measurement. Micro systems and other small objects with complex motion patterns however also require simultaneous acquisition and analysis of three motion directions. In the past, in-plane motion of micro systems was captured using relatively slow and inefficient methods based on high-speed image processing such as stroboscopic video microscopy with resolution limited to the nm range. A higher in-plane resolu-tion is often required for qualify-ing new MEMS devices.
The MSA-100-3D is a new mea-surement system from Polytec that meets the in-plane measure-ment requirements for MEMS by using a revolutionary approach to laser Doppler vibrometry. Vibra-tion is measured simultaneously from three different directions to derive genuine 3D vibration data in real time with in-plane resolu-tion down to the sub-picometer (pm) level. For MEMS R&D this is extremely important since many MEMS devices have their dominant motion components in the plane of the device as is the case e.g. for gyroscopic sensors
and accelerometers. High spatial resolution measurements on devices with small dimensions are no problem due to the < 4 µm laser spot size. The large stand-off distance of the new instrument facilitates measurements on deep, structured samples. Two integrated video cameras pro-vide crisp real-time images that simplify and accelerate system set-up. A wide range of hardware and software options adapt the instrument to specific needs of the application. In addition, full-field measurements of 3D deflection shapes are easily achieved with a scanning option. The MSA-100-3D is available in different configurations with a bandwidth of up to 25 MHz.
Figure 2 gives a typical ex-ample visualizing the in- and out-of-plane modes of a MEMS cantilever device.
The MSA-100-3D is available for integration into a probe-station for semi-automated or fully automated testing of MEMS at the wafer level. The long working distance and special shape of the instrument, together with a removable compensation glass render the instrument ideal for measurements on a vacuum probe station.
More Info
www.polytec.com/mems
Figure 2: Out-of-plane and in-plane deflection shapes of a MEMS cantilever device
This innovative solution facili-tates new opportunities for the development and testing of MEMS devices and of other tiny precision mechanical components such as for example from the data storage industry or in other fields such as entomology.

10 |
Microstructures
Extremely VersatileThe micro system analyzer
in the MEMS laboratory at Tohoku University Japan
In this laboratory, and
probably many others
throughout the world,
Polytec Micro System
Analyzers are the most
standard MEMS evaluation
tools for their mechan-
ical characterization.
This article introduces
three examples of MEMS
studies using Polytec
tools in my laboratory.
HIGH FREQUENCY DISK-TYPE MEMS RESONATORS
Mechanical resonance is one of the most fundamental dynamics exhibited by MEMS. It is used for gyroscopes, mass sensors, optical scanners, clock oscillators etc. One natural research direction for MEMS resonators is to pursue higher resonance frequencies and find new applications. Electrostat-ic and piezoelectric transductions are two major driving principles, and electrostatic MEMS resona-tors were more intensively studied from an early stage. However, electrostatic transduction suffers from the critical problem that electromechanical coupling is
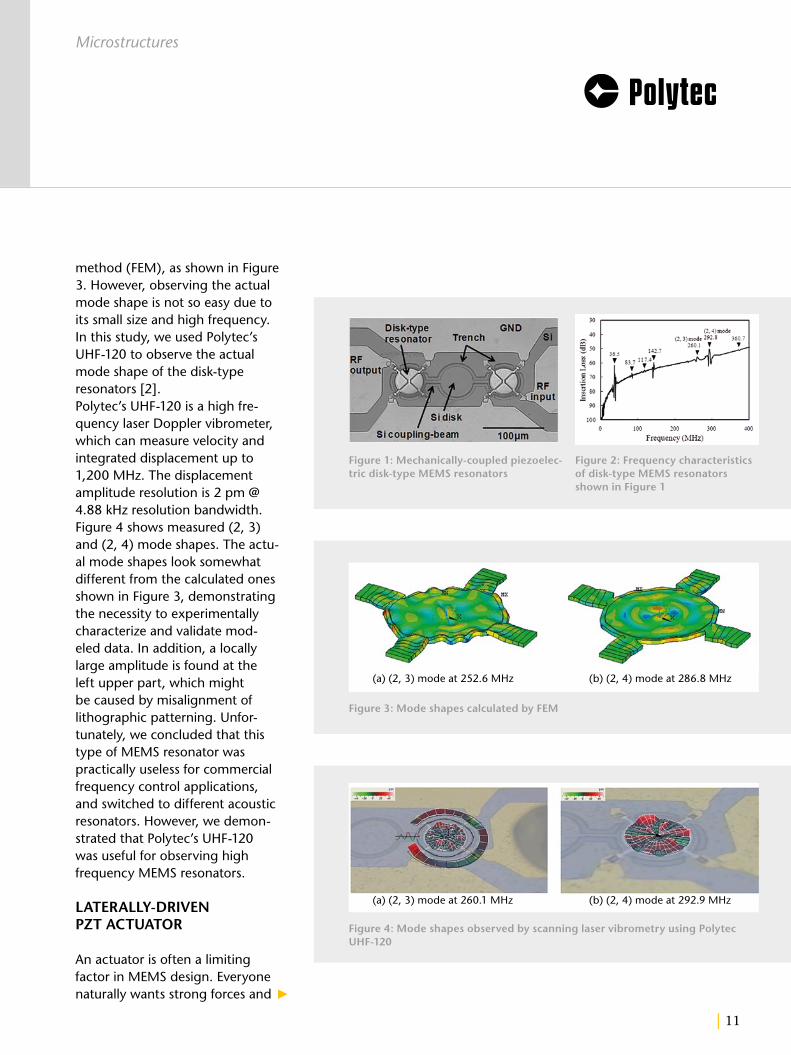
too weak for many applications. Therefore, we decided to adopt piezoelectric transduction for disk-type resonators, which were based on electrostatic transduc-tion in many previous studies. Figure 1 shows piezoelectric disk-type resonators, which are mechanically connected via a center silicon disk [1]. Sput-ter-deposited aluminum nitride (AlN) was used as a piezoelectric thin film. Figure 2 shows the frequency characteristics up to 400 MHz. Each peak corresponds to a specific resonance mode, and the (2, 4) mode at 292.8 MHz is the main mode which we needed. The mode shapes can be calculated using the finite element
| 11
Microstructures
Extremely VersatileThe micro system analyzer
in the MEMS laboratory at Tohoku University Japan
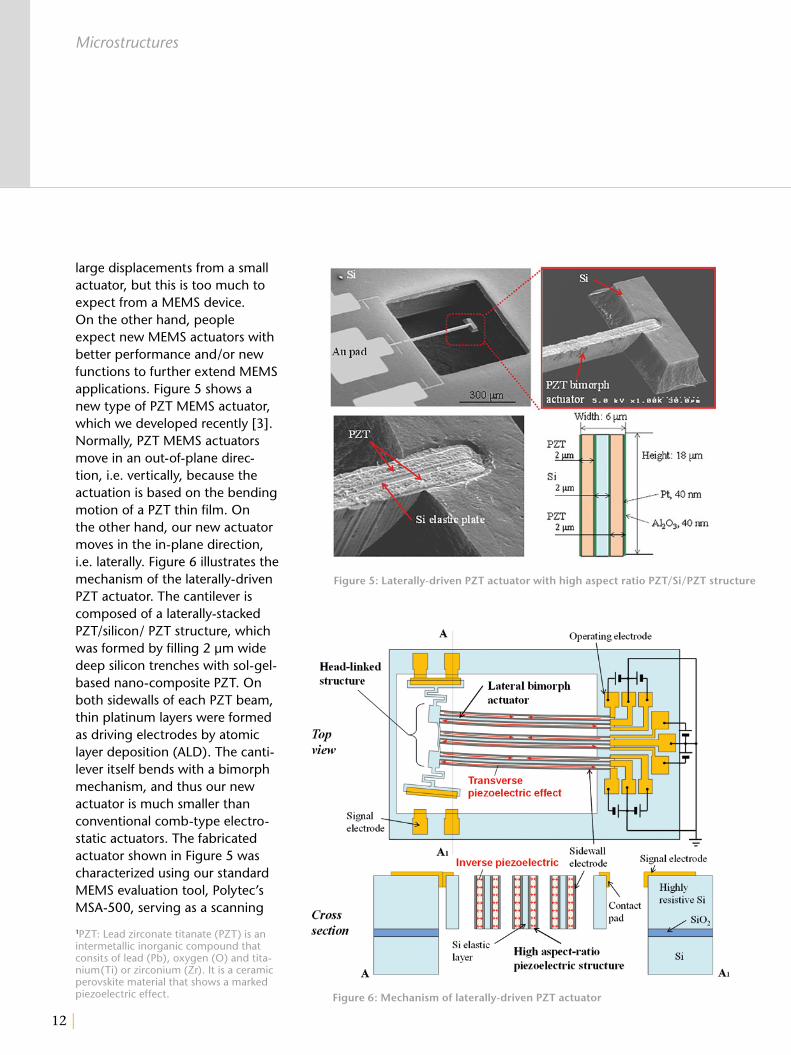
method (FEM), as shown in Figure 3. However, observing the actual mode shape is not so easy due to its small size and high frequency. In this study, we used Polytec’s UHF-120 to observe the actual mode shape of the disk-type resonators [2]. Polytec’s UHF-120 is a high fre-quency laser Doppler vibro meter, which can measure velocity and integrated displacement up to 1,200 MHz. The displacement amplitude resolution is 2 pm @ 4.88 kHz resolution bandwidth. Figure 4 shows measured (2, 3) and (2, 4) mode shapes. The actu-al mode shapes look somewhat different from the calculated ones shown in Figure 3, demonstrating the necessity to experimentally characterize and validate mod-eled data. In addition, a locally large amplitude is found at the left upper part, which might be caused by misalignment of lithographic patterning. Unfor-tunately, we concluded that this type of MEMS resonator was practically useless for commercial frequency control applications, and switched to different acoustic resonators. However, we demon-strated that Polytec’s UHF-120 was useful for observing high frequency MEMS resonators.
LATERALLY-DRIVEN PZT ACTUATOR
An actuator is often a limiting factor in MEMS design. Everyone naturally wants strong forces and
Figure 1: Mechanically-coupled piezoelec-tric disk-type MEMS resonators
Figure 2: Frequency characteristics of disk-type MEMS resonators shown in Figure 1
Figure 3: Mode shapes calculated by FEM
Figure 4: Mode shapes observed by scanning laser vibrometry using Polytec UHF-120
►
(a) (2, 3) mode at 252.6 MHz (b) (2, 4) mode at 286.8 MHz
(a) (2, 3) mode at 260.1 MHz (b) (2, 4) mode at 292.9 MHz
12 |
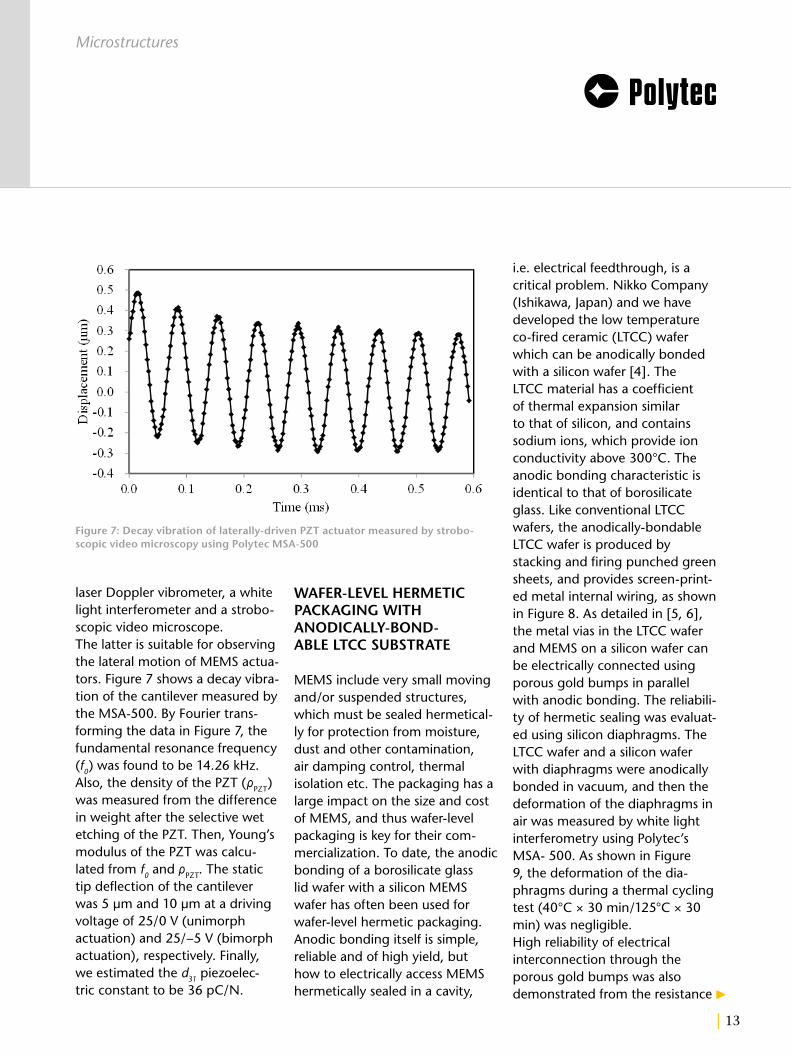
large displacements from a small actuator, but this is too much to expect from a MEMS device. On the other hand, people expect new MEMS actuators with better performance and/or new functions to further extend MEMS applications. Figure 5 shows a new type of PZT MEMS actuator, which we developed recently [3]. Normally, PZT MEMS actuators move in an out-of-plane direc-tion, i.e. vertically, because the actuation is based on the bending motion of a PZT thin film. On the other hand, our new actuator moves in the in-plane direction, i.e. laterally. Figure 6 illustrates the mechanism of the laterally-driven PZT actuator. The cantilever is composed of a laterally-stacked PZT/silicon/ PZT structure, which was formed by filling 2 µm wide deep silicon trenches with sol-gel-based nano-composite PZT. On both sidewalls of each PZT beam, thin platinum layers were formed as driving electrodes by atomic layer deposition (ALD). The canti-lever itself bends with a bimorph mechanism, and thus our new actuator is much smaller than conventional comb-type electro-static actuators. The fabricated actuator shown in Figure 5 was characterized using our standard MEMS evaluation tool, Polytec’s MSA-500, serving as a scanning
Figure 6: Mechanism of laterally-driven PZT actuator
Figure 5: Laterally-driven PZT actuator with high aspect ratio PZT/Si/PZT structure
Microstructures
1PZT: Lead zirconate titanate (PZT) is an intermetallic inorganic compound that consits of lead (Pb), oxygen (O) and tita-nium(Ti) or zirconium (Zr). It is a ceramic perovskite material that shows a marked piezoelectric effect.
| 13
laser Doppler vibrometer, a white light interferometer and a strobo-scopic video microscope. The latter is suitable for observing the lateral motion of MEMS actua-tors. Figure 7 shows a decay vibra-tion of the cantilever measured by the MSA-500. By Fourier trans-forming the data in Figure 7, the fundamental resonance frequency (f0) was found to be 14.26 kHz. Also, the density of the PZT (ρPZT) was measured from the difference in weight after the selective wet etching of the PZT. Then, Young’s modulus of the PZT was calcu-lated from f0 and ρPZT. The static tip deflection of the cantilever was 5 µm and 10 µm at a driving voltage of 25/0 V (unimorph actuation) and 25/−5 V (bimorph actuation), respectively. Finally, we estimated the d31 piezoelec-tric constant to be 36 pC/N.
WAFER-LEVEL HERMETIC PACKAGING WITH ANODICALLY-BOND-ABLE LTCC SUBSTRATE
MEMS include very small moving and/or suspended structures, which must be sealed hermetical-ly for protection from moisture, dust and other contamination, air damping control, thermal isolation etc. The packaging has a large impact on the size and cost of MEMS, and thus wafer-level packaging is key for their com-mercialization. To date, the anodic bonding of a borosilicate glass lid wafer with a silicon MEMS wafer has often been used for wafer-level hermetic packaging. Anodic bonding itself is simple, reliable and of high yield, but how to electrically access MEMS hermetically sealed in a cavity,
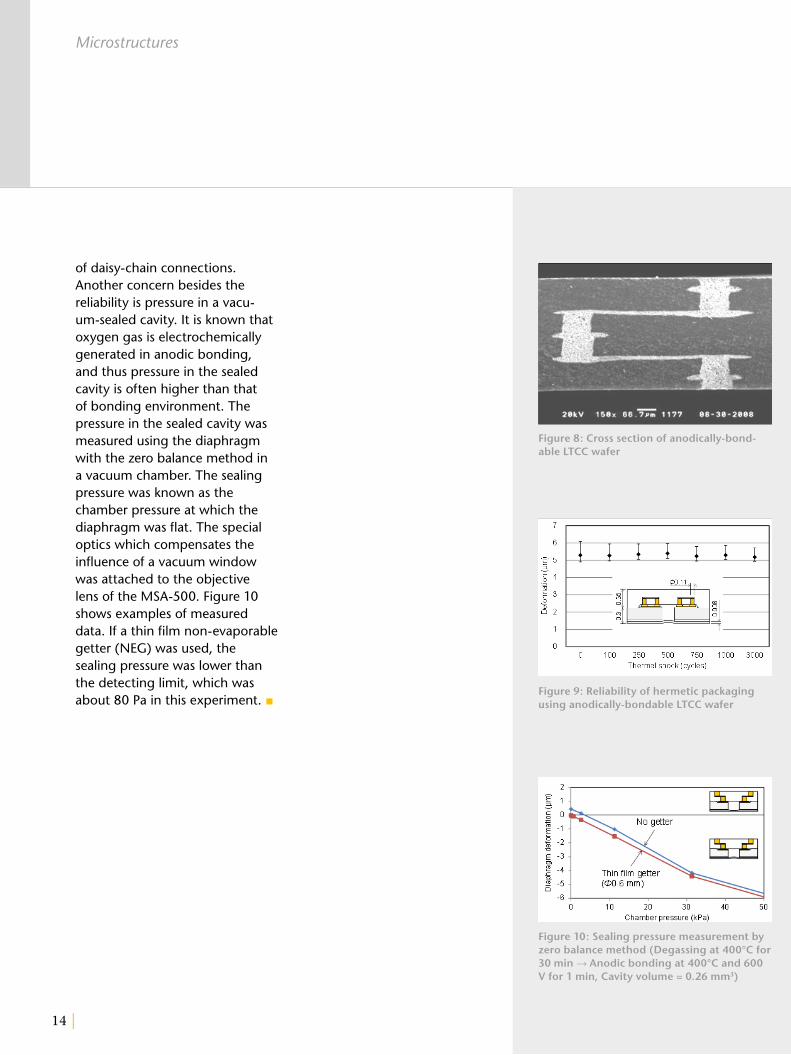
i.e. electrical feedthrough, is a critical problem. Nikko Company (Ishikawa, Japan) and we have developed the low temperature co-fired ceramic (LTCC) wafer which can be anodically bonded with a silicon wafer [4]. The LTCC material has a coefficient of thermal expansion similar to that of silicon, and contains sodium ions, which provide ion conductivity above 300°C. The anodic bonding characteristic is identical to that of borosilicate glass. Like conventional LTCC wafers, the anodically-bondable LTCC wafer is produced by stacking and firing punched greensheets, and provides screen-print-ed metal internal wiring, as shown in Figure 8. As detailed in [5, 6], the metal vias in the LTCC wafer and MEMS on a silicon wafer can be electrically connected using porous gold bumps in parallel with anodic bonding. The reliabili-ty of hermetic sealing was evaluat-ed using silicon diaphragms. The LTCC wafer and a silicon wafer with diaphragms were anodically bonded in vacuum, and then the deformation of the diaphragms in air was measured by white light interferometry using Polytec’s MSA- 500. As shown in Figure 9, the deformation of the dia-phragms during a thermal cycling test (40°C × 30 min/125°C × 30 min) was negligible. High reliability of electrical interconnection through the porous gold bumps was also demonstrated from the resistance
Figure 7: Decay vibration of laterally-driven PZT actuator measured by strobo-scopic video microscopy using Polytec MSA-500
►
Microstructures
14 |
Microstructures
of daisy-chain connections. Another concern besides the reliability is pressure in a vacu-um-sealed cavity. It is known that oxygen gas is electrochemically generated in anodic bonding, and thus pressure in the sealed cavity is often higher than that of bonding environment. The pressure in the sealed cavity was measured using the diaphragm with the zero balance method in a vacuum chamber. The sealing pressure was known as the chamber pressure at which the diaphragm was flat. The special optics which compensates the influence of a vacuum window was attached to the objective lens of the MSA-500. Figure 10 shows examples of measured data. If a thin film non-evaporablegetter (NEG) was used, the sealing pressure was lower than the detecting limit, which was about 80 Pa in this experiment. ■
Figure 8: Cross section of anodically-bond-able LTCC wafer
Figure 9: Reliability of hermetic packaging using anodically-bondable LTCC wafer
Figure 10: Sealing pressure measurement by zero balance method (Degassing at 400°C for 30 min → Anodic bonding at 400°C and 600 V for 1 min, Cavity volume = 0.26 mm3)
| 15
Microstructures
REFERENCES
[1] Takeshi Matsumura et al., Multi-band radio-frequency filters fabricated by using polyimide-based membrane transfer bonding technology, Journal of Microme-chanics and Microengineering, 20 (2010) 095027
[2] Takeshi Matsumura et al., Vibration Mode Observation of Piezoelectric Disk-Type Resonator by High-Fre-quency Laser Doppler Vibrometer, Electronics and Communications in Japan, 95 (2012) pp. 33–41
[3] Shinya Yoshida et al., Fabrication and character-ization of laterally-driven piezoelectric bimorph MEMS actuator with sol–gel-based high-aspect-ratio PZT structure, Journal of Micromechanics and Microengineering, 23 (2013) 065014
[4] Shuji Tanaka et al., Wafer-Level Hermetic Packaging Technology for MEMS using Anodically-Bondable LTCC Wafer, 24th IEEE International Conference on Micro Electro Mechanical Systems, Cancun, Mexico, January 23–27, 2011 pp. 376–379
[5] Shuji Tanaka et al., Versatile Wafer-Level Hermetic Packaging Technology using Anodically-Bond-able LTCC Wafer with Compliant Porous Gold Bumps Spontaneously Formed in Wet-Etched Cavities, 25th IEEE International Conference on Micro Electro Mechanical Systems, Paris, France, January 29–February 2, 2012, pp. 369–372
[6] Shuji Tanaka et al., Electrical Interconnection in Anodic Bonding of Silicon Wafer to LTCC Wafer Using Highly Compliant Porous Bumps Made from Submicron Gold Particles, Sensors and Actuators A, 188 (2012) pp. 198–202
Acknowledgements
I would like to especially thank Dr. Takeshi Matsu-mura, Mr. Nan Wang and Mr. Mamoru Mohri for Examples 1, 2 and 3, respectively. Examples 1 and 2 were supported by the “Funding Program for World-Leading Innovative R&D on Science and Technology”, and Example 3 was partially supported by the “Creation of Innovation Centers for Advanced Interdisciplinary Research Areas Program”.
Finally, I would like to thank my friends at Polytec for giving me the chance to write this article.
Contact
Professor Shuji Tanaka
Department of Bioengineering and Robotics,Graduate School of EngineeringTohoku University
16 |
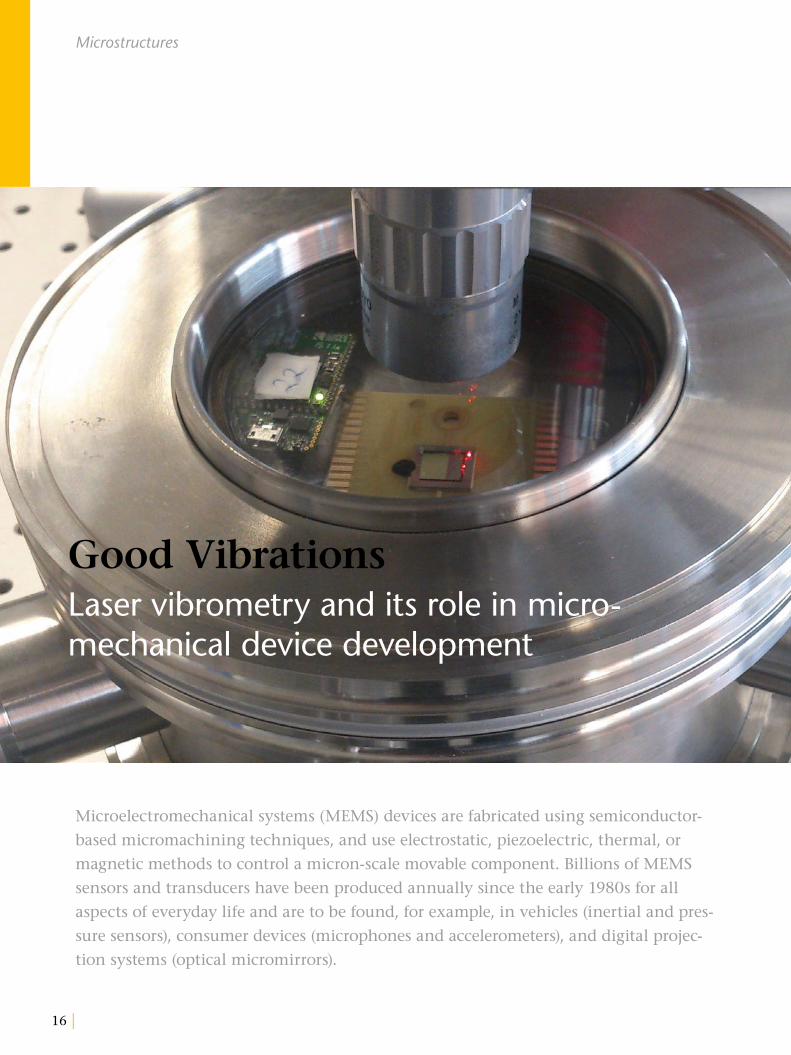
Good VibrationsLaser vibrometry and its role in micro-mechanical device development
Microelectromechanical systems (MEMS) devices are fabricated using semiconductor-
based micromachining techniques, and use electrostatic, piezoelectric, thermal, or
magnetic methods to control a micron-scale movable component. Billions of MEMS
sensors and transducers have been produced annually since the early 1980s for all
aspects of everyday life and are to be found, for example, in vehicles (inertial and pres-
sure sensors), consumer devices (microphones and accelerometers), and digital projec-
tion systems (optical micromirrors).
Microstructures
| 17
Established with a mission to support industry and academia in driving research to market, the Tyndall National Institute is one of Europe’s leading research centers in Information and Communica-tions Technology (ICT) research and development, and the largest facility of its type in Ireland. Tyndall has a large R&D activity focussed on the development of MEMS devices, primarily for industries spanning electronics, medical devices, energy and communication. As part of this activity, non-destructive optical characterization techniques are routinely used for high-resolution, static and dynamic characteriza-tion of such structures.
The article introduces the Polytec laser vibrometry facility at Tyndall, and illustrates its use in two appli-cations, namely radio frequency (RF) MEMS for telecommunica-tions, and piezoelectric MEMS cantilevers for energy harvesting.
HARDWARE
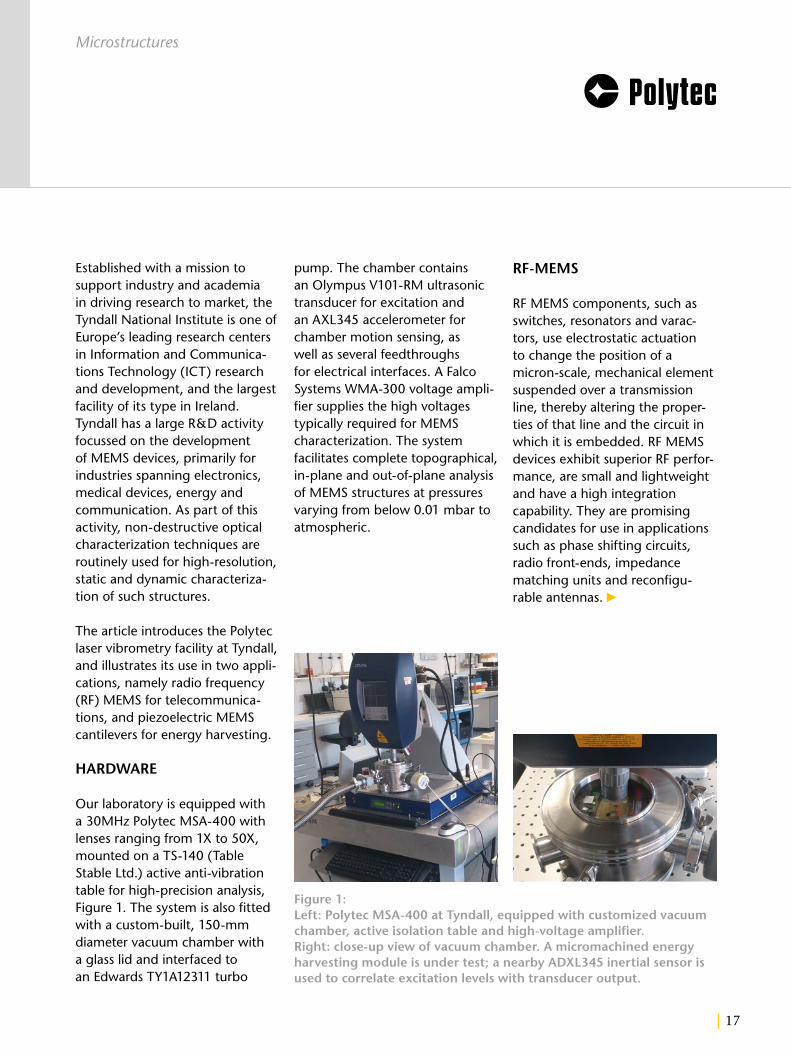
Our laboratory is equipped with a 30MHz Polytec MSA-400 with lenses ranging from 1X to 50X, mounted on a TS-140 (Table Stable Ltd.) active anti-vibration table for high-precision analysis, Figure 1. The system is also fitted with a custom-built, 150-mm diameter vacuum chamber with a glass lid and interfaced to an Edwards TY1A12311 turbo
pump. The chamber contains an Olympus V101-RM ultrasonic transducer for excitation and an AXL345 accelerometer for chamber motion sensing, as well as several feedthroughs for electrical interfaces. A Falco Systems WMA-300 voltage ampli-fier supplies the high voltages typically required for MEMS characterization. The system facilitates complete topographical, in-plane and out-of-plane analysis of MEMS structures at pressures varying from below 0.01 mbar to atmospheric.
RF-MEMS
RF MEMS components, such as switches, resonators and varac-tors, use electrostatic actuation to change the position of a micron-scale, mechanical element suspended over a transmission line, thereby altering the proper-ties of that line and the circuit in which it is embedded. RF MEMS devices exhibit superior RF perfor-mance, are small and lightweight and have a high integration capability. They are promising candidates for use in applications such as phase shifting circuits, radio front-ends, impedance matching units and reconfigu-rable antennas. ►
Microstructures
Figure 1:Left: Polytec MSA-400 at Tyndall, equipped with customized vacuum chamber, active isolation table and high-voltage amplifier.Right: close-up view of vacuum chamber. A micromachined energy harvesting module is under test; a nearby ADXL345 inertial sensor is used to correlate excitation levels with transducer output.
18 |
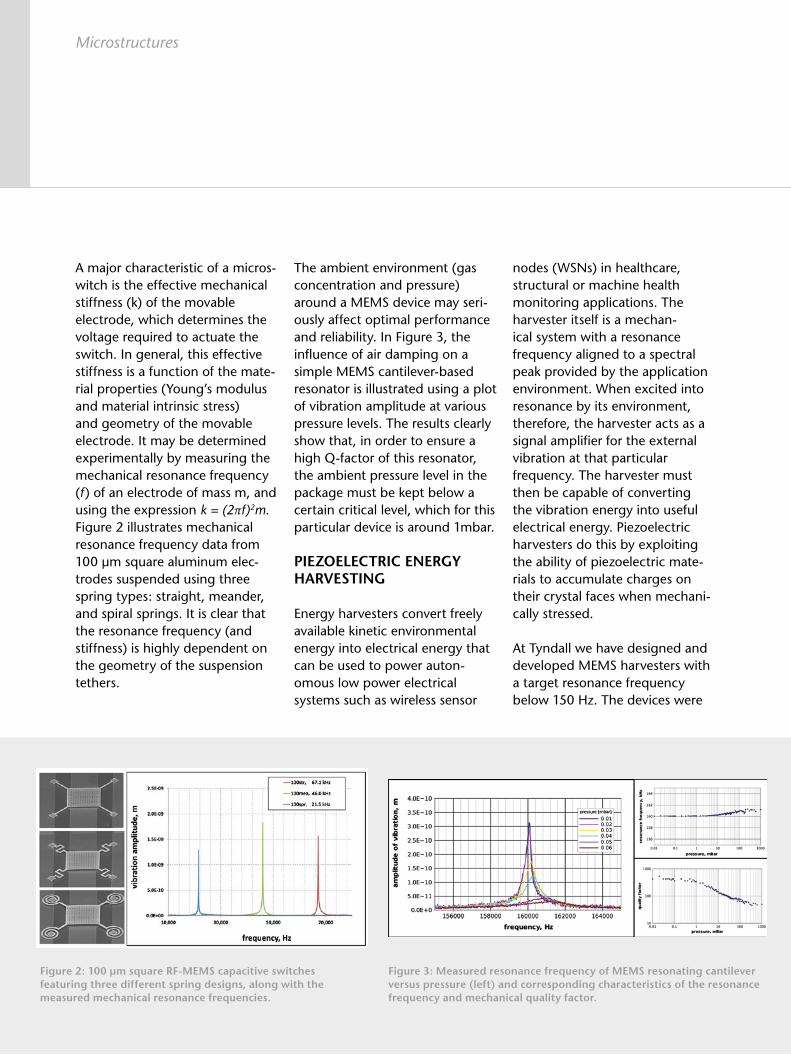
A major characteristic of a micros-witch is the effective mechanical stiffness (k) of the movable electrode, which determines the voltage required to actuate the switch. In general, this effective stiffness is a function of the mate-rial properties (Young’s modulus and material intrinsic stress) and geometry of the movable electrode. It may be determined experimentally by measuring the mechanical resonance frequency (f) of an electrode of mass m, and using the expression k = (2πf)2m. Figure 2 illustrates mechanical resonance frequency data from 100 µm square aluminum elec-trodes suspended using three spring types: straight, meander, and spiral springs. It is clear that the resonance frequency (and stiffness) is highly dependent on the geometry of the suspension tethers.
The ambient environment (gas concentration and pressure) around a MEMS device may seri-ously affect optimal performance and reliability. In Figure 3, the influence of air damping on a simple MEMS cantilever-based resonator is illustrated using a plot of vibration amplitude at various pressure levels. The results clearly show that, in order to ensure a high Q-factor of this resonator, the ambient pressure level in the package must be kept below a certain critical level, which for this particular device is around 1mbar.
PIEZOELECTRIC ENERGY HARVESTING
Energy harvesters convert freely available kinetic environmental energy into electrical energy that can be used to power auton-omous low power electrical systems such as wireless sensor
Microstructures
Figure 2: 100 µm square RF-MEMS capacitive switches featuring three different spring designs, along with the measured mechanical resonance frequencies.
Figure 3: Measured resonance frequency of MEMS resonating cantilever versus pressure (left) and corresponding characteristics of the resonance frequency and mechanical quality factor.
nodes (WSNs) in healthcare, structural or machine health monitoring applications. The harvester itself is a mechan-ical system with a resonance frequency aligned to a spectral peak provided by the application environment. When excited into resonance by its environment, therefore, the harvester acts as a signal amplifier for the external vibration at that particular frequency. The harvester must then be capable of converting the vibration energy into useful electrical energy. Piezoelectric harvesters do this by exploiting the ability of piezoelectric mate-rials to accumulate charges on their crystal faces when mechani-cally stressed.
At Tyndall we have designed and developed MEMS harvesters with a target resonance frequency below 150 Hz. The devices were
| 19
Microstructures
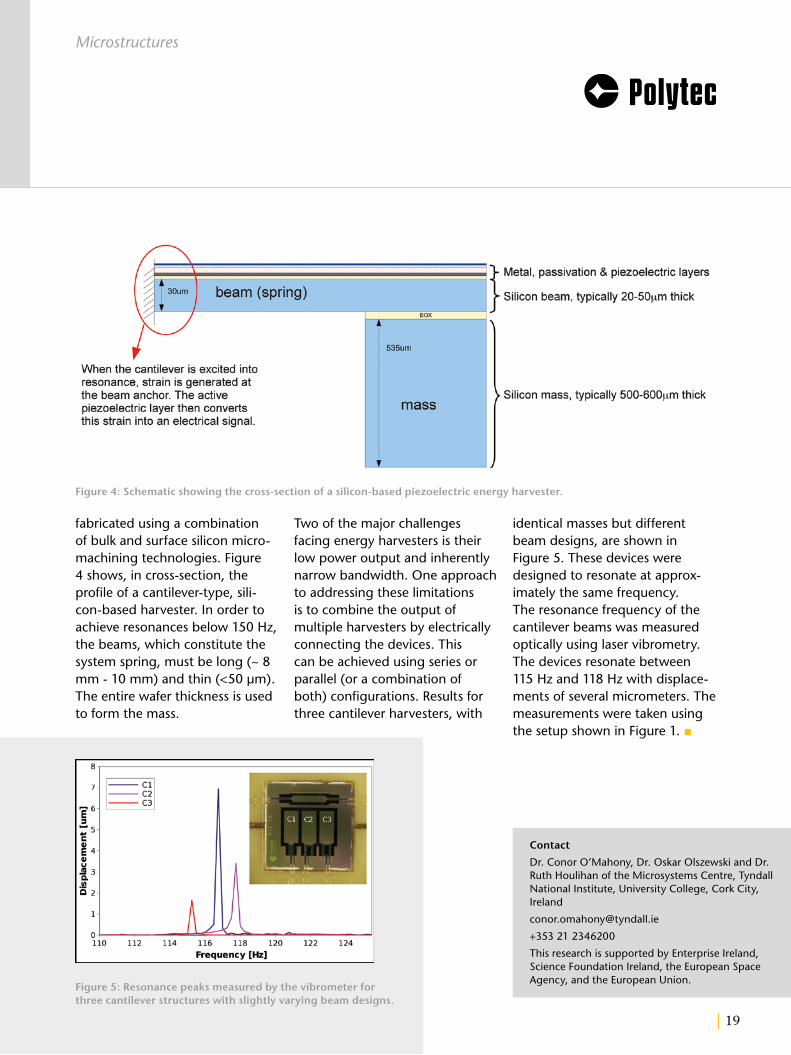
Figure 4: Schematic showing the cross-section of a silicon-based piezoelectric energy harvester.
Figure 5: Resonance peaks measured by the vibrometer for three cantilever structures with slightly varying beam designs.
Contact
Dr. Conor O’Mahony, Dr. Oskar Olszewski and Dr. Ruth Houlihan of the Microsystems Centre, Tyndall National Institute, University College, Cork City, Ireland
+353 21 2346200
This research is supported by Enterprise Ireland, Science Foundation Ireland, the European Space Agency, and the European Union.
fabricated using a combination of bulk and surface silicon micro-machining technologies. Figure 4 shows, in cross-section, the profile of a cantilever-type, sili-con-based harvester. In order to achieve resonances below 150 Hz, the beams, which constitute the system spring, must be long (~ 8 mm - 10 mm) and thin (<50 µm). The entire wafer thickness is used to form the mass.
Two of the major challenges facing energy harvesters is their low power output and inherently narrow bandwidth. One approach to addressing these limitations is to combine the output of multiple harvesters by electrically connecting the devices. This can be achieved using series or parallel (or a combination of both) configurations. Results for three cantilever harvesters, with
identical masses but different beam designs, are shown in Figure 5. These devices were designed to resonate at approx-imately the same frequency. The resonance frequency of the cantilever beams was measured optically using laser vibrometry. The devices resonate between 115 Hz and 118 Hz with displace-ments of several micrometers. The measurements were taken using the setup shown in Figure 1. ■

20 |
Microstructures
Better SwitchingCharacterization and optimization of
BiCMOS-integrated RF-MEMS switches
The monolithic integration of RF-MEMS into a SiGe-BiCMOS technology enables the
development of cost-effective and highly-integrated circuits for future radar and imag-
ing systems. Laser Doppler vibrometry (LDV) and coherence scanning interferometry
(WLI) have enabled the development of RF-MEMS switches with excellent perfor-
mance and reliability.
| 21
Microstructures
BICMOS RF-MEMS SWITCH INTEGRATION
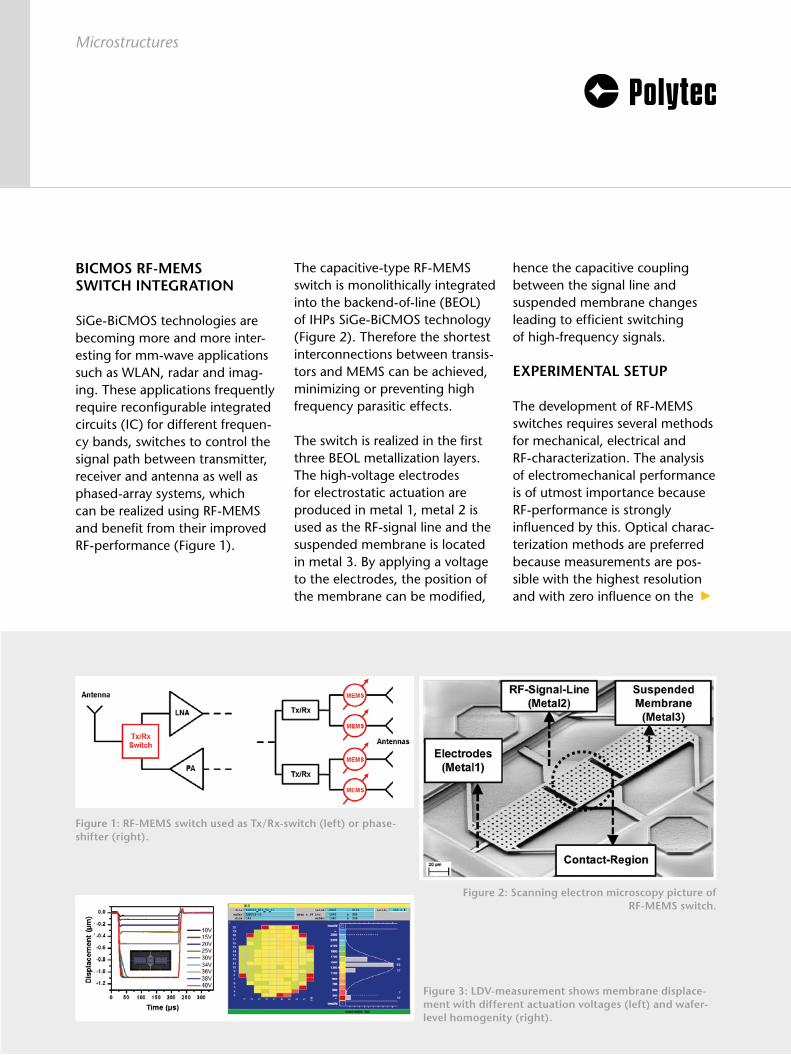
SiGe-BiCMOS technologies are becoming more and more inter-esting for mm-wave applications such as WLAN, radar and imag-ing. These applications frequently require reconfigurable integrated circuits (IC) for different frequen-cy bands, switches to control the signal path between transmitter, receiver and antenna as well as phased-array systems, which can be realized using RF-MEMS and benefit from their improved RF-performance (Figure 1).
The capacitive-type RF-MEMS switch is monolithically integrated into the backend-of-line (BEOL) of IHPs SiGe-BiCMOS technology (Figure 2). Therefore the shortest interconnections between transis-tors and MEMS can be achieved, minimizing or preventing high frequency parasitic effects.
The switch is realized in the first three BEOL metallization layers. The high-voltage electrodes for electrostatic actuation are produced in metal 1, metal 2 is used as the RF-signal line and the suspended membrane is located in metal 3. By applying a voltage to the electrodes, the position of the membrane can be modified,
hence the capacitive coupling between the signal line and suspended membrane changes leading to efficient switching of high-frequency signals.
EXPERIMENTAL SETUP
The development of RF-MEMS switches requires several methods for mechanical, electrical and RF-characterization. The analysis of electromechanical performance is of utmost importance because RF-performance is strongly influenced by this. Optical charac-terization methods are preferred because measurements are pos-sible with the highest resolution and with zero influence on the
Figure 1: RF-MEMS switch used as Tx/Rx-switch (left) or phase-shifter (right).
Figure 2: Scanning electron microscopy picture of RF-MEMS switch.
Figure 3: LDV-measurement shows membrane displace-ment with different actuation voltages (left) and wafer-level homogenity (right).
►
22 |
Microstructures
behavior of the device. The MSA-500’s LDV is used for automated 200mm wafer-level electromechanical motion char-acterization of the RF-MEMS switches, and WLI for analyzing the static deformation. LDV is an outstanding measurement method for process-control due to its ability to detect “out-of-plane” motions with nm-range displacement resolution and µm spatial resolution.
RESULTS
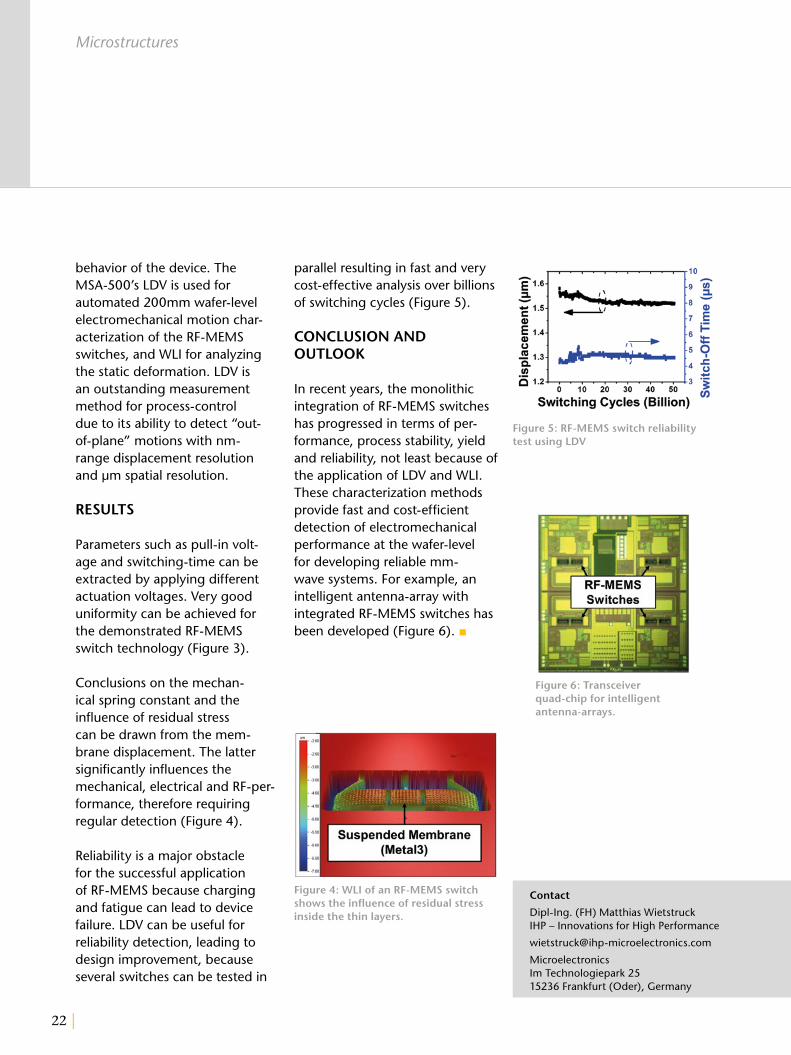
Parameters such as pull-in volt-age and switching-time can be extracted by applying different actuation voltages. Very good uniformity can be achieved for the demonstrated RF-MEMS switch technology (Figure 3).
Conclusions on the mechan-ical spring constant and the influence of residual stress can be drawn from the mem-brane displacement. The latter significantly influences the mechanical, electrical and RF-per-formance, therefore requiring regular detection (Figure 4).
Reliability is a major obstacle for the successful application of RF-MEMS because charging and fatigue can lead to device failure. LDV can be useful for reliability detection, leading to design improvement, because several switches can be tested in
parallel resulting in fast and very cost-effective analysis over billions of switching cycles (Figure 5).
CONCLUSION AND OUTLOOK
In recent years, the monolithic integration of RF-MEMS switches has progressed in terms of per-formance, process stability, yield and reliability, not least because of the application of LDV and WLI. These characterization methods provide fast and cost-efficient detection of electromechanical performance at the wafer-level for developing reliable mm-wave systems. For example, an intelligent antenna-array with integrated RF-MEMS switches has been developed (Figure 6). ■
Figure 4: WLI of an RF-MEMS switch shows the influence of residual stress inside the thin layers.
Figure 5: RF-MEMS switch reliability test using LDV
Figure 6: Transceiver quad-chip for intelligent antenna-arrays.
Contact
Dipl-Ing. (FH) Matthias WietstruckIHP – Innovations for High Performance
MicroelectronicsIm Technologiepark 2515236 Frankfurt (Oder), Germany

| 23
Microstructures
Tailored Modeling of MEMS Systematic parameter extraction and model
validation using laser Doppler vibrometry
MEMS transducers are employed in many everyday objects from tire pressure sensors
to mobile phones. For optimal performance and cost savings, their complexity requires
a combination of dedicated modeling and simulation procedures (virtual prototyp-
ing), together with experimental characterization, parameter extraction and model
validation. ►
24 |
Microstructures
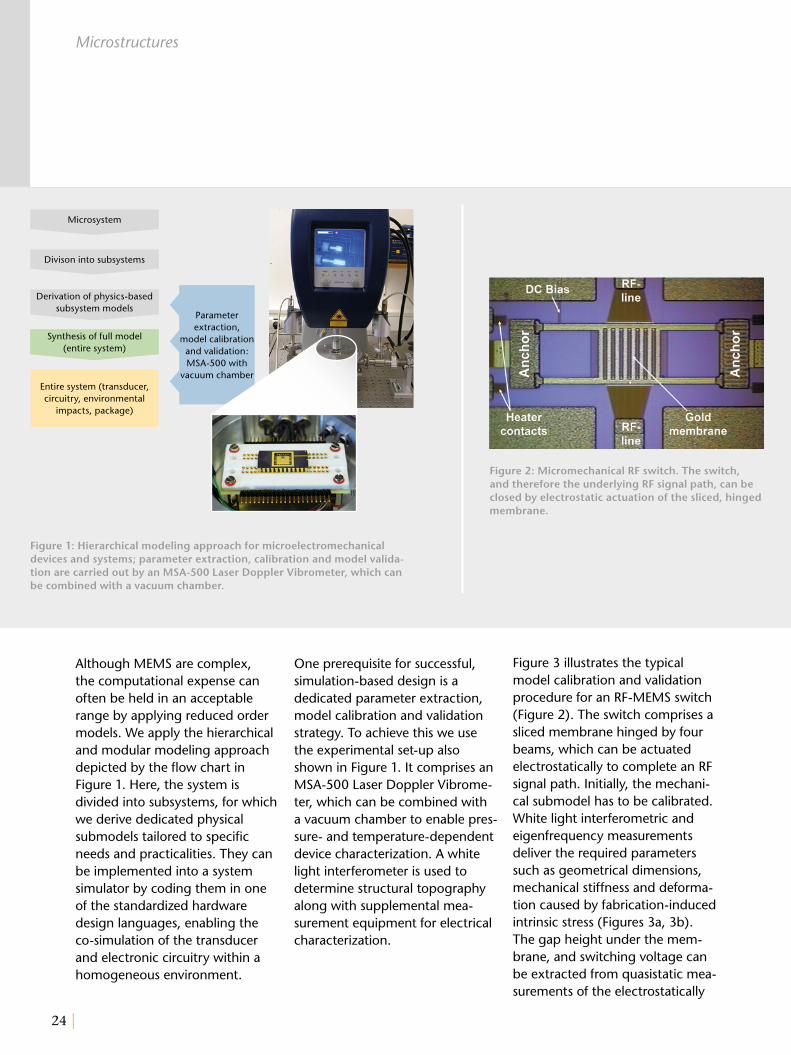
Although MEMS are complex, the computational expense can often be held in an acceptable range by applying reduced order models. We apply the hierarchical and modular modeling approach depicted by the flow chart in Figure 1. Here, the system is divided into subsystems, for which we derive dedicated physical submodels tailored to specific needs and practicalities. They can be implemented into a system simulator by coding them in one of the standardized hardware design languages, enabling the co-simulation of the transducer and electronic circuitry within a homogeneous environment.
One prerequisite for successful, simulation-based design is a dedicated parameter extraction, model calibration and validation strategy. To achieve this we use the experimental set-up also shown in Figure 1. It comprises an MSA-500 Laser Doppler Vibrome-ter, which can be combined with a vacuum chamber to enable pres-sure- and temperature-dependent device characterization. A white light interferometer is used to determine structural topography along with supplemental mea-surement equipment for electrical characterization.
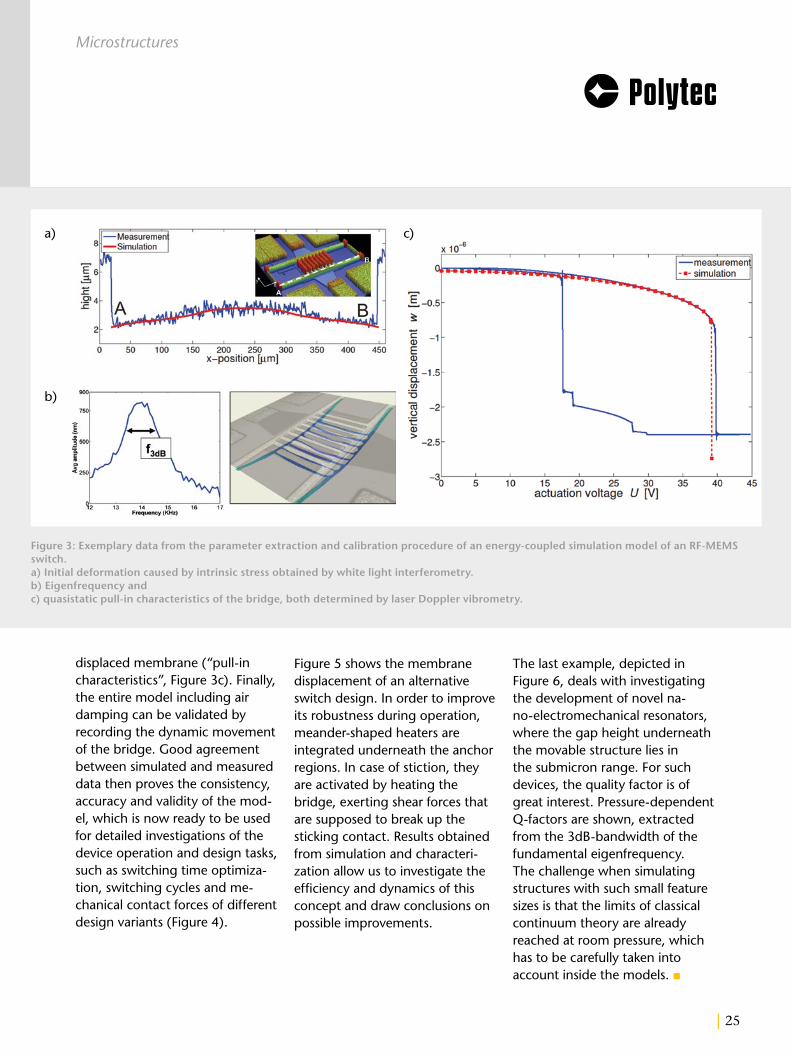
Figure 3 illustrates the typical model calibration and validation procedure for an RF-MEMS switch (Figure 2). The switch comprises a sliced membrane hinged by four beams, which can be actuated electrostatically to complete an RF signal path. Initially, the mechani-cal submodel has to be calibrated. White light interferometric and eigenfrequency measurements deliver the required parameters such as geometrical dimensions, mechanical stiffness and deforma-tion caused by fabrication-induced intrinsic stress (Figures 3a, 3b). The gap height under the mem-brane, and switching voltage can be extracted from quasistatic mea-surements of the electrostatically
Figure 2: Micromechanical RF switch. The switch, and therefore the underlying RF signal path, can be closed by electrostatic actuation of the sliced, hinged membrane.
Figure 1: Hierarchical modeling approach for microelectromechanical devices and systems; parameter extraction, calibration and model valida-tion are carried out by an MSA-500 Laser Doppler Vibrometer, which can be combined with a vacuum chamber.
Microsystem
Divison into subsystems
Derivation of physics-based subsystem models
Entire system (transducer, circuitry, environmental
impacts, package)
Parameter extraction,
model calibration and validation:MSA-500 with
vacuum chamber
Synthesis of full model (entire system)
| 25
Microstructures
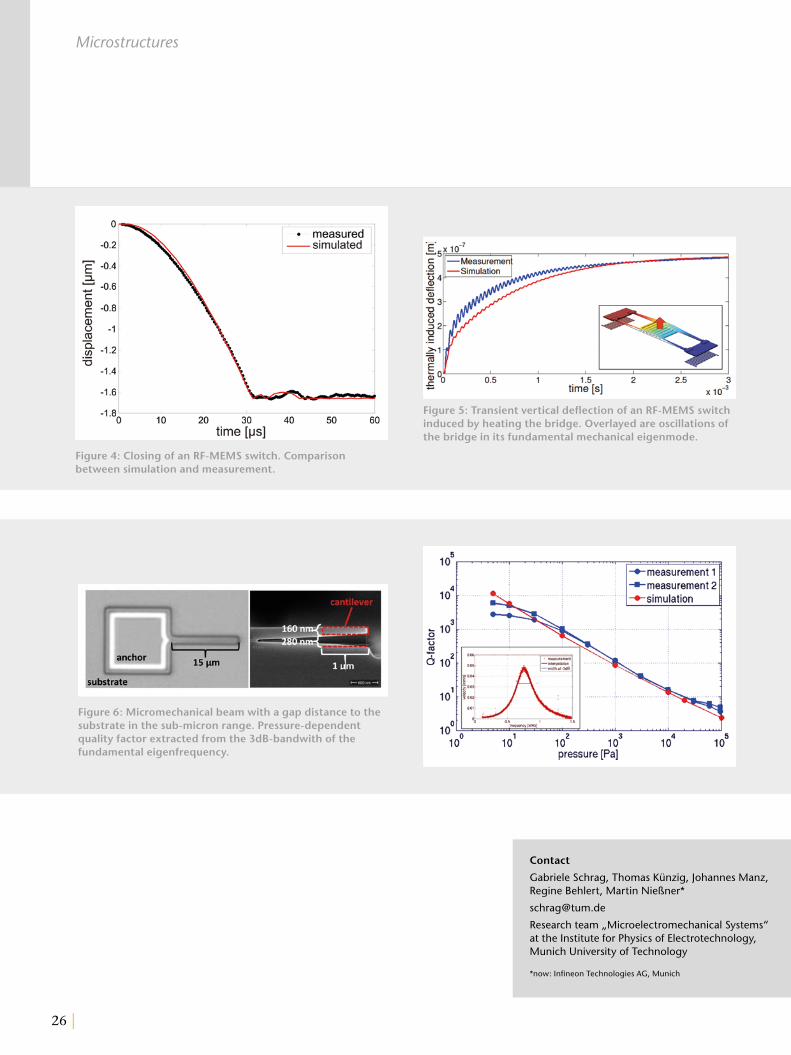
displaced membrane (“pull-in characteristics”, Figure 3c). Finally, the entire model including air damping can be validated by recording the dynamic movement of the bridge. Good agreement between simulated and measured data then proves the consistency, accuracy and validity of the mod-el, which is now ready to be used for detailed investigations of the device operation and design tasks, such as switching time optimiza-tion, switching cycles and me-chanical contact forces of different design variants (Figure 4).
Figure 5 shows the membrane displacement of an alternative switch design. In order to improve its robustness during operation, meander-shaped heaters are integrated underneath the anchor regions. In case of stiction, they are activated by heating the bridge, exerting shear forces that are supposed to break up the sticking contact. Results obtained from simulation and characteri-zation allow us to investigate the efficiency and dynamics of this concept and draw conclusions on possible improvements.
Figure 3: Exemplary data from the parameter extraction and calibration procedure of an energy-coupled simulation model of an RF-MEMS switch. a) Initial deformation caused by intrinsic stress obtained by white light interferometry.b) Eigenfrequency and c) quasistatic pull-in characteristics of the bridge, both determined by laser Doppler vibrometry.
The last example, depicted in Figure 6, deals with investigating the development of novel na-no-electromechanical resonators, where the gap height underneath the movable structure lies in the submicron range. For such devices, the quality factor is of great interest. Pressure-dependent Q-factors are shown, extracted from the 3dB-bandwidth of the fundamental eigenfrequency. The challenge when simulating structures with such small feature sizes is that the limits of classical continuum theory are already reached at room pressure, which has to be carefully taken into account inside the models. ■
c)a)
b)
26 |
Contact
Gabriele Schrag, Thomas Künzig, Johannes Manz, Regine Behlert, Martin Nießner*
Research team „Microelectromechanical Systems“ at the Institute for Physics of Electrotechnology, Munich University of Technology
*now: Infineon Technologies AG, Munich
Figure 6: Micromechanical beam with a gap distance to the substrate in the sub-micron range. Pressure-dependent quality factor extracted from the 3dB-bandwith of the fundamental eigenfrequency.
Microstructures
Figure 5: Transient vertical deflection of an RF-MEMS switch induced by heating the bridge. Overlayed are oscillations of the bridge in its fundamental mechanical eigenmode.
Figure 4: Closing of an RF-MEMS switch. Comparison between simulation and measurement.
| 27
Microstructures
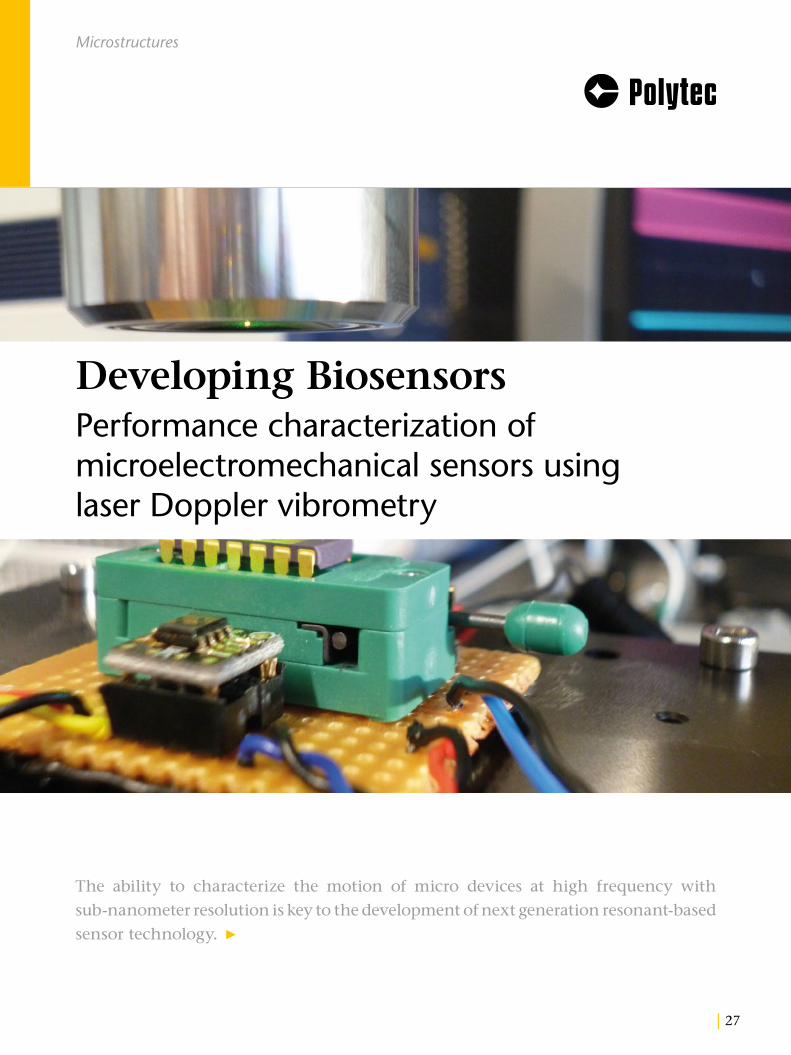
The ability to characterize the motion of micro devices at high frequency with
sub-nanometer resolution is key to the development of next generation resonant-based
sensor technology.
Developing BiosensorsPerformance characterization of micro electromechanical sensors using laser Doppler vibrometry
►
28 |
incorporates a 750 nm thick piezoelectric (PZT) film deposited onto the silicon diaphragm. A 200 nm silicon oxide layer provides a means to define electrode regions and then by application of voltage across an electrode, the resulting induced bending moment drives the device into motion.
Manufacture of the device utilizes cleanroom fabrication processes. The design must account for fabrication tolerances of ±2 µm. Two silicon wafers, one of which is patterned, are bonded together to form a circular diaphragm reso-nator. A platinum base electrode is used as the foundation layer for the subsequently spun-on PZT thin film with patterned oxide and gold layers forming the top electrodes and immobilization regions (Figure 3). The wafers are then diced and individual devices (Figure 4) packaged.
Microstructures
Micro fabrication processes herald a new generation of healthcare technology where point-of-care sensors promise increased sensitivity at low cost, and readout times within minutes.
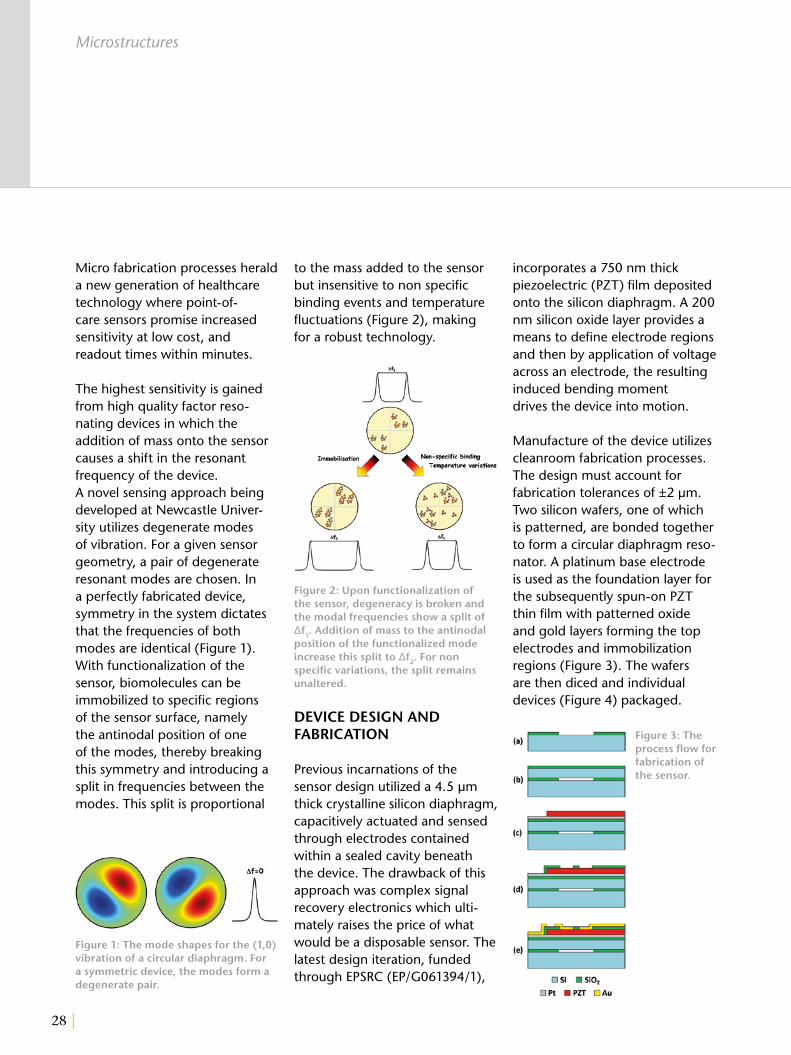
The highest sensitivity is gained from high quality factor reso-nating devices in which the addition of mass onto the sensor causes a shift in the resonant frequency of the device.A novel sensing approach being developed at Newcastle Univer-sity utilizes degenerate modes of vibration. For a given sensor geometry, a pair of degenerate resonant modes are chosen. In a perfectly fabricated device, symmetry in the system dictates that the frequencies of both modes are identical (Figure 1). With functionalization of the sensor, biomolecules can be immobilized to specific regions of the sensor surface, namely the antinodal position of one of the modes, thereby breaking this symmetry and introducing a split in frequencies between the modes. This split is proportional
to the mass added to the sensor but insensitive to non specific binding events and temperature fluctuations (Figure 2), making for a robust technology.
DEVICE DESIGN AND FABRICATION
Previous incarnations of the sensor design utilized a 4.5 µm thick crystalline silicon diaphragm, capacitively actuated and sensed through electrodes contained within a sealed cavity beneath the device. The drawback of this approach was complex signal recovery electronics which ulti-mately raises the price of what would be a disposable sensor. The latest design iteration, funded through EPSRC (EP/G061394/1),
Figure 2: Upon functionalization of the sensor, degeneracy is broken and the modal frequencies show a split of Δf1. Addition of mass to the antinodal position of the functionalized mode increase this split to Δf2. For non specific variations, the split remains unaltered.
Figure 3: The process flow for fabrication of the sensor.
Figure 1: The mode shapes for the (1,0) vibration of a circular diaphragm. For a symmetric device, the modes form a degenerate pair.
| 29
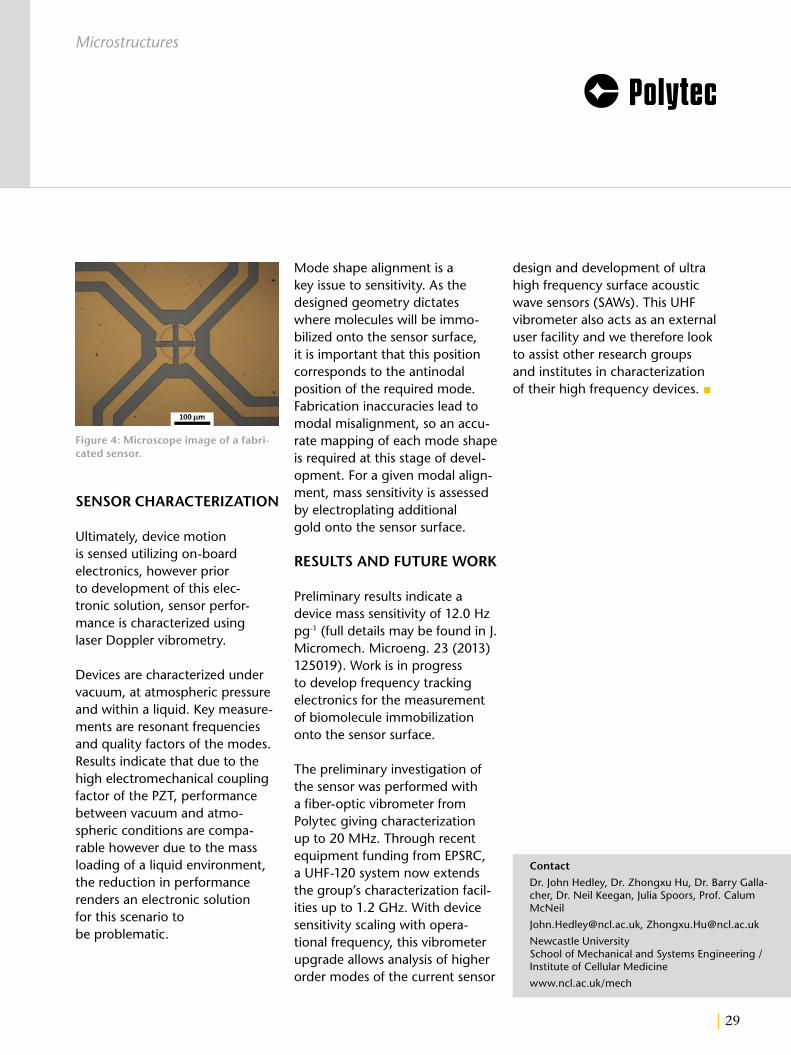
SENSOR CHARACTERIZATION
Ultimately, device motion is sensed utilizing on-board electronics, however prior to development of this elec-tronic solution, sensor perfor-mance is characterized using laser Doppler vibrometry.
Devices are characterized under vacuum, at atmospheric pressure and within a liquid. Key measure-ments are resonant frequencies and quality factors of the modes. Results indicate that due to the high electromechanical coupling factor of the PZT, performance between vacuum and atmo-spheric conditions are compa-rable however due to the mass loading of a liquid environment, the reduction in performance renders an electronic solutionfor this scenario to be problematic.
Microstructures
Contact
Dr. John Hedley, Dr. Zhongxu Hu, Dr. Barry Galla-cher, Dr. Neil Keegan, Julia Spoors, Prof. Calum McNeil
[email protected], [email protected]
Newcastle UniversitySchool of Mechanical and Systems Engineering / Institute of Cellular Medicine
www.ncl.ac.uk/mech
Figure 4: Microscope image of a fabri-cated sensor.
Mode shape alignment is a key issue to sensitivity. As the designed geometry dictates where molecules will be immo-bilized onto the sensor surface, it is important that this position corresponds to the antinodal position of the required mode. Fabrication inaccuracies lead to modal misalignment, so an accu-rate mapping of each mode shape is required at this stage of devel-opment. For a given modal align-ment, mass sensitivity is assessed by electroplating additional gold onto the sensor surface.
RESULTS AND FUTURE WORK
Preliminary results indicate a device mass sensitivity of 12.0 Hz pg-1 (full details may be found in J. Micromech. Microeng. 23 (2013) 125019). Work is in progress to develop frequency tracking electronics for the measurement of biomolecule immobilization onto the sensor surface.
The preliminary investigation of the sensor was performed with a fiber-optic vibrometer from Polytec giving characterization up to 20 MHz. Through recent equipment funding from EPSRC, a UHF-120 system now extends the group’s characterization facil-ities up to 1.2 GHz. With device sensitivity scaling with opera-tional frequency, this vibrometer upgrade allows analysis of higher order modes of the current sensor
design and development of ultra high frequency surface acoustic wave sensors (SAWs). This UHF vibrometer also acts as an external user facility and we therefore look to assist other research groups and institutes in characterization of their high frequency devices. ■

30 |
Cicadas, leafhoppers, planthoppers and spittlebugs (also called Auchenorrhyncha) are
a very diverse group of animals within the insect world. Nevertheless, relatively little
is known about their behavior and phylogeny. Vibrational signals play an important
role in species recognition and mating behavior. Here, the use of laser vibrometer is
extremely helpful.
Big Time for Small SingersUse and benefit of laser vibrometry in insect research
Biology
A planthopper (Hyalesthes obsoletus). This species is a vector of a plant-disease in vineyards and there-
fore of scientific and economic interest.

| 31
Cicadas and their songs are familiar to many people who live or vacation in the USA, Mediterra-nean or tropics. The “true bugs” (Hemiptera), which not only include Auchenorrhyncha but also bugs, aphids and whiteflies, are a very successful and diverse insect order. To date, about 42,000 species of Auchenorrhyncha have been described worldwide. Most of these species are leafhoppers or planthoppers (cover picture) with a body length of less than 5 mm. They play a significant role as primary consumers and consequently as a food source for other animals. Some leaf-hoppers and planthoppers are pests, for example in vineyards or rice fields, and are therefore of economic importance.
THE PROBLEM
In contrast to cicada songs, which are easily heard unaided by humans, leafhoppers and planthoppers use substrate-born signals. They produce vibrations (100 - 3,000 Hz) that can only be registered on the plant the animal is sitting on. Substrate-born signals were ignored for a long time although they are wide-spread among insects. The songs, often sounding like drums, are produced by so-called tympal or-gans, plates on the abdomen, set into vibration by muscles. Duets can often be observed between males and females. Because this communication is mainly used to find mates, it is believed that the songs are species specific and therefore a barrier to other species (biological species concept).
Species differentiation is difficult for many groups of Auchen-orrhyncha, and until now the identification is mainly based on anatomical characteristics. How-ever these are often very small, so other features are needed for identification. Aside from molec-ular methods, it turns out that bioacoustics is a helpful solution.
EXPERIMENTAL SETUP
In the past, vibration signals were recorded using very simple meth-ods. The vibrations were made au-dible by touching the host plant with a gramophone stylus. More recently, piezoelectric transducers were used. The signals could then be recorded on magnetic tape or later on computers. The biggest disadvantage of these methods was that the pickup system had
Biology
Figure 1: Experimental setup for recording planthopper songs. The vibrations are registered with a PDV-100 laser vibrometer either directly on the animal or on its host plant.
►
32 |
OUTLOOK
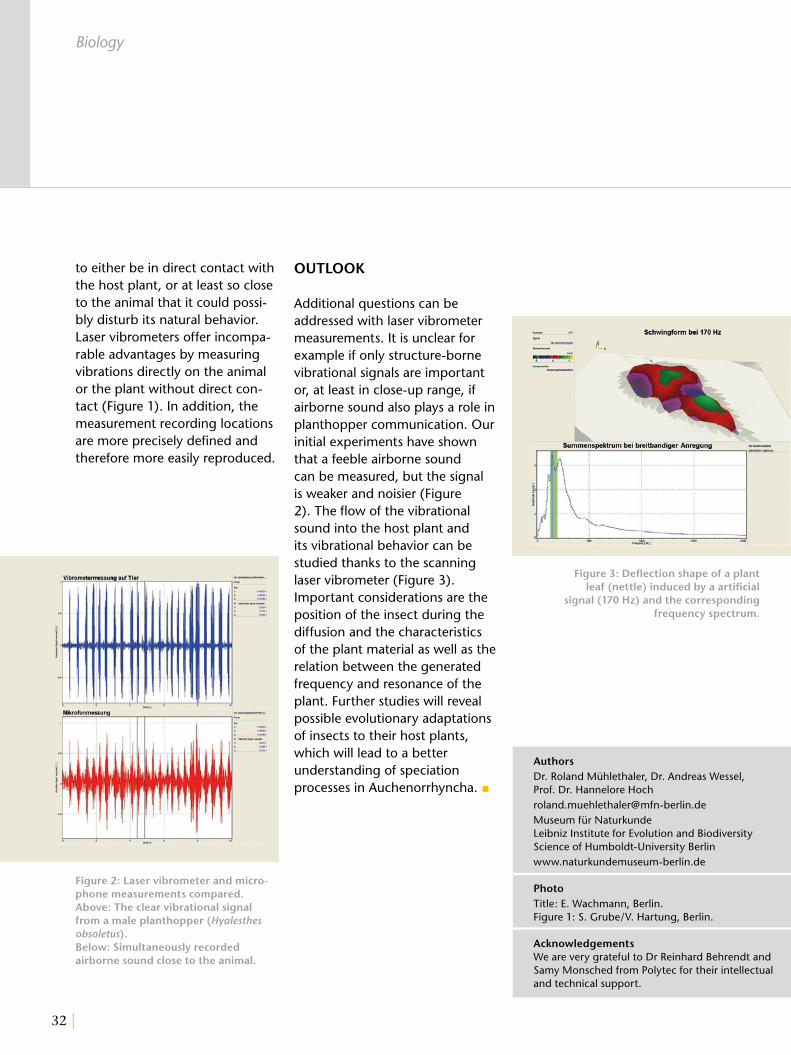
Additional questions can be addressed with laser vibrometer measurements. It is unclear for example if only structure-borne vibrational signals are important or, at least in close-up range, if airborne sound also plays a role in planthopper communication. Our initial experiments have shown that a feeble airborne sound can be measured, but the signal is weaker and noisier (Figure 2). The flow of the vibrational sound into the host plant and its vibrational behavior can be studied thanks to the scanning laser vibrometer (Figure 3). Important considerations are the position of the insect during the diffusion and the characteristics of the plant material as well as the relation between the generated frequency and resonance of the plant. Further studies will reveal possible evolutionary adaptations of insects to their host plants, which will lead to a better understanding of speciation processes in Auchenorrhyncha. ■
to either be in direct contact with the host plant, or at least so close to the animal that it could possi-bly disturb its natural behavior. Laser vibrometers offer incompa-rable advantages by measuring vibrations directly on the animal or the plant without direct con-tact (Figure 1). In addition, the measurement recording locations are more precisely defined and therefore more easily reproduced.
Biology
Figure 3: Deflection shape of a plant leaf (nettle) induced by a artificial
signal (170 Hz) and the corresponding frequency spectrum.
Figure 2: Laser vibrometer and micro-phone measurements compared.Above: The clear vibrational signal from a male planthopper (Hyalesthes obsoletus).Below: Simultaneously recorded airborne sound close to the animal.
AuthorsDr. Roland Mühlethaler, Dr. Andreas Wessel, Prof. Dr. Hannelore [email protected] für NaturkundeLeibniz Institute for Evolution and Biodiversity Science of Humboldt-University Berlinwww.naturkundemuseum-berlin.de
PhotoTitle: E. Wachmann, Berlin.Figure 1: S. Grube/V. Hartung, Berlin.
AcknowledgementsWe are very grateful to Dr Reinhard Behrendt and Samy Monsched from Polytec for their intellectual and technical support.
| 33
Cooperation
Hearing impaired people are especially benefiting from this research. “Laser measurement technology is the basis for excel-lent research and solid education“ says Prof. Peter Eberhard, Head of the Institute. Dr. Stefan König, sales engineer at Polytec adds: “The new competence center promotes interesting applications as well as fundamental analysis.“
Laser Doppler vibrometry measures the tiniest nanometer movements and shows highly dynamic processes without affecting the measured object. “Laser vibrometry is a basic method to measure and under-stand vibrations. Therefore it can also be applied to biomechanical processes such as the transmission
of sound through the middle ear to the inner ear“ explains Dr. Albrecht Eiber who is the deputy head of the institute and uses methods such as computer simulation to investigate implants that allow the reconstruction of ears damaged by age, illness or accident.
Because the middle and inner ear region is very narrow, it was difficult in the past to painlessly figure out how hearing prostheses respond to different sounds and how well the patient hears after surgery. With the help of laser Doppler vibrometry such exam-inations are now possible. The instruments make a major contri-bution to the design of passive, efficient and well-priced hearing
To Improve HearingPolytec and the University of Stuttgart open competence center for laser Doppler vibrometry in biomechanics
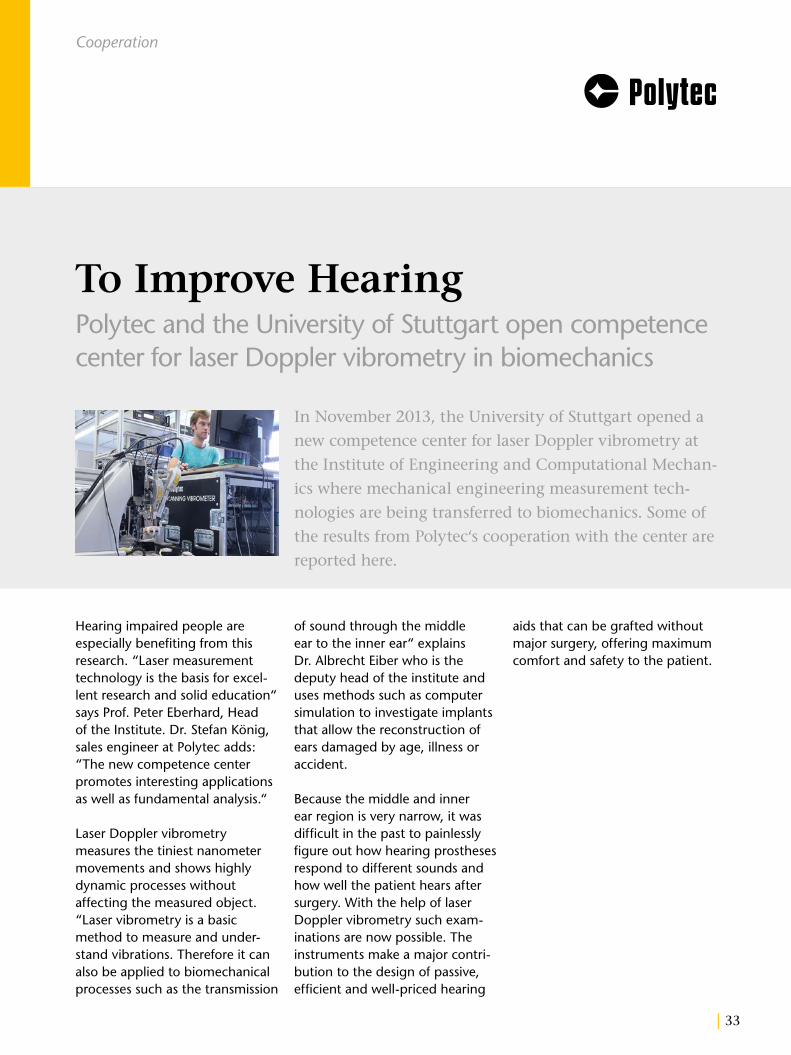
In November 2013, the University of Stuttgart opened a
new competence center for laser Doppler vibrometry at
the Institute of Engineering and Computational Mechan-
ics where mechanical engineering measurement tech-
nologies are being transferred to biomechanics. Some of
the results from Polytec‘s cooperation with the center are
reported here.
aids that can be grafted without major surgery, offering maximum comfort and safety to the patient.
34 |
Cooperation
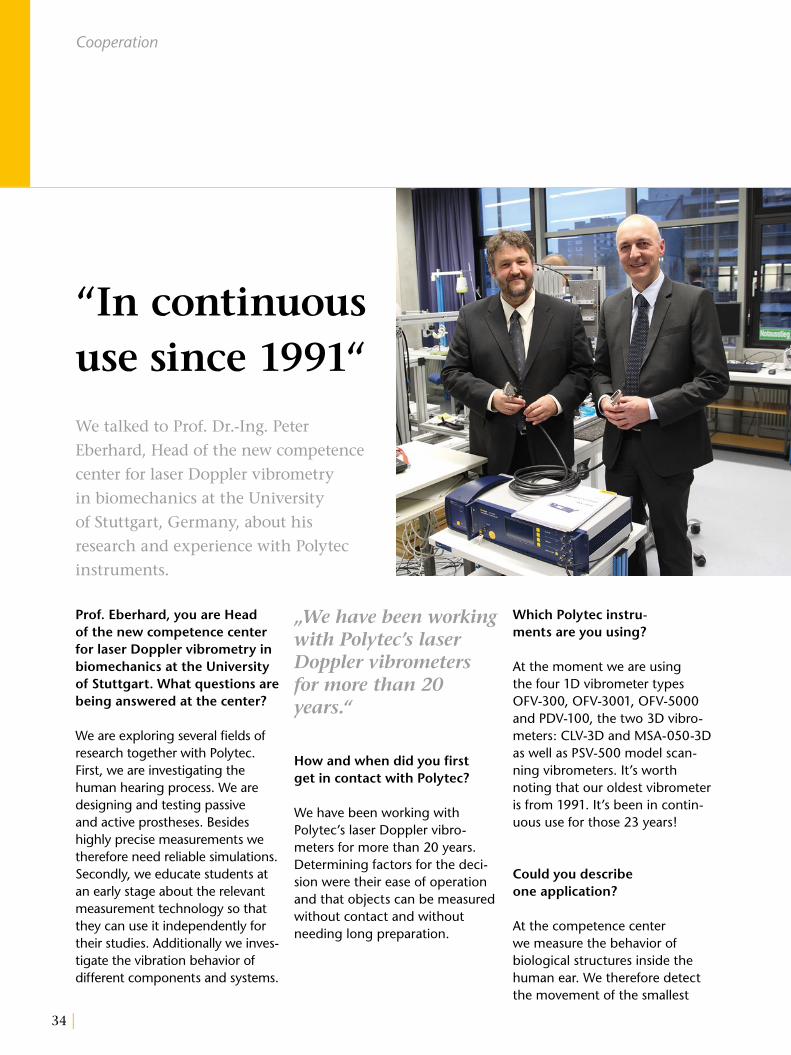
We talked to Prof. Dr.-Ing. Peter
Eberhard, Head of the new competence
center for laser Doppler vibrometry
in biomechanics at the University
of Stuttgart, Germany, about his
research and experience with Polytec
instruments.
“In continuoususe since 1991“
Prof. Eberhard, you are Head of the new competence center for laser Doppler vibrometry in biomechanics at the University of Stuttgart. What questions are being answered at the center?
We are exploring several fields of research together with Polytec. First, we are investigating the human hearing process. We are designing and testing passive and active prostheses. Besides highly precise measurements we therefore need reliable simulations. Secondly, we educate students at an early stage about the relevant measurement technology so that they can use it independently for their studies. Additionally we inves-tigate the vibration behavior of different components and systems.
„We have been working with Polytec’s laser Doppler vibrometers for more than 20 years.“
How and when did you first get in contact with Polytec?
We have been working with Polytec’s laser Doppler vibro-meters for more than 20 years. Determining factors for the deci-sion were their ease of operation and that objects can be measured without contact and without needing long preparation.
Which Polytec instru-ments are you using?
At the moment we are using the four 1D vibrometer types OFV-300, OFV-3001, OFV-5000 and PDV-100, the two 3D vibro-meters: CLV-3D and MSA-050-3D as well as PSV-500 model scan-ning vibrometers. It’s worth noting that our oldest vibrometer is from 1991. It’s been in contin-uous use for those 23 years!
Could you describe one application?
At the competence center we measure the behavior of biological structures inside the human ear. We therefore detect the movement of the smallest
| 35
Cooperation
structures, where very small shifts and forces are taking place.
Where do you see the benefits of the measure-ment tools from Polytec?
It works without contact, so the measurement doesn’t influ-ence the measured object. The result is not distorted. Other important attributes are the precise measure ment of small signals and the possibility to detect high frequency vibrations. This is not possible with mechan-ical measurement methods.
„... but when you reach physical extremes optical methods demonstrate their strengths.“
What advantages do our measurement instru-ments have over other measurement methods?
Mechanical measurement methods, e.g. accelerometers, can also deliver reliable results, but when you reach physical extremes, optical methods demonstrate their strengths. Simple operation is also key. In many cases we combine different measurement methods, e.g.
during the reproducible exci-tation of biological structures through micro adjustable tables and the simultaneous measure-ment of displacement along with forces from force sensors.
What is your general impression of Polytec?
We have shared our development ideas with Polytec for many years and are delighted with the inno-vative improvements that have transpired. For us it is important that there are new developments both for simple instruments for standard measurements and for high-end applications for difficult situations. Also important to us are Polytec’s highly competent sales engineers who understand our requirements and help us to find the best solution.
What are future questions that you want so solve with Polytec’s vibration measurement tech nology?
For me as head of the institute it is always interesting to see the broad span of applications for the vibrometers in our lab. In many cases the instruments are used in experiments for which optical methods weren’t sched-uled. The instruments can also be found in tests where you just want to try something. When
tools are in continuous use and colleagues like to use them for different purposes you know that you made the right decision. Besides that, we, together with Polytec, face some challenges for future Polytec instruments as experts for mechanical vibration technology and dynamics.
Mr. Eberhard, we thank you for this interview.
Prof. Dr.-Ing. Prof.E.h. Peter Eberhard
Head of Institute of Engineering and Computa-tional Mechanics, University of Stuttgart, Germany
36 |
Acoustics
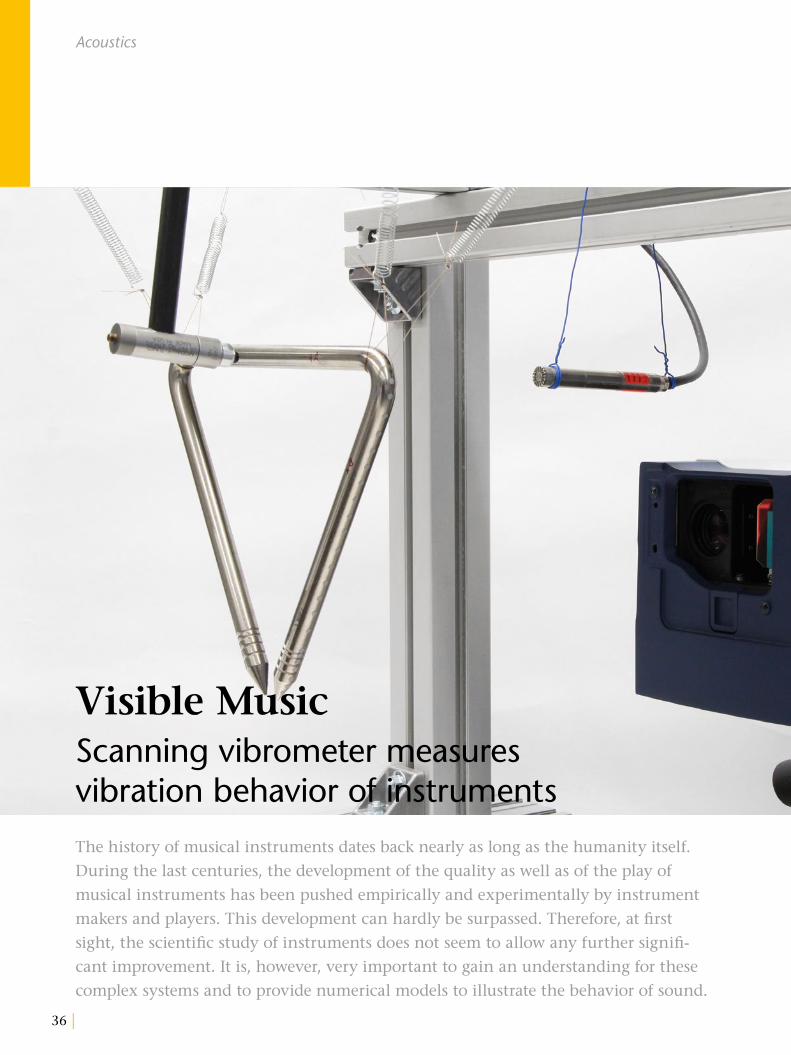
Visible MusicScanning vibrometer measuresvibration behavior of instruments
The history of musical instruments dates back nearly as long as the humanity itself.
During the last centuries, the development of the quality as well as of the play of
musical instruments has been pushed empirically and experimentally by instrument
makers and players. This development can hardly be surpassed. Therefore, at first
sight, the scientific study of instruments does not seem to allow any further signifi-
cant improvement. It is, however, very important to gain an understanding for these
complex systems and to provide numerical models to illustrate the behavior of sound.
| 37
Visible MusicScanning vibrometer measuresvibration behavior of instruments
Acoustics
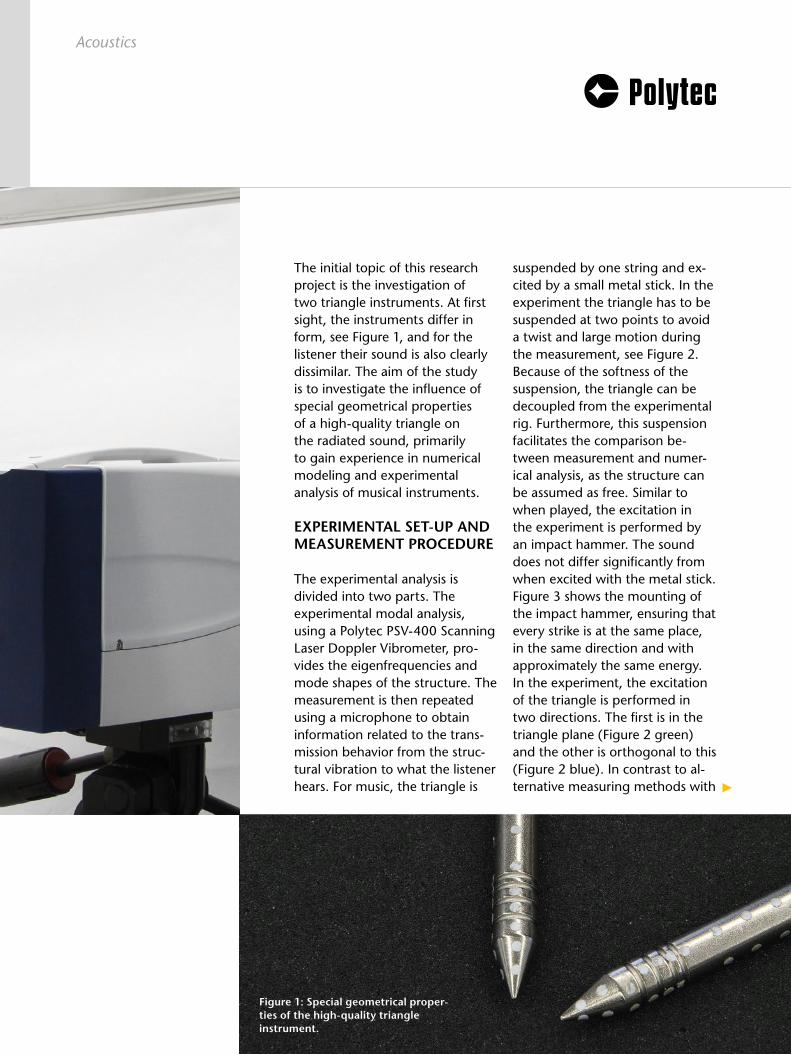
The initial topic of this research project is the investigation of two triangle instruments. At first sight, the instruments differ in form, see Figure 1, and for the listener their sound is also clearly dissimilar. The aim of the study is to investigate the influence of special geometrical properties of a high-quality triangle on the radiated sound, primarily to gain experience in numerical modeling and experimental analysis of musical instruments.
EXPERIMENTAL SET-UP AND MEASUREMENT PROCEDURE
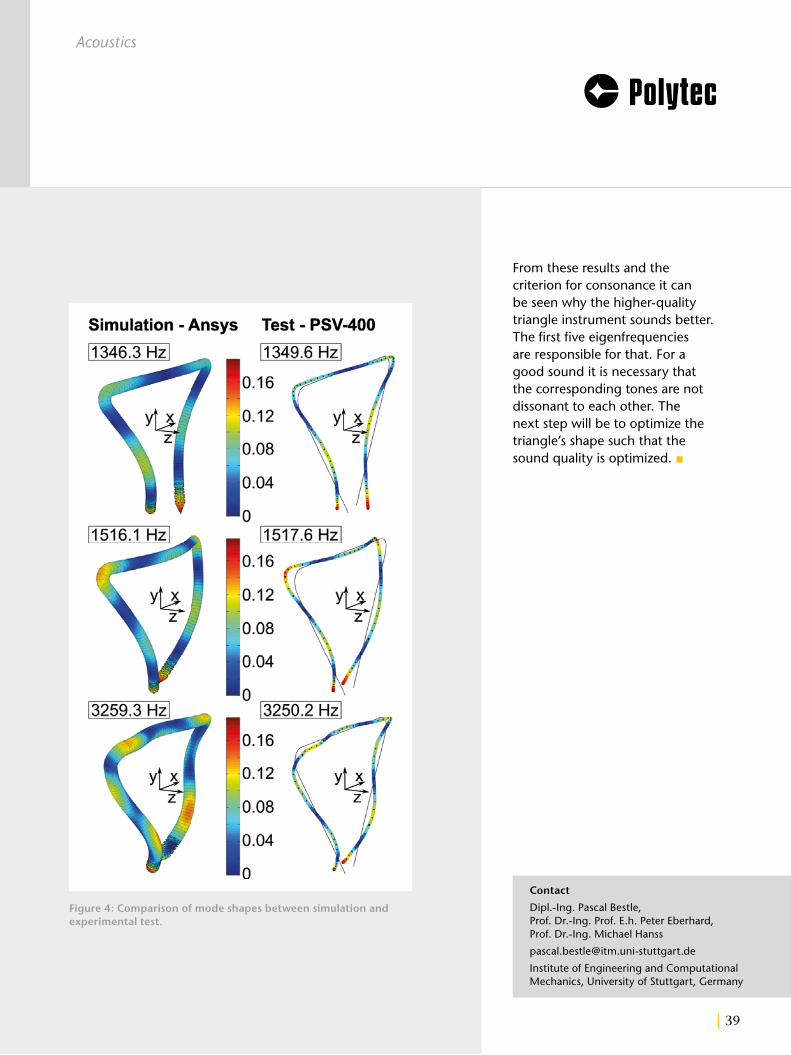
The experimental analysis is divided into two parts. The experimental modal analysis, using a Polytec PSV-400 Scanning Laser Doppler Vibrometer, pro-vides the eigenfrequencies and mode shapes of the structure. The measurement is then repeated using a microphone to obtain information related to the trans-mission behavior from the struc-tural vibration to what the listener hears. For music, the triangle is
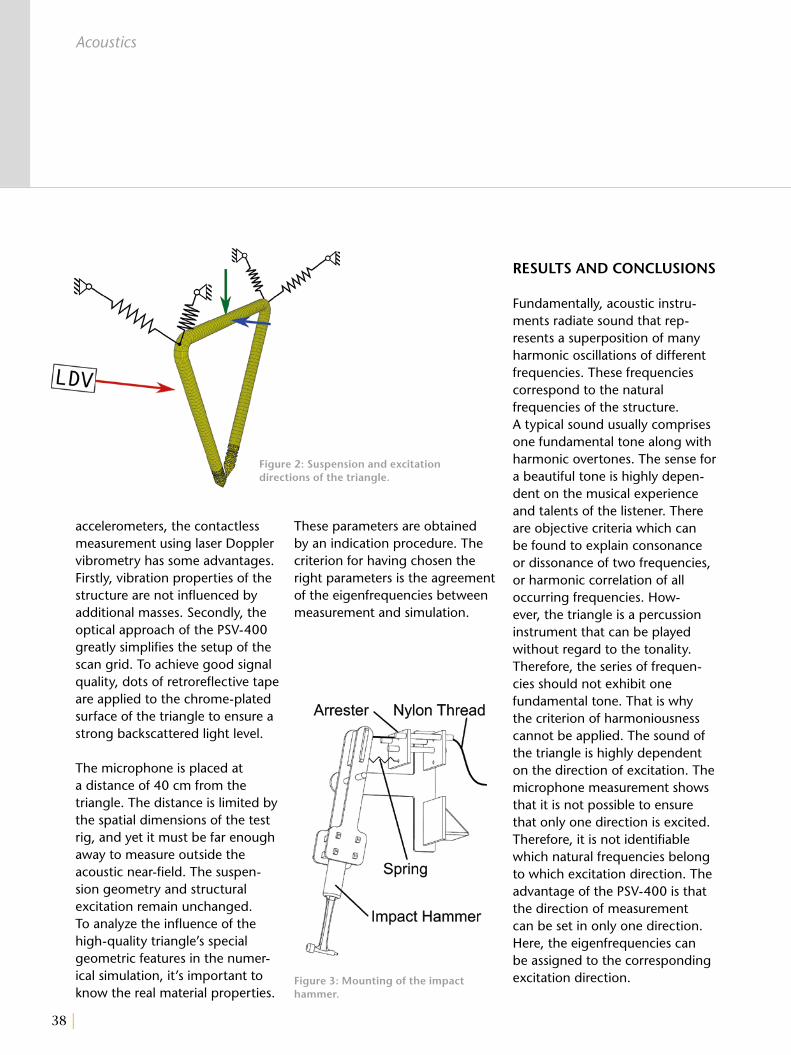
suspended by one string and ex-cited by a small metal stick. In the experiment the triangle has to be suspended at two points to avoid a twist and large motion during the measurement, see Figure 2. Because of the softness of the suspension, the triangle can be decoupled from the experimental rig. Furthermore, this suspension facilitates the comparison be-tween measurement and numer-ical analysis, as the structure can be assumed as free. Similar to when played, the excitation in the experiment is performed by an impact hammer. The sound does not differ significantly from when excited with the metal stick. Figure 3 shows the mounting of the impact hammer, ensuring that every strike is at the same place, in the same direction and with approximately the same energy. In the experiment, the excitation of the triangle is performed in two directions. The first is in the triangle plane (Figure 2 green) and the other is orthogonal to this (Figure 2 blue). In contrast to al-ternative measuring methods with ►
Figure 1: Special geometrical proper-ties of the high-quality triangle instrument.
38 |
accelerometers, the contactless measurement using laser Doppler vibrometry has some advantages. Firstly, vibration properties of the structure are not influenced by additional masses. Secondly, the optical approach of the PSV-400 greatly simplifies the setup of the scan grid. To achieve good signal quality, dots of retroreflective tape are applied to the chrome-plated surface of the triangle to ensure a strong backscattered light level.
The microphone is placed at a distance of 40 cm from the triangle. The distance is limited by the spatial dimensions of the test rig, and yet it must be far enough away to measure outside the acoustic near-field. The suspen-sion geometry and structural excitation remain unchanged. To analyze the influence of the high-quality triangle’s special geometric features in the numer-ical simulation, it’s important to know the real material properties.
These parameters are obtained by an indication procedure. The criterion for having chosen the right parameters is the agreement of the eigenfrequencies between measurement and simulation.
RESULTS AND CONCLUSIONS
Fundamentally, acoustic instru-ments radiate sound that rep-resents a superposition of many harmonic oscillations of different frequencies. These frequencies correspond to the natural frequen cies of the structure. A typical sound usually comprises one fundamental tone along with harmonic overtones. The sense for a beautiful tone is highly depen-dent on the musical experience and talents of the listener. There are objective criteria which can be found to explain consonance or dissonance of two frequencies, or harmonic correlation of all occurring frequencies. How-ever, the triangle is a percussion instrument that can be played without regard to the tonality. Therefore, the series of frequen-cies should not exhibit one fundamental tone. That is why the criterion of harmoniousness cannot be applied. The sound of the triangle is highly dependent on the direction of excitation. The microphone measurement shows that it is not possible to ensure that only one direction is excited. Therefore, it is not identifiable which natural frequencies belong to which excitation direction. The advantage of the PSV-400 is that the direction of measurement can be set in only one direction. Here, the eigenfrequencies can be assigned to the corresponding excitation direction. Figure 3: Mounting of the impact
hammer.
Figure 2: Suspension and excitation directions of the triangle.
Acoustics
| 39
Figure 4: Comparison of mode shapes between simulation and experimental test.
From these results and the criterion for consonance it can be seen why the higher-quality triangle instrument sounds better. The first five eigenfrequencies are responsible for that. For a good sound it is necessary that the corresponding tones are not dissonant to each other. The next step will be to optimize the triangle’s shape such that the sound quality is optimized. ■
Contact
Dipl.-Ing. Pascal Bestle, Prof. Dr.-Ing. Prof. E.h. Peter Eberhard, Prof. Dr.-Ing. Michael Hanss
Institute of Engineering and Computational Mechanics, University of Stuttgart, Germany
Acoustics

40 |
Medicines
Fascination of HearingVibration patterns of the
smallest bone in the human body
According to the WHO, 360 million people worldwide suffer from hearing loss, often
caused by damage to middle-ear structures from disease or accidents. The University
Hospital Zurich has measured vibration patterns of the impaired structures in order to
select appropriate prostheses and related surgical techniques. The goals of the research
are optimal coordination of hearing aids, improved interpretations in clinical diagnos-
tics and further development of current diagnostic procedures.
| 41
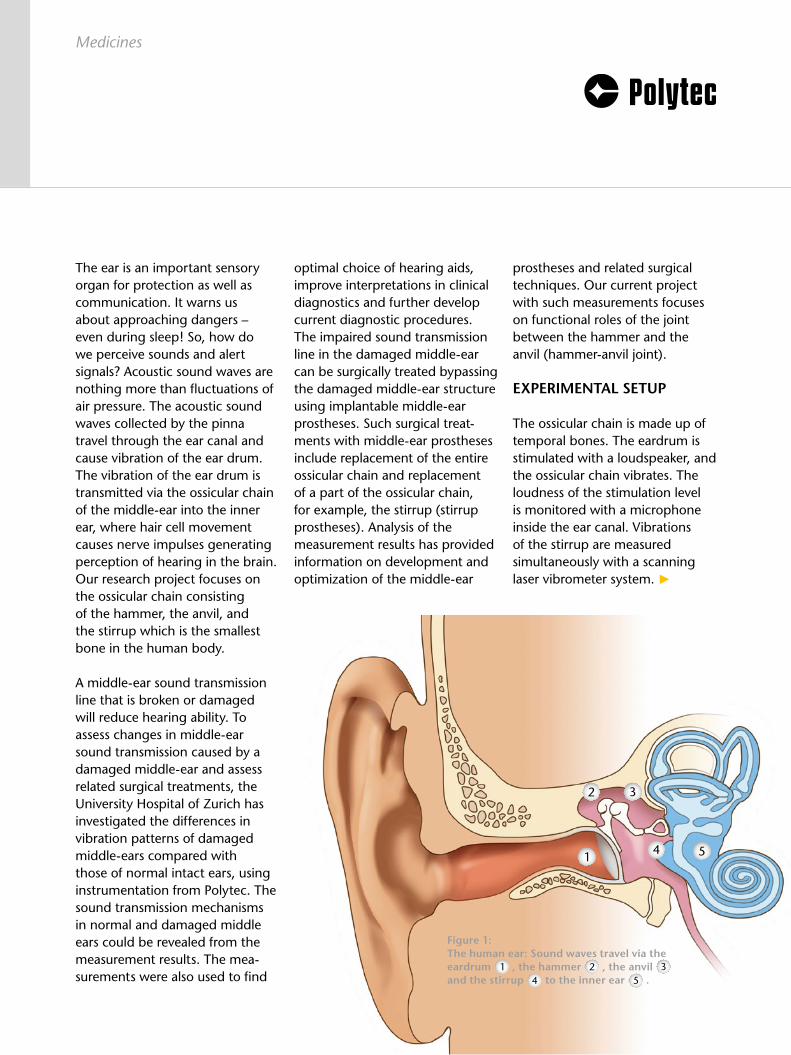
Figure 1:The human ear: Sound waves travel via the eardrum , the hammer , the anvil and the stirrup to the inner ear .
The ear is an important sensory organ for protection as well as communication. It warns us about approaching dangers – even during sleep! So, how do we perceive sounds and alert signals? Acoustic sound waves are nothing more than fluctuations of air pressure. The acoustic sound waves collected by the pinna travel through the ear canal and cause vibration of the ear drum. The vibration of the ear drum is transmitted via the ossicular chain of the middle-ear into the inner ear, where hair cell movement causes nerve impulses generating perception of hearing in the brain. Our research project focuses on the ossicular chain consisting of the hammer, the anvil, and the stirrup which is the smallest bone in the human body.
A middle-ear sound transmission line that is broken or damaged will reduce hearing ability. To assess changes in middle-ear sound transmission caused by a damaged middle-ear and assess related surgical treatments, the University Hospital of Zurich has investigated the differences in vibration patterns of damaged middle-ears compared with those of normal intact ears, using instrumentation from Polytec. The sound transmission mechanisms in normal and damaged middle ears could be revealed from the measurement results. The mea-surements were also used to find
Medicines
optimal choice of hearing aids, improve interpretations in clinical diagnostics and further develop current diagnostic procedures. The impaired sound transmission line in the damaged middle-ear can be surgically treated bypassing the damaged middle-ear structure using implantable middle-ear prostheses. Such surgical treat-ments with middle-ear prostheses include replacement of the entire ossicular chain and replacement of a part of the ossicular chain, for example, the stirrup (stirrup prostheses). Analysis of the measurement results has provided information on development and optimization of the middle-ear
prostheses and related surgical techniques. Our current project with such measurements focuses on functional roles of the joint between the hammer and the anvil (hammer-anvil joint).
EXPERIMENTAL SETUP
The ossicular chain is made up of temporal bones. The eardrum is stimulated with a loudspeaker, and the ossicular chain vibrates. The loudness of the stimulation level is monitored with a microphone inside the ear canal. Vibrations of the stirrup are measured simultaneously with a scanning laser vibrometer system. ►
42 |
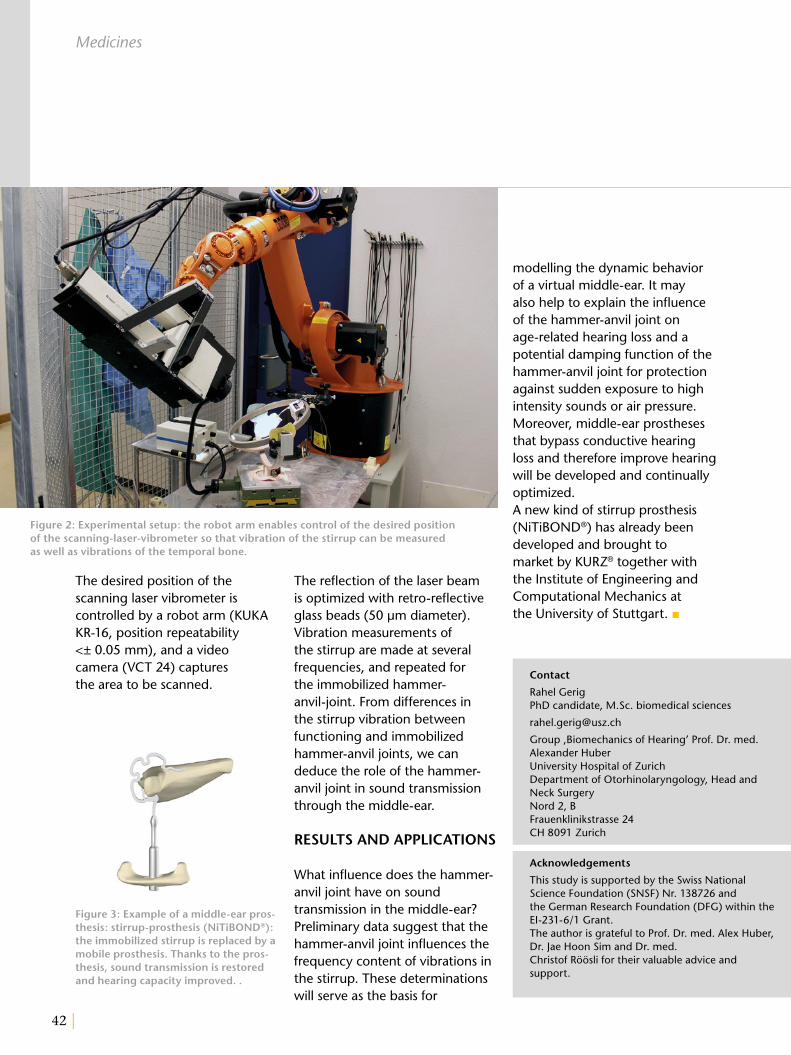
The desired position of the scanning laser vibrometer is controlled by a robot arm (KUKA KR-16, position repeatability <± 0.05 mm), and a video camera (VCT 24) captures the area to be scanned.
Medicines
Figure 3: Example of a middle-ear pros-thesis: stirrup-prosthesis (NiTiBOND®): the immobilized stirrup is replaced by a mobile prosthesis. Thanks to the pros-thesis, sound transmission is restored and hearing capacity improved. .
The reflection of the laser beam is optimized with retro-reflective glass beads (50 µm diameter). Vibration measurements of the stirrup are made at several frequencies, and repeated for the immobilized hammer-anvil-joint. From differences in the stirrup vibration between functioning and immobilized hammer-anvil joints, we can deduce the role of the hammer-anvil joint in sound transmission through the middle-ear.
RESULTS AND APPLICATIONS
What influence does the hammer-anvil joint have on sound transmission in the middle-ear? Preliminary data suggest that the hammer-anvil joint influences the frequency content of vibrations in the stirrup. These determinations will serve as the basis for
Contact
Rahel GerigPhD candidate, M.Sc. biomedical sciences
Group ‚Biomechanics of Hearing’ Prof. Dr. med. Alexander HuberUniversity Hospital of ZurichDepartment of Otorhinolaryngology, Head and Neck SurgeryNord 2, BFrauenklinikstrasse 24CH 8091 Zurich
Acknowledgements
This study is supported by the Swiss National Science Foundation (SNSF) Nr. 138726 andthe German Research Foundation (DFG) within the EI-231-6/1 Grant.The author is grateful to Prof. Dr. med. Alex Huber, Dr. Jae Hoon Sim and Dr. med.Christof Röösli for their valuable advice and support.
Figure 2: Experimental setup: the robot arm enables control of the desired position of the scanning-laser-vibrometer so that vibration of the stirrup can be measured as well as vibrations of the temporal bone.
modelling the dynamic behavior of a virtual middle-ear. It may also help to explain the influence of the hammer-anvil joint on age-related hearing loss and a potential damping function of the hammer-anvil joint for protection against sudden exposure to high intensity sounds or air pressure. Moreover, middle-ear prostheses that bypass conductive hearing loss and therefore improve hearing will be developed and continually optimized. A new kind of stirrup prosthesis (NiTiBOND®) has already been developed and brought to market by KURZ® together with the Institute of Engineering and Computational Mechanics at the University of Stuttgart. ■
| 43
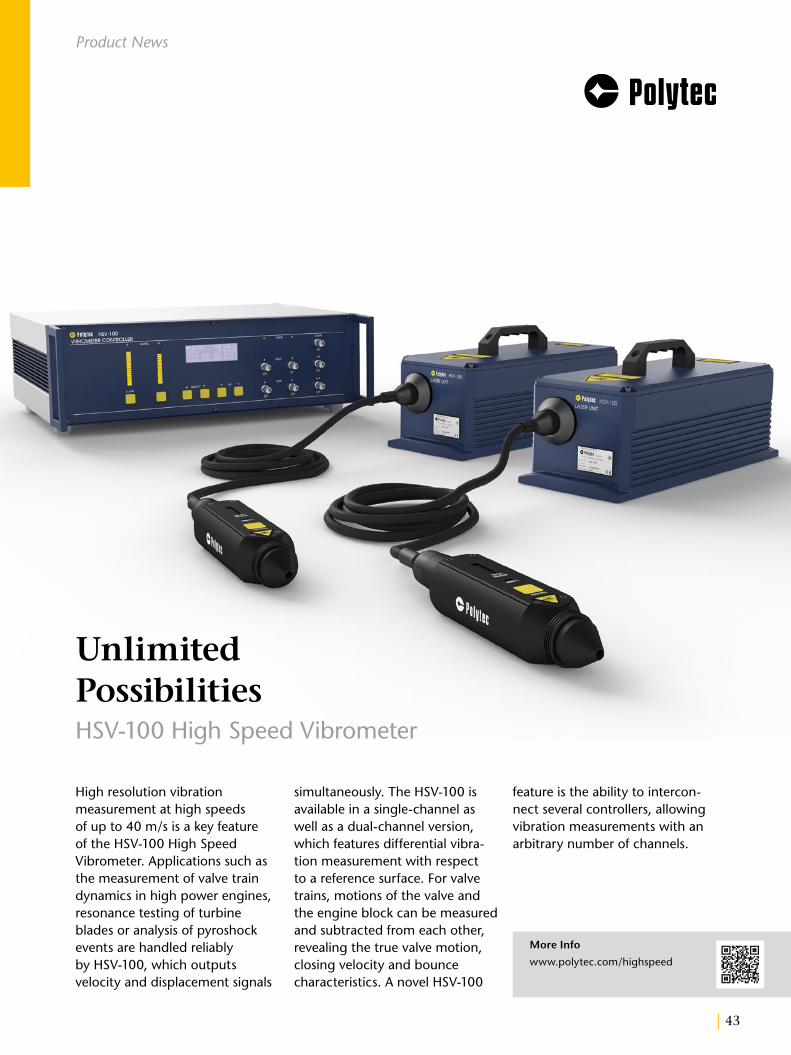
Unlimited PossibilitiesHSV-100 High Speed Vibrometer
More Info
www.polytec.com/highspeed
Product News
High resolution vibration measurement at high speeds of up to 40 m/s is a key feature of the HSV-100 High Speed Vibrometer. Applications such as the measurement of valve train dynamics in high power engines, resonance testing of turbine blades or analysis of pyroshock events are handled reliably by HSV-100, which outputs velocity and displacement signals
simultaneously. The HSV-100 is available in a single-channel as well as a dual-channel version, which features differential vibra-tion measurement with respect to a reference surface. For valve trains, motions of the valve and the engine block can be measured and subtracted from each other, revealing the true valve motion, closing velocity and bounce characteristics. A novel HSV-100
feature is the ability to intercon-nect several controllers, allowing vibration measurements with an arbitrary number of channels.
44 |
Product News
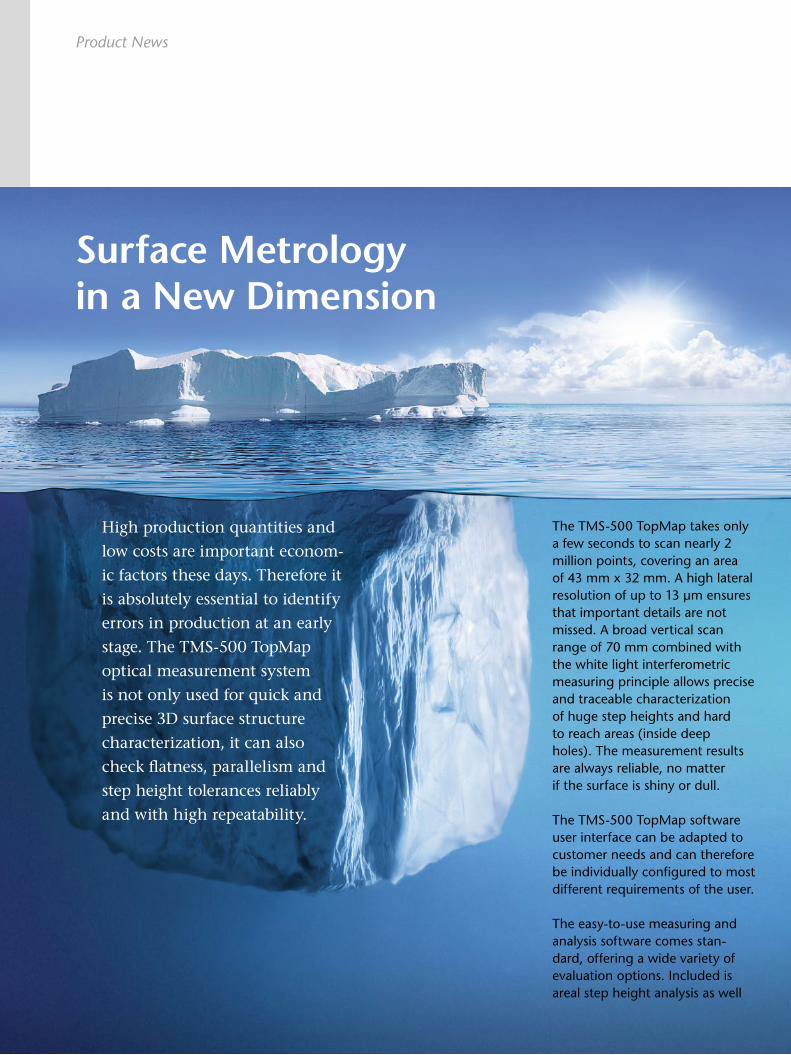
Surface Metrology in a New Dimension
High production quantities and
low costs are important econom-
ic factors these days. Therefore it
is absolutely essential to identify
errors in production at an early
stage. The TMS-500 TopMap
optical measurement system
is not only used for quick and
precise 3D surface structure
characterization, it can also
check flatness, parallelism and
step height tolerances reliably
and with high repeatability.
The TMS-500 TopMap takes only a few seconds to scan nearly 2 million points, covering an area of 43 mm x 32 mm. A high lateral resolution of up to 13 µm ensures that important details are not missed. A broad vertical scan range of 70 mm combined with the white light interferometric measuring principle allows precise and traceable characterization of huge step heights and hard to reach areas (inside deep holes). The measurement results are always reliable, no matter if the surface is shiny or dull.
The TMS-500 TopMap software user interface can be adapted to customer needs and can therefore be individually configured to most different requirements of the user.
The easy-to-use measuring and analysis software comes stan-dard, offering a wide variety of evaluation options. Included is areal step height analysis as well
| 45
as profile step height analysis according to DIN ISO 5436-1.
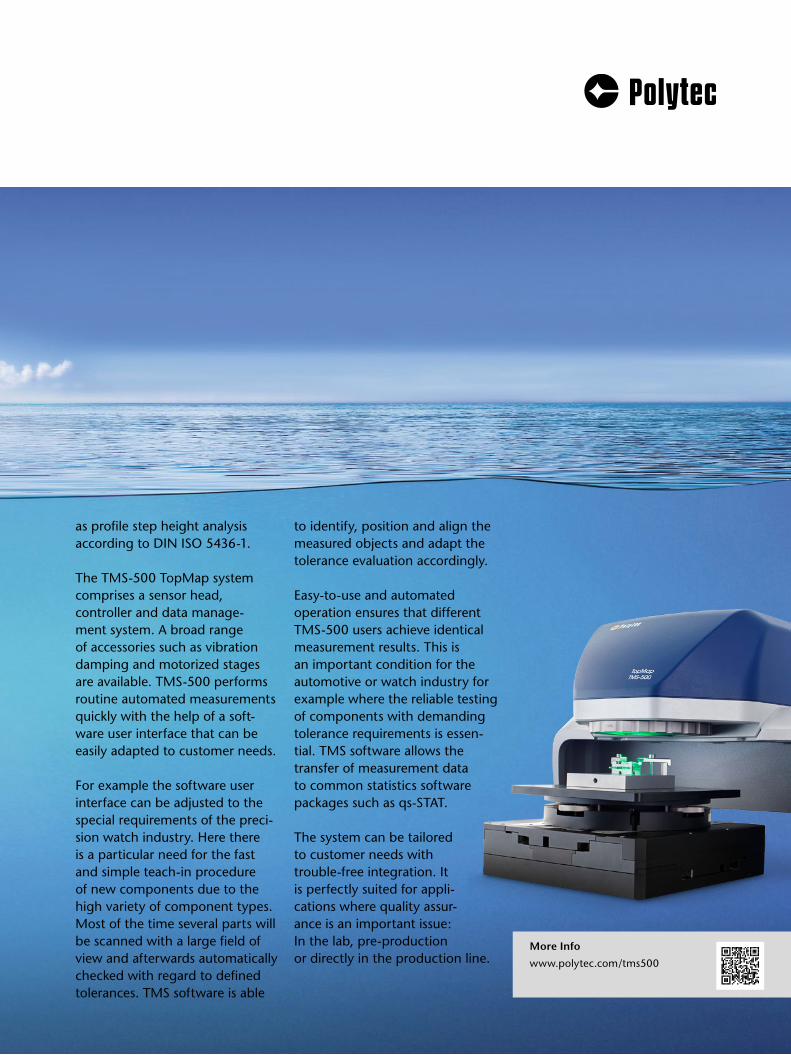
The TMS-500 TopMap system comprises a sensor head, controller and data manage-ment system. A broad range of accessories such as vibration damping and motorized stages are available. TMS-500 performs routine automated measurements quickly with the help of a soft-ware user interface that can be easily adapted to customer needs.
For example the software user interface can be adjusted to the special requirements of the preci-sion watch industry. Here there is a particular need for the fast and simple teach-in procedure of new components due to the high variety of component types. Most of the time several parts will be scanned with a large field of view and afterwards automatically checked with regard to defined tolerances. TMS software is able
to identify, position and align the measured objects and adapt the tolerance evaluation accordingly.
Easy-to-use and automated operation ensures that different TMS-500 users achieve identical measurement results. This is an important condition for the automotive or watch industry for example where the reliable testing of components with demanding tolerance requirements is essen-tial. TMS software allows the transfer of measurement data to common statistics software packages such as qs-STAT.
The system can be tailored to customer needs with trouble-free integration. It is perfectly suited for appli-cations where quality assur-ance is an important issue: In the lab, pre-production or directly in the production line.
More Info
www.polytec.com/tms500
46 |
Product News
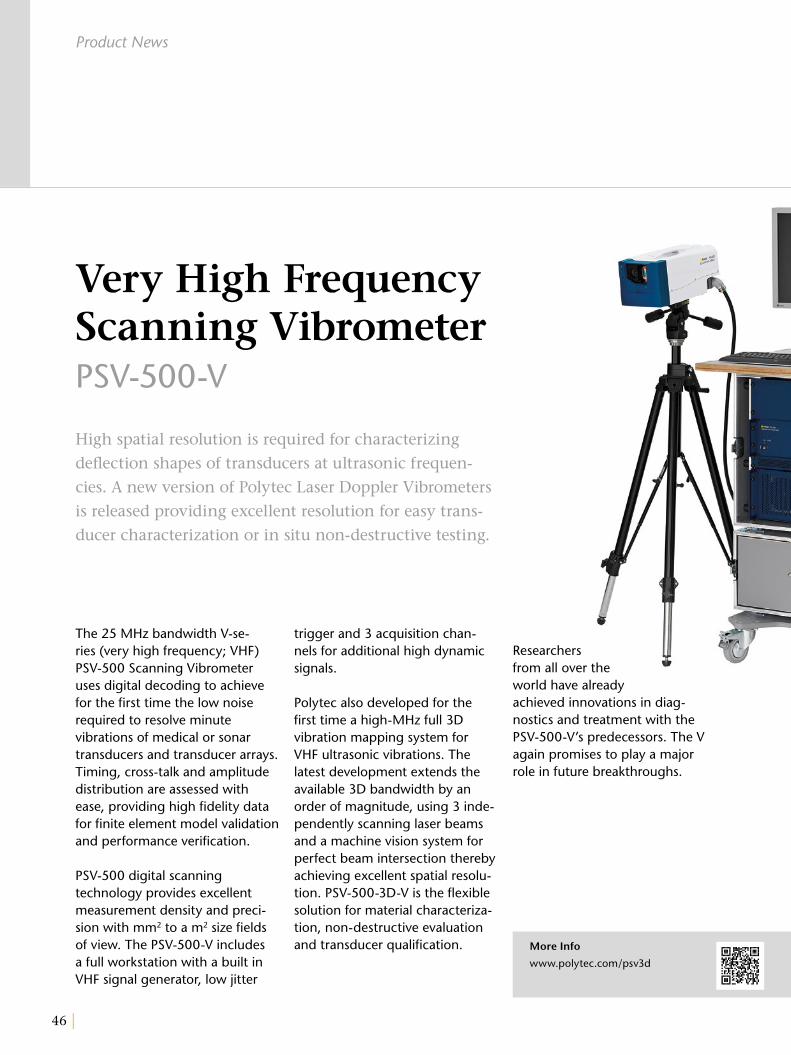
The 25 MHz bandwidth V-se-ries (very high frequency; VHF) PSV-500 Scanning Vibrometer uses digital decoding to achieve for the first time the low noise required to resolve minute vibrations of medical or sonar transducers and transducer arrays. Timing, cross-talk and amplitude distribution are assessed with ease, providing high fidelity data for finite element model validation and performance verification.
PSV-500 digital scanning technology provides excellent measurement density and preci-sion with mm2 to a m2 size fields of view. The PSV-500-V includes a full workstation with a built in VHF signal generator, low jitter
trigger and 3 acquisition chan-nels for additional high dynamic signals.
Polytec also developed for the first time a high-MHz full 3D vibration mapping system for VHF ultrasonic vibrations. The latest development extends the available 3D bandwidth by an order of magnitude, using 3 inde-pendently scanning laser beams and a machine vision system for perfect beam intersection thereby achieving excellent spatial resolu-tion. PSV-500-3D-V is the flexible solution for material characteriza-tion, non-destructive evaluation and transducer qualification.
Very High Frequency Scanning VibrometerPSV-500-V
High spatial resolution is required for characterizing
deflection shapes of transducers at ultrasonic frequen-
cies. A new version of Polytec Laser Doppler Vibrometers
is released providing excellent resolution for easy trans-
ducer characterization or in situ non-destructive testing.
More Info
www.polytec.com/psv3d
Researchers from all over the world have already achieved innovations in diag-nostics and treatment with the PSV-500-V’s predecessors. The V again promises to play a major role in future breakthroughs.
| 47
stored in the acquisition settings of the software. Extended damping values are available in the analyzers for a first assess-ment of the validity of simulation results.
MEMS and microsystems researchers using the software with the Micro System Analyzer (MSA) or Ultra High Frequency (UHF) scanning systems will benefit from the Q-factor feature for damping evaluations, as well as extended grid definition tools to allow a precise adjustment of the spatial resolution of the measurement grid to the acoustic wavelength of the sample.
Research groups in universities and colleges that are part of Polytec’s University Program benefit from these new features automatically. New attractive pricing for the desktop version of the software, which allows offline analysis of the measurement data, provides access to a larger group of users in R&D departments and e.g. simulations service companies.
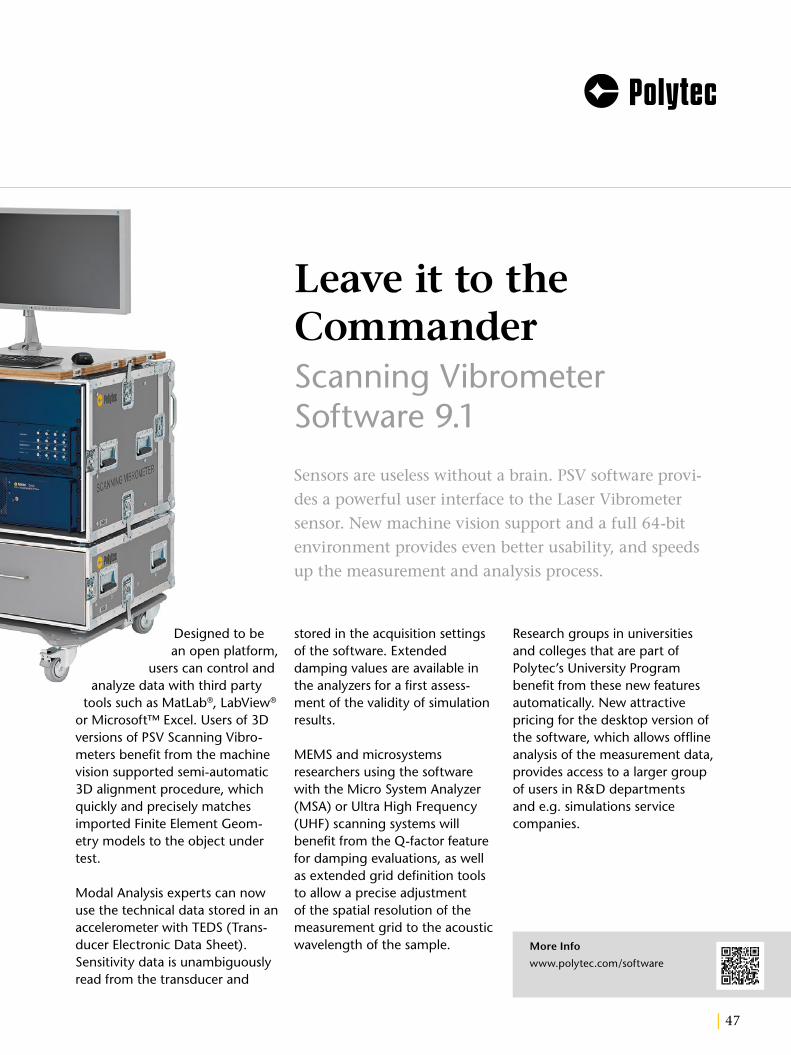
Leave it to the CommanderScanning Vibrometer Software 9.1
Sensors are useless without a brain. PSV software provi-
des a powerful user interface to the Laser Vibrometer
sensor. New machine vision support and a full 64-bit
environment provides even better usability, and speeds
up the measurement and analysis process.
More Info
www.polytec.com/software
Designed to be an open platform,
users can control and analyze data with third party
tools such as MatLab®, LabView® or Microsoft™ Excel. Users of 3D versions of PSV Scanning Vibro-meters benefit from the machine vision supported semi-automatic 3D alignment procedure, which quickly and precisely matches imported Finite Element Geom-etry models to the object under test.
Modal Analysis experts can now use the technical data stored in an accelerometer with TEDS (Trans-ducer Electronic Data Sheet). Sensitivity data is unambiguously read from the transducer and

Polytec GmbH (Germany)Polytec-Platz 1-776337 WaldbronnTel. + 49 7243 [email protected]
Polytec France S.A.S.Bâtiment Orion – 1er étage39, rue Louveau92320 ChâtillonTel. +33 1 [email protected]
Polytec Ltd.(Great Britain)Lambda House, Batford MillHarpenden, Herts A L5 5BZTel. + 44 1582 [email protected]
Polytec JapanArena Tower, 13th floor3-1-9, ShinyokohamaKohoku-ku, Yokohama-shiKanagawa, 222-0033Tel. +81 45 [email protected]
Polytec, Inc. (USA)North American Headquarters16400 Bake ParkwaySuites 150 & 200Irvine, CA 92618Tel. +1 949 [email protected]
Central Office1046 Baker RoadDexter, MI 48130Tel. +1 734 253-9428
East Coast Office25 South Street, Suite AHopkinton, MA 01748Tel. +1 508 417-1040
Polytec South-East Asia Pte LtdBlk 4010 Ang Mo Kio Ave 10#06-06 TechPlace 1Singapore 569626Tel. +65 6451 [email protected]
Polytec China Ltd.Room 1026, Hanwei PlazaNo. 7 Guanghua RoadChaoyang District 100004 BeijingTel. +86 10 [email protected]
www.polytec.comTech
nic
al s
pec
ifica
tion
s ar
e su
bje
ct t
o ch
ang
e w
ith
out
not
ice.
OM
_In
Focu
s_20
14_1
0_2
200
_E_4
2332
ImprintPolytec InFocus · Optical Measurement SolutionsIssue 2014 – ISSN 1864-9203 · Copyright © Polytec GmbH, 2014Polytec GmbH · Polytec-Platz 1 - 7 · 76337 Waldbronn · Germany
CEO/Publisher: Dr. H. SelbachEditorial Staff/Production: Dr. Philipp Hassinger,
Melanie Ohmer, David Oliver
Advancing Measurements by Light
Events
Images courtesy: Page 10: Shutterstock.com; Page 23: Maridav/Shutterstock.com; Page 41: ©creaseo/fotolia.com; Images courtesy of the authors unless otherwise specified.
Date Event Location
Oct 28 - 30, 2014 Automotive Testing Expo 2014 Novi, MI
Oct 29 - 30, 2014 International Automotive Body Congress Troy, MI
Nov 17 - 19, 2014 Eastern Analytical Symposium & Exposition Somerset, NJ
Dec 4, 2014 MBL: Workshop on “Quality control, condition monitoring and predictive maintenance“
Brussels, Netherlands
Events
Expertise for RentSystems and Engineering Services
Follow us online at:
Whether your measurement task involves general vibration testing, structural dynamics characterization, acoustic localization, finite element model validation or surface metrology – our experienced PolyXperts are always happy to take care of your needs, be they occasional or long term. Address your individual measurement tasks cost-effectively and productively by using our advanced systems and engineering services.
ADVANTAGES: ■ Access to the latest in non-contact measurement technology
■ Short term or occasional measurement
■ Improved data quality ■ Fast response to critical characterization requirements
Tests can be performed in one of our state-of-the-art engineering centers and testfacilities or at the convenience of your facility. Please contact us at 949-943-3033 or send us an email at [email protected].