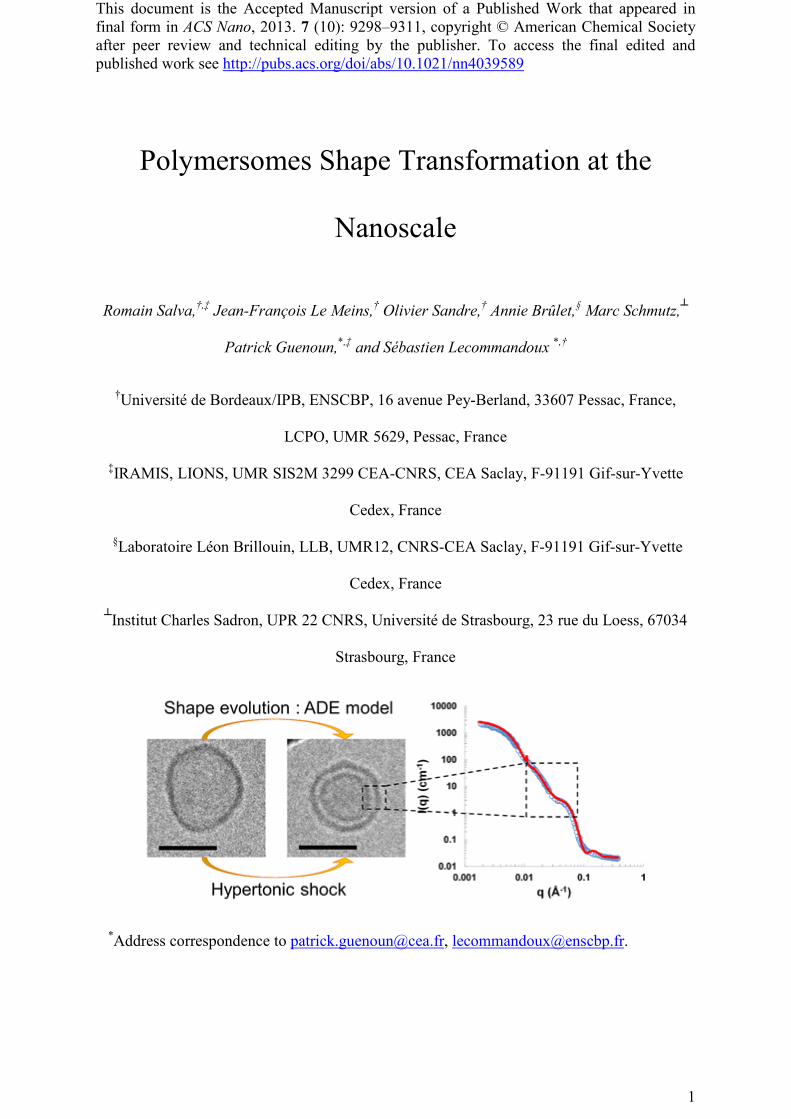
Polymersomes Shape Transformation at the Nanoscale
47
This document is the Accepted Manuscript version of a Published Work that appeared in final form in ACS Nano, 2013. 7 (10): 9298–9311, copyright © American Chemical Society after peer review and technical editing by the publisher. To access the final edited and published work see http://pubs.acs.org/doi/abs/10.1021/nn4039589 1 Polymersomes Shape Transformation at the Nanoscale Romain Salva, †,‡ Jean-François Le Meins, † Olivier Sandre, † Annie Brûlet, § Marc Schmutz, ┴ Patrick Guenoun, *,‡ and Sébastien Lecommandoux *,† † Université de Bordeaux/IPB, ENSCBP, 16 avenue Pey-Berland, 33607 Pessac, France, LCPO, UMR 5629, Pessac, France ‡ IRAMIS, LIONS, UMR SIS2M 3299 CEA-CNRS, CEA Saclay, F-91191 Gif-sur-Yvette Cedex, France § Laboratoire Léon Brillouin, LLB, UMR12, CNRS-CEA Saclay, F-91191 Gif-sur-Yvette Cedex, France ┴ Institut Charles Sadron, UPR 22 CNRS, Université de Strasbourg, 23 rue du Loess, 67034 Strasbourg, France * Address correspondence to [email protected], [email protected].
Transcript of Polymersomes Shape Transformation at the Nanoscale
This document is the Accepted Manuscript version of a Published Work that appeared in final form in ACS Nano, 2013. 7 (10): 9298–9311, copyright © American Chemical Society after peer review and technical editing by the publisher. To access the final edited and published work see http://pubs.acs.org/doi/abs/10.1021/nn4039589
1
Polymersomes Shape Transformation at the
Nanoscale
Romain Salva,†,‡ Jean-François Le Meins,† Olivier Sandre,† Annie Brûlet,§ Marc Schmutz,┴
Patrick Guenoun,*,‡ and Sébastien Lecommandoux *,†
†Université de Bordeaux/IPB, ENSCBP, 16 avenue Pey-Berland, 33607 Pessac, France,
LCPO, UMR 5629, Pessac, France
‡IRAMIS, LIONS, UMR SIS2M 3299 CEA-CNRS, CEA Saclay, F-91191 Gif-sur-Yvette
Cedex, France
§Laboratoire Léon Brillouin, LLB, UMR12, CNRS-CEA Saclay, F-91191 Gif-sur-Yvette
Cedex, France
┴Institut Charles Sadron, UPR 22 CNRS, Université de Strasbourg, 23 rue du Loess, 67034
Strasbourg, France
*Address correspondence to [email protected], [email protected].
This document is the Accepted Manuscript version of a Published Work that appeared in final form in ACS Nano, 2013. 7 (10): 9298–9311, copyright © American Chemical Society after peer review and technical editing by the publisher. To access the final edited and published work see http://pubs.acs.org/doi/abs/10.1021/nn4039589
2
ABSTRACT: Polymer vesicles, also named polymersomes, are valuable candidates for drug
delivery and micro or nano-reactors applications. As far as drug delivery is concerned, the
shape of the carrier is believed to have a strong influence on the biodistribution and cell
internalization. Polymersomes can be submitted to an osmotic imbalance when injected in
physiological media leading to morphological changes. To understand these osmotic stress-
induced variations in membrane properties and shapes, several nano-vesicles made of the
graft polymer poly(dimethylsiloxane)-g-poly(ethylene oxide) (PDMS-g-PEO) or the triblock
copolymer PEO-b-PDMS-b-PEO were osmotically stressed and observed by light scattering,
neutron scattering (SANS) and cryo-transmission electron microscopy (cryo-TEM).
Hypotonic shock leads to a swelling of the vesicles, comparable to optically observable giant
polymersomes, and hypertonic shock leads to collapsed structures such as stomatocytes and
original nested vesicles the latter being only observed for diblocks. Complementary SANS
and cryo-TEM experiments are shown to be in quantitative agreement and highlight the
importance of the membrane structure on the behavior of these nano-polymersomes under
hypertonic conditions as the final morphology reached depends whether or not the
copolymers assemble into a bilayer. The vesicle radius and membrane curvature are also
shown to be critical parameters for such transformations: the shape evolution trajectory
agrees with theoretical models only for large enough vesicle radii above a threshold value
around four times the membrane thickness.
KEYWORDS: block copolymer, vesicles, polymersomes, shape transformation, osmotic
shock, bi-lamellar membrane, nested vesicles, permeability
This document is the Accepted Manuscript version of a Published Work that appeared in final form in ACS Nano, 2013. 7 (10): 9298–9311, copyright © American Chemical Society after peer review and technical editing by the publisher. To access the final edited and published work see http://pubs.acs.org/doi/abs/10.1021/nn4039589
3
Self-assembly of amphiphilic block
copolymers in aqueous solution is a
versatile and widely used method for the
formation of nanostructures with various
shapes. By structural analogy with viral
capsids, polymeric vesicular structures
(polymersomes)1, 2 are under intense
scrutiny for triggered release drug delivery3,
4 but also for micro or nano-reactors
applications.5-7 Moreover, like lipidic
vesicles (liposomes), polymersomes can be
considered as a simplified model for living
membranes and thus be used for basic
cellular behavior studies.8 Indeed membrane
proteins have been successfully
incorporated in polymersomes membranes9,
10 and hierarchical self-assemblies
mimicking the structure of cells have been
reported.11 In terms of mechanics, the
membrane of polymersomes shows
improved mechanical resistance as
compared to liposomes. As a matter of fact,
the polymeric membrane usually has a
higher bending moduli and lysis strain, and
a lower permeability to both solvent and
solutes.1, 12
One of the next crucial steps for the future
use of polymersomes consists in controlling
their shape. In a biomimetic approach, the
behavior of many cells in physiological
environment is related to their shape and
conformational changes can go along with
severe diseases. As an example, human red
blood cells (RBCs) form a biconcave
discoid shape (discocyte) under healthy
conditions but blood diseases such as
malaria13, 14 or drepanocytosis (formation of
sickle shaped red blood cell) are related to
changes in the RBCs shape. The interaction
between cells and nanoparticles also
depends on the shape of these latter. Indeed,
in addition to nanoparticle’s size that is
obviously a relevant parameter,15, 16 the
shape has been shown to influence their
biodistribution in the body,
pharmacokinetic profile and internalization
pathway, and consequently their
therapeutic and imaging properties.17-20
Other examples exist in the literature on the
This document is the Accepted Manuscript version of a Published Work that appeared in final form in ACS Nano, 2013. 7 (10): 9298–9311, copyright © American Chemical Society after peer review and technical editing by the publisher. To access the final edited and published work see http://pubs.acs.org/doi/abs/10.1021/nn4039589
4
role of osmotic pressure for biological cells,
like the regulation of the plasma membrane
tension by large surface area membrane
proteins acting as “osmo-valves” to protect
the cell against osmotic imbalances,21 or the
production by some fungi spores of osmotic
agents (e.g. glycerol) to pierce the leaves of
plants,22 which more generally remain
turgescent thank to the osmotic pressure of
water acting on their cell walls. As
polymersomes generally present very
selective permeabilities,23 a difference in
permeation rate of species can easily trigger
an osmotic imbalance between the inner and
the outer media, thus potentially inducing
shape modification or even vesicle rupture.
It is then of prime importance to precisely
elucidate this osmotic pressure induced
phenomenon in order to better anticipate
and define the behavior of polymersomes in
complex biological conditions.
The osmotic pressure gradient across a
membrane is related to the difference
between the osmolarity of the internal
medium and the external medium: ΔП =
RT(cint - cext) = RTΔc. In the pioneering
work of E. Boroske and W. Helfrich, the
osmotic shrinkage of giant unilamellar
vesicles (GUV) under hypertonic conditions
(negative osmotic pressure difference ∆Π)
observed as a function of time by optical
microscopy appeared as an efficient method
to measure the permeability constant of
water through the membranes.24 Both lipid
and polymer vesicles have also been shown
to undergo swelling in hypotonic conditions
(positive osmotic pressure difference ∆Π),
leading in some cases to a burst process,25
with a possible reseal of the membrane after
leakage.26, 27 Vesicle behaviors under
hypertonic stress appear to be more
complex. According to experimental and
theoretical studies28, 29 giant unilamellar
liposomes, when exposed to hypertonic
conditions, evolve from spheres into a
variety of non-spherical morphologies, such
as prolate or oblate ellipsoids, stomatocytes
and even into non-axisymmetric starfish
shapes.30, 31 The formation of “raspberry
vesicles” has also been reported for DOPC
This document is the Accepted Manuscript version of a Published Work that appeared in final form in ACS Nano, 2013. 7 (10): 9298–9311, copyright © American Chemical Society after peer review and technical editing by the publisher. To access the final edited and published work see http://pubs.acs.org/doi/abs/10.1021/nn4039589
5
(1,2-dioleoyl-sn-glycero-3-
phosphocholine),32 DOPG
(dioleoylphosphatidylglycerol)33 and EPC
(egg phosphatidylcholine)34 GUVs in such
conditions due to the excess surface
membrane area appearing while volume
shrinking and the outward flow-rate of
water. All these morphological changes are
enabled by the fluidity of the phospholipid
bilayer membranes above their main chain
transition temperature. An interesting
response to hypertonic stresses has been
reported for micro-sized catanionic vesicles
of icosahedral symmetry by Carrière et al.35
They observed that when incubated in a
hypertonic solution above a hypertonicity
threshold (below 1 mOsm) the icosahedral
vesicles progressively collapsed until
complete buckling. During the last stages of
buckling, the encapsulated material was
released due to the rupture of the bilayer
membrane. SANS experiments and
theoretical calculations indicate that this
rupture is predominantly governed by
curvature and happens when the radius of
curvature is comparable to the membrane
thickness.
Polymersomes are believed to undergo
similar shape transformations than
liposomes if the polymer chains in the
membrane possess enough mobility in the
experimental conditions.1, 36, 37 However,
even with a membrane formed with a
hydrophobic block of low glass transition
temperature Tg, several behaviors were
reported depending on the polymer nature
and architecture. The formation of raspberry
vesicles was observed for PDMS-g-PEO
(poly(dimethylsiloxane)-g-poly(ethylene
oxide)) and PBut-b-PEO (polybutadiene-b-
poly(ethylene oxide)) giant vesicles but
non-axisymmetric shape deformations,
faceting, or bursting were also evidenced.26
Lorenceau et al. reported a collapsed
structure for PBA-b-PAA (poly(n-butyl
acrylate)-b-poly(acrylic acid)) giant vesicles
in similar hypertonic conditions.38 Whereas
the thinnest possible membrane of a
liposome is always a bilayer made of two
lipid leaflets, polymersomes self-assemble
This document is the Accepted Manuscript version of a Published Work that appeared in final form in ACS Nano, 2013. 7 (10): 9298–9311, copyright © American Chemical Society after peer review and technical editing by the publisher. To access the final edited and published work see http://pubs.acs.org/doi/abs/10.1021/nn4039589
6
from amphiphilic copolymers into either a
bilayer (for diblock or graft copolymers) or
a monolayer (for triblocks or even random
copolymers). We will see in the following
that the membrane structure can strongly
affect the vesicle transformations under
osmotic shocks.
The vesicle size (related to the radius of
curvature of membrane) is actually another
additional important factor. Concerning
smaller liposomes, instead of the formation
of raspberry-like vesicles observed for
GUVs, a shape transition from spherical to
oblate vesicles in hypertonic conditions has
been reported for different phospholipids
(DOPC, EPC).39,40 Studies on DODAB
(dioctadecyldimethylammonium bromide)
small unilamellar (SUV) liposomes 41 and
DODAC (dioctadecyldimethylammonium
chloride) SUVs 42 have also shown that the
neutral or charged character of the osmotic
agent used has an influence on the final
morphology. On the one hand, when
exposed to a hypertonic media containing
CaCl2, these unilamellar vesicles deflated
into a stomatocyte shape – i.e. concave
vesicles shaped like a stomach. As the
electrostatic double layer thickness of the
membrane was strongly decreased by the
high ionic strength of the divalent salt, the
repulsion between the cationic charges of
the bilayers was screened, and the edges of
the stomatocyte progressively approached
each other until they fused into a non-
reversible bi-lamellar twinned vesicle. On
the other hand, a sucrose hypertonic
medium only led to “lens-like” deflated
structures, as the prerequisites to allow the
approach and fusion of the edges were not
fulfilled. B. Pitard et al. who studied DNA
encapsulation in liposomes (lipoplex) did a
control experiment by submitting pure
liposomes to a hyperosmotic concentration
gradient of NaCl (cext-cint = 150 mM),43 that
led to the formation of bi-lamellar vesicles
out of unilamellar ones, some of them being
elongated (Figure 4B and 4C of this
reference).
Concerning nanosize polymersomes, only
a few reports are available in the literature.
This document is the Accepted Manuscript version of a Published Work that appeared in final form in ACS Nano, 2013. 7 (10): 9298–9311, copyright © American Chemical Society after peer review and technical editing by the publisher. To access the final edited and published work see http://pubs.acs.org/doi/abs/10.1021/nn4039589
7
Kim et al. studied the shape transformation
of PS-b-PEO (polystyrene-b-poly(ethylene
oxide)) polymersomes.44 They evidenced
that a partial deflation of these vesicles
changes their shape from spheres to
stomatocytes, as observed for DODAB
liposomes. Surprisingly, no twinned
vesicles but collapsed vesicles (the so-called
“kippah” morphologies)45 were observed
when the volume was further decreased.46
It is thus becoming obvious that osmotic-
induced stresses are able to shape the
polymersomes in different ways.
Understanding the parameters that control
these morphological changes in such
conditions is then necessary to precisely
design polymersomes as drug delivery
devices or cell-mimicking assemblies of
precise shapes and anticipate their behavior
in complex biological media. In this
context, we were interested in describing
how the copolymer architecture – grafted
versus triblock – and thus the membrane
structure – bilayer versus monolayer –
influence these deformations. In particular,
we will evidence in the following that fluid
polymersomes made of a graft copolymer
transform into original bi-lamellar “double”
polymersomes after intermediate
stomatocyte formation and ultimate
membrane fusion. On the contrary for
vesicles made of a triblock copolymer, no
such double polymersomes were found,
presumably due to the polymer architecture
that disfavors the membrane fusion.
Interestingly, these results are obtained by
two independent complementary
experimental approaches in order to avoid
multiple artifacts. One is cryo-transmission
electron microscopy (cryo-TEM) for direct
imaging of the geometrical shape of the
objects, and the other is small angle neutron
scattering (SANS) to measure better
averaged nanoscopic dimensions of the
objects through an appropriate model. This
work is therefore original by giving a very
precise and quantitative insight on the
relationship between vesicular shape
transformation and macromolecular design.
This document is the Accepted Manuscript version of a Published Work that appeared in final form in ACS Nano, 2013. 7 (10): 9298–9311, copyright © American Chemical Society after peer review and technical editing by the publisher. To access the final edited and published work see http://pubs.acs.org/doi/abs/10.1021/nn4039589
8
Results and Discussion.
Polymersomes under hyper and
hypotonic conditions observed by DLS.
Changes in apparent hydrodynamic radii of
PDMS-g-PEO and PEO-b-PDMS-b-PEO
vesicles upon osmotic shocks have been
measured by DLS on samples at 1 mg/mL.
The vesicles were prepared at 10 mg/mL –
based on procedures described in the
experimental part – and their initial
hydrodynamic size (R0) was measured on
samples diluted by an isotonic aqueous
solution (à virer car le 1M sème la
confusion: c’est expliqué dans les
procedures). The second hydrodynamic
radius measurement (RH), done one hour
after applying the shock by adjusting the
external glucose concentration, allowed
determining any changes in size induced by
the osmotic pressure. Vesicles were always
submitted to a single osmotic shock with no
consecutive changes of the external
medium.
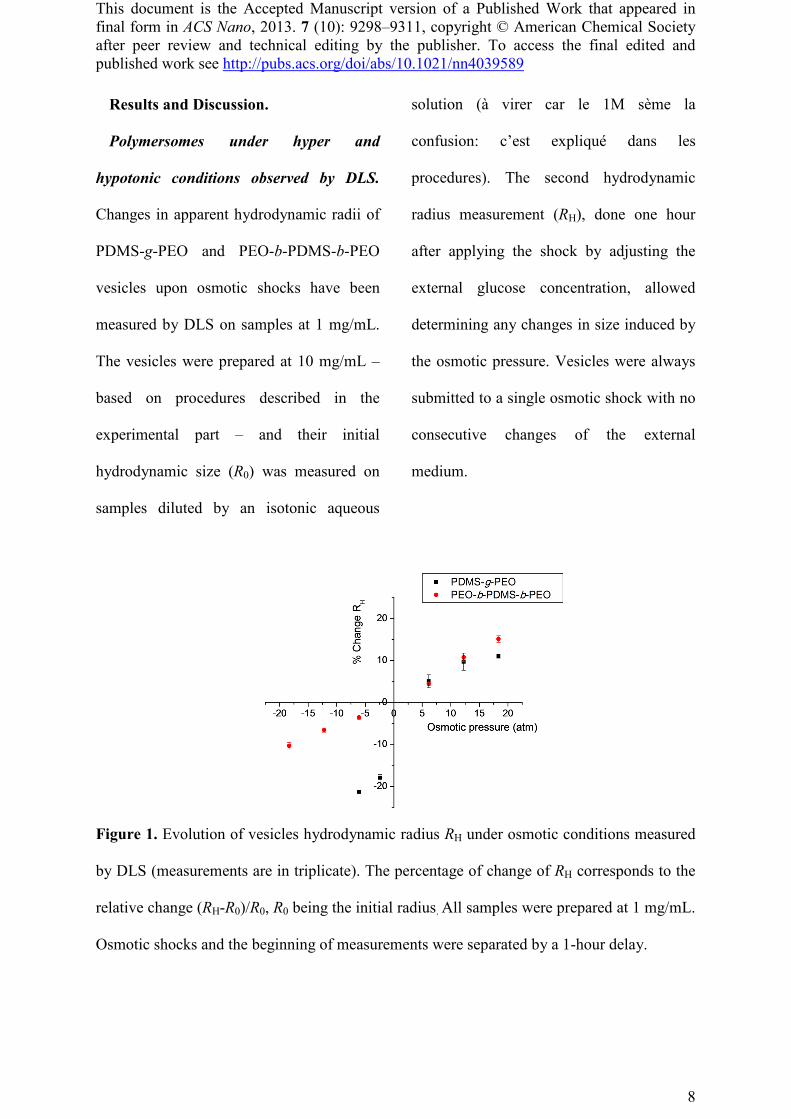
Figure 1. Evolution of vesicles hydrodynamic radius RH under osmotic conditions measured
by DLS (measurements are in triplicate). The percentage of change of RH corresponds to the
relative change (RH-R0)/R0, R0 being the initial radius. All samples were prepared at 1 mg/mL.
Osmotic shocks and the beginning of measurements were separated by a 1-hour delay.

This document is the Accepted Manuscript version of a Published Work that appeared in final form in ACS Nano, 2013. 7 (10): 9298–9311, copyright © American Chemical Society after peer review and technical editing by the publisher. To access the final edited and published work see http://pubs.acs.org/doi/abs/10.1021/nn4039589
9
Table 1. Hydrodynamic radius (RH) and polydispersity index under several osmotic
conditions measured by DLS.
Shock Hypertonic Isotonic Hypotonic
Δc (mM) -750 -500 -250 -100 0 250 500 750
ΔΠ (atm) -18.3 -12.2 -6.1 -2.4 0 6.1 12.2 18.3
Sample Hydrodynamic radius RH (nm) and polydispersity index
PDMS-g-PEO - - 42.8 ± 0.1 (0.06)
44.6 ± 0.4 (0.09)
54.4 ± 0.5 (0.05) - - -
- - - - 44.6 ± 0.5 (0.04)
46.8 ± 0.7 (0.03)
48.9 ± 0.9 (0.03)
49.5 ± 0.2 (0.03)
PEO-b-PDMS-b-PEO 44.2 ± 0.4 (0.06)
46.1 ± 0.3 (0.06)
47.6 ± 0.3 (0.06) - 49.3 ± 0.3
(0.05) - - -
- - - - 50.3 ± 0.6 (0.14)
52.5 ± 0.2 (0.11)
55.7 ± 0.5 (0.14)
57.9 ± 0.4 (0.12)
The evolution of the vesicles
hydrodynamic radii upon positive or
negative osmotic shocks shown in Figure 1
confirmed that hypertonic stresses resulted
into a shrinking of the vesicles and
hypotonic stresses into a swelling. PDMS-
g-PEO vesicles were the most responsive in
hypertonic conditions, changes in diameter
reached -21.3% as compare to the ∼ -10%
for the triblock copolymer vesicles even
though the applied osmotic pressure was
higher. The sudden drop of radius observed
for the former vesicles, even at a hypertonic
pressure of 2 atm, could be attributed to the
morphological transformation from
unilamellar to bilamellar vesicles. The
vesicles adjust their internal volume in
response to osmotic shocks by water
transfer through the membrane.24, 26 In
hypotonic conditions, the solute
concentration inside the vesicle was higher
than in the external medium, so that water
came into the vesicle, resulting into a
swelling. On the contrary, in hypertonic
conditions water was pushed out of the
vesicles, resulting into a decrease of their
diameter. It necessarily implies an excess of
surface membrane area, but the membrane
reorganization cannot be appreciated by
light scattering results only since a true
This document is the Accepted Manuscript version of a Published Work that appeared in final form in ACS Nano, 2013. 7 (10): 9298–9311, copyright © American Chemical Society after peer review and technical editing by the publisher. To access the final edited and published work see http://pubs.acs.org/doi/abs/10.1021/nn4039589
10
interpretation of a hydrodynamic radius is
function of the object shape. In order to get
more insight on the structural changes at
nanoscale induced by an osmotic stress,
vesicles under such conditions were further
studied by cryo-TEM and SANS. Under
hypotonic shocks, neither membrane
thickening nor significant changes of
vesicle radii for PDMS-g-PEO vesicular
solutions were observed by SANS (curves
shown in Electronic Supporting
Information, Fig. S1b). In the following, we
then focus on the structural changes upon
hypertonic conditions. For PDMS-g-PEO
vesicles, that were the more responsive to
changes, hypertonic glucose concentration
gradients chosen were 100 mM and 250
mM (equivalent to the external solution
osmolarity as vesicles were originally
water-filled). For the triblock copolymer,
250 mM and 750 mM hypertonic conditions
were selected. The equivalent osmotic
pressures are higher than conditions usually
encountered in natural media (of order ??)
but were chosen to better evidence the
influence of membrane parameters on the
shape evolution.
PDMS-g-PEO structural changes in
hypertonic conditions. Figure 2-A shows
typical cryo-TEM image of PDMS-g-PEO
vesicles in their native state (isotonic
conditions, i.e. pure water). Vesicles
appeared to be polydisperse in size and
shape, a non-negligible part of them being
found anisotropic as evidenced by the
aspect ratio distribution. This is likely an
effect of the extrusion step as already
reported for lipidic systems,47 where
vesicles larger than the pore size are
deformed while passing through the
extrusion filter and eventually break up.
Once on the other side of the filter, they
reseal but can retain an anisotropic shape
due to the excess of surface membrane area.
A statistical study (over a number of
structures n = 148) revealed that 96% of the
objects were unilamellar vesicles. Indeed,
the difference between simple (unilamellar)
and double (bi-lamellar) membrane is clear
on cryo-TEM images, since silicon atoms of
This document is the Accepted Manuscript version of a Published Work that appeared in final form in ACS Nano, 2013. 7 (10): 9298–9311, copyright © American Chemical Society after peer review and technical editing by the publisher. To access the final edited and published work see http://pubs.acs.org/doi/abs/10.1021/nn4039589
11
PDMS provide an electron scattering
density sufficiently different from the
carbon and oxygen atoms of PEO. The
experimental uncertainty, determined by
measuring several times the same
membrane thickness, was below one
nanometer. An average membrane thickness
of 5.4 ± 0.6 nm (number of measurements n
= 50) was measured, in good agreement
with the value of about 5 nm reported in
literature for PDMS-g-PEO unilamellar
vesicles.48
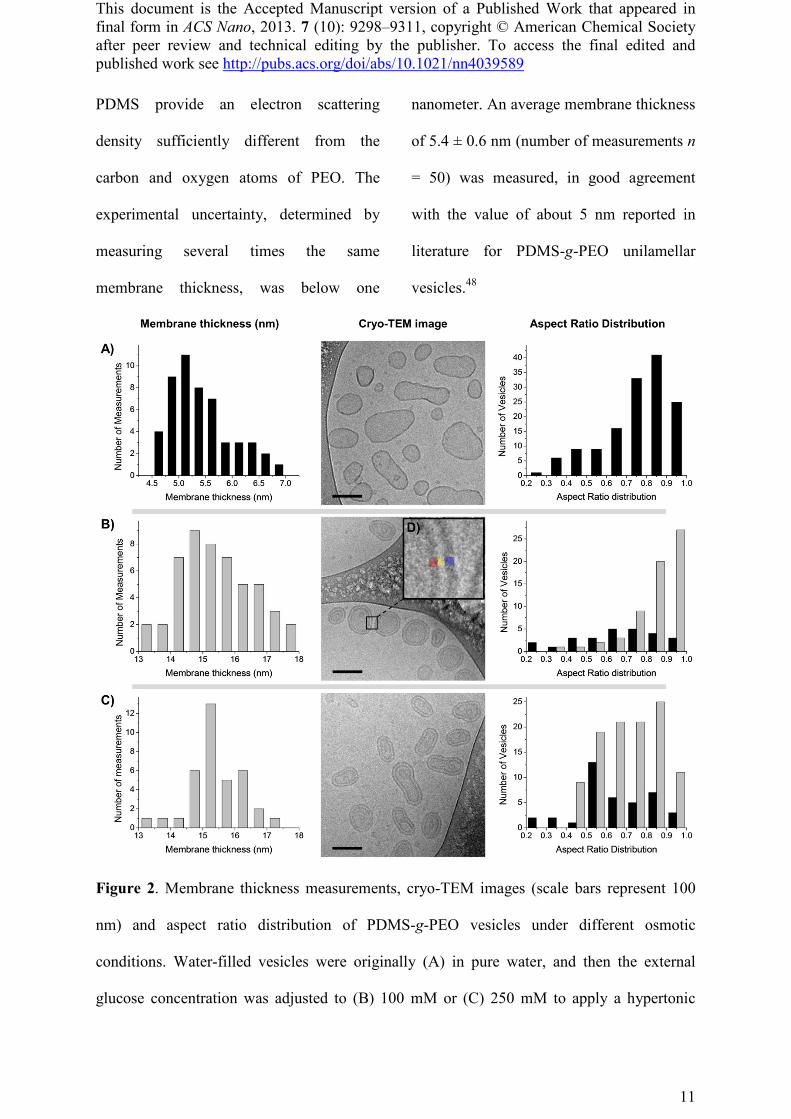
Figure 2. Membrane thickness measurements, cryo-TEM images (scale bars represent 100
nm) and aspect ratio distribution of PDMS-g-PEO vesicles under different osmotic
conditions. Water-filled vesicles were originally (A) in pure water, and then the external
glucose concentration was adjusted to (B) 100 mM or (C) 250 mM to apply a hypertonic
This document is the Accepted Manuscript version of a Published Work that appeared in final form in ACS Nano, 2013. 7 (10): 9298–9311, copyright © American Chemical Society after peer review and technical editing by the publisher. To access the final edited and published work see http://pubs.acs.org/doi/abs/10.1021/nn4039589
12
shock. On all diagrams, black columns represent unilamellar vesicles and grey columns
represent bi-lamellar nested vesicles. For samples in hypertonic conditions (B and C), the
membrane thickness was measured on nested vesicles and represents the total width
including the two polymer layers and the water gap (d tot). (D) Insert: zoom on the vesicle
membrane. The red area corresponds to the internal shell thickness δi, the yellow one to the
water gap Dw and the blue one to the external shell thickness δe. Using the ImageJ software,
the projection of vesicles in the observation plane were approximated by ellipsoids of semi-
major axis a, semi-minor axis b, thus aspect ratio K=b/a.
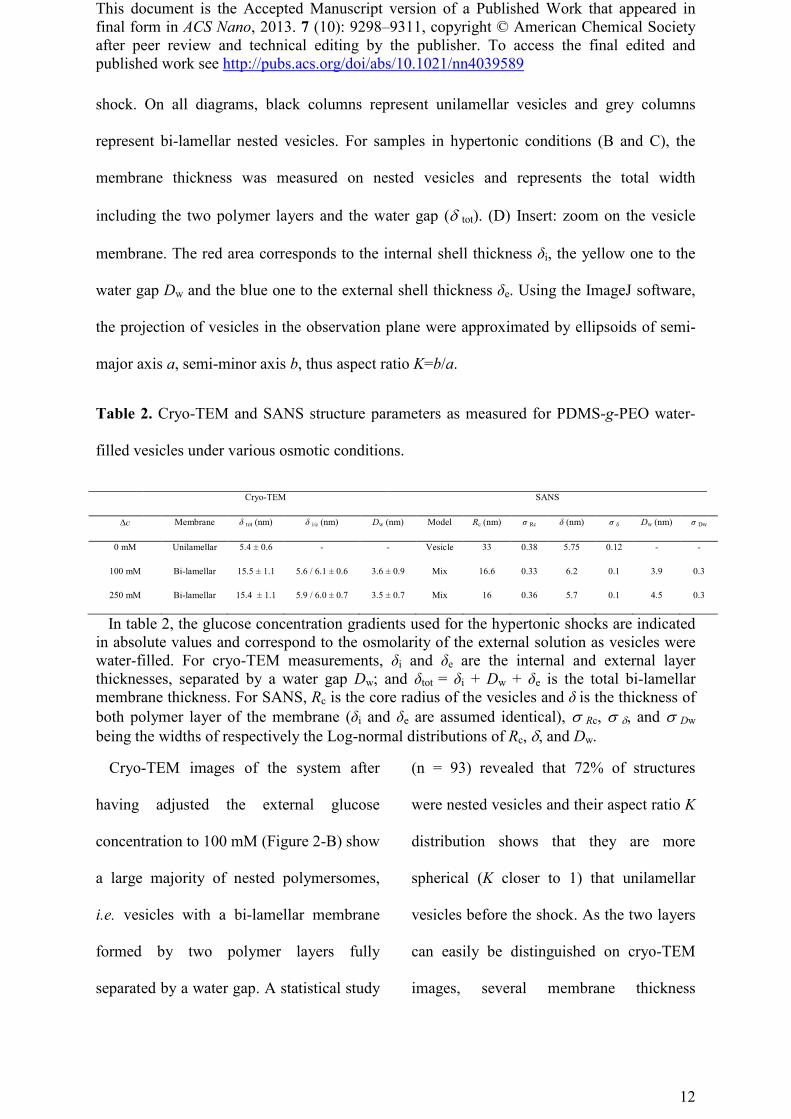
Table 2. Cryo-TEM and SANS structure parameters as measured for PDMS-g-PEO water-
filled vesicles under various osmotic conditions.
Cryo-TEM SANS
∆c Membrane δ tot (nm) δ i/e (nm) Dw (nm) Model Rc (nm) σ Rc δ (nm) σ δ Dw (nm) σ Dw
0 mM Unilamellar 5.4 ± 0.6 - - Vesicle 33 0.38 5.75 0.12 - -
100 mM Bi-lamellar 15.5 ± 1.1 5.6 / 6.1 ± 0.6 3.6 ± 0.9 Mix 16.6 0.33 6.2 0.1 3.9 0.3
250 mM Bi-lamellar 15.4 ± 1.1 5.9 / 6.0 ± 0.7 3.5 ± 0.7 Mix 16 0.36 5.7 0.1 4.5 0.3
In table 2, the glucose concentration gradients used for the hypertonic shocks are indicated in absolute values and correspond to the osmolarity of the external solution as vesicles were water-filled. For cryo-TEM measurements, δi and δe are the internal and external layer thicknesses, separated by a water gap Dw; and δtot = δi + Dw + δe is the total bi-lamellar membrane thickness. For SANS, Rc is the core radius of the vesicles and δ is the thickness of both polymer layer of the membrane (δi and δe are assumed identical), σ Rc, σ d, and σ Dw being the widths of respectively the Log-normal distributions of Rc, d, and Dw.
Cryo-TEM images of the system after
having adjusted the external glucose
concentration to 100 mM (Figure 2-B) show
a large majority of nested polymersomes,
i.e. vesicles with a bi-lamellar membrane
formed by two polymer layers fully
separated by a water gap. A statistical study
(n = 93) revealed that 72% of structures
were nested vesicles and their aspect ratio K
distribution shows that they are more
spherical (K closer to 1) that unilamellar
vesicles before the shock. As the two layers
can easily be distinguished on cryo-TEM
images, several membrane thickness
This document is the Accepted Manuscript version of a Published Work that appeared in final form in ACS Nano, 2013. 7 (10): 9298–9311, copyright © American Chemical Society after peer review and technical editing by the publisher. To access the final edited and published work see http://pubs.acs.org/doi/abs/10.1021/nn4039589
13
measurements were carried out (figure 2-
D). Internal and external thicknesses of
shells, respectively di = 5.6 ± 0.6 nm and de
= 6.1 ± 0.6 nm (n = 50), were found similar
to the membrane thickness of unilamellar
vesicles determined before applying a
hypertonic shock (Table 2). The distance
between these two shells was found rather
constant at a value Dw = 3.6 ± 0.9 nm.
Then, the total bi-lamellar membrane
thickness was found to be dtot = di + Dw + de
= 15.5 ± 1.1 nm. Vesicles that stayed
unilamellar, about 28%, were stretched out
and appear to be smaller than nested
vesicles on cryo-TEM images, as confirmed
by the initial radius calculation presented
later on.
The strongest applied hypertonic shock
(Figure 2-C), with a glucose concentration
gradient of 250 mM, led to a similar
vesicles population distribution since nested
vesicles represented 74% of the structures
observed (n = 151) and the remaining
unilamellar vesicles 26%. Membrane
thicknesses measurements (n = 38) also
gave results similar to the hypertonic shock
with a 100 mM glucose solution as external
medium (Table 2). The main difference,
confirmed by the aspect ratio K distribution,
is that these nested vesicles were now
stretched out and not spherical anymore.
Observation of nested polymersome
structures in such conditions is in agreement
with DLS measurements provided that the
change in shape is taken into account to
recalculate the external diameter and
compare it to the initial hydrodynamic
radius. Using measured membrane
parameters and from pure geometrical
considerations, one can indeed calculate the
decrease in external radius of unilamellar
vesicles that would undergo these
morphological changes, the parameter set
constant being the surface membrane area.
For an initial radius R0 of 54 nm, a polymer
layer thickness of 5.5 nm and 3.5 nm
between the shells after transformation, it
would result in a 21.5% decrease of the
external radius. This value is in good
agreement with the decrease in
This document is the Accepted Manuscript version of a Published Work that appeared in final form in ACS Nano, 2013. 7 (10): 9298–9311, copyright © American Chemical Society after peer review and technical editing by the publisher. To access the final edited and published work see http://pubs.acs.org/doi/abs/10.1021/nn4039589
14
hydrodynamic radius measured by DLS –
17.9% and 21.3% for the 100 mM and 250
mM hypertonic shocks respectively.
These bi-lamellar vesicles were further
investigated using SANS, in order to obtain
a more detailed analysis of the membrane
characteristics at nanoscale averaged on
many objects and to rule out any cryo-TEM
preparation artifact or statistical bias. Figure
3-A shows the scattered intensity per unit
volume for PDMS-g-PEO vesicles in their
preparation media, i.e. pure D2O at room
temperature. The vesicular morphology of
this sample is characterized by the q-2
decrease of the SANS intensity in the
intermediate q values regime. In such
conditions, the experimental data were
fitted with a polydisperse hollow sphere
form factor using the SasView program
(http://www.sasview.org/) using a proper
weighting of the hollow sphere form factor
(1) by the volumes (2) with Log-normal
distribution laws of both the core radius Rc
and of the membrane thickness d (3). The
form factor (tending towards 1 when q→0)
is given by :49
( )( ) ( )
( )( ) ( )
( )e c
e c
2
e e e c c cc e 2 3 3
e c
sin cos sin cos9( , , ) R R
R R
qR qR qR qR qR qRP q R R V V
qR qRV V
− −= −
− (1)
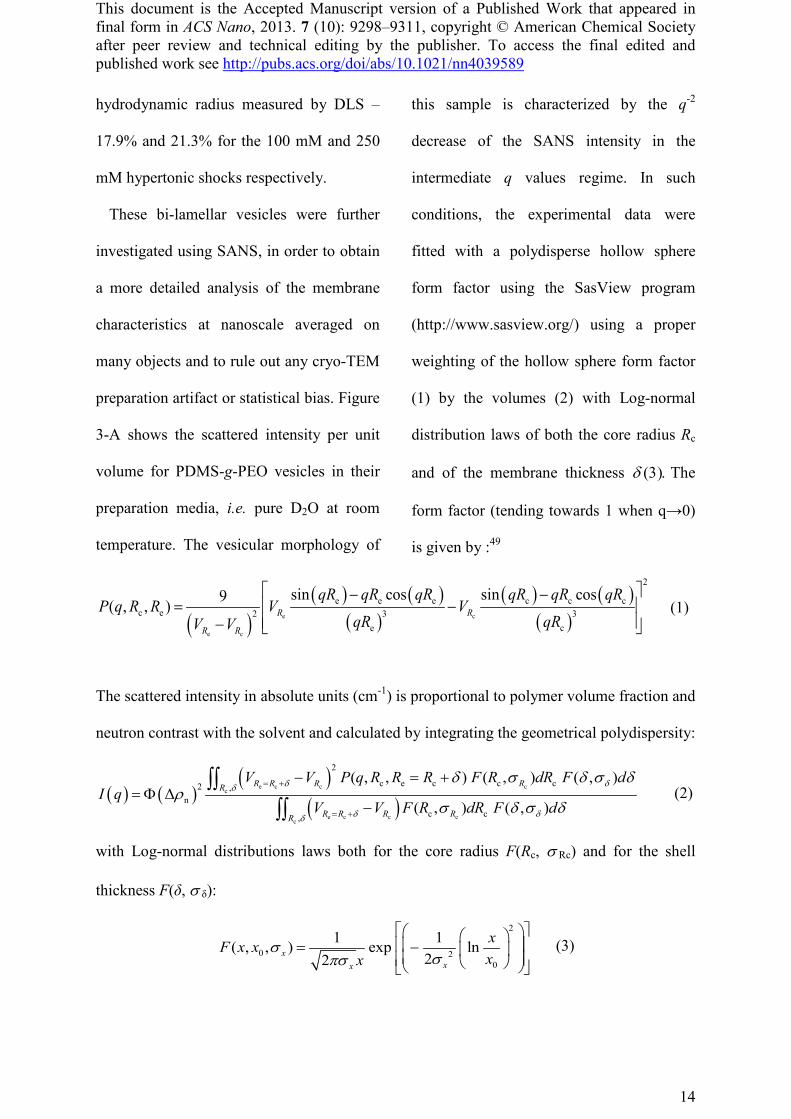
The scattered intensity in absolute units (cm-1) is proportional to polymer volume fraction and
neutron contrast with the solvent and calculated by integrating the geometrical polydispersity:
( ) ( )( )
( )e c c c
c
e c c cc
2
c e c c c2 ,n
c c,
( , , ) ( , ) ( , )Δ
( , ) ( , )
R R R RR
R R R RR
V V P q R R R F R dR F dI q
V V F R dR F d
d dd
d dd
d σ d σ dρ
σ d σ d
= +
= +
− = += F
−
∫∫∫∫
(2)
with Log-normal distributions laws both for the core radius F(Rc, σ Rc) and for the shell
thickness F(δ, σ δ):
2
0 20
1 1( , , ) exp ln22x
xx
xF x xxx
σσpσ
= − (3)
This document is the Accepted Manuscript version of a Published Work that appeared in final form in ACS Nano, 2013. 7 (10): 9298–9311, copyright © American Chemical Society after peer review and technical editing by the publisher. To access the final edited and published work see http://pubs.acs.org/doi/abs/10.1021/nn4039589
15
In these formulas, Rc and Re = Rc + d
respectively correspond to the core radius
and the external radius of the shell, and
VRc(VRe) is the volume of the sphere of
radius Rc(Re). For q→0, the intensity I(q)
tends towards
( ) ( ) ( )e c c e c c
22n0 Δ R R R R R RqI q V V V Vd dρ = + = +→→ F − −
where the brackets represent statistical
averages. All scattering objects are
considered to be PDMS shells, with a
scattering length density SLDPDMS =
6.37×10⁻⁸ Å-2, into a D2O media of SLDD2O
= 6.35×10⁻⁶ Å-2. The polydispersity in shape
and size, revealed by cryo-TEM analysis,
cannot be distinguished with this technique
so resulted in a weak influence of the
vesicle radius value on the quality of the
fits. On the contrary, the fit results were
very sensitive to the membrane parameters
(its median thickness δ, and standard width
of the Log-normal distribution, σd). The
best results, summarized in Table 2, are
obtained for a core radius Rc = 33 nm (σRc =
0.38) and a membrane thickness δ = Re–Rc=
5.75 nm (σd = 0.12), which agrees well with
cryo-TEM observations, and also confirms
that vesicles were mostly unilamellar after
the extrusion process.
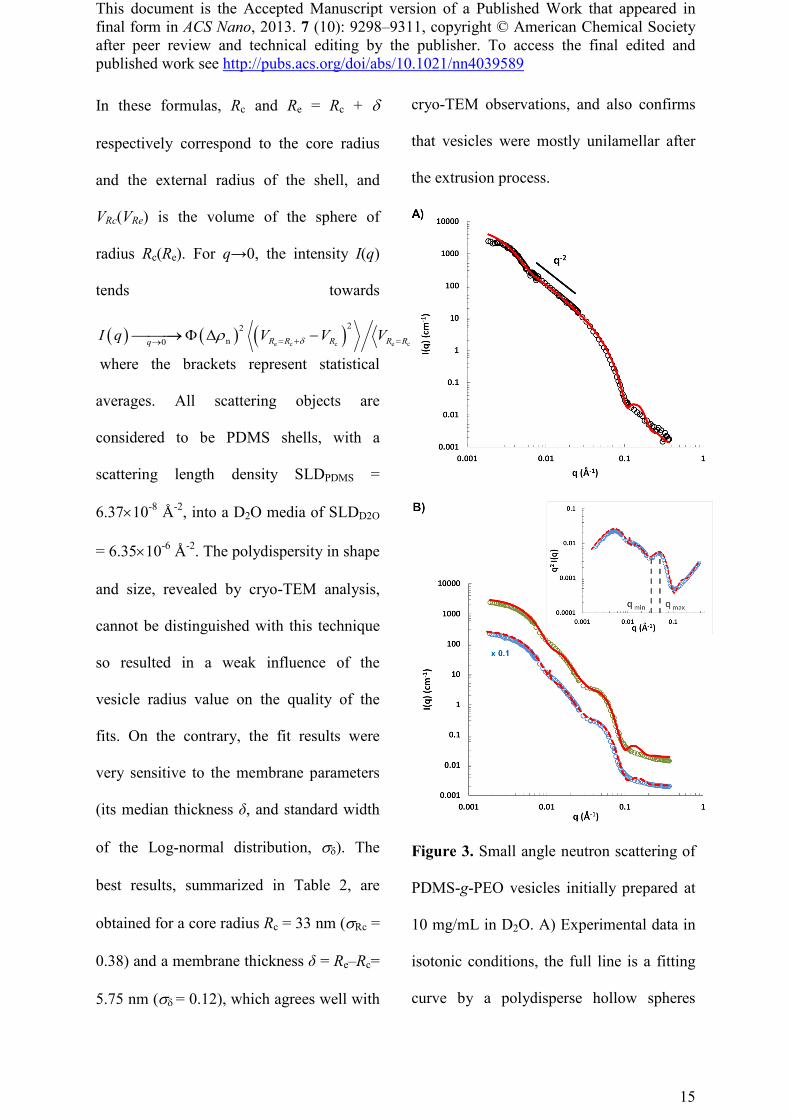
Figure 3. Small angle neutron scattering of
PDMS-g-PEO vesicles initially prepared at
10 mg/mL in D2O. A) Experimental data in
isotonic conditions, the full line is a fitting
curve by a polydisperse hollow spheres
This document is the Accepted Manuscript version of a Published Work that appeared in final form in ACS Nano, 2013. 7 (10): 9298–9311, copyright © American Chemical Society after peer review and technical editing by the publisher. To access the final edited and published work see http://pubs.acs.org/doi/abs/10.1021/nn4039589
16
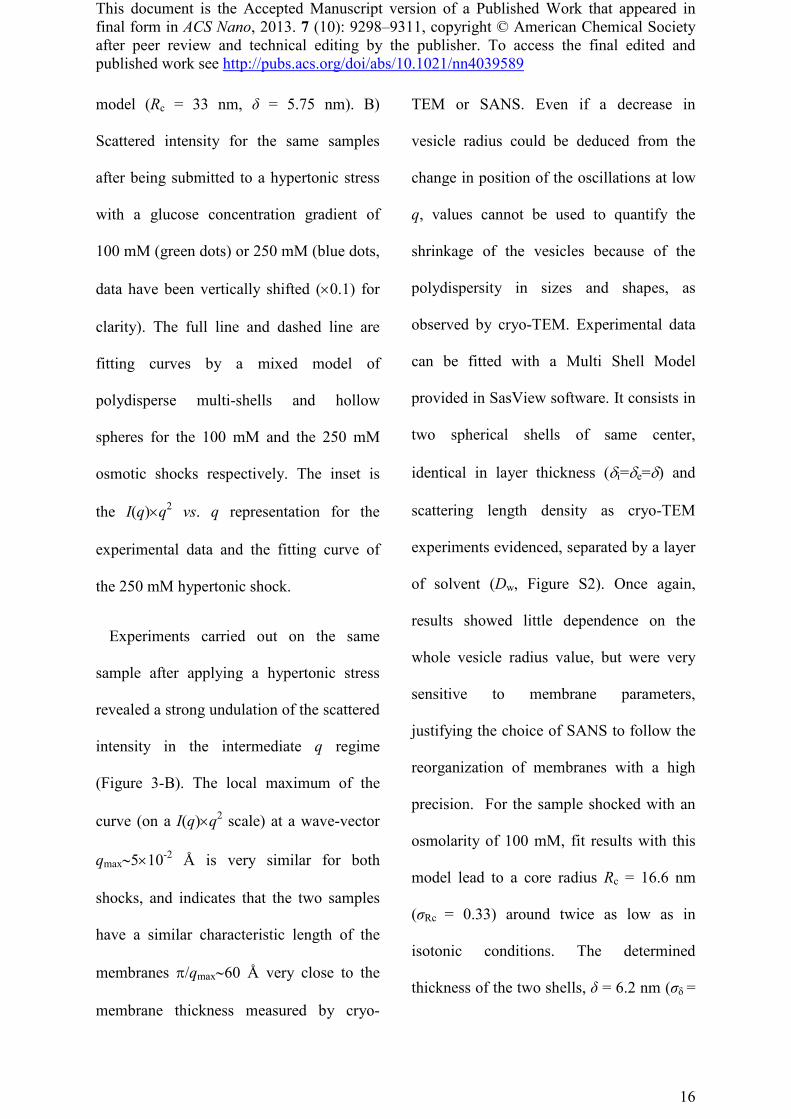
model (Rc = 33 nm, δ = 5.75 nm). B)
Scattered intensity for the same samples
after being submitted to a hypertonic stress
with a glucose concentration gradient of
100 mM (green dots) or 250 mM (blue dots,
data have been vertically shifted (×0.1) for
clarity). The full line and dashed line are
fitting curves by a mixed model of
polydisperse multi-shells and hollow
spheres for the 100 mM and the 250 mM
osmotic shocks respectively. The inset is
the I(q)×q2 vs. q representation for the
experimental data and the fitting curve of
the 250 mM hypertonic shock.
Experiments carried out on the same
sample after applying a hypertonic stress
revealed a strong undulation of the scattered
intensity in the intermediate q regime
(Figure 3-B). The local maximum of the
curve (on a I(q)×q2 scale) at a wave-vector
qmax∼5×10⁻² Å is very similar for both
shocks, and indicates that the two samples
have a similar characteristic length of the
membranes p/qmax∼60 Å very close to the
membrane thickness measured by cryo-
TEM or SANS. Even if a decrease in
vesicle radius could be deduced from the
change in position of the oscillations at low
q, values cannot be used to quantify the
shrinkage of the vesicles because of the
polydispersity in sizes and shapes, as
observed by cryo-TEM. Experimental data
can be fitted with a Multi Shell Model
provided in SasView software. It consists in
two spherical shells of same center,
identical in layer thickness (di=de=d) and
scattering length density as cryo-TEM
experiments evidenced, separated by a layer
of solvent (Dw, Figure S2). Once again,
results showed little dependence on the
whole vesicle radius value, but were very
sensitive to membrane parameters,
justifying the choice of SANS to follow the
reorganization of membranes with a high
precision. For the sample shocked with an
osmolarity of 100 mM, fit results with this
model lead to a core radius Rc = 16.6 nm
(σRc = 0.33) around twice as low as in
isotonic conditions. The determined
thickness of the two shells, δ = 6.2 nm (σδ =

This document is the Accepted Manuscript version of a Published Work that appeared in final form in ACS Nano, 2013. 7 (10): 9298–9311, copyright © American Chemical Society after peer review and technical editing by the publisher. To access the final edited and published work see http://pubs.acs.org/doi/abs/10.1021/nn4039589
17
0.1), and the distance between them Dw =
3.9 nm (σDw = 0.5) are in excellent
agreement with values measured on cryo-
TEM images. Despite the high
polydispersity of the distance between the
two shells (σDw = 0.5), the amplitude of the
oscillation of the simulated curve in the
intermediate q regime was still too high (too
low intensity at qmin) compare to the
experiment. Therefore, we mixed the two
models (unilamellar and bi-lamellar) to take
into account the presence of remaining
unilamellar vesicles in the sample (as
observed by cryo-TEM on Figure 2-B) and
to achieve a proper fit of the experimental
intensity. The best fit, presented in figure 3-
B, was indeed obtained by adding simulated
curves for unilamellar and nested vesicles
using parameters previously determined by
SANS and cryo-TEM. All fitting
parameters were kept identical for nested
vesicles, except σDw set at 0.3. Unilamellar
vesicles were simulated by a Hollow Sphere
Model with the same radius and membrane
parameters as nested vesicles (but only one
shell), and the proportion of each
population was fixed using the repartition
measured by cryo-TEM: 72% of nested
vesicles and 28% of unilamellar vesicles.
Concerning the sample shocked with an
osmolarity of 250 mM, the best fit is also a
mix of nested (74%) and unilamellar
vesicles (26%). Fitting parameters (Table 2)
are similar to those of the 100 mM
hypertonic shock and confirm that
membranes parameters were the same for
the two hypertonic conditions.
These SANS experiments confirm that
when submitted to a hypertonic stress
ranging from 100 mM to at least 250 mM,
water-filled PDMS-g-PEO unilamellar
vesicles change their structure to form
nested vesicles with a constant distance
between the two polymer layers constituting
the membrane. Membrane parameters
determined by SANS for nested vesicles are
in excellent agreement with the cryo-TEM
experiments and confirm the physical
meaning and robustness of our fits.
Moreover, these results show that statistical
This document is the Accepted Manuscript version of a Published Work that appeared in final form in ACS Nano, 2013. 7 (10): 9298–9311, copyright © American Chemical Society after peer review and technical editing by the publisher. To access the final edited and published work see http://pubs.acs.org/doi/abs/10.1021/nn4039589
18
weights and geometrical parameters
measured independently using cryo-TEM
can be used to fit neutrons scattering
experimental data in a very quantitative
way.
The force driving the shape
transformation during hypertonic shock is
the decrease in the volume of the inner
compartment of the polymersomes. The
Area Difference Elasticity model (ADE)
uses the reduced volume as one of the
critical parameters to predict vesicle shape
transformation upon shrinking and
swelling.29 This reduced volume
corresponds for a given membrane surface
area (A) to the ratio between the inner
volume enclosed by the membrane (V) and
the volume of a sphere with the same area:
v=3(4p)1/2V/A3/2. According to predicted
shape trajectory in the ADE model,
spherical vesicles (v=1) evolve to
stomatocytes once the reduced volume
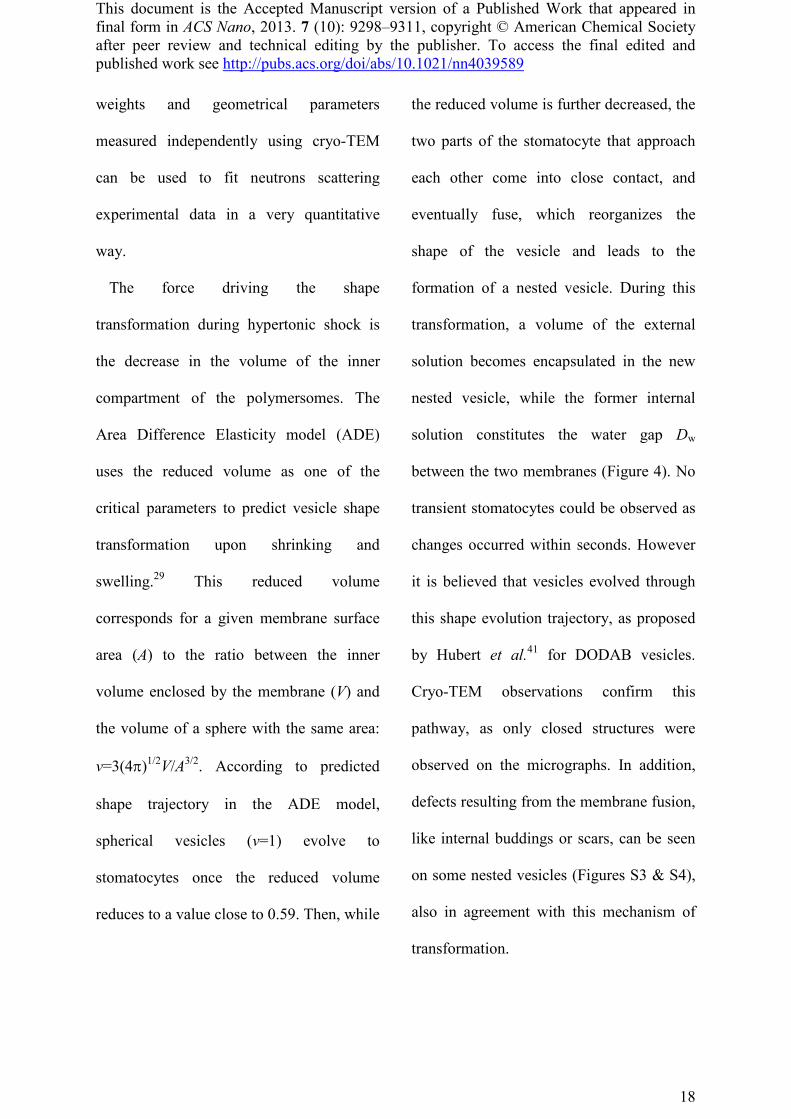
reduces to a value close to 0.59. Then, while
the reduced volume is further decreased, the
two parts of the stomatocyte that approach
each other come into close contact, and
eventually fuse, which reorganizes the
shape of the vesicle and leads to the
formation of a nested vesicle. During this
transformation, a volume of the external
solution becomes encapsulated in the new
nested vesicle, while the former internal
solution constitutes the water gap Dw
between the two membranes (Figure 4). No
transient stomatocytes could be observed as
changes occurred within seconds. However
it is believed that vesicles evolved through
this shape evolution trajectory, as proposed
by Hubert et al.41 for DODAB vesicles.
Cryo-TEM observations confirm this
pathway, as only closed structures were
observed on the micrographs. In addition,
defects resulting from the membrane fusion,
like internal buddings or scars, can be seen
on some nested vesicles (Figures S3 & S4),
also in agreement with this mechanism of
transformation.
This document is the Accepted Manuscript version of a Published Work that appeared in final form in ACS Nano, 2013. 7 (10): 9298–9311, copyright © American Chemical Society after peer review and technical editing by the publisher. To access the final edited and published work see http://pubs.acs.org/doi/abs/10.1021/nn4039589
19
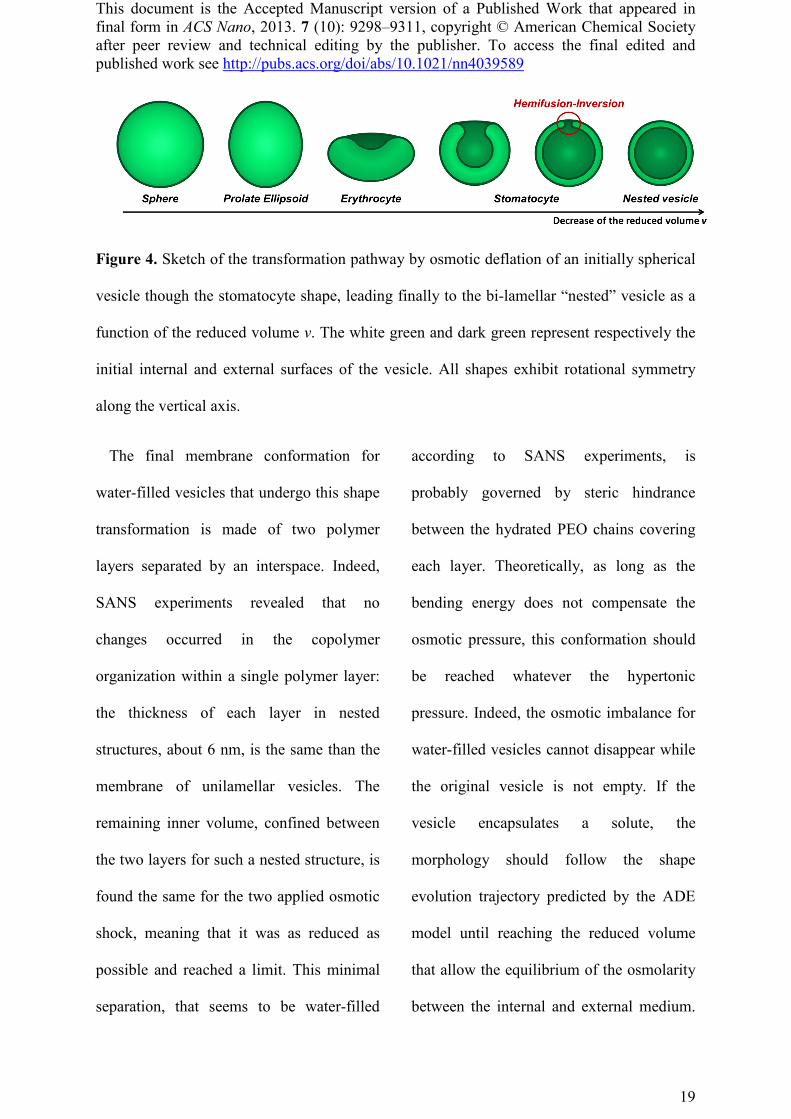
Figure 4. Sketch of the transformation pathway by osmotic deflation of an initially spherical
vesicle though the stomatocyte shape, leading finally to the bi-lamellar “nested” vesicle as a
function of the reduced volume v. The white green and dark green represent respectively the
initial internal and external surfaces of the vesicle. All shapes exhibit rotational symmetry
along the vertical axis.
The final membrane conformation for
water-filled vesicles that undergo this shape
transformation is made of two polymer
layers separated by an interspace. Indeed,
SANS experiments revealed that no
changes occurred in the copolymer
organization within a single polymer layer:
the thickness of each layer in nested
structures, about 6 nm, is the same than the
membrane of unilamellar vesicles. The
remaining inner volume, confined between
the two layers for such a nested structure, is
found the same for the two applied osmotic
shock, meaning that it was as reduced as
possible and reached a limit. This minimal
separation, that seems to be water-filled
according to SANS experiments, is
probably governed by steric hindrance
between the hydrated PEO chains covering
each layer. Theoretically, as long as the
bending energy does not compensate the
osmotic pressure, this conformation should
be reached whatever the hypertonic
pressure. Indeed, the osmotic imbalance for
water-filled vesicles cannot disappear while
the original vesicle is not empty. If the
vesicle encapsulates a solute, the
morphology should follow the shape
evolution trajectory predicted by the ADE
model until reaching the reduced volume
that allow the equilibrium of the osmolarity
between the internal and external medium.
This document is the Accepted Manuscript version of a Published Work that appeared in final form in ACS Nano, 2013. 7 (10): 9298–9311, copyright © American Chemical Society after peer review and technical editing by the publisher. To access the final edited and published work see http://pubs.acs.org/doi/abs/10.1021/nn4039589
20
Then, it is possible to precisely tune the
shape of such nano-vesicle once injected in
a physiological media (∼300 mOsm) by
carefully choosing the initial internal solute
concentration.
However, some limitations of theoretical
models are reached because of the small
size of the polymersomes prepared through
an extrusion process. Indeed, the membrane
thickness becomes no more negligible with
respect to the vesicle radius and thus the
membrane cannot be seen as a 2D surface
embedded in 3D space as hypothesized in
the ADE model.29 Careful examination of
cryo-TEM images revealed that unilamellar
vesicles that are still present after
hypertonic stresses are stretched out and
smaller than the nested vesicles. This may
be due to a higher bending energy when the
membrane thickness becomes of the same
order of magnitude than the radius of
curvature: such a finite-size effect that
would prevent the formation of an
invagination for significantly curved
vesicles has not been encountered yet, to the
authors’ knowledge, by the current
theoretical predictions including those that
consider confinement effects.50, 51 One can
thus try to estimate if a minimal radius
before applying a hypertonic shock is
necessary for the formation of nested
vesicle. The initial radius R0 of each
vesicles can be estimated for nested vesicles
and stretched out unilamellar ones from
their surface membrane area. It corresponds
to the radius of a spherical and unilamellar
vesicle with the same surface area. As all
structures are not spherical, they appear as
ellipses on cryo-TEM images, the surface
membrane area can only be calculated with
an assumption on the 3D vesicle shape. As
models on fluid membranes predicts that
ellipsoids are prolate for a small excess of
membrane area compare to the inner
compartment,29 we assumed that the non-
spherical unilamellar and nested vesicles are
prolate ellipsoids. Initial radii R0 can be
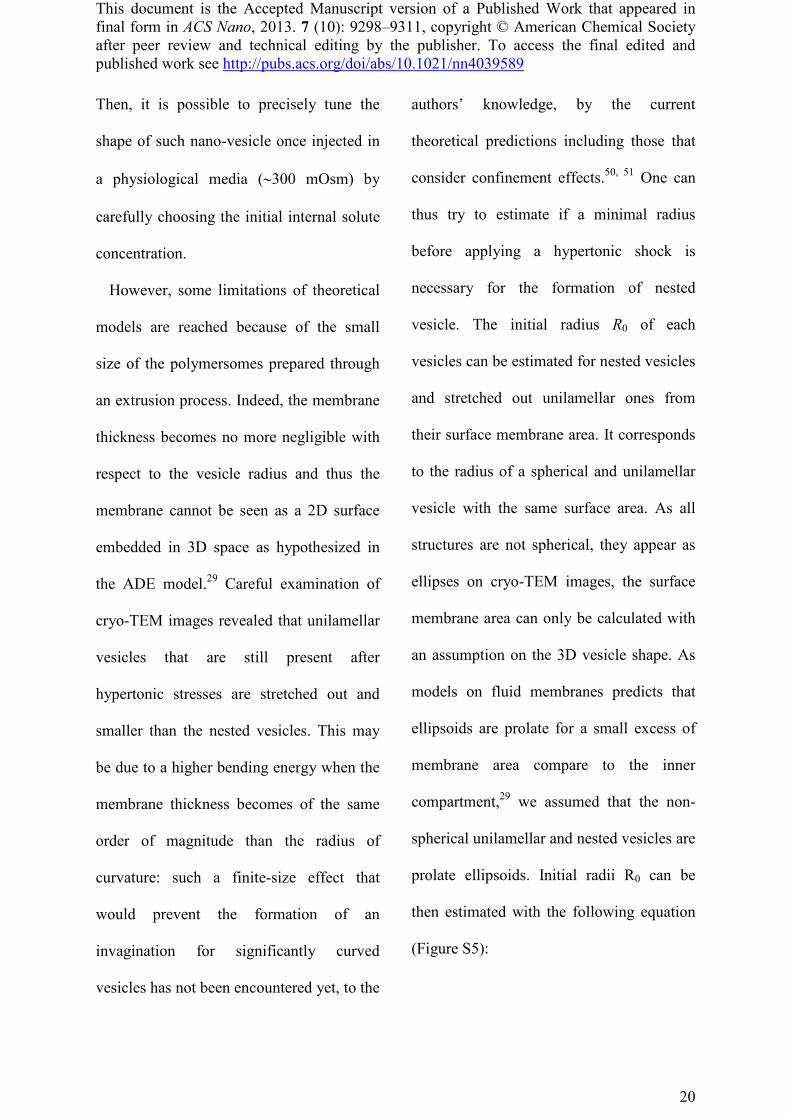
then estimated with the following equation
(Figure S5):
This document is the Accepted Manuscript version of a Published Work that appeared in final form in ACS Nano, 2013. 7 (10): 9298–9311, copyright © American Chemical Society after peer review and technical editing by the publisher. To access the final edited and published work see http://pubs.acs.org/doi/abs/10.1021/nn4039589
21
21
2
0 )sin(22
+= ∑
ii
i
iii eArcebab
R
and i
iii a
bae
22 −=
with a0 = semi-major axis and b0 = semi-
minor axis of the fitting ellipse for all the
vesicles, and a1 = a0 - (δ + Dw) and b1 = b0 -
(δ + Dw) for nested vesicles only. For
calculations, the membrane thickness is δ =
5.8 nm and the water gap between the shells
Dw = 3.5 nm (average values from all cryo-
TEM measurements in table 2). A minimal
initial radius needed to form a nested
vesicle R0 min could be determined for each
hypertonic condition from the smallest R0
value of nested vesicles. Determined values
are R0 min 100 mM = 23.7 nm for the
hypertonic shock with a 100 mM solution
and R0 min 250 mM = 22.9 nm for the shock at
250 mM. These values correspond to
maximum ratios (δ/R) max 100 mM = 0.24 and
(δ/R) max 250 mM = 0.25. Interestingly, there is
a good agreement between the minimal R0
calculated values and the radii R0 measured
by cryo-TEM on unilamellar vesicles
remaining after hypertonic shock. This is a
consequence of the non-negligible
membrane thickness compared to radius:
above a maximal ratio (δ/R), vesicles do not
follow the same shape evolution trajectory.
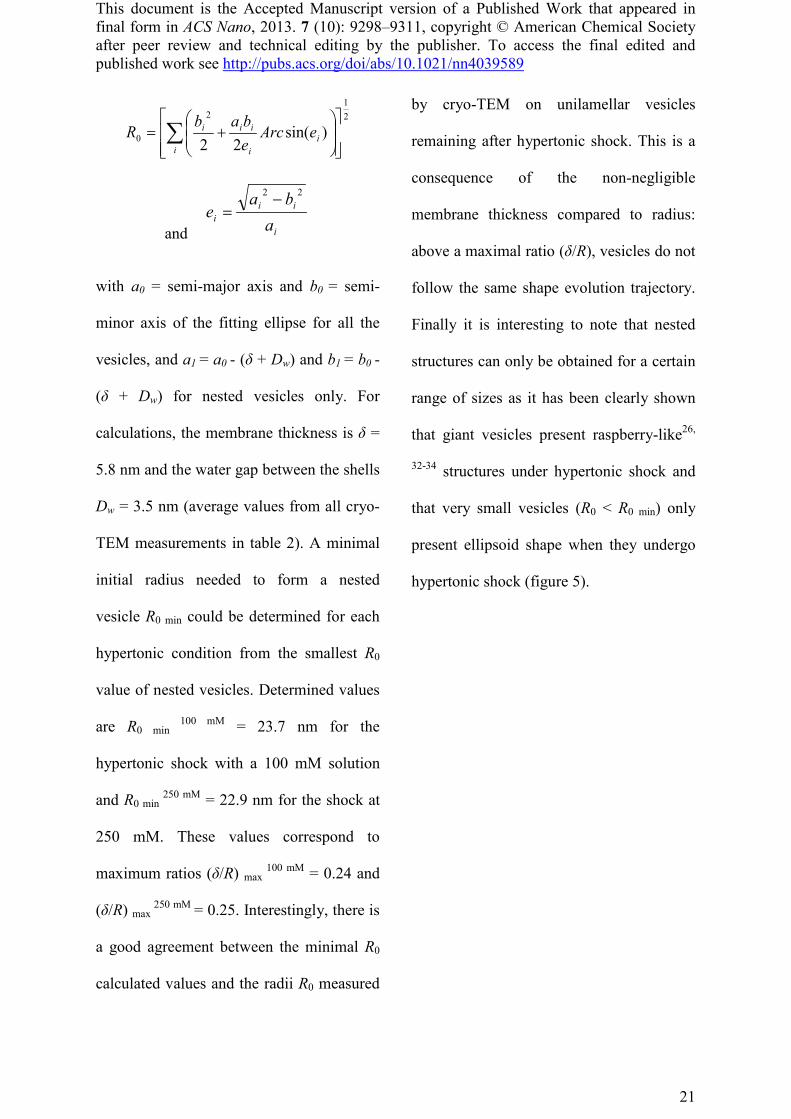
Finally it is interesting to note that nested
structures can only be obtained for a certain
range of sizes as it has been clearly shown
that giant vesicles present raspberry-like26,
32-34 structures under hypertonic shock and
that very small vesicles (R0 < R0 min) only
present ellipsoid shape when they undergo
hypertonic shock (figure 5).
This document is the Accepted Manuscript version of a Published Work that appeared in final form in ACS Nano, 2013. 7 (10): 9298–9311, copyright © American Chemical Society after peer review and technical editing by the publisher. To access the final edited and published work see http://pubs.acs.org/doi/abs/10.1021/nn4039589
22
Figure 5. Final morphology expected for
water-filled vesicles with a fluid membrane
submitted to a hypertonic stress as a
function of the membrane thickness /
vesicle radius ratio. Illustration is made
using the cryo-TEM image of a PEO-b-
PDMS-b-PEO vesicle (middle, right
image), cryo-TEM images of PDMS-g-PEO
vesicles (top and middle, left image) and a
DIC microscopy image of a PDMS-g-PEO
raspberry vesicle (bottom image, adapted
from26). Black scale bars represent 50 nm
and white scale bar 20 µm.
With this evolution pathway depicted on
Fig. 4, the external medium becomes the
internal phase, and final objects are
perfectly isotonic. Thus, the obtained
structures should be spherical whatever the
initial aspect ratio of the unilamellar vesicle
and the applied osmotic shock. This was
observed for the 100 mM hypertonic shock.
However it is not fully understood why the
polymersomes after 250 mM hypertonic
shock led to rather stretched out nested
vesicles. We propose that at this quite high
concentration, glucose may interact with the
PEO chains, as already reported,52 and
modifies the spontaneous curvature, slightly
changing the shape evolution trajectory
effectively followed (the spontaneous
curvature c0 is indeed one of the parameters
of the ADE model in addition to the reduce
volume v, together with the difference of
number of amphiphilic molecules between
the two bilayer leaflets).29
PEO-b-PDMS-b-PEO structural
changes in hypertonic conditions.
This document is the Accepted Manuscript version of a Published Work that appeared in final form in ACS Nano, 2013. 7 (10): 9298–9311, copyright © American Chemical Society after peer review and technical editing by the publisher. To access the final edited and published work see http://pubs.acs.org/doi/abs/10.1021/nn4039589
23
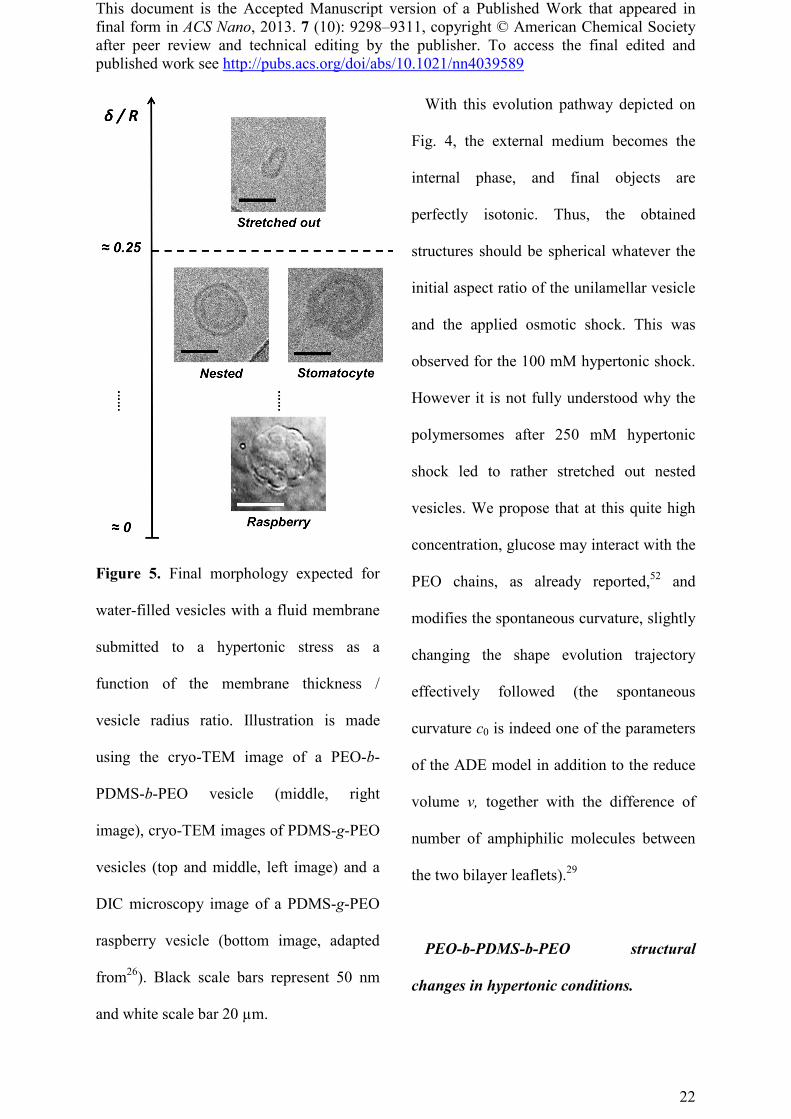
As observed by DLS on figure 1, water-
filled nano-vesicles of PEO-b-PDMS-b-
PEO exhibit only very little changes when
submitted to hypertonic stresses, and their
slight decrease in hydrodynamic radius of
about 10% seems less compatible with the
double-layered structure observed for
water-filled PDMS-g-PEO vesicles. In
order to confirm this behavior and
understand what parameters govern this
moderate response to osmotic stress, cryo-
TEM and SANS analyses were also carried
out on these polymersomes made of a
triblock copolymer.
Figure 6. Two different cryo-TEM images and aspect ratio distribution of water-filled PEO-b-
PDMS-b-PEO vesicles in (A) their native state and (B) under 250 mM hypertonic conditions
(∆Π of -6.1 atm). On the aspect ratio diagrams, black columns represent unilamellar vesicles,
grey columns represent bi-lamellar vesicles and white columns represent stomatocytes.
Inserts in (B) images are other structures observed on the same images, outside the field of
view presented here. Scale bars represent 100 nm.
This document is the Accepted Manuscript version of a Published Work that appeared in final form in ACS Nano, 2013. 7 (10): 9298–9311, copyright © American Chemical Society after peer review and technical editing by the publisher. To access the final edited and published work see http://pubs.acs.org/doi/abs/10.1021/nn4039589
24
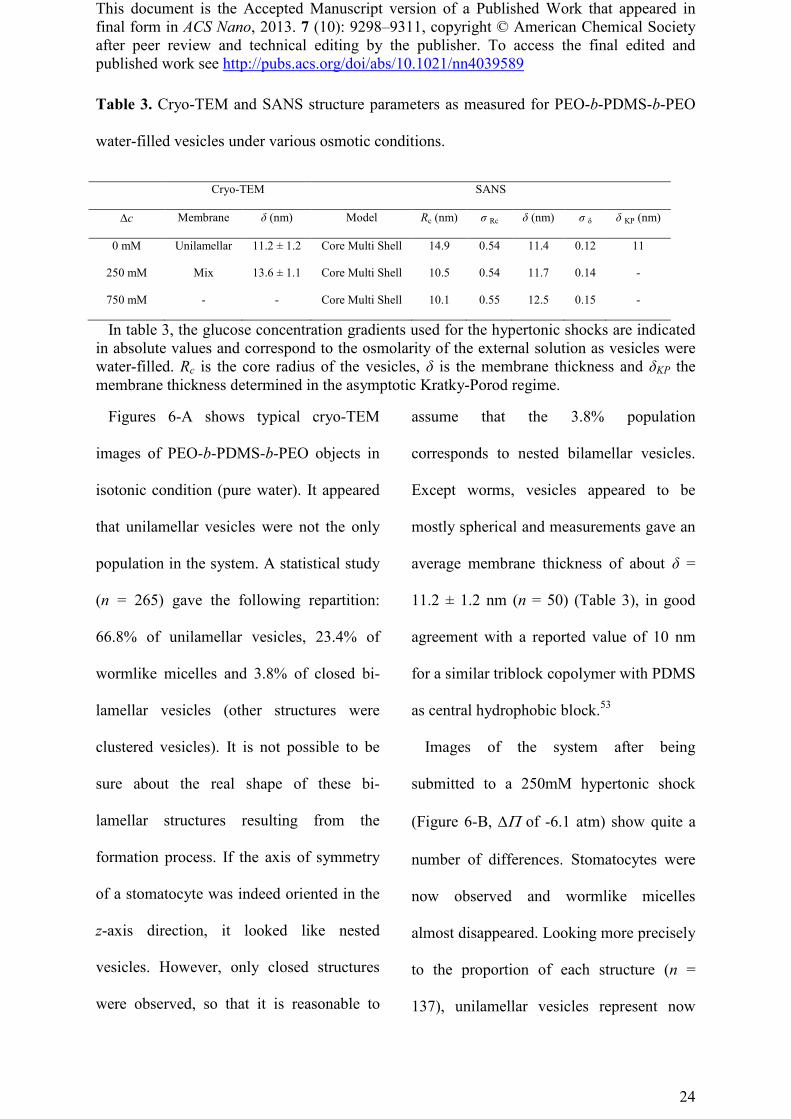
Table 3. Cryo-TEM and SANS structure parameters as measured for PEO-b-PDMS-b-PEO
water-filled vesicles under various osmotic conditions.
Cryo-TEM SANS
∆c Membrane δ (nm) Model Rc (nm) σ Rc δ (nm) σ δ δ KP (nm)
0 mM Unilamellar 11.2 ± 1.2 Core Multi Shell 14.9 0.54 11.4 0.12 11
250 mM Mix 13.6 ± 1.1 Core Multi Shell 10.5 0.54 11.7 0.14 -
750 mM - - Core Multi Shell 10.1 0.55 12.5 0.15 -
In table 3, the glucose concentration gradients used for the hypertonic shocks are indicated in absolute values and correspond to the osmolarity of the external solution as vesicles were water-filled. Rc is the core radius of the vesicles, δ is the membrane thickness and δKP the membrane thickness determined in the asymptotic Kratky-Porod regime.
Figures 6-A shows typical cryo-TEM
images of PEO-b-PDMS-b-PEO objects in
isotonic condition (pure water). It appeared
that unilamellar vesicles were not the only
population in the system. A statistical study
(n = 265) gave the following repartition:
66.8% of unilamellar vesicles, 23.4% of
wormlike micelles and 3.8% of closed bi-
lamellar vesicles (other structures were
clustered vesicles). It is not possible to be
sure about the real shape of these bi-
lamellar structures resulting from the
formation process. If the axis of symmetry
of a stomatocyte was indeed oriented in the
z-axis direction, it looked like nested
vesicles. However, only closed structures
were observed, so that it is reasonable to
assume that the 3.8% population
corresponds to nested bilamellar vesicles.
Except worms, vesicles appeared to be
mostly spherical and measurements gave an
average membrane thickness of about δ =
11.2 ± 1.2 nm (n = 50) (Table 3), in good
agreement with a reported value of 10 nm
for a similar triblock copolymer with PDMS
as central hydrophobic block.53
Images of the system after being
submitted to a 250mM hypertonic shock
(Figure 6-B, ∆Π of -6.1 atm) show quite a
number of differences. Stomatocytes were
now observed and wormlike micelles
almost disappeared. Looking more precisely
to the proportion of each structure (n =
137), unilamellar vesicles represent now

This document is the Accepted Manuscript version of a Published Work that appeared in final form in ACS Nano, 2013. 7 (10): 9298–9311, copyright © American Chemical Society after peer review and technical editing by the publisher. To access the final edited and published work see http://pubs.acs.org/doi/abs/10.1021/nn4039589
25
81.6% of the total structures, double-layered
structures – i.e. closed bi-lamellar vesicles
and stomatocytes – 11.3% and wormlike
micelles only 5%. Membrane thickness of
unilamellar vesicles was about δ = 13.6 ±
1.1 nm (n = 50).
Figure 7. Small angle neutron scattering of
PEO-b-PDMS-b-PEO vesicles initially
prepared at 10 mg/mL in D2O. A)
Experimental data in isotonic conditions,
the full line is a fitting curve by a core
multi-shell model (Rc = 14.9 nm, σRc = 0.54,
δ = 11.4 nm, σδ = 0.12). The inset is the
Kratky-Porod plot yielding an estimate of
the membrane thickness dKP. B) Scattered
intensity for the same sample after being
submitted to a 250 mM or 750 mM
hypertonic stress (respectively green and
blue dots). The full line and dashed line are
fitting curves by a polydisperse core multi-
shell model, respectively for the 250 mM
(Rc = 10.5 nm, σRc = 0.54, δ = 11.7 nm, σδ =
0.14) and the 750 mM (Rc = 10.1 nm, σRc =
0.55, δ = 12.5 nm, σδ = 0.15) hypertonic
shocks, corresponding to a ∆Π of -6.1 atm
and -18.3 atm respectively.
Figure 7-A shows the SANS scattered
intensity for objects in isotonic conditions at
room temperature. At intermediate q values,
the asymptotic decrease of the scattered
intensity varying as q-2 evidences the
presence of vesicular structures in the
sample, but at high q values, the oscillation
corresponding to the membrane thickness is
less distinct than on Fig. 3 due to a large
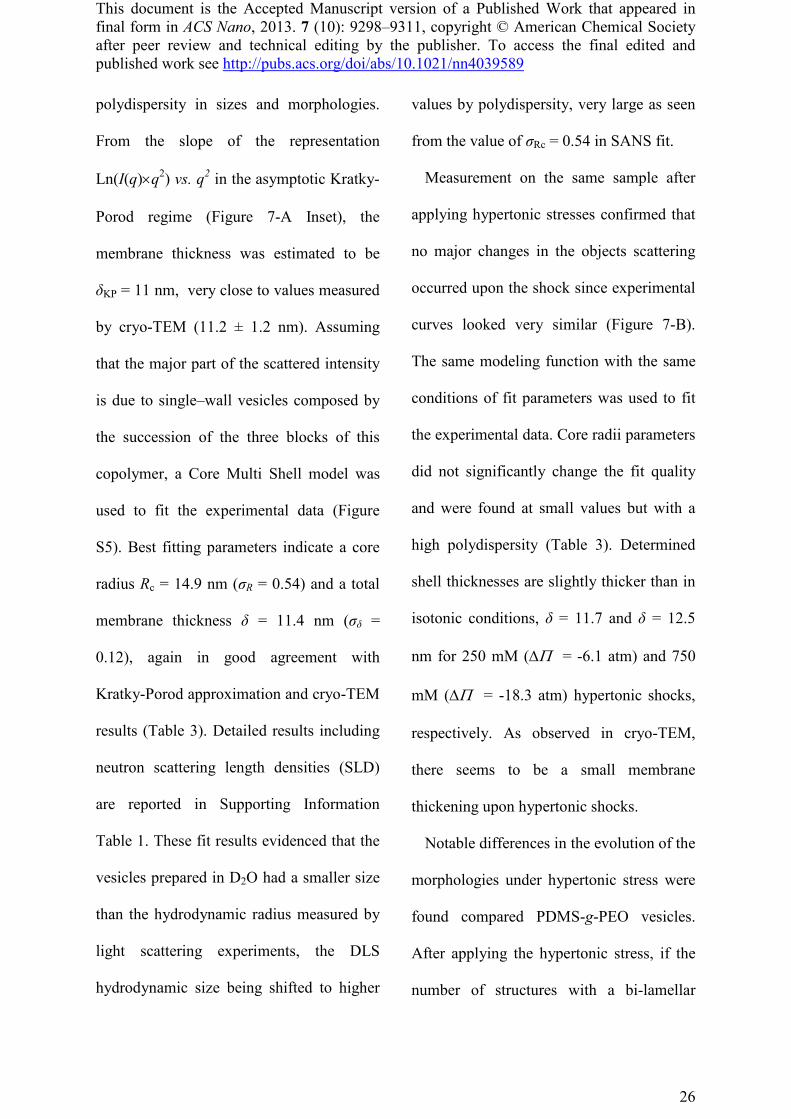
This document is the Accepted Manuscript version of a Published Work that appeared in final form in ACS Nano, 2013. 7 (10): 9298–9311, copyright © American Chemical Society after peer review and technical editing by the publisher. To access the final edited and published work see http://pubs.acs.org/doi/abs/10.1021/nn4039589
26
polydispersity in sizes and morphologies.
From the slope of the representation
Ln(I(q)×q2) vs. q2 in the asymptotic Kratky-
Porod regime (Figure 7-A Inset), the
membrane thickness was estimated to be
δKP = 11 nm, very close to values measured
by cryo-TEM (11.2 ± 1.2 nm). Assuming
that the major part of the scattered intensity
is due to single–wall vesicles composed by
the succession of the three blocks of this
copolymer, a Core Multi Shell model was
used to fit the experimental data (Figure
S5). Best fitting parameters indicate a core
radius Rc = 14.9 nm (σR = 0.54) and a total
membrane thickness δ = 11.4 nm (σδ =
0.12), again in good agreement with
Kratky-Porod approximation and cryo-TEM
results (Table 3). Detailed results including
neutron scattering length densities (SLD)
are reported in Supporting Information
Table 1. These fit results evidenced that the
vesicles prepared in D2O had a smaller size
than the hydrodynamic radius measured by
light scattering experiments, the DLS
hydrodynamic size being shifted to higher
values by polydispersity, very large as seen
from the value of σRc = 0.54 in SANS fit.
Measurement on the same sample after
applying hypertonic stresses confirmed that
no major changes in the objects scattering
occurred upon the shock since experimental
curves looked very similar (Figure 7-B).
The same modeling function with the same
conditions of fit parameters was used to fit
the experimental data. Core radii parameters
did not significantly change the fit quality
and were found at small values but with a
high polydispersity (Table 3). Determined
shell thicknesses are slightly thicker than in
isotonic conditions, δ = 11.7 and δ = 12.5
nm for 250 mM (∆Π = -6.1 atm) and 750
mM (∆Π = -18.3 atm) hypertonic shocks,
respectively. As observed in cryo-TEM,
there seems to be a small membrane
thickening upon hypertonic shocks.
Notable differences in the evolution of the
morphologies under hypertonic stress were
found compared PDMS-g-PEO vesicles.
After applying the hypertonic stress, if the
number of structures with a bi-lamellar
This document is the Accepted Manuscript version of a Published Work that appeared in final form in ACS Nano, 2013. 7 (10): 9298–9311, copyright © American Chemical Society after peer review and technical editing by the publisher. To access the final edited and published work see http://pubs.acs.org/doi/abs/10.1021/nn4039589
27
membrane was more than twice the initial
one, 11.3% of the total structures, more than
half of them were clearly identified as
stomatocytes (6.4% of the total structures).
As there were already nested bilamellar
vesicles due to the formation process, this
increase in double-layered structures
proportion can be mostly attributed to the
appearance of stomatocytes and not to
newly formed nested vesicles. Moreover,
the aspect ratio distribution of unilamellar
vesicles was wider than before the shock
(Figure 6-B), suggesting that these objects
were too small (see below) to form
invaginations and thus were just stretched
out to reduce their internal volume at a
constant surface area.
The lack of sensitivity of this triblock
system to hypertonic conditions can be
explained by the limitation previously
identified: the membrane thickness is not
negligible with respect to the vesicle radius.
For this system, the minimal initial radius
needed to form nested vesicles is R0 min 250
mM = 39.2 nm, calculated with δ = 11 nm
and Dw = 5.5 nm measured for the five
smallest nested vesicles after the 250 mM
hypertonic shock. It is not surprising to
determine a higher R0 min 250 mM value for the
triblock copolymer than for the grafted one,
since the energy of a closed membrane is
proportional to the bending modulus (Eb =
8pKb),54 the latter being proportional to the
square of the membrane thickness.1
Interestingly, this minimal initial radius R0
min 250 mM is equivalent to a maximal ratio
(δ/R) max 250 mM = 0.28, close to values
determined for PDMS-g-PEO vesicles,
most likely giving rise to a general thumb
rule (not dependent upon the exact polymer
architecture) that the radius of curvature
needs to be ∼4 times larger the membrane
thickness to authorize the invagination
formation.
Comparing the R0 values determined for
all vesicles remaining unilamellar after the
shock with the R0 min 250 mM value of this
system confirms that 85% of them were too
small to form nested vesicles and thus were
just stretched out. Therefore, the smaller

This document is the Accepted Manuscript version of a Published Work that appeared in final form in ACS Nano, 2013. 7 (10): 9298–9311, copyright © American Chemical Society after peer review and technical editing by the publisher. To access the final edited and published work see http://pubs.acs.org/doi/abs/10.1021/nn4039589
28
shrinkage observed by DLS as compared to
PDMS-g-PEO vesicles (Figure 1) was due
to the lack of changes in morphology of
these vesicles under hypertonic conditions.
This is also the reason why SANS curves on
shocked samples for the triblock copolymer
vesicles (Fig. 7B) showed almost no change
compared to the scattered intensity in
isotonic conditions (Fig. 7A).
Surprisingly, the small amount of vesicles
which undergo invagination under
hypertonic conditions (6.4% of population)
never reached a closed bi-lamellar structure
and kept their stomatocyte shape, even
though the R0 determined for most of them
was higher than R0 min 250 mM. A probable
explanation of the phenomenon lies in the
triblock architecture of the PEO-b-PDMS-
b-PEO copolymer, which leads to the
formation of a well-defined copolymer
monolayer and not to a bilayer classically
formed by diblock copolymers. This
monolayer nanostructure disfavors the
stomatocyte closure because all the PEO-b-
PDMS-b-PEO chains involved in the hemi-
fusion step would have to go through a very
unfavorable hairpin conformation to avoid
contact between the PDMS hydrophobic
core and water, thus increasing the energetic
cost of the membrane fusion (Figure 8).
Figure 8. Sketch of the membrane fusion step for membranes formed by A) diblock
copolymers and B) triblock copolymers. It is believed that the hemifusion-inversion step
occurs with a graft copolymer membrane such as PDMS-g-PEO (the membrane of which
This document is the Accepted Manuscript version of a Published Work that appeared in final form in ACS Nano, 2013. 7 (10): 9298–9311, copyright © American Chemical Society after peer review and technical editing by the publisher. To access the final edited and published work see http://pubs.acs.org/doi/abs/10.1021/nn4039589
29
probably looks like a classical lipid bilayer) but are not possible for a triblock copolymer
such as PEO-b-PDMS-b-PEO (adapted from classical textbooks on membranes55).
Another effect observed by cryo-TEM is
the disappearance of the worm-like micelles
upon the shock. In the classical description
of the shape of self-assembled amphiphilic
structures, the main parameter governing
the final morphology is the relative size of
hydrophilic and hydrophobic part, which
determines the curvature of the
hydrophilic/hydrophobic interface.56, 57 In
the present case, the simultaneous presence
of vesicles and wormlike micelles under
isotonic conditions indicates that the system
could be locked at an intermediate value,
favoring both kinds of structures. Addition
of glucose may result in a small dehydration
of PEO chain,52 thus lowering the
interfacial area of the hydrophilic block and
decreasing the spontaneous curvature of the
interface. This can explain why wormlike
micelles almost disappeared in hypertonic
conditions. The small membrane thickening
(from 11.4 to 11.7 nm) can also be ascribed
to this dehydration of the PDMS / PEO
interface upon glucose addition, the contrast
of dehydrated PEO being higher than that of
the hydrated state.
Conclusion.
In this work, we studied the behavior of
polymer vesicles at nanometric scale under
osmotic stresses. Copolymers with the same
hydrophobic block in a fluid state (PDMS)
but different molecular weight and
architecture were chosen in order to
understand crucial parameters governing
structural changes. On the one hand,
hypotonic shocks led to a slight swelling of
the nano-vesicles, as for giant
polymersomes. On the other hand,
hypertonic shocks led to more complex
behaviors. Combination of SANS and Cryo-
TEM allowed an unprecedented
understanding of this complexity. It was
indeed observed that water-filled PDMS-g-
PEO unilamellar vesicles transform into bi-
lamellar nested vesicles when submitted to
This document is the Accepted Manuscript version of a Published Work that appeared in final form in ACS Nano, 2013. 7 (10): 9298–9311, copyright © American Chemical Society after peer review and technical editing by the publisher. To access the final edited and published work see http://pubs.acs.org/doi/abs/10.1021/nn4039589
30
hypertonic conditions. This is to our
knowledge the first time that the formation
of such structure, known until now for
liposomes only,43 is also reported for
polymersomes. The shape evolution
trajectory is in agreement with theoretical
predictions of the area difference elasticity
model, although the membrane thickness
cannot be considered negligible compared
to the vesicle radius in our system. In
particular, for two different types of vesicle
membranes (either bilayers or monolayers
obtained via self-assembly of respectively
grafted copolymer or triblock copolymer) it
was evidenced that above a critical
membrane thickness/vesicle radius ratio
(δ/R) of about 0.25, invaginations under
hypertonic conditions are no more possible
and vesicles remain unilamellar, while
undergoing simply a stretching
deformation. Finally, we have shown that
the architecture of the copolymer plays a
crucial role on the final morphology of the
vesicles submitted to hypertonic shock. It
was especially observed that vesicles
obtained from the self-assembly of a
triblock copolymer (PEO-b-PDMS-b-PEO)
do not evolve further than the stomatocyte
shape, the well-defined architecture of their
membrane disfavoring the membrane
hemifusion step needed to eventually reach
a closed nested vesicle structure.
Methods.
Materials. The graft copolymer used,
PDMS-g-PEO (Dow Corning 5329), was a
gift from Dow Corning. All the molecular
characterization were performed in the lab
in a previous study 58 and the results were in
perfect agreement with data already
available in literature. 59, 60 Briefly, it is on
average composed of a PDMS chain
decorated with two branches of PEO, with a
polymerization degree of about 12. The
weight fraction of ethylene oxide is 47%.
The average viscosity molecular weight is
equal to 3000 g/mol and the dispersity
index is 1.32 as measured by SEC. This
copolymer gives birth in aqueous solutions
to polymersomes whose membrane have a
This document is the Accepted Manuscript version of a Published Work that appeared in final form in ACS Nano, 2013. 7 (10): 9298–9311, copyright © American Chemical Society after peer review and technical editing by the publisher. To access the final edited and published work see http://pubs.acs.org/doi/abs/10.1021/nn4039589
31
core thickness of 5 nm48 which was also
checked by cryo-TEM in a previous study
of our group. 58
Deuterated glucose-d12 was purchased
from Santa Cruz Biotechnology.
Synthesis of PEO-b-PDMS-b-PEO
triblock amphiphilic copolymer. This
copolymer was obtained by coupling two
different blocks (Figure S7). Macro-initiator
α,ω-bis aminopropyl terminated
poly(dimethylsiloxane) with a number
average molecular weight of 5000 g/mol
(according to supplier data) was purchased
from ABCR, Germany. α-methoxy-ω-N
hydroxysuccinimide ester poly(ethylene
glycol) with a number average molecular
weight of 750 g/mol was purchased from
Rapp polymer, Germany. This coupling
reaction was done in dichloromethane at
room temperature for 24 h. The success of
the coupling was monitored using in 1H
NMR the disappearance of the NHS leaving
group signal and the signal shift for
carbon’s proton in α position of the amine
groups that turned into amide upon the
reaction (Figure S8). The polydispersity
index of the final triblock copolymer was
evaluated to be 1.26 using SEC on 5 mg/mL
polymer solution in THF and using
polystyrene standard calibration curve. The
triblock copolymer number average molar
mass is 6800 g/mol and the hydrophilic
weight fraction 22 wt.%.
Polymersome preparation. Vesicles of
PDMS-g-PEO were spontaneously obtained
by mixing the polymer with aqueous
solution (distilled water for the samples
used for hypertonic shocks and 1M glucose
solution for the samples used for hypotonic
shocks) at 10 mg/mL and stirring at 250
rpm for 2 hours. Then, in order to obtain
monodisperse unilamellar vesicles, the
solution was extruded 19 times through two
polycarbonate membranes with a 0.1 µm
pore size using a double-syringe mini-
extruder (Avanti Polar Lipids, Alabaster,
AL, Canada). Vesicles of PEO-b-PDMS-b-
PEO were obtained from a double-emulsion
– evaporation method as such: (1) 46 mg of
polymer was dissolved per mL of
This document is the Accepted Manuscript version of a Published Work that appeared in final form in ACS Nano, 2013. 7 (10): 9298–9311, copyright © American Chemical Society after peer review and technical editing by the publisher. To access the final edited and published work see http://pubs.acs.org/doi/abs/10.1021/nn4039589
32
chloroform. (2) 0.02 mL of aqueous
solution was added to 0.2 mL of polymer
solution prior to 20 sec of probe sonication.
(3) The entire resulting emulsion was added
drop-wise to 0.9 mL of aqueous solution
(the same as in step 2) and sonicated again
for 2 minutes. (4) Resulting solution was
extruded 19 times through two
polycarbonate membranes with a 0.1 µm
pore size.
Osmotic shock. Vesicles in their native
state are in isotonic conditions, i.e. not
subjected to any glucose concentration
gradient and prepared at an initial
concentration of 10 mg/mL. Hypertonic
shocks were applied by adjusting the
external concentration to the desired
osmolarity using freshly prepared glucose
solutions (1M for DLS and cryo-TEM
experiments, 2M for SANS experiments).
As vesicles were water-filled for these
hypertonic shocks, the final glucose
concentration gradient is the osmolarity at
which the external medium was adjusted.
Glucose solutions used for the SANS
experiments were prepared with 75%
deuterated glucose and 25% hydrogenated
glucose in order to obtain the same
calculated scattering length density as
deuterated water. For DLS experiments,
both distilled water and a 1M glucose
solution were used to dilute the samples (for
hypertonic and hypotonic shocks) in order
to end up with the desired glucose
concentration gradients and a theoretical
polymer concentration of 1 mg/mL.
Instrumentation and measurements.
Nuclear Magnetic Resonance (NMR)
Spectroscopy: 1H NMR spectra were
recorded on a Bruker Avance AC 400
spectrometer.
Size Exclusion Chromatography (SEC): A
Varian apparatus was used, equipped with
both refractive index and UV detectors.
Analyses were performed using THF as
eluent (1 mL.min-1) and trichlorobenzene as
flow marker.
Dynamic Light Scattering (DLS): Light
scattering were carried out on a Malvern
Zetasizer Nano ZS at 25º C and 90°
This document is the Accepted Manuscript version of a Published Work that appeared in final form in ACS Nano, 2013. 7 (10): 9298–9311, copyright © American Chemical Society after peer review and technical editing by the publisher. To access the final edited and published work see http://pubs.acs.org/doi/abs/10.1021/nn4039589
33
scattering angle (633 nm wavelength).
Values of viscosity used for proper
determination of the hydrodynamic radius
are indicated in Figure S9.
Small Angle Neutron Scattering (SANS):
These experiments were performed at the
Laboratoire Léon Brillouin (CEA-CNRS,
Saclay) on PACE and TPA spectrometers
(respectively SANS and VSANS). Three
configurations were used on the PACE
spectrometer to cover scattering vectors
from 2.4×10⁻³ to 3.7×10⁻¹ Å-1: (1) sample-to
detector distance D = 4.7 m and neutron
wavelength λ = 17 Å, (2) D = 3 m and λ = 6
Å, and (3) D = 1 m and λ = 6 Å.
Complementary, the TPA spectrometer
allows to access lower q values, here down
to 10-3 Å-1 with a good resolution (D = 6 m
and λ = 6 Å) up to low q values obtained
with PACE spectrometer. Analyses were
performed on samples of initial
concentration 1 wt.% in D2O in 2-mm-thick
quartz cells.
Cryo-Transmission Electron Microscopy
(cryo-TEM): 5µl of the solution were
deposited onto a freshly glow discharged
400 Cu grid covered with a carbon holey
film. The grid is rapidely plunged into
liquid ethane cooled by liquid nitrogen by a
homemade T° controlled freezing device.
The grid was then mounted onto a Gatan
626 cryoholder and transferred into a FEI-
Tecnai G2 cryo TEM. The grids were
observed under low dose conditions and the
pictures taken with an Eagle 2k2k slow scan
CCD camera. Analyses were performed on
samples of initial concentration 1 wt.%.
Aspect ratios were determined by fitting
each vesicle by an ellipse model using the
ImageJ software (http://rsb.info.nih.org/ij)
and defined as the semi-minor axis (b0)
divided by the semi-major axis (a0) of the
fitting ellipse (K=b0/a0).
Acknowledgment. This work was
supported by the Commissariat à l’énergie
atomique et aux energies alternatives (CEA)
and Conseil Régional d’Aquitaine for PhD
funding of R. Salva (CTCR grant). ESF
Research Network Programme P2M
“Precision Polymer Materials” is also
This document is the Accepted Manuscript version of a Published Work that appeared in final form in ACS Nano, 2013. 7 (10): 9298–9311, copyright © American Chemical Society after peer review and technical editing by the publisher. To access the final edited and published work see http://pubs.acs.org/doi/abs/10.1021/nn4039589
34
acknowledged. C. Chevallard and H. Nuss
are warmly thanked for participation to
preliminary neutron runs.
Supporting information available.
Description of the SANS models used to fit
the experimental data. Additional SANS
curves for PDMS-g-PEO and PBut-b-PEO
vesicles under positive and negative
osmotic pressure gradients. Additional
cryo-TEM images with defects from the
membrane fusion after hypertonic stress.
Estimates of the initial radius R0 of all
vesicles. Protocol for the PEO-b-PDMS-b-
PEO synthesis. Viscosities of glucose
solutions for DLS measurements. This
material is available free of charges via the
Internet at http://pubs.acs.org.
References.
1. Discher, B. M.; Won, Y.-Y.; Ege, D. S.; Lee, J. C.-M.; Bates, F. S.; Discher, D. E.; Hammer, D. A. Polymersomes: Tough Vesicles Made from Diblock Copolymers. Science 1999, 284, 1143-1146. 2. Discher, D. E.; Eisenberg, A. Polymer Vesicles. Science 2002, 297, 967-973.
3. Nicolas, J.; Mura, S.; Brambilla, D.; Mackiewicz, N.; Couvreur, P. Design, Functionalization Strategies and Biomedical Applications of Targeted Biodegradable/Biocompatible Polymer-Based Nanocarriers for Drug Delivery. Chem. Soc. Rev. 2013, 42, 1147-1235. 4. Meng, F.; Zhong, Z.; Feijen, J. Stimuli-Responsive Polymersomes for Programmed Drug Delivery. Biomacromolecules 2009, 10, 197-209. 5. Renggli, K.; Baumann, P.; Langowska, K.; Onaca, O.; Bruns, N.; Meier, W. Selective and Responsive Nanoreactors. Adv. Funct. Mater. 2011, 21, 1241-1259. 6. Peters, R. J. R. W.; Louzao, I.; van Hest, J. C. M. From Polymeric Nanoreactors to Artificial Organelles. Chem. Sci. 2012, 3, 335-342. 7. Picker, A.; Nuss, H.; Guenoun, P.; Chevallard, C. Polymer Vesicles as Microreactors for Bioinspired Calcium Carbonate Precipitation. Langmuir 2011, 27, 3213-3218. 8. Marguet, M.; Bonduelle, C.; Lecommandoux, S. Multicompartmentalized Polymeric Systems: Towards Biomimetic Cellular Structure and Function. Chem. Soc. Rev. 2013, 42, 512-529. 9. Winterhalter, M.; Hilty, C.; Bezrukov, S. M.; Nardin, C.; Meier, W.; Fournier, D. Controlling Membrane Permeability with Bacterial Porins: Application to Encapsulated Enzymes. Talanta 2001, 55, 965-971. 10. Kumar, M.; Grzelakowski, M.; Zilles, J.; Clark, M.; Meier, W. Highly Permeable Polymeric Membranes Based on the Incorporation of the Functional Water Channel Protein Aquaporin Z. Proc. Natl. Acad. Sci. U.S.A. 2007, 104, 20719-20724. 11. Marguet, M.; Sandre, O.; Lecommandoux, S. Polymersomes in “Gelly” Polymersomes: Toward Structural Cell Mimicry. Langmuir 2012, 28, 2035-2043. 12. Le Meins, J. F.; Sandre, O.; Lecommandoux, S. Recent Trends in the
This document is the Accepted Manuscript version of a Published Work that appeared in final form in ACS Nano, 2013. 7 (10): 9298–9311, copyright © American Chemical Society after peer review and technical editing by the publisher. To access the final edited and published work see http://pubs.acs.org/doi/abs/10.1021/nn4039589
35
Tuning of Polymersomes’ Membrane Properties. Eur. Phys. J. E 2011, 34, 1-17. 13. Abkarian, M.; Massiera, G.; Berry, L.; Roques, M.; Braun-Breton, C. A Novel Mechanism for Egress of Malarial Parasites from Red Blood Cells. Blood 2011, 117, 4118-4124. 14. Callan-Jones, A.; Albarran Arriagada, O. E.; Massiera, G.; Lorman, V.; Abkarian, M. Red Blood Cell Membrane Dynamics During Malaria Parasite Egress. Biophys. J. 2012, 103, 2475-2483. 15. Perrault, S. D.; Walkey, C.; Jennings, T.; Fischer, H. C.; Chan, W. C. W. Mediating Tumor Targeting Efficiency of Nanoparticles Through Design. Nano Lett. 2009, 9, 1909-1915. 16. Chithrani, B. D.; Ghazani, A. A.; Chan, W. C. W. Determining the Size and Shape Dependence of Gold Nanoparticle Uptake into Mammalian Cells. Nano Lett. 2006, 6, 662-668. 17. Chauhan, V. P.; Popović, Z.; Chen, O.; Cui, J.; Fukumura, D.; Bawendi, M. G.; Jain, R. K. Fluorescent Nanorods and Nanospheres for Real-Time In Vivo Probing of Nanoparticle Shape-Dependent Tumor Penetration. Angew. Chem. Int. Ed. 2011, 50, 11417-11420. 18. Champion, J. A.; Katare, Y. K.; Mitragotri, S. Particle Shape: A New Design Parameter for Micro- and Nanoscale Drug Delivery Carriers. J. Controlled Release 2007, 121, 3-9. 19. Decuzzi, P.; Pasqualini, R.; Arap, W.; Ferrari, M. Intravascular Delivery of Particulate Systems: Does Geometry Really Matter? Pharm. Res. 2009, 26, 235-243. 20. Sharma, G.; Valenta, D. T.; Altman, Y.; Harvey, S.; Xie, H.; Mitragotri, S.; Smith, J. W. Polymer Particle Shape Independently Influences Binding and Internalization by Macrophages. J. Controlled Release 2010, 147, 408-412. 21. Boucher, P.-A.; Morris, C. E.; Joós, B. Mechanosensitive Closed-Closed Transitions in Large Membrane Proteins: Osmoprotection and Tension Damping. Biophys. J. 2009, 97, 2761-2770.
22. Howard, R. J.; Ferrari, M. A.; Roach, D. H.; Money, N. P. Penetration of Hard Substrates by a Fungus Employing Enormous Turgor Pressures. Proc. Natl. Acad. Sci. U.S.A. 1991, 88, 11281-11284. 23. Battaglia, G.; Ryan, A. J.; Tomas, S. Polymeric Vesicle Permeability: A Facile Chemical Assay. Langmuir 2006, 22, 4910-4913. 24. Boroske, E.; Elwenspoek, M.; Helfrich, W. Osmotic Shrinkage of Giant Egg-Lecithin Vesicles. Biophys. J. 1981, 34, 95-109. 25. Li, W.; Aurora, T. S.; Haines, T. H.; Cummins, H. Z. Elasticity of Synthetic Phospholipid Vesicles and Submitochondrial Particles During Osmotic Swelling. Biochemistry 1986, 25, 8220-8229. 26. Carlsen, A.; Glaser, N.; Le Meins, J.-F.; Lecommandoux, S. Block Copolymer Vesicle Permeability Measured by Osmotic Swelling and Shrinking. Langmuir 2011, 27, 4884-4890. 27. Shum, H. C.; Kim, J.-W.; Weitz, D. A. Microfluidic Fabrication of Monodisperse Biocompatible and Biodegradable Polymersomes with Controlled Permeability. J. Am. Chem. Soc. 2008, 130, 9543-9549. 28. Käs, J.; Sackmann, E. Shape Transitions and Shape Stability of Giant Phospholipid Vesicles in Pure Water Induced by Area-to-Volume Changes. Biophys. J. 1991, 60, 825-844. 29. Seifert, U. Configurations of Fluid Membranes and Vesicles. Adv. Phys. 1997, 46, 13-137. 30. Wintz, W.; Döbereiner, H.-G.; Seifert, U. Starfish Vesicles. Europhys. Lett. 1996, 33, 403-408. 31. Michalet, X. Equilibrium Shape Degeneracy in Starfish Vesicles. Phys. Rev. E 2007, 76, 021914. 32. Ménager, C.; Cabuil, V. Reversible Shrinkage of Giant Magnetoliposomes under an Osmotic Stress. J. Phys. Chem. B 2002, 106, 7913-7918. 33. Claessens, M. M. A. E.; Leermakers, F. A. M.; Hoekstra, F. A.;
This document is the Accepted Manuscript version of a Published Work that appeared in final form in ACS Nano, 2013. 7 (10): 9298–9311, copyright © American Chemical Society after peer review and technical editing by the publisher. To access the final edited and published work see http://pubs.acs.org/doi/abs/10.1021/nn4039589
36
Stuart, M. A. C. Osmotic Shrinkage and Reswelling of Giant Vesicles Composed of Dioleoylphosphatidylglycerol and Cholesterol. Biochim. Biophys. Acta 2008, 1778, 890-895. 34. Bernard, A.-L.; Guedeau-Boudeville, M.-A.; Jullien, L.; di Meglio, J.-M. Raspberry Vesicles. Biochim. Biophys. Acta 2002, 1567, 1-5. 35. Bealle, G.; Jestin, J.; Carriere, D. Osmotically Induced Deformation of Capsid-Like Icosahedral Vesicles. Soft Matter 2011, 7, 1084-1089. 36. Li, X.; Pivkin, I. V.; Liang, H.; Karniadakis, G. E. Shape Transformations of Membrane Vesicles from Amphiphilic Triblock Copolymers: A Dissipative Particle Dynamics Simulation Study. Macromolecules 2009, 42, 3195-3200. 37. Yuan, H.; Huang, C.; Zhang, S. Dynamic Shape Transformations of Fluid Vesicles. Soft Matter 2010, 6, 4571-4579. 38. Lorenceau, E.; Utada, A. S.; Link, D. R.; Cristobal, G.; Joanicot, M.; Weitz, D. A. Generation of Polymerosomes from Double-Emulsions. Langmuir 2005, 21, 9183-9186. 39. Pencer, J.; White, G. F.; Hallett, F. R. Osmotically Induced Shape Changes of Large Unilamellar Vesicles Measured by Dynamic Light Scattering. Biophys. J. 2001, 81, 2716-2728. 40. Beney, L.; Linares, E.; Ferret, E.; Gervais, P. Influence of the Shape of Phospholipid Vesicles on the Measurement of Their Size by Photon Correlation Spectroscopy. Eur. Biophys. J. 1998, 27, 567-574. 41. Hubert, D. H. W.; Jung, M.; Frederik, P. M.; Bomans, P. H. H.; Meuldijk, J.; German, A. L. Morphology Transformations of DODAB Vesicles Reminiscent of Endocytosis and Vesicular Traffic. Langmuir 2000, 16, 8973-8979. 42. Saveyn, P.; Cocquyt, J.; Bomans, P.; Frederik, P.; De Cuyper, M.; Van der Meeren, P. Osmotically Induced Morphological Changes of Extruded Dioctadecyldimethylammonium Chloride
(DODAC) Dispersions. Langmuir 2007, 23, 4775-4781. 43. Pitard, B.; Oudrhiri, N.; Lambert, O.; Vivien, E.; Masson, C.; Wetzer, B.; Hauchecorne, M.; Scherman, D.; Rigaud, J.-L.; Vigneron, J.-P., et al. Sterically Stabilized BGTC-Based Lipoplexes: Structural Features and Gene Transfection into the Mouse Airways in Vivo. J. Gene Med. 2001, 3, 478-487. 44. Kim, K. T.; Zhu, J.; Meeuwissen, S. A.; Cornelissen, J. J. L. M.; Pochan, D. J.; Nolte, R. J. M.; van Hest, J. C. M. Polymersome Stomatocytes: Controlled Shape Transformation in Polymer Vesicles. J. Am. Chem. Soc. 2010, 132, 12522-12524. 45. Azzam, T.; Eisenberg, A. Fully Collapsed (Kippah) Vesicles: Preparation and Characterization. Langmuir 2010, 26, 10513-10523. 46. Meeuwissen, S. A.; Kim, K. T.; Chen, Y.; Pochan, D. J.; van Hest, J. C. M. Controlled Shape Transformation of Polymersome Stomatocytes. Angew. Chem. Int. Ed. 2011, 50, 7070-7073. 47. Mui, B. L.-S.; Cullis, P. R.; Evans, E. A.; Madden, T. D. Osmotic Properties of Large Unilamellar Vesicles Prepared by Extrusion. Biophys. J. 1993, 64, 443-453. 48. Lin, Z.; Hill, R. M.; Davis, H. T.; Scriven, L. E.; Talmon, Y. Cryo Transmission Electron Microscopy Study of Vesicles and Micelles in Siloxane Surfactant Aqueous Solutions. Langmuir 1994, 10, 1008-1011. 49. Pedersen, J. S. Analysis of Small-Angle Scattering Data from Colloids and Polymer Solutions: Modeling and Least-Squares Fitting. Adv. Colloid Interface Sci. 1997, 70, 171-210. 50. Kahraman, O.; Stoop, N.; Müller, M. M. Fluid Membrane Vesicles in Confinement. New J. Phys. 2012, 14, 095021. 51. Kahraman, O.; Stoop, N.; Müller, M. M. Morphogenesis of Membrane Invaginations in Spherical Confinement. EPL 2012, 97, 68008. 52. Sarkar, B.; Ravi, V.; Alexandridis, P. Micellization of Amphiphilic Block
This document is the Accepted Manuscript version of a Published Work that appeared in final form in ACS Nano, 2013. 7 (10): 9298–9311, copyright © American Chemical Society after peer review and technical editing by the publisher. To access the final edited and published work see http://pubs.acs.org/doi/abs/10.1021/nn4039589
37
Copolymers in Binary and Ternary Solvent Mixtures. J. Colloid Interface Sci. 2013, 390, 137-146. 53. Nardin, C.; Winterhalter, M.; Meier, W. Giant Free-Standing ABA Triblock Copolymer Membranes. Langmuir 2000, 16, 7708-7712. 54. Helfrich, W.; Servuss, R. M. Undulations, Steric Interaction and Cohesion of Fluid Membranes. Il Nuovo Cimento D 1984, 3, 137-151. 55. Arnold, K. Cation-Induced Vesicle Fusion Modulated by Polymers and Proteins. In Structure and dynamics of membranes: Generic and specific interactions, Lipowsky, R.; Sackmann, E., Eds. Elsevier: Amsterdam, 1995; pp 903-957 56. Israelachvili, J. Intermolecular and Surface Forces, Second Edition: With Applications to Colloidal and Biological Systems (Colloid Science). Academic Press: 1992. 57. Discher, D. E.; Ahmed, F. Polymersomes. Annu. Rev. Biomed. Eng. 2006, 8, 323-341. 58. Chemin, M.; Brun, P. M.; Lecommandoux, S.; Sandre, O.; Le Meins, J. F. Hybrid Polymer/Lipid Vesicles: Fine Control of the Lipid and Polymer Distribution in the Binary Membrane. Soft Matter 2012, 8, 2867-2874. 59. Hill, R. M.; He, M.; Lin, Z.; Davis, H. T.; Scriven, L. E. Lyotropic Liquid Crystal Phase Behavior of Polymeric Siloxane Surfactants. Langmuir 1993, 9, 2789-2798. 60. Nam, J.; Santore, M. M. Adhesion Plaque Formation Dynamics between Polymer Vesicles in the Limit of Highly Concentrated Binding Sites. Langmuir 2007, 23, 7216-7224.
This document is the Accepted Manuscript version of a Published Work that appeared in final form in ACS Nano, 2013. 7 (10): 9298–9311, copyright © American Chemical Society after peer review and technical editing by the publisher. To access the final edited and published work see http://pubs.acs.org/doi/abs/10.1021/nn4039589
38
Supporting Information for:
Polymersomes Shape Transformation at the
Nanoscale
Romain Salva,†,‡ Jean-François Le Meins,† Olivier Sandre,† Annie Brûlet,§ Marc Schmutz,┴
Patrick Guenoun,*,‡ and Sébastien Lecommandoux *,†
†Université de Bordeaux/IPB, ENSCBP, 16 avenue Pey-Berland, 33607 Pessac, France,
LCPO, UMR 5629, Pessac, France
‡IRAMIS, LIONS, UMR SIS2M 3299 CEA-CNRS, CEA Saclay, F-91191 Gif-sur-Yvette
Cedex, France
§Laboratoire Léon Brillouin, LLB, UMR12, CNRS-CEA Saclay, F-91191 Gif-sur-Yvette
Cedex, France
┴Institut Charles Sadron, UPR 22 CNRS, Université de Strasbourg, 23 rue du Loess, 67034
Strasbourg, France
Small angle neutron scattering – Raw intensity curves. The SANS curves are
presented for vesicles made of PDMS22-g-PEO12 (Dow Corning) in various hypertonic and
hypotonic conditions. All measurements were performed in 5 mm-thick quartz cells. The
isotonic samples (0/0 and 1000 mM/1000 mM glucose in D2O) had a concentration of 10
mg/mL. The hypertonic samples were almost as concentrated as the initial ones (e.g. 9.75 g/L
for the 0/100mM samples). The hypotonic samples had a lower weight concentration due to

This document is the Accepted Manuscript version of a Published Work that appeared in final form in ACS Nano, 2013. 7 (10): 9298–9311, copyright © American Chemical Society after peer review and technical editing by the publisher. To access the final edited and published work see http://pubs.acs.org/doi/abs/10.1021/nn4039589
39
dilution by pure D2O (e.g. 7.5 g/L for the 1000 mM/750 mM samples). The SANS profiles
plotted on Figure S1 are normalized by the polymer concentration.
a)
0.01
0.1
1
10
100
1000
104
0.001 0.01 0.1 1
Hypertonic Conditions PDMS-g-PEO
PDMS 0 Atm
PDMS -2.44Atm
PDMS -6.11 Atm
I
q (Å-1)
b)
0.01
0.1
1
10
100
1000
104
0.001 0.01 0.1 1
Hypotonic conditions PDMS-g-PEO
PDMS 0 atm
PDMS 6.11 Atm
PDMS 12.22 Atm
I
q (Å-1)
Figure S1. SANS curves for PDMS-g-PEO vesicles in hypertonic conditions (a) and
hypotonic conditions (b).
It is clear than in hypertonic conditions (Fig. S1a), PDMS-g-PEO polymersomes undergo
modifications, presumably the formation of nested vesicles, whereas they do not change in
hypotonic conditions (Fig. S1b). This is an interesting result of the SANS study as it is
similar to direct observations of PDMS-g-PEO giant vesicles, for which the invariance of the
vesicle size in hypotonic condition was attributed to a fast swell burst cycle.16
We evaluated the radii of gyration of the vesicles in the Guinier (low q) regime and their
membrane thicknesses using the Kratky-Porod approximation in the intermediate q regime
(LnI×q2 varying like -q2H2/12). In hypertonic conditions, we observed a slight decrease of the
radius of gyration (from 43 nm to 35 nm). The membrane thicknesses H deduced by Kratky-
Porod plots seems to be unchanged for PDMS-g-PEO (~6.4 nm). In hypotonic conditions, the
radius of gyration and membrane thickness remain unchanged.
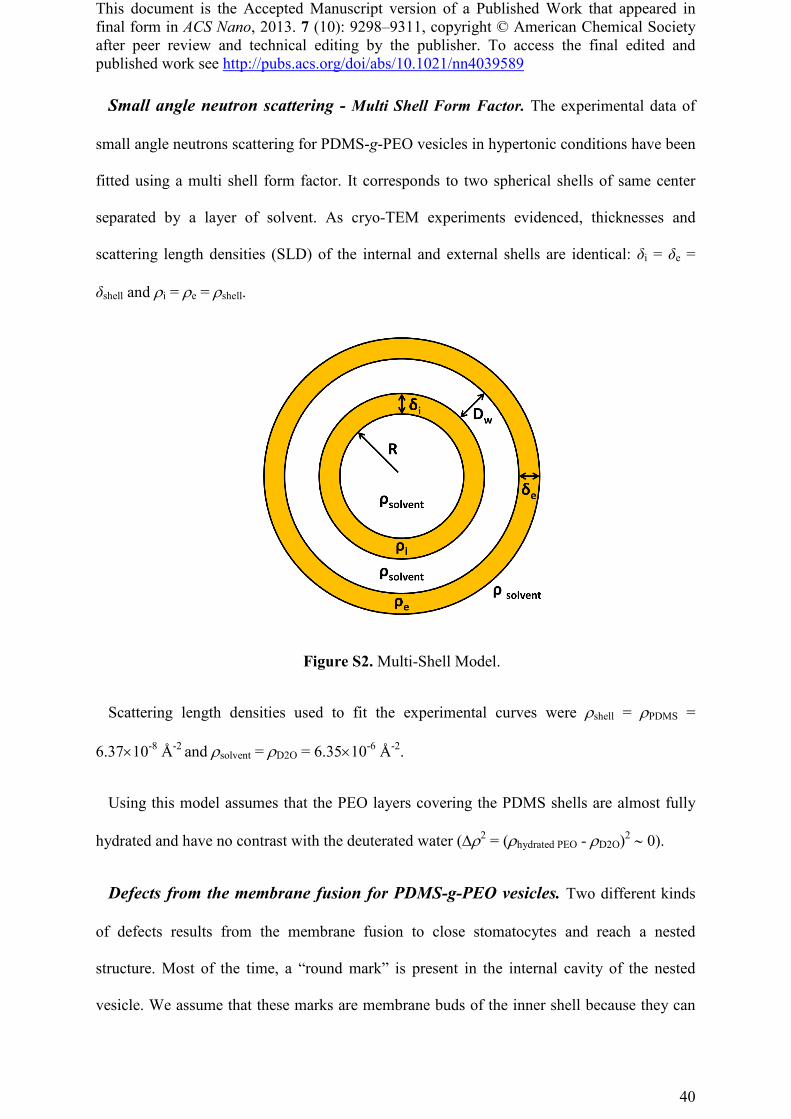
This document is the Accepted Manuscript version of a Published Work that appeared in final form in ACS Nano, 2013. 7 (10): 9298–9311, copyright © American Chemical Society after peer review and technical editing by the publisher. To access the final edited and published work see http://pubs.acs.org/doi/abs/10.1021/nn4039589
40
Small angle neutron scattering - Multi Shell Form Factor. The experimental data of
small angle neutrons scattering for PDMS-g-PEO vesicles in hypertonic conditions have been
fitted using a multi shell form factor. It corresponds to two spherical shells of same center
separated by a layer of solvent. As cryo-TEM experiments evidenced, thicknesses and
scattering length densities (SLD) of the internal and external shells are identical: δi = δe =
δshell and ρi = ρe = ρshell.
Figure S2. Multi-Shell Model.
Scattering length densities used to fit the experimental curves were ρshell = ρPDMS =
6.37×10⁻⁸ Å-2 and ρsolvent = ρD2O = 6.35×10⁻⁶ Å-2.
Using this model assumes that the PEO layers covering the PDMS shells are almost fully
hydrated and have no contrast with the deuterated water (∆ρ2 = (ρhydrated PEO - ρD2O)2 ∼ 0).
Defects from the membrane fusion for PDMS-g-PEO vesicles. Two different kinds
of defects results from the membrane fusion to close stomatocytes and reach a nested
structure. Most of the time, a “round mark” is present in the internal cavity of the nested
vesicle. We assume that these marks are membrane buds of the inner shell because they can
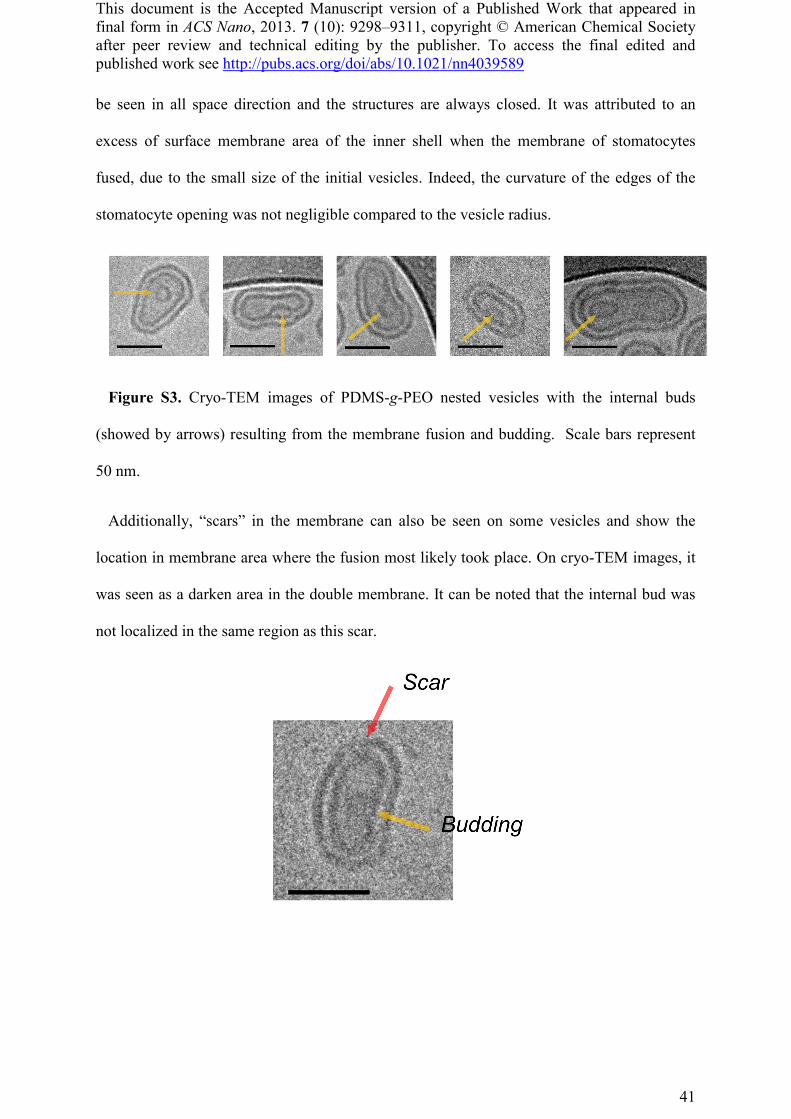
This document is the Accepted Manuscript version of a Published Work that appeared in final form in ACS Nano, 2013. 7 (10): 9298–9311, copyright © American Chemical Society after peer review and technical editing by the publisher. To access the final edited and published work see http://pubs.acs.org/doi/abs/10.1021/nn4039589
41
be seen in all space direction and the structures are always closed. It was attributed to an
excess of surface membrane area of the inner shell when the membrane of stomatocytes
fused, due to the small size of the initial vesicles. Indeed, the curvature of the edges of the
stomatocyte opening was not negligible compared to the vesicle radius.
Figure S3. Cryo-TEM images of PDMS-g-PEO nested vesicles with the internal buds
(showed by arrows) resulting from the membrane fusion and budding. Scale bars represent
50 nm.
Additionally, “scars” in the membrane can also be seen on some vesicles and show the
location in membrane area where the fusion most likely took place. On cryo-TEM images, it
was seen as a darken area in the double membrane. It can be noted that the internal bud was
not localized in the same region as this scar.
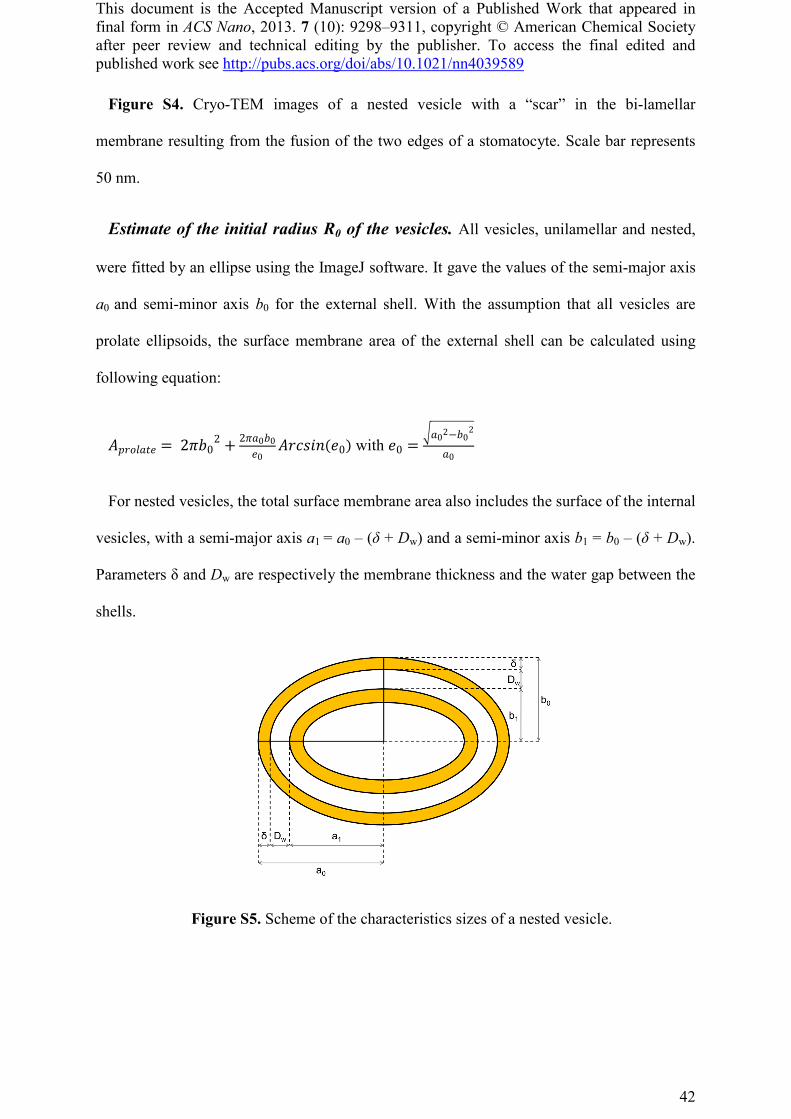
This document is the Accepted Manuscript version of a Published Work that appeared in final form in ACS Nano, 2013. 7 (10): 9298–9311, copyright © American Chemical Society after peer review and technical editing by the publisher. To access the final edited and published work see http://pubs.acs.org/doi/abs/10.1021/nn4039589
42
Figure S4. Cryo-TEM images of a nested vesicle with a “scar” in the bi-lamellar
membrane resulting from the fusion of the two edges of a stomatocyte. Scale bar represents
50 nm.
Estimate of the initial radius R0 of the vesicles. All vesicles, unilamellar and nested,
were fitted by an ellipse using the ImageJ software. It gave the values of the semi-major axis
a0 and semi-minor axis b0 for the external shell. With the assumption that all vesicles are
prolate ellipsoids, the surface membrane area of the external shell can be calculated using
following equation:
𝐴𝑝𝑝𝑝𝑝𝑝𝑝𝑝 = 2𝜋𝑏02 + 2𝜋𝑝0𝑏0
𝑝0𝐴𝑝𝐴𝐴𝐴𝐴(𝑝0) with 𝑝0 =
�𝑝02−𝑏02
𝑝0
For nested vesicles, the total surface membrane area also includes the surface of the internal
vesicles, with a semi-major axis a1 = a0 – (δ + Dw) and a semi-minor axis b1 = b0 – (δ + Dw).
Parameters δ and Dw are respectively the membrane thickness and the water gap between the
shells.
Figure S5. Scheme of the characteristics sizes of a nested vesicle.
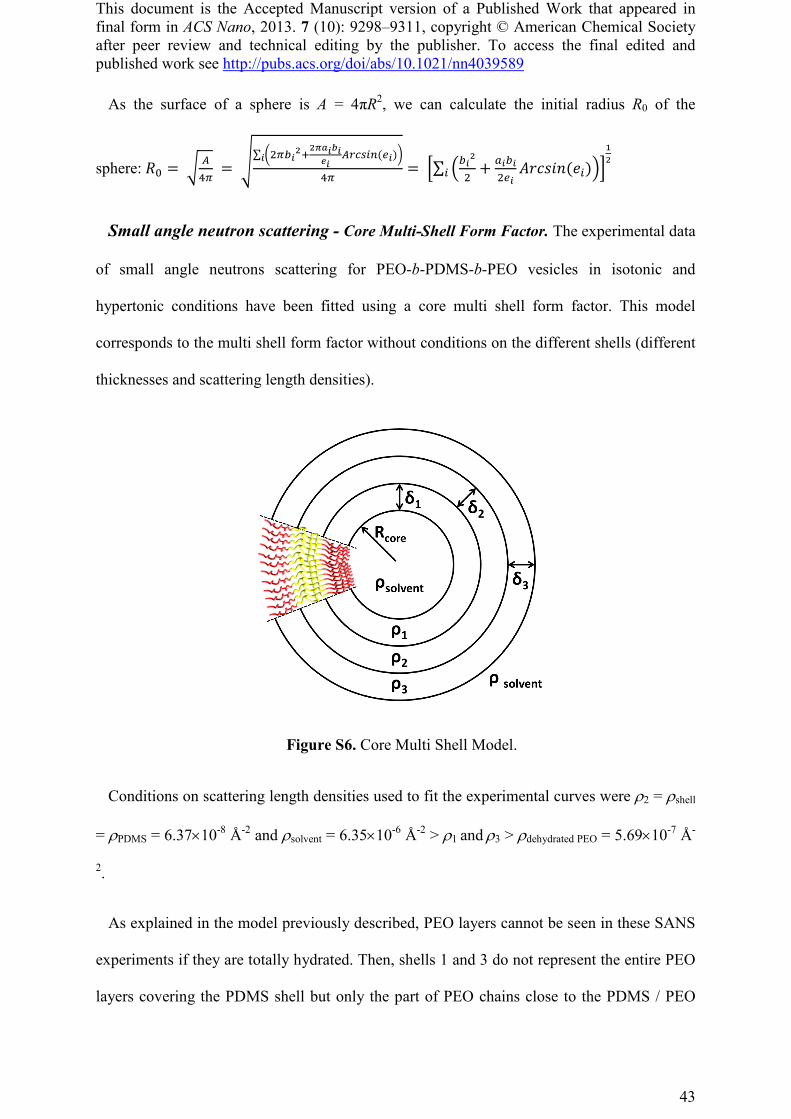
This document is the Accepted Manuscript version of a Published Work that appeared in final form in ACS Nano, 2013. 7 (10): 9298–9311, copyright © American Chemical Society after peer review and technical editing by the publisher. To access the final edited and published work see http://pubs.acs.org/doi/abs/10.1021/nn4039589
43
As the surface of a sphere is A = 4πR2, we can calculate the initial radius R0 of the
sphere: 𝑅0 = � 𝐴4𝜋
= �∑ �2𝜋𝑏𝑖2+
2𝜋𝑎𝑖𝑏𝑖𝑒𝑖
𝐴𝐴𝐴𝐴𝐴𝐴(𝑒𝑖)�𝑖
4𝜋= �∑ �𝑏𝑖
2
2+ 𝑎𝑖𝑏𝑖
2𝑒𝑖𝐴𝑝𝐴𝐴𝐴𝐴(𝑝𝐴)�𝐴 �
12
Small angle neutron scattering - Core Multi-Shell Form Factor. The experimental data
of small angle neutrons scattering for PEO-b-PDMS-b-PEO vesicles in isotonic and
hypertonic conditions have been fitted using a core multi shell form factor. This model
corresponds to the multi shell form factor without conditions on the different shells (different
thicknesses and scattering length densities).
Figure S6. Core Multi Shell Model.
Conditions on scattering length densities used to fit the experimental curves were ρ2 = ρshell
= ρPDMS = 6.37×10⁻⁸ Å-2 and ρsolvent = 6.35×10⁻⁶ Å-2 > ρ1 and ρ3 > ρdehydrated PEO = 5.69×10⁻⁷ Å-
2.
As explained in the model previously described, PEO layers cannot be seen in these SANS
experiments if they are totally hydrated. Then, shells 1 and 3 do not represent the entire PEO
layers covering the PDMS shell but only the part of PEO chains close to the PDMS / PEO
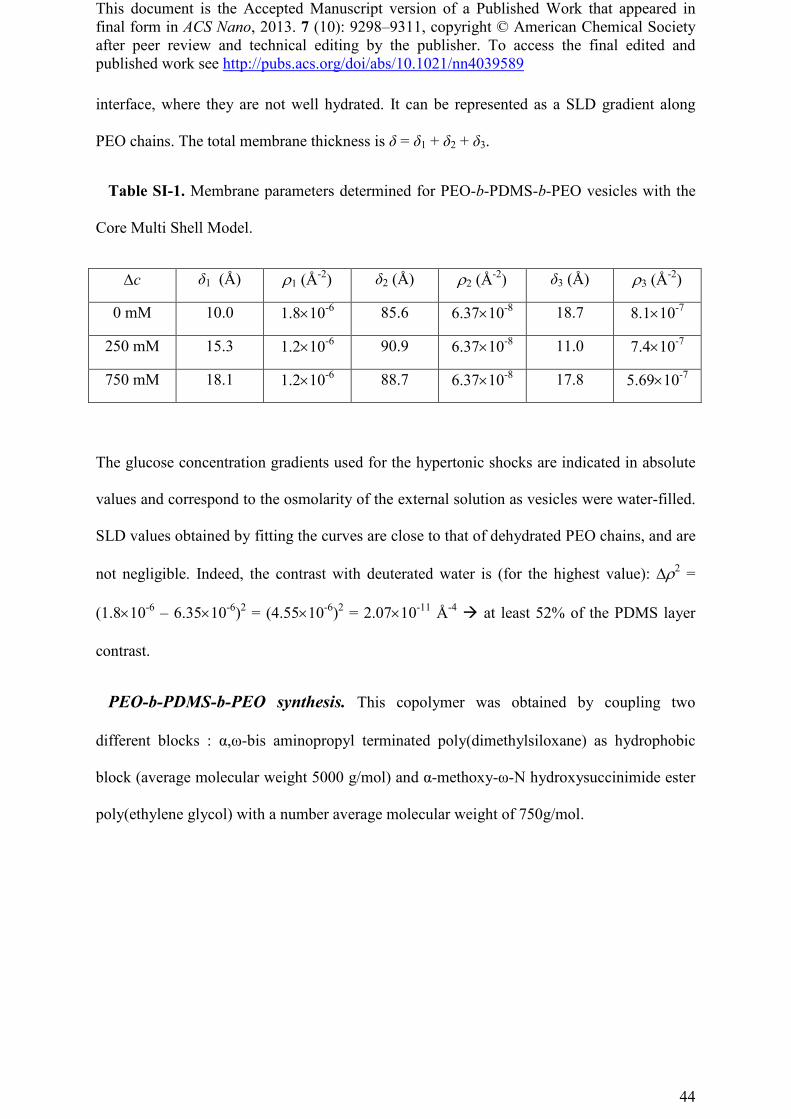
This document is the Accepted Manuscript version of a Published Work that appeared in final form in ACS Nano, 2013. 7 (10): 9298–9311, copyright © American Chemical Society after peer review and technical editing by the publisher. To access the final edited and published work see http://pubs.acs.org/doi/abs/10.1021/nn4039589
44
interface, where they are not well hydrated. It can be represented as a SLD gradient along
PEO chains. The total membrane thickness is δ = δ1 + δ2 + δ3.
Table SI-1. Membrane parameters determined for PEO-b-PDMS-b-PEO vesicles with the
Core Multi Shell Model.
∆c δ1 (Å) ρ1 (Å-2) δ2 (Å) ρ2 (Å-2) δ3 (Å) ρ3 (Å-2)
0 mM 10.0 1.8×10⁻⁶ 85.6 6.37×10⁻⁸ 18.7 8.1×10⁻⁷
250 mM 15.3 1.2×10⁻⁶ 90.9 6.37×10⁻⁸ 11.0 7.4×10⁻⁷
750 mM 18.1 1.2×10⁻⁶ 88.7 6.37×10⁻⁸ 17.8 5.69×10⁻⁷
The glucose concentration gradients used for the hypertonic shocks are indicated in absolute
values and correspond to the osmolarity of the external solution as vesicles were water-filled.
SLD values obtained by fitting the curves are close to that of dehydrated PEO chains, and are
not negligible. Indeed, the contrast with deuterated water is (for the highest value): ∆ρ2 =
(1.8×10⁻⁶ – 6.35×10⁻⁶)2 = (4.55×10⁻⁶)2 = 2.07×10⁻¹¹ Å-4 at least 52% of the PDMS layer
contrast.
PEO-b-PDMS-b-PEO synthesis. This copolymer was obtained by coupling two
different blocks : α,ω-bis aminopropyl terminated poly(dimethylsiloxane) as hydrophobic
block (average molecular weight 5000 g/mol) and α-methoxy-ω-N hydroxysuccinimide ester
poly(ethylene glycol) with a number average molecular weight of 750g/mol.
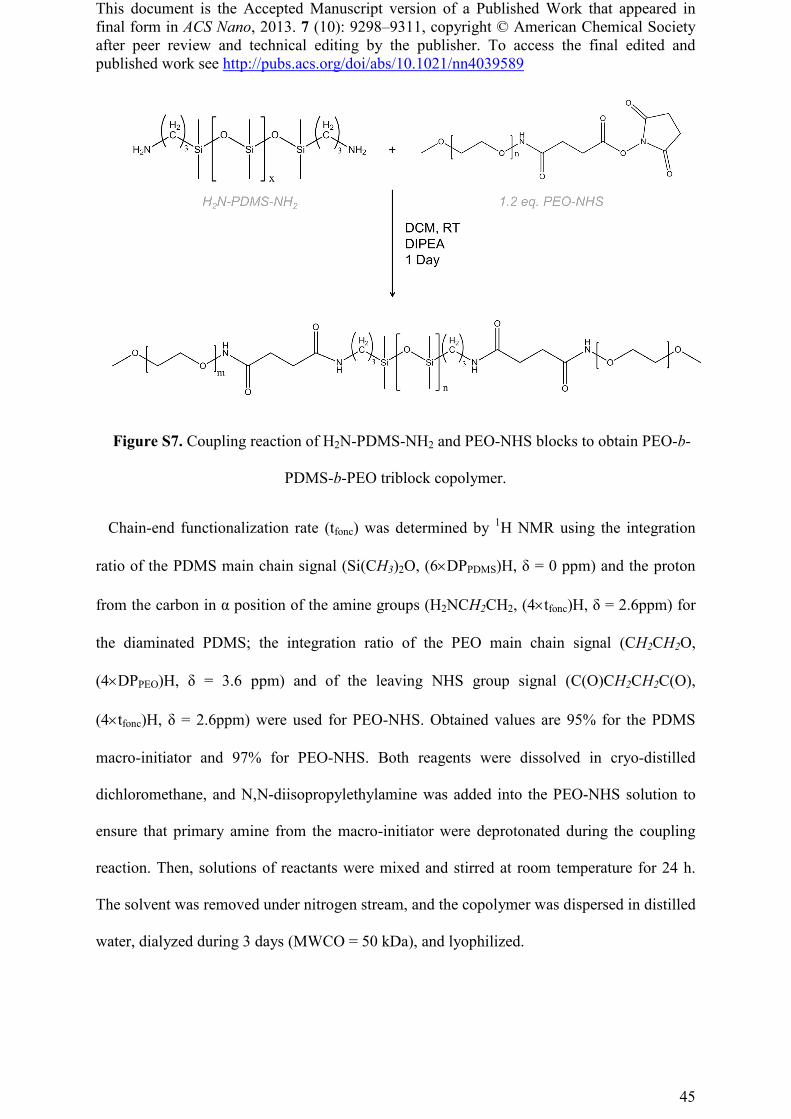
This document is the Accepted Manuscript version of a Published Work that appeared in final form in ACS Nano, 2013. 7 (10): 9298–9311, copyright © American Chemical Society after peer review and technical editing by the publisher. To access the final edited and published work see http://pubs.acs.org/doi/abs/10.1021/nn4039589
45
Figure S7. Coupling reaction of H2N-PDMS-NH2 and PEO-NHS blocks to obtain PEO-b-
PDMS-b-PEO triblock copolymer.
Chain-end functionalization rate (tfonc) was determined by 1H NMR using the integration
ratio of the PDMS main chain signal (Si(CH3)2O, (6×DPPDMS)H, δ = 0 ppm) and the proton
from the carbon in α position of the amine groups (H2NCH2CH2, (4×tfonc)H, δ = 2.6ppm) for
the diaminated PDMS; the integration ratio of the PEO main chain signal (CH2CH2O,
(4×DPPEO)H, δ = 3.6 ppm) and of the leaving NHS group signal (C(O)CH2CH2C(O),
(4×tfonc)H, δ = 2.6ppm) were used for PEO-NHS. Obtained values are 95% for the PDMS
macro-initiator and 97% for PEO-NHS. Both reagents were dissolved in cryo-distilled
dichloromethane, and N,N-diisopropylethylamine was added into the PEO-NHS solution to
ensure that primary amine from the macro-initiator were deprotonated during the coupling
reaction. Then, solutions of reactants were mixed and stirred at room temperature for 24 h.
The solvent was removed under nitrogen stream, and the copolymer was dispersed in distilled
water, dialyzed during 3 days (MWCO = 50 kDa), and lyophilized.
This document is the Accepted Manuscript version of a Published Work that appeared in final form in ACS Nano, 2013. 7 (10): 9298–9311, copyright © American Chemical Society after peer review and technical editing by the publisher. To access the final edited and published work see http://pubs.acs.org/doi/abs/10.1021/nn4039589
46
The success of the coupling between PEO-NHS and H2N-PDMS-NH2 macro-initiator was
monitored using 1H NMR. Before coupling, the signal for carbon’s proton at the chain end of
the macro-initiator corresponds to amine groups (H2NCH2CH2, δ = 2.6ppm). After coupling,
this signal is significantly shifted and corresponds to amide groups (RCONHCH2CH2, δ =
3.1ppm), attesting that all chain end functions reacted with PEO-NHS. Disappearance of
proton signal from the NHS leaving group of PEO-NHS reactants confirms the success of the
reaction and of the dialysis (to remove all unreacted products).
Figure S8. 1H NMR spectrum in CDCl3 for PEO-NHS blocks (upper curve), H2N-PDMS-
NH2 (middle curve) and PEO-b-PDMS-b-PEO triblock copolymer (lower curve).
Hydrodynamic radius measurements by Dynamic Light Scattering. The proper
solution viscosities used for the hydrodynamic radius measurements were determined thank
to a 2nd order polynomial fit of viscosity measurements carried out on glucose solutions.
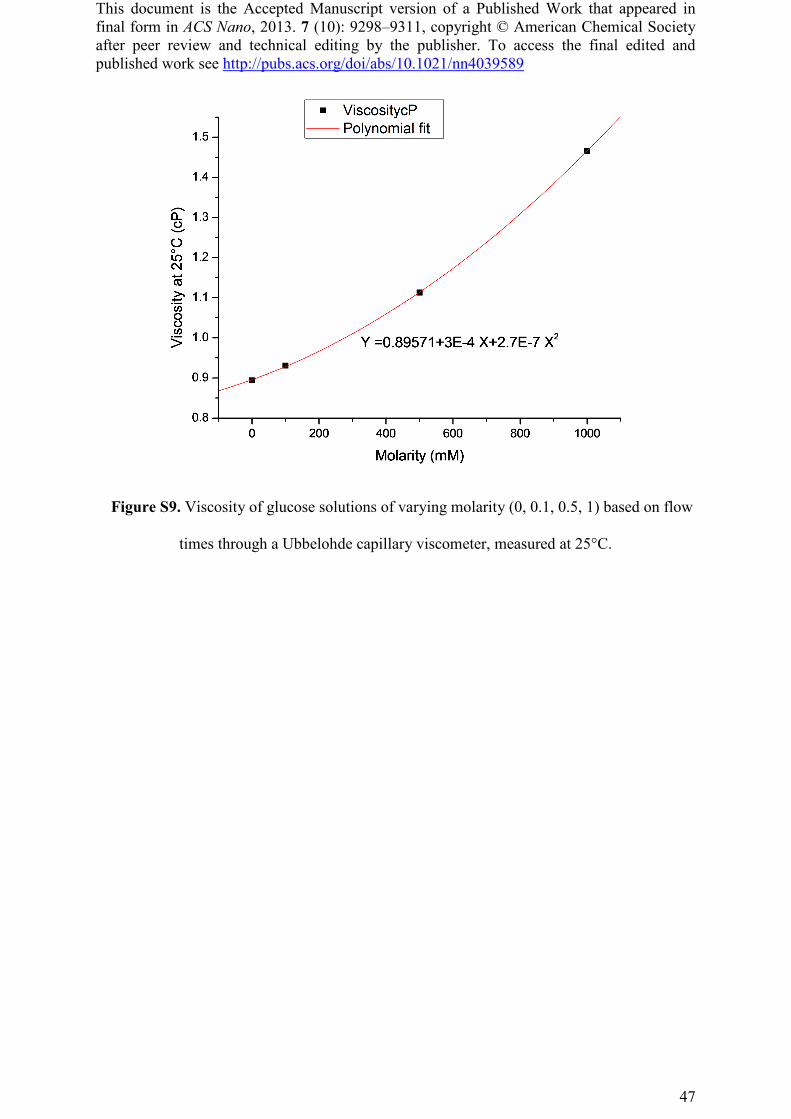
This document is the Accepted Manuscript version of a Published Work that appeared in final form in ACS Nano, 2013. 7 (10): 9298–9311, copyright © American Chemical Society after peer review and technical editing by the publisher. To access the final edited and published work see http://pubs.acs.org/doi/abs/10.1021/nn4039589
47
Figure S9. Viscosity of glucose solutions of varying molarity (0, 0.1, 0.5, 1) based on flow
times through a Ubbelohde capillary viscometer, measured at 25°C.