POLYMERISATION KINETICS AND OPTICAL PHENOMENA OF …etheses.bham.ac.uk/1730/1/Hadis_11_PhD.pdf ·...
222
POLYMERISATION KINETICS AND OPTICAL PHENOMENA OF PHOTOACTIVE DENTAL RESINS By MOHAMMED ABDUL HADIS A thesis submitted to the Faculty of Medicine and Dentistry of the University of Birmingham for the degree of DOCTOR OF PHILOSOPHY Biomaterials Unit School of Dentistry St. Chad‟s Queensway Birmingham B4 6NN March 2011
Transcript of POLYMERISATION KINETICS AND OPTICAL PHENOMENA OF …etheses.bham.ac.uk/1730/1/Hadis_11_PhD.pdf ·...
POLYMERISATION KINETICS AND OPTICAL PHENOMENA OF
PHOTOACTIVE DENTAL RESINS
By
MOHAMMED ABDUL HADIS
A thesis submitted to the
Faculty of Medicine and Dentistry
of the
University of Birmingham
for the degree of
DOCTOR OF PHILOSOPHY
Biomaterials Unit
School of Dentistry
St. Chad‟s Queensway
Birmingham B4 6NN
March 2011
University of Birmingham Research Archive
e-theses repository This unpublished thesis/dissertation is copyright of the author and/or third parties. The intellectual property rights of the author or third parties in respect of this work are as defined by The Copyright Designs and Patents Act 1988 or as modified by any successor legislation. Any use made of information contained in this thesis/dissertation must be in accordance with that legislation and must be properly acknowledged. Further distribution or reproduction in any format is prohibited without the permission of the copyright holder.
SYNOPSIS
Globally, the use of resin based composites (RBCs) is increasing but several
shortcomings remain. This may be related to problems associated with incomplete
conversion (40-70%), polymerisation shrinkage (1-4% by volume) and the associated
stress generated at the tooth/restoration interface. Additionally, the increased number
of technique sensitive incremental steps required to fill relatively large cavities is due
to inefficient light transmission at depths greater than 2 mm. Accordingly, the change
in optical properties and the setting reaction of RBC materials is not well understood.
An interesting approach to control the setting reaction is by the application of the
exposure reciprocity law. Therefore the current investigation demonstrates the
applicability of this law with regards to monomer composition, filler percentage and
photoinitaitor type on degree of conversion with the aim of a better understanding of
the setting reaction. Although appropriate resin matrix chemistry and photoinitiator
chemistry may provide potential for reduced curing time, inadequate cure depths
remain without appropriate filler adaptation.
The development of techniques that will allow dynamic monitoring of optical
and physical change during cure will further aid material development with the goal
of improved depths of cure and will allow such restorations to be cured with one
„shot‟. The current investigation has demonstrated the use of several analytical
techniques (FT-IR spectroscopy, UV-Vis Spectroscopy and low coherence
interferometry) which will aid such developments. UV-Vis spectroscopy and low
coherence interferometry may have some significance towards a better understanding
of the dynamic changes of optical properties of RBC materials. UV-Vis Spectroscopy
may be used to monitor the decomposition of the photoinitiator which will improve
light transmission and low coherence interferometry can be used to monitor both
refractive index and physical thickness change. The current study demonstrated the
complexity of optical phenomena within RBCs which are affected by material
composition as well as cavity dimensions.
Whilst research continues to develop a novel RBC with reduced shrinkage and
improved depths of cure, there is currently no commercially available solution to such
problems. Consequently a better understanding of the setting reaction, optical
properties and physical properties will aid material development.
ACKNOWLEDGEMENTS
Firstly and foremost I would like to sincerely thank both my supervisors, Dr WM
Palin and Dr AC Shortall for their excellent supervision, advice and support
throughout this PhD. I would like to extend my warmest thanks to Dr Palin for his
continual encouragement, advice, guidance and patience which made this all possible.
I would also like to extend my gratitude to Dr Shortall for his aptitude for statistics
throughout this PhD.
I am extremely grateful to the University of Birmingham, School of Dentistry and
ESPRC for funding this PhD and giving me the opportunity to research at the
forefront of material science. I am also grateful to 3M ESPE and Kuraray for kindly
donating materials towards this research and Heraeus Kulzer for the travel grant
which allowed me to attend the 88th
IADR session in Barcelona.
I would like to express my gratitude to Dr P Tomlins and the National Physical
Laboratory for all their support, advice and assistance in setting up Dynacure.
I would also like to express my gratitude to Mrs S Fisher and Dr J Wilson for their
day to day technical assistance and to the administrative staff for their assistance
dealing with the associated bureaucracy. I would also like to thank Mrs G Smith, Dr
KC Carter and Dr O Addison for their technical assistance and advice.
Special thanks goes out to my international colleagues, Dr J Leprince, Professor JL
Ferracance, Professor J Devaux and Dr G Leloup for their useful discussion and
advice. I would like to extend my gratitude to Dr J Leprince and the Université
catholique de Louvvain for their assistance in rheology measurments.
Finally, I would like to thank all my friends, family and postgraduate students for
their support, patience and encouragement throughout this PhD, without whom this
would truly be impossible.

DEDICATED TO MY FAMILY
i
TABLE OF CONTENTS
CHAPTER 1 Introduction and Literature Review
1.0 Historical perspectives ....................................................................................... 1
1.1 Resin based composites .................................................................................. 2
1.1.1 Aesthetic quality ......................................................................................... 3
1.1.2 Composition ................................................................................................ 4
1.1.3 Resin matrix ................................................................................................ 4
1.1.4 Fillers .......................................................................................................... 9
1.1.5 Inhibitors ................................................................................................... 11
1.1.6 Pigments and UV absorbers ...................................................................... 12
1.1.7 Photoinitiators ........................................................................................... 13
1.1.7.1 Camphoroquinone ................................................................................. 13
1.1.7.2 Alternative photoinitaitors .................................................................... 16
1.1.7.3 Lucirin TPO .......................................................................................... 19
1.2 Photo-induced Polymerisation ..................................................................... 20
1.2.1 The kinetics of polymerisation.................................................................. 21
1.2.2 The problem of polymerisation shrinkage and shrinkage stress ............... 23
1.3 Applications of Resin Based Composites .................................................... 25
1.4 Light-Curing Technology ............................................................................ 26
1.4.1 The quartz-tungsten halogen bulb ............................................................. 27
1.4.2 Plasma-arc lamps ...................................................................................... 27
1.4.3 Argon ion-lasers ........................................................................................ 28
1.4.4 Light emitting diodes ................................................................................ 28
1.4.5 The importance of spectral emission/absorption overlap ......................... 30
1.4.6 The use of alternative curing protocols to reduce shrinkage stress .......... 31
1.5 The Exposure Reciprocity Law ................................................................... 32
1.6 Optical and Physical Properties of Resin Based Composites ..................... 35
1.6.1 Degree of conversion ................................................................................ 36
1.6.1.1 Fourier transform infra-red spectroscopy ............................................. 37
1.6.1.2 An alternative to infra-red spectroscopy ............................................... 39
1.6.2 Light transport through photocurable resins ............................................. 40
1.6.3 Refractive index ........................................................................................ 41
1.6.3.1 Contribution of low coherence interferometry ..................................... 43
1.6.4 Colour ....................................................................................................... 45
1.6.4.1 Colorimetric spectrometry .................................................................... 46
1.7 Summary ...................................................................................................... 48
1.7.1 Aims of the present investigation ............................................................. 49
References ................................................................................................................ 51
ii
CHAPTER 2 Polymerisation Kinetics of Resin Based Composites
2.0 Polymerisation Kinetics of Resin Based Composites ...................................... 65
2.1 High Irradiance Curing and the Applicability of the Exposure
Reciprocity Law in Commercial Dental Resin-Based Materials ........................... 66
2.1.1 Abstract ..................................................................................................... 66
2.1.2 Introduction ............................................................................................... 67
2.1.3 Materials and Methods .............................................................................. 69
2.1.4 Results ....................................................................................................... 73
2.1.5 Discussion ................................................................................................. 82
2.1.6 Conclusion ................................................................................................ 86
2.2 Further Anomalies of the Exposure Reciprocity Law in Model
Photoactive Resin Based Materials ......................................................................... 87
2.2.1 Abstract ..................................................................................................... 87
2.2.2 Introduction ............................................................................................... 88
2.2.3 Materials and Methods .............................................................................. 89
2.2.4 Results ....................................................................................................... 91
2.2.5 Discussion ................................................................................................. 95
2.2.6 Conclusion ................................................................................................ 97
2.3 Photoinitiator Type and Applicability of the Exposure Reciprocity Law
in Filled and Unfilled Photoactive Resins ............................................................... 98
2.3.1 Abstract ..................................................................................................... 98
2.3.2 Introduction ............................................................................................... 99
2.3.3 Materials and Methods ............................................................................ 101
2.3.4 Results ..................................................................................................... 102
2.3.5 Discussion ............................................................................................... 108
2.3.6 Conclusion .............................................................................................. 111
2.4 Summary .................................................................................................... 112
References .............................................................................................................. 114
iii
CHAPTER 3 Optical Phenomena of Photoactive Dental Resins
3.0 Optical Phenomena of Photoactive Dental Resins ........................................ 118
3.1 Competitive Light Absorbers in Photoactive Resin-Based Materials ...... 119
3.1.1 Abstract ................................................................................................... 119
3.1.2 Introduction ............................................................................................. 120
3.1.3 Materials and Methods ............................................................................ 123
3.1.4 Results ..................................................................................................... 130
3.1.5 Discussion ............................................................................................... 138
3.1.6 Conclusion .............................................................................................. 143
3.2 Dynamic Monitoring of Refractive Index Change Through Photoactive
Resins .................................................................................................................... 144
3.2.1 Abstract ................................................................................................... 144
3.2.2 Introduction ............................................................................................. 145
3.2.3 Materials and Methods ............................................................................ 148
3.2.4 Results ..................................................................................................... 152
3.2.5 Discussion ............................................................................................... 158
3.2.6 Conclusion .............................................................................................. 161
3.3 Specimen Aspect Ratio Affects Light-Transmission in Photoactive
dental resins ........................................................................................................... 162
3.3.1 Abstract ................................................................................................... 162
3.3.2 Introduction ............................................................................................. 163
3.3.3 Materials and Methods ............................................................................ 166
3.3.4 Results ..................................................................................................... 172
3.3.5 Discussion ............................................................................................... 179
3.3.6 Conclusion .............................................................................................. 185
3.4 Summary .................................................................................................... 186
References .............................................................................................................. 188

iv
CHAPTER 4 Recommendations for Further Work
4.0 Recommendations for Further Work ........................................................... 195
APPENDIX ................................................................................................................ 199
PUBLICATIONS
Hadis MA, Tomlins PH, Shortall AC, Palin WM. Dynamic monitoring of refractive
index change through photoactive resins. Dental Materials, 2010; 26: 1106-1112.
Leprince JG, Hadis M, Shortall AC, Ferracane JL, Devaux J, Leloup G, and Palin
WM. Photoinitiator type and applicability of exposure reciprocity law in filled and
unfilled photoactive resins. Dental Materials, 2011; 27: 157-164.
SUBMITTED FOR PUBLICATION
Hadis M, Leprince JG, Leloup G, Devaux J, Shortall AC, and Palin WM. High
irradiance curing and anomalies of exposure reciprocity law in resin-based materials.
Submitted to Journal of Dentistry.
Hadis M, Shortall AC, and Palin WM. Competitive light absorbers in photoactive
dental materials. Submitted to Acta Biomaterialia.
AWARDS
Heraeus Kulzer travel award for innovation in material testing. International
Association of Dental Research, Barcelona, Spain, 2010.
Paffenbarger award. Acadamy of Dental Materials, Portland, USA, 2009.
v
DECLARATION
I hereby declare that this thesis is my own work and effort. Where other sources of
information have been used, they have been acknowledged.
This thesis consists of two experimental Chapters with six sections in the form
published and submitted papers with contributions from the following people other
than the primary supervisors:
Chapter 2.1: High Irradiance Curing and the Applicability of the
Exposure Reciprocity Law in Commercial Dental Resin-Based Materials
Leprince JG – Named Author/ Rheology measurements
Leloup G – Named Author
Devaux J – Named Author
Chapter 2.2: Further Anomalies of the Exposure Reciprocity Law in
Model Photoactive Resin Based Materials.
Leprince JG – Named Author
Leloup G – Named Author
Devaux J – Named Author
Chapter 2.3: Photoinitiator Type and Applicability of the Exposure
Reciprocity Law in Filled and Unfilled Photoactive Resins.
Leprince JG – Co-Author
Leloup G – Named Author
Devaux J – Named Author
Ferracane JL – Named Author
Chapter 3.2: Dynamic Monitoring of Refractive Index Change Through
Photoactive Resins.
Tomlins P – Named Author/ Static Refractive Index Measurements
vi
LIST OF MAIN ABBREVIATIONS
b: Change in b value of the CIELAB system
E: Colour change value
T: Change in temperature
TMax
: Maximum change in temperature
MaxDC : Maximum degree of conversion
Max
pR : Maximum rate of polymerisation
pR : Rate of polymerisation
ANOVA: Analysis of variance
BHT: Butylated hydroxy toluene
Bis-GMA: bisphenol A glycidyl dimethacrylate
CQ: Camphoroquinone
DC: Degree of conversion
DMAEMA: Di-methyl-aminoethyl methacrylate
DOC: Depth of cure
FT-NIRS: Fourier-transform near infrared spectroscopy
HF: High filled
LCI: Low coherence interferometry
LF: Low Filled
NIR: Near infra-red
PI: Photoinitiator
RBCs: Resin based composites
RI: Refractive Index
TEGDMA: triethylene glycol dimethacrylate
UF: Unfilled
UV-Vis: Ultra-Violet-Visible
vii
LIST OF FIGURES
Figure No. Page
1.1.1
1.1.2
1.1.3
1.1.4
1.1.5
1.1.6
1.1.7
1.2.1
1.4.1
1.6.1
1.6.2
1.6.3
1.6.4
2.1.1
2.1.2
The chemical structure of the base and diluent monomers used in
RBC materials.
The chemical structure of the lower molecular weight base monomer,
UDMA compared to Bis-GMA, which contains urethane functional
groups.
The chemical structures of the common inhibitors used in RBCs
The production of free radicals during initiation in resins and RBCs
containing camphoroquinone and an amine reducing agent.
Chemical structures of co-initiators/ photo sensitisers used in photo-
active RBCs.
The chemical structures of alternative photoinitaitors used in RBCs.
The production of free radicals during initiation in resins and RBCs
containing Lucirin TPO.
The schematic representation of the initiation and propagation process
during photopolymerisation. (1), (2), (3) and (n) represent the
theoretical steps of linear monomer addition.
Schematic representation of the spectral irradiance of the different
types of light curing units. (Modified from Price et al., 2010)
The electromagnetic spectrum and the associated wavelength and
energies. (Adopted from www.antonine-education.co.uk, 10/12/2010)
Schematic representation of the refraction of radiation through two
media and the refractive index.
Schematic representation of a Michelson Interferometer
The illuminating/viewing configurations as recommended by CIE for
materials with diffuse reflecting surfaces. (a) and (b) are illuminated
by a standard illuminant and detected at 45○. (c) and (d) are
illuminated by a standard illuminant and detected at 0○.
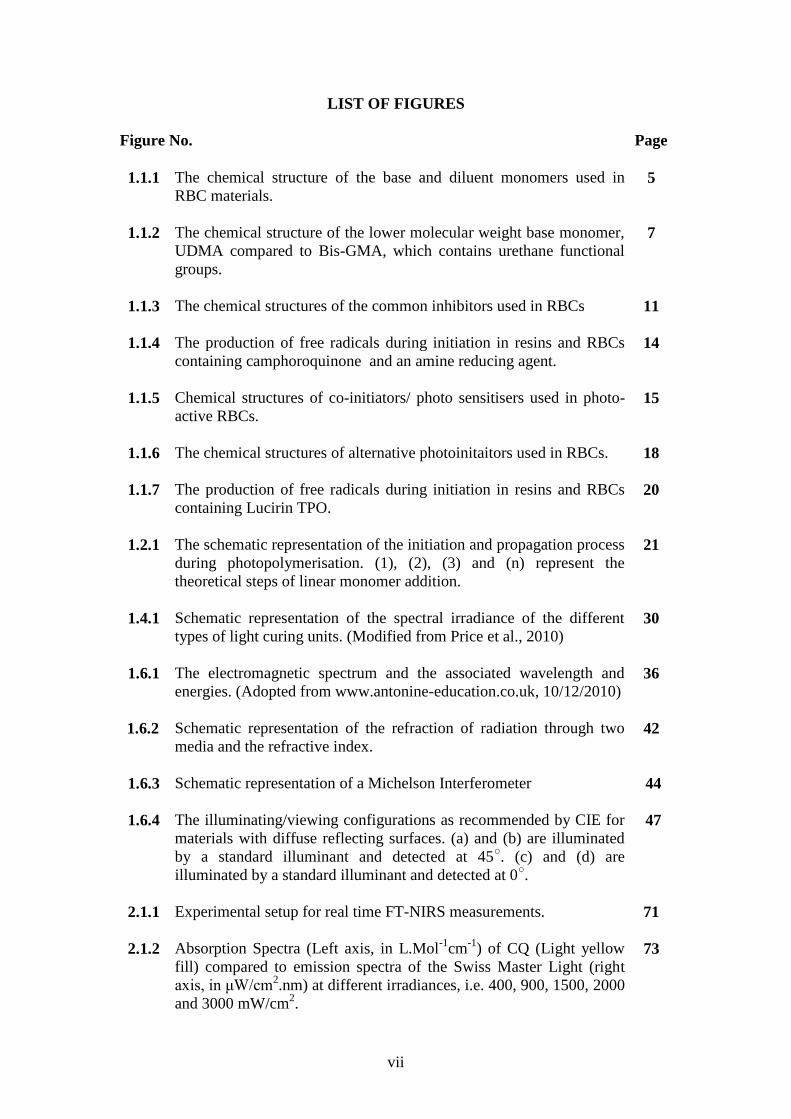
Experimental setup for real time FT-NIRS measurements.
Absorption Spectra (Left axis, in L.Mol-1
cm-1
) of CQ (Light yellow
fill) compared to emission spectra of the Swiss Master Light (right
axis, in μW/cm2.nm) at different irradiances, i.e. 400, 900, 1500, 2000
and 3000 mW/cm2.
5
7
11
14
15
18
20
21
30
36
42
44
47
71
73
viii
2.1.3
2.1.4
2.1.5
2.2.1
2.3.1
2.3.2
2.3.3
2.3.4
3.1.1
3.1.2
The main affects of manufacturer, composite type (restorative or
flowable) and irradiation protocol for the commercial materials on
DCMax
(a). The interactions of manufacturer, composite type and
irradiation protocol of commercial materials on DCMax
(b).
The complex viscosities of the flowable composites. The error bars
represent the standard deviations (n=6) for each flowable material,
angular frequency of 10 rad/s (a) angular frequency of 0.01 rad/s (b).
T during polymerization (curing) at low irradiance (45s at 400
mW/cm2) compared to high irradiance (6s at 3000mW/cm
2) for high
viscosity resins (a) and low viscosity resins (b) filled with 40 vol%
filler in comparison to the light on its own (light) and temperature rise
in a fully cured specimen (cured).
The main effects of resin type, filler percentage and cure protocol for
DCMax
(a). The interaction of resin type, filler and cure protocol for
DCMax
(b).
The chemical structures of the photoinitaitors tested in the present
study.
Absorption spectra (left axis, in L.Mol-1
cm-1
) of Camphoroquinone
(yellow) and Lucirin TPO (purple) compared to the emission spectra
of the Swiss Master Light (right axis, in μW/cm2.nm) at different
irradiances, i.e. 400, 1500 and 3000 mW/cm2. An Improvement of the
overlap with Lucirin TPO absorption can be observed with increased
power of the curing unit.
DC (a) and Rp (b) curves in real time during 70 s for 50/50 mass%
Bis-GMA/TEGDMA resin. Blue and red curves correspond
respectively to Lucirin TPO-based and CQ-based resins. Irradiation
modes are indicated on the charts.
DC (a) and Rp (b) curves in real time during 70 s for 50/50 mass%
Bis-GMA/TEGDMA resin filled with 75 mass% fillers. Blue and red
curves correspond respectively to Lucirin TPO-based and CQ-based
resins. Irradiation modes are indicated on the charts.
Free radical (•) production with the photoinitiator system
camphorquinone/amine (a) Lucirin TPO (b) and the termination of
free radicals by the inhibitor BHT (c).
Experimental set up for the measurement of real time photoinitiator
absorption (a), degree of conversion (b) and temperature (c).
75
77
81
92
101
103
104
105
124
129
ix
3.1.3
3.1.4
3.1.5
3.2.1
3.2.2
3.2.3
3.2.4
3.3.1
3.3.2
3.3.3
3.3.4
3.3.5
Absorption spectra (left axis, in L.Mol-1
cm-1
) of camphoroquinone
(solid blue line), Lucirin TPO (broken blue line) and BHT (dotted
blue line) compared to emission spectra of the XL2500 (right axis, in
µW/cm2.nm) (a). Magnified peak for BHT (b).
Real time change in PI absorption of (a) camphoroquinone (CQ) (b)
and Lucirin TPO, measured at the maximum point of overlap of the
LCU (camphoroquinone: 470nm; Lucirin TPO: 420nm) by UV-Vis
spectroscopy.
Rp curves for (a) camphoroquinone (CQ) and (b) Lucirin TPO
measured in real-time using FT-NIR spectroscopy.
Experimental arrangement of the frequency domain low coherence
interferometry system used for dynamic monitoring of refractive
index and shrinkage of photoactive materials.
Correlation of the low coherence interferometry and conventional
Abbé techniques for measuring phase and group refractive index of
resins with increasing TEGDMA content (a) before and (b) following
cure.
The dynamic and simultaneous measurement of (a) refractive index,
(b) rate of refractive index change and (c) shrinkage strain of curing
resins with various TEGDMA/Bis-GMA ratios.
The relationship between increasing shrinkage strain and refractive
index of curing resins with various TEGDMA/Bis-GMA ratios. The
circled region highlights an inverse trend where refractive index
appears to decrease as the material cures.
Experimental arrangement for the measurement of light transmission
in real time of curing resins.
Experimental arrangement for the measurement of real time
shrinkage-strain.
Relative light transmission percentage of resin contained in black
nylon mould cavities having different aspect ratios (n=3) for the
control group (a) and for curing resins (b), which are a percentage of
their respective control group.
The Vickers hardness number of the upper and the lower surfaces of
cured specimens. The error bars represent the standard deviations of
the averages of three indents of each specimen (n=3).
Shrinkage strain data for specimens cured in black nylon moulds; (a)
total measured shrinkage strain percentage (b) the shrinkage strain per
unit mass.
131
133
137
150
154
155
157
168
170
174
175
177
x
3.3.6
3.3.7
Light transmission through resins contained in fabricated ceramic
disks which were either bonded or non-bonded (a). For the non
bonded specimens, a decrease in transmission is indicative of de-
bonding from the cavity walls. Representative digital image of micro-
cracked specimens which were bonded to the cavity walls with
Scotchbond adhesive (b). The visible micro-cracks were characterized
by an audible cracking sound.
Lens characterization and the converging/diverging of light travelling
from left to right.
178
181
xi
LIST OF TABLES
TABLE No. Page
1.1.1
1.1.2
2.1.1
2.1.2
2.1.3
2.2.1
2.3.1
2.3.2
3.1.1
3.1.2
3.1.3
3.2.1
3.2.2
3.3.1
Summary of filler properties and classification of fillers in dental
composite materials.
The absorption characteristics of photoinitaitors used in RBCs.
Resin Matrix Composition and filler mass percentage (reported by
manufacturer) and mass percentage (experimentally determined) of
commercial materials.
DCMax
, RpMax
and time to RpMax
of commercial materials. Similar
letters within boxes indicate no significant differences (p<0.05).
Total heat energy detected by the thermistor during irradiation
calculated as the integrals of the curves respectively (Figure 2.1.5).
DCMax
, RpMax
and time to RpMax
of experimental formulations. Similar
letters within boxes indicate no significant differences (p<0.05).
DCMax
, RpMax
, TMax
and depth of cure (DOC) of unfilled resins. Similar
letters within boxes indicate no significant differences (p<0.05).
DCMax
, RpMax
, TMax
and depth of cure (DOC) of filled resins. Similar
letters within boxes indicate no significant differences (p<0.05).
Photoinitaitor concentration as percentage of total weight of resin
having equimolar concentrations of camphoroquinone and Lucirin
TPO.
Colour change, temperature rise and DC for resins containing the
photoinitiator Camphoroquinone. Similar letters within the same
column represents no statistical significance (p<0.05).
Colour change, temperature rise and DC for resins containing the
photoinitiator Lucirin TPO. Similar letters within the same column
represents no statistical significance (p<0.05).
Monomer composition of the experimental resins.
The mean refractive index for resins with various TEGDMA/Bis-
GMA ratios prior to and following 7 days after initial polymerization
using two methods; low coherence interferometry (LCI) and a
conventional Abbé technique with group and phase index values.
Standard deviations are displayed in parentheses.
Mould Properties.
11
17
70
79
80
94
107
107
123
135
135
148
153
166
xii
3.3.2
Comparison of light transmission, strain and Vickers hardness data of
each specimen group. The tables represent the comparison between
thickness at constant height (a) and diameter at constant thickness (b).
Similar letters within each column represents no significant
differences.
173

CHAPTER 1
Introduction and Literature Review
1
1.0 Historical perspectives
The need for the artificial replacement of missing body parts has existed for
thousands of years in order to improve and maintain primary health as-well as primary
oral health. The latter includes prevention and management of dental caries and
periodontal disease and improvements to the functionality and appearance of missing,
damaged or worn teeth. Attempts at filling spaces created by tooth loss or tooth
alterations has been documented as far back as the early century‟s in B.C were natural
teeth were ligated with gold or silver wire, and detached teeth or teeth carved from other
materials such as animal teeth, ivory and bone were connected by wire and ligated to
existing teeth (Laney, 1997). However, such materials were utilised with limited success
due to the instability of the materials in the oral cavity due to the corrosive effects of
human saliva and the tendency for ivory and bone to become stained over time (Kelly et
al 1996).
The development of amalgam in the 18th
and 19th
century revolutionised
restorative dentistry and gained widespread acceptance shortly after (Berry et al., 1998).
Unfortunately, controversial issues regarding the use of mercury and the release of
mercury vapour during mastication arose and its safety came into question, despite a lack
of consensus (Osborne, 1992; Dodes, 2001; Osborne, 2004; Mutter et al., 2004;
Sadowsky, 2006). More recently however, several Scandinavian countries (Norway,
Denmark and Sweden) have banned the use of dental amalgam amongst fears of mercury
toxicity and its environmental impact (Jones, 2008). However a significant drift from
amalgam to resin based composites (RBCs) in several countries recently (UK, USA and
Finland) is a result of clinical indication and the patients aesthetic demand and as a result
of dentists seeking less invasive treatments (Forss and Widström, 2001; Burke et al.,
2003; Haj-Ali et al., 2005; Gilmour et al., 2007) rather than environmental and toxicity
issues. Consequently, the use of resin-based composites has exponentially grown over
several decades and today it is the direct restorative material of choice for many dentists
across the world. For example, by 2005 in the USA, resin composite was the most
frequently used direct restorative material for posterior restorations (Hajj-Ali et al.,
2005). The exponential growth is evident in studies performed in the UK, where in 2001,
2
49% of dentists questioned never or rarely used resin composites for posterior
restorations (Burke et al., 2003), whereas in 2007 the number increased to a majority of
restorations (Gilmour et al., 2007). Although these material types are extensively used in
clinical practice there remain many unanswered questions concerned with intrinsic
material properties and associated setting parameters such as shrinkage of the resin
matrix, photoinitiator absorption, optical phenomena related to resin and filler interaction.
This investigation explores such material and system deficiencies in an attempt to
improve our understanding of RBC technology, which may hopefully assist future
material development.
1.1 Resin based composites
A composite structure is a mixture of at least two phases with differing properties
of one kind or another, which are intermediate in many senses to those of the
components. This broad definition includes glass ionomer cements, compomers and
ormocers as-well as RBCs. Resin based materials were first introduced in dentistry
during the late 1940s. The earliest materials that were used were simple and based on
unfilled poly(methyl methacrylate). Several shortcomings existed, amongst which
polymerisation shrinkage (20-25% by volume), poor colour stability, and poor chemical,
physical and mechanical properties led to modifications in order to try to improve these
properties. In 1951 Knock and Glenn attempted to solve the problem of polymerisation
shrinkage by including inorganic filler particles in the resin (Knock and Glen, 1951)
although poor mechanical properties and significant discolouration remained a problem
due to the absence of coupling agents between the filler and the resin.
In the early 1960‟s, resin based composites where introduced into the dental scene
(Bowen, 1962) by Dr Rafael Bowen and this class of material looked a promising
alternative for amalgam. Bowen developed the monomer in 1956 after attaching
methacrylate groups to an epoxy monomer to form bisphenol A-glycidyl methacrylate
(Bis-GMA). The introduction of a high-molecular weight, di-functional monomer (Bis-
GMA or Bowens Resin) greatly facilitated the commercial development of materials
containing inorganic fillers. In 1962, Bowen patented the combination of Bis-GMA resin
3
and silane-treated quartz particles, which is the origin of most commercial composites
available today (Bowen, 1962). The first use of composites in paste/liquid form was
developed by Chang in 1969 and Henry Lee in 1970 (Glenn JF, 1982). These materials
were conventionally polymerised with the redox methods of the cold-cure acrylic
chemistry commonly used in restorative dentistry. In RBCs the two phases are the resin
matrices (i.e. the monomers) and the fillers.
The fundamental work on the use of high molecular weight epoxy and
methacrylate derivatives that incorporated inorganic filler loading has received wide
spread attention and since then much work has been done to reach the current level of
sophistication. However clinical longevity remains limited compared to amalgam and
there exists a likelihood of root canal therapy if failure occurs (Drummond, 2008).
However, since their inception, the properties of composites have been greatly improved
resulting in higher mechanical properties (Palin et al., 2003), lower thermal coefficient of
expansion (Stevens, 1999), lower dimensional change on setting (Watts and Cash, 1991),
and higher resistance to abrasion (Turssi et al., 2005), which all contribute to the
increased clinical performance.
1.1.1 Aesthetic quality
One of the major advantages of RBCs is the property of aesthetic quality. The
aesthetic revolution began shortly after the introduction of RBCs in the 1970‟s. Although
acrylic resin and silicate exhibited satisfactory initial aesthetics, the introduction of RBCs
meant that for the first time, clinicians were able to restore teeth for aesthetics as well as
form and function without rapid bulk discoloration occurring which was inherent with
acrylic resins. The popularity of RBCs increased as the ability to mimic tooth structure
through anatomical stratification improved and the incorporation of dyes and opacifiers
became possible (Terry, 2003).
4
1.1.2 Composition
Composite materials generally consist of a resin-based matrix and an inorganic
filler, the ratio of which affects the properties of the material. The incorporation of filler
is the main strategy used to improve the poor mechanical and physical properties
associated with unfilled resins. The filler gives the composite wear resistance, strength,
reduced dimensional change aesthetics and opacity (Ferracane, 1995; Turssi et al., 2005).
The composite also consists of a coupling agent such as silane, which enhances the bond
between the filler and the resin matrix, and an initiator in order to initiate the process of
polymerisation when external energy such as light or heat is applied. An inhibitor may
also be added into the composite in order to prolong the shelf life of the monomer
(Bowen and Marjenhoff, 1992) and improve ambient light stability. Furthermore,
pigments and dyes (optical modifiers) may also be incorporated to improve aesthetics and
aid colour matching with natural teeth.
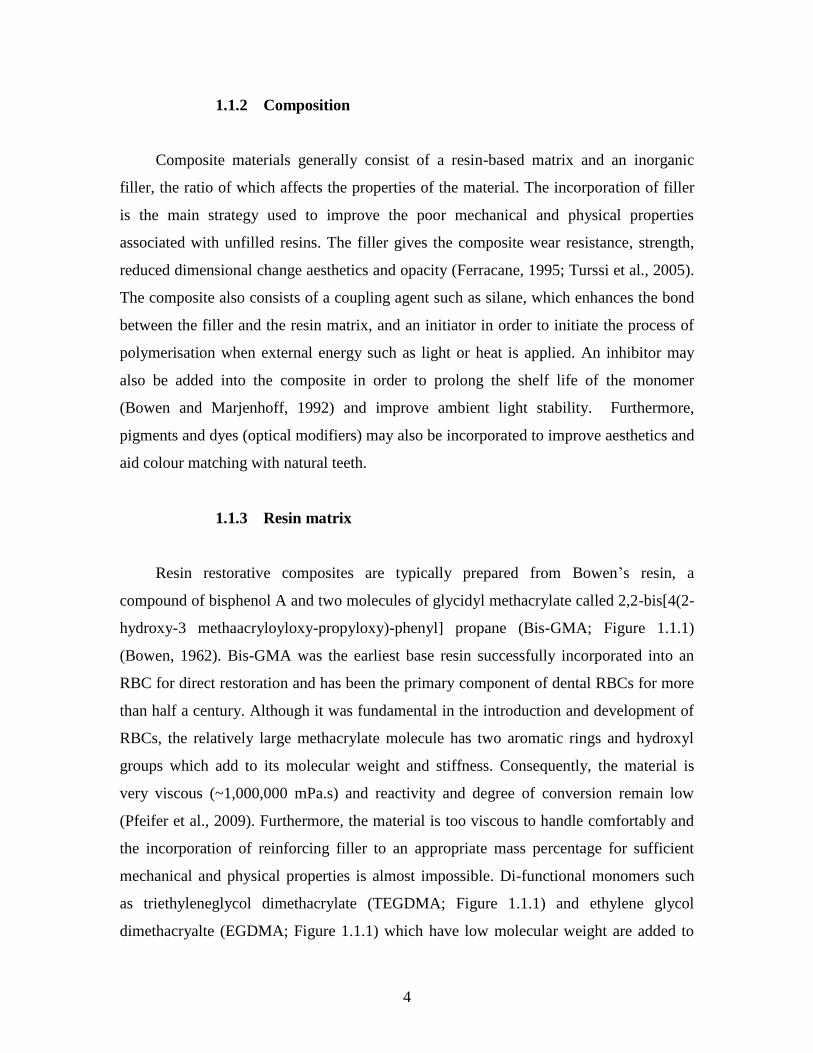
1.1.3 Resin matrix
Resin restorative composites are typically prepared from Bowen‟s resin, a
compound of bisphenol A and two molecules of glycidyl methacrylate called 2,2-bis[4(2-
hydroxy-3 methaacryloyloxy-propyloxy)-phenyl] propane (Bis-GMA; Figure 1.1.1)
(Bowen, 1962). Bis-GMA was the earliest base resin successfully incorporated into an
RBC for direct restoration and has been the primary component of dental RBCs for more
than half a century. Although it was fundamental in the introduction and development of
RBCs, the relatively large methacrylate molecule has two aromatic rings and hydroxyl
groups which add to its molecular weight and stiffness. Consequently, the material is
very viscous (~1,000,000 mPa.s) and reactivity and degree of conversion remain low
(Pfeifer et al., 2009). Furthermore, the material is too viscous to handle comfortably and
the incorporation of reinforcing filler to an appropriate mass percentage for sufficient
mechanical and physical properties is almost impossible. Di-functional monomers such
as triethyleneglycol dimethacrylate (TEGDMA; Figure 1.1.1) and ethylene glycol
dimethacryalte (EGDMA; Figure 1.1.1) which have low molecular weight are added to
5
reduce the viscosity and act as diluents for the matrix system (Silikas and Watts, 1999)
which facilitates the incorporation of greater amounts of inorganic filler and improves
mechanical properties of the final RBC material. Additionally, these types of monomer
contain reactive carbon double bonds at each end that can undergo addition
polymerisation and therefore reactivity and degree of conversion are increased.
Figure 1.1.1: The chemical structure of the base and diluent monomers used in RBC
materials.
6
TEGDMA has a much lower molecular weight and thus the viscosity is
significantly lower (~10 mPa.s). Although the reactivity increases due to the lower
viscosity, the presence of ether groups (C-O-C) and the lack of aromatic rings along its
structure, reduces its mechanical properties when compared to Bis-GMA. Furthermore,
inferior physical properties are also reported, namely polymerisation shrinkage
(TEGDMA = 12.5%, Bis-GMA = 5.2%) which is due to its lower molecular weight and
increased concentration of carbon double bonds which inevitably improves conversion
(Asmussen, 1982; Munksgaard et al., 1985; Braga et al, 2005). However, its low
hydrophobocity may result in increased stain susceptibility and leaching of TEGDMA
into the oral environment (Sideridou and Achilias, 2005).
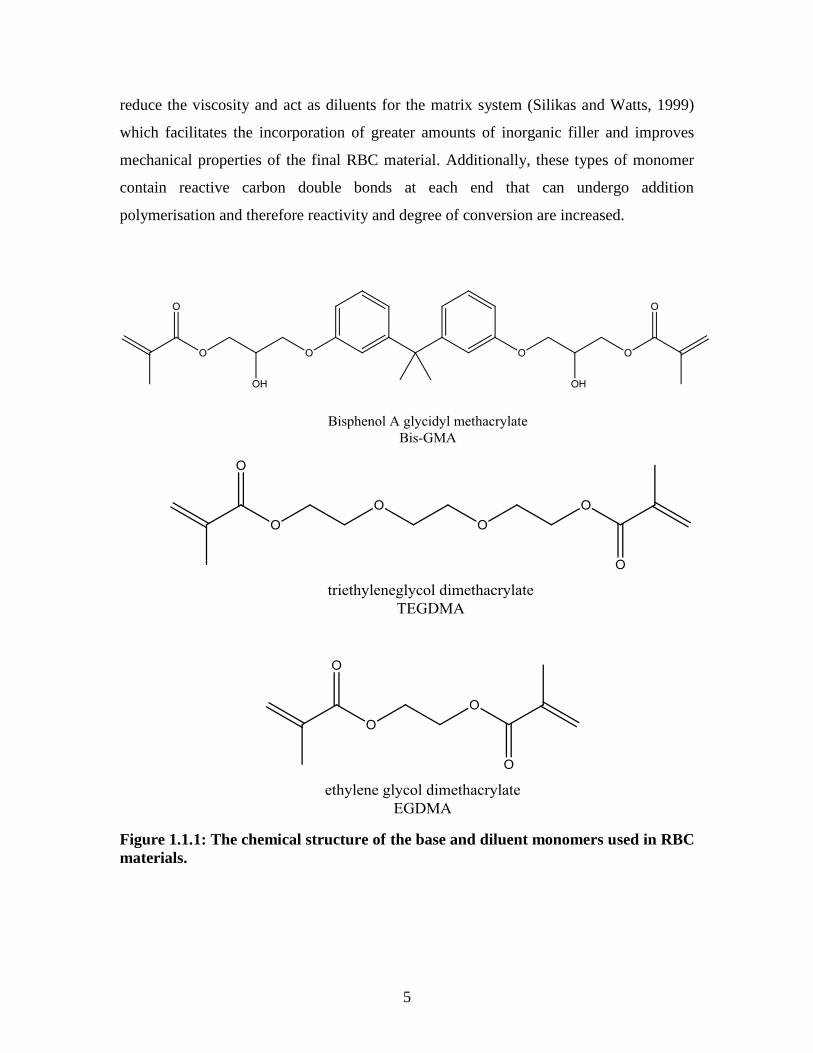
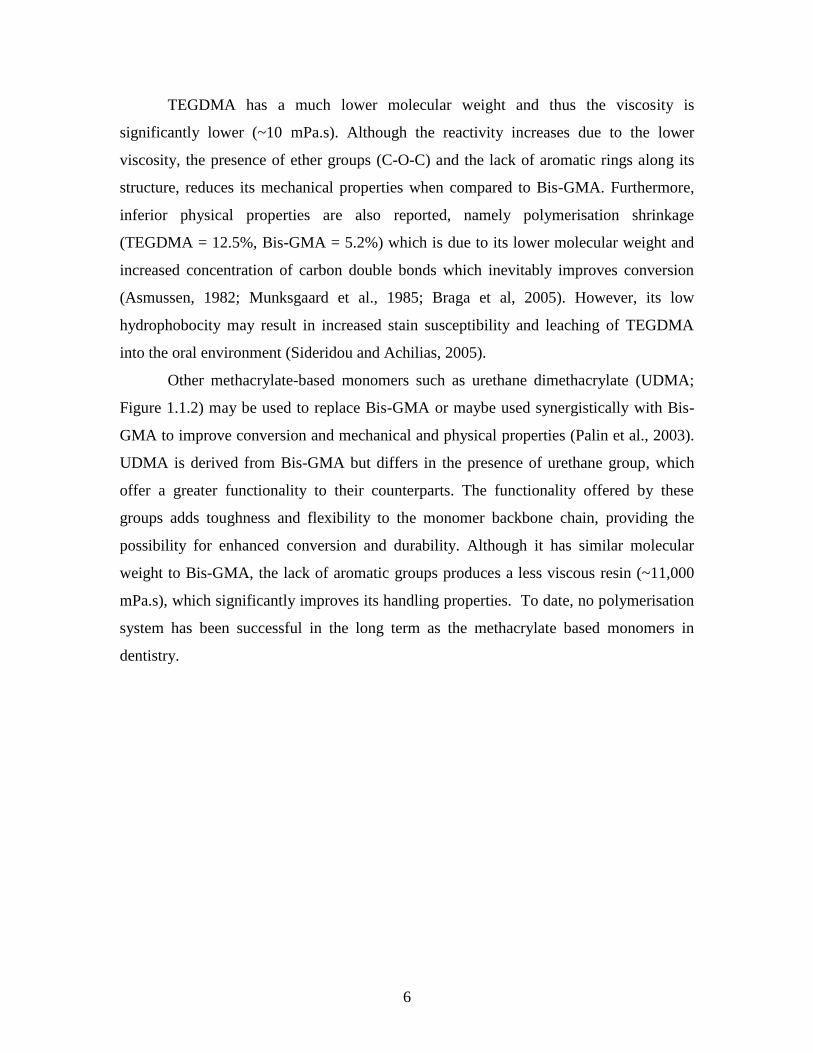
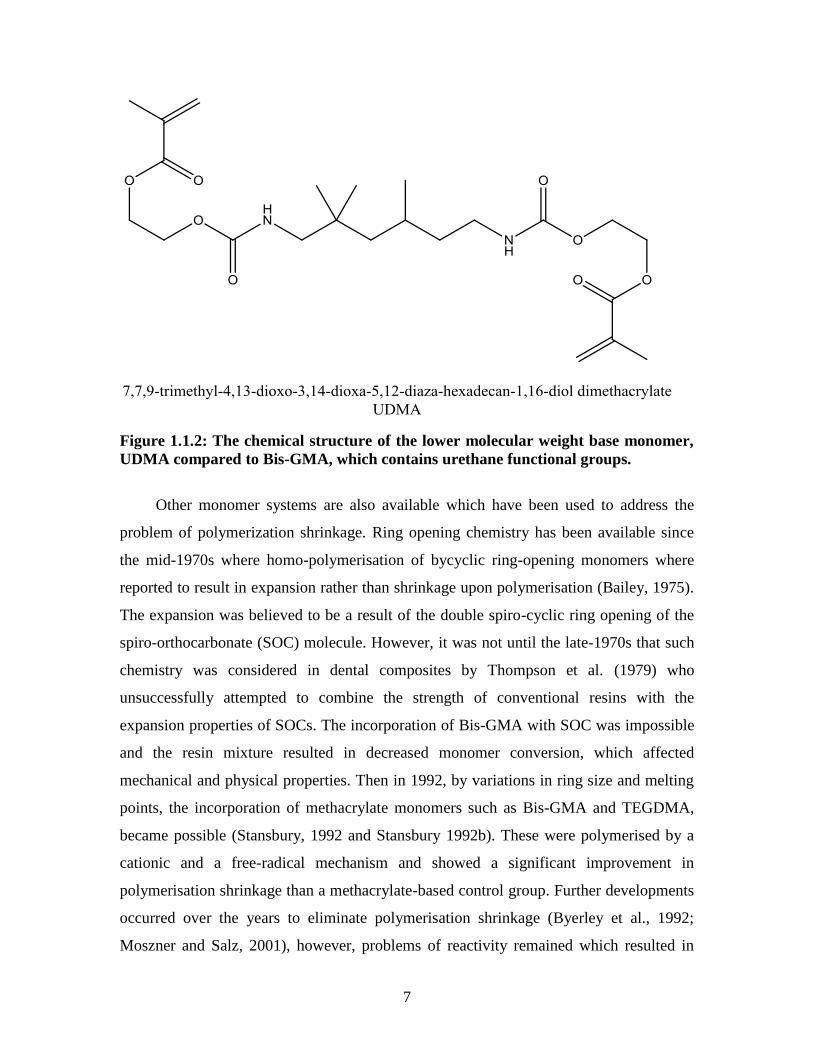
Other methacrylate-based monomers such as urethane dimethacrylate (UDMA;
Figure 1.1.2) may be used to replace Bis-GMA or maybe used synergistically with Bis-
GMA to improve conversion and mechanical and physical properties (Palin et al., 2003).
UDMA is derived from Bis-GMA but differs in the presence of urethane group, which
offer a greater functionality to their counterparts. The functionality offered by these
groups adds toughness and flexibility to the monomer backbone chain, providing the
possibility for enhanced conversion and durability. Although it has similar molecular
weight to Bis-GMA, the lack of aromatic groups produces a less viscous resin (~11,000
mPa.s), which significantly improves its handling properties. To date, no polymerisation
system has been successful in the long term as the methacrylate based monomers in
dentistry.
7
Figure 1.1.2: The chemical structure of the lower molecular weight base monomer,
UDMA compared to Bis-GMA, which contains urethane functional groups.
Other monomer systems are also available which have been used to address the
problem of polymerization shrinkage. Ring opening chemistry has been available since
the mid-1970s where homo-polymerisation of bycyclic ring-opening monomers where
reported to result in expansion rather than shrinkage upon polymerisation (Bailey, 1975).
The expansion was believed to be a result of the double spiro-cyclic ring opening of the
spiro-orthocarbonate (SOC) molecule. However, it was not until the late-1970s that such
chemistry was considered in dental composites by Thompson et al. (1979) who
unsuccessfully attempted to combine the strength of conventional resins with the
expansion properties of SOCs. The incorporation of Bis-GMA with SOC was impossible
and the resin mixture resulted in decreased monomer conversion, which affected
mechanical and physical properties. Then in 1992, by variations in ring size and melting
points, the incorporation of methacrylate monomers such as Bis-GMA and TEGDMA,
became possible (Stansbury, 1992 and Stansbury 1992b). These were polymerised by a
cationic and a free-radical mechanism and showed a significant improvement in
polymerisation shrinkage than a methacrylate-based control group. Further developments
occurred over the years to eliminate polymerisation shrinkage (Byerley et al., 1992;
Moszner and Salz, 2001), however, problems of reactivity remained which resulted in
8
inadequate saturation of SOC rings, decreased cross-linking and therefore decreased
mechanical properties.
In attempts to reduce polymerization shrinkage, thiol-ene resin chemistry has also
been suggested for the use in dental restorative materials (Jacquelyn et al., 2005). The
reaction of thiol-ene monomers creates reactive thiol or vinyl (ene)- functionalized
oligomers. Thiol-ene resins polymerise by a step growth mechanism rather than a chain
growth mechanism found in dimethacrylate based resins. As a result, the gel point is
significantly delayed which enable better control of the polymerization process, i.e
molecular weight control and reduced shrinkage stress (Cramer and Bowman, 2001).
Furthermore, the use of such monomers has been reported to improve shrinkage by up to
33% when compared to metahcrylate systems (Patel et al., 1987; Jacquelyn et al., 2005).
However, although thiol-ene resins performed well physically, i.e reduced shrinkage and
shrinkage stress, their mechanical properties remain inferior to Bis-GMA/TEGDMA
resins (Jacquelyn et al., 2005). Recently composite methacrylate-thiol-ene formulations
have been shown to exhibit improvements in methacrylate conversion, flexural strength,
shrinkage stress, depth of cure, and water solubility (Boulden et al., 2010). In such
systems, the thiol-ene acts as the reactive diluent in ternary formulations which then
results in a unique polymerization kinetics and shrinkage dynamics which is a
combination of both thiol-ene and methacrylate chemistry (Cramer et al., 2010).
Additionally, such systems exhibit a pseudo-hybrid polymerization process whereby the
first stage is dominated by methacrylate homo-polymeriation and chain transfer to thiol
and the second stage is dominated by thiol-ene polymerization (Cramer et al., 2010).
Consequently, the polymers produced are expected to show improved physical and
mechanical properties. Research is ongoing on this topic.
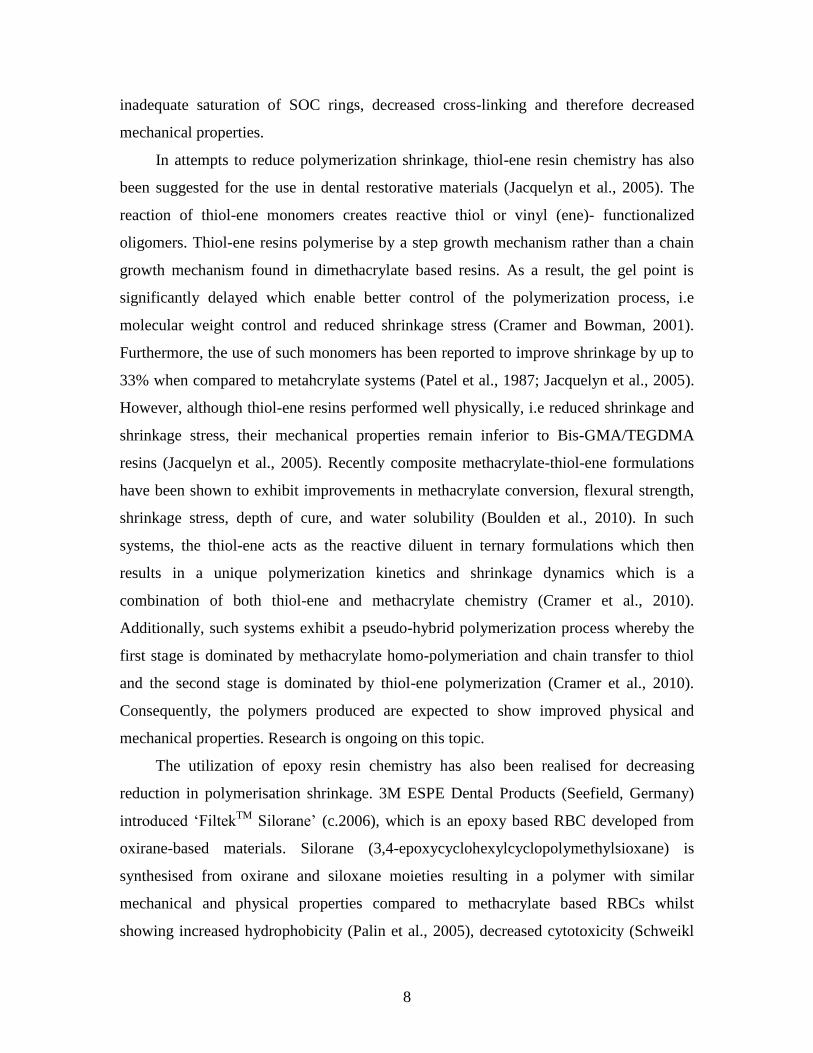
The utilization of epoxy resin chemistry has also been realised for decreasing
reduction in polymerisation shrinkage. 3M ESPE Dental Products (Seefield, Germany)
introduced „FiltekTM
Silorane‟ (c.2006), which is an epoxy based RBC developed from
oxirane-based materials. Silorane (3,4-epoxycyclohexylcyclopolymethylsioxane) is
synthesised from oxirane and siloxane moieties resulting in a polymer with similar
mechanical and physical properties compared to methacrylate based RBCs whilst
showing increased hydrophobicity (Palin et al., 2005), decreased cytotoxicity (Schweikl
9
et al., 2004), increased ambient light stability (Weinmann et al., 2005) and most
importantly decreased polymerisation shrinkage and stress (Ernst et al., 2004; Weinmann
et al., 2005). Such composites utilise an innovative approach of ring-opening chemistry.
The monomers connect by opening, flattening and extending towards each other, which
results in a significantly lower polymerisation shrinkage in contrast to a methacrylate
based composite in which the monomers are linear and connect by actually shifting closer
together, which results in a greater loss of volume.
The initiating system in FiltekTM
Silorane composes of three components,
camphoroquinone, an iodinium salt and an electron donor. The electron donor
decomposes the iodinium salt to form the cation which initiates the polymerisation
(Weinmann et al., 2005). A significant improvement over traditional methacrylate based
RBCs in polymerisation shrinkage (<1%) has been reported due to the ring opening
cationic polymerisation (Weinmann et al 2005).
1.1.4 Fillers
The incorporation of fillers is a strategy whereby inorganic particles or pre-
polymerised material is added in proportion to the composite, which then proportionally
reduces the shrinkage (Bowen, 1962; Atai and Watts, 2006) by offsetting it with the
relatively inert filler particles (Condon and Ferracane, 2000). However, even this method
is reported to produce relatively high polymerisation shrinkage (Atai and Watts, 2006).
In the 1970s and 1980s, it was recognised that the size and amount of filler was
critically important for the material and physical properties and thus RBCs were
characterised according to the filler content. Modification in the filler component will
change rheology, curing kinetics, degree of conversion and ultimately the mechanical and
physical properties (Leprince et al., 2009; Beun et al., 2009).
Additionally, the type of filler is also important towards both optical and physical
properties. The use of quartz provides excellent optical match to the polymer and is
readily available. However, several drawbacks exist. Namely, it is not radioopaque and is
very abrasive towards enamel. Furthermore, the relatively large particles reduces its
polishability and therefore this was addressed with the development of amorphous silica.
10
However, the relatively small particles did not permit large volume fractions of filler to
be incorporated. Consequently pre-polymerisaed fillers are added (which have larger
particle size) to improve volume filler fraction. The use of such a technique improved the
polishability of the material dramatically but the problem of radio-opacity remained.
Most modern composites are filled with radiopaque silicate particles based on barium,
strontium, zinc, aluminium, or zirconium (Ferracane, 1995).
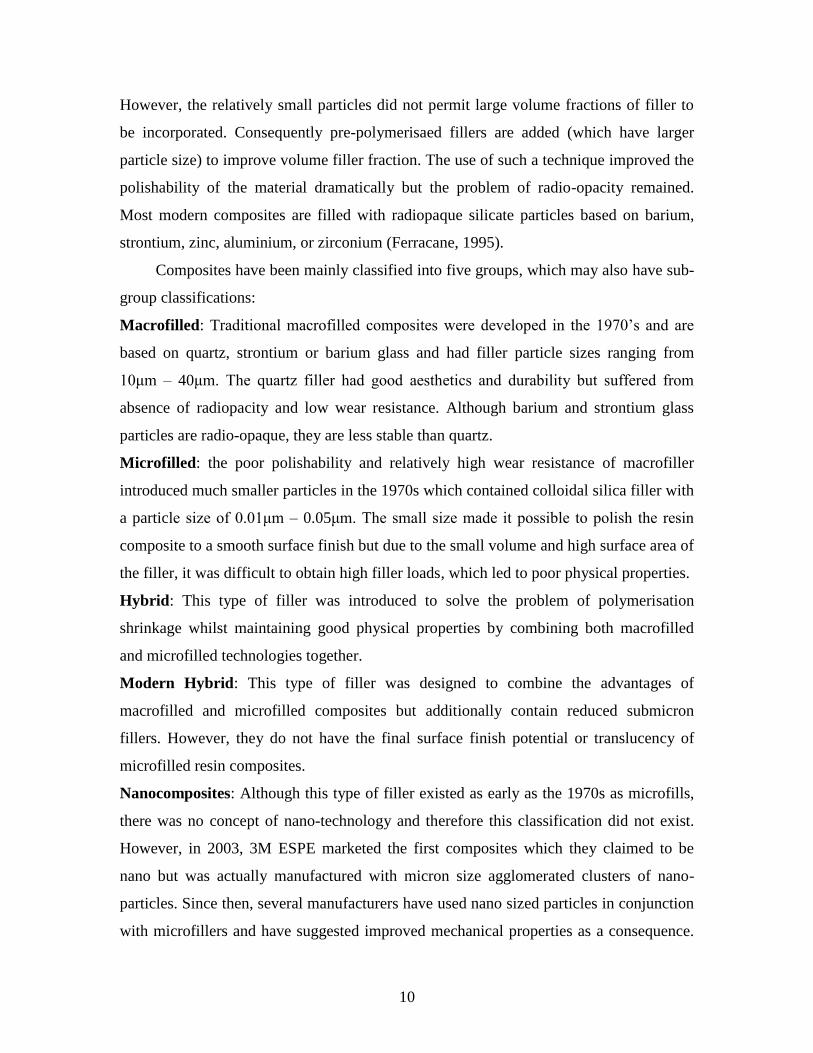
Composites have been mainly classified into five groups, which may also have sub-
group classifications:
Macrofilled: Traditional macrofilled composites were developed in the 1970‟s and are
based on quartz, strontium or barium glass and had filler particle sizes ranging from
10μm – 40μm. The quartz filler had good aesthetics and durability but suffered from
absence of radiopacity and low wear resistance. Although barium and strontium glass
particles are radio-opaque, they are less stable than quartz.
Microfilled: the poor polishability and relatively high wear resistance of macrofiller
introduced much smaller particles in the 1970s which contained colloidal silica filler with
a particle size of 0.01μm – 0.05μm. The small size made it possible to polish the resin
composite to a smooth surface finish but due to the small volume and high surface area of
the filler, it was difficult to obtain high filler loads, which led to poor physical properties.
Hybrid: This type of filler was introduced to solve the problem of polymerisation
shrinkage whilst maintaining good physical properties by combining both macrofilled
and microfilled technologies together.
Modern Hybrid: This type of filler was designed to combine the advantages of
macrofilled and microfilled composites but additionally contain reduced submicron
fillers. However, they do not have the final surface finish potential or translucency of
microfilled resin composites.
Nanocomposites: Although this type of filler existed as early as the 1970s as microfills,
there was no concept of nano-technology and therefore this classification did not exist.
However, in 2003, 3M ESPE marketed the first composites which they claimed to be
nano but was actually manufactured with micron size agglomerated clusters of nano-
particles. Since then, several manufacturers have used nano sized particles in conjunction
with microfillers and have suggested improved mechanical properties as a consequence.
11
However, the classification of „nano‟ creates some debate amongst researchers as to date
no commercial composites truly contains only nano sized particles.
Composite Type Filler Size (μm) Filler Material
Macrofilled 10 - 40 Quartz or Glass
Microfilled 0.01 - 0.1 Colloidal Silica
Hybrid 15 - 20 and 0.01 - 0.05 Glass and colloidal silica
Modern Hybrid 0.5 - 1 and 0.01 - 0.05 Glass, Zirconia and colloidal
silica
Nanofiller < 0.01 (10nm) Silica or Zirconia
Table 1.1.1: Summary of filler properties and classification of fillers in dental
composite materials.
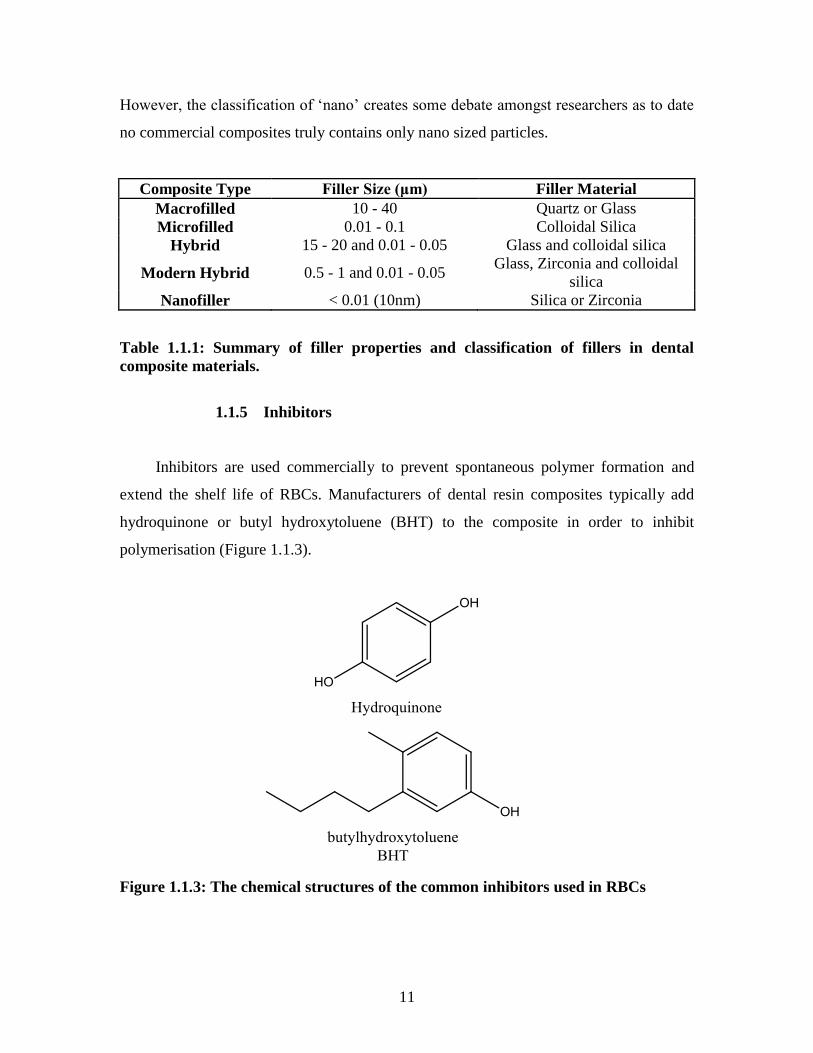
1.1.5 Inhibitors
Inhibitors are used commercially to prevent spontaneous polymer formation and
extend the shelf life of RBCs. Manufacturers of dental resin composites typically add
hydroquinone or butyl hydroxytoluene (BHT) to the composite in order to inhibit
polymerisation (Figure 1.1.3).
Figure 1.1.3: The chemical structures of the common inhibitors used in RBCs
12
The inhibitors react with the free radical thus decreasing the rate of initiation and
increasing the rate of termination (Moad and Solomon, 1995). Decreasing the rate of
initiation results in retardation of polymerization and an increase in the rate of
termination. Although chemical inhibition may be used to extend the shelf life of
composites, inhibition of polymerisation may also occur when there are large amounts of
oxygen present and this could lead to partially cured restorations which may cause
problems because the optimum properties are not obtained (Gauthier et al., 2005).
BHT is a commercially available primary antioxidant and is also used as an
inhibitor in dental composites (Geurtsen, 1998). Reduction in reaction speed by chemical
inhibition occurs as the free radicals are terminated by reacting with the phenolic
hydrogen of the BHT molecule. BHT molecules are primary antioxidants which are
effectively free radical scavengers, which combine with peroxy radicals and break the
autocatalytic cycle. The phenoxy radicals may then inactivate another free radical by C-C
or C-O coupling or loss of another hydrogen atom to form a quinine, which may react
further. Therefore, each inhibitor molecule can terminate two or more polymer chains
(Moad and Solomon, 1995). The conversion of monomer to polymer proceeds at a
reduced rate until all the inhibitor is consumed. Inhibition may also extend the „pre-gel
phase‟, which will allow shrinkage forces to be dissipated before the cross-linking
reaches a certain point at which molecular displacement becomes impossible (Braga and
Ferracane, 2002). However, this idea has never been commercialized and BHT is only
used to prolong the shelf life of a commercial composite by acting as a stabilizer to
inhibit auto polymerization.
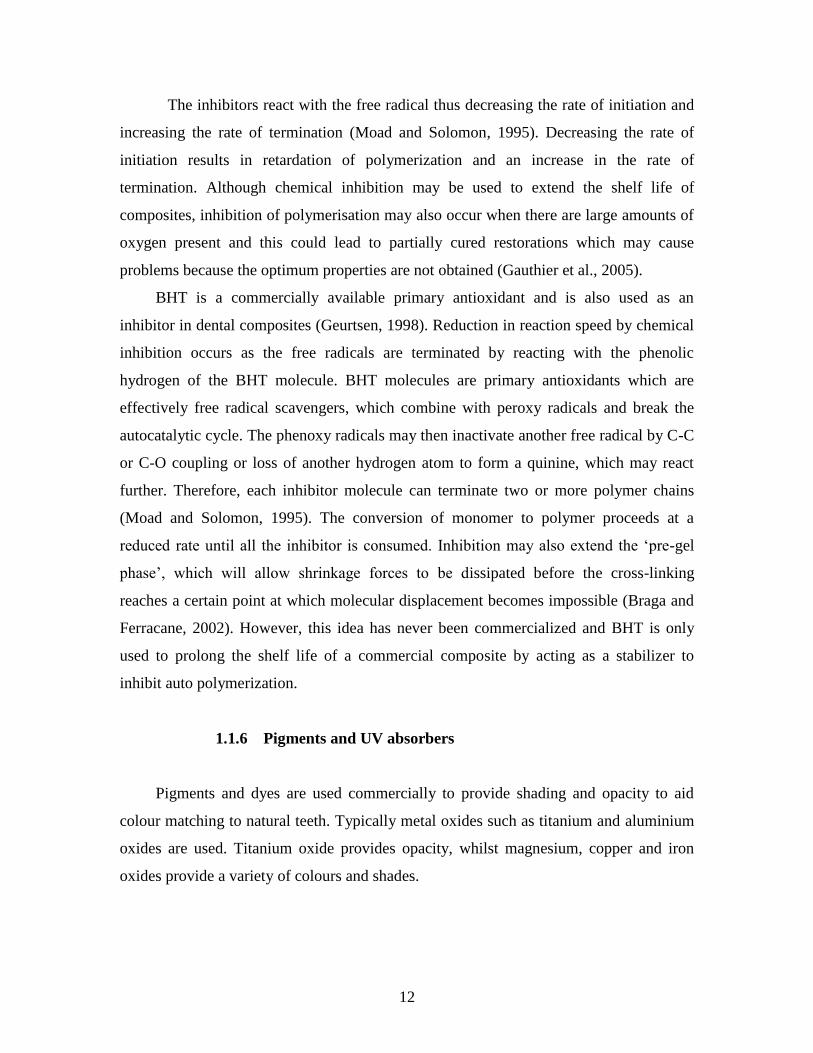
1.1.6 Pigments and UV absorbers
Pigments and dyes are used commercially to provide shading and opacity to aid
colour matching to natural teeth. Typically metal oxides such as titanium and aluminium
oxides are used. Titanium oxide provides opacity, whilst magnesium, copper and iron
oxides provide a variety of colours and shades.
13
As dental composite fillings are prone to discolouration due to UV absorption
(below 400nm), UV absorbers such as Benzophenone are used commercially, which
absorb UV light to prevent such discolouration.
1.1.7 Photoinitiators
The first photo-polymerised composite system was developed in the 1970‟s under
the trade name of Nuva; Dentsply/ Caulk (Rueggeberg, 2002) as an attempt to decrease
the lengthy setting times. Photo-initiation polymerisation involves the use of a light to
produce free radicals to start the polymerisation process and allows the ability to
„command-cure‟ restorations. This has become highly popular in dentistry as degree of
conversion can range from 40-70% with appropriate conditions (Fonseca et al., 2004;
Mendes et al., 2005; Ogunyinka et al., 2007). Systems used in current restorations and
luting-agents frequently use both photo- and chemical–initiation (dual curing) as it is
often difficult to expose the material to sufficient light to reach the maximum degree of
conversion and thus maximum strength (Watts, 2005). The potential advantage of photo-
activated composites over chemically activated composites is that they have greater
handling time because the polymerisation process is initiated once the composite is
irradiated with light, whereas for the chemically activated composite resins, working time
was extremely limited and setting times range from 3 to 5 minutes once the material is
mixed and can only be controlled by modifying the concentrations of initiator and
accelerator (Fonseca et al., 2004).
1.1.7.1 Camphoroquinone
The photoinitiator system within a RBC generally consists of a two-component
system, a photoinitiator and a co-initiator. Camphoroquinone is the most commonly used
visible light activated free radical photo-initiator for dental resins. The absorption range
corresponds to visible blue light between 400-500nm (λmax = 470 nm). The co-initiator or
photo sensitizer is normally a tertiary aliphatic amine reducing agent, which reacts with
camphoroquinone in its excited triplet state to generate free radicals. The absorption of
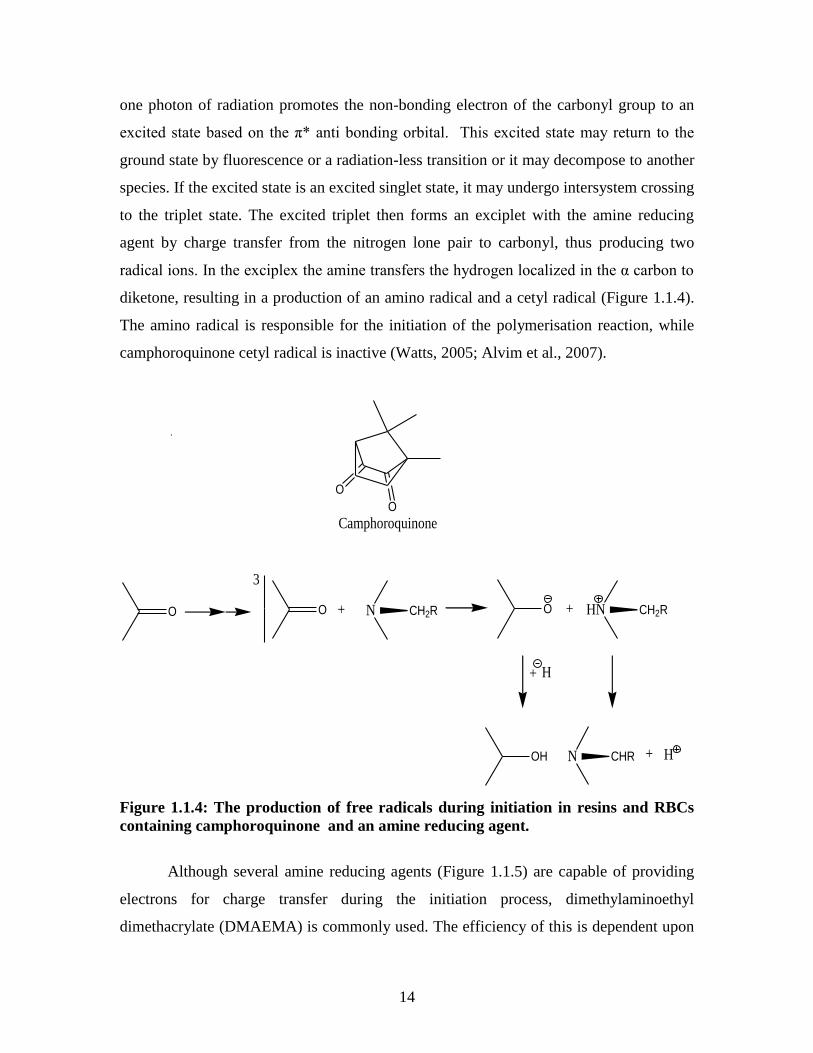
14
one photon of radiation promotes the non-bonding electron of the carbonyl group to an
excited state based on the π* anti bonding orbital. This excited state may return to the
ground state by fluorescence or a radiation-less transition or it may decompose to another
species. If the excited state is an excited singlet state, it may undergo intersystem crossing
to the triplet state. The excited triplet then forms an exciplet with the amine reducing
agent by charge transfer from the nitrogen lone pair to carbonyl, thus producing two
radical ions. In the exciplex the amine transfers the hydrogen localized in the α carbon to
diketone, resulting in a production of an amino radical and a cetyl radical (Figure 1.1.4).
The amino radical is responsible for the initiation of the polymerisation reaction, while
camphoroquinone cetyl radical is inactive (Watts, 2005; Alvim et al., 2007).
O
O
Camphoroquinone
O
3
O + N CH2R O + HN CH2R
OH N CHR + H
+ H
Figure 1.1.4: The production of free radicals during initiation in resins and RBCs
containing camphoroquinone and an amine reducing agent.
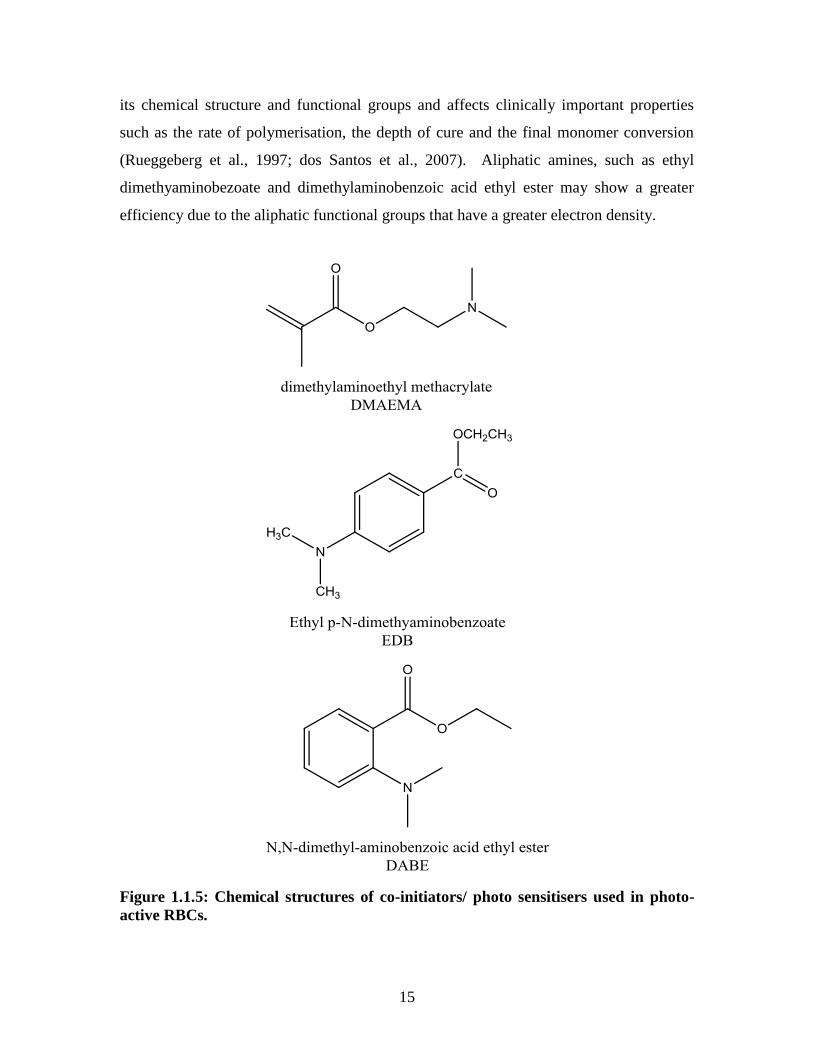
Although several amine reducing agents (Figure 1.1.5) are capable of providing
electrons for charge transfer during the initiation process, dimethylaminoethyl
dimethacrylate (DMAEMA) is commonly used. The efficiency of this is dependent upon
15
its chemical structure and functional groups and affects clinically important properties
such as the rate of polymerisation, the depth of cure and the final monomer conversion
(Rueggeberg et al., 1997; dos Santos et al., 2007). Aliphatic amines, such as ethyl
dimethyaminobezoate and dimethylaminobenzoic acid ethyl ester may show a greater
efficiency due to the aliphatic functional groups that have a greater electron density.
Figure 1.1.5: Chemical structures of co-initiators/ photo sensitisers used in photo-
active RBCs.
16
Appropriate photoinitiator chemistry is essential for efficient polymerisation to
achieve satisfactory mechanical and physical properties of the polymer (Ogunyinka et al.,
2007). An optimum correlation between photoinitiator and co-initiator type and
concentration will maximize photon absorbance efficiency which may in turn maximize
depth of cure of a filled system (Chen et al., 2007; dos Santos et al., 2007). The
photoinitiator concentration should be limited in order to obtain an optimum photo-curing
reaction with high monomer conversion since excessive un-reacted photoinitiator,
products of their photolysis, and any un-reacted monomer, may cause cytoxicity (Pagoria
et al., 2005). Furthermore, the concentration of camphoroquinone effects the aesthetics of
a restoration as exceeding a critical concentration limit of camphoroquinone will lead to
yellow discoloration and any un-reacted molecules may return back to the ground state
(Ogunyinka et al., 2007) which will cause discolouration of the final polymer. Such
discoloration may reduce aesthetic quality (Rueggeberg et al., 1997; Suh BI., 1997;
Studer et al., 2001; Brackett et al., 2007) and affect light transport through material
thickness. Furthermore, the discoloration may also create problems in color matching to
natural teeth.
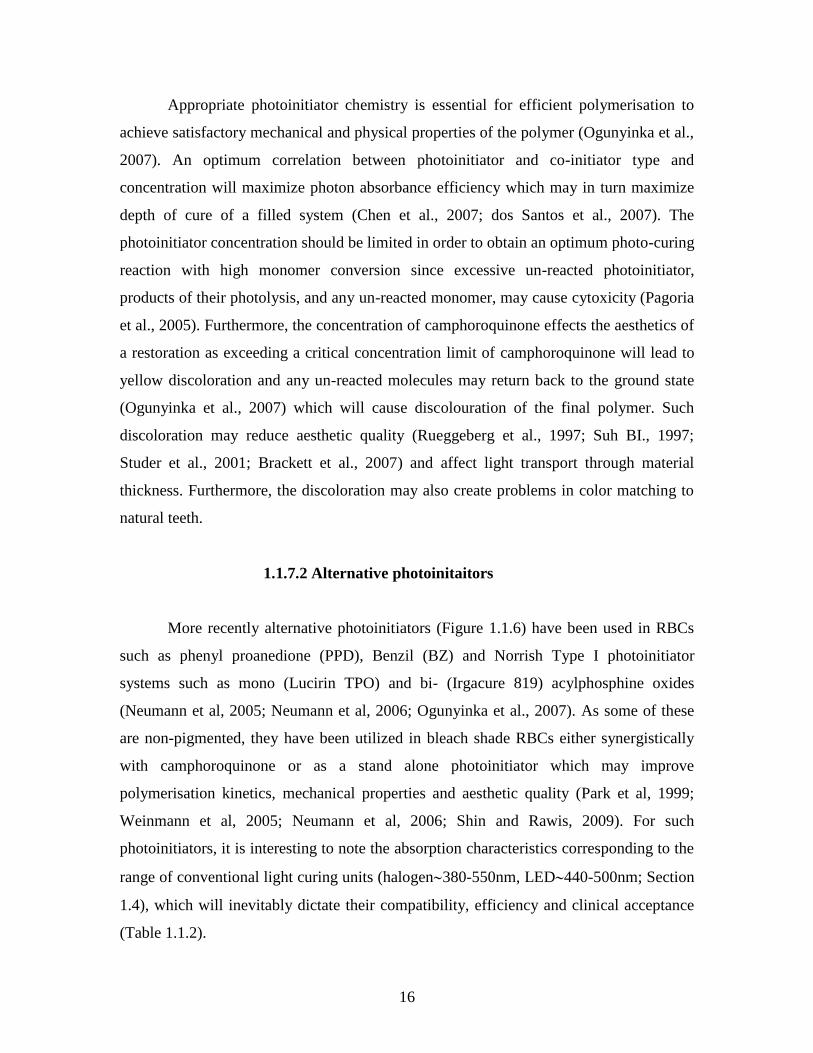
1.1.7.2 Alternative photoinitaitors
More recently alternative photoinitiators (Figure 1.1.6) have been used in RBCs
such as phenyl proanedione (PPD), Benzil (BZ) and Norrish Type I photoinitiator
systems such as mono (Lucirin TPO) and bi- (Irgacure 819) acylphosphine oxides
(Neumann et al, 2005; Neumann et al, 2006; Ogunyinka et al., 2007). As some of these
are non-pigmented, they have been utilized in bleach shade RBCs either synergistically
with camphoroquinone or as a stand alone photoinitiator which may improve
polymerisation kinetics, mechanical properties and aesthetic quality (Park et al, 1999;
Weinmann et al, 2005; Neumann et al, 2006; Shin and Rawis, 2009). For such
photoinitiators, it is interesting to note the absorption characteristics corresponding to the
range of conventional light curing units (halogen380-550nm, LED440-500nm; Section
1.4), which will inevitably dictate their compatibility, efficiency and clinical acceptance
(Table 1.1.2).
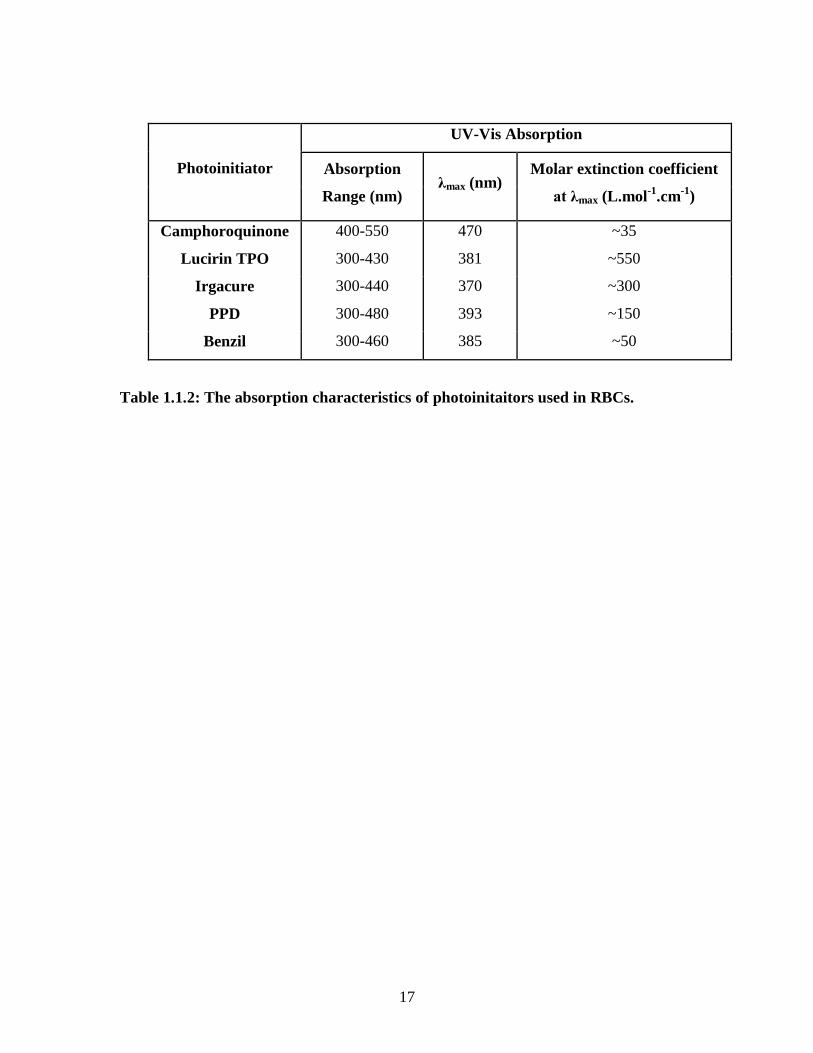
17
Photoinitiator
UV-Vis Absorption
Absorption
Range (nm) λmax (nm)
Molar extinction coefficient
at λmax (L.mol-1
.cm-1
)
Camphoroquinone 400-550 470 ~35
Lucirin TPO 300-430 381 ~550
Irgacure 300-440 370 ~300
PPD 300-480 393 ~150
Benzil 300-460 385 ~50
Table 1.1.2: The absorption characteristics of photoinitaitors used in RBCs.
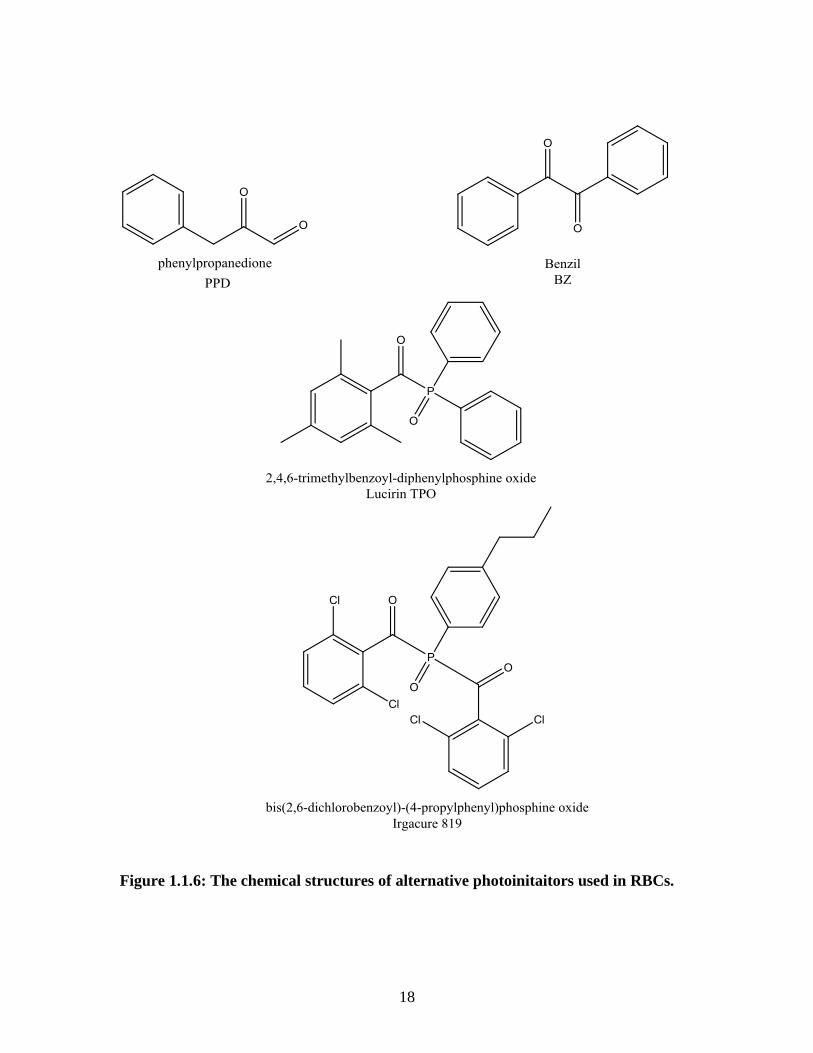
18
Figure 1.1.6: The chemical structures of alternative photoinitaitors used in RBCs.
19
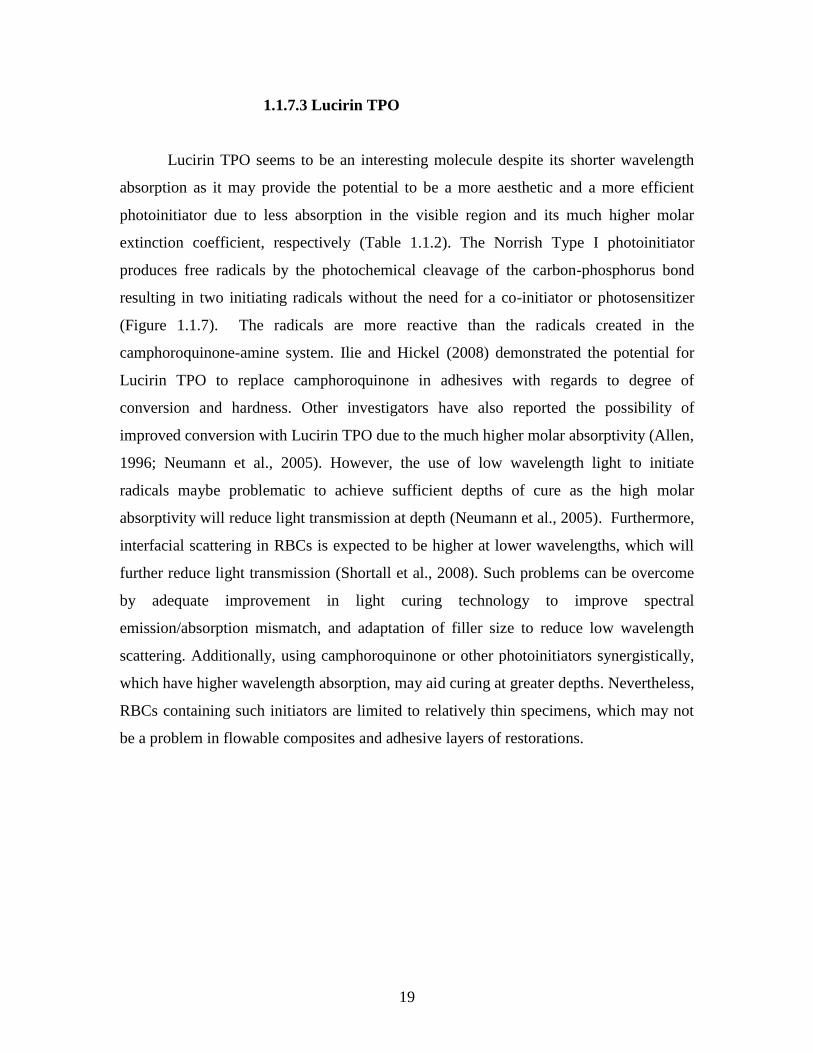
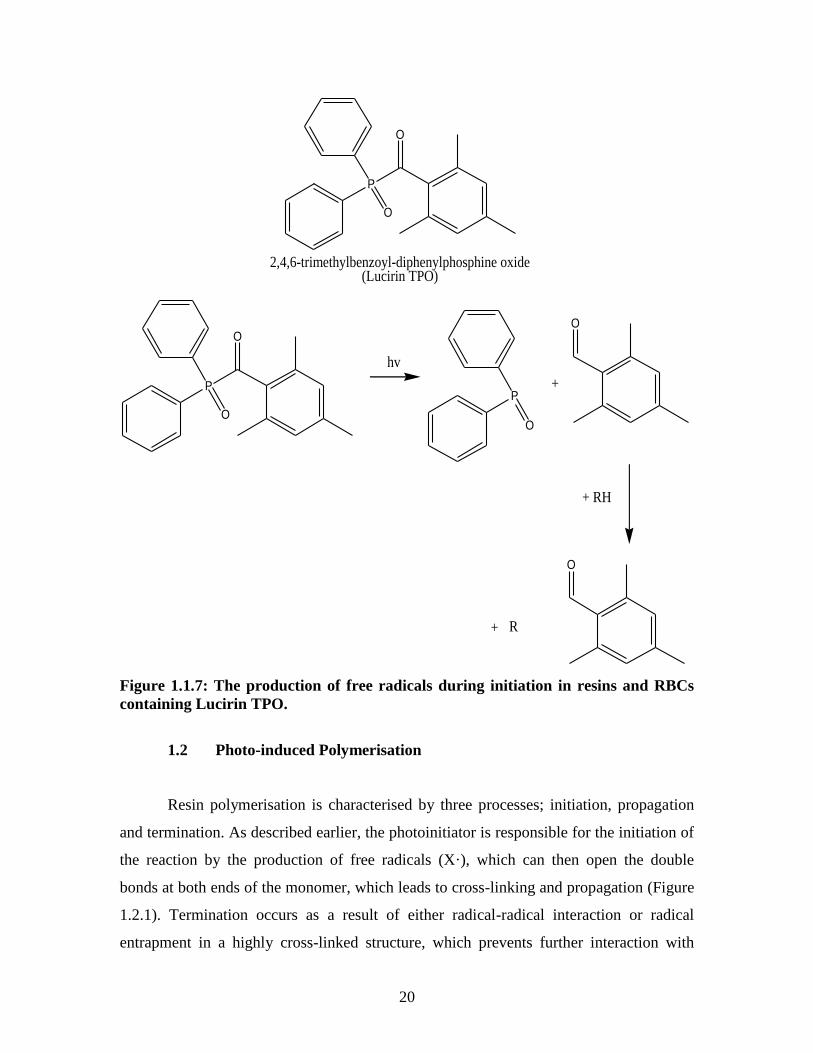
1.1.7.3 Lucirin TPO
Lucirin TPO seems to be an interesting molecule despite its shorter wavelength
absorption as it may provide the potential to be a more aesthetic and a more efficient
photoinitiator due to less absorption in the visible region and its much higher molar
extinction coefficient, respectively (Table 1.1.2). The Norrish Type I photoinitiator
produces free radicals by the photochemical cleavage of the carbon-phosphorus bond
resulting in two initiating radicals without the need for a co-initiator or photosensitizer
(Figure 1.1.7). The radicals are more reactive than the radicals created in the
camphoroquinone-amine system. Ilie and Hickel (2008) demonstrated the potential for
Lucirin TPO to replace camphoroquinone in adhesives with regards to degree of
conversion and hardness. Other investigators have also reported the possibility of
improved conversion with Lucirin TPO due to the much higher molar absorptivity (Allen,
1996; Neumann et al., 2005). However, the use of low wavelength light to initiate
radicals maybe problematic to achieve sufficient depths of cure as the high molar
absorptivity will reduce light transmission at depth (Neumann et al., 2005). Furthermore,
interfacial scattering in RBCs is expected to be higher at lower wavelengths, which will
further reduce light transmission (Shortall et al., 2008). Such problems can be overcome
by adequate improvement in light curing technology to improve spectral
emission/absorption mismatch, and adaptation of filler size to reduce low wavelength
scattering. Additionally, using camphoroquinone or other photoinitiators synergistically,
which have higher wavelength absorption, may aid curing at greater depths. Nevertheless,
RBCs containing such initiators are limited to relatively thin specimens, which may not
be a problem in flowable composites and adhesive layers of restorations.
20
P
O
O
2,4,6-trimethylbenzoyl-diphenylphosphine oxide(Lucirin TPO)
P
O
O
hv
P
O
+
O
+ RH
O
+ R
Figure 1.1.7: The production of free radicals during initiation in resins and RBCs
containing Lucirin TPO.
1.2 Photo-induced Polymerisation
Resin polymerisation is characterised by three processes; initiation, propagation
and termination. As described earlier, the photoinitiator is responsible for the initiation of
the reaction by the production of free radicals (X·), which can then open the double
bonds at both ends of the monomer, which leads to cross-linking and propagation (Figure
1.2.1). Termination occurs as a result of either radical-radical interaction or radical
entrapment in a highly cross-linked structure, which prevents further interaction with
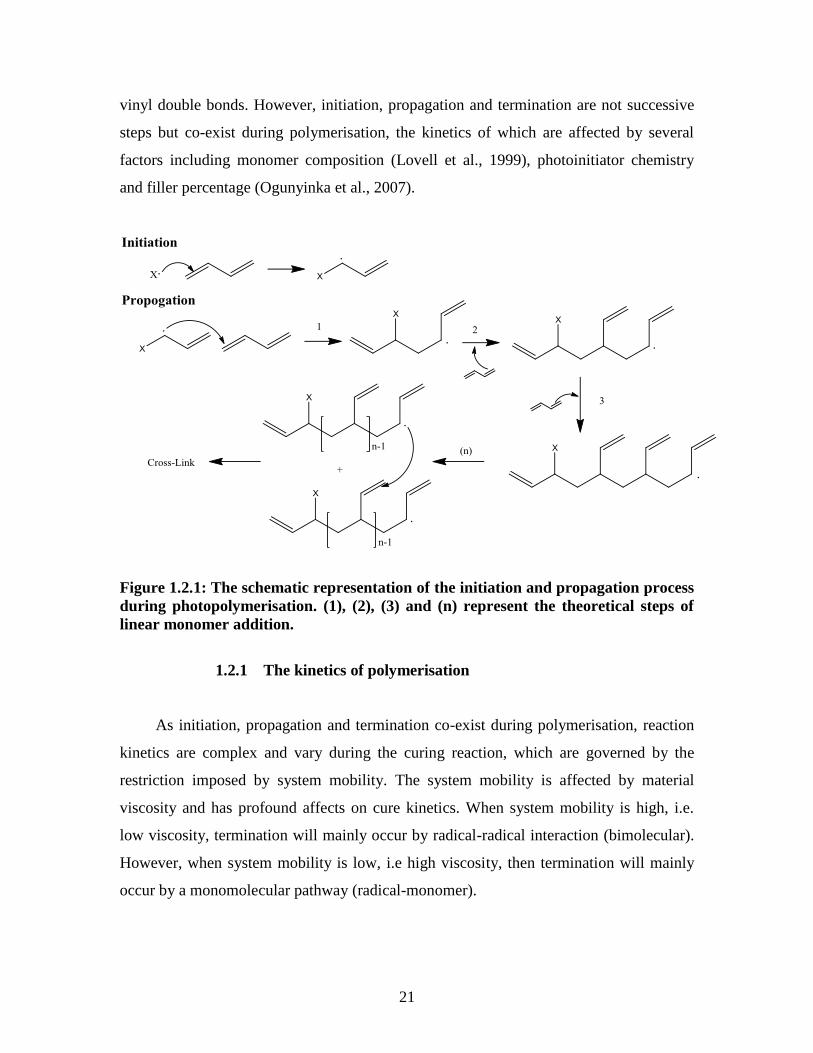
21
vinyl double bonds. However, initiation, propagation and termination are not successive
steps but co-exist during polymerisation, the kinetics of which are affected by several
factors including monomer composition (Lovell et al., 1999), photoinitiator chemistry
and filler percentage (Ogunyinka et al., 2007).
Figure 1.2.1: The schematic representation of the initiation and propagation process
during photopolymerisation. (1), (2), (3) and (n) represent the theoretical steps of
linear monomer addition.
1.2.1 The kinetics of polymerisation
As initiation, propagation and termination co-exist during polymerisation, reaction
kinetics are complex and vary during the curing reaction, which are governed by the
restriction imposed by system mobility. The system mobility is affected by material
viscosity and has profound affects on cure kinetics. When system mobility is high, i.e.
low viscosity, termination will mainly occur by radical-radical interaction (bimolecular).
However, when system mobility is low, i.e high viscosity, then termination will mainly
occur by a monomolecular pathway (radical-monomer).
22
MRkR pp Equation 1.2.1
2 RkR tt Equation 1.2.2
Equation 1.2.1 and 1.2.2 can be used to describe the polymerization process, where
pR and tR are the rate of propagation and termination respectively, pk and tk are the
respective rate constants and M and R in square brackets are the monomer
concentration and free radical concentration respectively. At the very beginning of
polymerisation, conversion and therefore the extent of cross-linking is low, and it can be
assumed that the concentration of free radicals remains constant (i.e. equilibrium between
rate of initiation, iR where tR = iR and pR ) with the steps of polymerisation being
chemically controlled. However, according to Anseth et al. (1996), for dimethacrylate
monomers, this is only valid during the initial stage of polymerisation where conversion
is less than 10%. As propagation proceeds, conversion increases, which subsequently
restricts the mobility of the curing system due to increased viscosity. The cross-linked
polymer network transforms from a liquid to a rubber and consists of two components;
the sol (the monomer) and the gel component. The gelation point is characterised by the
point at which the mobility of propagating species becomes so low that free-flow of
macro-radicals becomes restricted and termination becomes diffusion limited. However,
small monomer molecules can still diffuse through the cross linked networks and create
new growth centres. As mobility restrictions mainly affect large growing polymer chains
but not small monomer molecules tk decreases significantly but pk remains largely
unaffected (i.e. pR >> tR ). Consequently, [ R ] increases and results in a dramatic
increase in the rate of polymerisation, which is known as “autoacceleration” and is more
pronounced in the case of more viscous monomers (Goodner and Bowman, 1999; Feng
and Suh, 2007). Once the mobility restrictions become too high, diffusion becomes
impossible (even for small monomer molecules), pk decreases and a dramatic decrease in
the rate of polymerisation is observed (“autodeceleration”) and conversion starts to
plateau as the system becomes vitrified. Vitrification occurs when the glass transition
temperature ( gT ) of the polymerising material reaches reaction temperature, i.e ambient
23
temperature plus T of the reaction exotherm (n.b. above this temperature the same
polymer would return from a glassy to a rubbery state if heated up). The glass transition
temperature of a monomer based of 50% Bis-GMA and 50% TEGDMA is approximately
47.5◦C (Dewaele et al., 2009). Although the majority of polymerization takes place
during irradiation, conversion then evolves for up to 24 h post irradiation as a result of
reduction in free volume bringing radicals closer together allowing further reaction
(Truffier-Boutry et al., 2006).
1.2.2 The problem of polymerisation shrinkage and shrinkage stress
A major limitation of using RBCs as a dental restorative is shrinkage during
polymerization, which may lead to a poor marginal seal, marginal staining and potentially
an increased risk of recurrent caries. Polymerisation leads to closer packing of the
molecules and consequently a loss in volume and bulk contraction occurs as the resin
matrix changes from a pre-gel state to a solid. The polymerisation shrinkage increases
proportionally with the amount of carbon double bonds present in the reaction
environment. Consequently, increasing the proportion of low molecular weight
monomers increases the concentration of double bonds and thus the degree of conversion
increases with an increase in the volumetric shrinkage. Nonetheless, replacement of the
bulky Bis-GMA molecule with lower molecular weight monomers such as UDMA and
bisphenol-A ethoxylated dimethacrylate (Bis-EMA) have been shown to provide
improved mechanical properties (Indrani et al., 1995; Asmussen and Peutzfeldt, 1998;
Palin et al., 2003) although polymerisation shrinkage remains a problem.
Since the mid-twentieth century, the main strategy to reduce polymerisation
shrinkage has been to increase filler load. Shrinkage is an intrinsic property of the resin
matrix and it follows that a reduction in the monomer percentage would proportionally
reduce the shrinkage, as well as significantly increasing stiffness, which may also act to
compromise the tooth/RBC interface. Polymerisation shrinkage remains, and to date no
methacrylate-based chemistry has been developed to solve this problem, which may limit
the clinical longevity of a restoration. The polymerisation shrinkage of modern
24
methacrylate based RBCs remain in the region of 1-4% by volume (Lai and Johnson,
1993; Watts and Hindi, 1999; Schmidt et al., 2010).
As described in section 1.2, the gelation point of an RBC occurs when the viscous
flow of the curing monomer stops and is unable to keep up with the curing contraction
(Davidson and Feilzer, 1997). When the composite resin is in the pre-gel state, no stress
is conducted to the surrounding tooth structure. As the composite cures, the material can
flow from the unbound surface to accommodate for shrinkage. The flow stops once the
composite becomes too rigid due to the increasing modulus, and stresses are transmitted
to the surrounding cavity walls. The shrinkage strain induced during polymerisation is
characterised by its magnitude, direction and strain dependence and becomes problematic
when it becomes restricted by the adhesive bond at the tooth-restoration interface, which
causes it to manifest into shrinkage stress. The resultant stress may compromise the
synergism between the tooth and restoration interface (Davidson et al., 1984), increase
the likelihood of mechanical failure (Sakaguchi et al., 1992), permit the ingress of
bacteria, causing pulpal irritation (Lutz et al., 1991), result in cuspal deflection (Abbas et
al., 2003), and in some cases result in micro, or even macro-cracking of the surrounding
tooth (Hübsch et al., 1999; Palin et al., 2005).
The stress magnitude is not an inherent material property and is determined by
characteristics of composites such as filler content and modulus (Condon and Ferracane,
2000), curing rate (Bouschilcher and Rueggeberg, 2000) and degree of conversion (Braga
and Ferracane, 2002). Many authors have also reported that the final stress is governed by
the configuration factor (C-factor) of the cavity; the ratio of bonded to un-bonded
surfaces and the compliance of the surrounding tooth structure or test system (Feilzer et
al., 1987; Loguercio et al., 2004; Bragga et al., 2006; Watts and Satterthwaite, 2008).
Some authors suggest that C-factors less than 1 result in the low development of
shrinkage stress and the composite remains bonded to the cavity walls (Feilzer et al.,
1987). The C-factor itself is governed by the geometry of the cavity, i.e. the diameter and
the height which both independently influence the magnitude of stress generated.
Over the decades many changes have occurred in order to address the problem of
polymerization shrinkage and its associated stress. Major changes in light-curing units
and curing modes (Section 1.4.6) have occurred in attempts to try and prolong the gel
25
point, which has been reported to alleviate developing stress in vitro (Sakaguchi and
Berge, 1998; Hofmann et al., 2002).
Any clinical benefit of so-called, “soft-start” curing regimes (which employ lower
irradiance at the outset of polymerisation) has yet to be realised, and there remains a risk
of under-curing is adequate intensity is not provided to the restoration. Many factors
associated with light transmission will also affect how much shrinkage occurs. Such
factors include, light intensity, wavelength (Section 1.4.6) and the shade and opacity of
the composite.
1.3 Applications of Resin Based Composites
The synthetic resins of RBCs have been used in dentistry for many years as
restorative materials or adhesives. The fundamental characteristics that allow their
successful use as restorative materials are aesthetic quality (Burke et al., 2003; Haj-Ali et
al., 2005) and adequate mechanical physical properties (Peutzfeldt, 1997). Furthermore,
they are relatively easy to handle which allows easy manipulation in the oral cavity.
RBCs have many direct and indirect uses which include veneers, anterior restorations,
posterior restorations, crowns, bridges, repair of fracture restorations, liners, pits and
fissure sealants, bonding of orthodontic brackets and splinting (Ritter, 2005; Sadowsky,
2006).
„Extension for prevention‟, a principle introduced by Dr GV Black in 1895 which
quickly became a foundational stone for the practice in the 20th
century. The principle
was based on what was known in the 19th century and the limitations of technology, and
made perfect sense but was later shown in several studies that the best dentistry was a
least invasive one, one with the ultimate goal of conserving tooth structure (Ericson et al.,
2003; Anussavice, 2005). Nowadays, composites are placed with the principle of
„minimally invasive dentistry‟ which was indicated through the use of adhesive
restorative materials and new preparation instruments of the market (Rossomando, 2007).
It is often difficult to work with high and medium viscosity composite pastes as they are
difficult to handle. Flowable composites are better adapted to a less invasive preparation
of the cavity as the composite easily flows due to lower viscosity. This type of composite
26
was first introduced in the 1980‟s. With respect to the more viscous packable RBCs,
flowable composites can be produced in two ways; either by increasing the amount of
diluent monomer or by reducing the filler mass percentage. Additionally, the use of
flowable materials with reduced filler content has been shown to reduce shrinkage stress
due to it much lower elastic modulus (Bragga et al., 2003). Again, this has been reported
in vitro and its effect on lowering stress will differ depending on the ratio of bonded to
non-bonded surfaces (Feilzer et al., 1987; Loguercio et al., 2004; Braga et al., 2006;
Watts and Satterthwaite, 2008), compliance (Feilzer et al., 1987; Watts and Marouf,
2000), material composition (Anseth et al., 1996) and irradiation protocol (Sakaguchi and
Berge, 1998; Hofmann et al., 2002). Application of such composites include minimally
invasive class III cavities, class I and II cavities without masticatory loads, pit and fissure
sealing as well as extended pit and fissure sealing and class V cavities. Furthermore, they
may also be used for cavity linings in class I and II cavities to alleviate stress (Braga et
al., 2003).
Packable composites were designed and developed for use in the posterior region in
the late 1990‟s. Packable composites generally contain a high proportion of fillers or
specialised filler technology such as integrated matrix fillers (Leinfelder et al., 1999).
Such materials facilitate contouring of the approximal contact area when using standard
metal matrices. Furthermore, they do not stick to instrument and exhibit good positional
stability, which inevitably aids contouring of the occlusal surface. However, a more
invasive preparation is required as this type of composite is highly viscous.
1.4 Light-Curing Technology
Light curing technology has improved over the last several decades. By 2007, the
use of light emitting diode (LED) light curing units became wide spread and is set to
dominate the light curing industry (Krämer et al., 2008). However, to date, four main
types of polymerization initiating technology are available, namely halogen bulbs, plasma
arc lamps, argon ion lasers and LED.
27
1.4.1 The quartz-tungsten halogen bulb
Quartz tungsten halogen (QTH) lamps have been used in dentistry for several
decades despite their remarkably low efficiency due to the relatively large heat generation
(Strydon, 2005). Furthermore, as halogen bulbs operate with a hot filament, high
operating temperatures due to long cure times limits the lifespan of the bulb to
approximately 100 h with consecutive degradation of the bulb, reflector and band-pass
filters which are used to limit the emission range to the absorption range of
camphoroquinone (370-550 nm) (Neumann et al., 2005; Krämer et al., 2008). Recently,
one high power QTH light has been developed which uses a 340 Watt bulb producing up
to 3000 mW/cm2 and has a water-cooling system incorporated within the lamp housing to
prevent the unit overheating and to limit the degradation of the bulb. The latter problem
reduces the curing efficiency of the unit over time (Uhl et al., 2006). Typically for such
lights, 5% of the total energy is visible light, 12% is heat, and 80% is light emitted in the
infra-red region (Mills et al., 2002; Burgess et al., 2002).
1.4.2 Plasma-arc lamps
The reduction of curing time, which may have financial implications for a dentist,
motivated researchers to find an alternative. This led to the introduction of plasma arc
lamps (PAC) which emit at higher intensities (Rueggeberg, 1999). The emission of light
occurs through the glowing plasma, which is composed of gaseous mixtures of ionized
molecules such as xenon molecules and electrons. In comparison to QTH lamps, the
spectral emission range is comparable but have a higher intensity focused centrally
around 470nm (the maximum absorption wavelength of camphoroquinone).
28
1.4.3 Argon ion-lasers
Argon-ion laser technology has also been used which emit blue-green light of
activated argon ions in selected wavelengths (between 450 and 500 nm) (Meniga et al.,
1997). When compared to QTH lights, argon lasers show improved conversion rates and
polymerization depths (Fleming and Maillet, 1999). Although these showed improved
physical properties compared to conventional QTH systems, heat generation during
polymerization combined with considerably high initial shrinkage stresses have been
reported to be problematic (Christensen et al., 1999; Strydom, 2005). Furthermore, when
compared to QTH lights, argon lasers show improved conversion rates and
polymerization depths (Fleming and Maillet, 1999). However, these lights remain
expensive due to the narrowness of the beam and their only interesting feature over other
lights is their very low light dispersion over a distance (Krämer et al., 2008).
1.4.4 Light emitting diodes
Solid state light emitting diodes (LED) were later introduced as an attempt to
solve the problems associated with conventional halogen lights as describe earlier. The
efficiency of these lights was greatly improved as the power consumption was
significantly lower. Light is generated through junctions of doped semiconductors (p-n
junctions). In gallium nitride LEDs under forward biased conditions, electrons and holes
recombine at the LED‟s p-n junction leading to the generation of blue light which is
collimated through a polymer lens. The light emitted covers the maximum absorption
range of camphoroquinone despite its lower bandwidth (440-500 nm) so no filters are
needed (Nakamura et al., 1994). Despite the lower bandwidth, higher intensity light is
produced by such LEDs and consequently higher photo polymerization efficiency has
been reported (Neumann et al., 2006). Additionally, the advantages include a greater
lifespan as LED lamps with a lifetime of several thousands of hours without a significant
loss in intensity. Fifteen percent of the total energy produced is light energy and the
remaining eighty five percent is emitted as heat energy, although the heat produced is in
the opposite direction to the curing tip (Mills et al., 2002).
29
Over the last decade, LED technology has changed significantly with the
development of recent “generations” of high power LEDs comparable to advances in
high tech computer technology. The first generation LED lights were unable to compete
with conventional halogen technology despite their greater efficiency. This was due to
the lower power density, which forced manufacturers to build complicated arrangements
of ten to fifteen diodes into one lamp (Burgess et al., 2002; Hofmann et al., 2002).
Despite the higher intensity, the expectations toward a possible reduction in curing times
with first generation LEDs could not be confirmed (Besnault et al., 2003).
Second generation LEDs (or power LEDs) were later developed which were
capable of delivering rather high outputs (>1500 mW/cm2) with one single diode. These
where shown to produce material properties of polymers which where comparable to
QTH lights (Soh et al., 2004; Shortall, 2005) and the potential for reduced curing time
without loss of material properties was recognized (Yap and Soh, 2005; Schattenberg et
al., 2008). However, maximum light intensities were limited to approximately 2000
mW/cm2 as the heat generation created clinical concerns regarding gingival and pulpal
tissue damage caused by the so called photodynamic effect and therefore the
reappearance of cooling devices occurred (Krämer et al., 2008).
More recently, the introduction of new photoinitiators created compatibility issues
with narrow band LED light, which brought about the development of third generation
(or poly-wave) LED lights (Price and Felix, 2009). This generation of LED lights
comprises of two peaks, one in the visible region and one covering the shorter
wavelength UV-Vis region. The use of such LED lights allows effective overlap of the
emission spectra of the lights with the absorption spectra of other photoinitaitors such as
Lucirin TPO, Iragcure and phenyl propanedione (PPD), which absorb at shorter
wavelengths, as well as the most commonly used initiator, camphoroquinone (Neumann
et al., 2005; Neumann et al., 2006).
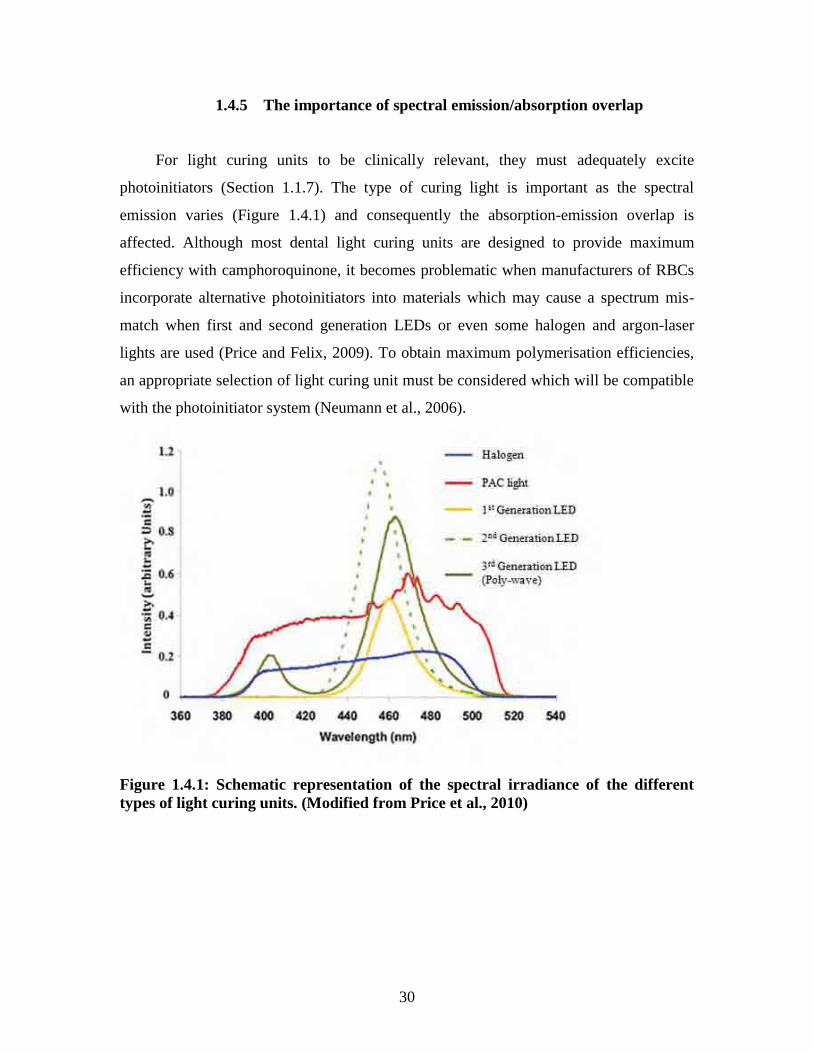
30
1.4.5 The importance of spectral emission/absorption overlap
For light curing units to be clinically relevant, they must adequately excite
photoinitiators (Section 1.1.7). The type of curing light is important as the spectral
emission varies (Figure 1.4.1) and consequently the absorption-emission overlap is
affected. Although most dental light curing units are designed to provide maximum
efficiency with camphoroquinone, it becomes problematic when manufacturers of RBCs
incorporate alternative photoinitiators into materials which may cause a spectrum mis-
match when first and second generation LEDs or even some halogen and argon-laser
lights are used (Price and Felix, 2009). To obtain maximum polymerisation efficiencies,
an appropriate selection of light curing unit must be considered which will be compatible
with the photoinitiator system (Neumann et al., 2006).
Figure 1.4.1: Schematic representation of the spectral irradiance of the different
types of light curing units. (Modified from Price et al., 2010)
31
1.4.6 The use of alternative curing protocols to reduce shrinkage
stress
Several curing protocols have been developed in order to address the problem of
polymerisation shrinkage and its associated stress. Such techniques include, step curing,
soft start and pulse-delay methods which have shown to improve conversion, material
properties and marginal quality through the reduction in internal stresses (Sakaguchi and
Berge, 1998; Hofmann et al., 2002).
The first attempt to reduce initial shrinkage stress was by the step curing method,
which initiates polymerisation initially at 100 mW/cm2 for 10s followed consecutively by
a higher intensity dose (700 mW/cm2). This technique may extend the pre-gel phase,
whereby any developing stress can be alleviated through composites flow. After the gel-
point, flow ceases and developing stresses cannot be compensated for. Although initial
results indicated lower polymerisation stresses than conventional halogen lights,
improved marginal adaption has not been reported (Muangmingsuk et al., 2003).
The soft start method is based on similar principles to the step curing method.
However, the increase from low intensity (100 mW/cm2) to higher intensity (800
mW/cm2) occurs exponentially. However, the use of such a technique has not been
unanimously clarified, although researchers have reported a reduction in stress, improved
marginal quality of RBC restorations has not been proven in vivo (Krämer et al., 2008).
Pulse activated polymerisation methods use short impulses of high intensity
irradiations. For example, ten pulses for at two seconds at 750 mW/cm2 exposes the
material to a total of twenty seconds of irradiation. The short pulses may extend the pre-
gel phase and allow flow of the composite, which may alleviate stress. Pulse-delay
methods have also been introduced, which initially irradiates the restoration with short
pulses of light energy (pre-polymerisation at low intensity, e.g. 2 seconds or 20 seconds
at 100 mW/cm2). After a short waiting period of about three minutes, the final
polymerisation is carried out for 30 seconds at high intensity. However this method
remains controversial due to the low degree of conversion at the base of the cavity and
furthermore no significant advantages have been reported (Yap et al., 2002).
32
1.5 The Exposure Reciprocity Law
The introduction of high powered curing lights allows the reduction in curing time
with the advantage of minimised chair side procedure time, which has financial
implications (Christensen, 2000). Furthermore, a reduced curing time seems attractive to
a patient, who are understandably reluctant to keep their mouth open for a long time.
Curing time can be reduced by optimizing the spectral overlap between the light
curing unit and the photoinitiator to increase the number of absorbed photons, however
the general trend amongst manufacturers of light curing units has been to produce lights
with increased irradiance with the assumption that curing time can be reduced
proportionally (Burgess et al., 2002; Hofmann et al., 2002; Yap and Soh, 2005;
Schattenberg et al., 2008). This is primarily based on the assumption that the degree of
conversion and mechanical properties of photoactive materials are dependent upon the
total energy of the irradiation, i.e. radiant exposure (J/cm2), the product of irradiance (I,
mW/cm2) and irradiation time (t, s; Equation 1.5.1).
It = constant Equation 1.5.1
The concept of total energy has been used extensively in other fields including
photography and radiography and more recently has been applied to photo-active dental
materials (Morgan, 1944; Halvorson et al., 2002; Peutzfeldt and Asmussen, 2005). The
idea of total energy originated from the work of Robert Bunsen and Henry Roscoe, who
in 1859 reported that all photochemical reactions are dependent upon the total absorbed
energy and is independent of irradiance and time. However, failures were observed and a
modification in the law was proposed by Scharzchild in 1900 (Equation 1.5.2):
IPt = constant Equation 1.5.2
where p is the Schwarzchild coefficient that he believed was a constant, which was latter
shown to vary from material to material and in some cases with a change in irradiance. In
2003 it was concluded that the law proposed by Schwarzchild adequately modeled the
33
photo-response of a wide range of materials as a function of irradiance, as p lies between
0.5 and 1.0 for 97% of materials where the latter corresponds to complete conformity to
exposure reciprocity (Martin et al., 2003).
In photo-active dental materials, the total energy principle promotes the common
assumption that varying combination of curing irradiance and exposure time provides
similar material properties for the same radiant exposure, irrespective of how radiant
exposure is obtained (by different combinations of irradiance and time). This is the
principle known as the “exposure reciprocity law”. This law has been tested with regards
to several properties such as degree of conversion, flexural strength, flexural modulus,
hardness and depth of cure (Feng and Suh, 2007) and in some cases the law holds quite
well with regards to modulus (Sakaguchi and Ferracane, 2001), degree of conversion
(Halvorson et al., 2002; Emami and Söderholm, 2003) and hardness (Price et al., 2004),
whilst clearly in others it does not for similar outcomes (Peutzfeldt and Asmussen, 2005;
Asmussen and Peutzfeldt, 2005; Feng and Suh, 2007). Although radiant exposure plays
an important role, irradiance and time independently influences polymer chain length,
extent of cross linking and mechanical properties and deviations from the law are
reported. The investigation by Musanje and Darvell (2003) is of particular interest, as
they tested highly filled commercial materials and their work highlighted the importance
of particular composition and reactivity. Out of the four products tested at different
combinations of irradiance and time, only one satisfied reciprocity with regards to
flexural strength, modulus and total energy to failure. Additionally, a recent study by
Feng and Suh (2009) also highlighted the inferior properties of some resin based
composites and adhesives when cured for short exposure times at high irradiance and the
same group earlier reported the importance of resin viscosity on degree of conversion and
the validity of exposure reciprocity law (Feng and Suh, 2007). Other studies have also
highlighted the inferior properties of lower viscosity systems, i.e. dentin bonding agents,
compared with higher viscosity resin composites when using high power light curing
units when compared to other lights (D‟alphino et al., 2007).
The efficiency of the photoinitiators are dependent upon their absorption
characteristics (Neumann et al., 2005) and the compatibility with the light curing unit
(Section 1.4.5), which will determine the amount of free radicals created (Neumann et al.,
34
2006). As degree of conversion is directly related to the efficiency of the photoinitiator
system (Emami and Soderholm, 2003; Ogunyinka et al., 2007;) and the amount of light
absorbed by the photoinitiator, it should be expected that reciprocity should hold at a
similar radiant exposure as the same total amount of efficient radicals are created by
different irradiation protocols (Chen et al., 2007). However, at very high irradiance,
photoinitiators with very low extinction coefficients i.e. camphoroquinone (~ 35 L.mol-
1.cm
-1), the photoinitiator system may become saturated resulting in no improvement in
the initiation rate (Musanje and Darvell, 2003) and thus failures in the law may occur.
The introduction of high powered lights and other photoinitiators may allow the
possibility of reduced curing time with increased irradiance although to date there is no
real consensus on an adequate radiant exposure to produce sufficient polymerization,
with radiant exposures ranging from 16-24 J/cm2 (Rueggeberg et al., 1993; Koran and
Kurschner 1998; Vandewalle et al., 2004) where the latter is usually considered a
standard for less than 2 mm increments cured with a halogen lamp. As mentioned earlier,
the combination of irradiance and time at the same radiant exposure will independently
influence polymer chain length, extent of cross linking and mechanical properties.
Peutzfeldt and Asmussen (2005) concluded that increasing radiant exposure increases the
degree of conversion, flexural strength and flexural modulus. Furthermore, the same
study also showed the trend of decreasing degree of conversion with high irradiance and
short time irradiation protocols for each radiant exposure whilst maximum flexural
strength and modulus occurred at an intermediate irradiance (Peutzfeldt and Asmussen,
2005). With high irradiance and short time irradiation protocols, degree of conversion
and the kinetic chain length may decrease and the frequency of cross-linking increase,
which may explain the parabolic relationship between irradiance, flexural strength and
flexural modulus. Dewaele et al. (2009) suggested that degree of conversion, elastic
modulus and gT of a light curing polymer-based material are mainly and positively
influenced by radiant exposure, whilst a negative correlation exists with respect to
irradiance. Leprince et al. (2010) reported the impact of irradiation mode on the radical
entrapment in photoactive resins. When similar radiant exposure were compared, higher
concentrations of trapped free radicals were measured for longer times at lower
irradiance. The authors suggested that since the premature termination of free radicals is
35
proportional to their squared concentration, which is higher for high irradiance protocols,
early termination of free radicals would result in a lower degree of conversion.
Furthermore, the concentration of trapped free radicals would also be influenced by the
composition of the reaction medium as polymerisation leads to highly cross-linked
networks where mobility restrictions would favour monomolecular termination (Section
1.2.1; Andrzekewska, 2001). Thus it is clear that the validity of exposure reciprocity law
is complex and several factors will influence whether the law is upheld.
1.6 Optical and Physical Properties of Resin Based Composites
The electromagnetic spectrum consists of photons of varying wavelengths and
energy (Figure 1.6.1). The interaction of matter with photons in the ultraviolet and visible
regions of the electromagnetic spectrum is known as UV-Vis spectroscopy, whereas the
spectroscopy of photons in the infra-red region is known as infra-red spectroscopy.
Spectroscopy is the study of the interaction between radiation or light with matter as a
function of wavelength, which can be used to assess the amount of a given substance or
for the identification of a substance. Ultraviolet-visible (UV-Vis) spectroscopy has been
used to calculate the quantum yield of conversion of photoinitiators in RBCs (Chen et al.,
2007). Degree of conversion of the monomers used in RBCs has been analysed using
mid- and near infra-red (MIR, NIR) spectroscopy (Antonucci and Toth, 1983; Ferracane
and Greener, 1984; Urabe et al., 1991; Stansbury and Dickens, 2001).
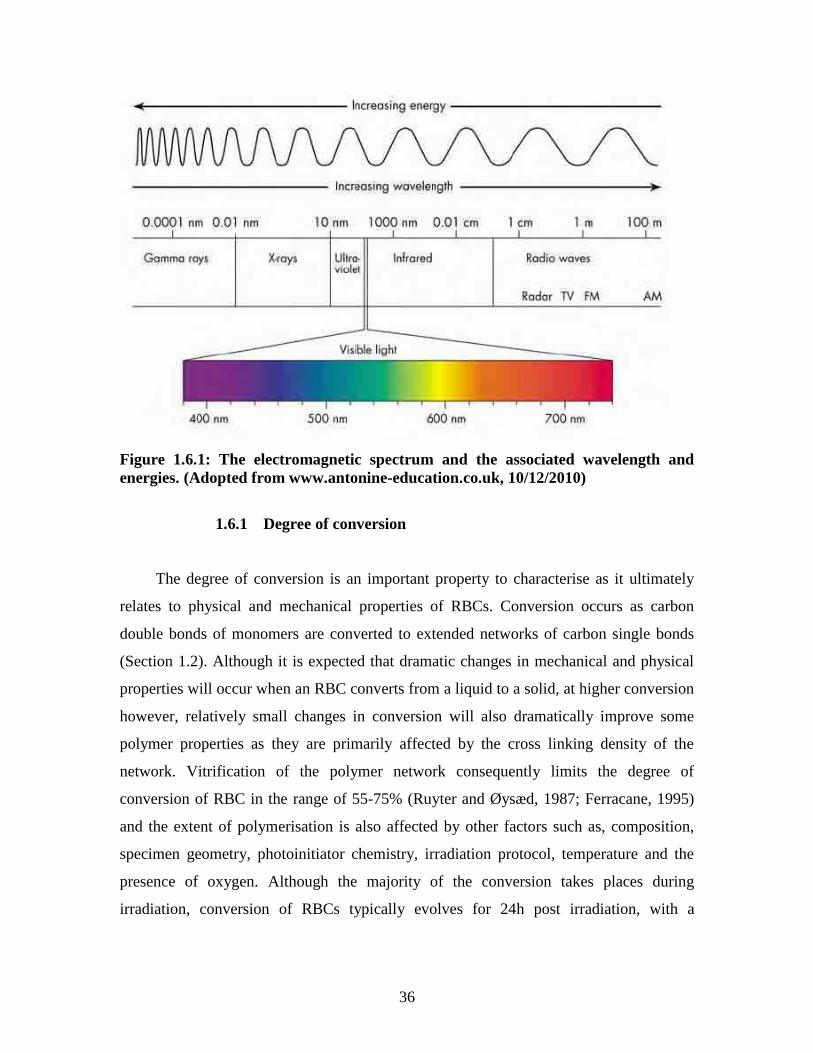
36
Figure 1.6.1: The electromagnetic spectrum and the associated wavelength and
energies. (Adopted from www.antonine-education.co.uk, 10/12/2010)
1.6.1 Degree of conversion
The degree of conversion is an important property to characterise as it ultimately
relates to physical and mechanical properties of RBCs. Conversion occurs as carbon
double bonds of monomers are converted to extended networks of carbon single bonds
(Section 1.2). Although it is expected that dramatic changes in mechanical and physical
properties will occur when an RBC converts from a liquid to a solid, at higher conversion
however, relatively small changes in conversion will also dramatically improve some
polymer properties as they are primarily affected by the cross linking density of the
network. Vitrification of the polymer network consequently limits the degree of
conversion of RBC in the range of 55-75% (Ruyter and Øysæd, 1987; Ferracane, 1995)
and the extent of polymerisation is also affected by other factors such as, composition,
specimen geometry, photoinitiator chemistry, irradiation protocol, temperature and the
presence of oxygen. Although the majority of the conversion takes places during
irradiation, conversion of RBCs typically evolves for 24h post irradiation, with a
37
logarithmically related decline in „post cure‟ (Vankerckhoven et al., 1982; Kildal and
Ruyter, 1994; Truffier-Boutry et al., 2006).
Several analytical techniques have been used to assess the degree of conversion in
RBC materials, amongst which a temperature based differential scanning calorimetry
(DSC) and infra-red spectroscopy are the most common (Antonucci and Toth, 1983;
Ferracane and Greener, 1984; Urabe et al., 1991; Stansbury and Dickens, 2001).
1.6.1.1 Fourier transform infra-red spectroscopy
Infra-red (IR) spectroscopy techniques are mainly based on absorption
spectroscopy in the IR region of the electromagnetic spectrum (Figure 1.6.1) and is
divided into three main regions; the near-, mid- and far- IR according to their relation to
the visible spectrum. The absorption at specific frequencies is characteristic of chemical
structure and can be used to identify and quantify specific functional groups in a
molecule.
Fourier transform infra-red (FT-IR) spectroscopy has evolved as a technique
which is used to obtain the IR spectrum of absorption, emission, photoconductivity or
Raman scattering of a solid, liquid or gas, and is capable of simultaneously acquiring
spectral data in a wide spectral range. The name „Fourier transform‟ simply means a
mathematical algorithm, which is used to convert the raw data into the actual spectrum.
The spectrometer is based on a Michelson interferometer (Section 1.6.3.1), where light
from a polychromatic IR source is collimated and directed to a beam splitter. The light is
then split equally onto a fixed mirror and a moving mirror, which is then reflected back to
the beam splitter. Ideally, fifty percent of this light is passed into the sample
compartment, which is then focused through the sample onto a detector. An
interferogram is produced by creating a „time-delay‟ with the moving mirror and
recording the signal at various points. This is then computed and the Fourier transform is
applied by a computer programme to obtain the IR spectrum.
In RBCs, IR spectroscopy directly measures the conversion as a function of the
un-reacted methacrylate groups. Several methods within this analytical technique exist,
which utilise a transmission method (Ruyter and Györösi, 1976), a multiple internal
38
reflection method (Ruyter and Svendsen, 1978), and an absorption method (Stansbury
and Dickens, 2001). The transmission method and the multiple internal reflection
methods measure the decrease in the intensity of the carbon double bond stretching mode
at 1637cm-1
as the methacrylate monomer is converted into polymer. However, these
methods require reference bands that are stable during polymerisation which are typically
based on aromatic groups of Bis-GMA (1608cm-1
or 1583cm-1
) or the N-H or C=O
groups of urethane monomers. Conversion for a Bis-GMA/TEGDMA system is then
calculated from the intensity at each band respectively (Equation 1.6.1):
Equation 1.6.1
Conversion has been characterised by FT-IR using other methods, namely
potassium bromide (KBr) pellets for bulk conversion and Raman spectroscopy, which
involves scattering rather than absorption (Stansbury and Dickens, 2001). However, most
of these techniques are limited by the fact that only the conversion in thin specimens was
possible or the sample had to be ground and destroyed to measure bulk conversion.
Near infra-red (NIR) spectroscopy has been used in medical and pharmaceutical
industries for the non-destructive analysis of products and over the last decade has
evolved as a technique to measure bulk conversion in RBCs having geometries of clinical
relevance (Burns and Ciurezak, 1992; Murray and Cowe, 1992; Stansbury and Dickens,
2001). In RBCs, NIR monitors the absorption of the =C-H group of monomers at
6165cm-1
and 4743cm-1
(Bis-GMA/TEGDMA) which corresponds to conversion of the
methacrylate groups. The band at 4743cm-1
is not typically used to characterize
methacrylate conversion because the sharp baseline drop near its =C-H peak makes
reliable peak area measurement difficult. Therefore the degree of conversion at 6165cm-1
is the calculated from equation 1.6.2:
Equation 1.6.2
100 1608 / 1638
1608 / 1638 %
1 1
1 1
uncured cm cm
cured cm cm Conversion
Conversion 100 1 %
absorbance Initial
absorbance Final
39
It is also possible to measure the conversion of RBCs based on other monomers as
the majority of the peaks lie between 6163 and 6167cm-1
(Stansbury and Dickens, 2001).
Additionally, such measurements do not require the presence of an internal reference
peak and the non-destructive nature allows real-time measurement of conversion by the
continuous measurement of the change in absorbance of the =C-H group. It is also then
possible to interrogate curing kinetics, such as autoacceleration, rate maximum and time
to reach maximum rates of polymerisation
1.6.1.2 An alternative to infra-red spectroscopy
Differential scanning calorimetry (DSC) provides a measure of the methacrylate
conversion based on the enthalpy of the exothermic polymerisation reaction. This
thermo-analytical technique uses the amount of heat required to increase the temperature
of a sample and a reference as a function of temperature. The technique was originally
developed by Watson and O‟Neil (1960) and then later became commercially available.
It is now used in a variety of applications including the measurement of polymerisation in
dental polymers (Lee et al., 2004; Tanimoto et al., 2005).
The underlying principle of this technique is that when a sample undergoes a
physical transformation from one phase to another, more or less heat will need to flow to
it than the reference to maintain both of them at the same temperature. For example,
when ice melts, it will require more heat flowing to the sample to increase the
temperature at the same rate as the reference. This is an endothermic process in which
heat is absorbed by the sample to undergo its phase transition. Conversely with RBCs, an
exothermic polymerisation process (due to the conversion of the carbon double bonds to
single bonds and photoinitator decomposition) will require less heat to raise the sample
temperature. Thus, by observing the heat flow between the sample and reference, it is
possible to measure the amount of heat absorbed and released during phase transitions.
By assuming the heat produced during the polymerisation is proportional to the number
of monomer units converted under isothermal conditions, it is possible to determine the
degree of conversion and kinetics of polymerisation (Tanimoto et al., 2005).
40
Differential Thermal Analysis (DTA) has been shown to be a reliable method for
measuring the conversion of dental composites (McCabe 1985; Imazato et al. 2001).
Other methods to measure temperature change during polymerisation have also been
employed. Some methods are based on thermocouples and others are based on
thermistors (Shortall and Harrington, 1998). Although polymerisation temperatures can
be measured, several limitations exist. Firstly, the non-isothermal conditions prevent
reaction kinetics from being determined and secondly the positioning of the temperature
sensors (on the material surface or embedded within its bulk) and the volume of the test
sample will dictate how much heat is registered. For this reason it seems DSC is more
reliable, but thermocouple and thermistor based methods remain adequate for simple
temperature measurements during polymerisation of RBCs.
1.6.2 Light transport through photocurable resins
The transmission of light and number of photons absorbed by the photoinitiator is
critically important to the extent of polymerisation and is a desired parameter to fully
characterise since it ultimately relates to the final mechanical and physical properties of
the polymer. Inefficient light transmission and limited cure depths are associated with
surface reflection (Harrington and Wilson, 1995; Watts and Cash, 1994), absorption
(Chen et al., 2007; Ogunyinka et al., 2007), scattering by filler particles (Enami et al.,
2005; dos Santos et al., 2008) and interfacial filler/resin refraction (Shortall et al., 2008).
Upon irradiation, the photoinitiator will decompose (Section 1.1.7) and reduce its
concentration. Polymerisation shrinkage of the curing resin (Section 1.2.2) will reduce
the optical path length with the outcome of increased light transmission through the
sample according to Beer-Lamberts law (Equation 1.6.3).
0
logI
IClA
Equation 1.6.3
where, A is the absorbance, l is the optical path length, C and ε are the concentration and
molar extinction coefficient of the absorbing species (i.e. the photoinitiator) and I and
41
0I are the light transmission and initial light transmission, respectively. Interestingly,
varying patterns of light transmission in RBCs have been reported even using the same
method. Harrington et al. (1996) developed a method based on a photo-diode which
allowed the actual consumption of light energy by the activator to be demonstrated and
reported an increasing light intensity with radiation time for most commercial
composites. Using the same technique, Ogunyinka et al. (2007) reported decreasing
transmission during polymerisation of experimental composite formulations. Then,
Shortall et al. (2008) described the effect of monomer and filler composition on light
transmission and reported that the refractive index mis-match between the filler and resin
will affect its light transmission profile where maximum transmission was observed when
the refractive index of the resin and filler are equal. This underlines the complexity of the
optical properties of RBC materials when cured at depths as problems associated with
attenuation and inherently non-uniform curing rates profiles exist which will inevitably
affect the extent of monomer conversion.
1.6.3 Refractive index
As the resin matrix (typically, co-monomer mixtures of Bis-GMA and TEGDMA;
Section 1.1.3) cures, its optical properties change and refractive index rises due to a rapid
increase in cross-link density and viscosity. As the refractive index of the resin
approaches that of the filler, interfacial filler/resin scattering is reduced and light
transmission is increased (Shortall et al., 2008). The refractive index (n) of a medium at
optical wavelengths is defined as the ratio of phase velocity of light in a vacuum (c) to
the phase velocity ( p), in a given medium (Shoemaker et al., 1989) and the velocity at
which it propagates is wavelength dependent (Equation 1.6.4).
p
cn
Equation 1.6.4
When light passes through the interfaces of two media, it is accompanied a
change in velocity and a directional change. Hence the refractive index can also be
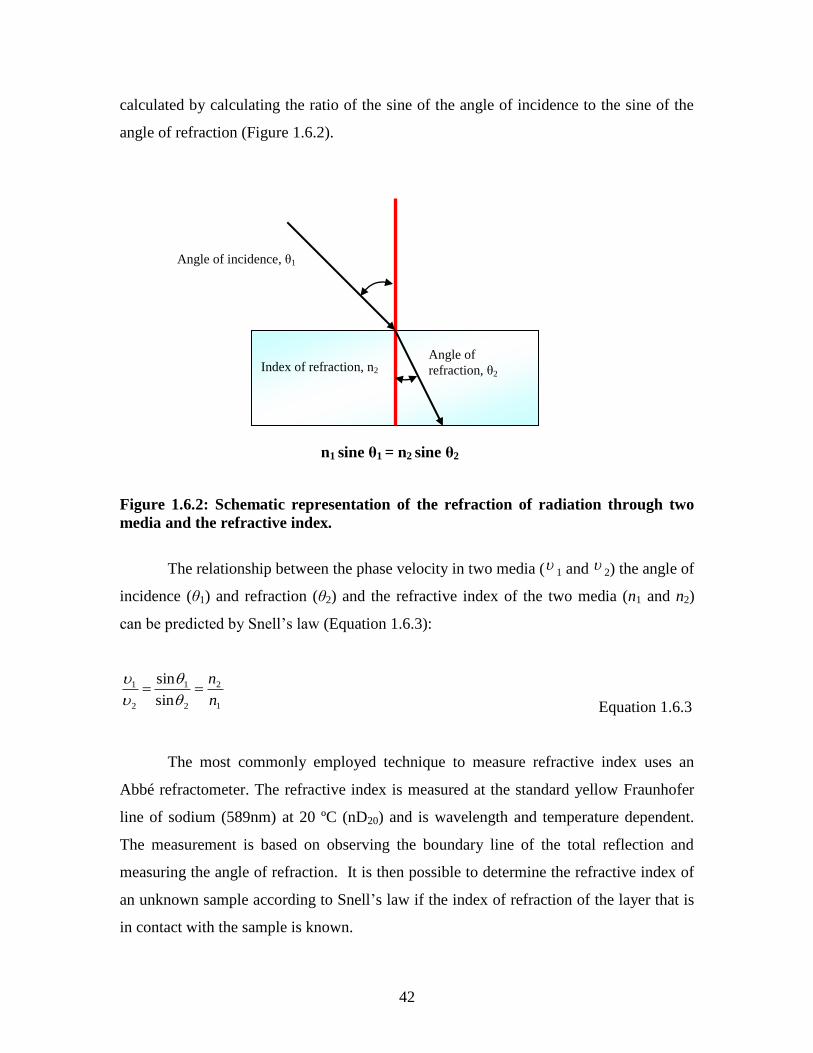
42
calculated by calculating the ratio of the sine of the angle of incidence to the sine of the
angle of refraction (Figure 1.6.2).
Figure 1.6.2: Schematic representation of the refraction of radiation through two
media and the refractive index.
The relationship between the phase velocity in two media ( 1 and 2) the angle of
incidence (θ1) and refraction (θ2) and the refractive index of the two media (n1 and n2)
can be predicted by Snell‟s law (Equation 1.6.3):
1
2
2
1
2
1
sin
sin
n
n
Equation 1.6.3
The most commonly employed technique to measure refractive index uses an
Abbé refractometer. The refractive index is measured at the standard yellow Fraunhofer
line of sodium (589nm) at 20 ºC (nD20) and is wavelength and temperature dependent.
The measurement is based on observing the boundary line of the total reflection and
measuring the angle of refraction. It is then possible to determine the refractive index of
an unknown sample according to Snell‟s law if the index of refraction of the layer that is
in contact with the sample is known.
Angle of incidence, θ1
Angle of
refraction, θ2 Index of refraction, n2
n1 sine θ1 = n2 sine θ2
43
1.6.3.1 Contribution of low coherence interferometry
Characterising the optical and physical properties of RBCs remains an important
aspect in the development of restorative materials. Static and theoretical measurements of
refractive index are well established for dental polymers (Shortall et al., 2008; Lehtinen
et al., 2008). Additionally, polymerisation shrinkage of dental composites has been
assessed by several methods amongst which dilatotometry (Archimedes principle) (de
Gee and Davidson, 1981) and the bonded disc method (Watts and Cash, 1991) are the
most commonly employed although devices based on laser interferometry and optical
magnifiers are available (Fogleman et al., 2002; Demoli et al., 2004; Arenas et al., 2007).
Low coherence interferometry (LCI) is an optical technique which has been
applied to several fields related to industrial surface metrology, biological analysis,
medical systems and more recently has been applied in the physical and optical
characterisation of dental polymers to obtain thickness and topography (Tomlins et al.,
2007; Morel and Torga, 2009). It is well suited to such applications as there is no direct
contact between the sample and the fiber output and the possibility of measuring samples
at high temperatures exists. In RBC materials, the ability to measure refractive index and
thickness change simultaneously during curing photoactive resins may allow for the
design of composite formulations which exhibit optimum evolution of translucency (as
the refractive index of the curing resin approaches that of the filler) and enable precise
control of aesthetic quality and light transmission through material bulk to cure at depths.
A „coherence grating‟ provides precise axial positioning of an object in the
direction of light propagation and therefore it is possible to obtain micron range
accuracies. Information on finite volume and structural information as a function of depth
may be obtained by focusing the light to obtain good transverse resolution (perpendicular
to the optical beam) so that backscattered light is coupled back into the interferometer.
This then mixes with a reference beam to form interference fringes, which is then
detected by a photo-detector.
The most commonly used interferometer is the Michelson interferometer and was
invented by Albert Abraham Michelson. The interferometer consists of two highly
polished mirrors, a half silvered mirror and a monochromatic light source. The half
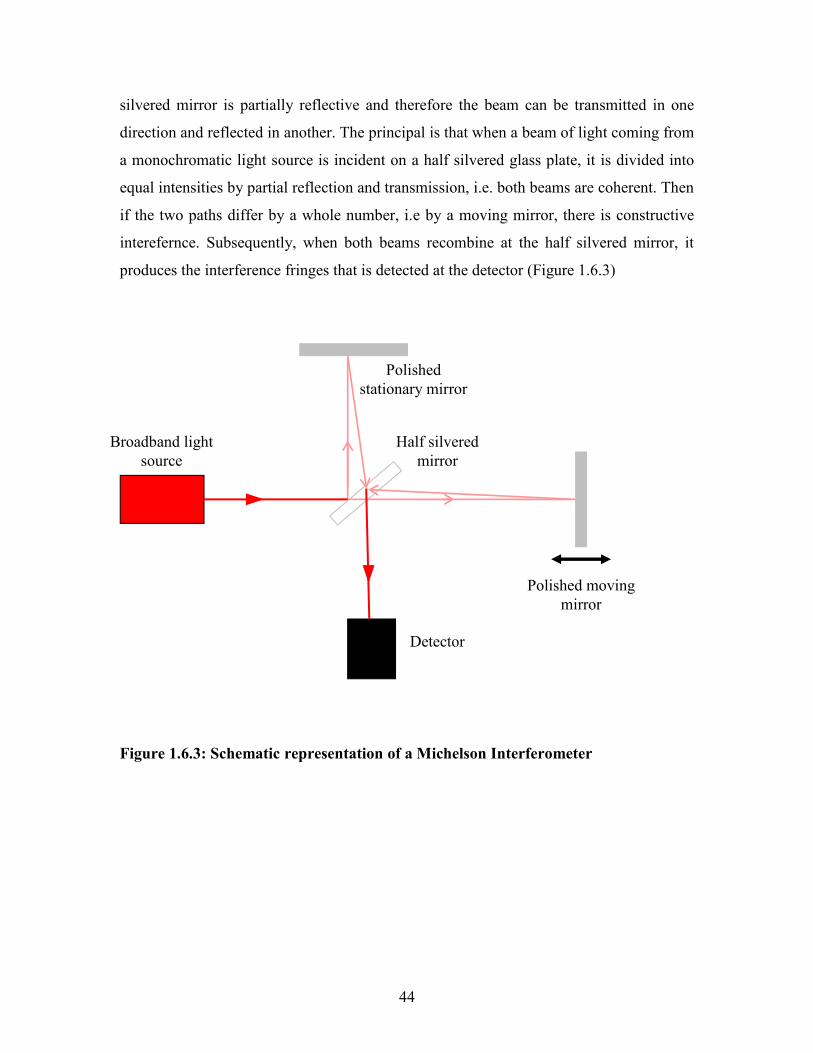
44
silvered mirror is partially reflective and therefore the beam can be transmitted in one
direction and reflected in another. The principal is that when a beam of light coming from
a monochromatic light source is incident on a half silvered glass plate, it is divided into
equal intensities by partial reflection and transmission, i.e. both beams are coherent. Then
if the two paths differ by a whole number, i.e by a moving mirror, there is constructive
interefernce. Subsequently, when both beams recombine at the half silvered mirror, it
produces the interference fringes that is detected at the detector (Figure 1.6.3)
Figure 1.6.3: Schematic representation of a Michelson Interferometer
Half silvered mirror
Polished stationary mirror
Polished moving mirror
Detector
Broadband light source
45
1.6.4 Colour
The matching of restorative materials to natural teeth is complicated as the human
perception of colour varies according to differences in illuminant, background colour,
positioning, translucency and human eye fatigue (van der Burgt et al., 1990; Dagg et al.,
2004; Joiner, 2004). Additionally, moisture, skin tone and the surface characteristics of
the restoration, i.e. gloss matt and roughness, further complicates matters. As described
earlier (Section 1.1.1) the ability of RBCs to mimic tooth structure is one of its greatest
assets and therefore a standardized method of quantifying any colour change is essential
for a restoration to be aesthetically acceptable.
The composition within the RBC determines its ability to colour match to natural
teeth, i.e the photoinitiator and pigments and dyes. One of the greatest problems
associated with the use of pigmented photoinitaitors such as camphoroquinone is the
presence of a partly unbleachable chrompore group (Jakubiak et al., 2003), which reduces
its compatability in bleach shade composites. Additionally, such photoinitaitors are
typically used with amine photo-sensitizers which are also known to produce coloured
reaction by products (Asmussen, 1985). This ultimately limits the concentration of
champhoroquinone/amine that can be incorporated in to RBCs with concentrations
ranging from 0.17 mass percentage to 1.03 mass percentage (Taira et al., 1988).
Moreover, colour matching is further complicated by the fact that photoinitaitors
decompose during irradiation with a subsequent loss of colour. However, the use of
alternative photoinitaitors (Section 1.1.7.2) which absorb short wavelength visible light
may show improved aesthetics and better colour matching properties particularly with
bleach shade composites.
Clinically, during colour matching, RBC colour is quantified by the use of shade
guides (van der Burgt et al., 1990) but remains subjective and operator sensitive. The
same operator may even visualize the same colour differently at different times (Okubo et
al., 1998). Despite many inherent disadvantages associated with visual matching, it
remains the most common method for determining tooth colour and shade matching due
to its cost effectiveness over instrumental colour measurement devices (Brewer et al.,
2004).
46
1.6.4.1 Colorimetric spectrometry
The colour of RBCs relates to optical properties of opacity and translucency and
may be measured using a colorimeter or spectrophotometer. The sample under test is
irradiated with light, which is transmitted, reflected, refracted and diffused through the
sample (van der Burgt et al., 1990). The reflectance pattern is then measured which is
unique (fingerprint) for each colour and therefore can be numerically quantified.
Although such measurements are more reliable than visual assessment, its accuracy is
limited due to the translucent nature of tooth structure and the occurrence of edge loss, in
which tooth structure may be affected by background colour (Seghi et al., 1990; Bolt et
al., 1994; Brewer et al., 2004). Spectrophotometers are typically considered to be more
accurate than colorimeters, however recent advances in modern colorimeters have greatly
improved their reliability (Seghi, 1990).
For accuracy, such measurements are usually made with standard illuminants
such as D65, which corresponds to average daylight conditions and illuminant A which
represents incandescent lighting based on typical domestic tungsten filaments. The
illuminant is irradiated onto the test specimen at a specific orientation (45○ for dental
materials) and the reflected light is then captured and analysed, the spectrum of which
represents the materials colour. However, as colour is not static and differs with
illuminant and viewing orientations, the Commission Internationale de l‟Eclairage (CIE)
have recommended four illuminating/viewing configurations to be used for materials
with diffuse reflecting surfaces such as RBCs (Seghi, 1990) (Figure 1.6.4).
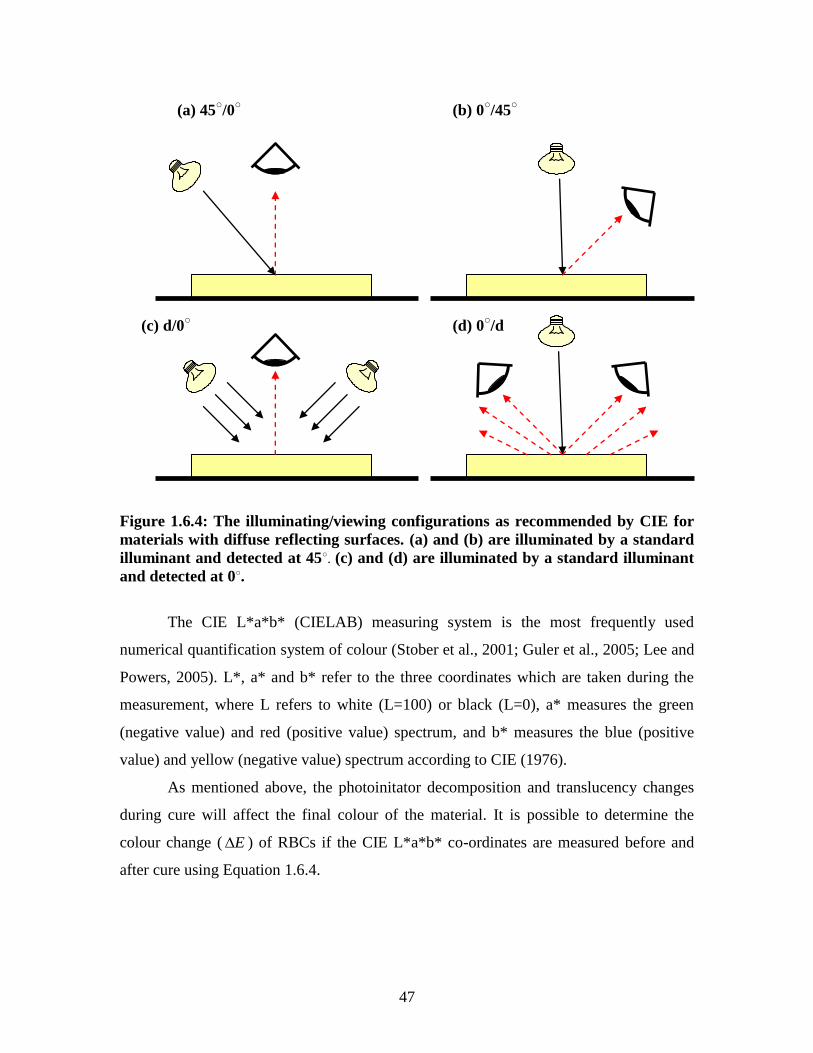
47
Figure 1.6.4: The illuminating/viewing configurations as recommended by CIE for
materials with diffuse reflecting surfaces. (a) and (b) are illuminated by a standard
illuminant and detected at 45○. (c) and (d) are illuminated by a standard illuminant
and detected at 0○.
The CIE L*a*b* (CIELAB) measuring system is the most frequently used
numerical quantification system of colour (Stober et al., 2001; Guler et al., 2005; Lee and
Powers, 2005). L*, a* and b* refer to the three coordinates which are taken during the
measurement, where L refers to white (L=100) or black (L=0), a* measures the green
(negative value) and red (positive value) spectrum, and b* measures the blue (positive
value) and yellow (negative value) spectrum according to CIE (1976).
As mentioned above, the photoinitator decomposition and translucency changes
during cure will affect the final colour of the material. It is possible to determine the
colour change ( E ) of RBCs if the CIE L*a*b* co-ordinates are measured before and
after cure using Equation 1.6.4.
(b) 0○/45
○
(c) d/0○ (d) 0
○/d
(a) 45○/0
○
48
2*
1
*
2
2*
1
*
2
2*
1
*
2 )()()( bbaaLLE Equation 1.6.4
where the subscript numbers 1 and 2 represent before and after cure, respectively for each
co-ordinate. Subsequently, the acceptability of differences in colour change is a matter of
debate in dental literature (Jonston and Kao; 1989; Guler et al., 2005; Lee and Powers,
2005) whereby some authors suggest that a E value less than 3.3-3.7 is clinically
acceptable (Johnston and Kao, 1989; Lee and Powers, 2005) and some suggest a E
value less than 5.4 is clinically acceptable (Cook and Chong, 1985) for RBCs. This value
is lower for resins and a value not exceeding 2 is considered acceptable (Ferracane et al.,
1985). Such differences are presumably due to the many factors affecting the perception
of colour, which underlines the necessity to quantify and measure colour change to
improve clinical acceptability.
1.7 Summary
Since the introduction of RBCs in the 1960‟s (Bowen, 1962) there have been
significant developments, which continue to improve both mechanical and physical
properties, with the ultimate goal of improved clinical longevity. Although RBCs are
becoming ever popular with increasing clinical indications, many inherent limitations
remain, which limits their application. Polymerisation shrinkage (Davidson and Feilzer,
1997) and limited cure depths (Fan et al., 2002) of RBCs remain major drawbacks when
compared to amalgam fillings. Much research has been conducted in order to try and
improve the setting reaction through improved technology and chemistry, but
polymerization shrinkage and limited depth of cure remain major concerns of clinicians
when using RBCs.
49
1.7.1 Aims of the present investigation
The kinetics of polymerisation is complex and is dependent upon several factors
including monomer composition (Feng and Suh, 2007), photoinitiator chemistry (Emami
and Soderholm, 2005; Ogunyinka et al., 2007), filler content and irradiation protocol
(Musanje and Darvell, 2003; Asmussen and Peutzfeldt, 2005) which all affect the setting
reaction. The application of the so-called “exposure reciprocity law” seems an interesting
approach to control polymerization kinetics and polymer properties. Consequently, to
better understand polymerization kinetics, the associated setting reaction and the
applicability of the exposure reciprocity law, Chapter 2 aims to investigate anomalies of
the law in high viscosity commercial materials and their low viscosity counterparts
(Section 2.1). However, the analysis of commercial materials remains limited due to the
fact that manufacturers typically do not divulge the exact composition of RBCs, and thus
the investigation of the exposure reciprocity law and the setting reaction in experimental
materials for further understanding will also be conducted (Section 2.2). Additionally, the
chemistry of the photoinitiator (i.e. the type and concentration) will play a remarkable
role in the kinetics of polymerization and the setting reaction and therefore the impact of
photoinitiator type in filled and unfilled photoactive resins on the exposure reciprocity
law will also be investigated (Section 2.3).
Additionally, as the optical properties of RBC are not well understood, Chapter 3
aims to improve the understanding of such properties within RBCs. The composition of
the RBC, i.e. photoinitiator, pigments/dyes, resin matrix and filler fundamentally control
any optical change during cure. The photoinitiator is the primary absorber of light and its
efficiency is dependent upon its absorption characteristics and will ultimately affect
reaction kinetics. However, the use of other photoinitaitors such as Lucirin TPO are
increasing in popularity mainly due to aesthetic benefits, therefore to better understand
the use of Lucirin TPO in RBCs, the absorption characteristics of Lucirin TPO will also
be investigated with regards to conversion, kinetics, physical properties and its potential
for improved aesthetics (Section 3.1).
Limited cure depths are primarily associated with inefficient light transmission at
depth. Optical change is mainly governed by Beer-lamberts law, however, this is
50
complicated by the fact that there is a complex interaction between photoinitiator
decomposition, shrinkage due to monomer conversion and an increase in refractive index
due to increase in density by cross linking of polymer chains. As the monomer cures, the
refractive index increases and maximum light transmission is expected at the point where
refractive index of the monomer matches that of the filler (Shortall et al., 2008).
However, the change in refractive index is dependent upon the resin matrix composition
and is not well understood dynamically. Therefore to better understand dynamic changes
in refractive index the simultaneous dynamic monitoring of refractive index change
through and physical thickness change of photo-active resins will be demonstrated using
a novel bespoke low coherence interferometer (Section 3.2) with the goal of a better
understanding of optical and physical properties. Additionally the affect of shrinkage
strain on light transmission will also be investigated (Section 3.3), with the aim of
improving the setting reaction through better understanding of light transmission during
light curing of various specimen geometries
51
References
Abbas G, Fleming GJP, Harrington E, Shortall ACC and Burke FJT. Cuspal
movement and microleakage in premolar teeth restored with a packable composite
cured in bulk or in increments. Journal of Dentistry, 2003; 31: 437-444.
Allen NS. Photoinitiators for UV and visible curing of coatings: mechanisms and
properties. Journal of Photochemistry and Photobiology A: Chemistry, 1996; 100:
101-107
Alvim HH, Alecio AC, Vasconcellos WA, Furlan M, de Oliveira JE and Saad JRC.
Analysis of camphoroquinone in composite resins as a function of shade. Dental
Materials, 2007; 23: 1245-1249.
Andrzejewska E. Photopolymerisation kinetics of multifunctional monomers.
Progress in Polymer Science, 2001; 26: 605-665.
Anseth KS, Anderson KJ, Bowman CN. Radical concentration, environments, and
reactivities during cross-linking polymerizations. Macromolecular Chemistry and
Physics, 1996; 197: 833-848.
Anseth KS, Goodner MD, Reil MA, Annurpatti AR, Newman SM and Bowman CN.
The influence of comonomer composition on dimethacrylate resin properties for
dental composites. Journal of Dental Research, 1996; 75: 1607-1612
Antonucci JM and Toth EE. Extent of polymerization of dental resins by differential
scanning calorimetry. Journal of Dental Research 1983; 23: 704-707
Anussavice KJ. Present and future approaches for the control of caries. Journal of
Dental Education, 2005; 69: 538-554.
Arenas G, Noriega S, Vallo C, Duchowicz R. Polymerisation shrinkage of dental resin
composite determined by a fiber optic Fizeau interferometer. Optical
Communications, 2007; 271: 581-586.
Asmussen E and Peutzfeldt A. Influence of UEDMA, BisGMA and TEGDMA on
selected mechanical properties of experimental resin composites. Dental Materials,
1998; 14: 51-56.
Asmussen E. Clinical relevance of physical, chemical and bonding properties of
composite resins. Operative Dentistry, 1985; 10: 61-73
Asmussen E. Factors affecting the quantity of remaining double bonds in restorative
resin polymers. European Journal of Oral Sciences, 1982; 90: 490-496.
Atai M and Watts DC. A new kinetic model for the photopolymerisation shrinkage-
strain of dental composites and resin monomers. Dental Materials, 2006; 22: 785-791.
52
Baily WJ. Cationic polymerization with expansion in volume. Journal of
Macromolecular Science, 1975; A9: 849-865.
Berry TG, Summit JB, Chung AKH, and Osbborne JW. Amalgam at the new
millennium. Journal of American Dental Association, 1998; 129: 1547-1556.
Besnault C, Pradelle-Plasse N, Picard B, and Colon P. Effect of a LED versus halogen
light cure polymerization on the curing characteristics of three composite resins.
American Journal of Dentistry, 2003; 16: 323-328.
Beun S, Bailly C, Dabin A, Vreven J, Devaux J, Leloup G. Rheological properties of
experimental Bis-GMA/TEGDMA flowable resin composites with various
macrofiller/microfiller ratio. Dental Materials, 2009; 25:198-205.
Bolt R, Ten Bosch J, Coops J. Influence of window size in small window colour
measurement, particularly of teeth. Physics in Medicine and Biology, 1994; 39: 1133-
1142.
Boulden JE, Cramer NB, Shreck KM, Couch CL, Bracho-Troconis C, Stansbury JW
and Bowman CN. Thiol-ene-methacrylate composites as dental restorative materials.
Dental Materials, 2010, DOI: 10.1016/j.dental.2010.11.001
Bouschlicher MR, Rueggeberg FA. Effect of ramped light intensity on polymerization
force and conversion in photactivated composite. Journal of Esthetetic Dentistry,
2000; 12: 328-329.
Bowen RL, Marjenhoff WA. Dental Composites.Glass Ionomers: the materials.
Advanced Dental Research, 1992; 6: 44-49.
Bowen RL. Dental Filling Materials Comprising of Vinyl-Silane Treated Fused Silica
and Binder Consisting of the Reaction Product of Bisphenol And Glycidyl
Methacrylate. 1962, US Patent 3, 066,112
Brackett MG, Brackett WW, Browning WD, Rueggeberg FA. The effect of light
curing source on the residual yellowing of resin composites. Operative Dentistry,
2007; 35: 443-450.
Braga RR, Ballester RY, Ferracane JL. Factors involved in the development of
polymerization shrinkage stress in resin composites: A systematic review. Dental
Materials, 2005; 21: 962-970.
Braga RR, Boaro LCC, Kuroe T, Azevedo CLN, Singer JM. Influence of cavity
dimensions and their derivatives (volume and „C‟ factor) on shrinkage stress
development and microleakage of composite restorations. Dental Materials, 2006; 22:
818-823.
Braga RR, Ferracane JL. Contraction stress related to degree of conversion and
reaction kinetics. Journal of Dental Research, 2002; 81: 114-118.
53
Braga RR, Hilton TJ and Ferracane JL. Contraction stress of flowable composite
materials and their efficiency as stress-reliveing layers. Journal of American Dental
Assocoation, 2003; 134: 721-728
Brewer JD, Wee A, Seghi R. Advances in color matching. Dental Clinics of North
America, 2004; 48: 341-358.
Burgess JO, Walker RS, Porche CJ and Rappold AJ. Light curing. An update.
Compendium of Continuing Education in Dentistry, 2002; 23: 889-896.
Burke FJ, McHugh S, Hall AC, Randall RC, Widstrom E, Forss H. Amalgam and
composite use in UK general dental practice in 2001. British Dental Journal, 2003;
194: 613-618.
Burns DA and Ciurezak EW, editors. Handbook of near-infra-red analysis Practical
spectroscopy series 1992, vol. 13. New York: Marcel Dekker
Byerley TJ, Eick JD, Chen GP, Chappelow CC and Millich F. Synthesis and
polymerization of new expanding dental monomers. Dental Materials, 1992; 8: 345-
350.
Chen YC, Ferracane JL and Prahl SA. Quantum Yield of conversion of the
photoinitiator camphoroquinone. Dental Materials, 2007; 23: 655-664.
Christensen GJ. Curing restorative resin: A significant controversy. Journal of the
American Dental Association, 2000; 131: 1067-1069.
Christensen RP, Palmer TM, Ploeger BJ and Yost MP. Resin polymerization
problems. Are they caused by resin curing lights, resin formulation, or both?
Continuing Education in Dentistry Supplement, 1999; S42-S54.
Condon JR, Ferracane JL. Assessing the effect of composite formulation on
polymerization stress. Journal of the American Dental Association, 2000; 131: 497-
503.
Cook WD, Chong MP. Colour stability and visual perception of dimetacrylate based
dental composite resins. Biomaterials, 1985; 6: 257-264.
Cramer NB and Bowman CN. Kinetics of thiol-ene and thiol-acrylate
photopolymerisations with real time Fourier transform infrared. Journal of Polymer
Science Part A- Polymer Chemistry, 2001; 19: 3311-3319
Cramer NB, Couch CL, Schreck KM, Carioscia JA, Boulden JE and Stansbury JW.
Ivestigation of thiol-ene and thiol-ene-methacrylate based resins as dental restorative
materials. Dental Materials 2010; 26: 21-28
D‟alphino PHP, Svizero NR, Pereira JC, Rueggeberg FA, Carvalho RM, Pashley DH.
Influence of light curing sources on polymerisation reaction kinetics of a restorative
system. American Journal of Dentistry, 2007; 20: 46-52.
54
Dagg H, O‟Connel B, Claffey N, Byrne D, Gorman C. The influence of some
different factors on the accuracy of shade selection. Journal of Oral Rehabilitation,
2004; 31: 900-904.
Davidson CL and Feilzer AJ. Polymerisation shrinkage and polymerization shrinkage
stress in polymer-based restoratives. Journal of Dentistry, 1997; 25: 435-440.
Davidson CL, DeGee AJ and Feilzer AJ. The competition between the composite
dentine bond strength and the polymerization contraction stress. Journal of Dental
Research, 1984; 63: 1396-1399.
de Gee AJ, Davidson CL. A modified dilatometer for continuous recording of
volumetric polymerization shrinkage of composite restorative materials. Journal of
Dentistry, 1981; 9: 36-42.
Demoli N, Knezevic A, Tarle Z, Meniga A, Sutalo J, Pichler G. Digital Interferometry
for measuring the resin composite thickness during blue light polymerization. Optical
Communications, 2004; 231: 45-51.
Dewaele M, Asmussen E, Peutzfeldt A, Munksgaard EC, Benetti AR, Finné G,
Leloup G and Devaus J. Influence of curing protocol on selected properties of light-
curing polymers: degree of conversion, volume contraction, elastic modulus, and
glass transition temperature. Dental Materials, 2009; 25: 1576-4584.
Dodes JE. The amalgam controversy: an evidence based analysis. Journal of the
American Dental Association, 2001; 132: 348-356.
dos Santos GB, Alto RV, Filho HR, da Silva EM, Fellows CE. Light transmission in
dental resin composites. Dental Materials, 2008; 24: 571-576.
Drummond JL. Degradation, Fatigue and Failure of Resin Dental Composite
Materials. Journal of Dental Research, 2008; 87: 710-719.
Emami N and Söderholm KJ. How light irradiance and curing time affect monomer
conversion in light-cured resin composites. European Journal of Oral Science, 2003;
111:536-542.
Emami N, Sjodhal M, Söderholm KM. How filler properties, filler fraction, sample
thickness and light source affect light attenuation in particulate filled resin
composites. Dental Materials, 2005; 21: 721-730.
Ericson D, Kidd E, McComb D, Mjör I and Noack MJ. Minimally invasive dentistry-
concepts and techniques in cariology. Oral Health Preventitive Debtistry, 2003; 1: 59-
72.
Ernst C, Meyer G, Klocker K and Willershausen B. Determination of polymerisation
shrinkage stress by means of photoelastic investigation. Dental Materials, 2004; 20:
313-321.
55
Fan PL, Schumacher RM, Azzolin K, Geary R and Eichmiller FV. Curing light
intensity and depth of cure of resin-based composites tested according to international
standards. Journal of American Dental Association, 2002; 133: 429-434
Feilzer AJ, De Gee AJ, Davidson CL. Setting stress in composite resin in relation to
configuration of the restoration. Journal of Dental Research, 1987; 66: 1636-1639.
Feng L and Suh BI. Exposure reciprocity law in photopolymerisation of multi-
functional acrylates and methacrylates. Macromolecular Chemistry and Physics,
2007; 208: 295-306.
Feng L, Carvalho R and Suh BI. Insufficient cure under the condition of high
irradiance and short irradiation time. Dental Materials, 2009; 25: 283-289.
Ferracane JL and Greener EH. Fourier transform infrared analysis of degree of
polymerization in unfilled resins- methods comparison. Journal of Dental Research,
1984: 63: 1093-1095.
Ferracane JL. Current trends in dental composites. Critical Review of Oral Biological
Medicine, 1995; 6: 301-318.
Fleming MG and Maillet WA. Photopolymerisation of composite resin using the
argon laser. Journal of Canadian Dental Association, 1999; 65: 447-450.
Fogleman EA, Kelly MT and Grubbs WT. Laser interferometer methods for
measuring linear polymerization shrinkage in light cured dental restoratives. Dental
Materials, 2002; 18:324-330.
Fonseca RG, Crux CADS and Adabo GL. The influence of chemical activation on
hardness of dual curing resin cements. Brazilian Oral Research, 2004; 18: 288-232.
Forss H, Widström E. From amalgam to composite: selection of restorative materials
and restoration longevity in Finland. Acta Odontologica Scandinavica, 2001; 59: 57-
62.
Gauthier MA, Stangel I, Ellis TH and Zhu XX. Oxygen inhibition in dental resins.
Journal of Dental Research, 2005; 84: 725-729.
Geurtsen W. Substances released from dental resin composites and glass ionomer
cements. European Journal of Oral Sciences, 1998; 106: 687-695.
Gilmour AS, Evans P, Addy LD. Attitudes of general dental practioners in the UK to
the use of composite materials in posterior teeth. British Dental Journal, 2007; 202:
E32.
Glenn JF. Composition and properties of unfilled and composite restorative materials.
In: Smith DC, Williams DF, editors. Biocompatability of dental materials. Vol III.
10th
ed. Boca Ration (FL): CRC Press; 1982. p. 98-125
56
Goodner MD and Bowman CN. Modeling primary radical termination and its effects
on autoacceleration in photopolymerisation kinetics. Macromolecules, 1999; 32:
6552-6559
Guler AU, Yilmaz F, Kulunk T, Guler E and Kurt S. Effects of different drinks on
stainability of resin composite provisional restorative materials. The Journal of
Prosthetic Dentistry, 2005; 94: 118-124.
Haj-Ali R, Walker MP, Williams K. Survey of general dentists regarding posterior
restorations, selection criteria, and associated clinical problems. General Dentistry,
2005; 53: 369-375.
Halvorson RH, Erickson RL, Davidson CL. Energy dependent polymerization of
resin-based composite. Dental Materials, 2002; 18:463-469.
Harrington E, Wilson HJ, Shortall AC. Light activated restorative materials: a method
of determining effective radiation times. Journal of Oral Rehabilitation, 1996; 23:
210-218.
Harrington E, Wilson HJ. Determination of radiation energy emitted by light
activation units. Journal of Oral Rehabilitation, 1995; 22: 377-385.
Hofmann N, Hugo B, Klaiber B. Effect of irradiation type (LED or QTH) on photo-
activated composite shrinkage strain kinetics, temperature rise, and hardness.
European Journal of Oral Science, 2002; 110: 471-479.
Hübsch PF, Middleton J, Feilzer AJ. Identification of the constitutive behaviour of
dental composite cements during curing. Computer Methods in Biomechanics and
Biomedical Engineering, 1999; 2: 245-256.
Ilie N, Hickel R. Can CAMPHOROQUINONE be completely replaced by alternative
initiators in dental adhesives?. Dental Materials Journal, 2008; 27: 221-228.
Imazato S, McCabe JF, Tarumi H, Ehara A and Ebisu S. Degree of conversion of
composites measured by DTA and FTIR. Dental Materials, 2001; 17:178-183.
Indrani DJ, Cook WD, Televantos F, Tyas MJ and Harcourt JK. Fracture toughness of
water-aged resin composite restorative materials. Dental Materials, 1995; 11: 201-
207.
Jacquelyn A, Carioscia HL, and Stansbury JW. Thiol-ene oligomers as dental
restorative materials. Dental Materials, 2005; 21: 1137-1143
Jakubiak J, Allonas X, Fouassier JP. Camphoroquinone-amine photoinitiating systems
for the initiation of free radical polymerization. Polymer, 2003; 44: 5219-5226
Johnston WM, Kao EC. Assessment of appearance match by visual observation and
clinical colorimetry. Journal of Dental Research, 1989; 68: 819-822.
Joiner A. Tooth colour: a review of the literature. Journal of Dentistry 2004; 32: 3-12
57
Jones DW. Has Dental amalgam been torpedoed and sunk? Journal of Dental
Research, 2008; 87: 101-102
Kelly JR, Nishimura I, and Campbell SD. Ceramics in Dentistry: Historical Roots and
Current Perspectives. Journal of Prosthetic Dentistry, 1996; 75: 18-32.
Kildal KK and Ruyter IE. How different curing methods affect the degree of
conversion of resin-based inlay/onlay materials. Acta Odontologica Scandinavica,
1994; 52: 315-322.
Knock FE, Glenn JF. Dental Materials, US Patent No. 2,558,139, June 26, 1951 (CA
46: 784f, 1952)
Koran P, Kurschner R. Effect of sequential versus continuous irradiation of a light
cured resin composite on shrinkage, viscosity, adhesion, and degree of
polymerisation. American Journal of Dentistry, 1998; 11: 17-22.
Krämer N, Lohbauer U and Garcia-Godoy F. Light curing of resin based composites
in the LED era. American Journal of Dentistry, 2008; 21: 135-142.
Lai JH and Johnson AE. Measuring polymerization shrinkage of photo-activated
restorative materials by a water filled dilatometer. Dental Materials, 1993; 9: 139-143.
Laney WR. Prosthodontics: A historical Perspective. Journal of Prosthodontics, 1997;
6: 2-6.
Lee JK, Choi JY, Lim BS, Lee Y and Sakaguchi RL. Change of properties during
storage of a UDMA/TEGDMA dental Resin. Journal of Biomedical Meterial
Research B: Applied Biomaterials, 2004; 64B: 216-221.
Lee Y-K, Powers J. Discoloration of dental resin composites after immersion in series
of organic and chemical solutions. Journal of Biomedical Materials Research Part B:
Applied Biomaterials, 2005; 73B: 361-367.
Lehtinen J, Laurila T, Lassila LJ, Vallittu PK, Raty J, Hernberg R. Optical
characterization of bisphenol-A-glycidyldimethacrylate-
triethyleneglycoldimethacrylate (BisGMA/TEGDMA) monomers and copolymer.
Dental Materials, 2008; 24: 1324-1328.
Leinfelder KF, Bayne SC and Swift EJ Jr. Packable composites: overview and
technical considerations. Journal of Esthetic Dentistry, 1999; 11: 234-249.
Leprince J, Lamblin G, Devaux J, Dewaele M, Mestdagh M, Palin WM, Gallez B,
Leloup G. Irradiation Modes‟ impact on radical entrapment in photoactive resins.
Journal of Dental Research, 2010; 89: 1494-1498
Leprince J, Lamblin G, Truffier-Boutry D, Demoustier-Champagne S, Devaux J,
Mestdagh M, Leloup G. Kinetic study of free radicals trapped in dental resins stored
in different environments. Acta Biomaterials 2009; 5:2518-2524.
58
Loguercio AD, Reis A, Ballester RY. Polymerisation shrinkage: effects of constraint
and filling technique in composite restorations. Dental Materials, 2004; 20: 236-243.
Lovell LG, Stansbury JW, Syrpes DC, and Bowman SN. Effects of composition and
reactivity on the reaction kinetics of dimethacrylate/dimethacrylate
copolymerisations. Macromolecules, 1999; 32: 3913-3921
Lu H, Stansbury JW, Bowman CN. Toward the elucidation of shrinkage stress
development and relaxation in dental composites. Dental Materials, 2004; 20: 979-
986.
Lutz F, Kreici I and Barbakow F. Quality and durability of marginal adaption in
bonded composite restorations. Dental Materials, 1991; 7: 107-113.
Martin JW, Chin JW and Tinh N. Reciprocity law experiments in polymeric
photodegradation: a critical review. Progress in Organic Coatings, 2003; 47: 292-311.
McCabe JF Cure performance of light-activated composites assessed by differential
thermal analysis (DTA). Dental Materials, 1985; 1:231-234.
Mendes LC, Tedesco AD and Miranda MS. Determination of degree of conversion as
a function of depth of a photo-initiated dental restoration composite. Polymer Testing,
2005; 24: 418-422.
Meniga A, Tarle Z, Ristic M, Sutalo J, Pichler G. Pulsed blue laser curing of hybrid
composite resins. Biomaterials, 1997; 18: 1349-1354.
Mills RW, Uhl A and JAndt KD. Optical Power outputs, spectra and dental composite
septh of cure, obtained with with blue light emitting diode (LED) and halogen light
curing units (LCUs). British Dental Journal, 2002; 193: 459-463.
Moad G and Solomon DH. The chemistry of free radical polymerization 1995;
London, Pergamon.
Morel EN, Torga JR. Dimensional characterization of opaque samples with a ring
interferometer. Optics and Lasers in Engineering, 2009; 47: 607-611.
Morgan RH. Reciprocity law failure in X-Ray films. Radiology, 1944: 42-471.
Moszner N, Salz U. New developments of polymeric dental composites. Progress in
Polymer Science, 2001; 26: 535-576.
Muangmingsuk A, Senawongse P andYudhasaraprasithi S. Influence of different soft
start polymerisation techniques onmatginal daption of class V restorations. American
Journal of Dentistry, 2003; 16: 117-119.
Munksgaard EC, Irie M, Asmussen E. Dentin-polymer bond promoted by Gluma and
various resins. Journal of Dental Research, 1985; 64: 1409-1411.
59
Murray I, Cowe IA. Editors. Making light work: advances in near infrared
spectroscopy 1992, New York: VCH Publishers
Musanje L and Darvell BW. Polymerization of resin composite restorative materials:
exposure reciprocity. Dental Materials, 2003; 19:531-541.
Mutter J, Naumann J, Sadaghiani C, Walach H, and Drasch G. Amalgam studies:
Disregarding basic principles of mercury toxicity. International Journal of Hygiene
and Environmental Health, 2004; 207: 391-397.
Nakamura S, Mukai T, Senoh M. Candela-class high brightness InGaN/AlGaN
double hetrostructure blue light-emmitting diodes. Applied Physics Letters 1994; 64:
1687-1689
Neumann MG, Miranda WG Jr, Schmitt CC, Rueggeberg FA, Correa IC. Molar
extinction coefficients and the photon absorption efficiency of dental photoinitiators
and light curing units. Journal of Dentistry, 2005; 33: 525-532.
Neumann MG, Schmitt CC, Ferreira GC, Correa IC. The initiating radical yields and
the efficiency of polymerisation for various dental photoinitiators excited by different
light curing units. Dental Materials, 2006; 22: 576-584.
Ogunyinka A, Palin WM, Shortall AC and Marquis PM. Photoinitiation chemistry
affects light transmission and degree of conversion of curing experimental dental
composites. Dental Materials, 2007; 23: 807-813.
Okubo SR, Kanawati A, Richards MW, Childress S. Evaluation of visual and
instrument shade matching. The Journal of Prosthetic Dentistry, 1998; 80: 642-648.
Osborne JW. Dental amalgam and mercury vapor release. Advances in Dental
Research, 1992; 6: 135-138.
Osborne JW. Safety of dental amalgam. Journal of Esthetic Restorative Dentistry,
2004; 16: 377-388.
Pagoria D, Lee A and Geurtsen W. The effect of camphoroquinone
(CAMPHOROQUINONE) and CAMPHOROQUINONE-related photosensitizers on
the generation of reactive oxygen species and the production of oxidative DNA
damage. Biomaterials, 2005; 26: 4091-4099.
Palin WM, Fleming G, Nathwani H, Burke T, Randall RC. In vitro cuspal deflection
and microleakage of maxillary premolars restored with novel low-shrink dental
composites. Dental Materials, 2005; 21: 324-335.
Palin WM, Fleming GJP, Burke FJT, Randall RC. Monomer conversion versus
flexure strength of a novel dental composite. Journal of Dentistry, 2003; 31: 341-351.
Palin WM, Fleming GLP, Burke FJT, Marquis PM and Randall RC. The influence of
short and medium-term water immersion on the hydrolytic stability of novel low-
shrink dental composites. Dental Materials, 2005; 21: 852-863.
60
Park YJ, Chae KH, Rawls HR. Development of new photoinitiation system for dental
light-cure composite resins. Dental Materials, 1999; 15: 120-127.
Patel MP, Braden M, Davy KWM. Polymerisation shrinkage of methacrylate esters.
Biomaterials, 1987; 1: 53-56
Peutzfeldt A and Asmussen E. Resin composite properties and energy density of light
cure. Journal of Dental Research, 2005; 84:659-662.
Peutzfeldt A. Resin Composites in Dentistry: the monomer systems. European Journal
of Oral Sciences, 1997; 105: 97-116.
Pfeifer CS, Silva LR, Kawani Y, Braga RR. Bis-GMA co-polymerisation: Influence
on conversion, flexural properties, fracture toughness and susceptibility to ethanol
degradation of experimental composites. Dental Materials, 2009; 25: 1136-1141.
Price RB and Felix CA. Effect of delivering light in specific narrow bandwidths from
394 to 515nm on the microhardness of resin composites. Dental Materials, 2009; 25:
899-908.
Price RB, Felix CA, Andreou P. Effects of resin composite composition and
irradiation distance on the performance of curing lights. Biomaterials, 2004; 25:4465-
4477.
Price RBT, Fahey J and Felix CM. Knoop Microhardness mapping used to compare
the efficacy of LED, QTH and PAC curing lights. Operative Dentistry, 2010; 35: 58-
68.
Ritter AV. Direct resin-based composites: current recommendations for optimal
clinical results. Compendium of Continuing Education in Dentistry, 2005; 26: 481-
490.
Rossomando EF. Minimally invasive dentistry and the dental enterprise.
Compendium, 2007; 28: 104-105.
Rueggeber FA, Caughman W and Curtis J. Factors affecting cure at depths within
light-activated resin composite. American Journal of Dentistry, 1993; 6: 91-95.
Rueggeberg F. Contemporary issues in photocuring. Compendium of Continuing
Education in Dentistry Supplement, 1999; 20: S4-15.
Rueggeberg FA, Ergle JW and Lockwood PE. Effect of photoinitiator level on
properties of light cure and post cure heated model resin system. Dental Materials,
1997; 13: 360-363.
Rueggerberg FA. From vulcanite to vinyl, a history of resins in restorative dentistry.
The Journal Prosthetic Dentistry, 2002; 87: 364-379.
Ruyter IE and Györösi PP. An infrared spectroscopic study of sealants. Scandinavian
Journal of Dental Research, 1976; 84: 396-400.
61
Ruyter IE and Øysæd H. Composites for use in posterior composites: composition and
conversion. Journal of Biomedical Material Research, 1987; 1: 11-23.
Ruyter IE and Svendsen SA. Remaining methacrylate groups in composite restorative
materials. Acta Odontologica Scandinavica, 1978; 36: 75-82.
Sadowsky SD. An overview of treatment considerations for esthetic restorations: A
review of the literature. The Journal of Prosthetic Dentistry, 2006; 96: 433-442.
Sakaguchi RL and Ferracane JL. Effect of light power density on development of
elastic modulus of a model light-activated composite during polymerization. Journal
of Esthetic Restorative Dentistry, 2001; 13:121-130.
Sakaguchi RL, Berge HX. Reduced light energy density decreases post-gel
contraction while maintaining degree of conversion in composites. Journal of
Dentistry, 1998; 26: 695-700.
Sakaguchi RL, Perters MC, Nelson SR, Douglas WH and Port HW. Effects of
polymerization contractions in composite restorations. Journal of Dentistry, 1992; 20:
178-182.
Schatterberg A, Lichtenberg D, Stender E, Willershausen B and Ernst CP. Minimal
exposure time of different LED-curing devices. Dental Materials, 2008; 24: 1043-
1049.
Schmidt M, Kirkevang LL, Horsted-Binslev P, and Poulsen S. Marginal adaption of a
low-shrinkage silorane-based composite: 1-year randomized clinical trial. Clinical
Oral Investigations, Short communication, 2010: DOI 10.1007/s00784-010-0446-2
Schweikl H, Schmalz G and Weinmann W. The induction of gene mutations and
micronuclei by oxiranes and siloranes in mammalian cells in vitro. Journal of Dental
Research, 2004; 83: 17-21.
Seghi RR. Effects of instrument-measuring geometry on colorimetric assessments of
dental porcelains. Journal of Dental Research, 1990; 69: 1180-1183.
Shin DH and Rawis RH. Degree of conversion and colour stability of the light curing
resin with new photoinitiator systems. Dental Materials, 2009; 25: 1030-1038.
Shoemaker DP, Garland CW, Nibler JW. Experiments in physical chemistry, 1989;
5th Edition., Chapter 17: McGraw-Hill, New York.
Shortall AC and Harrington E. Temperature rise during the polymerization of light-
activated resin composites. Journal of Oral Rehabilitation, 1998; 25:908-913.
Shortall AC. How light source and product shade influences cure depth for a
contemporary composite. Journal of Oral Rehabilitation, 2005; 32: 906-911.
62
Shortall AC, Palin WM, and Burtscher P. Refractive index mismatch and monomer
reactivity influence composite curing depths. Journal of Dental Research, 2008; 87:
84-88.
Sideridou ID, Achiilias DS. Elution study of unreacted Bis-GMA, TEGDMA,
UDMA, and BisEMA from light cured dental resins and resin composites using
HPLC. Journal of Biomedical Materials Research Part B: Applied Biomaterials, 2005;
74B: 617-626.
Silikas N, Watts DC. Rheology of urethane dimethacrylate and diluent formulations.
Dental Materials, 1999; 15: 257-261.
Soh MS, Yap AU, Siow KS. Post-gel Shrinkage with different modes of LED and
halogen light curing units. Operative Dentistry, 2004; 29: 317-324.
Soh MS, Yap AU, Yu T, Shen ZX. Analysis of the degree of conversion of LED and
halogen lights using micro-raman spectroscopy. Operative Dentistry, 2004; 29: 571-
577.
Sorin WV, Gray DF. Simultaneous thickness and group index measurement using
optical low-coherence reflectometry. IEEE photonics technology letters, 1992; 4:105-
107.
Stansbury JW and Dickens SH. Determination of double bond conversion in dental
resins by near infrared spectroscopy. Dental Materials, 2001; 17: 71-79.
Stansbury JW. Synthesis and evaluation of new Oxaspiro monomers for double-ring
opening polymerization. Journal of Dental Research, 1992b; 71: 1408-1412.
Stansbury JW. Synthesis and evaluation of novel multifunctional oligomers for
dentistry. Journal of Dental Research, 1992; 71: 434-437.
Stevens MP. Polymer Chemistry: An Introduction, Hartford, Oxford University Press.
Stober T, Glide H, Lenz P. Color stability of highly filled composite resin materials
for facings. Dental Materials, 2001; 17: 87-94.
Strydom C. Polymerisation and polymerization shrinkage stress: Fast cure versus
conventional cure. Journal of the South African Dental Association, 2005; 60: 252-
253.
Strydom C. Prerequisites for proper curing. Journal of the South African Dental
Association, 2005; 60: 254-255.
Studer K, Koniger R. Initial photoyellowing of photocrosslinked coatings. European
Coatings Journal, 2001; 1: 26-37.
Suh BI. Controlling and understanding the polymerization shrinkage-induced stresses
in light cured composites. Compedndium, 1999; 20: 34-41.
63
Taira M, Urabe H, Hirose T, Wakasa K, Yamaki M. Analysis of photo-initiators in
visible-light-cured dental composite resins. Journal of Dental Research, 1988; 67: 24.
Tanimoto Y, Hayakawa T and Nemoto K. Analysis of photopolymerisation behaviour
of UDMA/TEGDMA resin mixture and its composite by differential scanning
calorimetry. Journal of Biomedical Meterial Research B: Applied Biomaterials, 2005;
72B: 310-315.
Terry DA. Dimensions of colour. Creating high diffusion layers with composite resin.
Compendium of Continuing Education in Dentistry, 2003; 24: 3-13.
Thompson VP, Williams EF and Baily WJ. Dental resins with reduced shrinkage
during hardening. Journal of Dental Research, 1979; 58: 1522-1532.
Tomlins PH, Palin WM, Shortall AC, Wang RK. Time-resolved simultaneous
measurement of group index and physical thickness during photopolymerization of
resin-based dental composite. Journal of Biomedical Optics, 2007; 12: 014020.
Truffier-Boutry D, Demoustier-Champagne S, Devaux J, Biebuyck JJ, Mestdagh M,
Larbanois P, Leloup G.A physico-chemical explanation of the post-polymerization
shrinkage in dental resins. Dental Materials, 2006; 22:405-412.
Turssi CP, Ferracane JL, Vogal K. Filler Features and their effects on wear and
degree of conversion of particulate dental resin composites. Biomaterials, 2005; 26:
4932-4937.
Uhl A, Volpel A, Sigusch BW. Influence of heat from light curing units and dental
composite polymerisation on cells in vitro. Journal of Dentistry, 2006; 34: 298-306.
Urabe H, Wakasa K, Yamaki M. Cure performance of multifunctional monomers to
photo-initiators: a thermoanalytical study on bis-GMA- based resins. Journal of
Material Science, 1991; 26: 3185-3190.
van der Burgt TP, ten Bosch JJ, Borsboom PCF, Kortsmit WJPM. A comparison of
new and conventional methods for quantification of tooth colour. The Journal of
Prosthetic Dentistry, 1990; 63: 155-162.
Vandewalle KS, Ferracane JL, Hilton T, Erikson RL and Sakaguchi RL. Effect of
energy dentsity on properties and marginal integrity of posterior resin composite
restorations. Dental Materials, 2004; 20:96-106.
Vankerckhoven H, Lambrechts P, Van Beylen M, Davidson CL and Vanherle G.
Unreacted methacrylate groups on the surface of composite resins. Journal of Dental
Research, 1982; 61: 791-795.
Watson ES and O‟Neill MJ. Differntial Microcalorimter. US Patent No. 3,263,484,
August 2, 1966
Watts DC and Hindi AA. Intrinsic „Soft start‟ polymerization shrinkage-kinetics in an
acrylate-based resin composite. Dental Materials, 1999; 15: 39-45.
64
Watts DC, Cash AJ. Analysis of optical transmission by 400-500nm visible light into
aesthetic dental biomaterials. Journal of Dentistry, 1994; 22: 112-117.
Watts DC, Cash AJ. Determination of polymerization shrinkage kinetics in visible
light cured materials: methods development. Dental Materials, 1991; 7: 281-287.
Watts DC, Marouf AS. Optimal specimen geometry in bonded disk shrinkage-strain
measurements on light cured biomaterials. Dental Materials, 2000; 16: 447-451
Watts DC, Satterthwaite JD. Axial Shrinkage-stress depends upon both C-factor and
composite mass. Dental Materials, 2008; 24: 1-8.
Watts DC. Reaction Kinetics and Mechanics in photo-polymerisaed networks. Dental
Materials, 2005; 21: 27-35.
Weinamann W, Thalacker C and Guggenberger R. Siloranes in dental composites.
Dental Materials, 2005; 21: 68-74.
Yap AU and Soh MS. Curing efficiency of a new generation high power LED lamp.
Operative Dentistry, 2005; 30: 758-763.
Yap AU, Soh MS and Siow KS. Post-gel shrinkage with pulse activation and soft start
polymerization. Operative Dentistry, 2002; 27: 44-49.

65
CHAPTER 2
Polymerisation Kinetics of Resin Based Composites
65
2.0 Polymerisation Kinetics of Resin Based Composites
Resin based composites (RBCs) have become the material of choice in restorative
dentistry for the direct restoration of damaged teeth. Although the materials have been
significantly improved since their introduction several decades ago, several limitations
remain. Most notably, inadequate cure depth and polymerisation shrinkage continue to be
of primary concern to clinicians. From a material development viewpoint, such problems
have been addressed by investigating various material aspects such as inorganic filler
morphology and content, resin formulation and curing light technology, with some
success. Clinically, RBCs are placed incrementally and should be cured according to
manufacturer‟s guidelines for the material in an attempt to overcome the potential
negative consequences of material shrinkage and inadequate cure depth. The incremental
layering technique employed is designed to allow for adequate cure of a given increment
and also to reduce bulk contraction stress of the composite restoration (Mackenzie et al.,
2009). However, for large restorations this can be a complex time consuming procedure
and is undesirable both from the viewpoint of operator efficiency and patient comfort.
Consequently, the goal of reduced chairside procedure time of large resin composite
restorations requiring multiple increments is pursued globally. Accordingly, several
investigators and manufacturers of light curing units support the “exposure reciprocity
law” and claim that the radiant exposure (the product of irradiance and time) is the main
determining factor of degree of conversion and mechanical properties of photoactive
RBCs (Sakaguchi and Ferracane, 2001; Halvorson et al., 2002; Price et al., 2004; Emami
et al., 2006). Consequently, due to the supposed reciprocity between irradiance and time,
some dentists use high-power light curing units to reduce curing exposure. However,
failures in the law are reported and it has been suggested that irradiance and time
independently influence polymer chain length, extent of cross linking and mechanical
properties (Musanje and Darvell, 2003; Asmussen and Peutzfeld, 2005; Peutzfeldt and
Asmussen, 2005; Dewaele et al., 2009). Therefore, the aim of the current Chapter is to
gain a greater insight into such failures by further investigating the physical properties of
high intensity curing.
66
2.1 High Irradiance Curing and the Applicability of the Exposure
Reciprocity Law in Commercial Dental Resin-Based Materials*
2.1.1 Abstract
The aim of this work was to investigate the effect of high irradiance curing on
degree of conversion (DC) of „flowable‟ resin composites and their counterpart higher
viscosity restorative materials. Five commercial flowable materials (Venus; Heraeus
Kulzer, Synergy D6; Coltene, Premise; Kerr, Grandio; Voco and Gradia; GC Corp) and
their counterpart restorative versions were tested. Specimens were cured with a halogen
Swiss Master Light (EMS, Switzerland) at similar radiant exposures (18 J/cm2): 400
mW/cm2 for 45 s, 900 mW/cm
2 for 20 s, 1500 mW/cm
2 for 12 s, 2000 mW/cm
2 for 9 s or
3000 mW/cm2 for 6 s. DC was measured in real time by Fourier transform near infrared
spectroscopy (FT-NIRS). Two way ANOVA testing revealed significant differences
(P<0.02) with respect to “composite type” and “cure protocol” for DC for all 5 product
comparisons. Supplementary one-way ANOVA also revealed significant differences
between curing protocols (P<0.05). The majority of higher viscosity resin composite
paste materials exhibited similar DC regardless of curing protocol. However, a significant
decrease in DC for specimens cured at 3000 mW/cm2 for 6 s compared with 400
mW/cm2 for 45 s was observed for the flowable materials, Grandio (41 0.36 and 62
1.15 %, respectively) and Venus (44 0.44 and 67 0.44 %, respectively). Conversely,
other flowable materials exhibited little or no significant differences between curing
modes. Generally, flowables showed higher DC than their counterpart, except at high
irradiance for those materials were reciprocity failed. The validity of exposure reciprocity
law and final DC depends on several factors, among which resin viscosity and filler
content were important. Information on material composition and appropriate radiation
sources by manufacturers may assist practitioners with the selection of appropriate curing
protocols for specific material / light curing unit combinations which may reduce the
incidence of under-cured restorations and the clinical impact thereof.
* Hadis M, Leprince JG, Leloup G, Devaux J, Shortall AC, Palin WM. High irradiance curing and
anomalies of exposure reciprocity law in resin-based materials. Submitted to Journal of Dentistry.
67
2.1.2 Introduction
The placement of multi-increment resin composite restorations is time consuming
and there exists a significant demand for reducing cure time to minimize chairside
procedure and its potential financial implication (Christensen, 2000). Therefore, the use
of high power curing light sources is commonplace since they play a crucial role in
polymerization efficiency. Some reduction in curing time can be achieved by optimizing
the spectral overlap between the curing unit and the photoinitiator to increase the
efficiency of photon absorption, which has been improved in the case of camphorquinone
initiated materials by the development of blue gallium nitride LED technology (Krämer
et al., 2008; Jiménez-Planas et al., 2008; Santini, 2010). The general trend amongst
curing unit manufacturers has been to produce lights with increased irradiance with the
presumption that curing time can be reduced proportionally. This is primarily based on
the assumption that the degree of conversion and mechanical properties of photoactive
materials are dependent upon the total energy of the irradiation, i.e. radiant exposure (RE,
J/cm2), the product of irradiance (I, mW/cm
2) and irradiation time (t, s).
For photo-active dental materials, the total energy principle promotes the common
assumption that varying combinations of curing irradiance and exposure time provide
similar material properties at constant radiant exposure. This is the principle known as the
“exposure reciprocity law” and holds quite well in certain cases with regards to degree of
conversion (Halvorson et al., 2002; Emami and Söderholm, 2003), modulus (Sakaguchi
and Ferracance, 2001) and hardness (Price et al., 2004). Other studies have reported that
although radiant exposure plays an important role, irradiance and time independently
influence polymer chain length, extent of crosslinking and mechanical properties, and
consequently exposure reciprocity does not hold under all conditions (Musanje and
Darvell, 2003; Peutzfeldt and Asmussen, 2005; Asmussen and Peutzfeldt, 2005; Feng and
Suh, 2007; Dewaele et al., 2009).
The kinetics of polymerisation is complex and is dependent upon several factors
including monomer composition (Feng and Suh, 2007), photoinitiator chemistry (Cook ,
1992; Emami and Söderholm, 2005), filler content and irradiation protocol (Asmussen
and Peutzfeldt, 2005; Feng and Suh, 2007). For example, the investigation by Musanje
68
and Darvell (2003) on highly filled commercial materials highlighted the importance of
particular composition and reactivity of different commercial products. They tested four
commercial products at different combinations of irradiance and time and examined
flexural strength modulus and total energy required for failure and reported that out of the
four tested materials only one satisfied the exposure reciprocity law for all the properties
considered (Musanje and Darvell, 2003). A recent study by Feng & Suh (2009) using a
plasma-arc and a halogen curing unit suggested that some RBCs and adhesives exhibit
inferior cure using short exposure times at high irradiance (Feng et al., 2009). The same
group also highlighted the importance of resin viscosity on degree of conversion and the
validity of the exposure reciprocity law (Feng and Suh, 2007). Other studies have also
highlighted the inferior properties of lower viscosity systems (dentin bonding adhesives)
compared to higher viscosity resin composites when using high power light curing units
compared to other lights (D‟alphino et al., 2007).
Clinically, the impact of viscosity might have important consequences on the extent
of cure of light-cured materials in dental practice. It is problematic when commercial
materials are used where exact compositions remain unknown. Notably, commercial
flowable materials can either be produced by reducing the filler content or increasing the
diluent monomer, either of which may affect the setting reaction and final polymer
conversion for high intensity curing protocols. As a result, this work aims to compare the
efficiency of different curing protocols in terms of degree of conversion in flowable
composite resin materials and their highly filled counterparts by testing two hypotheses:
i) If exposure reciprocity law is upheld for the „parent‟ restorative composite
(ie. similar degree of conversion regardless of curing protocol) then it will
also hold for its counterpart lower viscosity, „flowable‟.
ii) An increase in the filler content will result in a decrease in the degree of
conversion regardless of curing mode.
69
2.1.3 Materials and Methods
Five commercial resin composite materials (Venus; Heraeus Kulzer, Synergy D6;
Coltene, Premise; Kerr, Grandio; Voco and Gradia; GC Corp) and their counterpart
flowable versions in the A3 shade were tested for their compatibility with exposure
reciprocity law. Table 2.1.1 describes the commercial materials and their resin matrix
constituents. Specimens were cured with a halogen Swiss Master Light (EMS,
Switzerland; 11 mm diameter light guide) chosen for its capability to provide a range of
irradiance outputs and exposure times. Spectral emission was measured using a UV-Vis
spectrometer (USB4000, Ocean Optics) calibrated with a deuterium tungsten light source
(Mikropack DH2000-CAL, Ocean Optics, Dunedin, USA) with known spectral output in
the UV-Vis and NIR range in accordance to NIST standards. This allowed absolute
measurements of irradiance for the light curing unit at different irradiances. Reflective
neutral density filters (Thorlabs, UK) were stacked to control the output of the high
power curing light which produced a 6-fold reduction in irradiance over the whole
spectrum during absolute irradiance measurements. Five different curing protocols giving
a total of 18 J/cm2 of energy were applied to compare the applicability of exposure
reciprocity law; 400 mW/cm2 for 45 s was chosen as the reference protocol and compared
to protocols of the same radiant exposure (18 J/cm2): 900 mW/cm
2 for 20 s, 1500
mW/cm2 for 12 s, 2000 mW/cm
2 for 9 s and 3000 mW/cm
2 for 6 s. The irradiance values
were based on the in-built radiometer of the curing-unit and verified by the spectrometer.
Real time measurement of degree of conversion (DC) and rate of polymerization ( Rp)
were measured using a method developed by Stansbury and Dickens by which a Fourier
Transform near infrared Spectrometer (FT-NIRS; Figure 2.1.1) continuously monitors
(integration time = 0.85 s) the decompsoition of the -CH2 peak at 6164 cm-1
(Stansbury
and Dickens, 2001). Curing kinetics of the RBC samples held in a 12 x 1.4 mm
cylindrical white Teflon mould placed on a glass slide and covered by a thin glass cover
slip (n=3) were measured for 190 s. Although DC evolves for up-to 24 h post-irradiation
(Truffier-Boutry et al., 2006)., the major part of polymerization occurs during light
activation. For that reason, DC at 180 s after the start of measurement was chosen for
comparison and will be referred to as DCMax .
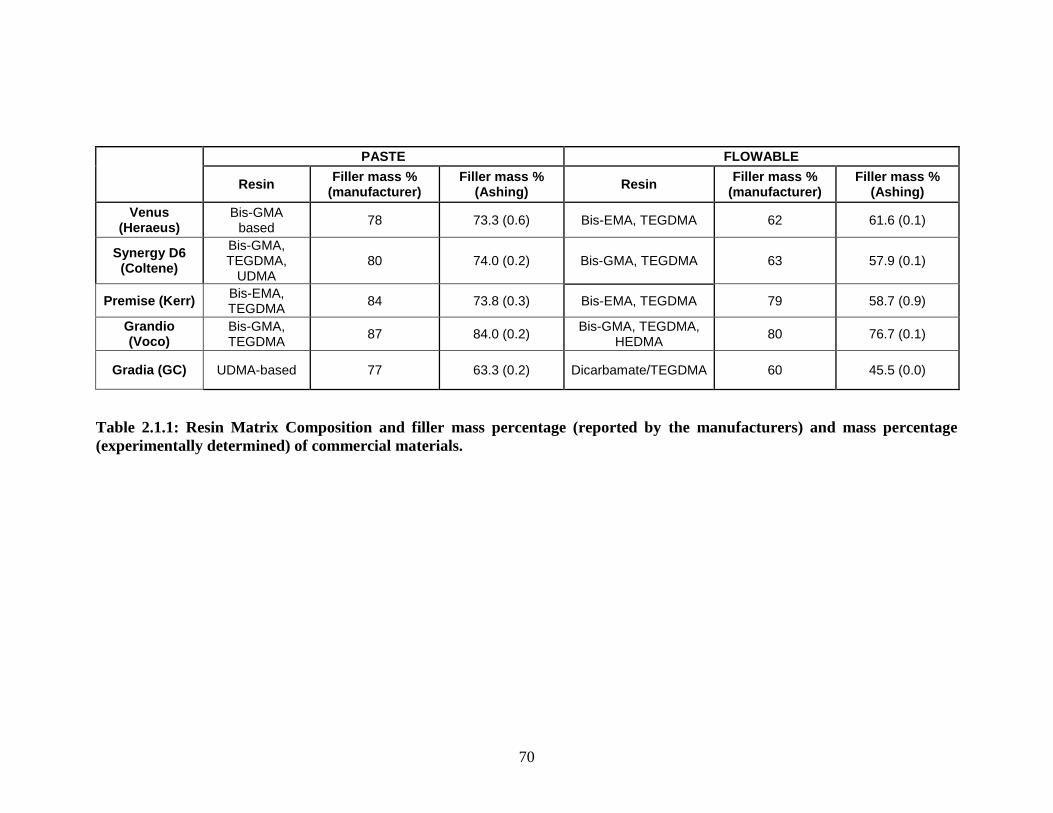
70
PASTE FLOWABLE
Resin Filler mass %
(manufacturer) Filler mass %
(Ashing) Resin
Filler mass % (manufacturer)
Filler mass % (Ashing)
Venus (Heraeus)
Bis-GMA based
78 73.3 (0.6) Bis-EMA, TEGDMA 62 61.6 (0.1)
Synergy D6 (Coltene)
Bis-GMA, TEGDMA,
UDMA 80 74.0 (0.2) Bis-GMA, TEGDMA 63 57.9 (0.1)
Premise (Kerr) Bis-EMA, TEGDMA
84 73.8 (0.3) Bis-EMA, TEGDMA 79 58.7 (0.9)
Grandio (Voco)
Bis-GMA, TEGDMA
87 84.0 (0.2) Bis-GMA, TEGDMA,
HEDMA 80 76.7 (0.1)
Gradia (GC) UDMA-based 77 63.3 (0.2) Dicarbamate/TEGDMA 60 45.5 (0.0)
Table 2.1.1: Resin Matrix Composition and filler mass percentage (reported by the manufacturers) and mass percentage
(experimentally determined) of commercial materials.
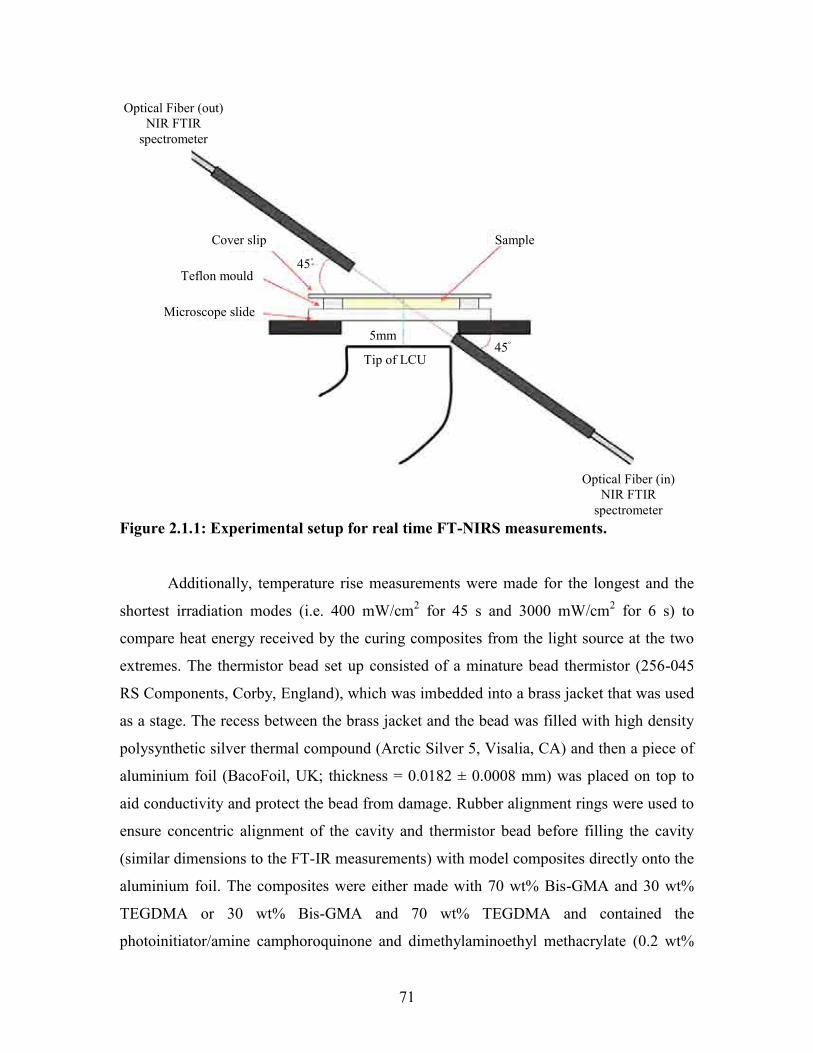
71
Figure 2.1.1: Experimental setup for real time FT-NIRS measurements.
Additionally, temperature rise measurements were made for the longest and the
shortest irradiation modes (i.e. 400 mW/cm2 for 45 s and 3000 mW/cm2 for 6 s) to
compare heat energy received by the curing composites from the light source at the two
extremes. The thermistor bead set up consisted of a minature bead thermistor (256-045
RS Components, Corby, England), which was imbedded into a brass jacket that was used
as a stage. The recess between the brass jacket and the bead was filled with high density
polysynthetic silver thermal compound (Arctic Silver 5, Visalia, CA) and then a piece of
aluminium foil (BacoFoil, UK; thickness = 0.0182 ± 0.0008 mm) was placed on top to
aid conductivity and protect the bead from damage. Rubber alignment rings were used to
ensure concentric alignment of the cavity and thermistor bead before filling the cavity
(similar dimensions to the FT-IR measurements) with model composites directly onto the
aluminium foil. The composites were either made with 70 wt% Bis-GMA and 30 wt%
TEGDMA or 30 wt% Bis-GMA and 70 wt% TEGDMA and contained the
photoinitiator/amine camphoroquinone and dimethylaminoethyl methacrylate (0.2 wt%
Optical Fiber (in) NIR FTIR
spectrometer
SampleCover slip
Teflon mould
Microscope slide
Optical Fiber (out) NIR FTIR
spectrometer
5mm
45◦
45◦
Tip of LCU
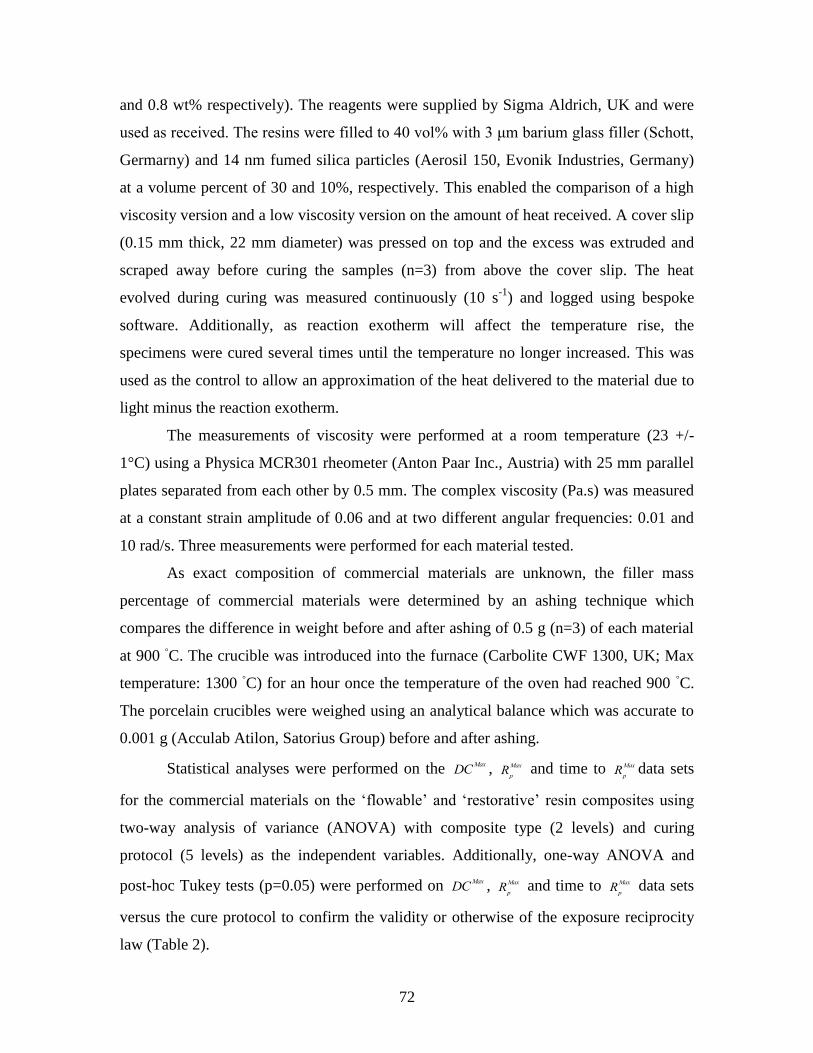
72
and 0.8 wt% respectively). The reagents were supplied by Sigma Aldrich, UK and were
used as received. The resins were filled to 40 vol% with 3 μm barium glass filler (Schott,
Germarny) and 14 nm fumed silica particles (Aerosil 150, Evonik Industries, Germany)
at a volume percent of 30 and 10%, respectively. This enabled the comparison of a high
viscosity version and a low viscosity version on the amount of heat received. A cover slip
(0.15 mm thick, 22 mm diameter) was pressed on top and the excess was extruded and
scraped away before curing the samples (n=3) from above the cover slip. The heat
evolved during curing was measured continuously (10 s-1
) and logged using bespoke
software. Additionally, as reaction exotherm will affect the temperature rise, the
specimens were cured several times until the temperature no longer increased. This was
used as the control to allow an approximation of the heat delivered to the material due to
light minus the reaction exotherm.
The measurements of viscosity were performed at a room temperature (23 +/-
1°C) using a Physica MCR301 rheometer (Anton Paar Inc., Austria) with 25 mm parallel
plates separated from each other by 0.5 mm. The complex viscosity (Pa.s) was measured
at a constant strain amplitude of 0.06 and at two different angular frequencies: 0.01 and
10 rad/s. Three measurements were performed for each material tested.
As exact composition of commercial materials are unknown, the filler mass
percentage of commercial materials were determined by an ashing technique which
compares the difference in weight before and after ashing of 0.5 g (n=3) of each material
at 900 ◦C. The crucible was introduced into the furnace (Carbolite CWF 1300, UK; Max
temperature: 1300 ◦C) for an hour once the temperature of the oven had reached 900
◦C.
The porcelain crucibles were weighed using an analytical balance which was accurate to
0.001 g (Acculab Atilon, Satorius Group) before and after ashing.
Statistical analyses were performed on the DCMax , Rp
Max and time to Rp
Max data sets
for the commercial materials on the „flowable‟ and „restorative‟ resin composites using
two-way analysis of variance (ANOVA) with composite type (2 levels) and curing
protocol (5 levels) as the independent variables. Additionally, one-way ANOVA and
post-hoc Tukey tests (p=0.05) were performed on DCMax , Rp
Max and time to Rp
Max data sets
versus the cure protocol to confirm the validity or otherwise of the exposure reciprocity
law (Table 2).
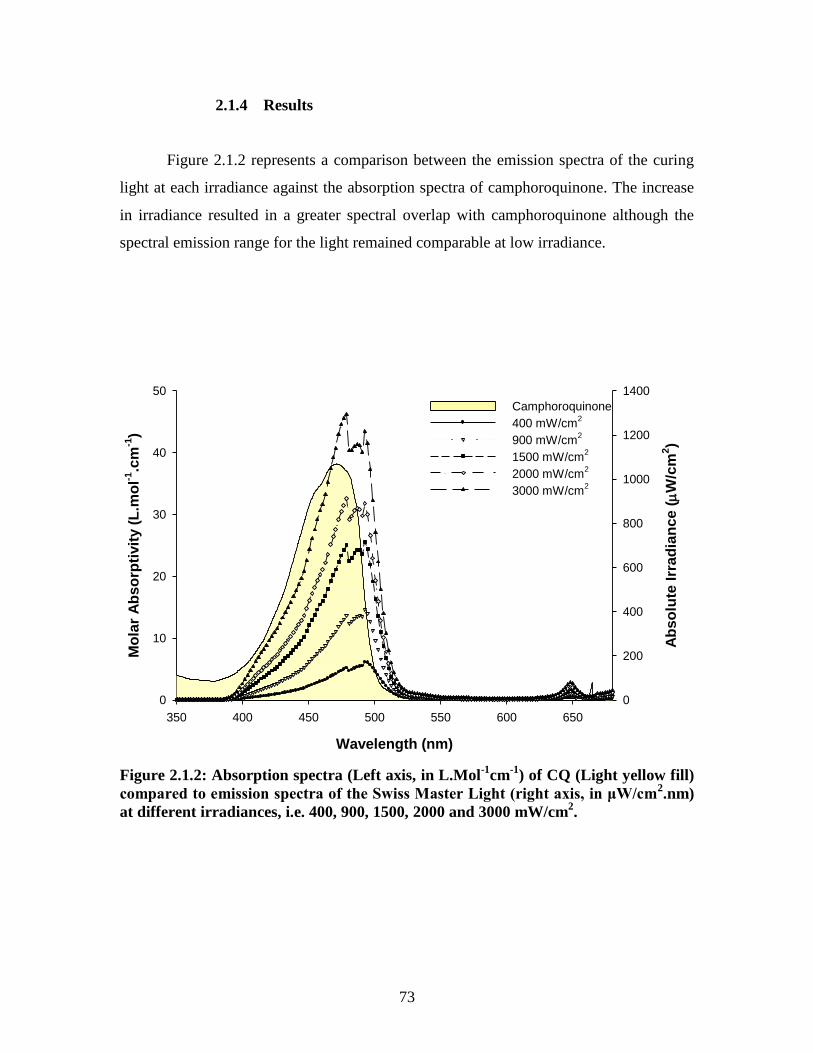
73
2.1.4 Results
Figure 2.1.2 represents a comparison between the emission spectra of the curing
light at each irradiance against the absorption spectra of camphoroquinone. The increase
in irradiance resulted in a greater spectral overlap with camphoroquinone although the
spectral emission range for the light remained comparable at low irradiance.
Wavelength (nm)
350 400 450 500 550 600 650
Mo
lar
Ab
so
rpti
vit
y (
L.m
ol-1
.cm
-1)
0
10
20
30
40
50
Ab
so
lute
Irr
ad
ian
ce
(
W/c
m2)
0
200
400
600
800
1000
1200
1400
Camphoroquinone
400 mW/cm2
900 mW/cm2
1500 mW/cm2
2000 mW/cm2
3000 mW/cm2
Figure 2.1.2: Absorption spectra (Left axis, in L.Mol-1
cm-1
) of CQ (Light yellow fill)
compared to emission spectra of the Swiss Master Light (right axis, in μW/cm2.nm)
at different irradiances, i.e. 400, 900, 1500, 2000 and 3000 mW/cm2.
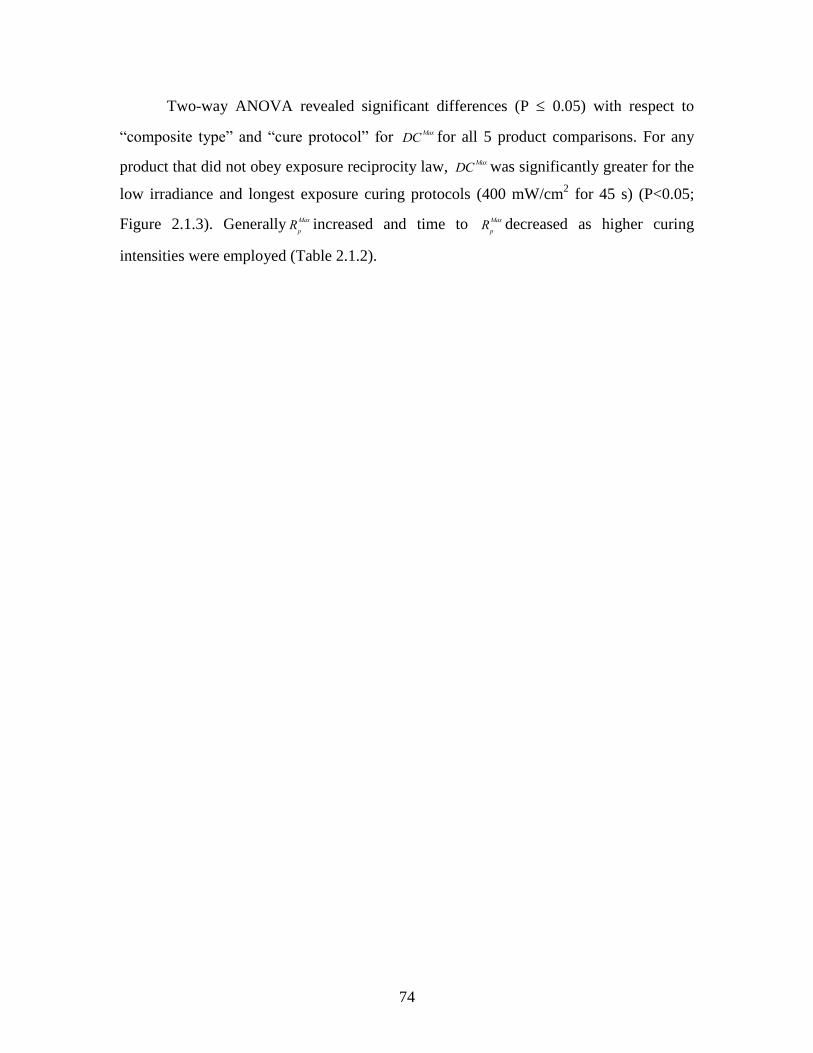
74
Two-way ANOVA revealed significant differences (P 0.05) with respect to
“composite type” and “cure protocol” for DCMax for all 5 product comparisons. For any
product that did not obey exposure reciprocity law, DCMax was significantly greater for the
low irradiance and longest exposure curing protocols (400 mW/cm2 for 45 s) (P<0.05;
Figure 2.1.3). Generally Rp
Max increased and time to Rp
Max decreased as higher curing
intensities were employed (Table 2.1.2).
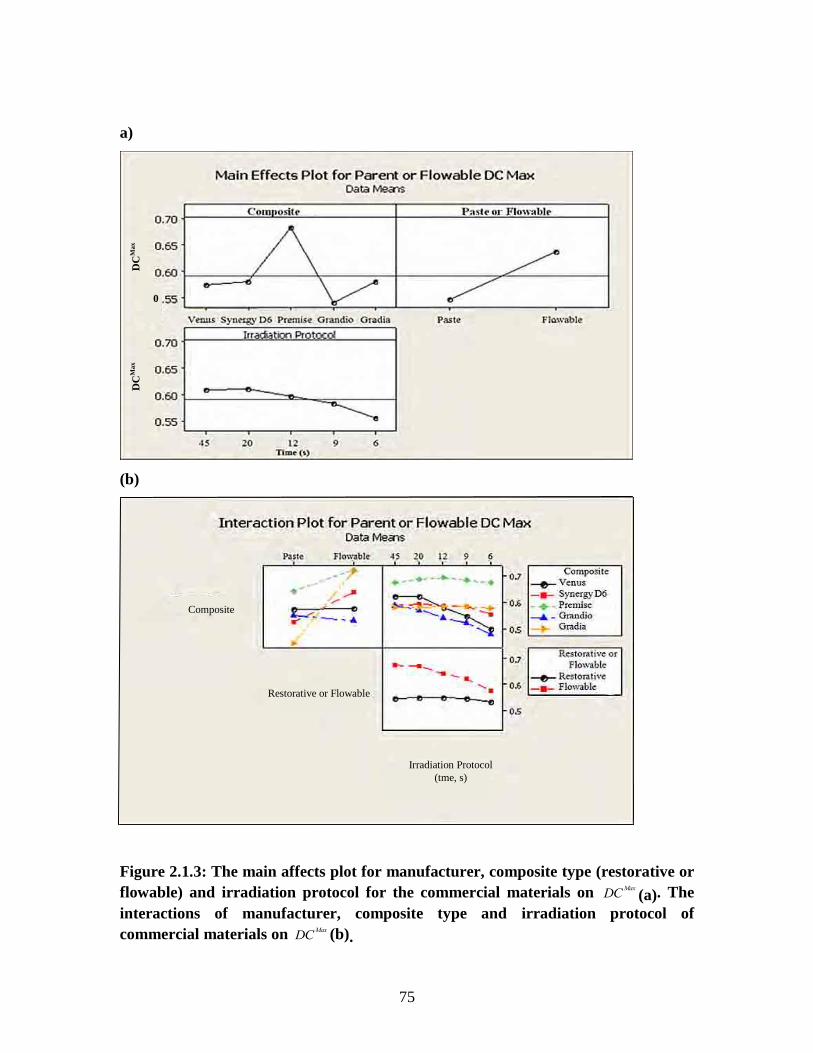
75
a)
(b)
Figure 2.1.3: The main affects plot for manufacturer, composite type (restorative or
flowable) and irradiation protocol for the commercial materials on DCMax
(a). The
interactions of manufacturer, composite type and irradiation protocol of
commercial materials on DCMax
(b).
Irradiation Protocol
(tme, s)
Restorative or Flowable
Composite
0
DC
Ma
x
DC
Ma
x
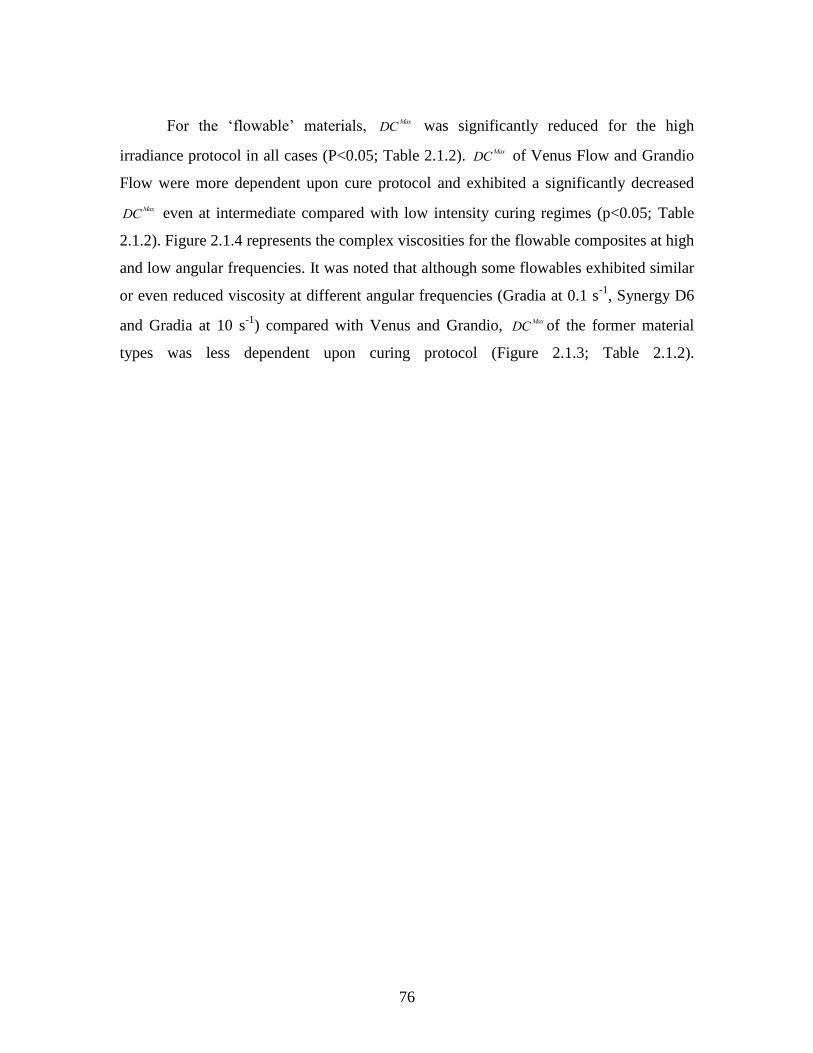
76
For the „flowable‟ materials, DCMax
was significantly reduced for the high
irradiance protocol in all cases (P<0.05; Table 2.1.2). DCMax
of Venus Flow and Grandio
Flow were more dependent upon cure protocol and exhibited a significantly decreased
DCMax even at intermediate compared with low intensity curing regimes (p<0.05; Table
2.1.2). Figure 2.1.4 represents the complex viscosities for the flowable composites at high
and low angular frequencies. It was noted that although some flowables exhibited similar
or even reduced viscosity at different angular frequencies (Gradia at 0.1 s-1
, Synergy D6
and Gradia at 10 s-1
) compared with Venus and Grandio, DCMax of the former material
types was less dependent upon curing protocol (Figure 2.1.3; Table 2.1.2).
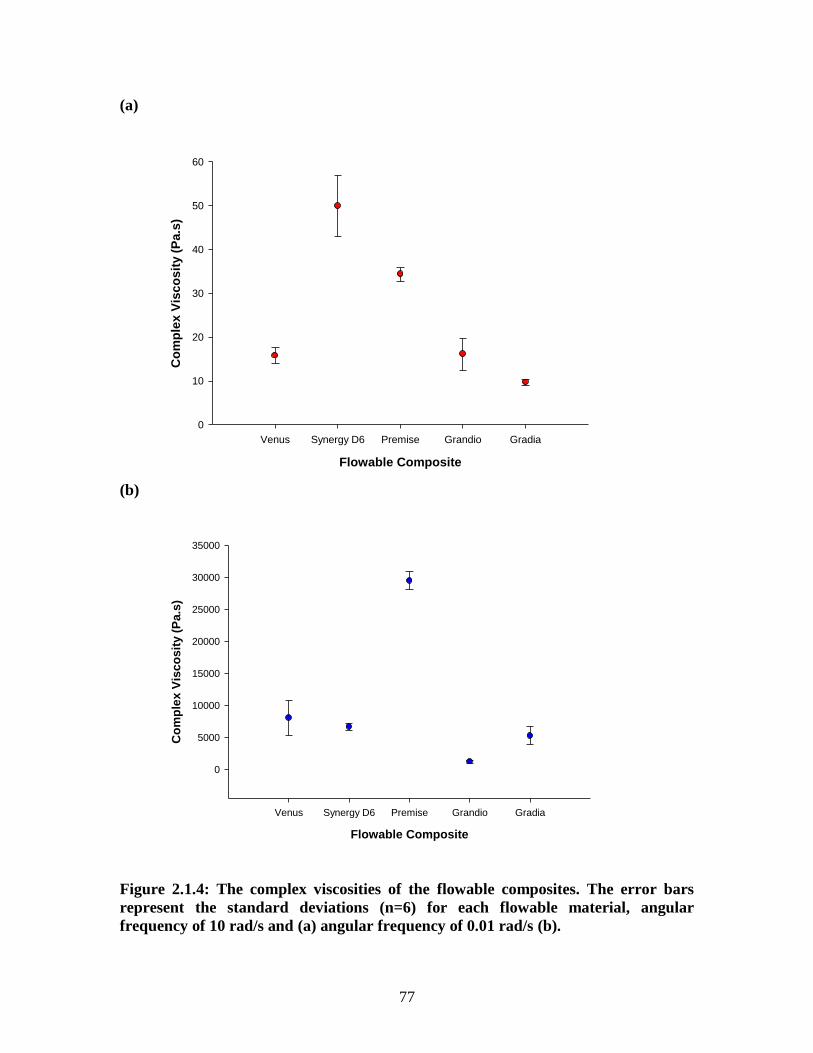
77
(a)
Flowable Composite
Venus Synergy D6 Premise Grandio Gradia
Co
mp
lex V
isc
os
ity (
Pa
.s)
0
10
20
30
40
50
60
(b)
Flowable Composite
Venus Synergy D6 Premise Grandio Gradia
Co
mp
lex V
isc
os
ity (
Pa.s
)
0
5000
10000
15000
20000
25000
30000
35000
Figure 2.1.4: The complex viscosities of the flowable composites. The error bars
represent the standard deviations (n=6) for each flowable material, angular
frequency of 10 rad/s and (a) angular frequency of 0.01 rad/s (b).
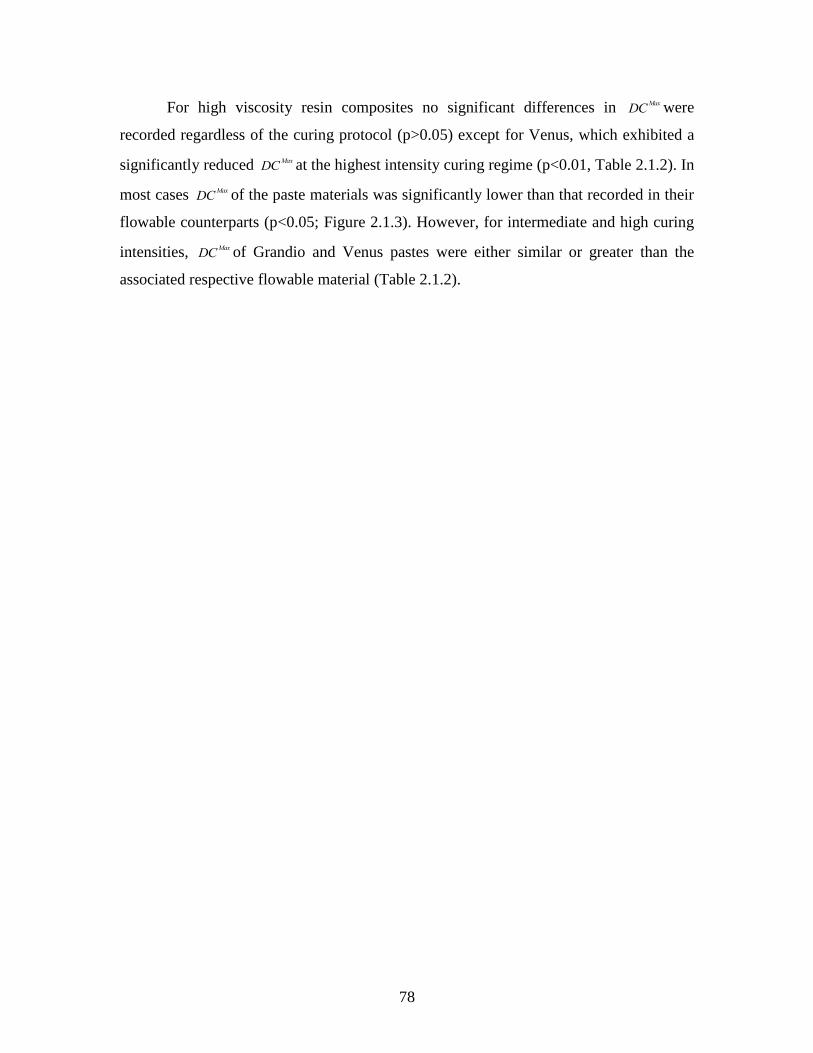
78
For high viscosity resin composites no significant differences in DCMax were
recorded regardless of the curing protocol (p>0.05) except for Venus, which exhibited a
significantly reduced DCMax at the highest intensity curing regime (p<0.01, Table 2.1.2). In
most cases DCMax of the paste materials was significantly lower than that recorded in their
flowable counterparts (p<0.05; Figure 2.1.3). However, for intermediate and high curing
intensities, DCMax of Grandio and Venus pastes were either similar or greater than the
associated respective flowable material (Table 2.1.2).
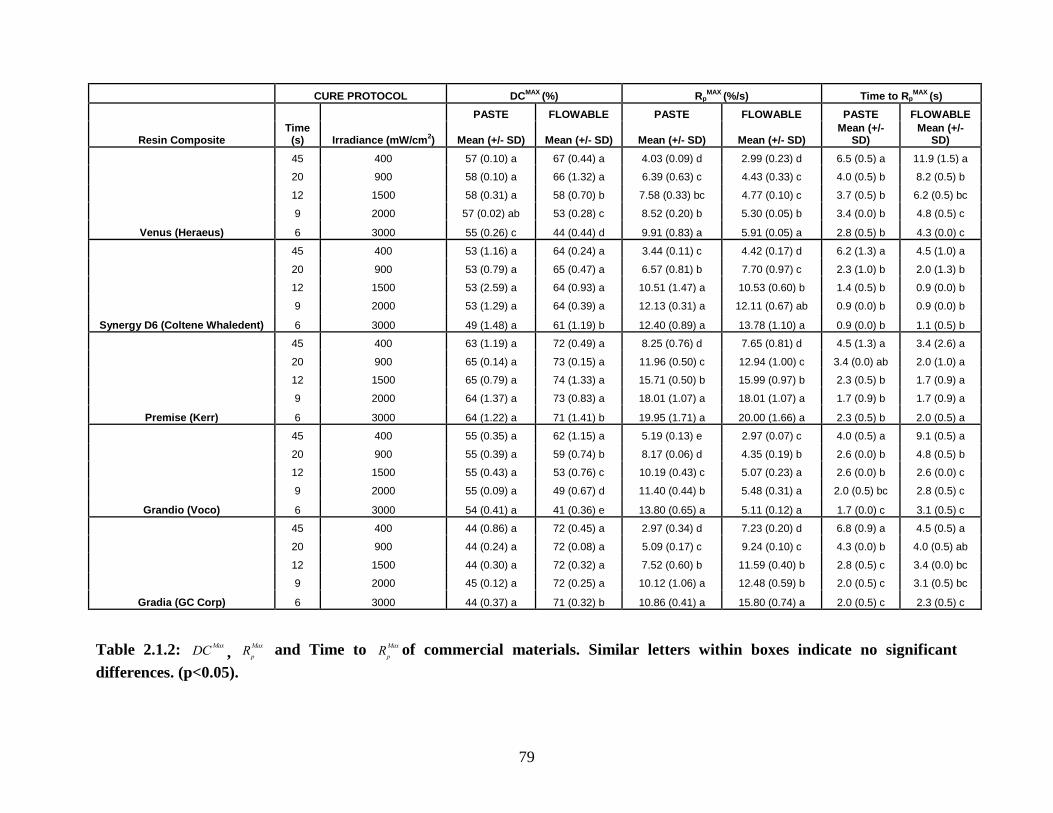
79
Table 2.1.2: DCMax
, RpMax and Time to R
p
Max of commercial materials. Similar letters within boxes indicate no significant
differences. (p<0.05).
CURE PROTOCOL DCMAX
(%) RpMAX
(%/s) Time to RpMAX
(s)
Resin Composite Time
(s) Irradiance (mW/cm2)
PASTE FLOWABLE PASTE FLOWABLE PASTE FLOWABLE
Mean (+/- SD) Mean (+/- SD) Mean (+/- SD) Mean (+/- SD) Mean (+/-
SD) Mean (+/-
SD)
Venus (Heraeus)
45 400 57 (0.10) a 67 (0.44) a 4.03 (0.09) d 2.99 (0.23) d 6.5 (0.5) a 11.9 (1.5) a
20 900 58 (0.10) a 66 (1.32) a 6.39 (0.63) c 4.43 (0.33) c 4.0 (0.5) b 8.2 (0.5) b
12 1500 58 (0.31) a 58 (0.70) b 7.58 (0.33) bc 4.77 (0.10) c 3.7 (0.5) b 6.2 (0.5) bc
9 2000 57 (0.02) ab 53 (0.28) c 8.52 (0.20) b 5.30 (0.05) b 3.4 (0.0) b 4.8 (0.5) c
6 3000 55 (0.26) c 44 (0.44) d 9.91 (0.83) a 5.91 (0.05) a 2.8 (0.5) b 4.3 (0.0) c
Synergy D6 (Coltene Whaledent)
45 400 53 (1.16) a 64 (0.24) a 3.44 (0.11) c 4.42 (0.17) d 6.2 (1.3) a 4.5 (1.0) a
20 900 53 (0.79) a 65 (0.47) a 6.57 (0.81) b 7.70 (0.97) c 2.3 (1.0) b 2.0 (1.3) b
12 1500 53 (2.59) a 64 (0.93) a 10.51 (1.47) a 10.53 (0.60) b 1.4 (0.5) b 0.9 (0.0) b
9 2000 53 (1.29) a 64 (0.39) a 12.13 (0.31) a 12.11 (0.67) ab 0.9 (0.0) b 0.9 (0.0) b
6 3000 49 (1.48) a 61 (1.19) b 12.40 (0.89) a 13.78 (1.10) a 0.9 (0.0) b 1.1 (0.5) b
Premise (Kerr)
45 400 63 (1.19) a 72 (0.49) a 8.25 (0.76) d 7.65 (0.81) d 4.5 (1.3) a 3.4 (2.6) a
20 900 65 (0.14) a 73 (0.15) a 11.96 (0.50) c 12.94 (1.00) c 3.4 (0.0) ab 2.0 (1.0) a
12 1500 65 (0.79) a 74 (1.33) a 15.71 (0.50) b 15.99 (0.97) b 2.3 (0.5) b 1.7 (0.9) a
9 2000 64 (1.37) a 73 (0.83) a 18.01 (1.07) a 18.01 (1.07) a 1.7 (0.9) b 1.7 (0.9) a
6 3000 64 (1.22) a 71 (1.41) b 19.95 (1.71) a 20.00 (1.66) a 2.3 (0.5) b 2.0 (0.5) a
Grandio (Voco)
45 400 55 (0.35) a 62 (1.15) a 5.19 (0.13) e 2.97 (0.07) c 4.0 (0.5) a 9.1 (0.5) a
20 900 55 (0.39) a 59 (0.74) b 8.17 (0.06) d 4.35 (0.19) b 2.6 (0.0) b 4.8 (0.5) b
12 1500 55 (0.43) a 53 (0.76) c 10.19 (0.43) c 5.07 (0.23) a 2.6 (0.0) b 2.6 (0.0) c
9 2000 55 (0.09) a 49 (0.67) d 11.40 (0.44) b 5.48 (0.31) a 2.0 (0.5) bc 2.8 (0.5) c
6 3000 54 (0.41) a 41 (0.36) e 13.80 (0.65) a 5.11 (0.12) a 1.7 (0.0) c 3.1 (0.5) c
Gradia (GC Corp)
45 400 44 (0.86) a 72 (0.45) a 2.97 (0.34) d 7.23 (0.20) d 6.8 (0.9) a 4.5 (0.5) a
20 900 44 (0.24) a 72 (0.08) a 5.09 (0.17) c 9.24 (0.10) c 4.3 (0.0) b 4.0 (0.5) ab
12 1500 44 (0.30) a 72 (0.32) a 7.52 (0.60) b 11.59 (0.40) b 2.8 (0.5) c 3.4 (0.0) bc
9 2000 45 (0.12) a 72 (0.25) a 10.12 (1.06) a 12.48 (0.59) b 2.0 (0.5) c 3.1 (0.5) bc
6 3000 44 (0.37) a 71 (0.32) b 10.86 (0.41) a 15.80 (0.74) a 2.0 (0.5) c 2.3 (0.5) c
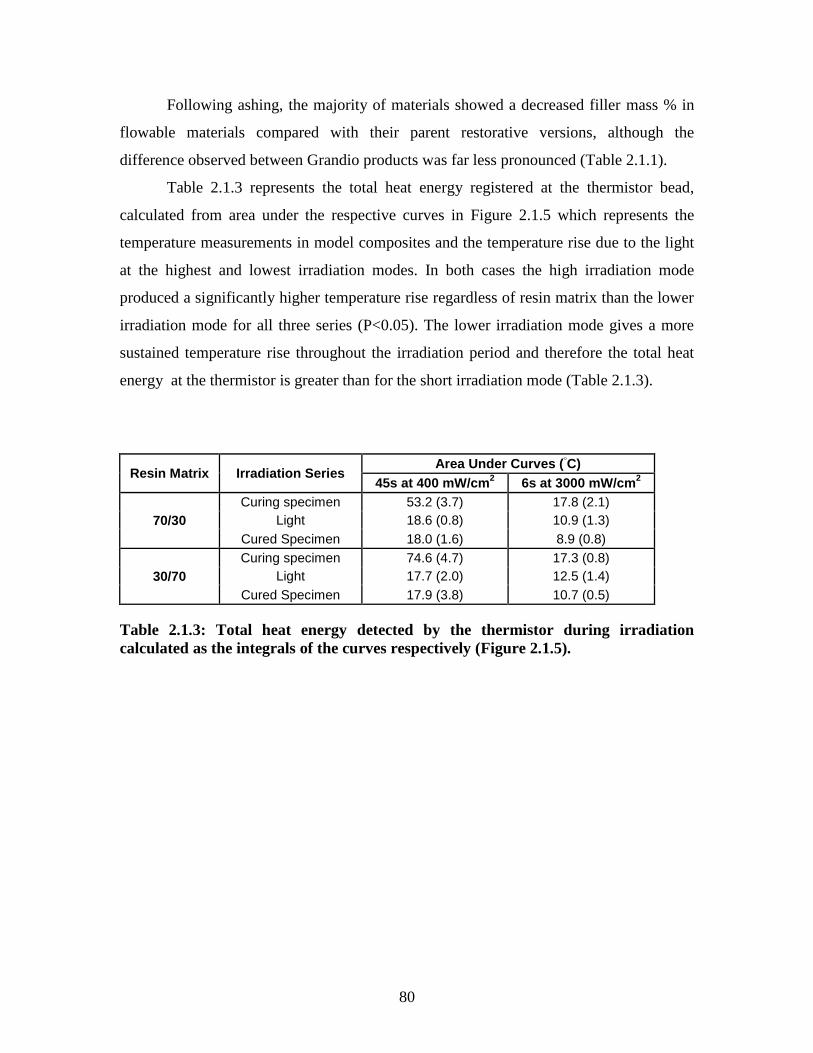
80
Following ashing, the majority of materials showed a decreased filler mass % in
flowable materials compared with their parent restorative versions, although the
difference observed between Grandio products was far less pronounced (Table 2.1.1).
Table 2.1.3 represents the total heat energy registered at the thermistor bead,
calculated from area under the respective curves in Figure 2.1.5 which represents the
temperature measurements in model composites and the temperature rise due to the light
at the highest and lowest irradiation modes. In both cases the high irradiation mode
produced a significantly higher temperature rise regardless of resin matrix than the lower
irradiation mode for all three series (P<0.05). The lower irradiation mode gives a more
sustained temperature rise throughout the irradiation period and therefore the total heat
energy at the thermistor is greater than for the short irradiation mode (Table 2.1.3).
Resin Matrix Irradiation Series Area Under Curves (
◦C)
45s at 400 mW/cm2 6s at 3000 mW/cm
2
70/30
Curing specimen 53.2 (3.7) 17.8 (2.1)
Light 18.6 (0.8) 10.9 (1.3)
Cured Specimen 18.0 (1.6) 8.9 (0.8)
30/70
Curing specimen 74.6 (4.7) 17.3 (0.8)
Light 17.7 (2.0) 12.5 (1.4)
Cured Specimen 17.9 (3.8) 10.7 (0.5)
Table 2.1.3: Total heat energy detected by the thermistor during irradiation
calculated as the integrals of the curves respectively (Figure 2.1.5).
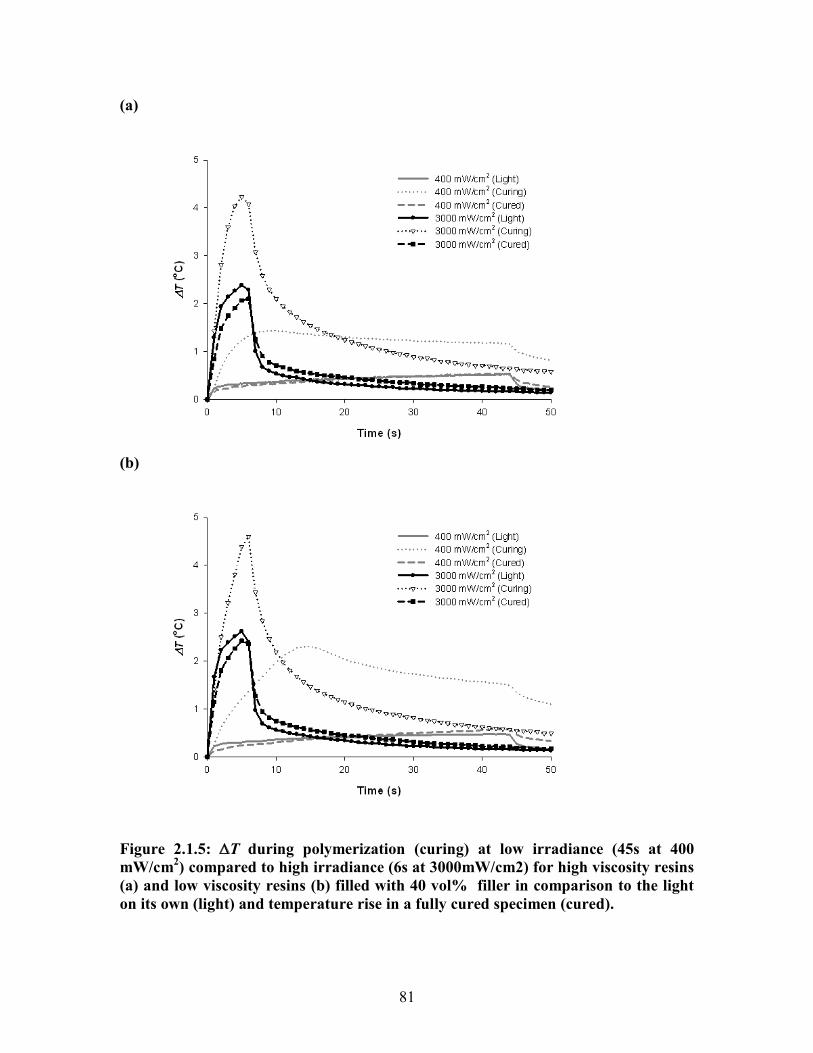
81
(a)
(b)
Figure 2.1.5: T during polymerization (curing) at low irradiance (45s at 400 mW/cm2) compared to high irradiance (6s at 3000mW/cm2) for high viscosity resins (a) and low viscosity resins (b) filled with 40 vol% filler in comparison to the light on its own (light) and temperature rise in a fully cured specimen (cured).
82
2.1.5 Discussion
The first hypothesis (if exposure reciprocity law is upheld for a paste, it will also
hold for its respective flowable material) was rejected as for all pastes reciprocity was
achieved or nearly achieved (Venus), while no such relationship was observed for the
respective flowables with much larger differences in DCMax of Grandio and Venus across
curing regimes. An interesting point to note is that flowable composites are manufactured
in different ways, i.e. some have more diluent monomer and some have less filler
percentage in comparison to their parent high viscosity versions (the effects of which will
be investigated in Section 2.2). Nonetheless, previous work has indicated that above a
specific (unfilled) resin viscosity ( 6:4, Bis-GMA/TEGDMA), exposure reciprocity law
is upheld (Feng and Suh, 2007). Viscosity of the resin matrix is known to play a
significant role in the polymerization rate, with the highest maximum rates observed for
mixtures containing 50-75 wt% Bis-GMA (Emami and Söderholm, 2003). Consequently,
it may be expected that flowables composites manufactured with 6:4, Bis-
GMA/TEGDMA or high viscosity resins may allow for reduced curing time clinically
when high irradiance protocols are used. However, when manufacturers use low viscosity
resins, it is expected that high system mobility will increases the probability of a
bimolecular (radical-radical) termination pathway during the initial stages of
polymerization resulting in a greater loss of radical growth centres by early termination.
When high irradiance protocols are applied to composites containing such resins, radical
loss is expected to be greater as a multitude of radical growth centres exist and as
termination is proportional to the squared concentration of free radicals at low conversion
(Leprince et al, 2010a). Consequently DCMax will significantly decrease compared with
similar radiant exposures achieved using a lower irradiance for longer time for
composites containing low viscosity resins. Therefore, a correlation between the
applicability of the exposure reciprocity law and the viscosity of the flowable materials
may have been expected. However, this was not the case since Gradia exhibited the
lowest viscosity (measured at 10 rad/s; Figure 2.1.4) and achieved similar DCMax for most
curing regimes whereas DCMax for the more viscous Grandio and Venus flowable materials
was clearly more dependent upon the irradiance and curing time combination (Figure
83
2.1.4 and Table 2.1.1). Although at lower angular frequency the rank order of viscosity
changed (presumably due to differences in pseudoplastic behaviour), similar effects were
seen. Here, Gradia and Synergy D6 exhibited lower viscosity compared with Venus, but
the former still obeyed the exposure reciprocity law for most cure modes (Figure 2.1.1
and Table 2.1.2). Therefore, it is evident that the impact of viscosity on composite
reactivity is more complicated than that observed for unfilled resins.
Broadly speaking, flowable resin composites can be manufactured either by
reducing the filler mass percentage or by increasing the volume of diluent resin,
maintaining a high filler load. In most cases, manufacturers do not divulge the exact
composition of commercial resin composites and typically will only report resin matrix
composition and filler percentage approximately. Material ashing may reveal useful
information regarding filler content, however such a technique is limited since the exact
percentage of organic filler types, which will decompose upon heating, are usually
unknown. Since the filler mass percentages of Grandio and Grandio Flow are close
(Table 2.1.1), it might be assumed that a higher quantity of diluent resin is used in the
formulation of the latter. At constant volume percentage of filler, partially substituting
Bis-GMA with a low molecular weight monomer (HEDMA) will serve to decrease the
viscosity of the material. Although a reduced viscosity at a constant filler load is not
apparent at first glance in the case of Venus/Venus Flow (78/62 and 73/62 mass%
reported by the manufacturer and from ashing, respectively; Table 2.1.1). Closer
examination of the resin constituents reveals substitution of the bulky Bis-GMA
monomer with a lower molecular weight monomer, Bis-EMA. Again, this may serve to
decrease resin viscosity in the „flowable‟ composite and thus reduce DCMax at high
irradiance and short irradiation times. Commercial „flowable‟ materials, which exhibited
similar DCMax
and a reciprocal relationship with respect to irradiance and time, show a
much greater reduction in filler percentage as opposed to any change in the resin matrix
components (Table 2.1.1).
In filled systems, the interaction between complex viscosity and the applicability
of exposure reciprocity law may not be directly related to bulk or macroscopic viscosity.
A first possible explanation could be that macroscopic viscosity does not reflect „local‟
viscosity of the resin matrix, as a result of inter-particulate spacing between fillers. From
84
the current results it appears that local viscosity is critical in determining polymerization
kinetics of curing photopolymer composites. However, the situation is complex since
changes in viscosity in the early stages of polymerization may differ with material
composition. The effect of changing rheology throughout cure is also an important
consideration and should be subject of further investigations. Additionally, RBC
manufacturers are increasingly using other photoinitiator(s), the type(s) or concentration
of which remain unknown to some extent. Since photoinitaitors have different absorption
characteristics, i.e. molar extinction coefficients and absorption bandwidths, their
quantum yield of conversion vary (Neumann et al., 2005; Neumann et al., 2006). As
such, the type and concentration of photoinitiator may influence the reciprocal
relationship between irradiance and exposure time, which also warrants further
investigation and is presented in Section 2.3.
The second hypothesis (that an increase of filler content results in a decrease in
degree of conversion regardless of curing protocol) must also be rejected since the
flowable versions of Venus and Grandio exhibited lower DCMax
at high irradiance than
their respective higher viscosity counterparts. For unfilled, or less filled systems
vitrification is delayed, which allows further radical propagation and increased DC is
usually observed for curing protocols that employ long exposure duration (D‟alphino et
al., 2007; Feng and Suh, 2007; Feng et al., 2009). Such an effect explains why all
flowables tested here show increased DCMax at the low irradiances for the longest cure
times (45 s at 400 mW/cm2 and 20 s at 900 mW/cm
2; Table 2.1.2). An inferior cure of
Grandio and Venus flowable compared with their counterpart paste materials at higher
intensities might be explained by the effects of a marked reduction in parent resin
viscosity as previously explained. The addition of fillers will increase the local viscosity
of the reaction medium and reduce the mobility of the propagating species and therefore
more highly filled systems are expected to approach a reciprocal relationship with respect
to irradiance and time at constant radiant exposure. This effect is supported by previous
findings, which reported a 3-fold increase in higher concentration of trapped free radicals
in the organic matrix of a filled composite than in its corresponding parent resin due to
spatial confinement within filled composites preventing bi-radical termination (Leprince
et al., 2009). The shape, size and content of filler as well as interlocking and interfacial
85
interactions between filler and the resin matrix will also affect the viscosity and mobility
of the reaction medium (Lee et al., 2006). For flowable composite materials with low
viscosity resins, the mobility restrictions due to fillers will lessen and a reduced local
viscosity will increase the probability of bi-radical termination and DC will become more
dependent upon irradiance and time (Table 2.1.2).
The effect of temperature, either from the curing unit, polymer exotherm or
insulating effects of filler inclusions should not be neglected. Absorption and scattering
of light energy within the volume of composite may cause an increase in temperature
during photopolymerisation (Panankis and Watts, 2000). The heat delivered to the
material will increase proportionally with increased irradiation time and intensity (Lloyd
et al., 1986; Hansen and Asmussen, 1993). An increase in temperature increases mobility,
not only of the radicals but also of the whole reaction environment, delays auto-
acceleration and increases the reaction rate parameters (an Arrhenius-type dependence)
thus increasing polymerization rate and final degree of conversion (Lovell et al., 2003).
The lower irradiance curing protocol (45s at 400mW/cm2) is expected to have a slower
polymerization process, which may result in a delayed liberated energy from the material
and therefore a lower temperature increase. Furthermore, it has been reported that the use
of the high irradiance mode on a Swiss Master light for a short time does not produce a
significant temperature increase when compared to a standard halogen or LED light
curing unit when activated for a longer time (Uhl et al., 2006) but this should be treated
with caution as spectral emissions are not comparable between lights and dissimilar
radiant exposures are used. Indeed, complementary temperature measurements recorded
here in model RBCs using the Swiss Master Light revealed differences in the maximum
temperature rise as well as total temperature rise between low (45s at 400mW/cm2) and
high irradiance (6s at 3000mW/cm2) curing protocols. Model composites were used as
manufacturers may use different monomers, fillers and photoinitiators, which will affect
exothermicity during polymerization. The heat measured in a fully cured sample
estimates the heating of a composite material due to the light minus the reaction
exotherm. The temperature rise was higher at high irradiance, however, a longer cure
duration at low irradiance exposes the materials to a more sustained temperature rise
resulting in a higher total energy with respect to heat (Figure 2.1.5, Table 2.1.3) and may
86
contribute to the increased DCMax of materials cured using these protocols. It must also be
underlined that the use of experimental materials (without pigments) probably
underestimates the heating due to the light because of lower light absorption.
Additionally, several limitations of the experimental procedure exist. Firstly, the
measurements were carried out under non-isothermal conditions and secondly the
protective foil and the conductive paste may have also significantly attenuated the heating
effects from the light and exotherm of the curing materials. Further work regarding the
synergistic effect of temperature (under isothermal conditions) on curing kinetics during
the application of exposure reciprocity law is required to fully elucidate this
phenomenon.
DC data should not be considered the “gold-standard” of material properties since
it is well known that irradiance and time independently influence polymer chain length
and crosslinking, which in turn may affect the mechanical properties such as flexural
strength and modulus, water sorption and cure depths (Musanje and Darvell, 2003;
Peutzfeldt and Asmussen, 2005; Asmussen and Peutzfeldt, 2005; Ferracane, 2006; Feng
and Suh, 2007; Dewaele et al., 2009). Moreover, flowable materials that are
manufactured by reducing filler content rather than those which maintain higher filler
loads and increase diluent resin concentration will exhibit differences in flexural strength,
modulus and polymerization shrinkage, which may affect their performance in situ.
2.1.6 Conclusion
The reduced viscosity of commercial flowables can be acquired in at least two
ways; either by decreasing filler load or increasing diluent monomer, which directly
affects the cure kinetics and of the effect exposure reciprocity on conversion. From this
work, it appears that the validity of the exposure reciprocity law may depend upon the
method with which “flowable” viscosity is achieved. This underlines the necessity to
adapt curing protocols according to the material filler content as well as the resin matrix
composition, which is of prime importance to clinicians. Inevitably, the design of
flowable materials may be optimized to ensure equivalent polymer conversion regardless
of curing protocols.
87
2.2 Further Anomalies of the Exposure Reciprocity Law in Model
Photoactive Resin Based Materials
2.2.1 Abstract
The aim of this section was to investigate the anomalies of exposure reciprocity in
model resin composite materials. Resins containing camphoroquinone (CQ; 0.2 wt%) and
dimethylaminoethyl methacrylate (DMAEMA, 0.8 wt%) were prepared having different
Bis-GMA/TEGDMA percentages: 70/30; 60/40; 50/50; 40/60 and 30/70 mass%,
respectively and were tested either unfilled (UF) or filled to 40 vol% (low fill, LF) or 60
vol% (high fill, HF) with silanated barium glass fillers and fumed silica. Specimens were
cured with a halogen Swiss Master Light (EMS, Switzerland) at the same radiant
exposures (18 J/cm2): 400 mW/cm
2 (reference), 900 mW/cm
2 for 20 s, 1500 mW/cm
2 for
12 s, 2000 mW/cm2 for 9 s and 3000 mW/cm
2 for 6 s. Degree of conversion (DC) was
measured by FT-NIRS in real time. For the resins and composites two way ANOVAs for
DCMax , R
p
Max and time to Rp
Max revealed significant differences (P<0.001) in all cases for each
of the two independent variables “resin type” and “cure protocol” as well as their
interactions. In the case of the UF resin, irradiation protocol was more influential (df = 4;
F = 9328) for DCMax than resin type (df = 4; F = 3455) whereas the opposite occurred with
the LF and HF counterparts. Supplementary one-way ANOVA also revealed significant
differences between curing protocols (P<0.05). Only composites made with 6:4 Bis-
GMA/TEGDMA completely obeyed reciprocity. For the resins and other composites, a
significant decrease in DC for specimens cured at 3000 mW/cm2 for 6 s compared with
the reference was observed. Generally the DC was lower for the composites cured with
the reference protocol compared to UF resin, but for the higher irradiation mode (3000
mW/cm2 for 6 s), addition of filler improved conversion. System viscosity as well as the
irradiation protocol significantly influence polymerization rate and the onset of reaction-
diffusion controlled termination, with the highest maximum rates observed for mixtures
containing high viscosity parent resins cured at high irradiance. The design and
development of new composites that allow high irradiance curing may reduce curing
time, which is desirable to both dentists and patients.
88
2.2.2 Introduction
Clinically, low viscosity materials or „flowables‟ have many uses including pit and
fissure sealants, base or liners for large restorations, routine Class I and V restorations,
small Class III restorations and restoration repairs. The reduction in curing time for such
procedures has some inherent advantages for the dental practice, i.e. increased efficiency,
as-well as the patient, i.e. comfort. The reduction in curing time has been implemented
namely by the application of the exposure reciprocity law (varying combinations of
irradiance and time) and the introduction of high powered light curing units (Peutzfeldt
and Asmussen, 2005; Feng and Suh, 2007). However, although the law is applicable in
some scenarios (Sakaguchi and Ferracane, 2001; Emami and Söderholm, 2003; Price et
al., 2004), the kinetics of polymerisation is complex and is dependent upon several
factors including monomer composition (Feng and Suh, 2007), photoinitiator chemistry
(Cook, 1992; Emami and Söderholm, 2005), filler content and irradiation protocol
(Emami and Söderholm, 2005; Dewaele et al., 2009) and as such failures in the law are
reported (Musanje and Darvell, 2003; Peutzfeldt and Asmussen, 2005; Emami and
Söderholm, 2005; Asmussen and Peutzfeldt, 2005; Dewaele et al., 2009).
Previously, it was shown that some low viscosity commercial flowable composites
do not obey reciprocity whilst others do (Section 2.1). Reciprocity failures can be
attributed to the existence of bi-radical terminations in relatively low viscosity materials.
However, from the previous section it appeared that the matter is complicated as
macroscopic viscosity does not reflect local viscosity (i.e. that of the resin). Additionally,
the importance of particular composition on reactivity was also highlighted by other
researchers using commercial products, where only one out of four products satisfied
reciprocity with regards to mechanical properties (Musanje and Darvell, 2003). Section
2.1 and a previous study have reported the inferior properties of some resins and RBCs
when cured with high irradiance/short duration cure protocols (Feng et al. 2009).
Although previous works are relevant, the conclusions remain limited by the fact that
commercial materials (with unknown specific compositions) and/or different light
sources to achieve higher intensity (creating differences in emission spectra) are used
(Musanje and Darvell, 2003; D‟alphino et al., 2007; Feng et al., 2009). Consequently, it
89
is important to fundamentally understand how certain low-viscosity flowable composites
obey exposure reciprocity law whilst others do not (Section 2.1). Therefore, this section
of the thesis is intends to investigate and obtain a better understanding of such failures
using model photoactive resins and resin based composites. Consequently, the aim of this
work is to investigate the following hypotheses:
i) For similar radiant exposure using the same light curing unit, if exposure
reciprocity law does not hold for the parent resin, then it will not hold for
the counterpart composite regardless of filler loading.
ii) An increase in the filler content will result in a decrease in the degree of
conversion regardless of curing mode.
2.2.3 Materials and Methods
Resin formulations containing the photoinitiator camphoroquinone (CQ; 0.2 wt%)
and the co-initiator, dimethylaminoethyl methacrylate (DMAEMA, 0.8 wt%) were
prepared having different Bis-GMA/TEGDMA percentages: 70/30; 60/40; 50/50; 40/60
and 30/70 mass% respectively. Reagents were supplied by Sigma Aldrich, UK and were
used as received. The resins were tested either unfilled or filled with silanated barium
glass fillers (Average particle size: 3 ± 1 µm; Schott, Germany) and fumed silica (14 nm;
Aerosil, Evonik Industries, Germany) to 30/10 vol% (Low Fill, LF), and 50/10 vol%
(High Fill, HF) respectively. Specimens were cured with a halogen Swiss Master Light
(EMS, Switzerland) chosen for its capability to provide a range of irradiance outputs
from 400 mW/cm2 to 3000 mW/cm
2 without altering the spectral emission as described
previously. The UV-Vis spectrometer (USB4000, Ocean Optics) was calibrated using a
deuterium tungsten light source (Mikropack DH2000-CAL, Ocean Optics, Dunedin,
USA) according to NIST standards, as described previously in Chapter 2.1.2. Five
different curing protocols giving a total of 18 J of energy were applied to compare the
applicability of the exposure reciprocity law, 400 mW/cm2 for 45 s was chosen as the
reference protocol and compared to protocols of the same radiant exposure (18 J/cm2):
900 mW/cm2 for 20 s, 1500 mW/cm
2 for 12 s, 2000 mW/cm
2 for 9 s and 3000 mW/cm
2
for 6 s. The irradiance values were based on the in-built radiometer of the curing-unit and
90
verified by the spectrometer.
The degree of conversion was measured throughout cure using a method
developed by Stansbury and Dickens (2001) where a Fourier Transform Infra-red
spectrometer is used to continuously measure - CH2 peak (6164 cm-1
). The measurement
protocol was identical to the one used in Chapter 2.1.2, where curing kinetics of resins
and resin composite samples confined in a white Teflon ring mould were monitored for
180 s (n=3) (Figure 2.1.1).
Statistical analyses were performed on the DCMax , Rp
Max and time to Rp
Max data sets
for the experimental materials on the unfilled resins and the 40% and 60% filled resin
composites using two-way analysis of variance (ANOVA) with resin type (5 levels). and
curing protocol (5 levels) as the independent variables. Additionally, one-way ANOVA
and post-hoc Tukey tests (p=0.05) were performed on DCMax , Rp
Max and time to Rp
Max data
sets versus the cure protocol to confirm the validity or otherwise of the exposure
reciprocity law.
91
2.2.4 Results
Figure 2.1.2 may be used to compare the emission spectra of the five irradiation
modes used on the Swiss Master curing light against the absorption spectra of
camphoroquinone. From this it is evident that high irradiance results in a greater spectral
overlap with camphoroquinone.
Two way ANOVAs for DCMax , R
p
Max and time to Rp
Max revealed significant
differences (P < 0.001) in all cases for each of the two independent variables “resin type”
and “cure protocol” as well as their interactions. In the case of the unfilled resin series
irradiation protocol was more influential (df = 4; F = 9328) for DCMax than resin type (df =
4; F = 3455) whereas the opposite occurred with the 40% and 60% filled counterparts
(Figure 2.2.1).
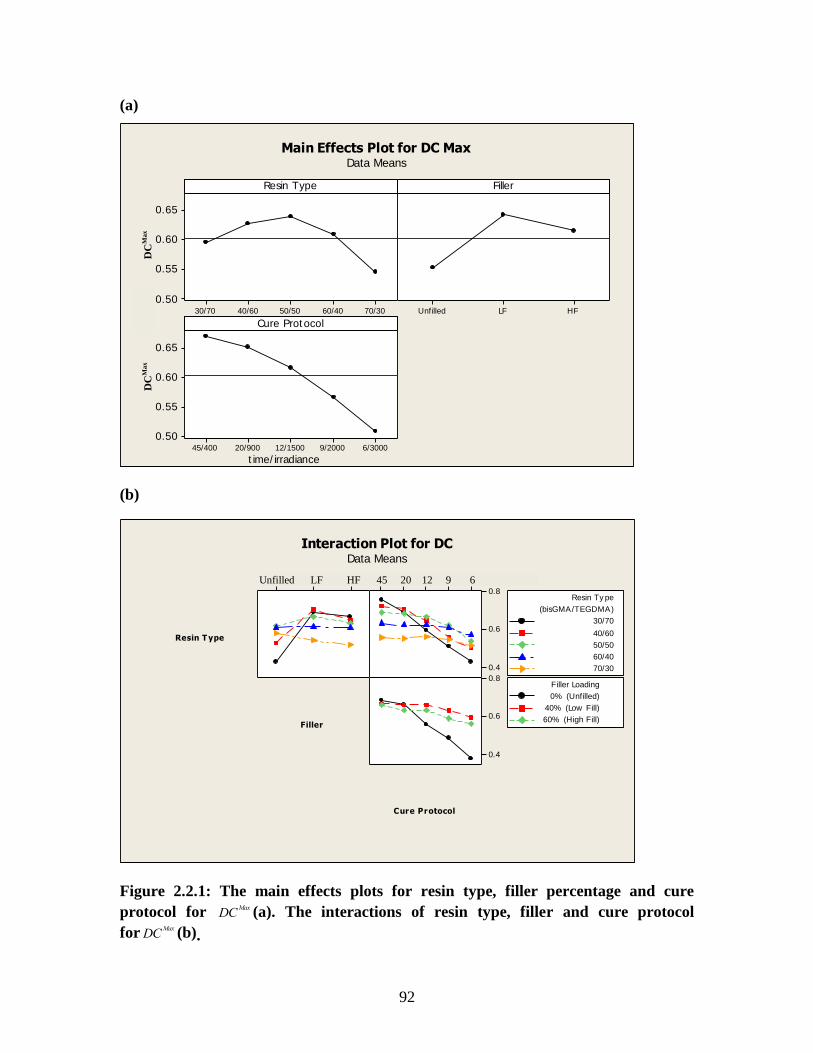
92
(a)
70/3060/4050/5040/6030/70
0.65
0.60
0.55
0.50HFLFUnfilled
6/30009/200012/150020/90045/400
0.65
0.60
0.55
0.50
Resin Type
Me
an
Filler
Cure Protocol
Main Effects Plot for DC MaxData Means
time/irradiance
(b)
321 54321
0.8
0.6
0.4
0.8
0.6
0.4
Resin T ype
Filler
Cure Protocol
30/70
40/60
50/50
60/40
70/30
(bisGMA /TEGDMA )
Resin Ty pe
0% (Unfilled)
40% (Low F ill)
60% (High F ill)
F iller Loading
Interaction Plot for DCData Means
Figure 2.2.1: The main effects plots for resin type, filler percentage and cure
protocol for DCMax
(a). The interactions of resin type, filler and cure protocol
forDCMax
(b).
45 20 12 9 6
Unfilled LF HF
DC
Ma
x
DC
Ma
x
93
Supplementary one-way ANOVAs also revealed significant differences (P<0.05)
between curing protocols (Table 2.2.1). For materials which did not obey the exposure
reciprocity law, DCMax was significantly greater for the low irradiance/longest irradiation
time (45s at 400mw/cm2) cure protocol compared to the high irradiance/shortest
irradiation time (6s at 3000mW/cm2) cure protocol (P<0.05). For composite materials,
only the high viscosity resins (>59% Bis-GMA) completely obeyed the exposure
reciprocity law and showed no significant differences between cure protocols (P>0.05)
(Table 2.2.1). Rp
Max was significantly greater and time to Rp
Max was significantly lower for
the high irradiance/short irradiation time (6s at 3000mW/cm2) cure protocol (P<0.05)
compared to the other protocols for all materials regardless of whether the exposure
reciprocity law was obeyed.
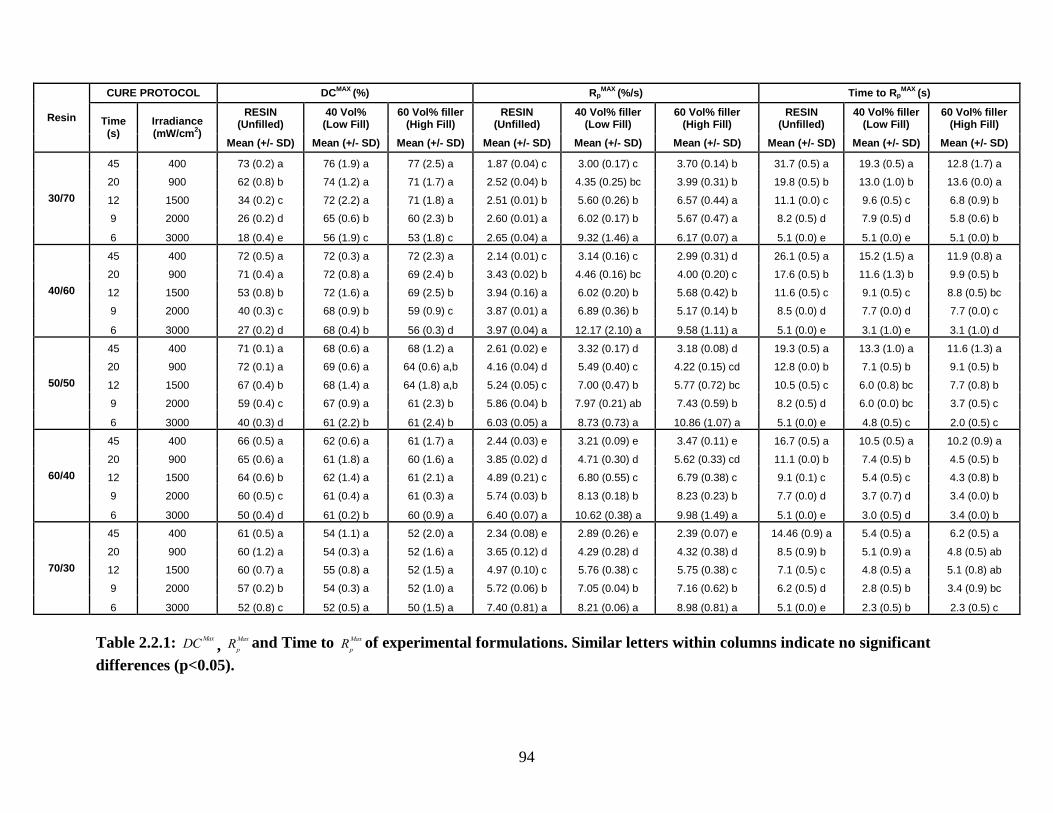
94
Table 2.2.1: DCMax
, RpMax and Time to R
p
Max of experimental formulations. Similar letters within columns indicate no significant
differences (p<0.05).
Resin
CURE PROTOCOL DCMAX
(%) RpMAX
(%/s) Time to RpMAX
(s)
Time (s)
Irradiance (mW/cm
2)
RESIN (Unfilled)
40 Vol% (Low Fill)
60 Vol% filler (High Fill)
RESIN (Unfilled)
40 Vol% filler (Low Fill)
60 Vol% filler (High Fill)
RESIN (Unfilled)
40 Vol% filler (Low Fill)
60 Vol% filler (High Fill)
Mean (+/- SD) Mean (+/- SD) Mean (+/- SD) Mean (+/- SD) Mean (+/- SD) Mean (+/- SD) Mean (+/- SD) Mean (+/- SD) Mean (+/- SD)
30/70
45 400 73 (0.2) a 76 (1.9) a 77 (2.5) a 1.87 (0.04) c 3.00 (0.17) c 3.70 (0.14) b 31.7 (0.5) a 19.3 (0.5) a 12.8 (1.7) a
20 900 62 (0.8) b 74 (1.2) a 71 (1.7) a 2.52 (0.04) b 4.35 (0.25) bc 3.99 (0.31) b 19.8 (0.5) b 13.0 (1.0) b 13.6 (0.0) a
12 1500 34 (0.2) c 72 (2.2) a 71 (1.8) a 2.51 (0.01) b 5.60 (0.26) b 6.57 (0.44) a 11.1 (0.0) c 9.6 (0.5) c 6.8 (0.9) b
9 2000 26 (0.2) d 65 (0.6) b 60 (2.3) b 2.60 (0.01) a 6.02 (0.17) b 5.67 (0.47) a 8.2 (0.5) d 7.9 (0.5) d 5.8 (0.6) b
6 3000 18 (0.4) e 56 (1.9) c 53 (1.8) c 2.65 (0.04) a 9.32 (1.46) a 6.17 (0.07) a 5.1 (0.0) e 5.1 (0.0) e 5.1 (0.0) b
40/60
45 400 72 (0.5) a 72 (0.3) a 72 (2.3) a 2.14 (0.01) c 3.14 (0.16) c 2.99 (0.31) d 26.1 (0.5) a 15.2 (1.5) a 11.9 (0.8) a
20 900 71 (0.4) a 72 (0.8) a 69 (2.4) b 3.43 (0.02) b 4.46 (0.16) bc 4.00 (0.20) c 17.6 (0.5) b 11.6 (1.3) b 9.9 (0.5) b
12 1500 53 (0.8) b 72 (1.6) a 69 (2.5) b 3.94 (0.16) a 6.02 (0.20) b 5.68 (0.42) b 11.6 (0.5) c 9.1 (0.5) c 8.8 (0.5) bc
9 2000 40 (0.3) c 68 (0.9) b 59 (0.9) c 3.87 (0.01) a 6.89 (0.36) b 5.17 (0.14) b 8.5 (0.0) d 7.7 (0.0) d 7.7 (0.0) c
6 3000 27 (0.2) d 68 (0.4) b 56 (0.3) d 3.97 (0.04) a 12.17 (2.10) a 9.58 (1.11) a 5.1 (0.0) e 3.1 (1.0) e 3.1 (1.0) d
50/50
45 400 71 (0.1) a 68 (0.6) a 68 (1.2) a 2.61 (0.02) e 3.32 (0.17) d 3.18 (0.08) d 19.3 (0.5) a 13.3 (1.0) a 11.6 (1.3) a
20 900 72 (0.1) a 69 (0.6) a 64 (0.6) a,b 4.16 (0.04) d 5.49 (0.40) c 4.22 (0.15) cd 12.8 (0.0) b 7.1 (0.5) b 9.1 (0.5) b
12 1500 67 (0.4) b 68 (1.4) a 64 (1.8) a,b 5.24 (0.05) c 7.00 (0.47) b 5.77 (0.72) bc 10.5 (0.5) c 6.0 (0.8) bc 7.7 (0.8) b
9 2000 59 (0.4) c 67 (0.9) a 61 (2.3) b 5.86 (0.04) b 7.97 (0.21) ab 7.43 (0.59) b 8.2 (0.5) d 6.0 (0.0) bc 3.7 (0.5) c
6 3000 40 (0.3) d 61 (2.2) b 61 (2.4) b 6.03 (0.05) a 8.73 (0.73) a 10.86 (1.07) a 5.1 (0.0) e 4.8 (0.5) c 2.0 (0.5) c
60/40
45 400 66 (0.5) a 62 (0.6) a 61 (1.7) a 2.44 (0.03) e 3.21 (0.09) e 3.47 (0.11) e 16.7 (0.5) a 10.5 (0.5) a 10.2 (0.9) a
20 900 65 (0.6) a 61 (1.8) a 60 (1.6) a 3.85 (0.02) d 4.71 (0.30) d 5.62 (0.33) cd 11.1 (0.0) b 7.4 (0.5) b 4.5 (0.5) b
12 1500 64 (0.6) b 62 (1.4) a 61 (2.1) a 4.89 (0.21) c 6.80 (0.55) c 6.79 (0.38) c 9.1 (0.1) c 5.4 (0.5) c 4.3 (0.8) b
9 2000 60 (0.5) c 61 (0.4) a 61 (0.3) a 5.74 (0.03) b 8.13 (0.18) b 8.23 (0.23) b 7.7 (0.0) d 3.7 (0.7) d 3.4 (0.0) b
6 3000 50 (0.4) d 61 (0.2) b 60 (0.9) a 6.40 (0.07) a 10.62 (0.38) a 9.98 (1.49) a 5.1 (0.0) e 3.0 (0.5) d 3.4 (0.0) b
70/30
45 400 61 (0.5) a 54 (1.1) a 52 (2.0) a 2.34 (0.08) e 2.89 (0.26) e 2.39 (0.07) e 14.46 (0.9) a 5.4 (0.5) a 6.2 (0.5) a
20 900 60 (1.2) a 54 (0.3) a 52 (1.6) a 3.65 (0.12) d 4.29 (0.28) d 4.32 (0.38) d 8.5 (0.9) b 5.1 (0.9) a 4.8 (0.5) ab
12 1500 60 (0.7) a 55 (0.8) a 52 (1.5) a 4.97 (0.10) c 5.76 (0.38) c 5.75 (0.38) c 7.1 (0.5) c 4.8 (0.5) a 5.1 (0.8) ab
9 2000 57 (0.2) b 54 (0.3) a 52 (1.0) a 5.72 (0.06) b 7.05 (0.04) b 7.16 (0.62) b 6.2 (0.5) d 2.8 (0.5) b 3.4 (0.9) bc
6 3000 52 (0.8) c 52 (0.5) a 50 (1.5) a 7.40 (0.81) a 8.21 (0.06) a 8.98 (0.81) a 5.1 (0.0) e 2.3 (0.5) b 2.3 (0.5) c
95
2.2.5 Discussion
The first hypothesis (that for similar radiant exposure, if reciprocity did not hold
for the parent resin then it should not hold for its composite counterpart) must be rejected
as reciprocity was not verified in any of the tested resins but was for some composites.
However, the differences in DCMax
between the extremes of the irradiation modes for the
resins became less marked for high viscosity resins (9% for 7:3 compared with 55% for
3:7 Bis-GMA/TEGDMA ratio). Previous work has indicated that reciprocity can be
verified above a specific (unfilled) resin viscosity ( 6:4, Bis-GMA/TEGDMA) (Feng
and Suh, 2007) which plays a significant role in the polymerization rate and the onset of
reaction-diffusion controlled termination, with the highest maximum rates observed for
mixtures containing 50-75 wt% Bis-GMA (Emami and Söderholm, 2003). As suggested
in the previous section, low viscosity resins have high system mobility and thus a
bimolecular termination (radical-radical) pathway dominates during the initial stages of
polymerization. Therefore, loss of radical growth centres is greater for high irradiance
protocols (where a multitude of radical growth centers co-exist), since at low conversion
termination is proportional to the squared concentration of free radicals (Leprince et al.,
2010b). Consequently, at constant radiant exposure, with higher irradiance (and shorter
time), a reduction in growth centres during auto-acceleration is expected and DCMax will be
significantly decreased compared with similar radiant exposures achieved using lower
irradiance for longer time. Furthermore, the initiation rate ( pR ) has a square root
dependency on intensity (Decker, 2002). This relationship only holds in the early stages
of polymerization where termination occurs by bimolecular reactions between polymer
radicals (i.e. in low viscosity resins). As polymerization proceeds, mobility restrictions
increase as the density of the polymer increases and sole segmental diffusion of cross-
linked polymer radicals become less likely and the radical site will mainly move by
reacting with neighboring functional groups until termination occurs. A more linear
dependence of pR on light intensity is observed after gelation as the polymer chain stops
growing and corresponds to a monomolecular termination process (Decker, 2002). For
high viscosity resins, polymerization exhibits reaction-diffusion-controlled termination
96
from the onset due to its very low mobility (Lovell et al., 2001; Emami and Söderholm,
2003) and thus reaction rate increases significantly with light intensity (Table 2.2.1). The
significant increase in the rates at high intensity allows for a reduced cure time (reduced
time to Rp
Max ) and thus the differences in DCMax between the extremes of the curing
protocols are lower.
The second hypothesis (an increase in the filler content will result in a decrease in
the degree of conversion regardless of curing mode) must also be rejected. Indeed, the
addition of filler proportionally decreases the concentration of carbon double bonds
available for conversion and thus conversion is expected to be lower. When compared to
highly filled systems, vitrification is expected to be delayed in unfilled or low filled
systems which will allow further radical propagation and improved conversion in such
systems (Feng and Suh, 2007; D‟alphino et al., 2007; Feng et al., 2009). This may well
explain why resins and composites made with ( 6:4, Bis-GMA/TEGDMA) always show
the highest DCMax for the reference protocol (45s at 400mW/cm2). However, the increased
viscosity due to the addition of filler served to decrease the differences in DCMax between
the extremes of the irradiation modes for the filled systems (7:3 Bis-GMA/TEGDMA
ratio: LF= 2%, HF= 2%; 3:7 Bis-GMA/TEGDMA ratio: LF= 20%, HF= 24%). Filled
systems are expected to approach a more reciprocal relationship with respect to irradiance
and time at constant radiant exposure by reducing the mobility of the propagating species.
However, the applicability of the exposure reciprocity law may not be related to the bulk
or macroscopic viscosity (Section 2.1). In filled systems, the diffusion of radicals will be
limited to a relatively small volume as the organic fractions will be located in the small
interstices between the inorganic particles and thus a monomolecular termination
pathway would be favoured due to the reduced mobility (i.e. increased local viscosity).
The local viscosity will increase as the contact area between the resin and the filler
increases (due to interlocking and interfacial interactions between filler and resin), i.e.
increasing the filler load, using smaller particle sizes or a combination of both (Leprince
et al., 2009; Beun et al., 2009).
The kinetics of polymerisation is complex and changes in viscosity in the early
stages differ with material composition. The effect of changing rheology throughout cure
is an essential consideration, which is needed to further understand the applicability of
97
the exposure reciprocity law. Additionally, the optical properties are also an important
consideration. Most notably the photoinitiator type may have a profound impact on
reciprocity (Section 2.3) due to greater efficiencies caused by greater molar absorptivity
(molar extinction coefficient). Since the decomposition of photoinitiators is directly
related to its absorbance optical properties are likely to be affected throughout cure and
will subsequently be investigated in Chapter 3.
Finally, temperature measurements should not be ignored as both irradiance and
time will influence the total heat energy delivered and consequently will affect the
kinetics and reaction exotherm (Section 2.1). Further work regarding the synergistic
effects of rheology, optical properties and temperature should be a subject of further
investigation.
2.2.6 Conclusion
Exposure reciprocity relies on the constituents of the resin matrix as well as the
filler percentage. From this work it is evident that local viscosity (i.e. that between the
fillers) is responsible for whether exposure reciprocity law is upheld. When a bi-radical
termination pathway dominates, reciprocity is unlikely to be verified when the material
contains only a camphoroquinone/amine photoinitiator system. However, when a
monomolecular termination pathway dominates, degree of polymer conversion is more
likely to be equal regardless of curing protocols with similar radiant exposure. This
further underlines the necessity to adapt curing regimes according to material filler
content, resin matrix composition and the photoinitiator system. This is of prime clinical
relevance as the development of composite materials may be optimized to ensure
equivalent polymer conversion at reduced curing times.
98
2.3 Photoinitiator Type and Applicability of the Exposure Reciprocity
Law in Filled and Unfilled Photoactive Resins†‡
2.3.1 Abstract
The aim of this section is to test the influence of photoinitiator type and filler
particle inclusion on the validity of exposure reciprocity law. 50/50wt% Bis-
GMA/TEGDMA resins were prepared with equimolar concentrations of
camphorquinone/DMAEMA (0.20/0.80 mass%) (CQ) or Lucirin-TPO (0.42 mass%), and
were used either unfilled or filled to 75 mass%. Specimens were cured with a halogen
Swiss Master Light (EMS, Switzerland) using four different curing protocols: 400
mW/cm2 for 45 s as reference protocol (18 J/cm
2), 1500 mW/cm
2 for 12 s (18 J/cm
2),
3000 mW/cm2 for 6 s (18 J/cm
2) and 3 s (9 J/cm
2). Degree of conversion (DC) was
measured in real time for 70 s by FT-NIRS and temperature rise using a thermocouple.
Depth of cure was determined with a penetrometer technique. With respect to DC and
depth of cure, exposure reciprocity law did not hold for any tested material, except for the
depth of cure of filled CQ-based materials. At similar radiant exposure, DC was
significantly higher (p<0.05) for all unfilled and filled TPO-based materials compared
with CQ-based materials. As exposure time was reduced and irradiance increased, TPO-
based materials exhibited higher DC whilst an opposite trend was observed for CQ-based
materials (p<0.05). For similar curing regimes, depth of cure of CQ-based materials
remained significantly greater than that of TPO-based materials. Adding fillers generally
reduced DC, except at higher irradiance for CQ-based materials where a positive effect
was observed (p<0.05). The validity of exposure reciprocity law was dependent on
several factors, among which photoinitiator type and filler content were important.
Lucirin-TPO is a highly reactive and efficient photoinitiator, which may allow the
potential for a reduction in curing time of TPO-based photoactive materials in thin
sections due to its reduced depth of cure.
† Leprince J, Hadis MA, Ferracane JF, Devaux J, Leloup G, Shortall ACC, Palin WM. Photoinitiator
type and applicability of exposure reciprocity law in filled and unfilled photoactive resins. Dental
Materials, 2011; 27: 157-164
‡ Winner of the Paffenbarger Award, Academy of Dental Materials, Portland, 2009.
99
2.3.2 Introduction
The demand for the reduction in curing time and minimized chairside procedure
is un-questionable. Combined with the increasing popularity and demand for photoactive
resin-based restorations as a replacement for dental amalgam, major financial
implications have been suggested for dentists who chose to use high power, fast curing
light sources (Christensen, 2000). Such light curing units may allow the possibility of
shorter exposure times (<10 s) whilst maintaining optimum material properties. This is
based on the assumption that the total energy of the irradiation, i.e. radiant exposure
(J/cm2), is the main determining factor in degree of conversion and mechanical properties
of the photoactive material. As radiant exposure is the product of irradiance (I, mW/cm2)
and irradiation time (t, s), it supposed that comparable material properties result from
similar radiant exposure, no matter how it is obtained (by different combinations of
irradiance and time). While in certain cases this law is upheld (Sakaguchi and Ferracane,
2001; Halvorson et al., 2002; Emami and Söderholm, 2003; Price et al., 2004), other
studies have reported that although radiant exposure plays an important role, irradiance
and time independently influence polymer chain length, extent of crosslinking and
mechanical properties, and as such, exposure reciprocity does not hold under all
conditions (Musanje and Darvell, 2003; Asmussen and Peutzfeldt, 2005; Peutzfeldt and
Asmussen, 2005; Feng and Suh, 2007; Dewaele et al., 2009).
Sections 2.1 and 2.2 of this thesis demonstrated the importance of monomer
composition and filler percentage on reactivity and degree of conversion of RBC
materials. Reactivity and degree of conversion are also dependent upon the efficiency of
the photoinitiator system (Ogunyinka et al., 2007). Furthermore, alternative
photoinitiators have been integrated in commercially available materials in the last few
years, mostly for aesthetic reasons, due to yellowing by camphorquinone/amine systems
(Price and Felix, 2009). As some of these alternative photoinitiators are also interesting in
terms of photopolymerization efficiency, they might also have an impact on the validity
of exposure reciprocity law. Notably, Lucirin-TPO, a monoacylphosphine oxide, seems
to be a promising molecule, as it presents higher molar absorptivity and curing efficiency
(Neumann et al., 2005; Neumann et al., 2006). However, considering the absorption
100
characteristics of Lucirin TPO and the increased scattering of light of shorter
wavelengths, inferior curing depth of materials that replace camphoroquinone with
Lucirin TPO may be a cause for concern (Price and Felix, 2009; Leprince et al., 2010a).
Although recent work has highlighted the potential of Lucirin TPO-based (unfilled)
polymers to be cured in thick layers (Kenning et al., 2008) and for use in dental adhesives
(Illie and Hickel, 2009), its application in filled resin composites has not been fully
described. To date, the curing efficiency of Lucirin TPO in filled resin-based composite
has only been studied in commercial materials (Palin et al., 2008; Price and Felix, 2009;
Leprince et al., 2010a), in which Lucirin TPO is not used by itself but in combination
with camphoroquinone. Lower quantum yields have been measured for polymerization
initiated by a mixture of Lucirin TPO and camphoroquinone compared to systems in
which Lucirin TPO was used alone, probably due to a transfer from the more efficient
photoinitiator (Lucirin TPO) to the less efficient one (camphoroquinone) (Neumann et
al., 2009). In addition, the exact photoinitiator concentration and ratio in commercially
available composite materials usually remains proprietary.
Consequently, the aim of this work was to investigate the impact of photoinitiator
type on the polymerization efficiency in unfilled and filled experimental resins. Degree of
conversion (DC) and depth of cure were measured to investigate the applicability of
exposure reciprocity law on the photoinitiator type and also the presence or absence of
fillers.
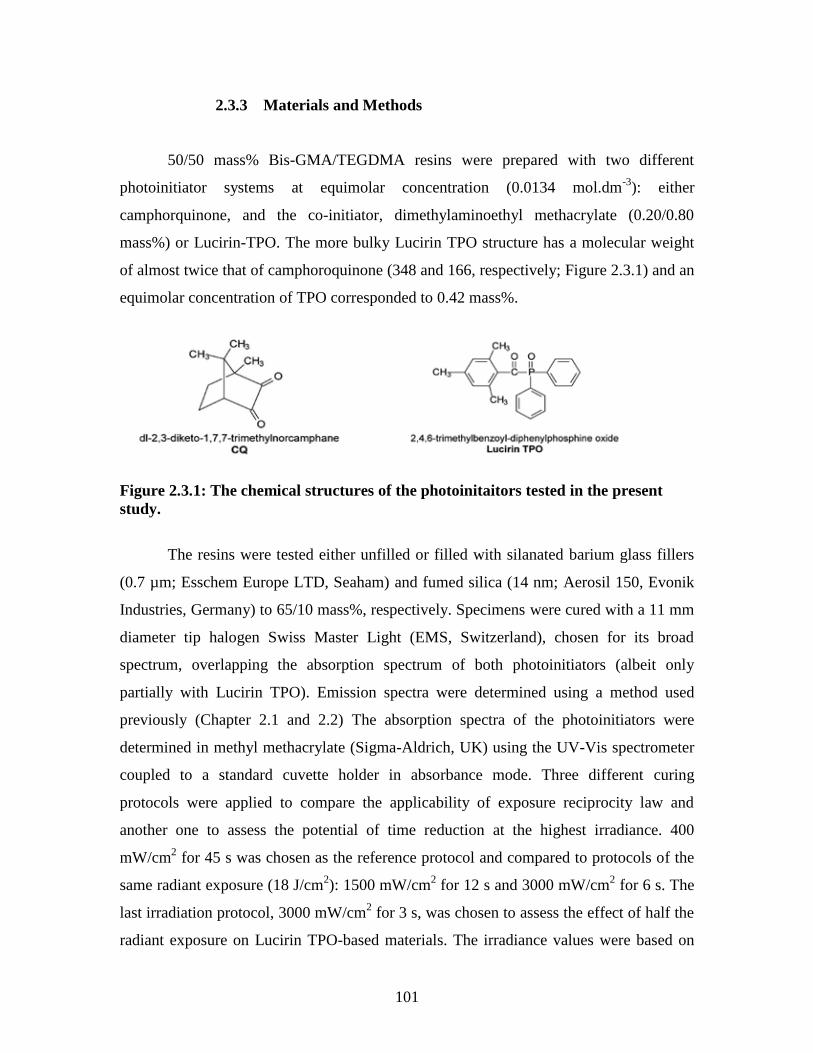
101
2.3.3 Materials and Methods
50/50 mass% Bis-GMA/TEGDMA resins were prepared with two different
photoinitiator systems at equimolar concentration (0.0134 mol.dm-3
): either
camphorquinone, and the co-initiator, dimethylaminoethyl methacrylate (0.20/0.80
mass%) or Lucirin-TPO. The more bulky Lucirin TPO structure has a molecular weight
of almost twice that of camphoroquinone (348 and 166, respectively; Figure 2.3.1) and an
equimolar concentration of TPO corresponded to 0.42 mass%.
Figure 2.3.1: The chemical structures of the photoinitaitors tested in the present
study.
The resins were tested either unfilled or filled with silanated barium glass fillers
(0.7 µm; Esschem Europe LTD, Seaham) and fumed silica (14 nm; Aerosil 150, Evonik
Industries, Germany) to 65/10 mass%, respectively. Specimens were cured with a 11 mm
diameter tip halogen Swiss Master Light (EMS, Switzerland), chosen for its broad
spectrum, overlapping the absorption spectrum of both photoinitiators (albeit only
partially with Lucirin TPO). Emission spectra were determined using a method used
previously (Chapter 2.1 and 2.2) The absorption spectra of the photoinitiators were
determined in methyl methacrylate (Sigma-Aldrich, UK) using the UV-Vis spectrometer
coupled to a standard cuvette holder in absorbance mode. Three different curing
protocols were applied to compare the applicability of exposure reciprocity law and
another one to assess the potential of time reduction at the highest irradiance. 400
mW/cm2 for 45 s was chosen as the reference protocol and compared to protocols of the
same radiant exposure (18 J/cm2): 1500 mW/cm
2 for 12 s and 3000 mW/cm
2 for 6 s. The
last irradiation protocol, 3000 mW/cm2 for 3 s, was chosen to assess the effect of half the
radiant exposure on Lucirin TPO-based materials. The irradiance values were based on
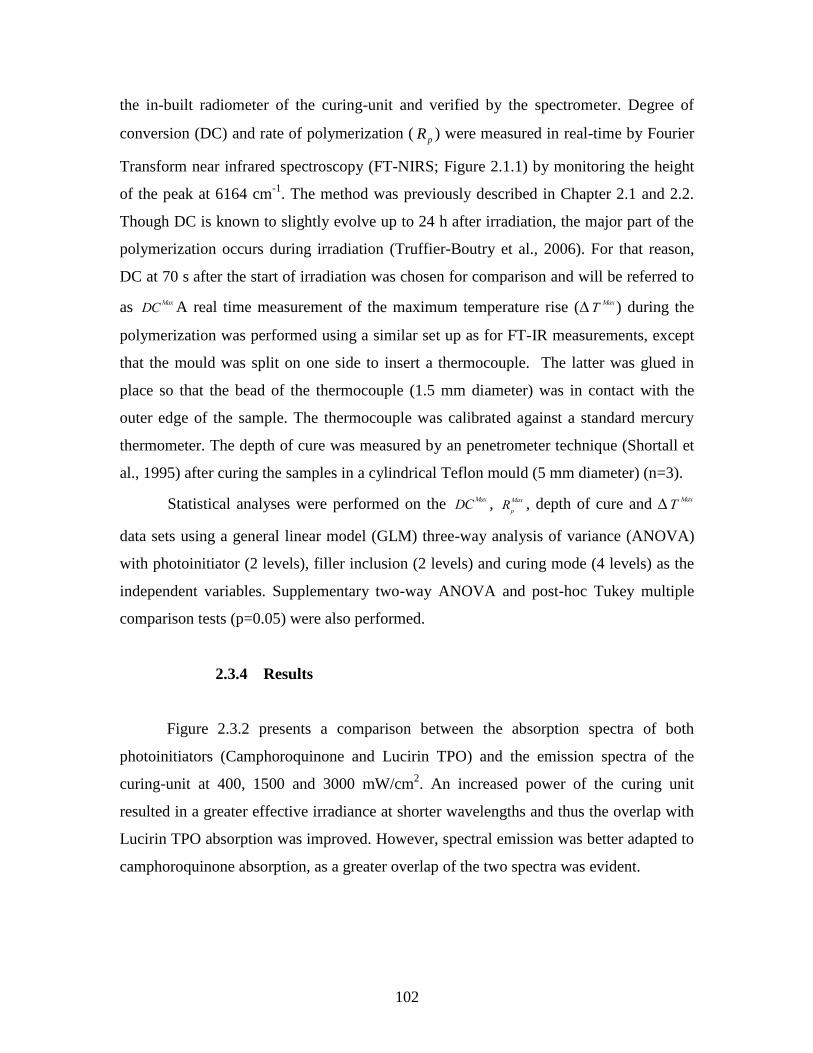
102
the in-built radiometer of the curing-unit and verified by the spectrometer. Degree of
conversion (DC) and rate of polymerization (pR ) were measured in real-time by Fourier
Transform near infrared spectroscopy (FT-NIRS; Figure 2.1.1) by monitoring the height
of the peak at 6164 cm-1
. The method was previously described in Chapter 2.1 and 2.2.
Though DC is known to slightly evolve up to 24 h after irradiation, the major part of the
polymerization occurs during irradiation (Truffier-Boutry et al., 2006). For that reason,
DC at 70 s after the start of irradiation was chosen for comparison and will be referred to
as DCMax
A real time measurement of the maximum temperature rise (TMax
) during the
polymerization was performed using a similar set up as for FT-IR measurements, except
that the mould was split on one side to insert a thermocouple. The latter was glued in
place so that the bead of the thermocouple (1.5 mm diameter) was in contact with the
outer edge of the sample. The thermocouple was calibrated against a standard mercury
thermometer. The depth of cure was measured by an penetrometer technique (Shortall et
al., 1995) after curing the samples in a cylindrical Teflon mould (5 mm diameter) (n=3).
Statistical analyses were performed on the DCMax
, Rp
Max , depth of cure and TMax
data sets using a general linear model (GLM) three-way analysis of variance (ANOVA)
with photoinitiator (2 levels), filler inclusion (2 levels) and curing mode (4 levels) as the
independent variables. Supplementary two-way ANOVA and post-hoc Tukey multiple
comparison tests (p=0.05) were also performed.
2.3.4 Results
Figure 2.3.2 presents a comparison between the absorption spectra of both
photoinitiators (Camphoroquinone and Lucirin TPO) and the emission spectra of the
curing-unit at 400, 1500 and 3000 mW/cm2. An increased power of the curing unit
resulted in a greater effective irradiance at shorter wavelengths and thus the overlap with
Lucirin TPO absorption was improved. However, spectral emission was better adapted to
camphoroquinone absorption, as a greater overlap of the two spectra was evident.
103
Wavelength (nm)
400 500 600 700
Mo
lar
ab
so
rpti
vit
y (
L.M
ol-1
.cm
-1)
0
100
200
300
400
500
600
Ab
so
lute
Irr
ad
ian
ce
(
W/c
m2.n
m)
0
200
400
600
800
1000
1200Lucirin TPO
Camphoroquinone
400 mW/cm2
1500 mW/cm2
3000 mW/cm2
Figure 2.3.2: Absorption spectra (left axis, in L.Mol
-1cm
-1) of Camphoroquinone
(yellow) and Lucirin TPO (purple) compared to the emission spectra of the Swiss
Master Light (right axis, in μW/cm2.nm) at different irradiances, i.e. 400, 1500 and
3000 mW/cm2. An Improvement of the overlap with Lucirin TPO absorption can be
observed with increased power of the curing unit.
The GLM of all independent variables revealed significant differences (p<0.001)
where photoinitiator (df=1; F=5971) > filler inclusion (df=1; F=1302) > curing mode
(df=3; F=809). A two-way ANOVA test of DCMax
results revealed significant overall
differences for both photoinitiators and curing mode (p<0.001). Comparing irradiation
modes of similar radiant exposure (18 J/cm2), DC
Max was significantly higher for all resin
and resin composite Lucirin TPO-based materials compared with Camphoroquinone-
based materials (p<0.05; Figure 2.3.3(a) and Figure 2.3.4(a)). For Lucirin TPO, an
increase in irradiance resulted in higher DCMax
regardless of exposure duration, while a
reverse trend was observed for camphoroquinone-based materials where longer exposure
led to higher DCMax
regardless of irradiance. DCMax
significantly decreased in most cases
with addition of fillers (p<0.05), except for camphoroquinone-based materials cured with
the highest irradiance where filled resins exhibited a significantly increased DCMax
compared with the unfilled parent resin (p<0.05).
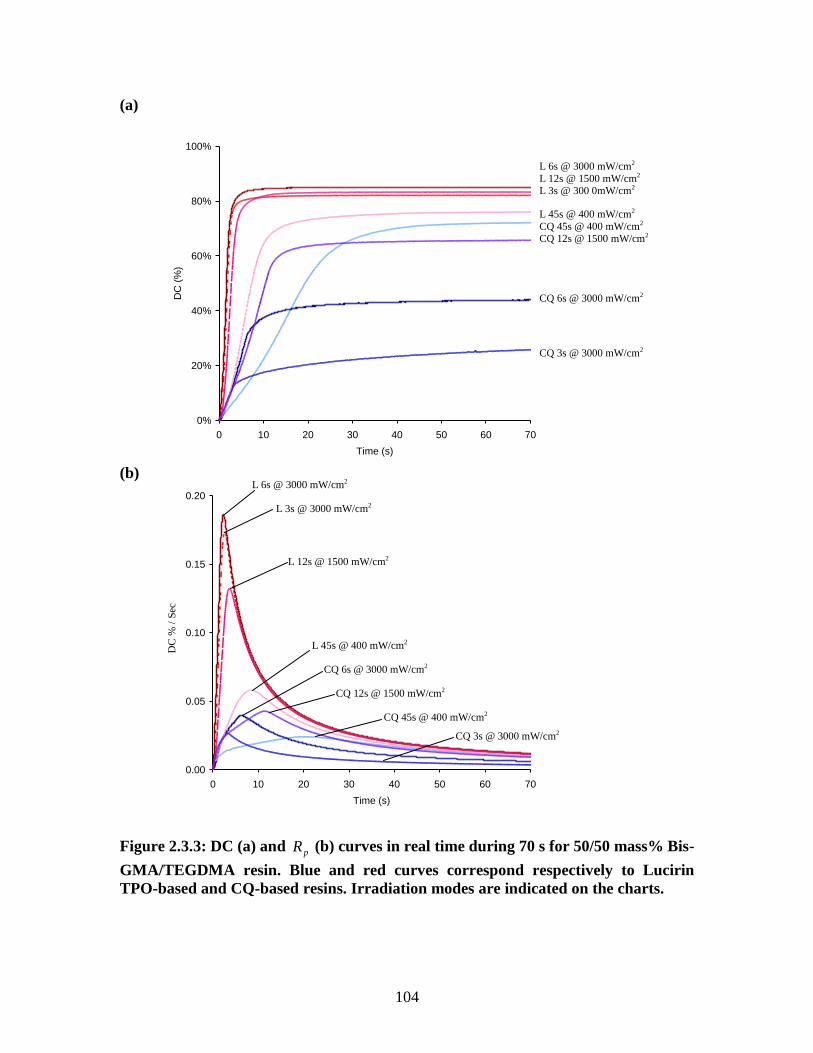
104
(a)
0%
20%
40%
60%
80%
100%
0 10 20 30 40 50 60 70
Time (s)
DC
(%
)
(b)
0.00
0.05
0.10
0.15
0.20
0 10 20 30 40 50 60 70
Time (s)
DC
(%
)
Figure 2.3.3: DC (a) and pR (b) curves in real time during 70 s for 50/50 mass% Bis-
GMA/TEGDMA resin. Blue and red curves correspond respectively to Lucirin
TPO-based and CQ-based resins. Irradiation modes are indicated on the charts.
CQ 6s @ 3000 mW/cm2
CQ 3s @ 3000 mW/cm2
L 6s @ 3000 mW/cm2
L 12s @ 1500 mW/cm2
L 3s @ 300 0mW/cm2
L 45s @ 400 mW/cm2
CQ 45s @ 400 mW/cm2 CQ 12s @ 1500 mW/cm2
L 6s @ 3000 mW/cm2
L 3s @ 3000 mW/cm2
L 12s @ 1500 mW/cm2
L 45s @ 400 mW/cm2
CQ 6s @ 3000 mW/cm2
CQ 12s @ 1500 mW/cm2
CQ 45s @ 400 mW/cm2
CQ 3s @ 3000 mW/cm2
DC
% /
Sec
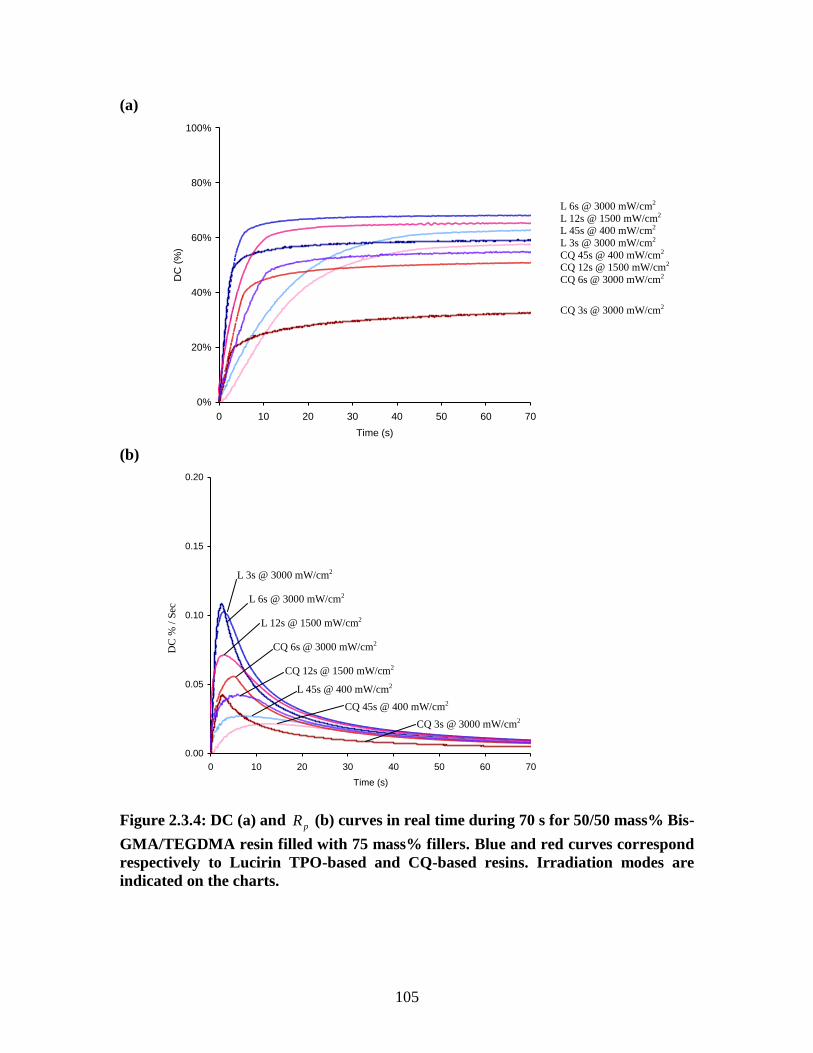
105
(a)
0%
20%
40%
60%
80%
100%
0 10 20 30 40 50 60 70
Time (s)
DC
(%
)
(b)
0.00
0.05
0.10
0.15
0.20
0 10 20 30 40 50 60 70
Time (s)
DC
(%
)
Figure 2.3.4: DC (a) and pR (b) curves in real time during 70 s for 50/50 mass% Bis-
GMA/TEGDMA resin filled with 75 mass% fillers. Blue and red curves correspond
respectively to Lucirin TPO-based and CQ-based resins. Irradiation modes are
indicated on the charts.
L 45s @ 400 mW/cm2
CQ 3s @ 3000 mW/cm2
L 6s @ 3000 mW/cm2
L 12s @ 1500 mW/cm2
L 45s @ 400 mW/cm2
L 3s @ 3000 mW/cm2
CQ 45s @ 400 mW/cm2 CQ 12s @ 1500 mW/cm2
CQ 6s @ 3000 mW/cm2
L 6s @ 3000 mW/cm2
L 3s @ 3000 mW/cm2
L 12s @ 1500 mW/cm2
CQ 6s @ 3000 mW/cm2
CQ 12s @ 1500 mW/cm2
CQ 45s @ 400 mW/cm2
CQ 3s @ 3000 mW/cm2
DC
% /
Sec
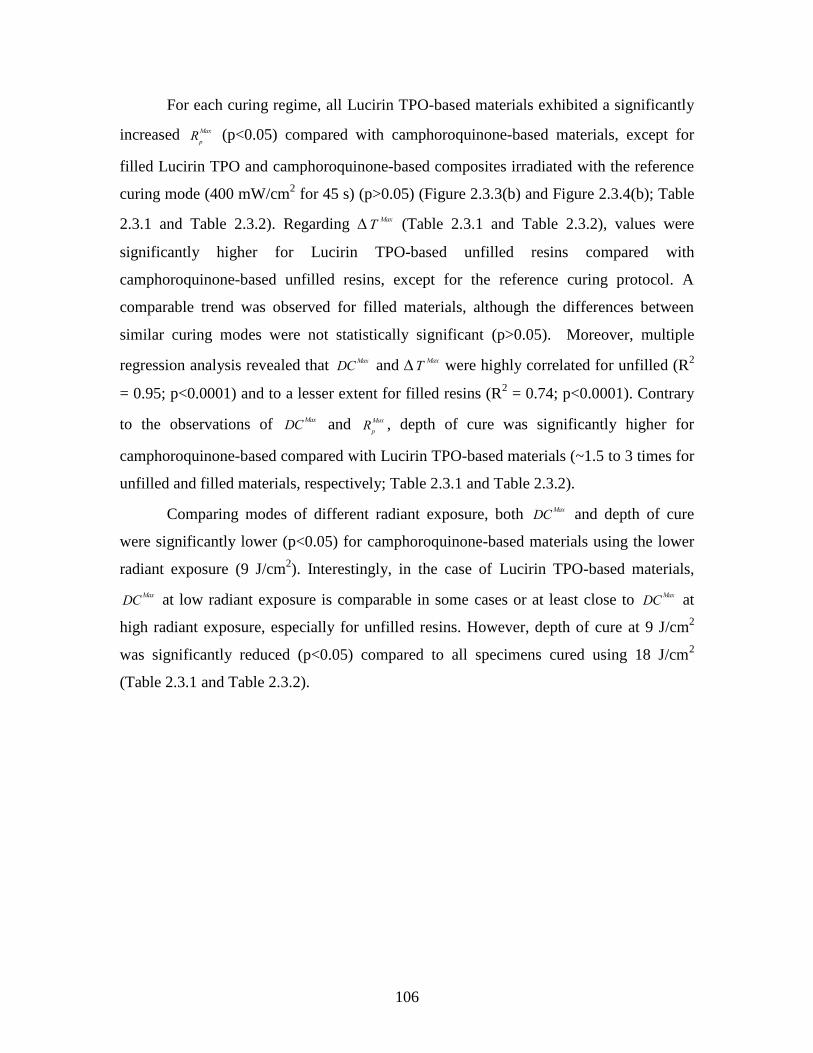
106
For each curing regime, all Lucirin TPO-based materials exhibited a significantly
increased Rp
Max (p<0.05) compared with camphoroquinone-based materials, except for
filled Lucirin TPO and camphoroquinone-based composites irradiated with the reference
curing mode (400 mW/cm2 for 45 s) (p>0.05) (Figure 2.3.3(b) and Figure 2.3.4(b); Table
2.3.1 and Table 2.3.2). Regarding TMax
(Table 2.3.1 and Table 2.3.2), values were
significantly higher for Lucirin TPO-based unfilled resins compared with
camphoroquinone-based unfilled resins, except for the reference curing protocol. A
comparable trend was observed for filled materials, although the differences between
similar curing modes were not statistically significant (p>0.05). Moreover, multiple
regression analysis revealed that DCMax
and TMax
were highly correlated for unfilled (R2
= 0.95; p<0.0001) and to a lesser extent for filled resins (R2 = 0.74; p<0.0001). Contrary
to the observations of DCMax
and Rp
Max , depth of cure was significantly higher for
camphoroquinone-based compared with Lucirin TPO-based materials (~1.5 to 3 times for
unfilled and filled materials, respectively; Table 2.3.1 and Table 2.3.2).
Comparing modes of different radiant exposure, both DCMax
and depth of cure
were significantly lower (p<0.05) for camphoroquinone-based materials using the lower
radiant exposure (9 J/cm2). Interestingly, in the case of Lucirin TPO-based materials,
DCMax
at low radiant exposure is comparable in some cases or at least close to DCMax
at
high radiant exposure, especially for unfilled resins. However, depth of cure at 9 J/cm2
was significantly reduced (p<0.05) compared to all specimens cured using 18 J/cm2
(Table 2.3.1 and Table 2.3.2).
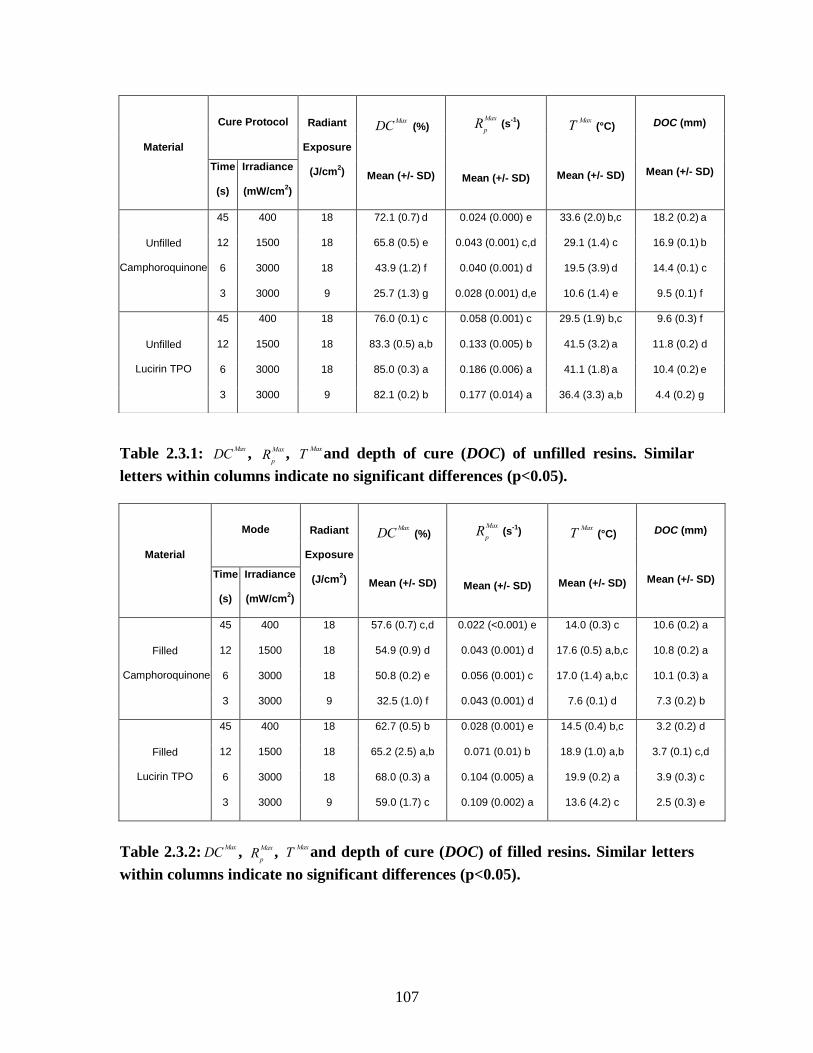
107
Table 2.3.1: DCMax
, Rp
Max , TMax
and depth of cure (DOC) of unfilled resins. Similar
letters within columns indicate no significant differences (p<0.05).
Material
Mode Radiant
Exposure
(J/cm2)
DCMax
(%)
Mean (+/- SD)
Rp
Max (s
-1)
Mean (+/- SD)
TMax
(°C)
Mean (+/- SD)
DOC (mm)
Mean (+/- SD) Time
(s)
Irradiance
(mW/cm2)
Filled
Camphoroquinone
45 400 18 57.6 (0.7) c,d 0.022 (<0.001) e 14.0 (0.3) c 10.6 (0.2) a
12 1500 18 54.9 (0.9) d 0.043 (0.001) d 17.6 (0.5) a,b,c 10.8 (0.2) a
6 3000 18 50.8 (0.2) e 0.056 (0.001) c 17.0 (1.4) a,b,c 10.1 (0.3) a
3 3000 9 32.5 (1.0) f 0.043 (0.001) d 7.6 (0.1) d 7.3 (0.2) b
Filled
Lucirin TPO
45 400 18 62.7 (0.5) b 0.028 (0.001) e 14.5 (0.4) b,c 3.2 (0.2) d
12 1500 18 65.2 (2.5) a,b 0.071 (0.01) b 18.9 (1.0) a,b 3.7 (0.1) c,d
6 3000 18 68.0 (0.3) a 0.104 (0.005) a 19.9 (0.2) a 3.9 (0.3) c
3 3000 9 59.0 (1.7) c 0.109 (0.002) a 13.6 (4.2) c 2.5 (0.3) e
Table 2.3.2:DCMax
, Rp
Max , TMax
and depth of cure (DOC) of filled resins. Similar letters
within columns indicate no significant differences (p<0.05).
Material
Cure Protocol Radiant
Exposure
(J/cm2)
DCMax
(%)
Mean (+/- SD)
Rp
Max (s
-1)
Mean (+/- SD)
TMax
(°C)
Mean (+/- SD)
DOC (mm)
Mean (+/- SD) Time
(s)
Irradiance
(mW/cm2)
Unfilled
Camphoroquinone
45 400 18 72.1 (0.7) d 0.024 (0.000) e 33.6 (2.0)
b,c 18.2 (0.2)
a
12 1500 18 65.8 (0.5) e 0.043 (0.001) c,d 29.1 (1.4) c 16.9 (0.1) b
6 3000 18 43.9 (1.2) f 0.040 (0.001) d 19.5 (3.9) d 14.4 (0.1) c
3 3000 9 25.7 (1.3) g 0.028 (0.001) d,e 10.6 (1.4) e 9.5 (0.1) f
Unfilled
Lucirin TPO
45 400 18 76.0 (0.1) c 0.058 (0.001) c 29.5 (1.9) b,c 9.6 (0.3) f
12 1500 18 83.3 (0.5) a,b 0.133 (0.005) b 41.5 (3.2) a 11.8 (0.2) d
6 3000 18 85.0 (0.3) a 0.186 (0.006) a 41.1 (1.8) a 10.4 (0.2)
e
3 3000 9 82.1 (0.2) b 0.177 (0.014) a 36.4 (3.3) a,b 4.4 (0.2) g
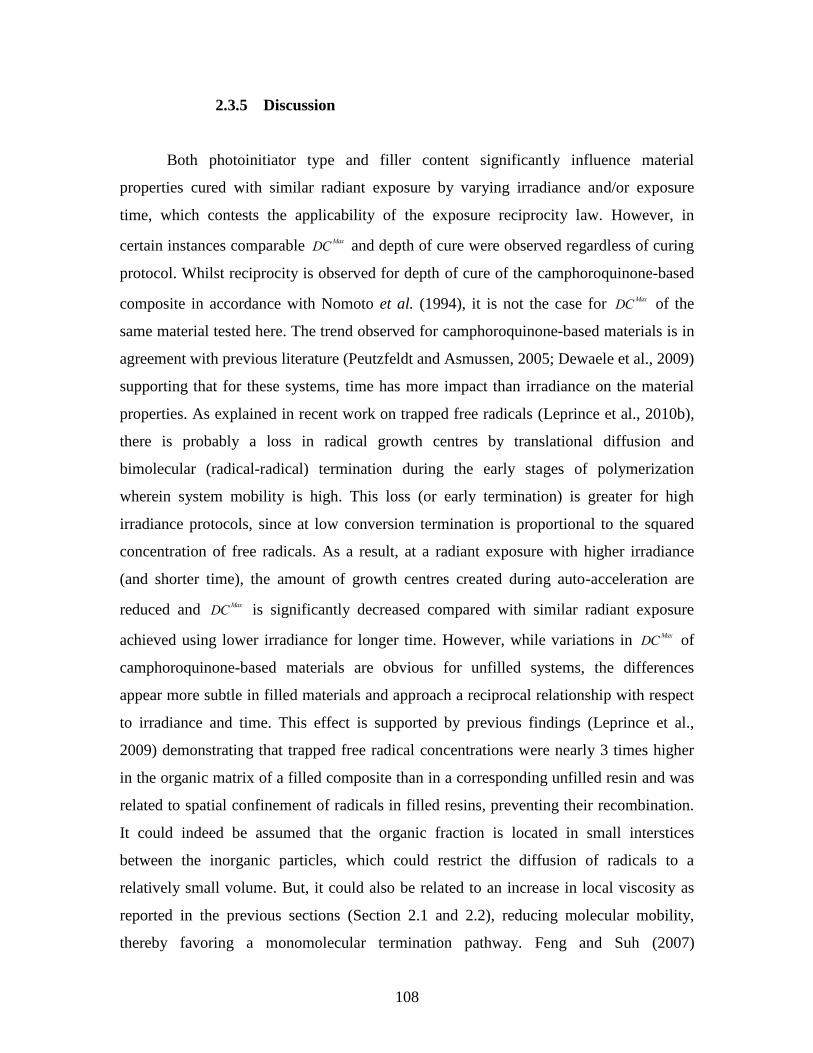
108
2.3.5 Discussion
Both photoinitiator type and filler content significantly influence material
properties cured with similar radiant exposure by varying irradiance and/or exposure
time, which contests the applicability of the exposure reciprocity law. However, in
certain instances comparable DCMax
and depth of cure were observed regardless of curing
protocol. Whilst reciprocity is observed for depth of cure of the camphoroquinone-based
composite in accordance with Nomoto et al. (1994), it is not the case for DCMax
of the
same material tested here. The trend observed for camphoroquinone-based materials is in
agreement with previous literature (Peutzfeldt and Asmussen, 2005; Dewaele et al., 2009)
supporting that for these systems, time has more impact than irradiance on the material
properties. As explained in recent work on trapped free radicals (Leprince et al., 2010b),
there is probably a loss in radical growth centres by translational diffusion and
bimolecular (radical-radical) termination during the early stages of polymerization
wherein system mobility is high. This loss (or early termination) is greater for high
irradiance protocols, since at low conversion termination is proportional to the squared
concentration of free radicals. As a result, at a radiant exposure with higher irradiance
(and shorter time), the amount of growth centres created during auto-acceleration are
reduced and DCMax
is significantly decreased compared with similar radiant exposure
achieved using lower irradiance for longer time. However, while variations in DCMax
of
camphoroquinone-based materials are obvious for unfilled systems, the differences
appear more subtle in filled materials and approach a reciprocal relationship with respect
to irradiance and time. This effect is supported by previous findings (Leprince et al.,
2009) demonstrating that trapped free radical concentrations were nearly 3 times higher
in the organic matrix of a filled composite than in a corresponding unfilled resin and was
related to spatial confinement of radicals in filled resins, preventing their recombination.
It could indeed be assumed that the organic fraction is located in small interstices
between the inorganic particles, which could restrict the diffusion of radicals to a
relatively small volume. But, it could also be related to an increase in local viscosity as
reported in the previous sections (Section 2.1 and 2.2), reducing molecular mobility,
thereby favoring a monomolecular termination pathway. Feng and Suh (2007)
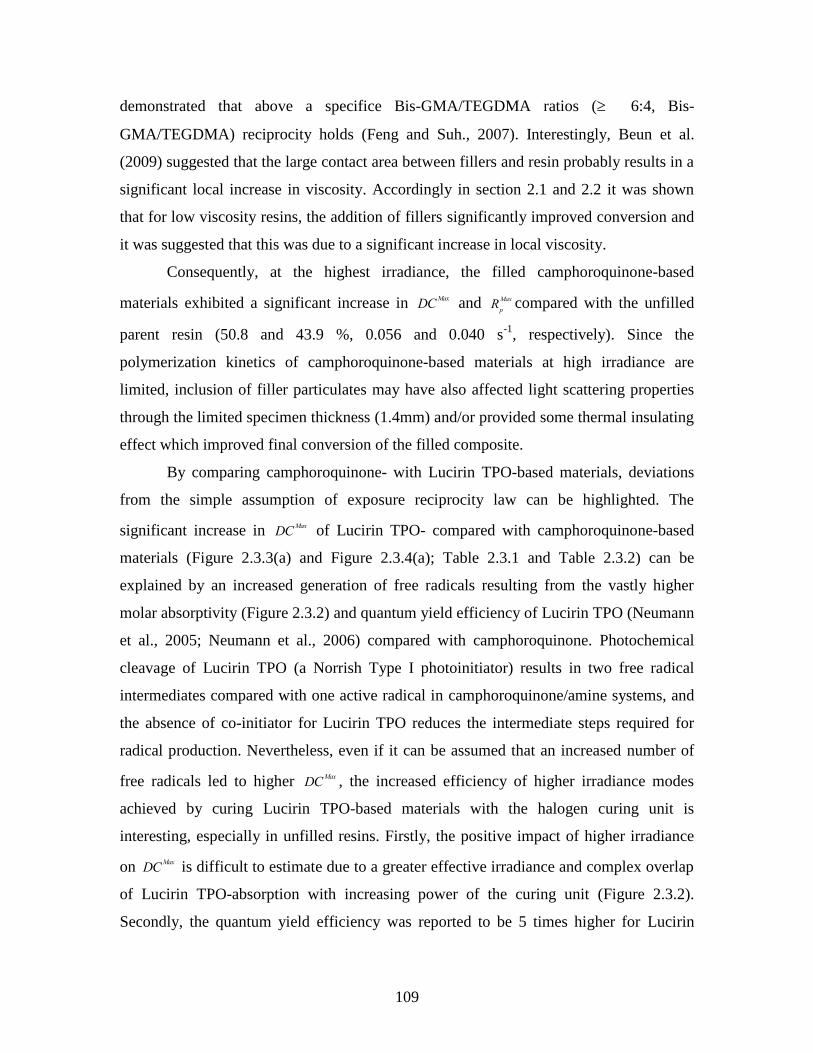
109
demonstrated that above a specifice Bis-GMA/TEGDMA ratios ( 6:4, Bis-
GMA/TEGDMA) reciprocity holds (Feng and Suh., 2007). Interestingly, Beun et al.
(2009) suggested that the large contact area between fillers and resin probably results in a
significant local increase in viscosity. Accordingly in section 2.1 and 2.2 it was shown
that for low viscosity resins, the addition of fillers significantly improved conversion and
it was suggested that this was due to a significant increase in local viscosity.
Consequently, at the highest irradiance, the filled camphoroquinone-based
materials exhibited a significant increase in DCMax
and Rp
Max compared with the unfilled
parent resin (50.8 and 43.9 %, 0.056 and 0.040 s-1
, respectively). Since the
polymerization kinetics of camphoroquinone-based materials at high irradiance are
limited, inclusion of filler particulates may have also affected light scattering properties
through the limited specimen thickness (1.4mm) and/or provided some thermal insulating
effect which improved final conversion of the filled composite.
By comparing camphoroquinone- with Lucirin TPO-based materials, deviations
from the simple assumption of exposure reciprocity law can be highlighted. The
significant increase in DCMax
of Lucirin TPO- compared with camphoroquinone-based
materials (Figure 2.3.3(a) and Figure 2.3.4(a); Table 2.3.1 and Table 2.3.2) can be
explained by an increased generation of free radicals resulting from the vastly higher
molar absorptivity (Figure 2.3.2) and quantum yield efficiency of Lucirin TPO (Neumann
et al., 2005; Neumann et al., 2006) compared with camphoroquinone. Photochemical
cleavage of Lucirin TPO (a Norrish Type I photoinitiator) results in two free radical
intermediates compared with one active radical in camphoroquinone/amine systems, and
the absence of co-initiator for Lucirin TPO reduces the intermediate steps required for
radical production. Nevertheless, even if it can be assumed that an increased number of
free radicals led to higher DCMax
, the increased efficiency of higher irradiance modes
achieved by curing Lucirin TPO-based materials with the halogen curing unit is
interesting, especially in unfilled resins. Firstly, the positive impact of higher irradiance
on DCMax
is difficult to estimate due to a greater effective irradiance and complex overlap
of Lucirin TPO-absorption with increasing power of the curing unit (Figure 2.3.2).
Secondly, the quantum yield efficiency was reported to be 5 times higher for Lucirin
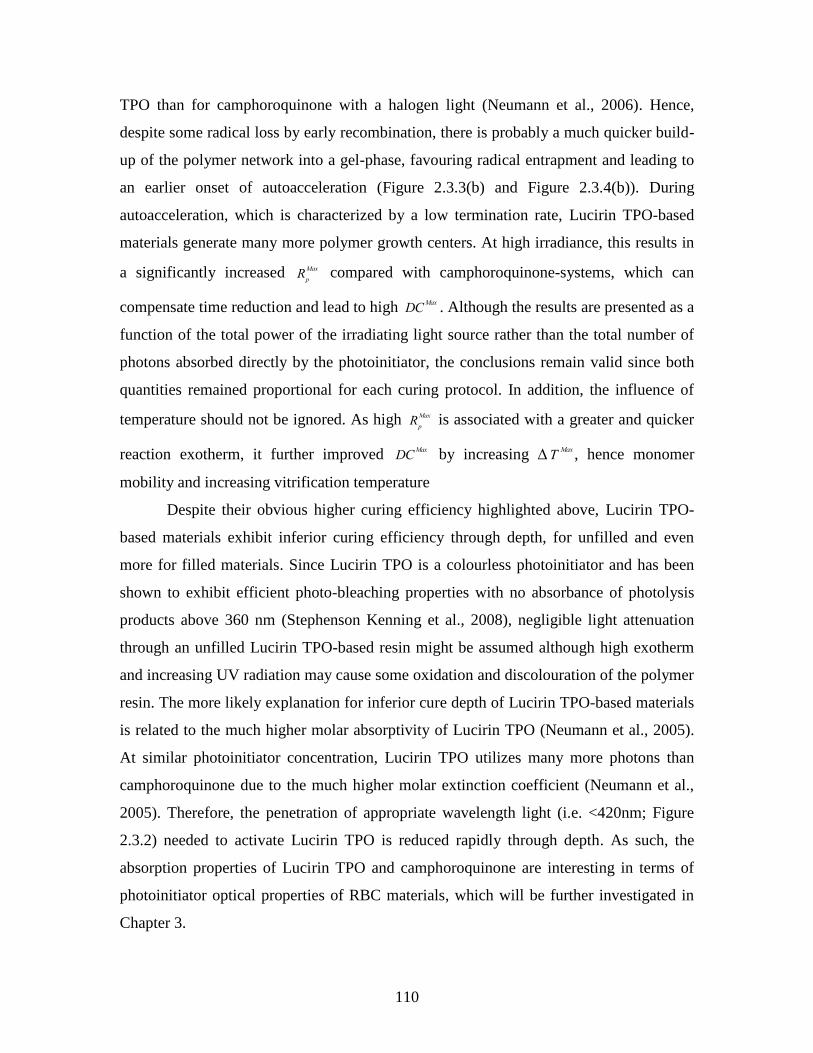
110
TPO than for camphoroquinone with a halogen light (Neumann et al., 2006). Hence,
despite some radical loss by early recombination, there is probably a much quicker build-
up of the polymer network into a gel-phase, favouring radical entrapment and leading to
an earlier onset of autoacceleration (Figure 2.3.3(b) and Figure 2.3.4(b)). During
autoacceleration, which is characterized by a low termination rate, Lucirin TPO-based
materials generate many more polymer growth centers. At high irradiance, this results in
a significantly increased Rp
Max compared with camphoroquinone-systems, which can
compensate time reduction and lead to high DCMax
. Although the results are presented as a
function of the total power of the irradiating light source rather than the total number of
photons absorbed directly by the photoinitiator, the conclusions remain valid since both
quantities remained proportional for each curing protocol. In addition, the influence of
temperature should not be ignored. As high Rp
Max is associated with a greater and quicker
reaction exotherm, it further improved DCMax
by increasing TMax
, hence monomer
mobility and increasing vitrification temperature
Despite their obvious higher curing efficiency highlighted above, Lucirin TPO-
based materials exhibit inferior curing efficiency through depth, for unfilled and even
more for filled materials. Since Lucirin TPO is a colourless photoinitiator and has been
shown to exhibit efficient photo-bleaching properties with no absorbance of photolysis
products above 360 nm (Stephenson Kenning et al., 2008), negligible light attenuation
through an unfilled Lucirin TPO-based resin might be assumed although high exotherm
and increasing UV radiation may cause some oxidation and discolouration of the polymer
resin. The more likely explanation for inferior cure depth of Lucirin TPO-based materials
is related to the much higher molar absorptivity of Lucirin TPO (Neumann et al., 2005).
At similar photoinitiator concentration, Lucirin TPO utilizes many more photons than
camphoroquinone due to the much higher molar extinction coefficient (Neumann et al.,
2005). Therefore, the penetration of appropriate wavelength light (i.e. <420nm; Figure
2.3.2) needed to activate Lucirin TPO is reduced rapidly through depth. As such, the
absorption properties of Lucirin TPO and camphoroquinone are interesting in terms of
photoinitiator optical properties of RBC materials, which will be further investigated in
Chapter 3.
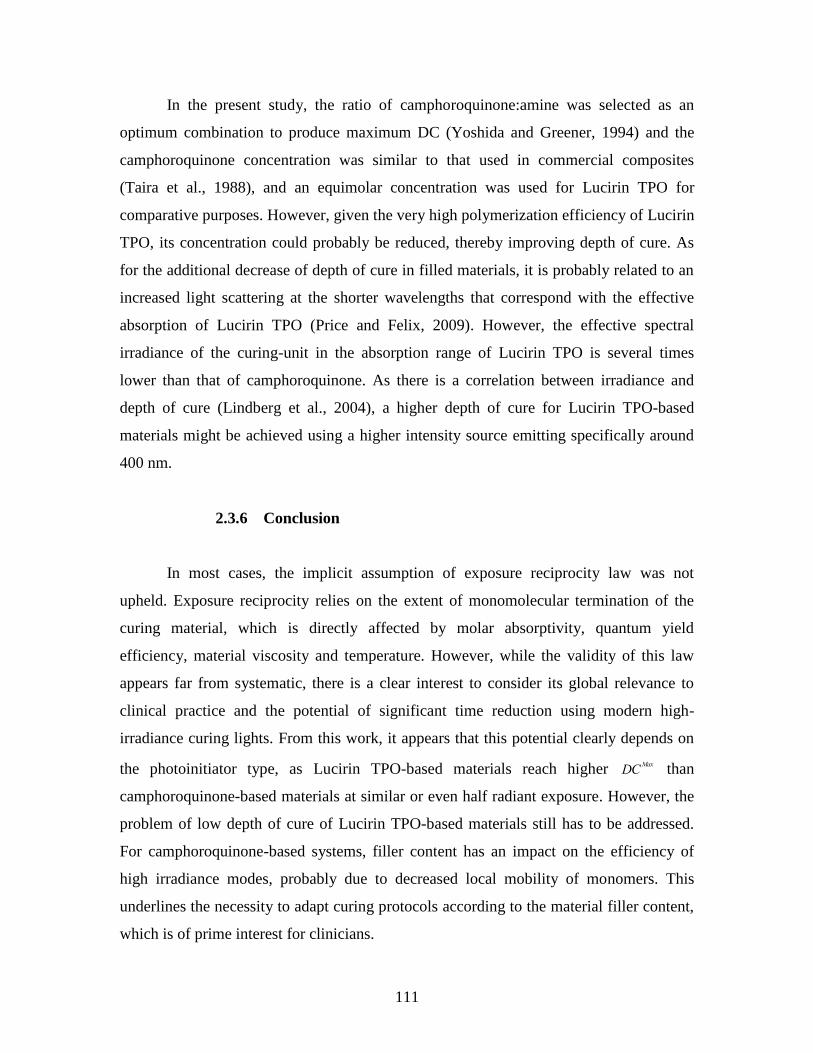
111
In the present study, the ratio of camphoroquinone:amine was selected as an
optimum combination to produce maximum DC (Yoshida and Greener, 1994) and the
camphoroquinone concentration was similar to that used in commercial composites
(Taira et al., 1988), and an equimolar concentration was used for Lucirin TPO for
comparative purposes. However, given the very high polymerization efficiency of Lucirin
TPO, its concentration could probably be reduced, thereby improving depth of cure. As
for the additional decrease of depth of cure in filled materials, it is probably related to an
increased light scattering at the shorter wavelengths that correspond with the effective
absorption of Lucirin TPO (Price and Felix, 2009). However, the effective spectral
irradiance of the curing-unit in the absorption range of Lucirin TPO is several times
lower than that of camphoroquinone. As there is a correlation between irradiance and
depth of cure (Lindberg et al., 2004), a higher depth of cure for Lucirin TPO-based
materials might be achieved using a higher intensity source emitting specifically around
400 nm.
2.3.6 Conclusion
In most cases, the implicit assumption of exposure reciprocity law was not
upheld. Exposure reciprocity relies on the extent of monomolecular termination of the
curing material, which is directly affected by molar absorptivity, quantum yield
efficiency, material viscosity and temperature. However, while the validity of this law
appears far from systematic, there is a clear interest to consider its global relevance to
clinical practice and the potential of significant time reduction using modern high-
irradiance curing lights. From this work, it appears that this potential clearly depends on
the photoinitiator type, as Lucirin TPO-based materials reach higher DCMax
than
camphoroquinone-based materials at similar or even half radiant exposure. However, the
problem of low depth of cure of Lucirin TPO-based materials still has to be addressed.
For camphoroquinone-based systems, filler content has an impact on the efficiency of
high irradiance modes, probably due to decreased local mobility of monomers. This
underlines the necessity to adapt curing protocols according to the material filler content,
which is of prime interest for clinicians.
112
2.4 Summary
The aim of this chapter was to investigate the reason why in some cases exposure
reciprocity is verified whilst in others it is not and to investigate the possibility of reduced
curing time based on radiant exposure.
Manufacturers of RBCs typically produce flowable materials either by reducing
the filler percentage used in the high viscosity versions or by increasing the amount of
diluent monomer used, both of which are likely to affect the kinetics of polymerization.
Five commercial resin composite materials (Venus; Heraeus Kulzer, Synergy D6;
Coltene, Premis; Kerr, Grandio; Voco and Gradia; GC Corp) and their counterpart
flowable versions were tested (Section 2.1). The materials were irradiated at various
combinations of irradiance and time so that they received a total radiant exposure of 18
J/cm2. The majority of the higher viscosity resin composite paste materials exhibited
similar degree of conversion regardless of curing protocol. However, a significant
decrease in degree of conversion for specimens cured at 3000 mW/cm2 for 6 s compared
with 400 mW/cm2 for 45 s was observed for flowable materials, Grandio (41 ± 0.36 and
62 ± 1.15 %, respectively) and Venus (44 ± 0.44 and 67 ± 0.44 % respectively).
Conversely, other flowable materials exhibited little or no significant difference between
curing modes. The validity of exposure reciprocity and the extent of conversion depend
on several factors amongst which resin viscosity and filler content are important factors
in determining radical termination pathway. Bi-radical termination pathways are expected
to be dominant when system mobility is high and therefore reciprocity is expected to fail.
However, as reciprocity was verified for some low viscosity materials, it was suggested
that the extent of bi-radical terminations depends upon the local viscosity (i.e. the resins
between the fillers) and not the macroscopic viscosity. Consequently, the problem of
partly unknown composition limits the analysis of commercial materials. Therefore, to
further understand such an effect, exposure reciprocity was investigated in model systems
comprising of Bis-GMA/TEGDMA ratios of 70/30, 60/40, 50/50, 40/60 and 30/70
mass%, respectively (Section 2.2). The resins were tested either unfilled (UF) or filled
with silanated barium glass fillers and fumed silica to 30/10 vol% (Low Fill, LF), and
50/10 vol% (High Fill, HF) respectively. The model composites were tested under the
113
hypothesis that if reciprocity held for the parent resins then it should also hold for the
composites, i.e low viscosity resins are expected to fail reciprocity (Feng and Suh, 2007)
regardless of whether they are filled or not. For UF resins, the differences in degree of
conversion between the highest and lowest irradiation modes were greater for the low
viscosity resins and degree of conversion was more dependent upon irradiation mode
rather than resin type. The opposite occurred for the LF and HF counterparts where resin
type became more influential. Therefore, it was suggested that the viscosity of the system
determines how radicals are terminated. When the system viscosity is low, bi-radical
termination occurs and polymer conversion becomes more dependent on exposure time
but when the viscosity is high, a monomolecular termination pathway dominates and
polymer conversion can rely, to a greater extent, on a reciprocal relationship between
irradiance and time. Although the constituents of the resin matrix play a major role in the
polymerization kinetics, it is evident that the fillers have a significant affect as they
restrict mobility to a relatively small volume and increase the probability of a
monomolecular termination pathway. Evidently bi-radical terminations even occur in
highly filled composites with low local viscosities and therefore reciprocity cannot be
verified.
However, not all flowable composites are manufactured in the same way and
there exists scenarios where reciprocity can be verified even with low resin viscosities
(Section 2.3). The use of alternative photoiniators such as Lucirin TPO seems an
interesting approach in terms of controlling polymerization kinetics as reactivity and
efficiency is significantly greater when compared to camphoroquinone. Although inferior
depth of cure may be a problem with such initiators, this may be overcome by improving
optical properties with appropriate filler adaptation or by using camphoroquinone
synergistically. As such, the optical properties of RBC materials will be investigated in
Chapter 3 of this thesis.
In conclusion, the current chapter highlights the importance of manufacturers to
divulge the composition of their materials to some extent in order to select adequate
curing protocols which may reduce the occurrence of under-cured restorations. Also, the
findings presented here may help the design of novel materials that allow high irradiance
curing at reduced time which will benefit both the dentist and the patient.
114
References
Asmussen E and Peutzfeldt A. Polymerization contraction of resin composite vs.
energy and power denstity of light-cure. European Journal of Oral Science, 2005;
113:417-421.
Beun S, Bailly C, Dabin A, Vreven J, Devaux J, Leloup G. Rheological properties of
experimental Bis-GMA/TEGDMA flowable resin composites with various
macrofiller/microfiller ratio. Dental Materials, 2009; 25:198-205.
Christensen GJ. Curing restorative resin: A significant controversy. Journal of
American Dental Association, 2000; 131: 1067-1069
Cook WD. Photopolymerisation kinetics of dimethacrylates using the
camphoroquinone/amine initiator system. Polymer, 1992; 33: 600-609
D‟alphino PHP, Svizero NR, Pereira JC, Rueggeberg FA, Carvalho RM, Pashley DH.
Influence of light curing sources on polymerisation reaction kinetics of a restorative
system. American Journal of Dentistry, 2007; 20: 46-52
Decker C. Kinetic study and new application of UV radiation curing.
Macromolecular. Rapid Communications, 2002; 23: 1067-1093
Dewaele M, Asmussen E, Peutzfeldt A, Munksgaard EC, Benetti AR, Finné G,
Leloup G, Devaux J. Influence of curing protocol on selected properties of light-
curing polymers: degree of conversion, volume contraction, elastic modulus, and
glass transition temperature. Dental Materials, 2009; 25:1576-1584
Emami N and Söderholm KJ. How light irradiance and curing time affect monomer
conversion in light-cured resin composites. European Journal of Oral Science, 2003;
111:536-542.
Emami N, Soderholm k-JM. Influence of light-curing procedures and photo-
initiator/co-initiator composition on the degree of conversion of light-curing resins.
Journal of Material Science: Materials in Medicine, 2005; 16:47-52
Feng L, Carvalho R, Suh BI. Insufficient cure under the condition of high irradiance
and short irradiation time. Dental Materials, 2009; 25: 283-289
Feng L, Suh BI. Exposure reciprocity law in photopolymerization of multi-functional
acrylates and methacrylates. Macromolecular Chemistry and Physics, 2007; 208:295-
306.
Ferracane JL. Hygroscopic and hydrolytic effects in dental polymer networks. Dental
Materials, 2006; 22: 211-222
Halvorson RH, Erickson RL, Davidson CL. Energy dependent polymerization of
resin-based composite. Dental Materials, 2002; 18:463-469.
115
Hansen EK, Asmussen E. Correlation between depth of cure and temperature rise of
light-activated resin. Scandinavian Journal of Dental Research, 1993; 101: 176-179
Ilie N and Hickel R. Can CQ be completely replaced by alternative initiators in dental
adhesives? Dental Materials Journal, 2009; 27: 1-8.
Jiménez-Planas A, Martin J, Abalos C, and Llamas R. Developments in
polymerization lamps. Quintessence International, 2008; 39: e74-84
Krämer N, Lohbauer U, Garcia-Godoy F, and Frankenberger R. Light curing of resin
based composites in the LED era. American Journal of Dentistry, 2008; 21: 135-142
Lee J-H, Um C-M, Lee I-B, Rheological properties of resin composites according to
variations in monomer and filler compositions. Dental Materials, 2006; 22: 515-526
Leprince J, Devaux J, Mullier T, Vreven J, Leloup G. Pulpal-temperature rise and
polymerisation efficiency of LED curing lights. Operative Dentistry, 2010a; 35: 220-
230
Leprince J, Lamblin G, Devaux J, Dewaele M, Mestdagh M, Palin WM, Gallez B,
Leloup G. Irradiation Modes‟ impact on radical entrapment in photoactive resins. J
Dental Research 2010b, 89: 1494-1498.
Leprince J, Lamblin G, Truffier-Boutry D, Demoustier-Champagne S, Devaux J,
Mestdagh M, Leloup G. Kinetic study of free radicals trapped in dental resins stored
in different environments. Acta Biomaterialia, 2009; 5:2518-2524
Lindberg A, Peutzfeldt A, van Dijken JW. Curing depths of a universal hybrid and a
flowable resin composite cured with quartz tungsten halogen and light-emitting diode
units. Acta Odontologica Scandinavica, 2004; 62:97-101.
Lloyd CH, Joshi A, McGlynn E. Temperature rise produced by light sources and
composites during curing. Dental Materials, 1986; 2: 170-174
Lovell LG, Lu, H, Elliot JE, Stansbury JW, Bowman CN. The effect of cure rate on
mechanical properties of dental resins. Dental Materials, 2001; 17: 504-511
Lovell LG, Newman SM, Donaldson MM, Bowman CN. The effect of light intensity
on double bond conversion and flexural strength of a model, unfilled dental resin.
Dental Materials, 2003; 19: 458-465
Mackenzie L, Shortall ACC and Burke FJT. Direct posterior composites: A practical
guide. Dental Update, 2009; 36: 71-95
Musanje L and Darvell BW. Polymerization of resin composite restorative materials:
exposure reciprocity. Dental Materials, 2003; 19:531-541.
116
Neumann MG, Miranda WG Jr, Schmitt CC, Rueggeberg FA, Correa IC. Molar
extinction coefficients and the photon absorption efficiency of dental photoinitiators
and light curing units. Journal of Dentistry, 2005; 33:525-532.
Neumann MG, Schmitt CC, Ferreira GC, Correa IC. The initiating radical yields and
the efficiency of polymerization for various dental photoinitiators excited by different
light curing units. Dental Materials, 2006; 22:576-584.
Neumann MG, Schmitt CC, Horn MA Jr. The effect of the mixtures of photoinitiators
in polymerization efficiencies. Journal of Applied Polymer Science, 2009; 112:129-
134.
Nomoto R, Uchida K, Hirasawa T. Effect of light intensity on polymerization of light-
cured composite resins. Dental Materials Journal, 1994; 13:198-205.
Ogunyinka A, Palin WM, Shortall AC and Marquis PM. Photoinitiation chemistry
affects light transmission and degree of conversion of curing experimental dental
composites. Dental Materials, 2007; 23: 807-813.
Palin WM, Senyilmaz DP, Marquis PM, Shortall AC. Cure width potential for MOD
resin composite molar restorations. Dental Materials, 2008; 24:1083-1094.
Panankis D, Watts DC. Incorporation of the heating effect of the light source in a non-
isothermal model of a visible-light-cured resin composite. Journal of Material
Science, 2000; 35: 4589-4600
Peutzfeldt A and Asmussen E. Resin composite properties and energy density of light
cure. Journal of Dental Research, 2005; 84:659-662.
Price RB, Felix CA . Effect of delivering light in specific narrow bandwidths from
394 to 515nm on the micro-hardness of resin composites. Dental Materials, 2009;
25:899-908.
Price RB, Felix CA, Andreou P. Effects of resin composite composition and
irradiation distance on the performance of curing lights. Biomaterials, 2004; 25:4465-
4477.
Sakaguchi RL and Ferracane JL. Effect of light power density on development of
elastic modulus of a model light-activated composite during polymerization. Journal
of Esthethic Restorative Dentistry, 2001; 13:121-130.
Santini A. Current status of visible light activation units and the curing of light-
activated resin-based composite materials. Dental Update, 2010; 37: 214-227
Shortall AC, Palin WM, and Burtscher P. Refractive index mismatch and monomer
reactivity influence composite curing depths. Journal of Dental Research, 2008; 87:
84-88.
117
Shortall AC, Wilson HJ, Harrington E. Depth of cure of radiation-activated composite
restoratives - influence of shade and opacity. Journal of Oral Rehabilitation, 1995;
22:337-342.
Stansbury JW and Dickens SH. Determination of double bond conversion in dental
resins by near infrared spectroscopy. Dental Materials, 2001; 17: 71-79
Stephenson Kenning N, Ficek BA, Hoppe CC, Scranton AB. Spatial and temporal
evolution of the photoinitiation rate for thick polymer systems illuminated by
polychromatic light : selection of efficient photoinitiators for LED or mercury lamps.
Polymer International, 2008; 57:1134-1140.
Taira M, Urabe H, Hirose T, Wakasa K, Yamaki M. Analysis of photo-initiators in
visible-light-cured dental composite resins. Journal of Dental Research, 1988; 67: 24.
Truffier-Boutry D, Demoustier-Champagne S, Devaux J, Biebuyck JJ, Mestdagh M,
Larbanois P, Leloup G.A physico-chemical explanation of the post-polymerization
shrinkage in dental resins. Dental Materials, 2006; 22:405-412.
Uhl A, Volpel A, Sigusch BW. Influence of heat from light curing units and dental
composite polymerisation on cells in vitro. Journal of Dentistry, 2006; 34: 298-306
Yoshida K, Greener EH. Effect of photoinitiator on degree of conversion of unfilled
light-cured resin. Journal of Dentistry, 1994; 22: 296-99.
CHAPTER 3
Optical Phenomena of Photoactive Dental Resins
118
3.0 Optical Phenomena of Photoactive Dental Resins
The demand for filling materials to match the aesthetic quality of natural teeth has
vastly increased in popularity over the last few decades. However, the durability of large
„white‟-fillings or resin-based composites (RBCs) in posterior load bearing applications
is generally considered to be inferior to „silver‟-filling types (dental amalgams). This
shortcoming may be related to both the increased number of technique sensitive
application steps the dentist has to perform when restoring the tooth as well as any
inherent shortcomings of a quasi-brittle solid compared with amalgam alloy materials.
The placement of modern light activated RBCs is limited to approximately 2 mm
increments which are cured „on command‟ with high intensity blue light following the
application and polymerisation of a bonding system Therefore, to fill large cavities,
adhesives and multiple increments are required, which increases procedure time and cost
when compared with placing dental amalgam which can be filled in bulk. Chapter 2 of
this thesis investigated the potential of high irradiance curing protocols to reduce
procedure time and cost. Another interesting approach to reduce procedure time is to
improve depth of cure, which will reduce the number of technique sensitive steps.
Consequently, the development of RBCs with improved light transmission through depth
is highly desirable which may improve depth of cure and reduce placement time.
The dynamic change in optical properties of RBCs is not well understood. Optical
properties can be controlled through photoinitiator chemistry (Section 3.1) and also by
altering the components of the resin matrix (Section 3.2), and therefore it may be possible
to alter the extent to which the curing light is transmitted through the material. As RBCs
cure, the photoinitiator decomposes and the resin components become denser and shrink.
Consequently changes in optical properties occur. Shrinkage vectors are dependent upon
several factors, amongst which material composition and cavity constraint are important.
As shrinkage will affect light transmission, dynamic optical properties of the curing light
may differ according to specimen geometry (Section 3.3). Therefore chapter aims to gain
a better understanding of optical properties, which may provide a platform with which to
improve cure depth, reduce procedure time and potentially improve clinical durability
and success of such materials.
119
3.1 Competitive Light Absorbers in Photoactive Resin-Based
Materials††‡‡
3.1.1 Abstract
The aim of this Section is to characterise real time photoinitiator absorption
properties of “white” Lucirin TPO and “yellow” camphoroquinone and to assess their
influence on polymer discolouration. Resin formulations (50:50 Bis-GMA/TEGDMA
mass %) contained low (0.0134 mol/dm3), intermediate (0.0405 mol/dm3) or high
(0.0678 mol/dm3) concentrations of the photoinitiators camphoroquinone or Lucirin TPO
and the inhibitor BHT at 0, 0.1 or 0.2% by mass. Disc shaped specimens (n=3) of each
resin were cured for 60 s using a halogen light curing unit (~800 mW/cm2). Dynamic
measurements of photoinitiator absorption, degree of conversion (DC)/ curing kinetics
and reaction temperature were performed on curing resins. A spectrophotometer was used
to measure CIELAB co-ordinates of each specimen before and after cure. Statistical
analyses were performed using a general linear model (GLM) three-way analysis of
variance (ANOVA) with photoinitiator (2 levels), photoinitiator concentration (3 levels)
and BHT percentage (3 levels) as the independent variables. Supplementary one-way
ANOVA and post-hoc Tukey tests (p=0.05) were also performed. The GLM of all
independent variables revealed significant differences (p<0.001) where photoinitiator
concentration (df=2; F=618.83) > photoinitiator type (df=1; F=176.12) > % BHT (df=2,
F=13.17). BHT affected kinetics but consequently produced lower conversion in some of
the camphoroquinone-based resins. Significant differences between photoinitiator type
and concentrations were seen in colour (Lucirin TPO resins became yellow and
camphoroquinone became less yellow). Reaction temperature, kinetics and conversion
were also significantly different for both initiators (P<0.001). Despite Lucirin-TPO-based
resins producing a visually perceptible colour change on cure, the colour change was
significantly lower than that produced in camphoroquinone-based resins.
††
Hadis MA, Shortall AC and Palin WM. Competetive light absorbers in photoactive dental
materials. Submitted to Acta Biomaterialia.
‡‡
Winner of the Heraeus Kulzer Travel award for innovation in materials testing. International
Association of Dental Research, Barcelona, 2010.
120
3.1.2 Introduction
Over the last decade, the significant increase in the use of photo-active RBCs over
dental amalgams in restorative dentistry is primarily due to patients aesthetic demands,
the dentists material preference to use RBCs and environmental concerns and
government legislations (Burke, 2004). The development of RBCs has continued since
they were first introduced several decades ago with much research being carried out in
order to improve the setting reaction and photoinitiator chemistry (the primary absorber
of light in RBCs) (Yoshida and Greener, 1994; Rueggeberg et al., 1997; Halvorson et al.,
2002; Jakubiak et al., 2003; Neumann et al., 2005; Neumann et al., 2006; Ogunyinka et
al., 2007; Musanje et al., 2009) as-well as mechanical properties (Kahler et al., 2008;
Curtis et al., 2009).
The α-diketone, camphoroquinone is the most widely and successfully used
photoinitiator in RBC materials (Stansbury, 2000; Jakubiak et al., 2003) and has a distinct
yellow tint, which does not bleach fully upon irradiation. Such discolouration may reduce
aesthetic quality (Rueggeberg et al., 1997; Suh, 1999; Brackett et al., 2007) and affect
light transport through material thickness. Furthermore, the use of camphoroquinone also
requires amine co-initiators such as dimethylamino ethyl methacrylate (DMAEMA) to
efficiently produce free radicals to initiate polymerisation. The use of such co-initiators is
known to produce coloured reaction by-products in the presence of light or heat
(Asmussen, 1985). Any colouring by the photoinitiators will inevitably reduce aesthetic
quality and cause problems in colour matching to natural teeth (Alvim et al., 2007).
Despite this, the camphoroquinone/amine system remains the most widely used
photoinitiator system in photoactive dental RBCs although more recently alternative
“colourless” photoinitators have been introduced which may be based on either iodinium
salts (Weinmann et al., 2005), onium compounds (Shin and Rawis, 2009) or Norrish
Type I photoinitiator systems such as acylphosphine oxides (Neumann et al., 2005; Illie
and Hickel, 2005; Neumann et al., 2006). Some of these types of photoinitiators have
recently been used by manufacturers either synergistically with camphoroquinone or as a
stand alone photoinitiator system, which may improve polymerisation kinetics (Chapter
121
2), mechanical properties and aesthetic quality (Park et at., 1999; Weinmann et al., 2005;
Neumann et al., 2006; Shin and Rawis, 2009).
Free-radical polymerisation of methacrylate monomers used in dental RBCs is
initiated by the excitation of suitable photoinitiator systems by light despite the monomer
itself being capable of forming reactive species although this is deemed inefficient (Sun
and Chae, 2000; Shin and Rawis, 2009). The photoinitiator chemistry affects light
transmission, polymerisation kinetics and overall conversion of monomer to polymer thus
affecting material properties (Yoshida and Greener, 1994; Rueggeberg et al., 1997;
Ogunyinka et al., 2007; Musanje et al., 2009). It is well known that an increase in the
amount of photoinitiator in composite resins or an increase in the spectral overlap
between the light curing unit and the initiating system (i.e. synergistically using more
than one photoinitiator) improves polymerisation kinetics, aesthetics, mechanical and
biological properties (Rueggeberg et al., 1997; Park et al., 1999). However, there exists
an optimal level above which any increase in photoinitiator does not benefit final
conversion (Yoshida and Greener, 1994; Musanje et al, 2009) and aesthetic quality may
be compromised in the case of pigmented photoinitiators.
The increased demand for aesthetic quality has introduced the use of alternative
colourless photoinitiators, which may provide the potential for improved aesthetic (Price
and Felix, 2009) and curing efficiency (Chapter 2; Neumann et al., 2005; Neumann et al.,
2006). Furthermore, photoinitiators based on acylphosphine oxides such as Lucirin TPO
(2,4,6-trimethylbenzoyl-diphenylphosphine oxide) do not require the use of amine
accelerators, which further increases the potential for aesthetic quality. The
photochemical cleavage of the carbon phosphorus bond in such molecules leads to the
formation of two free radical intermediates, which can initiate polymerisation without the
need for additional amine accelerators (Neumann et al., 2006).
Camphoroquinone has an absorption range from 400-500nm with a maximum
excitation wavelength of 470nm. Consequently, most light curing units are adapted for
the excitation of camphoroquinone. Lucirin TPO seems to be an interesting molecule
despite its shorter wavelength absorption range since its higher molar absorptivity may
provide greater efficiency to cure dental resins (Chapter 2; Neumann et al, 2005;
Neumann et al., 2006). Moreover, recent work has highlighted the potential of Lucirin
122
TPO-based (unfilled) polymers to be cured in thick layers (Stephenson Kenning et al.,
2008). However, in Section 2.3 it was suggested that inferior cure depth in resins and
RBCs containing Lucirin TPO when compared to camphoroquinone based materials may
be related to inefficient light transmission at depth. Additionally, the use of this initiator
is not compatible with most conventional light emitting diode (LED) light curing units,
which have an emission range between 450-500nm. Several manufacturers have now
introduced so-called third generation dual wavelength LED units by combining LEDs
with two different wavelengths that are capable of exciting alternative photoinitiators
(Illie and Hickel, 2008).
Consequently, the aim of this study was to analyse the photo-absorption
characteristics and photo-bleaching characteristics of camphoroquinone and Lucirin TPO
throughout cure using a dynamic spectroscopy technique, which may have some
significance to improving light transmission and the perceived improvement of aesthetic
quality using alternative, non-yellowing photoinitiator systems. The two hypotheses that
were tested were:
i) Camphoroquinone will exhibit a decrease in yellowing throughout and
following cure
ii) Lucirin TPO will not result in a significant change in colour during or
following cure.
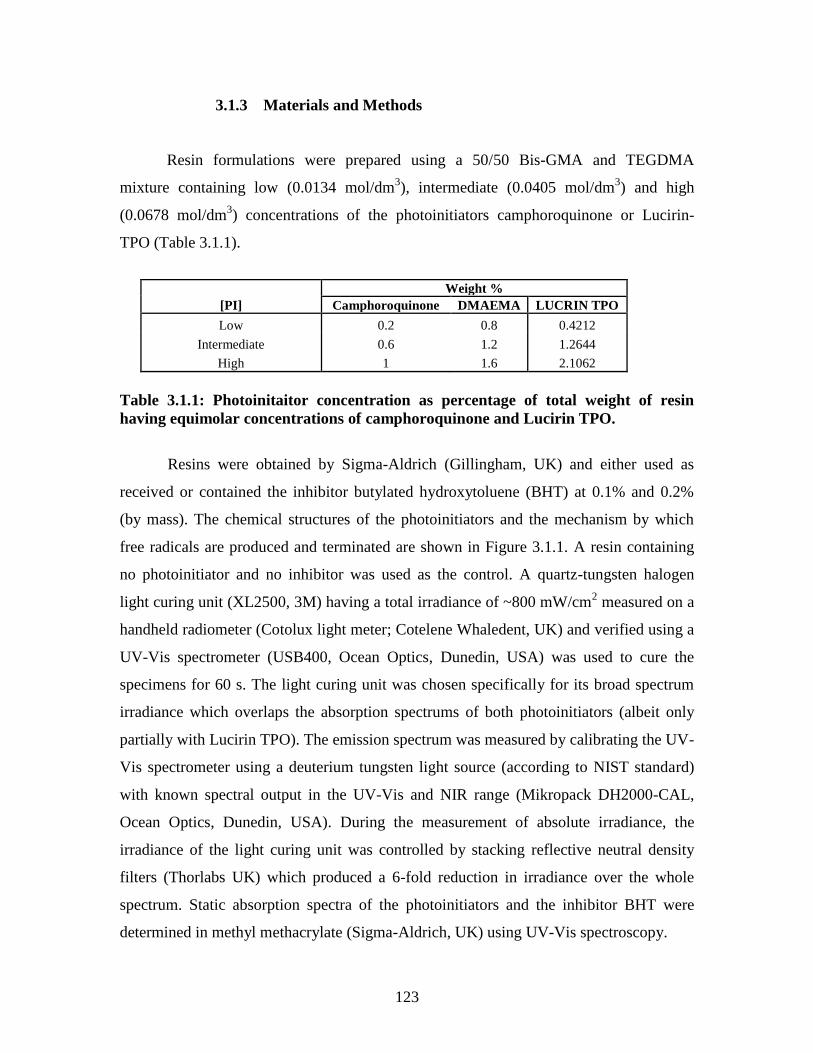
123
3.1.3 Materials and Methods
Resin formulations were prepared using a 50/50 Bis-GMA and TEGDMA
mixture containing low (0.0134 mol/dm3), intermediate (0.0405 mol/dm
3) and high
(0.0678 mol/dm3) concentrations of the photoinitiators camphoroquinone or Lucirin-
TPO (Table 3.1.1).
[PI]
Weight %
Camphoroquinone DMAEMA LUCRIN TPO
Low 0.2 0.8 0.4212
Intermediate 0.6 1.2 1.2644
High 1 1.6 2.1062
Table 3.1.1: Photoinitaitor concentration as percentage of total weight of resin
having equimolar concentrations of camphoroquinone and Lucirin TPO.
Resins were obtained by Sigma-Aldrich (Gillingham, UK) and either used as
received or contained the inhibitor butylated hydroxytoluene (BHT) at 0.1% and 0.2%
(by mass). The chemical structures of the photoinitiators and the mechanism by which
free radicals are produced and terminated are shown in Figure 3.1.1. A resin containing
no photoinitiator and no inhibitor was used as the control. A quartz-tungsten halogen
light curing unit (XL2500, 3M) having a total irradiance of ~800 mW/cm2 measured on a
handheld radiometer (Cotolux light meter; Cotelene Whaledent, UK) and verified using a
UV-Vis spectrometer (USB400, Ocean Optics, Dunedin, USA) was used to cure the
specimens for 60 s. The light curing unit was chosen specifically for its broad spectrum
irradiance which overlaps the absorption spectrums of both photoinitiators (albeit only
partially with Lucirin TPO). The emission spectrum was measured by calibrating the UV-
Vis spectrometer using a deuterium tungsten light source (according to NIST standard)
with known spectral output in the UV-Vis and NIR range (Mikropack DH2000-CAL,
Ocean Optics, Dunedin, USA). During the measurement of absolute irradiance, the
irradiance of the light curing unit was controlled by stacking reflective neutral density
filters (Thorlabs UK) which produced a 6-fold reduction in irradiance over the whole
spectrum. Static absorption spectra of the photoinitiators and the inhibitor BHT were
determined in methyl methacrylate (Sigma-Aldrich, UK) using UV-Vis spectroscopy.
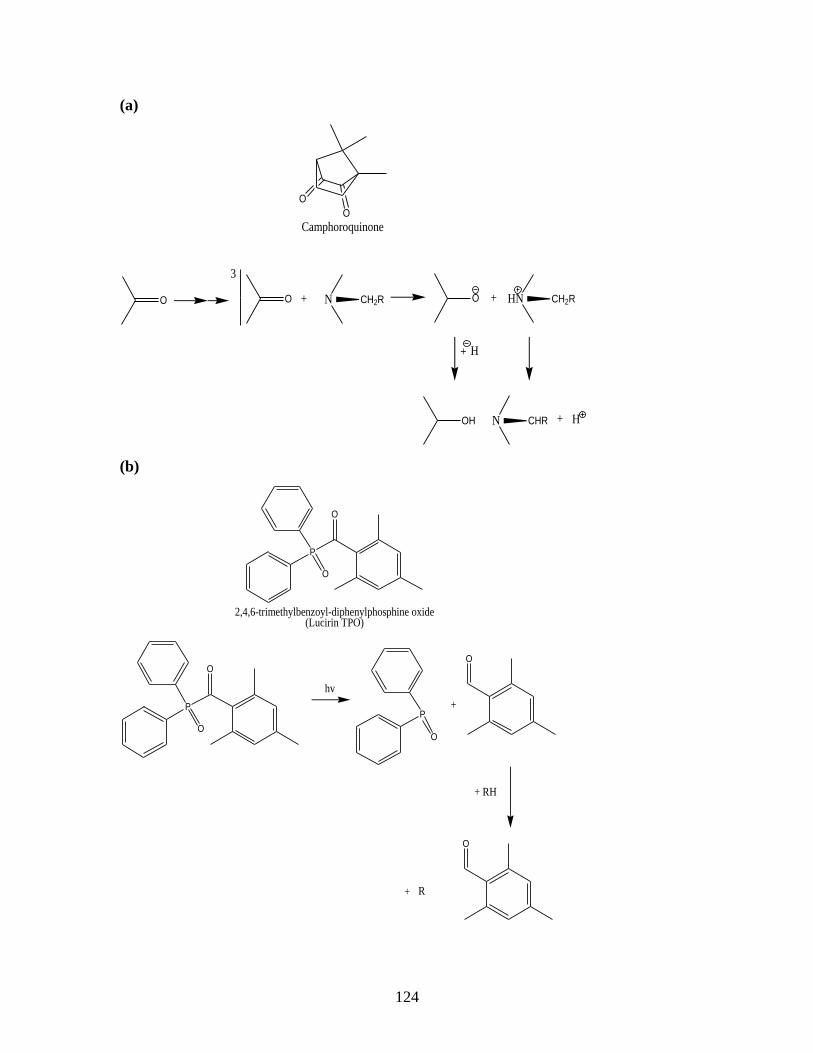
124
(a)
O
O
Camphoroquinone
O
3
O + N CH2R O + HN CH2R
OH N CHR + H
+ H
(b)
P
O
O
2,4,6-trimethylbenzoyl-diphenylphosphine oxide(Lucirin TPO)
P
O
O
hv
P
O
+
O
+ RH
O
+ R
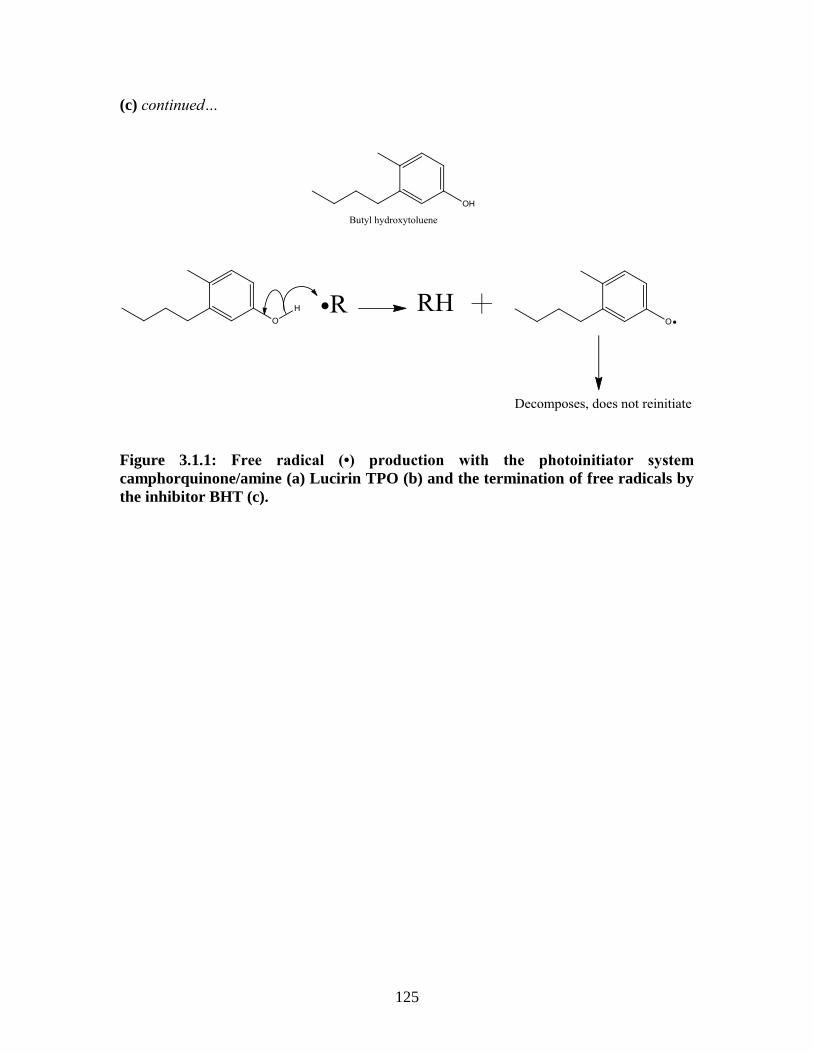
125
(c) continued…
Figure 3.1.1: Free radical (•) production with the photoinitiator system
camphorquinone/amine (a) Lucirin TPO (b) and the termination of free radicals by
the inhibitor BHT (c).
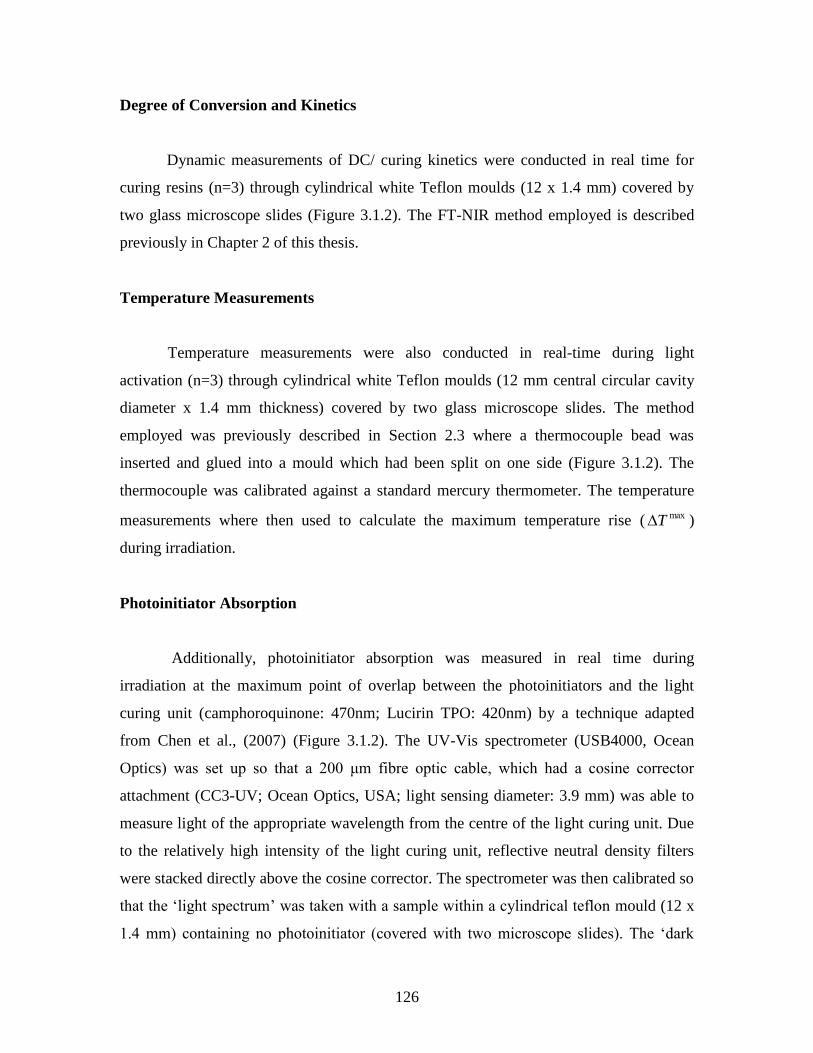
126
Degree of Conversion and Kinetics
Dynamic measurements of DC/ curing kinetics were conducted in real time for
curing resins (n=3) through cylindrical white Teflon moulds (12 x 1.4 mm) covered by
two glass microscope slides (Figure 3.1.2). The FT-NIR method employed is described
previously in Chapter 2 of this thesis.
Temperature Measurements
Temperature measurements were also conducted in real-time during light
activation (n=3) through cylindrical white Teflon moulds (12 mm central circular cavity
diameter x 1.4 mm thickness) covered by two glass microscope slides. The method
employed was previously described in Section 2.3 where a thermocouple bead was
inserted and glued into a mould which had been split on one side (Figure 3.1.2). The
thermocouple was calibrated against a standard mercury thermometer. The temperature
measurements where then used to calculate the maximum temperature rise ( maxT )
during irradiation.
Photoinitiator Absorption
Additionally, photoinitiator absorption was measured in real time during
irradiation at the maximum point of overlap between the photoinitiators and the light
curing unit (camphoroquinone: 470nm; Lucirin TPO: 420nm) by a technique adapted
from Chen et al., (2007) (Figure 3.1.2). The UV-Vis spectrometer (USB4000, Ocean
Optics) was set up so that a 200 μm fibre optic cable, which had a cosine corrector
attachment (CC3-UV; Ocean Optics, USA; light sensing diameter: 3.9 mm) was able to
measure light of the appropriate wavelength from the centre of the light curing unit. Due
to the relatively high intensity of the light curing unit, reflective neutral density filters
were stacked directly above the cosine corrector. The spectrometer was then calibrated so
that the „light spectrum‟ was taken with a sample within a cylindrical teflon mould (12 x
1.4 mm) containing no photoinitiator (covered with two microscope slides). The „dark
127
spectrum‟ was then taken by blocking any light reaching the optical fibre. The distance
between the top of the sample and the light curing unit was kept to 1 mm, which
facilitated the use of a shutter. A shutter was used as preliminary studies identified
fluctuations in light intensity during the first 10 s of activation and therefore the light was
activated for 10 s before the shutter was removed to start both calibration and sample
measurements. For sample measurements, real time absorbance was recorded using
Spectrasuite software during irradiation of the sample.
Colour Analysis
A spectrophotometer (CM-2600d; Konica, Minolta, UK) was used to measure the
tristimulus values of the International Commission on Illumination (CIELAB) values
based on D65 standard illuminant and a 10-degree observer. The tristimulus values
represent the amount of three primary stimuli (red, green and blue) required to give
colour match with the colour stimulus. The spectrophotometer was first calibrated against
a standard white tile provided by the manufacturer of the spectrophotometer. Colour
measurements were made before and after real time photoiniator absorption
measurements (described above). The measurements were made whilst the samples were
contained within the moulds and the glass microscope slides but were placed on top of a
white ceramic backing tile before each measurements. The CIELAB values obtained
included specular gloss (SCI) as the specular port was covered with a diffuse white
material and specular gloss was reflected back into the the integrating sphere. From these
values, the colour change was calculated according to the following equation:
2*
1
*
2
2*
1
*
2
2*
1
*
2 )()()( bbaaLLE
128
Statistical Analysis
Statistical analyses were performed on the maxDC , max
pR , maxT , E (change in
colour) and b (the change in b-value of the CIELAB co-ordinates) and data sets using a
general linear model (GLM) three-way analysis of variance (ANOVA) with
photoinitiator (2 levels), photoinitiator concentration (3 levels) and BHT concentration (3
levels) as the independent variables. Supplementary one-way ANOVA and post-hoc
Tukey tests (P=0.05) were also undertaken.
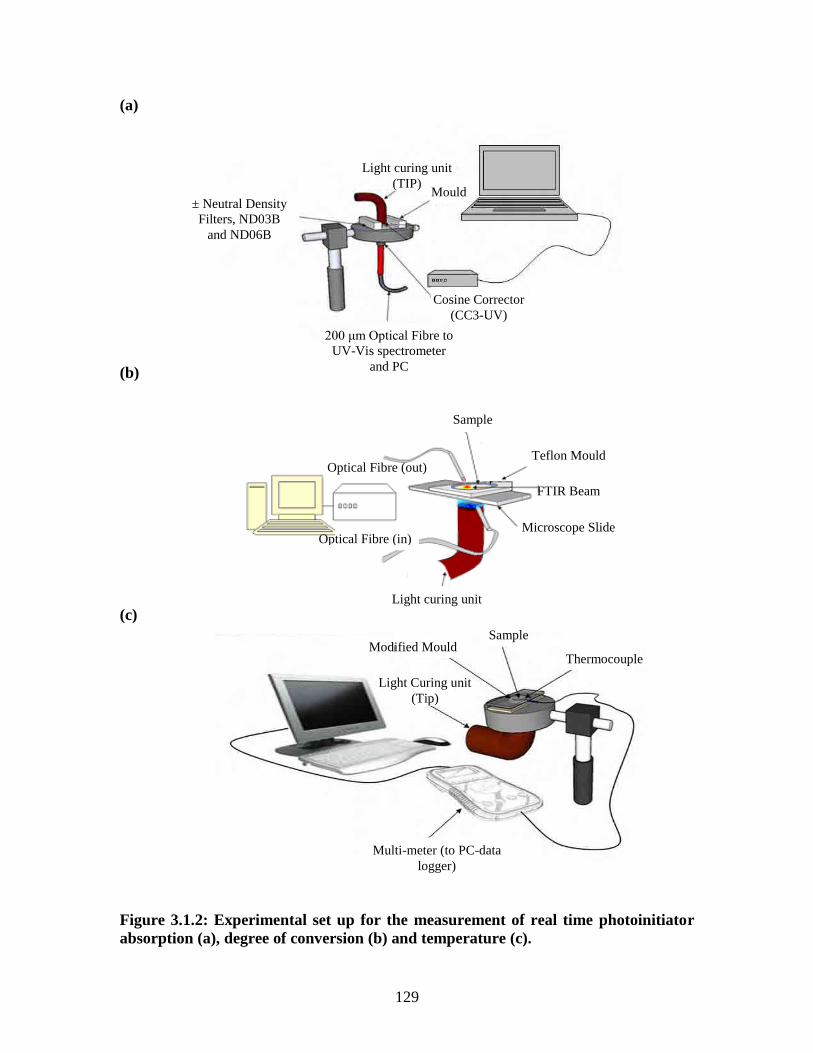
129
(a)
(b)
(c)
Figure 3.1.2: Experimental set up for the measurement of real time photoinitiator
absorption (a), degree of conversion (b) and temperature (c).
Multi-meter (to PC-data
logger)
Light Curing unit
(Tip)
Sample Modified Mould
Thermocouple
Sample
Teflon Mould
FTIR Beam
Microscope Slide
Light curing unit
Optical Fibre (out)
Optical Fibre (in)
Light curing unit
(TIP) Mould
Cosine Corrector
(CC3-UV)
200 μm Optical Fibre to
UV-Vis spectrometer
and PC
± Neutral Density
Filters, ND03B
and ND06B
130
3.1.4 Results
Figure 3.1.3 presents a comparison between the absorption spectra of both
photoinitiators (camphoroquinone and Lucirin TPO), the inhibitor BHT and the emission
spectra of the XL2500 light curing unit. The spectral emission of the light curing unit was
better adapted to camphoroquinone absorption, as a greater overlap of the two spectra
was evident although Lucirin TPO shows a significantly higher molar absorptivity at
max . The absorption range of BHT fell outside the emission range of the light curing unit
and absorbed in the UV region of the electromagnetic spectrum.
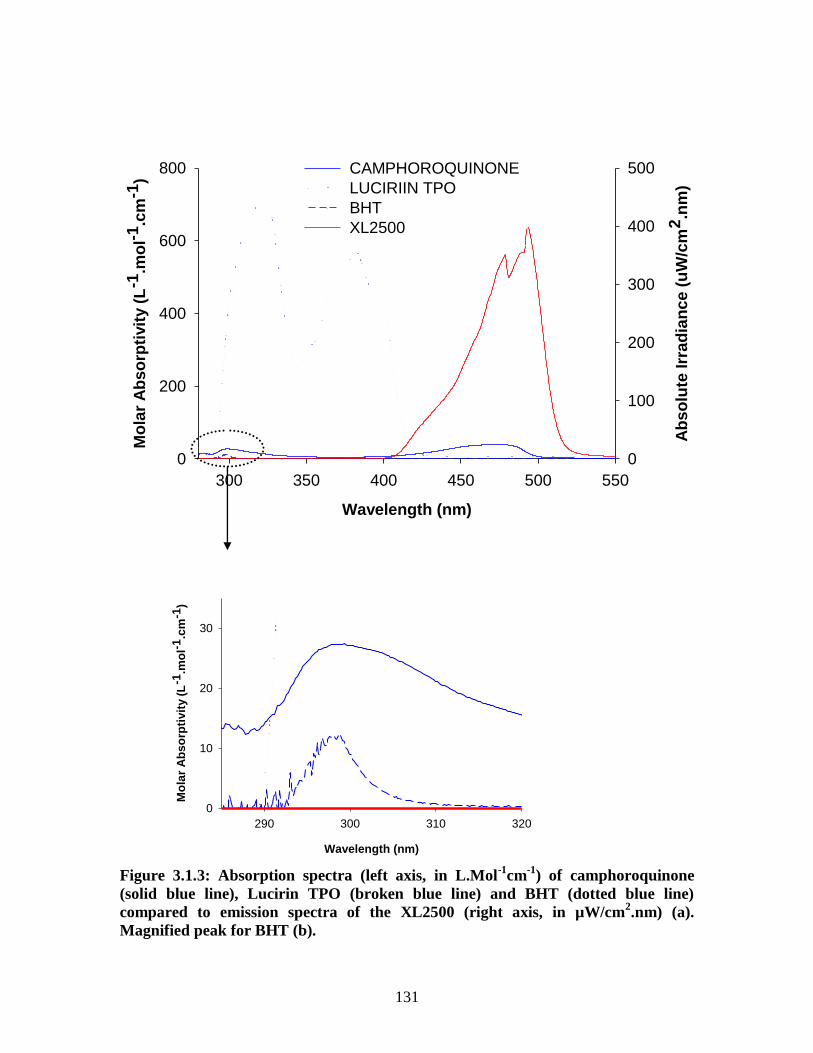
131
Wavelength (nm)
300 350 400 450 500 550
Mo
lar
Ab
so
rpti
vit
y (
L-1
.mo
l-1.c
m-1
)
0
200
400
600
800
Ab
so
lute
Irr
ad
ian
ce
(u
W/c
m2
.nm
)
0
100
200
300
400
500CAMPHOROQUINONE
LUCIRIIN TPO
BHT
XL2500
Wavelength (nm)
290 300 310 320
Mo
lar
Ab
so
rpti
vit
y (
L-1
.mo
l-1
.cm
-1)
0
10
20
30
Figure 3.1.3: Absorption spectra (left axis, in L.Mol-1
cm-1
) of camphoroquinone
(solid blue line), Lucirin TPO (broken blue line) and BHT (dotted blue line)
compared to emission spectra of the XL2500 (right axis, in µW/cm2.nm) (a).
Magnified peak for BHT (b).
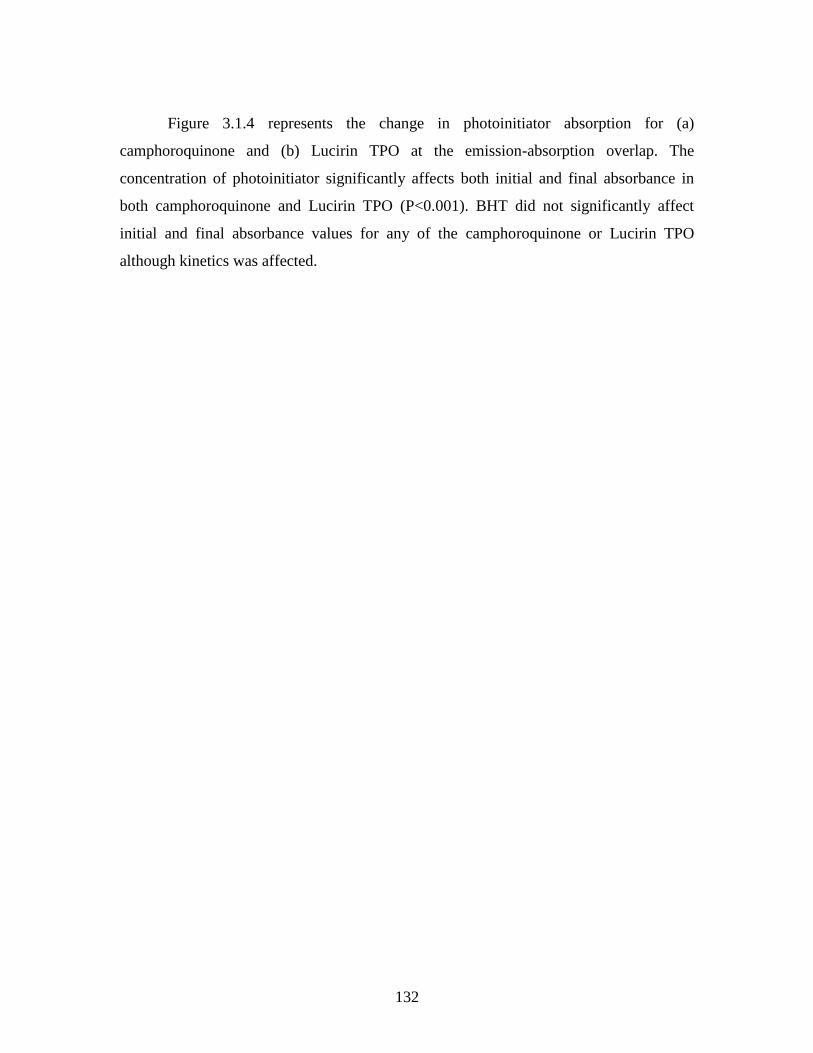
132
Figure 3.1.4 represents the change in photoinitiator absorption for (a)
camphoroquinone and (b) Lucirin TPO at the emission-absorption overlap. The
concentration of photoinitiator significantly affects both initial and final absorbance in
both camphoroquinone and Lucirin TPO (P<0.001). BHT did not significantly affect
initial and final absorbance values for any of the camphoroquinone or Lucirin TPO
although kinetics was affected.
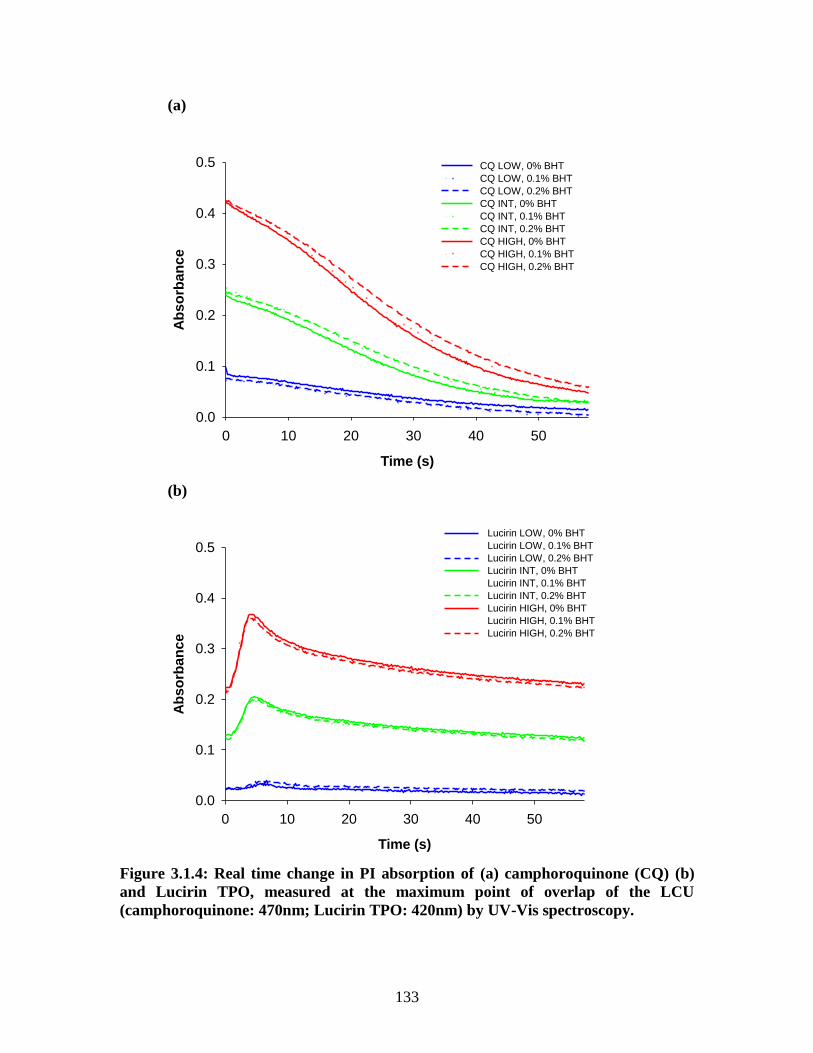
133
(a)
Time (s)
0 10 20 30 40 50
Ab
so
rban
ce
0.0
0.1
0.2
0.3
0.4
0.5 CQ LOW, 0% BHT
CQ LOW, 0.1% BHT
CQ LOW, 0.2% BHT
CQ INT, 0% BHT
CQ INT, 0.1% BHT
CQ INT, 0.2% BHT
CQ HIGH, 0% BHT
CQ HIGH, 0.1% BHT
CQ HIGH, 0.2% BHT
(b)
Time (s)
0 10 20 30 40 50
Ab
so
rba
nc
e
0.0
0.1
0.2
0.3
0.4
0.5Lucirin LOW, 0% BHT
Lucirin LOW, 0.1% BHT
Lucirin LOW, 0.2% BHT
Lucirin INT, 0% BHT
Lucirin INT, 0.1% BHT
Lucirin INT, 0.2% BHT
Lucirin HIGH, 0% BHT
Lucirin HIGH, 0.1% BHT
Lucirin HIGH, 0.2% BHT
Figure 3.1.4: Real time change in PI absorption of (a) camphoroquinone (CQ) (b)
and Lucirin TPO, measured at the maximum point of overlap of the LCU
(camphoroquinone: 470nm; Lucirin TPO: 420nm) by UV-Vis spectroscopy.
134
The GLM of all independent variables revealed significant differences (P<0.001)
where photoinitiator concentration (df=2; F=618.83) > photoinitiator type (df=1;
F=176.12) > % BHT (df=2, F=13.17). Separate one-way ANOVAs and post hoc-Tukey
tests (p<0.05) revealed significant overall differences for each separate response to
compare the effect of photoinitiator concentration and BHT concentrations within each
photoiniator group (Table 3.1.2). Camphoroquinone resins with similar BHT
concentrations revealed significantly higher E and b values as photoinitiator
concentration was increased which was related to the significantly higher b-values
(p<0.05) for both pre- and post irradiation (although b-values decreased upon irradiation
resulting in a negative b ). Similar trends were also observed for Lucirin TPO-based
resins although E and b (also related to the b-values) values significantly lower
(p<0.05) for all Lucirin TPO resins compared with camphoroquinone-based resins. For
Lucirin TPO resins, b values were positive as the b-value increased upon irradiation
(Table 3.1.3). Resins containing no photoinitiator showed no significant colour change so
E and b should be taken as zero.
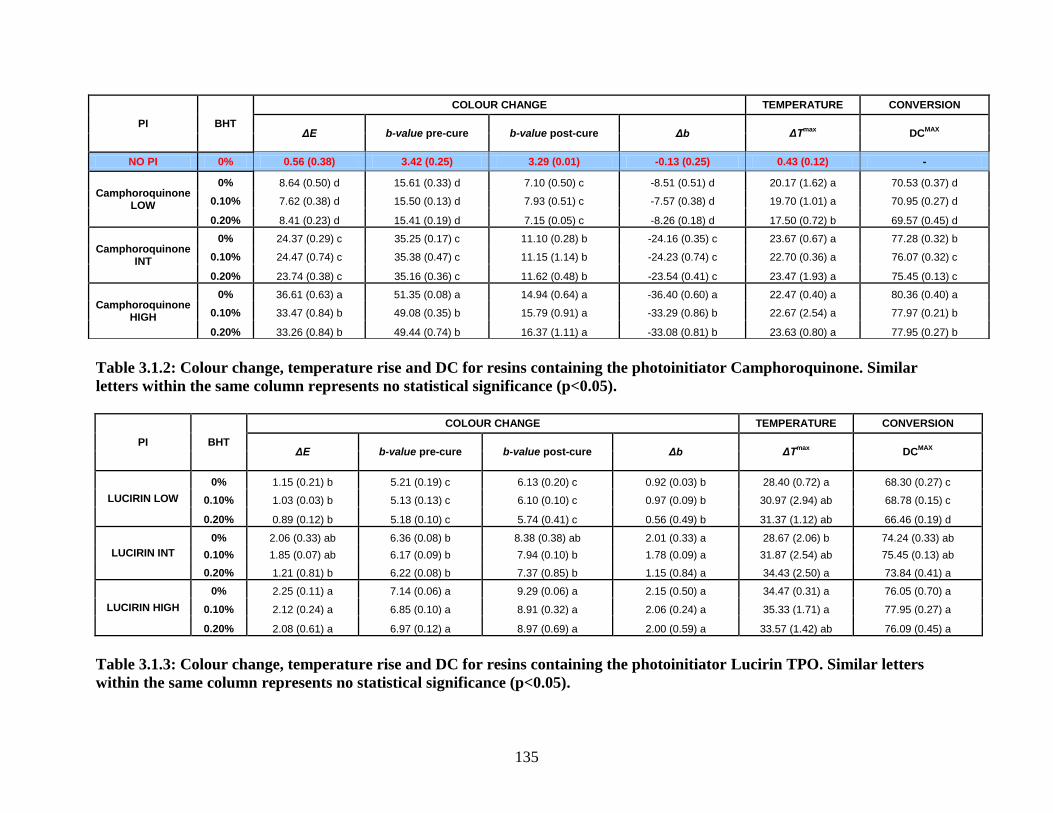
135
Table 3.1.2: Colour change, temperature rise and DC for resins containing the photoinitiator Camphoroquinone. Similar
letters within the same column represents no statistical significance (p<0.05).
PI BHT
COLOUR CHANGE TEMPERATURE CONVERSION
ΔE b-value pre-cure b-value post-cure Δb ΔTmax
DCMAX
LUCIRIN LOW
0% 1.15 (0.21) b 5.21 (0.19) c 6.13 (0.20) c 0.92 (0.03) b 28.40 (0.72) a 68.30 (0.27) c
0.10% 1.03 (0.03) b 5.13 (0.13) c 6.10 (0.10) c 0.97 (0.09) b 30.97 (2.94) ab 68.78 (0.15) c
0.20% 0.89 (0.12) b 5.18 (0.10) c 5.74 (0.41) c 0.56 (0.49) b 31.37 (1.12) ab 66.46 (0.19) d
LUCIRIN INT
0% 2.06 (0.33) ab 6.36 (0.08) b 8.38 (0.38) ab 2.01 (0.33) a 28.67 (2.06) b 74.24 (0.33) ab
0.10% 1.85 (0.07) ab 6.17 (0.09) b 7.94 (0.10) b 1.78 (0.09) a 31.87 (2.54) ab 75.45 (0.13) ab
0.20% 1.21 (0.81) b 6.22 (0.08) b 7.37 (0.85) b 1.15 (0.84) a 34.43 (2.50) a 73.84 (0.41) a
LUCIRIN HIGH
0% 2.25 (0.11) a 7.14 (0.06) a 9.29 (0.06) a 2.15 (0.50) a 34.47 (0.31) a 76.05 (0.70) a
0.10% 2.12 (0.24) a 6.85 (0.10) a 8.91 (0.32) a 2.06 (0.24) a 35.33 (1.71) a 77.95 (0.27) a
0.20% 2.08 (0.61) a 6.97 (0.12) a 8.97 (0.69) a 2.00 (0.59) a 33.57 (1.42) ab 76.09 (0.45) a
Table 3.1.3: Colour change, temperature rise and DC for resins containing the photoinitiator Lucirin TPO. Similar letters
within the same column represents no statistical significance (p<0.05).
PI BHT
COLOUR CHANGE TEMPERATURE CONVERSION
ΔE b-value pre-cure b-value post-cure Δb ΔTmax
DCMAX
NO PI 0% 0.56 (0.38) 3.42 (0.25) 3.29 (0.01) -0.13 (0.25) 0.43 (0.12) -
Camphoroquinone LOW
0% 8.64 (0.50) d 15.61 (0.33) d 7.10 (0.50) c -8.51 (0.51) d 20.17 (1.62) a 70.53 (0.37) d
0.10% 7.62 (0.38) d 15.50 (0.13) d 7.93 (0.51) c -7.57 (0.38) d 19.70 (1.01) a 70.95 (0.27) d
0.20% 8.41 (0.23) d 15.41 (0.19) d 7.15 (0.05) c -8.26 (0.18) d 17.50 (0.72) b 69.57 (0.45) d
Camphoroquinone INT
0% 24.37 (0.29) c 35.25 (0.17) c 11.10 (0.28) b -24.16 (0.35) c 23.67 (0.67) a 77.28 (0.32) b
0.10% 24.47 (0.74) c 35.38 (0.47) c 11.15 (1.14) b -24.23 (0.74) c 22.70 (0.36) a 76.07 (0.32) c
0.20% 23.74 (0.38) c 35.16 (0.36) c 11.62 (0.48) b -23.54 (0.41) c 23.47 (1.93) a 75.45 (0.13) c
Camphoroquinone HIGH
0% 36.61 (0.63) a 51.35 (0.08) a 14.94 (0.64) a -36.40 (0.60) a 22.47 (0.40) a 80.36 (0.40) a
0.10% 33.47 (0.84) b 49.08 (0.35) b 15.79 (0.91) a -33.29 (0.86) b 22.67 (2.54) a 77.97 (0.21) b
0.20% 33.26 (0.84) b 49.44 (0.74) b 16.37 (1.11) a -33.08 (0.81) b 23.63 (0.80) a 77.95 (0.27) b
136
For Lucirin TPO based materials, each resin exhibited significantly higher max
pR
(p<0.05) than camphoroquinone based resins of similar concentrations although
maxDC was significantly lower (p<0.05). For both camphoroquinone and Lucirin TPO,
the addition of BHT significantly reduced max
pR (P<0.005) which significantly affected
maxDC in some of the resins (p>0.05) (Figure 3.1.5; Table 3.1.2 and Table 3.1.3). The
temperature rise was significantly higher in all Lucirin TPO resins (p<0.05) with the
highest temperature rise being observed for high concentration. The addition of BHT did
not significantly change maxT (p<0.05) for any of the resins apart from the low
concentration of camphoroquinone that contained 0.20 wt% BHT which showed
significantly lower maxT (p<0.05). The temperature rise in resins containing no
photoinitiator was 0.43 ± 0.12 ○C due to heat dissipated by the light curing unit and was
used to correct resins containing photoinitiator to obtain temperature rise during
polymerisation.
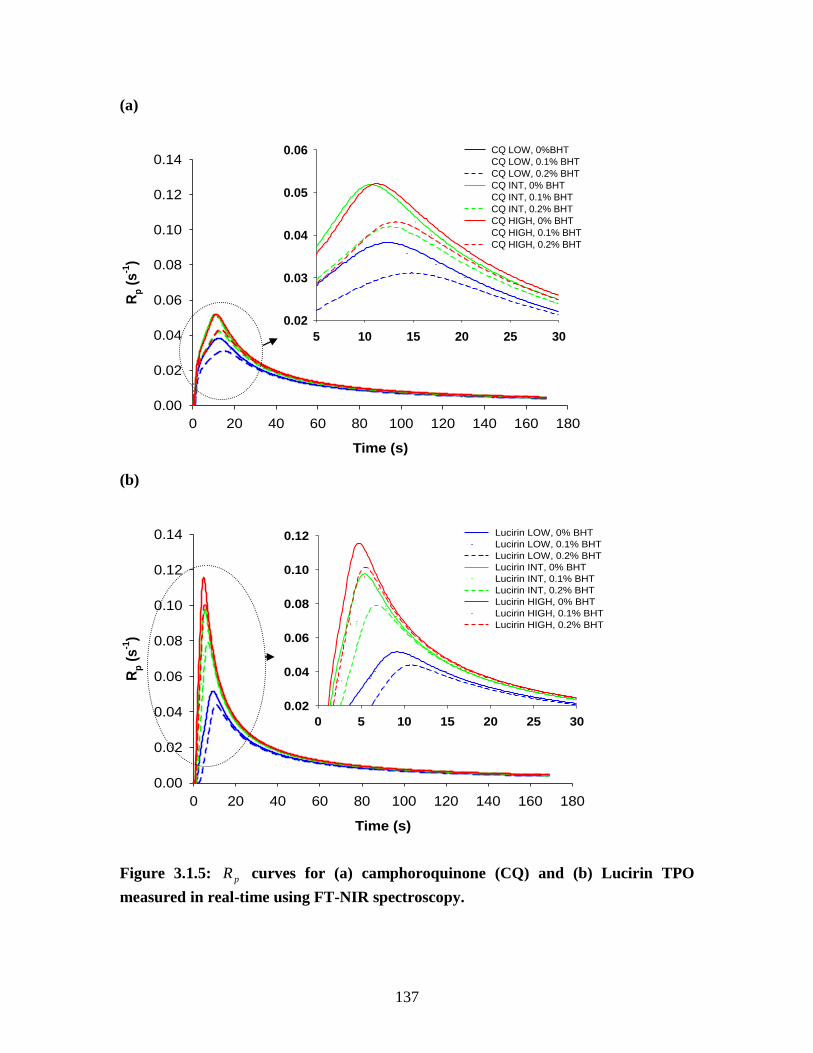
137
(a)
(b)
Figure 3.1.5: pR curves for (a) camphoroquinone (CQ) and (b) Lucirin TPO
measured in real-time using FT-NIR spectroscopy.
Time (s)
0 20 40 60 80 100 120 140 160 180
Rp (
s-1
)
0.00
0.02
0.04
0.06
0.08
0.10
0.12
0.14
0 5 10 15 20 25 30
0.02
0.04
0.06
0.08
0.10
0.12 Lucirin LOW, 0% BHT
Lucirin LOW, 0.1% BHT
Lucirin LOW, 0.2% BHT
Lucirin INT, 0% BHT
Lucirin INT, 0.1% BHT
Lucirin INT, 0.2% BHT
Lucirin HIGH, 0% BHT
Lucirin HIGH, 0.1% BHT
Lucirin HIGH, 0.2% BHT
Time (s)
0 20 40 60 80 100 120 140 160 180
Rp (
s-1
)
0.00
0.02
0.04
0.06
0.08
0.10
0.12
0.14
5 10 15 20 25 30
0.02
0.03
0.04
0.05
0.06 CQ LOW, 0%BHT
CQ LOW, 0.1% BHT
CQ LOW, 0.2% BHT
CQ INT, 0% BHT
CQ INT, 0.1% BHT
CQ INT, 0.2% BHT
CQ HIGH, 0% BHT
CQ HIGH, 0.1% BHT
CQ HIGH, 0.2% BHT
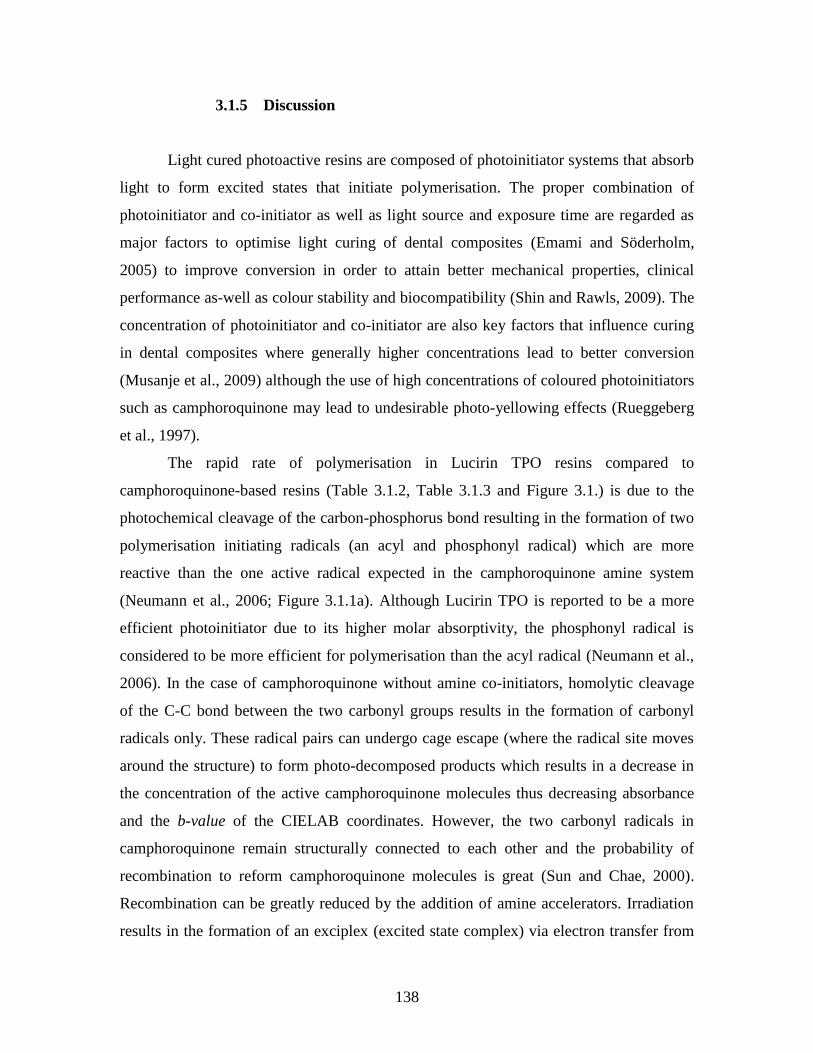
138
3.1.5 Discussion
Light cured photoactive resins are composed of photoinitiator systems that absorb
light to form excited states that initiate polymerisation. The proper combination of
photoinitiator and co-initiator as well as light source and exposure time are regarded as
major factors to optimise light curing of dental composites (Emami and Söderholm,
2005) to improve conversion in order to attain better mechanical properties, clinical
performance as-well as colour stability and biocompatibility (Shin and Rawls, 2009). The
concentration of photoinitiator and co-initiator are also key factors that influence curing
in dental composites where generally higher concentrations lead to better conversion
(Musanje et al., 2009) although the use of high concentrations of coloured photoinitiators
such as camphoroquinone may lead to undesirable photo-yellowing effects (Rueggeberg
et al., 1997).
The rapid rate of polymerisation in Lucirin TPO resins compared to
camphoroquinone-based resins (Table 3.1.2, Table 3.1.3 and Figure 3.1.) is due to the
photochemical cleavage of the carbon-phosphorus bond resulting in the formation of two
polymerisation initiating radicals (an acyl and phosphonyl radical) which are more
reactive than the one active radical expected in the camphoroquinone amine system
(Neumann et al., 2006; Figure 3.1.1a). Although Lucirin TPO is reported to be a more
efficient photoinitiator due to its higher molar absorptivity, the phosphonyl radical is
considered to be more efficient for polymerisation than the acyl radical (Neumann et al.,
2006). In the case of camphoroquinone without amine co-initiators, homolytic cleavage
of the C-C bond between the two carbonyl groups results in the formation of carbonyl
radicals only. These radical pairs can undergo cage escape (where the radical site moves
around the structure) to form photo-decomposed products which results in a decrease in
the concentration of the active camphoroquinone molecules thus decreasing absorbance
and the b-value of the CIELAB coordinates. However, the two carbonyl radicals in
camphoroquinone remain structurally connected to each other and the probability of
recombination to reform camphoroquinone molecules is great (Sun and Chae, 2000).
Recombination can be greatly reduced by the addition of amine accelerators. Irradiation
results in the formation of an exciplex (excited state complex) via electron transfer from
139
amine to the excited di-ketone. When amine accelerators are added, the formation of an
aminyl radical (responsible for the initiation of polymerisation) and a hydryl radical
(which is almost inactive) are a result of hydrogen transfer from amine to the excited
diketone in the exciplex. (Figure 3.1.1b; Shin and Rawls, 2009). Irradiation leads to the
decomposition of the photoinitiator system over time until the photoinitiator is consumed
(Figure 3.1.4). The amine accelerator serves to increase the rate of photodecomposition
(Sun and Chae, 2000) although the rate of decomposition is much slower than in Lucirin
TPO (Figure 3.1.5). The rate of decomposition and absorbance for both photoinitiator is
proportional to their concentrations as the likelihood of excitation is greatly increased
when the molar concentrations of absorbing species (photoinitiator) are increased. In the
present study, the ratio of camphoroquinone and amine was selected as an optimum
combination to produce maximum DC (Yoshida and Greener, 1994) and
camphoroquinone concentration was similar to the one used in commercial composites
(Taira et al., 1988), and an equimolar concentration was used for Lucirin TPO for
comparative purposes. Increasing photoinitiator concentration serves to accelerate the
reaction, consequently leading to greater max
pR and maxT at a reduced time (Figure 3.1.5;
Tables 3.1.2 and 3.1.3).
BHT is commonly used in RBCs due to its anti-oxidant properties which help
improve shelf-life and operatory light stability during chairside placement but may also
influence polymerisation kinetics and degree of cure (Rosentritt et al., 2010). Reduction
in reaction speed by chemical inhibition occurs as free radicals are terminated by reacting
with the phenolic hydrogens of the BHT molecule (Figure 3.1.1c) and thus increase the
rate of recombination and prolongs absorption by the photoinitiators with no dramatic
change in temperature or conversion (Table 3.1.2 and Table 3.1.3). The conversion of
monomer to polymer proceeds at a reduced rate until the inhibitor is consumed (Figure
3.1.5). Additionally, it should also be mentioned that „off the shelf‟ monomers typically
contain inhibitors to improve storability and shelf life and in this work these monomers
were used without purification. Therefore the subtle difference between 0% BHT and
0.1% BHT on cure kinetics, DC and colour (Figure 3.1.5; Tables 3.1.2 and 3.1.3) may
relate to trace impurities of inhibitors. This may also account for the non-significant
differences found in the same resins containing different BHT concentrations rather than
140
insensitivity of the analytical techniques employed (Tables 3.1.2 and 3.1.3). This is in
agreement with previous work showing reaction time increasing significantly when BHT
concentrations are above 0.25% (Rosentritt et al., 2010)
For RBCs it has been reported that a visually perceptible colour change occurs
when E exceeds 5.4 (Cook and Chong, 1985). However, a E value that exceeds 2 is
considered representative of a visually perceptible colour change for resins in the yellow-
red range (b-value) of the colour spectrum (Ferracane et al., 1985). As the current
investigation is based only on unfilled resins, it is more relevant to base the discussion
around the latter value. For Lucirin TPO, visually perceptible colour changes occurred for
the intermediate and high concentrations of Lucirin TPO, which may also occur in filled
systems (Table 3.1.3). Therefore, where so-called colourless photoinitiators might be
perceived to improve aesthetic quality of bleach white or translucent shades, they may
actually cause significant colour contamination and reduce shade matching if used at high
concentrations. Colour change may also be affected by several other factors such as
temperature, moisture and the presence of oxygen (Barres, 1945; Shin and Rawls, 2009).
One way to reduce the colour contamination is by the addition of inhibitors, which act as
anti-oxidants and reduce the oxidative by-products. The addition of BHT did not
significantly influence colour change for any of the tested resins although there was a
noticeable trend of decreased yellowing with increased BHT concentration for most of
the resins containing Lucirin TPO, which was not observed for camphoroquinone-based
resins as camphoroquinone is strongly pigmented (Table 3.1.2 and Table 3.1.3). This may
be due to the anti-oxidant properties of BHT (Lambert et al., 1996; Rosentritt et al.,
2010), which may reduce any oxidative by-products that are produced during the
reaction. The non-significant data may be due to the limited concentration of BHT used
in the present study ( 0.2 wt%) and the trace amounts of inhibitors already present in the
monomer. Nonetheless, chemical inhibition will reduce max
pR (Figure 3.1.5) which will
reduce the rate of conversion and the rate of colour change therefore affecting the final
colour change.
Yellowing of camphoroquinone resins is proportional to the concentration of
camphoroquinone, however, photo-activation causes camphoroquinone to decompose
and decreases the concentration of camphoroquinone causing a photo-bleaching effect
141
(decrease in b-value). Contrary to this, Lucirin TPO resins (initially colourless) show an
initial increase in absorption (Figure 3.1.4b) as a consequence of an increase in the b-
value of the CIELAB co-ordinates (Table 3.1.3) in the initial stages of polymerisation.
Since Lucirin TPO is a colourless photoinitiator and exhibits efficient photo-bleaching
properties with no absorbance of photolysis by-products above 360 nm (Stephenson
Kenning et al., 2006; Stephenson Kenning et al., 2008), the increase in b-value may be
related to monomer discolouration. The vinyl groups of the monomers will readily react
with oxygen to form coloured peroxides (Barres, 1945). The yellowing of Bis-GMA
monomer under UV illumination was also reported by Ferracane et al., (1985).
Consequently, the presence of oxygen and the higher reaction temperatures and kinetics
may have lead to the formation of coloured peroxides that absorb in the visible region of
the electromagnetic spectrum which are the probable cause of the yellow discolouration
observed in Lucirin TPO resins. Also, it should be noted that the amine (not used in
Lucirin TPO resins) and monomers do not absorb significantly between 420-520nm
(Asmussen and Vallo, 2009). It is also worth noting that BHT has an absorbance peak in
the UV region (290-310 nm) of the electromagnetic spectrum and thus falls outside the
measured range (470 nm for camphoroquinone and 420 nm for Lucirin TPO). Therfore
the measured absorbance is unlikely to be related to BHT. Additionally, the light curing
unit has an emission range between 400-550 nm and therefore it is expected that the
addition of BHT will not significantly affect light transmission through absorption by
BHT.
Polymerisation is usually accompanied by shrinkage and a decrease in volume
and possibly results in a path length change of approximately 3-4% that occurs during the
first 20 s of irradiation with a further 1-2% occurring thereafter (Mucci et al., 2009). As
the measured absorbance is the product of the molar absorptivity and concentration of
photoinitiator multiplied by the optical path length (Beer-lamberts law) any changes in
the path length will affect absorbance (where an increase in path length, i.e. expansion
will increase absorbance). Indeed, it may well be that for Lucirin TPO resins, volumetric
expansion by high reaction temperatures caused an initial increase in absorbance (Figure
3.1.4b). However, at the first stage of fast reaction, the sample shrinkage and expansion is
believed to be very slow and changes in sample thickness can be disregarded (Asmussen
142
and Vallo, 2009). This was further verified using a interferometry technique (Section
3.2), the results of which showed no such expansion during irradiation and can be found
in the Appendix of this thesis. Nonetheless, the presence of Lucirin TPO serves to
accelerate the colour change and this effect is related to photoinitiator concentration
(Lucirin High > Lucirin Intermediate > Lucirin Low) where intermediate and high
concentrations were deemed to be visually perceptible. Although the criteria for visual
perception vary in the literature any discolouration as a result of the photo-polymerisation
process of so-called “colourless” photoinitaitors may not only affect aesthetic quality but
also negatively affect light transmission and resultant DC.
As photoactivation leads to the decomposition of the photoinititaors, the first
hypothesis was accepted as all camphoroquinone-based resins exhibited a decrease in
yellowing throughout and following cure. Although Lucirin TPO has been considered a
colourless photoinitiator, monomers may become discoloured upon irradiation due to
high max
pR and temperatures, which may produce coloured oxidative by-products and
therefore the second hypothesis was rejected. In the present study, the absorption
characteristics and colour change of only two photoinitiator (camphoroquinone and
Lucirin TPO) were studied in unfilled resins. Therefore the absorption characteristics and
colour change of these initiators and others in filled composites should be the subject of
further studies as any scattering and attenuation of light (Brie et al., 1999) will inevitably
affect the absorption characteristics and colour change. Also, since optical properties are
likely to be directly related to shrinkage of the curing polymer, the change in physical and
optical properties of photoactive resins will be investigated in Sections 3.2 and 3.3 of this
thesis. Here, the understanding of optical absorption properties is of prime importance in
order to improve photoinitiator chemistry and clinical success of RBCs.
143
3.1.6 Conclusion
Although TPO, a “colourless” photoinitiator, exhibits greater absorption
efficiency compared with camphoroquinone the formation of coloured peroxides was the
likely cause of the yellow discolouration observed following increased rates of
polymerisation.
The dynamic understanding of photoinitiator absorption is of fundamental
importance as any unconverted photoinitiator can cause aesthetic imperfections and
reduced colour stability. Furthermore, competitive light absorbers from reaction by-
products from monomer or photoinitiator may reduce light transmission through depth
and affect final aesthetic quality of dental composite restorations.
Dynamic measurements during photo-polymerisation yields important
information on curing characteristics of photoactive resins which may be used in order to
significantly improve light transmission. Not only is the photoinitiator important for
optical properties, the resin matrix of RBC materials seems an important factor to control
optical and physical change which will be investigated in Section 3.2 of this thesis.
Improving knowledge of optical properties may ultimately improve curing depths, DC,
colour stability and mechanical properties of RBCs as well as have potential for reduced
procedure times.
144
3.2 Dynamic Monitoring of Refractive Index Change Through
Photoactive Resins§§
3.2.1 Abstract
The change in optical characteristics through the bulk of curing photopolymers is
not fully understood. Photopolymerisation processes are accompanied by photoinitiator
absorption, density changes and volumetric shrinkage, which alter optical properties and
may affect curing efficiency through depth. This investigation demonstrates the use of a
novel low coherence interferometry technique for simultaneous measurement of optical
(refractive index) and physical (shrinkage) properties throughout curing of photoactive
monomers containing various concentrations of bisphenol-A diglycidyl ether
dimethacrylate and triethylene glycol dimethacrylate. Reliability of the interferometry
technique was compared with an Abbé refractometer and showed a significant linear
regression (p<0.001; adjusted R2>0.99) for both uncured and cured resins. The change
and rate of refractive index and magnitude of shrinkage strain was dependent upon
monomer formulation. The development of this interferometry technique provides a
powerful non-invasive tool that will be useful for improving light transport through
photoactive resins and filled resin composites by precise control of optical properties
through material bulk.
§§
Hadis MA, Tomlins PH, Shortall AC and Palin WM. Dynamic monitoring of refractive index
change through photoactive resins. Dental Materials, 2010; 26: 1106-1112
145
3.2.2 Introduction
The worldwide use of dental amalgam continues to decrease with several
(Scandinavian) governments already prohibiting its application. The nearest chair side
alternative in terms of mechanical and physical properties adequate for long-lasting, large
stress-bearing restorations are resin-based composite (RBC) restorative materials
polymerized by high intensity visible (blue) light. Unfortunately, there exist several
shortcomings of RBCs in terms of technique sensitivity (partly a consequence of
inadequate curing depths and multiple incremental placement steps) and dimensional
change, which are partly a consequence of an incomplete understanding of the complex
optical and physical material properties throughout cure.
Besides diffusion limited termination reactions (by free radicals trapped in the
rapidly vitrifying matrix), inefficient light transmission and limited curing depths
(generally less than 3 mm) are a result of surface reflection (Watts and Cash, 1994),
photoinitiator and dye/pigment absorption (Ogunyinka et al., 2007), scattering by filler
particles (Enami et al., 2005, dos Santos et al., 2008) and interfacial filler/resin refraction
(Shortall et al., 2008, Feng et al., 2010). Consequently RBC materials are typically placed
incrementally which may be time consuming and costly. Chapter 2 demonstrated the
potential for reduced curing time with the photoinitiator, Lucirin TPO although inferior
cure depths when compared to camphoroquinone based materials may be a cause for
concern.
An interesting approach to reduce procedure time may be to increase cure depths
of RBC materials. Whilst photoinitiator type and concentration may have some
significance to improving light transmission (Section 3.1) through depth, other RBC
components such as the resin matrix, filler, pigments and dyes may absorb, scatter and
reflect light, as mentioned above. Although absorption characteristics of thin films are
well characterised, the change in optical properties through the bulk of curing
photopolymers (~1 cm) are not fully understood due to issues associated with light
attenuation with increasing sample depth and inherently non-uniform and complex curing
rate profiles (Stephenson et al, 2005; Kenning et al., 2006; Kenning et at., 2008). As the
resin matrix (typically, co-monomer mixtures of Bis-GMA and TEGDMA) cures, its
146
optical properties change and refractive index rises due to a rapid increase in cross-link
density and viscosity. As the refractive index of the resin approaches that of the filler,
interfacial filler/resin scattering is reduced and light transmission is increased (Shortall et
al., 2008). The refractive index (n) of a medium at optical wavelengths is defined as the
ratio of the phase velocity of light in a vacuum (c) to the phase velocity, (υp), in a given
medium (Equation 3.2.1; Shoemaker et al., 1989).
p
cn
Equation 3.2.1
In most materials the velocity with which light propagates is dependent upon the
optical wavelength . Hence, when broadband, rather than monochromatic, light
illuminates a sample, the speed with which it propagates will have an associated
distribution, the peak of which is known as the group velocity vg, with an associated
group index ng (Equation 3.2.2).
g
g
cn
Equation 3.2.2
As light passes through the interface of one medium to another, the change in
velocity is also accompanied by an optical path diversion. The relationship between the
phase velocity in two media (VA and VB) the angle of incidence (θA) and refraction (θB)
and the refractive index of the two media (nA and nB) can be predicted by Snell‟s law
(Equation 3.2.3).
A
B
B
A
B
A
n
n
V
V
sin
sin Equation 3.2.3
Therefore, by measuring the angle of refraction and knowing the index of
refraction of the layer that is in contact with the sample, it is possible to determine the
refractive index of an unknown sample accurately. The most commonly employed
technique to measure refractive index uses a commercial Abbé refractometer. Typically,
147
the wavelength and temperature dependent refractive indices are measured at the standard
yellow Fraunhofer line of sodium (589 nm) at 20 ºC (nD20). The measurement is based on
observing the boundary line of the total reflection. Although critical angle refractometry
techniques are well established for measuring the refractive index of homogenous
transparent materials, these techniques only measure the index at a smooth, planar surface
of a material. Having the capability to monitor the change in refractive index throughout
the bulk of a curing of photoactive resin will allow for a greater insight into the effects of
material properties on the complex setting reaction.
The use of low coherence interferometry (LCI) as a measurement method, has
allowed the development of several techniques to obtain thickness and topography of
multiple materials with excellent results and high accuracy (Tomlins et al., 2007; Morel
and Torga, 2009). LCI is an optical technique that relies on a coherence grating to
provide precise axial positioning of an object in the direction of light propagation and
may be used for optical and physical characterisation of materials with accuracy in the
micron range. LCI relies upon a broadband optical source, typically with a bandwidth of
50-100 nm, to determine the optical time of flight between material interfaces separated
by a geometrical distance d (Equation 3.2.4).
gv
d Equation 3.2.4
The related group thickness tg is defined (Equation 3.2.5)
dnt gg Equation 3.2.5
and the group index is defined from the spectrally dependent phase refractive index n()
(Equation 3.2.6)
d
dnnng )( Equation 3.2.6
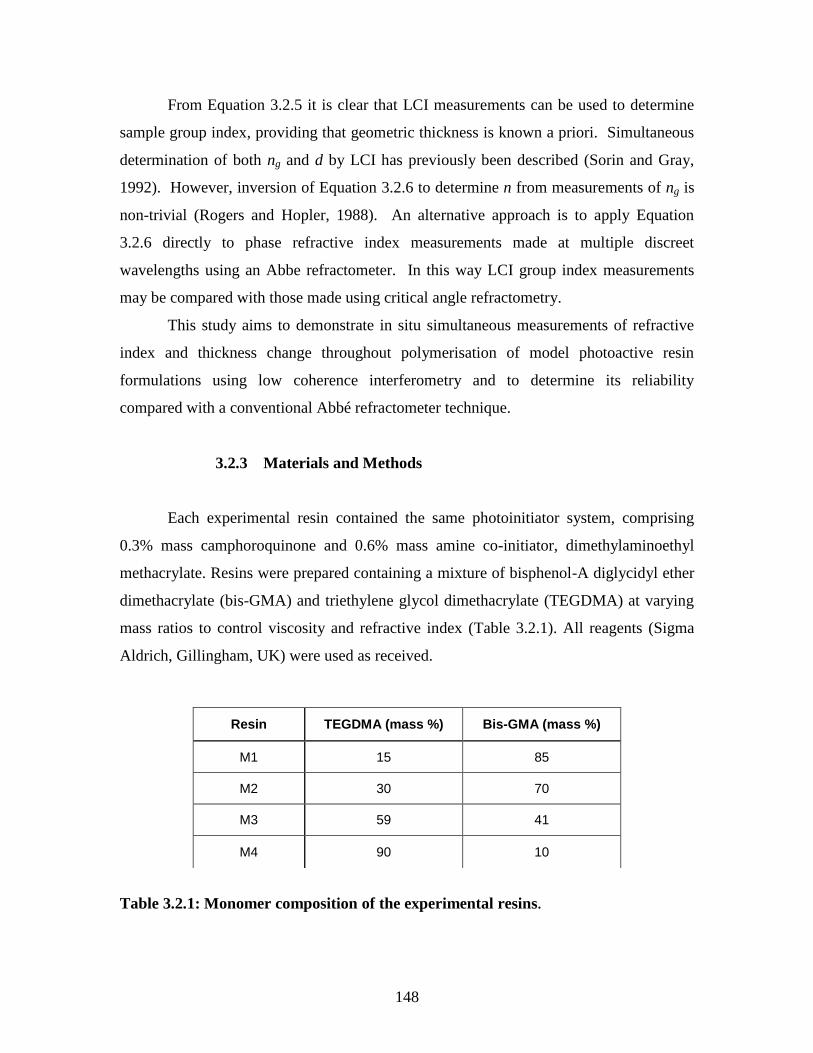
148
From Equation 3.2.5 it is clear that LCI measurements can be used to determine
sample group index, providing that geometric thickness is known a priori. Simultaneous
determination of both ng and d by LCI has previously been described (Sorin and Gray,
1992). However, inversion of Equation 3.2.6 to determine n from measurements of ng is
non-trivial (Rogers and Hopler, 1988). An alternative approach is to apply Equation
3.2.6 directly to phase refractive index measurements made at multiple discreet
wavelengths using an Abbe refractometer. In this way LCI group index measurements
may be compared with those made using critical angle refractometry.
This study aims to demonstrate in situ simultaneous measurements of refractive
index and thickness change throughout polymerisation of model photoactive resin
formulations using low coherence interferometry and to determine its reliability
compared with a conventional Abbé refractometer technique.
3.2.3 Materials and Methods
Each experimental resin contained the same photoinitiator system, comprising
0.3% mass camphoroquinone and 0.6% mass amine co-initiator, dimethylaminoethyl
methacrylate. Resins were prepared containing a mixture of bisphenol-A diglycidyl ether
dimethacrylate (bis-GMA) and triethylene glycol dimethacrylate (TEGDMA) at varying
mass ratios to control viscosity and refractive index (Table 3.2.1). All reagents (Sigma
Aldrich, Gillingham, UK) were used as received.
Table 3.2.1: Monomer composition of the experimental resins.
Resin TEGDMA (mass %) Bis-GMA (mass %)
M1 15 85
M2 30 70
M3 59 41
M4 90 10
149
Refractive index (RI) and physical thickness measurements of each model resin
formulation were obtained simultaneously throughout cure. The bespoke configuration
comprises of a Michelson interferometer arrangement (Figure 3.2.1) with a super
luminescent diode (L2KASLD16-015-BFA; Amonics, Kowloon, Hong Kong) broadband
light source with a centre wavelength at 1624 nm and a full-width half maximum of 55
nm. An „off the shelf‟ fibre coupled InGaAs photo detector (PDB120C; Thorlabs,
Cambridgeshire, UK) was used to detect the interference fringes from the sample and the
reference arm. A voice coil stage (VCS10-023-BS-1, H2W Technologies, Inc., USA) was
used to change the position of the reference mirror in order to modulate an optical time
delay between the reference arm and the sample arm.
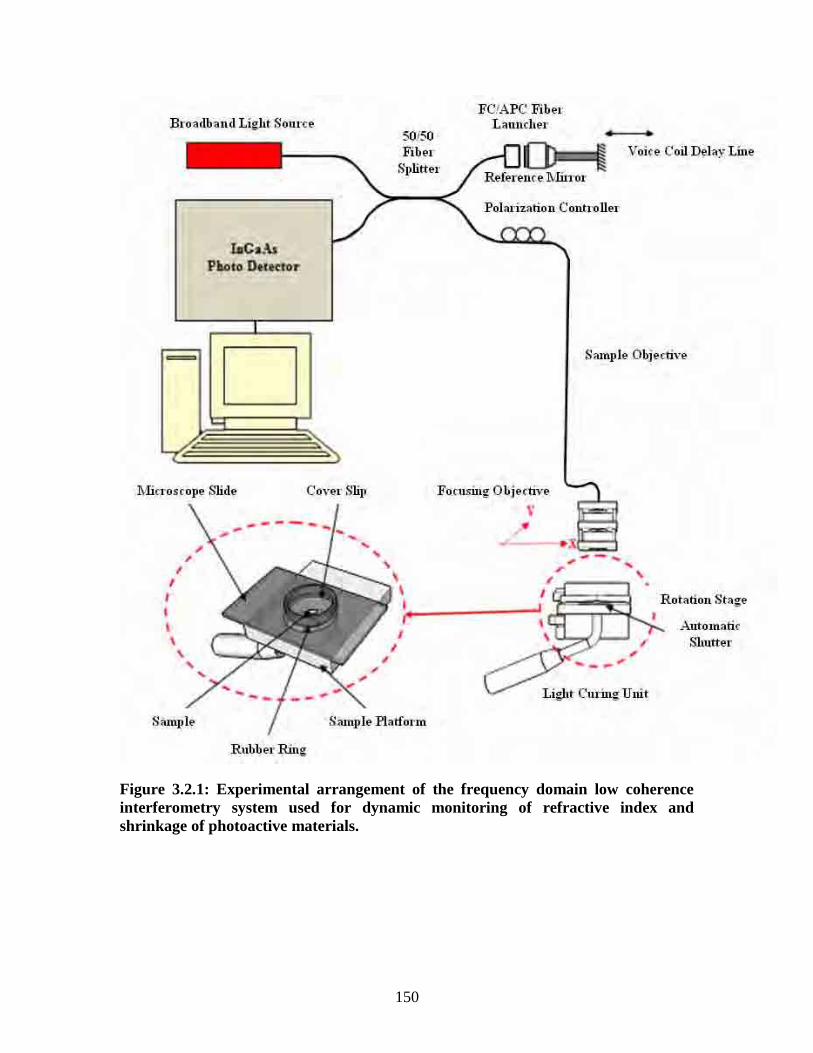
150
Figure 3.2.1: Experimental arrangement of the frequency domain low coherence
interferometry system used for dynamic monitoring of refractive index and
shrinkage of photoactive materials.
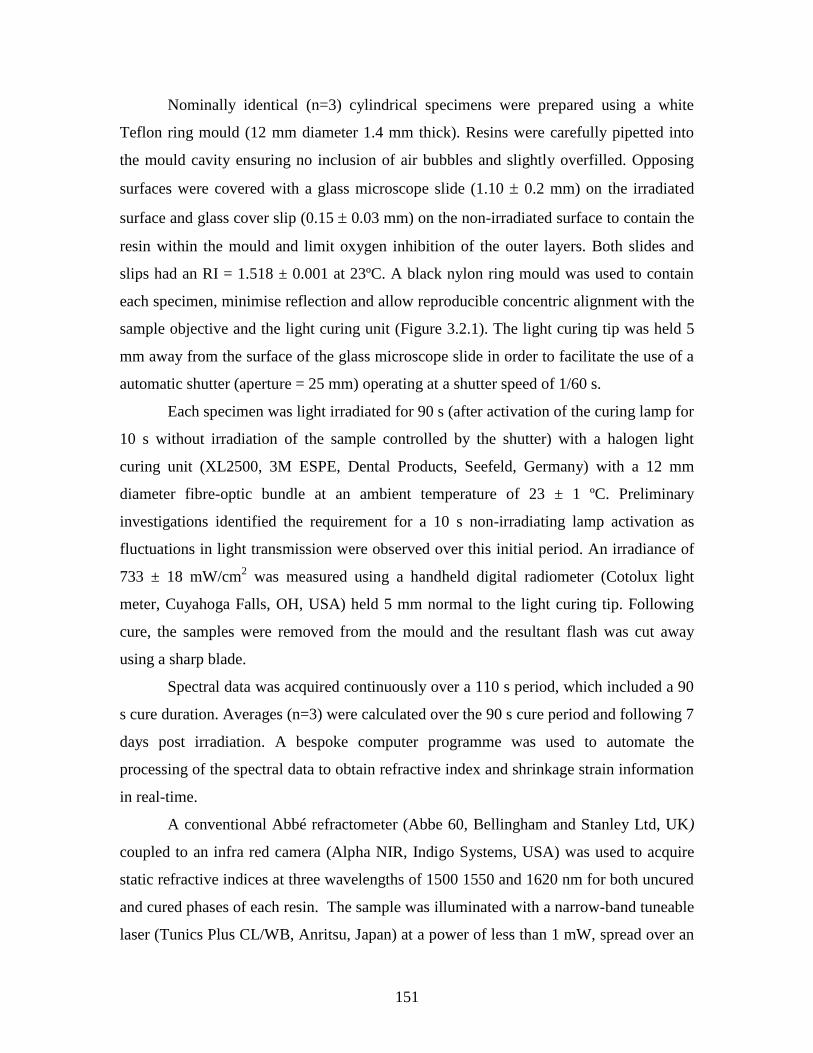
151
Nominally identical (n=3) cylindrical specimens were prepared using a white
Teflon ring mould (12 mm diameter 1.4 mm thick). Resins were carefully pipetted into
the mould cavity ensuring no inclusion of air bubbles and slightly overfilled. Opposing
surfaces were covered with a glass microscope slide (1.10 0.2 mm) on the irradiated
surface and glass cover slip (0.15 0.03 mm) on the non-irradiated surface to contain the
resin within the mould and limit oxygen inhibition of the outer layers. Both slides and
slips had an RI = 1.518 ± 0.001 at 23ºC. A black nylon ring mould was used to contain
each specimen, minimise reflection and allow reproducible concentric alignment with the
sample objective and the light curing unit (Figure 3.2.1). The light curing tip was held 5
mm away from the surface of the glass microscope slide in order to facilitate the use of a
automatic shutter (aperture = 25 mm) operating at a shutter speed of 1/60 s.
Each specimen was light irradiated for 90 s (after activation of the curing lamp for
10 s without irradiation of the sample controlled by the shutter) with a halogen light
curing unit (XL2500, 3M ESPE, Dental Products, Seefeld, Germany) with a 12 mm
diameter fibre-optic bundle at an ambient temperature of 23 ± 1 ºC. Preliminary
investigations identified the requirement for a 10 s non-irradiating lamp activation as
fluctuations in light transmission were observed over this initial period. An irradiance of
733 ± 18 mW/cm2 was measured using a handheld digital radiometer (Cotolux light
meter, Cuyahoga Falls, OH, USA) held 5 mm normal to the light curing tip. Following
cure, the samples were removed from the mould and the resultant flash was cut away
using a sharp blade.
Spectral data was acquired continuously over a 110 s period, which included a 90
s cure duration. Averages (n=3) were calculated over the 90 s cure period and following 7
days post irradiation. A bespoke computer programme was used to automate the
processing of the spectral data to obtain refractive index and shrinkage strain information
in real-time.
A conventional Abbé refractometer (Abbe 60, Bellingham and Stanley Ltd, UK)
coupled to an infra red camera (Alpha NIR, Indigo Systems, USA) was used to acquire
static refractive indices at three wavelengths of 1500 1550 and 1620 nm for both uncured
and cured phases of each resin. The sample was illuminated with a narrow-band tuneable
laser (Tunics Plus CL/WB, Anritsu, Japan) at a power of less than 1 mW, spread over an
152
area of approximately 10x10 mm. The group index for each sample was determined by
using Equation 6. The derivative of n with respect to was estimated from the slope of a
linear fit through the phase refractive index measurements. This approach was shown to
be valid by first measuring a pure silica calibration artefact (PT08002, Bellingham and
Stanley, UK). Each specimen was prepared in a bar-shaped rectangular mould having
similar dimensions to the calibration piece (25 x 10 x 2 mm). An alignment mould was
used to ensure repeatable placement of the light-curing unit with respect to the specimen.
Each portion of the bar-shaped specimen was cured for 90 s to establish a full and even
cure across the sample length. Specimens were measured following cure and 7 days post
irradiation.
As Kolmogorov-Smirnov normality tests on pooled refractive index data sets
indicated variation from the pattern expected from a population with a normal
distribution, data analysis was performed using distribution free test methods. Kruskal-
Wallis and Mann-Whitney non-parametric tests were performed with a significance level
of p=0.05. Where appropriate, parametric data was analysed using one-way analysis of
variance (ANOVA) and Tukey post-hoc comparisons (SPSS v.15.0, Surrey, UK) at a
confidence level of 95%.
3.2.4 Results
The effect of measurement method on the RI of each resin mixture prior to and
following 7d after cure are presented in Table 3.2.2 Kruskal-Wallace tests revealed
significant differences (p<0.001) in RI values obtained by LCI and phase index results
measured with the Abbé refractometer, although RI measured by LCI and group indices
were not significant (p=0.261). The phase index results were higher than those measured
by LCI (p<0.001), however, a significant linear regression was observed between LCI
and Abbé (phase) and LCI and Abbé (group) (Figure 3.2.2; adjusted R2>0.99 for both
regressions).
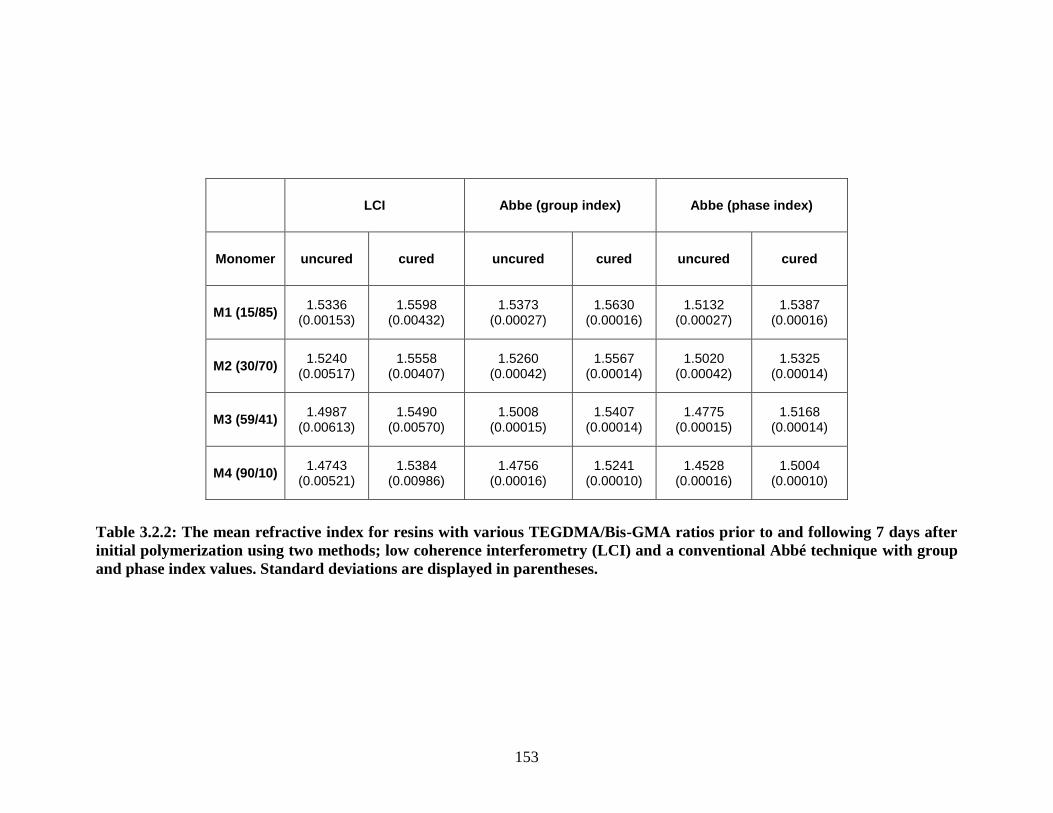
153
Table 3.2.2: The mean refractive index for resins with various TEGDMA/Bis-GMA ratios prior to and following 7 days after
initial polymerization using two methods; low coherence interferometry (LCI) and a conventional Abbé technique with group
and phase index values. Standard deviations are displayed in parentheses.
LCI Abbe (group index) Abbe (phase index)
Monomer uncured cured uncured cured uncured cured
M1 (15/85) 1.5336
(0.00153) 1.5598
(0.00432) 1.5373
(0.00027) 1.5630
(0.00016) 1.5132
(0.00027) 1.5387
(0.00016)
M2 (30/70) 1.5240
(0.00517) 1.5558
(0.00407) 1.5260
(0.00042) 1.5567
(0.00014) 1.5020
(0.00042) 1.5325
(0.00014)
M3 (59/41) 1.4987
(0.00613) 1.5490
(0.00570) 1.5008
(0.00015) 1.5407
(0.00014) 1.4775
(0.00015) 1.5168
(0.00014)
M4 (90/10) 1.4743
(0.00521) 1.5384
(0.00986) 1.4756
(0.00016) 1.5241
(0.00010) 1.4528
(0.00016) 1.5004
(0.00010)
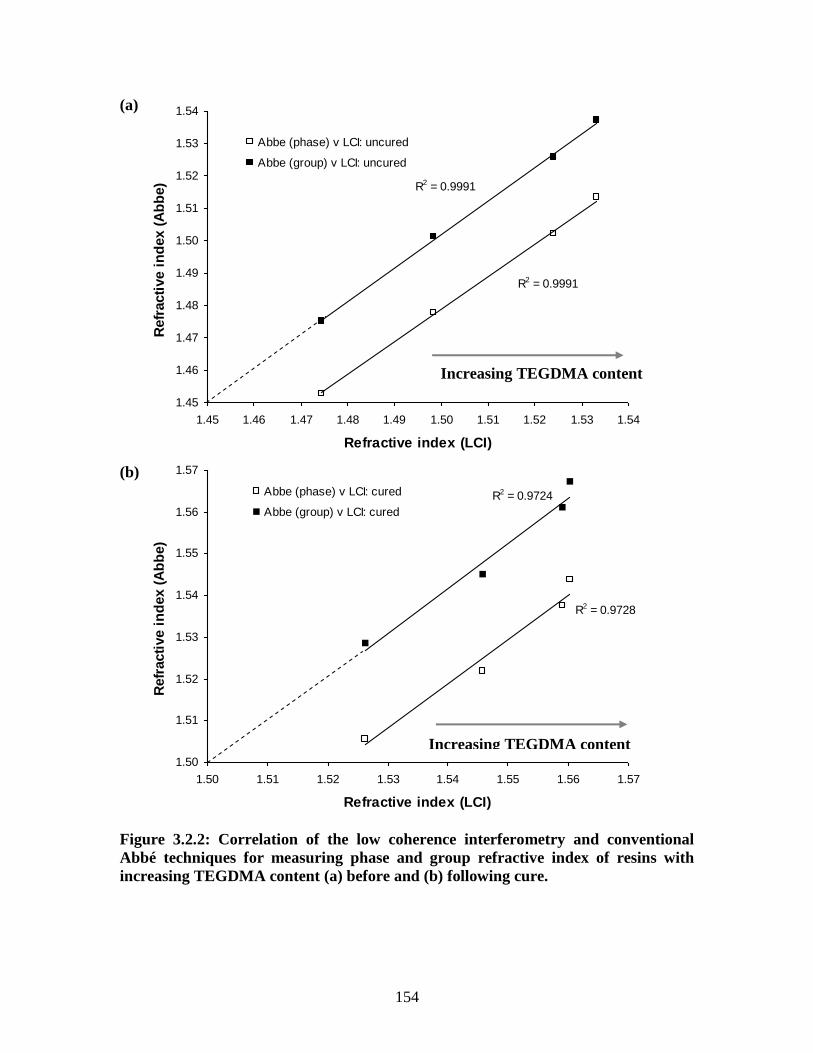
154
(a)
(b)
Figure 3.2.2: Correlation of the low coherence interferometry and conventional
Abbé techniques for measuring phase and group refractive index of resins with
increasing TEGDMA content (a) before and (b) following cure.
R2 = 0.9724
R2 = 0.9728
1.50
1.51
1.52
1.53
1.54
1.55
1.56
1.57
1.50 1.51 1.52 1.53 1.54 1.55 1.56 1.57
Refractive index (LCI)
Refr
acti
ve i
nd
ex (
Ab
be)
Abbe (phase) v LCI: cured
Abbe (group) v LCI: cured
R2 = 0.9991
R2 = 0.9991
1.45
1.46
1.47
1.48
1.49
1.50
1.51
1.52
1.53
1.54
1.45 1.46 1.47 1.48 1.49 1.50 1.51 1.52 1.53 1.54
Refractive index (LCI)
Refr
acti
ve i
nd
ex (
Ab
be)
Abbe (phase) v LCI: uncured
Abbe (group) v LCI: uncured
Increasing TEGDMA content
Increasing TEGDMA content
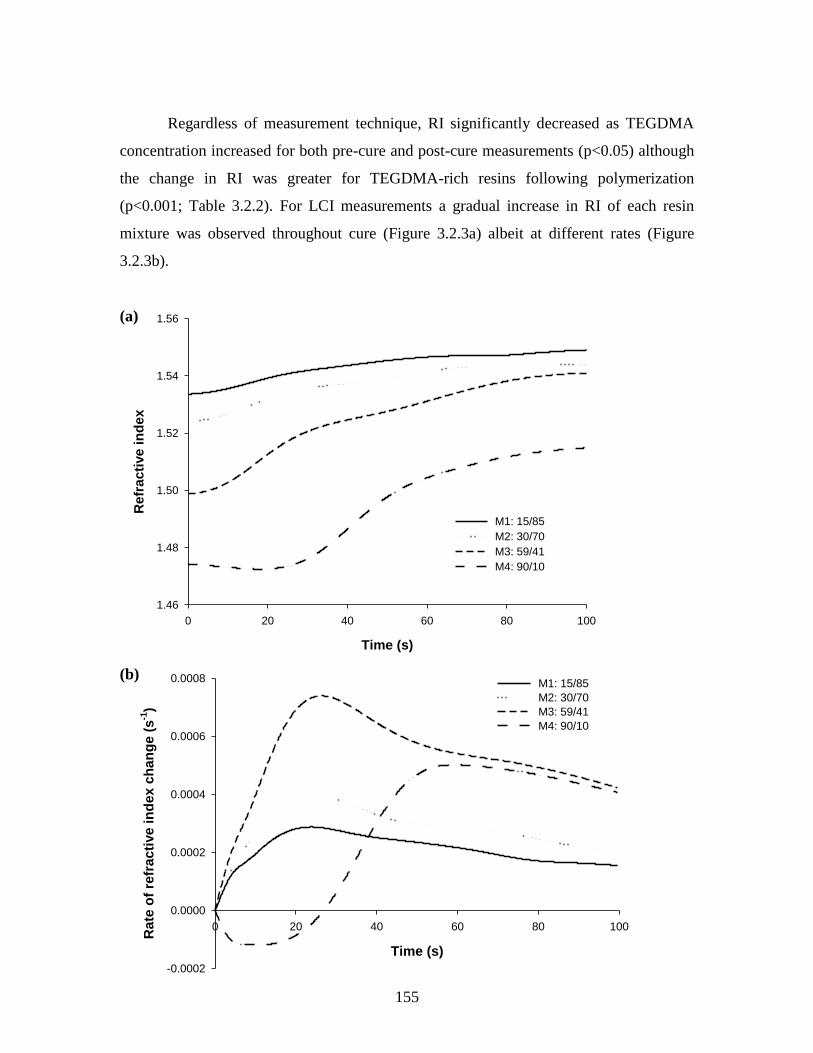
155
Time (s)
0 20 40 60 80 100
Ra
te o
f re
frac
tive
in
de
x c
han
ge (
s-1
)
-0.0002
0.0000
0.0002
0.0004
0.0006
0.0008 M1: 15/85
M2: 30/70
M3: 59/41
M4: 90/10
Time (s)
0 20 40 60 80 100
Re
fra
cti
ve
in
de
x
1.46
1.48
1.50
1.52
1.54
1.56
M1: 15/85
M2: 30/70
M3: 59/41
M4: 90/10
Regardless of measurement technique, RI significantly decreased as TEGDMA
concentration increased for both pre-cure and post-cure measurements (p<0.05) although
the change in RI was greater for TEGDMA-rich resins following polymerization
(p<0.001; Table 3.2.2). For LCI measurements a gradual increase in RI of each resin
mixture was observed throughout cure (Figure 3.2.3a) albeit at different rates (Figure
3.2.3b).
(a)
(b)
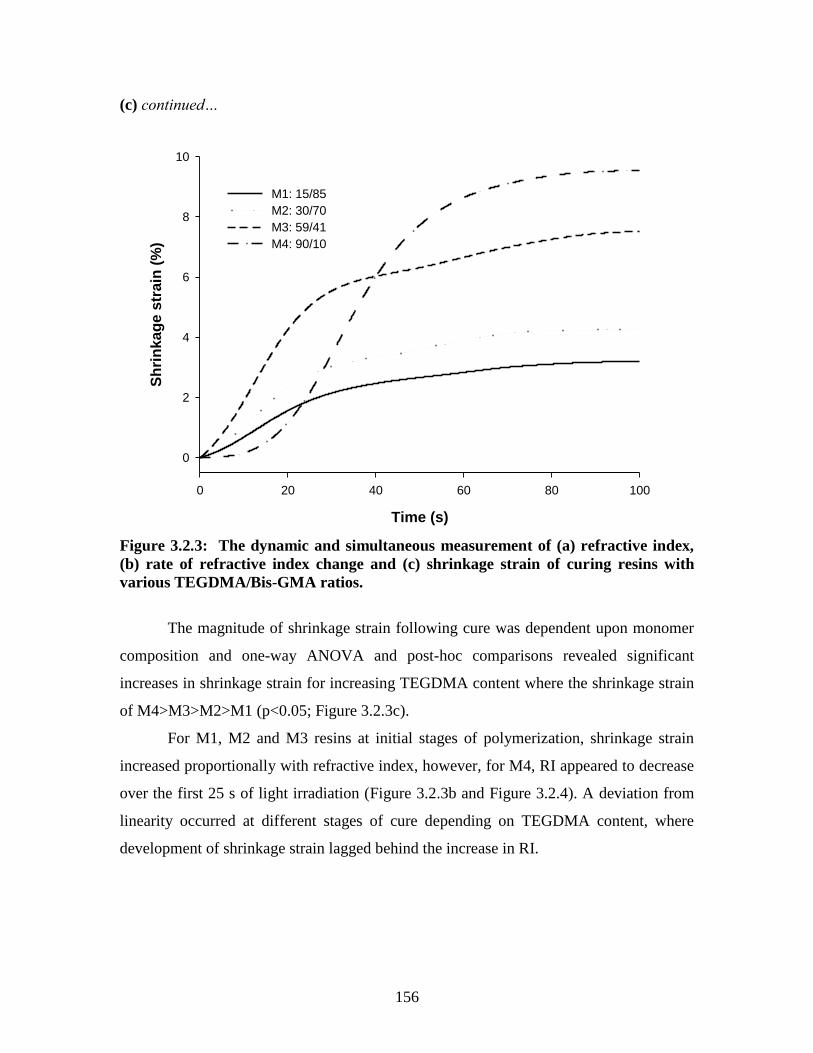
156
Time (s)
0 20 40 60 80 100
Sh
rin
ka
ge
str
ain
(%
)
0
2
4
6
8
10
M1: 15/85
M2: 30/70
M3: 59/41
M4: 90/10
(c) continued…
Figure 3.2.3: The dynamic and simultaneous measurement of (a) refractive index,
(b) rate of refractive index change and (c) shrinkage strain of curing resins with
various TEGDMA/Bis-GMA ratios.
The magnitude of shrinkage strain following cure was dependent upon monomer
composition and one-way ANOVA and post-hoc comparisons revealed significant
increases in shrinkage strain for increasing TEGDMA content where the shrinkage strain
of M4>M3>M2>M1 (p<0.05; Figure 3.2.3c).
For M1, M2 and M3 resins at initial stages of polymerization, shrinkage strain
increased proportionally with refractive index, however, for M4, RI appeared to decrease
over the first 25 s of light irradiation (Figure 3.2.3b and Figure 3.2.4). A deviation from
linearity occurred at different stages of cure depending on TEGDMA content, where
development of shrinkage strain lagged behind the increase in RI.
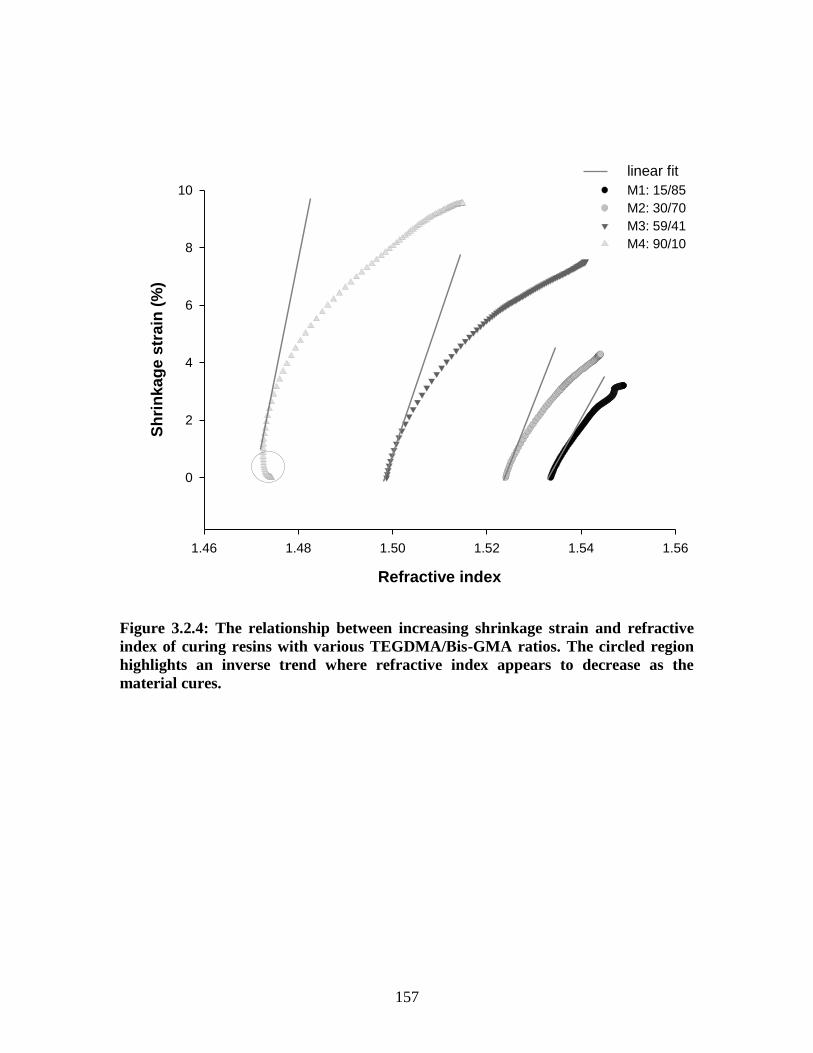
157
Figure 3.2.4: The relationship between increasing shrinkage strain and refractive
index of curing resins with various TEGDMA/Bis-GMA ratios. The circled region
highlights an inverse trend where refractive index appears to decrease as the
material cures.
Refractive index
1.46 1.48 1.50 1.52 1.54 1.56
Sh
rin
kag
e s
train
(%
)
0
2
4
6
8
10 M1: 15/85
M2: 30/70
M3: 59/41
M4: 90/10
linear fit
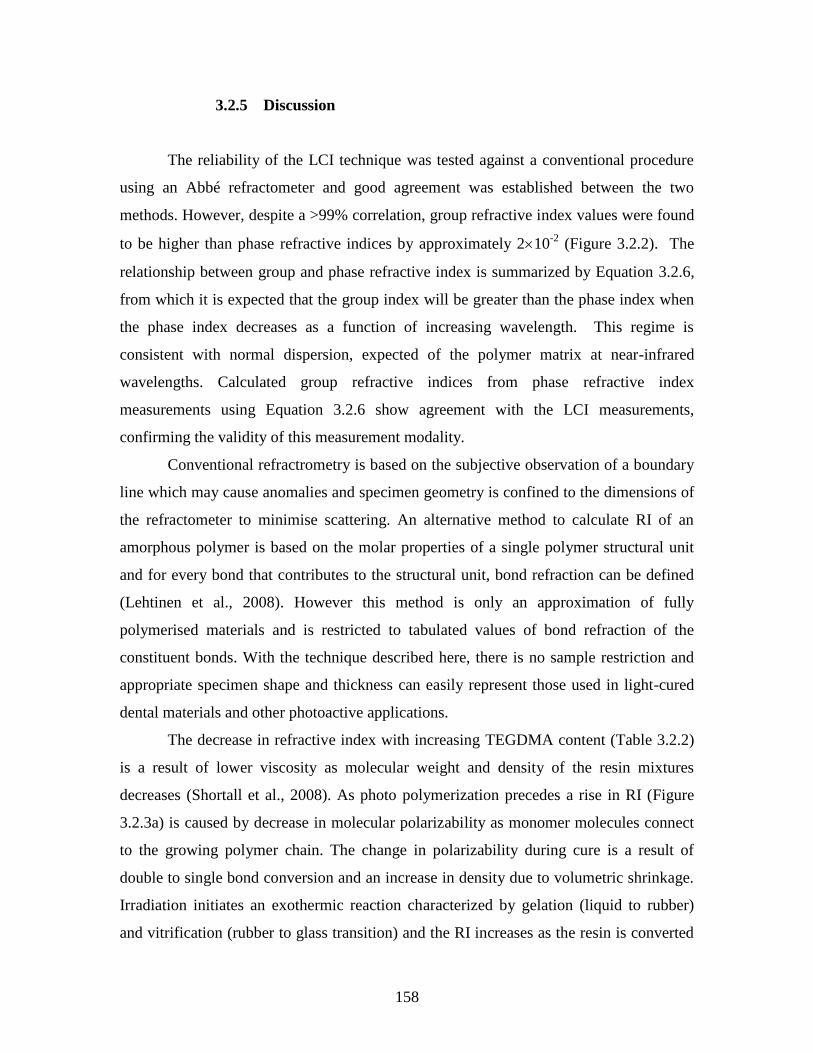
158
3.2.5 Discussion
The reliability of the LCI technique was tested against a conventional procedure
using an Abbé refractometer and good agreement was established between the two
methods. However, despite a >99% correlation, group refractive index values were found
to be higher than phase refractive indices by approximately 210-2
(Figure 3.2.2). The
relationship between group and phase refractive index is summarized by Equation 3.2.6,
from which it is expected that the group index will be greater than the phase index when
the phase index decreases as a function of increasing wavelength. This regime is
consistent with normal dispersion, expected of the polymer matrix at near-infrared
wavelengths. Calculated group refractive indices from phase refractive index
measurements using Equation 3.2.6 show agreement with the LCI measurements,
confirming the validity of this measurement modality.
Conventional refractrometry is based on the subjective observation of a boundary
line which may cause anomalies and specimen geometry is confined to the dimensions of
the refractometer to minimise scattering. An alternative method to calculate RI of an
amorphous polymer is based on the molar properties of a single polymer structural unit
and for every bond that contributes to the structural unit, bond refraction can be defined
(Lehtinen et al., 2008). However this method is only an approximation of fully
polymerised materials and is restricted to tabulated values of bond refraction of the
constituent bonds. With the technique described here, there is no sample restriction and
appropriate specimen shape and thickness can easily represent those used in light-cured
dental materials and other photoactive applications.
The decrease in refractive index with increasing TEGDMA content (Table 3.2.2)
is a result of lower viscosity as molecular weight and density of the resin mixtures
decreases (Shortall et al., 2008). As photo polymerization precedes a rise in RI (Figure
3.2.3a) is caused by decrease in molecular polarizability as monomer molecules connect
to the growing polymer chain. The change in polarizability during cure is a result of
double to single bond conversion and an increase in density due to volumetric shrinkage.
Irradiation initiates an exothermic reaction characterized by gelation (liquid to rubber)
and vitrification (rubber to glass transition) and the RI increases as the resin is converted
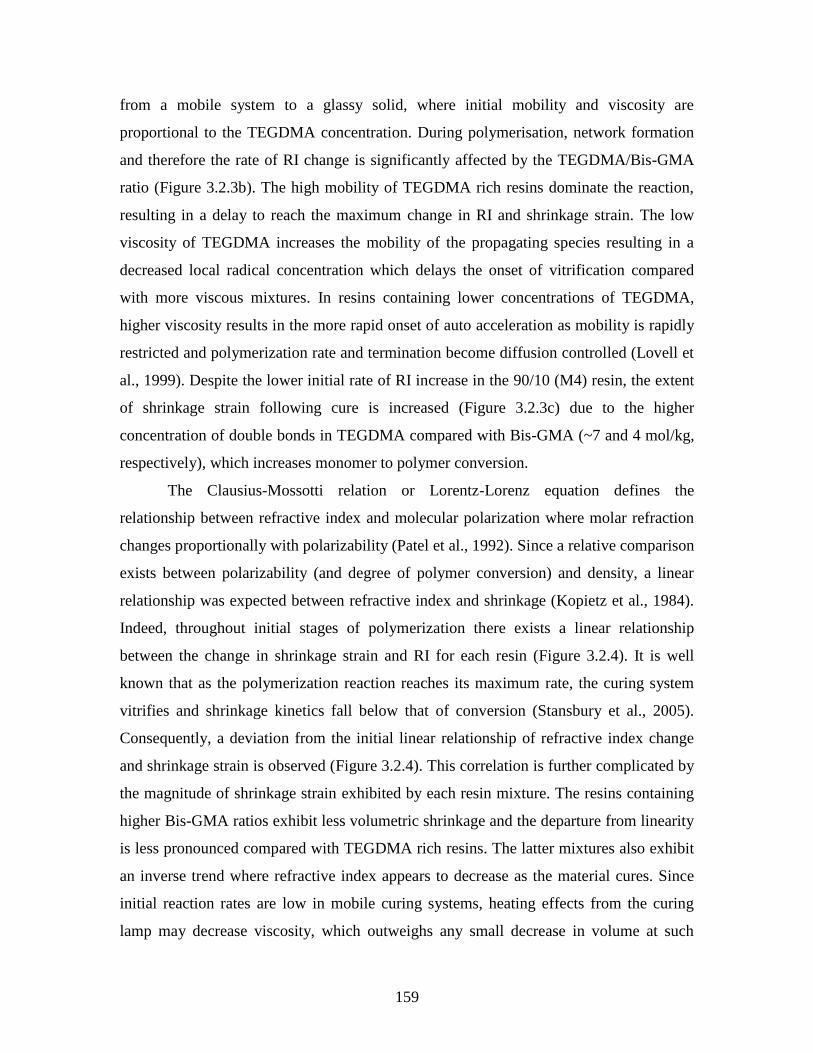
159
from a mobile system to a glassy solid, where initial mobility and viscosity are
proportional to the TEGDMA concentration. During polymerisation, network formation
and therefore the rate of RI change is significantly affected by the TEGDMA/Bis-GMA
ratio (Figure 3.2.3b). The high mobility of TEGDMA rich resins dominate the reaction,
resulting in a delay to reach the maximum change in RI and shrinkage strain. The low
viscosity of TEGDMA increases the mobility of the propagating species resulting in a
decreased local radical concentration which delays the onset of vitrification compared
with more viscous mixtures. In resins containing lower concentrations of TEGDMA,
higher viscosity results in the more rapid onset of auto acceleration as mobility is rapidly
restricted and polymerization rate and termination become diffusion controlled (Lovell et
al., 1999). Despite the lower initial rate of RI increase in the 90/10 (M4) resin, the extent
of shrinkage strain following cure is increased (Figure 3.2.3c) due to the higher
concentration of double bonds in TEGDMA compared with Bis-GMA (~7 and 4 mol/kg,
respectively), which increases monomer to polymer conversion.
The Clausius-Mossotti relation or Lorentz-Lorenz equation defines the
relationship between refractive index and molecular polarization where molar refraction
changes proportionally with polarizability (Patel et al., 1992). Since a relative comparison
exists between polarizability (and degree of polymer conversion) and density, a linear
relationship was expected between refractive index and shrinkage (Kopietz et al., 1984).
Indeed, throughout initial stages of polymerization there exists a linear relationship
between the change in shrinkage strain and RI for each resin (Figure 3.2.4). It is well
known that as the polymerization reaction reaches its maximum rate, the curing system
vitrifies and shrinkage kinetics fall below that of conversion (Stansbury et al., 2005).
Consequently, a deviation from the initial linear relationship of refractive index change
and shrinkage strain is observed (Figure 3.2.4). This correlation is further complicated by
the magnitude of shrinkage strain exhibited by each resin mixture. The resins containing
higher Bis-GMA ratios exhibit less volumetric shrinkage and the departure from linearity
is less pronounced compared with TEGDMA rich resins. The latter mixtures also exhibit
an inverse trend where refractive index appears to decrease as the material cures. Since
initial reaction rates are low in mobile curing systems, heating effects from the curing
lamp may decrease viscosity, which outweighs any small decrease in volume at such
160
slow rates of polymerization resulting in the apparent decrease in RI at early stages of
cure.
Specimen geometry is likely to significantly affect the shrinkage vectors of the
curing specimen. A low aspect ratio (where the specimen thickness approaches its
measured diameter) would be expected to cause multi-axial, rather than linear shrinkage
(Watts and Marouf, 2000), which would significantly affect both the measured optical
and physical thickness change of the curing specimen. Here, a large aspect ratio was
chosen to confine shrinkage to one direction and allow reliable correlations with
refractive index and thickness change. The effect of specimen geometry on dynamic
optical and physical properties will be investigated in Section 3.3 of this thesis.
161
3.2.6 Conclusion
Filler particle refractive indices vary between filler type but remain constant
throughout polymerization within a resin matrix (Shortall et al., 2008). The ability to
measure refractive index change of curing photoactive resins will allow for the design of
composite formulations, which exhibit optimum evolution of translucency (as the RI of
the curing resin approaches that of the filler) and enable precise control of aesthetic
quality, light transport through material bulk and curing depth. Furthermore, since
polymer conversion relates directly to polarizability and refractive index, development of
this technique (and miniaturisation of the components to a handheld device) will allow
for in-situ monitoring of the curing extent of resin-based materials and therefore
eliminate the risk of under cured restorations in clinical practice.
162
3.3 Specimen Aspect Ratio and Light-Transmission in Photoactive Resins
3.3.1 Abstract
This section tests the influence of specimen dimensions on light transmission and
shrinkage strain properties of curing dental resins. Experimental photocurable resins (Bis-
GMA/TEGDMA) were placed in cylindrical cavities in disc-shaped moulds with aspect
ratios (AR) ranging from 2-24; 4x2mm (AR: 2); 4x1mm (AR: 4); 8x2mm (AR: 4);
8x1mm (AR: 8); 12x1mm (AR: 12); and 12x0.5mm (AR: 24) were cured using a quartz
tungsten halogen light curing unit. Light transmission and shrinkage-strain data were
recorded throughout curing for 70 s. Surface hardness measurements were taken to
indirectly assess the extent of cure on the upper and lower surface of each specimen.
One-way ANOVAs and post-hoc Holm-Sidak revealed significant effects of specimen
dimensions on light transmission and Vickers hardness number (p<0.05). Cavity height
significantly affected initial and final light transmission in nearly all cases except for the
final light transmission in specimens with 12 mm diameter moulds (p<0.05). The lowest
AR specimens showed an increase in transmission above 100%, which may be due to a
possible „lens‟ effect caused by specimen constraint. The extent of lower surface cure (as
assessed by increasing micro-hardness) was principally affected by cavity height. Micro-
hardness was significantly lower for thicker specimens except for specimens with 8 mm
diameter (p<0.05). At constant thickness, only the 2 mm thick specimens showed
significantly higher lower surface cure with increasing diameter (p<0.05). The highest
AR specimen showed the significantly highest lower surface hardness percentage, which
represents almost equivalent cure on either side (p<0.05). Total shrinkage strain increased
with AR but no noticeable trends were observed at constant diameter and varying height.
Shrinkage strain per unit mass was significantly lower in most cases with increasing
diameter at constant height (p<0.05) except when diameter increased from 8 mm to 12
mm. Specimen constraint during polymerization in low AR cavities may compromise
light transmission as unexpected light intensity variations may occur for low
configuration factors. Improving light transmission through depth will ultimately improve
conversion and clinical longevity of the restoration.
163
3.3.2 Introduction
Photoactive dental RBCs are now widely used in restorative dentistry due to their
aesthetic properties and the choice of this material as an alternative for amalgam (Burke,
2004). However, polymerisation shrinkage of RBCs is a major concern amongst both
clinicians and researchers. Polymerisation induced shrinkage stress can lead to failure of
the interfacial bonds and can result in marginal leakage, premature failure of the
restoration, and in some cases micro, or even macro-cracking of the surrounding tooth
(Hübsch et al., 1999; Palin et al., 2005).
The shrinkage-strain induced during photo-polymerisation may be characterised
by its magnitude, direction (or vector character of strain) and time dependence. The strain
imposed during photo-polymerisation is not only influenced by the material factors such
as composition (Anseth et al., 1996; Section 3.2) but also shape and the size of the cavity
being restored as well as the compliance of the surrounding cavity (Feilzer et al., 1987;
Watts and Marouf, 2000). When the material undergoing shrinkage is bonded by
opposing cavity walls, strain becomes restricted and the final stress generated is given by
the product of the elastic modulus and the strain vectors (Davidson and Feilzer, 1997;
Sakaguchi and Ferracane, 1998). Not only is the stress magnitude determined by
characteristics of composites such as filler content (Condon and Ferracane, 2000), curing
rate (Bouschilcher and Rueggeberg, 2000) and degree of conversion (Braga and
Ferracane, 2002; Lu et al., 2004) but many authors have also reported that the final stress
is governed by the configuration factor (C-factor) of the cavity; the ratio of bonded to un-
bonded surfaces (Equation 3.3.1), which may also be given by the aspect ratio
(diameter/height), and the compliance of the system (Feilzer et al., 1987; Loguercio et
al., 2004; Braga et al., 2006; Watts and Satterthwaite, 2008). In the equation, r is the
cavity radius; h is the cavity height and is the cavity diameter.
hh
r
rh
rC f
22
2 2
Equation 3.3.1
Previous investigations have suggested that C-factors less than 1 result in the slow
164
development of shrinkage stress and the composite remains bonded to the cavity walls
(Davidson and de Gee, 1984; Feilzer et al., 1987). The C-factor itself is governed by the
geometry of the cavity, i.e. the diameter and the height which both independently
influence the generation of shrinkage-stress. A recent investigation by Watts et al (2008)
reported that at a constant height, with diameter variation, a C-factor increase from 0.6 to
6 gave an exact exponential decrease in shrinkage-stress, whereas at constant diameter
with height variation, an increase in C-factor from 3-100 gave an increase in shrinkage-
stress (Watts and Satterthwaite, 2008). It is clear that the stress generated during
polymerisation cannot simply be extrapolated to C-factor and is dependent upon several
other properties, amongst which volume and mass as well as the ratio of bonded to non-
bonded surfaces will influence the final stress as-well as bonding or lack of such to
mould or tooth and matrix surfaces and compliance of such (Watts and Marouf, 2000;
Braga et al., 2006; Watts and Satterthwaite, 2008).
The transmission of light and number of photons absorbed by the photoinitiator is
critically important to the extent of polymerisation and is a desired parameter to fully
characterize since it ultimately relates to the final mechanical and physical properties of
the polymer. Inefficient light transmission and limited cure depths are associated with
surface reflection (Harrington and Wilson, 1995), absorption (Chen et al., 2007;
Ogunyinka et al., 2007) and interfacial scattering (Shortall et al., 2008; Feng et al., 2010).
Upon polymerisation, photoinitiator decomposition will reduce the concentration of light
absorbers (Section 3.1) and polymerisation shrinkage (Section 3.2) will reduce the optical
path length, which will increase the transmitted light through the sample according to
Beer-Lamberts law (Equation 3.3.2).
0
logI
IClA Equation 3.3.2
where A is the absorbance, l is the optical path length, C and are the concentration and
molar extinction coefficient of the absorbing species (i.e the photoinitiator) and I and
0I are the light transmission and initial light transmission, respectively.
165
Varying patterns of light transmission through filled and unfilled photocurable
resins have been reported. Harrington et al. (1996) demonstrated a method, which
allowed the actual consumption of light energy by the photoinitiator to be calculated and
showed increasing light intensity with radiation time for commercial composites
(Harrington et al., 1996). Using the same technique, Ogunyinka et al. (2007) reported
decreasing transmission during polymerisation of experimental composite formulations.
Shortall et al. (2008) showed the effect of monomer and filler composition on light
transmission and reported that the refractive index mis-match between filler and resin
will affect its light transmission profile where maximum transmission is observed when
the refractive index of the resin and filler are equal. Section 3.2 also demonstrated the
effect of monomer composition on the variation in optical properties and physical
thickness change in unfilled resins during irradiation. Although shrinkage strain was
dependent upon material composition, cavity constraint is likely to affect shrinkage strain
development, which in turn may affect light transmission. Consequently, this Section
tests the following hypotheses:
i) For high specimen aspect ratio, increased shrinkage strain will increase
final light transmission in curing photoactive resins.
ii) If a higher final light transmission is observed, then curing extent will also
improve.
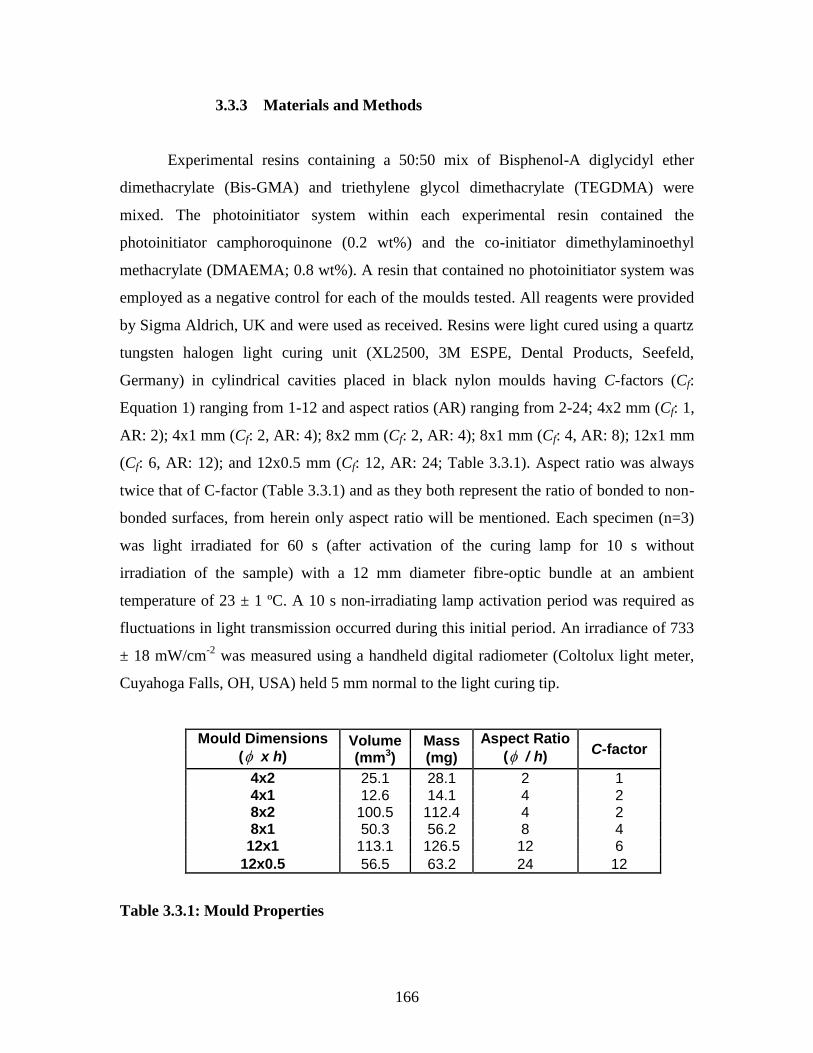
166
3.3.3 Materials and Methods
Experimental resins containing a 50:50 mix of Bisphenol-A diglycidyl ether
dimethacrylate (Bis-GMA) and triethylene glycol dimethacrylate (TEGDMA) were
mixed. The photoinitiator system within each experimental resin contained the
photoinitiator camphoroquinone (0.2 wt%) and the co-initiator dimethylaminoethyl
methacrylate (DMAEMA; 0.8 wt%). A resin that contained no photoinitiator system was
employed as a negative control for each of the moulds tested. All reagents were provided
by Sigma Aldrich, UK and were used as received. Resins were light cured using a quartz
tungsten halogen light curing unit (XL2500, 3M ESPE, Dental Products, Seefeld,
Germany) in cylindrical cavities placed in black nylon moulds having C-factors (Cf:
Equation 1) ranging from 1-12 and aspect ratios (AR) ranging from 2-24; 4x2 mm (Cf: 1,
AR: 2); 4x1 mm (Cf: 2, AR: 4); 8x2 mm (Cf: 2, AR: 4); 8x1 mm (Cf: 4, AR: 8); 12x1 mm
(Cf: 6, AR: 12); and 12x0.5 mm (Cf: 12, AR: 24; Table 3.3.1). Aspect ratio was always
twice that of C-factor (Table 3.3.1) and as they both represent the ratio of bonded to non-
bonded surfaces, from herein only aspect ratio will be mentioned. Each specimen (n=3)
was light irradiated for 60 s (after activation of the curing lamp for 10 s without
irradiation of the sample) with a 12 mm diameter fibre-optic bundle at an ambient
temperature of 23 ± 1 ºC. A 10 s non-irradiating lamp activation period was required as
fluctuations in light transmission occurred during this initial period. An irradiance of 733
± 18 mW/cm-2
was measured using a handheld digital radiometer (Coltolux light meter,
Cuyahoga Falls, OH, USA) held 5 mm normal to the light curing tip.
Mould Dimensions
( x h) Volume (mm3)
Mass (mg)
Aspect Ratio
( / h) C-factor
4x2 25.1 28.1 2 1 4x1 12.6 14.1 4 2 8x2 100.5 112.4 4 2 8x1 50.3 56.2 8 4
12x1 113.1 126.5 12 6
12x0.5 56.5 63.2 24 12
Table 3.3.1: Mould Properties
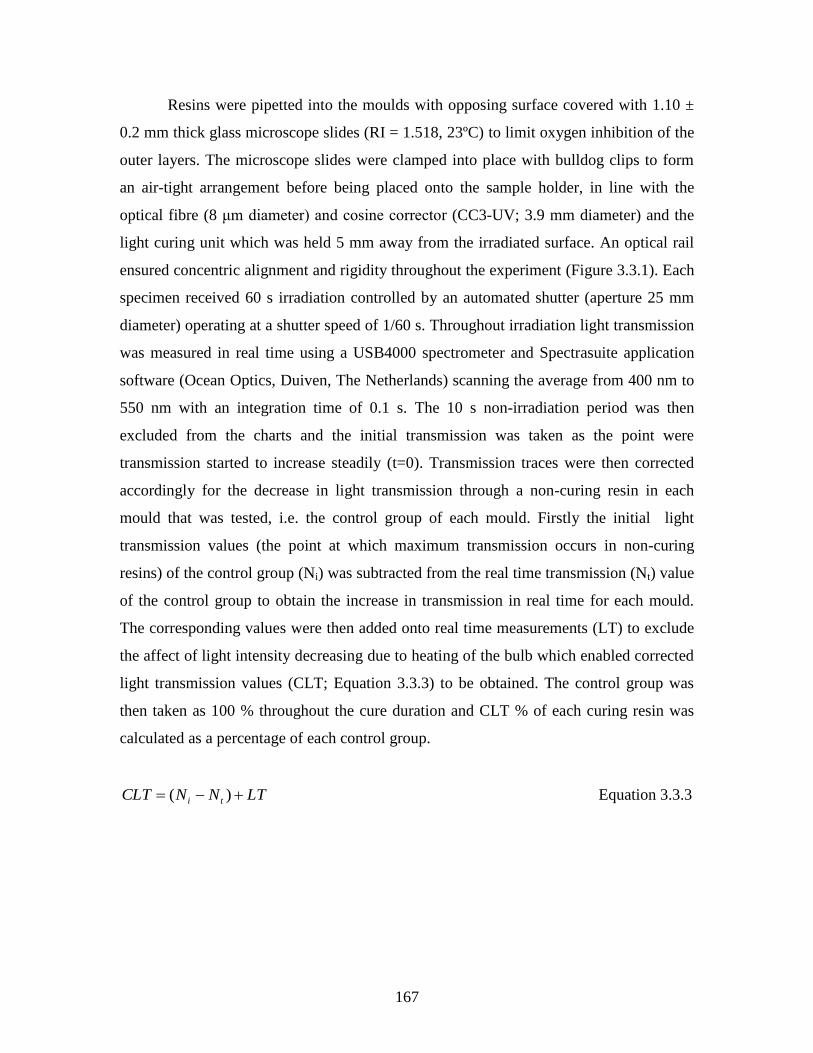
167
Resins were pipetted into the moulds with opposing surface covered with 1.10 ±
0.2 mm thick glass microscope slides (RI = 1.518, 23ºC) to limit oxygen inhibition of the
outer layers. The microscope slides were clamped into place with bulldog clips to form
an air-tight arrangement before being placed onto the sample holder, in line with the
optical fibre (8 μm diameter) and cosine corrector (CC3-UV; 3.9 mm diameter) and the
light curing unit which was held 5 mm away from the irradiated surface. An optical rail
ensured concentric alignment and rigidity throughout the experiment (Figure 3.3.1). Each
specimen received 60 s irradiation controlled by an automated shutter (aperture 25 mm
diameter) operating at a shutter speed of 1/60 s. Throughout irradiation light transmission
was measured in real time using a USB4000 spectrometer and Spectrasuite application
software (Ocean Optics, Duiven, The Netherlands) scanning the average from 400 nm to
550 nm with an integration time of 0.1 s. The 10 s non-irradiation period was then
excluded from the charts and the initial transmission was taken as the point were
transmission started to increase steadily (t=0). Transmission traces were then corrected
accordingly for the decrease in light transmission through a non-curing resin in each
mould that was tested, i.e. the control group of each mould. Firstly the initial light
transmission values (the point at which maximum transmission occurs in non-curing
resins) of the control group (Ni) was subtracted from the real time transmission (Nt) value
of the control group to obtain the increase in transmission in real time for each mould.
The corresponding values were then added onto real time measurements (LT) to exclude
the affect of light intensity decreasing due to heating of the bulb which enabled corrected
light transmission values (CLT; Equation 3.3.3) to be obtained. The control group was
then taken as 100 % throughout the cure duration and CLT % of each curing resin was
calculated as a percentage of each control group.
LTNNCLT ti )( Equation 3.3.3
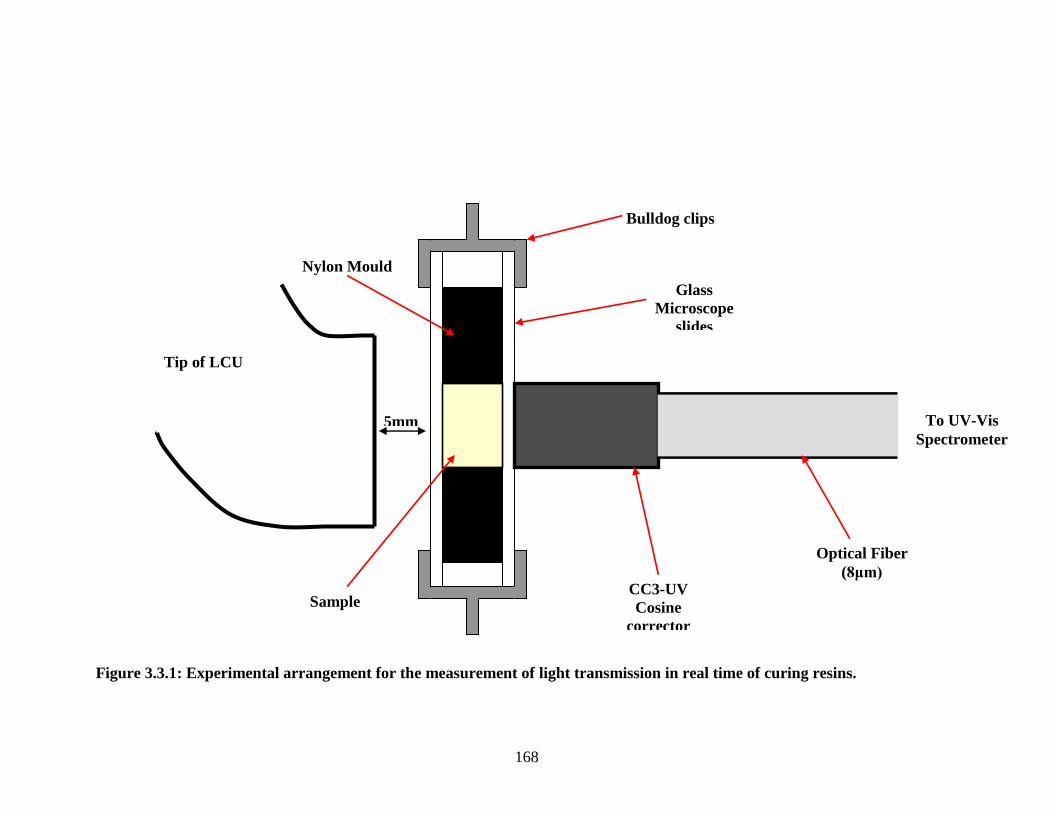
168
Figure 3.3.1: Experimental arrangement for the measurement of light transmission in real time of curing resins.
Tip of LCU
5mm
Optical Fiber
(8μm) CC3-UV
Cosine
corrector
Glass
Microscope
slides
Bulldog clips
Sample
Nylon Mould
To UV-Vis
Spectrometer
169
Shrinkage strain measurements were based on low coherence interferometry
methods developed in Section 3.2. The bespoke configuration comprises of a Michelson
interferometer arrangement, which has a super luminescent diode (L2KASLD16-015-
BFA; Amonics, Kowloon, Hong Kong) broadband light source with a centre wavelength
at 1624 nm which allows shrinkage-strain to be measured centrally in each sample
(Figure 3.3.2). An optical time delay is modulated by changing the position of the
reference arm with a voice coil stage (VCS10-023-BS-1, H2W Technologies, Inc., USA)
which produces interference fringes. The „off the shelf‟ fibre coupled InGaAs
photodetector (PDB120C; Thorlabs, Cambridgeshire, UK) allows the detection of the
interference fringes from the sample and the reference arm. Each specimen was
polymerised using an identical curing protocol as that used for light transmission
measurements. A bespoke computer programme was used to automate the processing of
the spectral data to obtain shrinkage strain information in real-time. Since mass plays a
dominant role (Watts and Satterthwaite, 2008), plots of strain variations per unit
composite mass separated the effects which mould dimensions had on strain developed
centrally at the specimen mid-point.
170
Figure 3.3.2: Experimental arrangement for the measurement of real time
shrinkage-strain
Tip of LCU
Optical Fiber to Low
Coherence
Interferometer
Focusing Lens
X-Y Stage to allow the
measurement of
reference points
Infra-Red Beam of
Broadband Light source
Glass Microscope Slides
Sample
Nylon Mould
Platform and Rotation
Stage containing an
automatic shutter
5mm
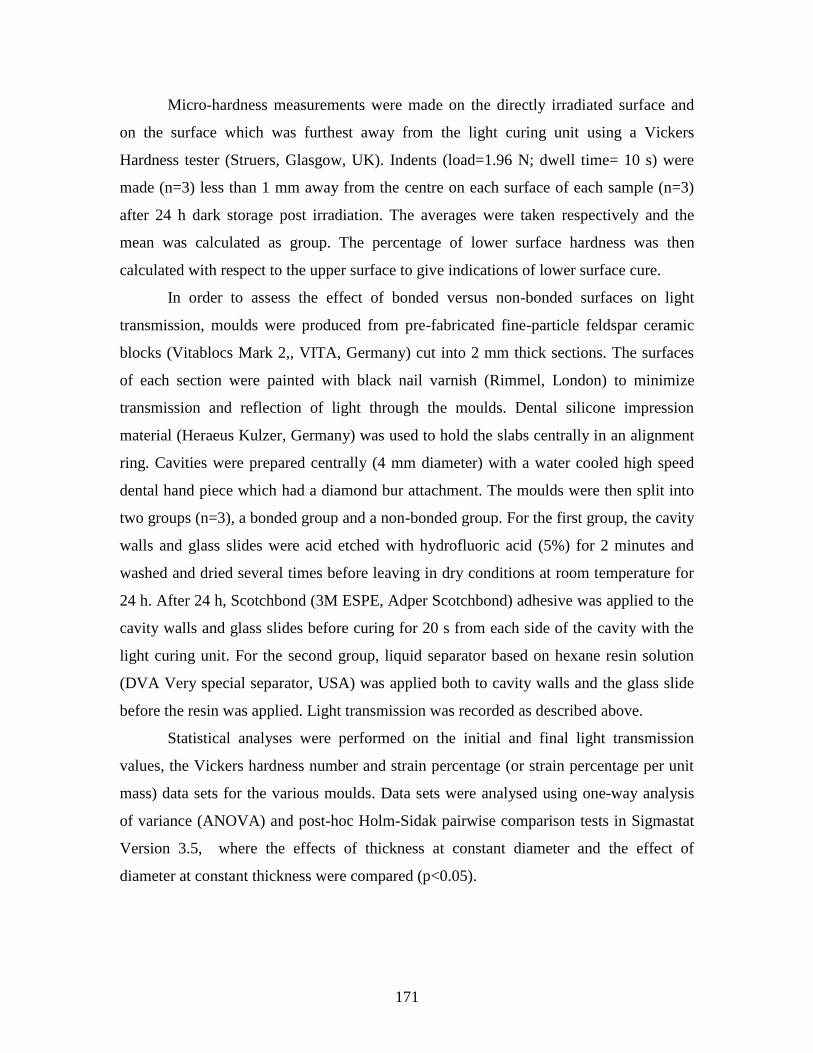
171
Micro-hardness measurements were made on the directly irradiated surface and
on the surface which was furthest away from the light curing unit using a Vickers
Hardness tester (Struers, Glasgow, UK). Indents (load=1.96 N; dwell time= 10 s) were
made (n=3) less than 1 mm away from the centre on each surface of each sample (n=3)
after 24 h dark storage post irradiation. The averages were taken respectively and the
mean was calculated as group. The percentage of lower surface hardness was then
calculated with respect to the upper surface to give indications of lower surface cure.
In order to assess the effect of bonded versus non-bonded surfaces on light
transmission, moulds were produced from pre-fabricated fine-particle feldspar ceramic
blocks (Vitablocs Mark 2,, VITA, Germany) cut into 2 mm thick sections. The surfaces
of each section were painted with black nail varnish (Rimmel, London) to minimize
transmission and reflection of light through the moulds. Dental silicone impression
material (Heraeus Kulzer, Germany) was used to hold the slabs centrally in an alignment
ring. Cavities were prepared centrally (4 mm diameter) with a water cooled high speed
dental hand piece which had a diamond bur attachment. The moulds were then split into
two groups (n=3), a bonded group and a non-bonded group. For the first group, the cavity
walls and glass slides were acid etched with hydrofluoric acid (5%) for 2 minutes and
washed and dried several times before leaving in dry conditions at room temperature for
24 h. After 24 h, Scotchbond (3M ESPE, Adper Scotchbond) adhesive was applied to the
cavity walls and glass slides before curing for 20 s from each side of the cavity with the
light curing unit. For the second group, liquid separator based on hexane resin solution
(DVA Very special separator, USA) was applied both to cavity walls and the glass slide
before the resin was applied. Light transmission was recorded as described above.
Statistical analyses were performed on the initial and final light transmission
values, the Vickers hardness number and strain percentage (or strain percentage per unit
mass) data sets for the various moulds. Data sets were analysed using one-way analysis
of variance (ANOVA) and post-hoc Holm-Sidak pairwise comparison tests in Sigmastat
Version 3.5, where the effects of thickness at constant diameter and the effect of
diameter at constant thickness were compared (p<0.05).
172
3.3.4 Results
The one-way ANOVA‟s revealed a significant difference between the cavity
dimensions for each of the responses. The initial light transmission was significantly
affected by the cavity height (p<0.05) where decreasing transmission was observed with
increasing height (Table 3.3.2a and Figure 3.3.3). For increasing diameter at constant
thickness only the 1 mm thick moulds showed a significant decrease in initial
transmission (p<0.003) for 4 to 8mm and 12 mm wide specimens but not from 8 to 12
mm wide specimens (Table 3.3.2b and Figure 3.3.3). However, although some of the
effects of diameter where insignificant, a noticeable decrease in initial light transmission
was observed with increasing diameter and volume at constant height (Table 3.3.1; Table
3.3.2b and Figure 3.3.3). For final light transmission, thicker moulds at constant diameter
showed significantly higher transmission (p<0.05) except for the 12 mm diameter
specimens where the effect of thickness was insignificant (Table 3.3.2a). At constant
thickness, narrow specimens showed significantly higher final transmission although the
change from 8x1 mm to 12x1 mm was not significant (Table 3.3.2b). Specimens cured in
the thickest and narrowest mould (4x2 mm) showed the most significant increase in light
transmission (>100%) during irradiation in comparison to the other specimen groups
(p<0.05; Table 3.3.2 and Figure 3.3.3).
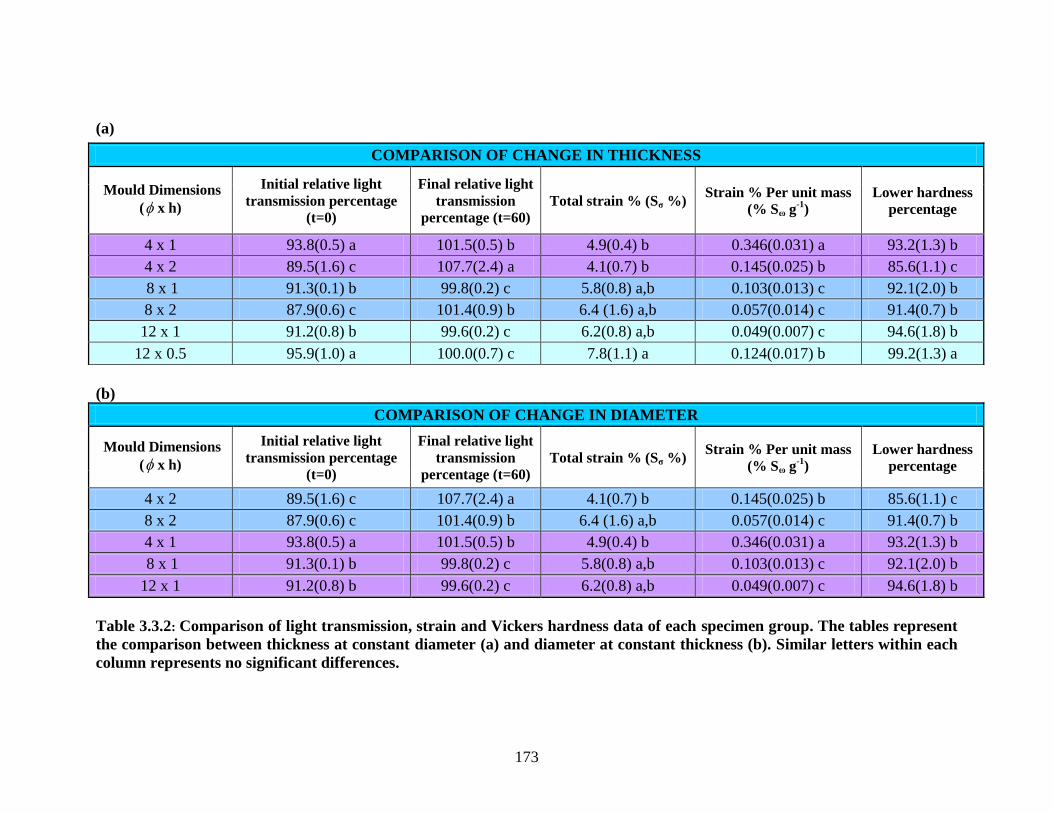
173
(a)
(b)
COMPARISON OF CHANGE IN DIAMETER
Mould Dimensions
( x h)
Initial relative light
transmission percentage
(t=0)
Final relative light
transmission
percentage (t=60)
Total strain % (Sσ %) Strain % Per unit mass
(% Sω g-1
)
Lower hardness
percentage
4 x 2 89.5(1.6) c 107.7(2.4) a 4.1(0.7) b 0.145(0.025) b 85.6(1.1) c
8 x 2 87.9(0.6) c 101.4(0.9) b 6.4 (1.6) a,b 0.057(0.014) c 91.4(0.7) b
4 x 1 93.8(0.5) a 101.5(0.5) b 4.9(0.4) b 0.346(0.031) a 93.2(1.3) b
8 x 1 91.3(0.1) b 99.8(0.2) c 5.8(0.8) a,b 0.103(0.013) c 92.1(2.0) b
12 x 1 91.2(0.8) b 99.6(0.2) c 6.2(0.8) a,b 0.049(0.007) c 94.6(1.8) b
Table 3.3.2: Comparison of light transmission, strain and Vickers hardness data of each specimen group. The tables represent
the comparison between thickness at constant diameter (a) and diameter at constant thickness (b). Similar letters within each
column represents no significant differences.
COMPARISON OF CHANGE IN THICKNESS
Mould Dimensions
( x h)
Initial relative light
transmission percentage
(t=0)
Final relative light
transmission
percentage (t=60)
Total strain % (Sσ %) Strain % Per unit mass
(% Sω g-1
)
Lower hardness
percentage
4 x 1 93.8(0.5) a 101.5(0.5) b 4.9(0.4) b 0.346(0.031) a 93.2(1.3) b
4 x 2 89.5(1.6) c 107.7(2.4) a 4.1(0.7) b 0.145(0.025) b 85.6(1.1) c
8 x 1 91.3(0.1) b 99.8(0.2) c 5.8(0.8) a,b 0.103(0.013) c 92.1(2.0) b
8 x 2 87.9(0.6) c 101.4(0.9) b 6.4 (1.6) a,b 0.057(0.014) c 91.4(0.7) b
12 x 1 91.2(0.8) b 99.6(0.2) c 6.2(0.8) a,b 0.049(0.007) c 94.6(1.8) b
12 x 0.5 95.9(1.0) a 100.0(0.7) c 7.8(1.1) a 0.124(0.017) b 99.2(1.3) a
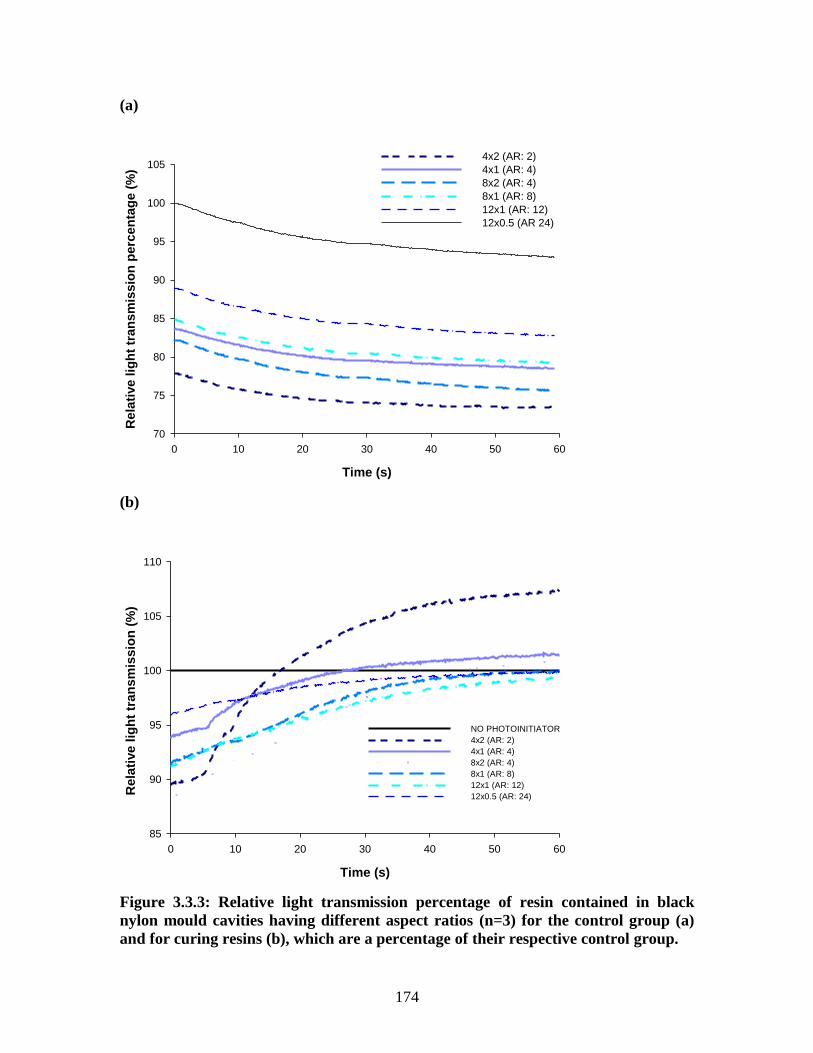
174
(a)
Time (s)
0 10 20 30 40 50 60
Rela
tive l
igh
t tr
an
sm
issio
n p
erc
en
tag
e (
%)
70
75
80
85
90
95
100
1054x2 (AR: 2)
4x1 (AR: 4)
8x2 (AR: 4)
8x1 (AR: 8)
12x1 (AR: 12)
12x0.5 (AR 24)
(b)
Time (s)
0 10 20 30 40 50 60
Re
lati
ve
lig
ht
tra
ns
mis
sio
n (
%)
85
90
95
100
105
110
NO PHOTOINITIATOR
4x2 (AR: 2)
4x1 (AR: 4)
8x2 (AR: 4)
8x1 (AR: 8)
12x1 (AR: 12)
12x0.5 (AR: 24)
Figure 3.3.3: Relative light transmission percentage of resin contained in black
nylon mould cavities having different aspect ratios (n=3) for the control group (a)
and for curing resins (b), which are a percentage of their respective control group.
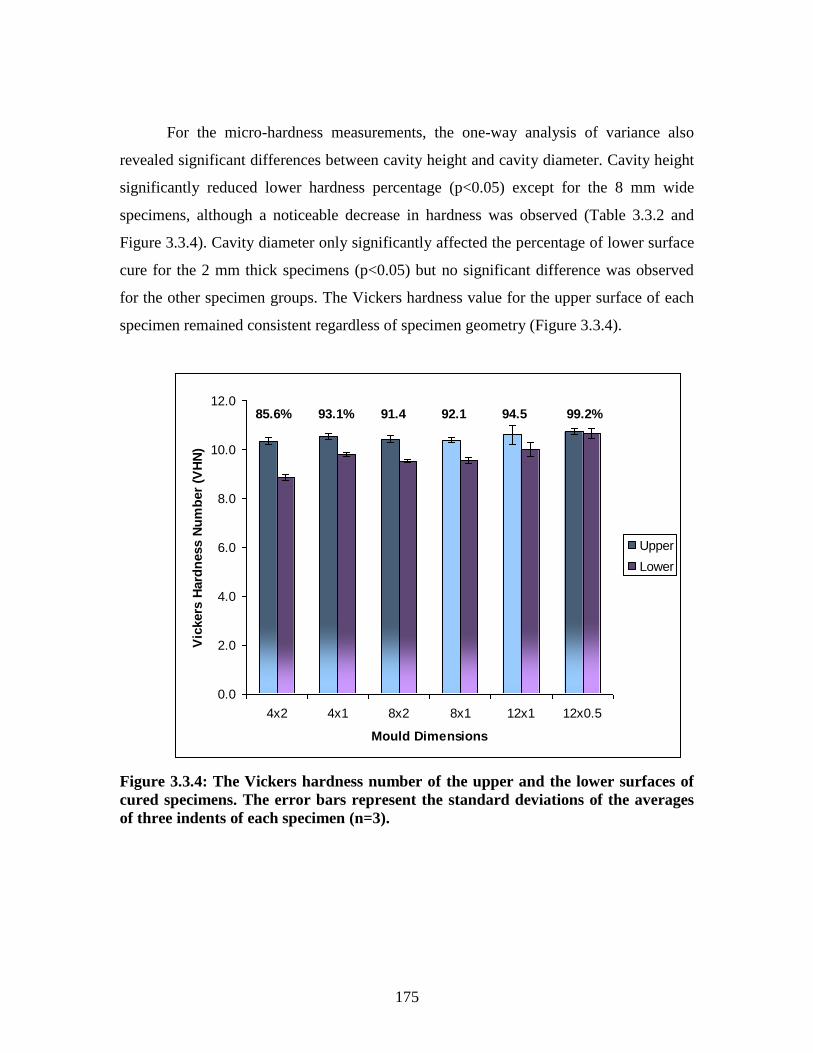
175
For the micro-hardness measurements, the one-way analysis of variance also
revealed significant differences between cavity height and cavity diameter. Cavity height
significantly reduced lower hardness percentage (p<0.05) except for the 8 mm wide
specimens, although a noticeable decrease in hardness was observed (Table 3.3.2 and
Figure 3.3.4). Cavity diameter only significantly affected the percentage of lower surface
cure for the 2 mm thick specimens (p<0.05) but no significant difference was observed
for the other specimen groups. The Vickers hardness value for the upper surface of each
specimen remained consistent regardless of specimen geometry (Figure 3.3.4).
0.0
2.0
4.0
6.0
8.0
10.0
12.0
4x2 4x1 8x2 8x1 12x1 12x0.5
Mould Dimensions
Vic
kers
Hard
ness N
um
ber
(VH
N)
Upper
Lower
85.6% 93.1% 91.4 92.1 94.5 99.2%
Figure 3.3.4: The Vickers hardness number of the upper and the lower surfaces of
cured specimens. The error bars represent the standard deviations of the averages
of three indents of each specimen (n=3).
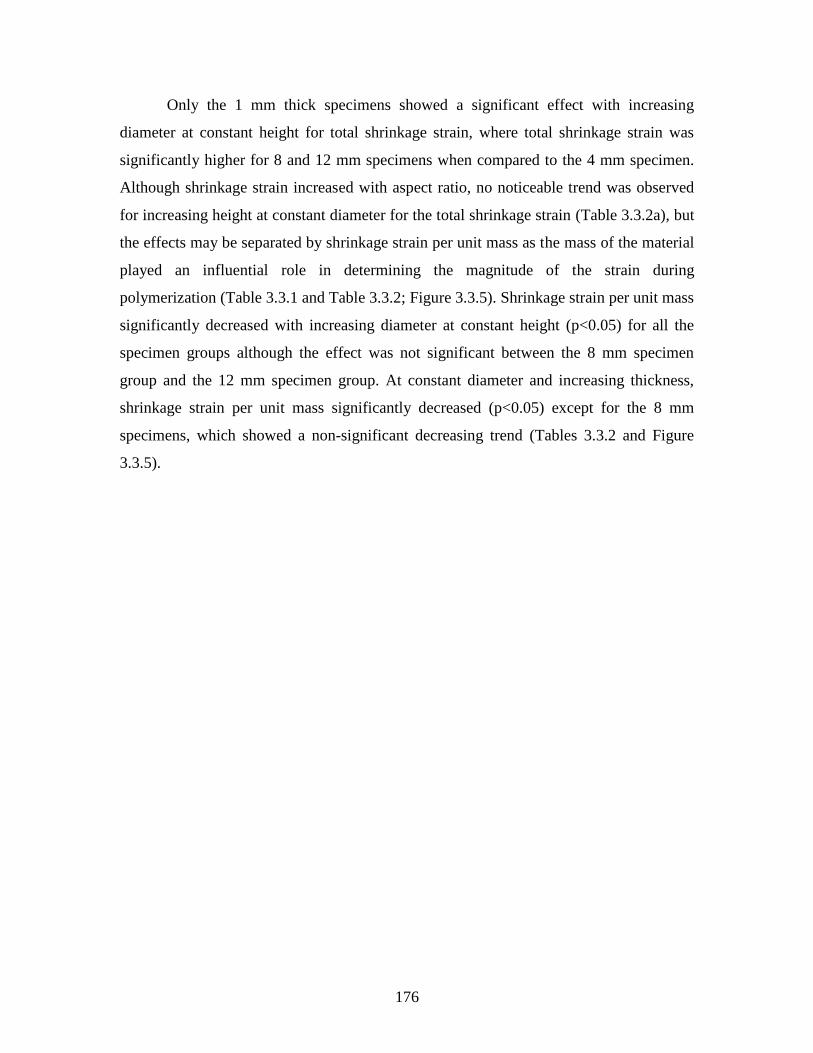
176
Only the 1 mm thick specimens showed a significant effect with increasing
diameter at constant height for total shrinkage strain, where total shrinkage strain was
significantly higher for 8 and 12 mm specimens when compared to the 4 mm specimen.
Although shrinkage strain increased with aspect ratio, no noticeable trend was observed
for increasing height at constant diameter for the total shrinkage strain (Table 3.3.2a), but
the effects may be separated by shrinkage strain per unit mass as the mass of the material
played an influential role in determining the magnitude of the strain during
polymerization (Table 3.3.1 and Table 3.3.2; Figure 3.3.5). Shrinkage strain per unit mass
significantly decreased with increasing diameter at constant height (p<0.05) for all the
specimen groups although the effect was not significant between the 8 mm specimen
group and the 12 mm specimen group. At constant diameter and increasing thickness,
shrinkage strain per unit mass significantly decreased (p<0.05) except for the 8 mm
specimens, which showed a non-significant decreasing trend (Tables 3.3.2 and Figure
3.3.5).
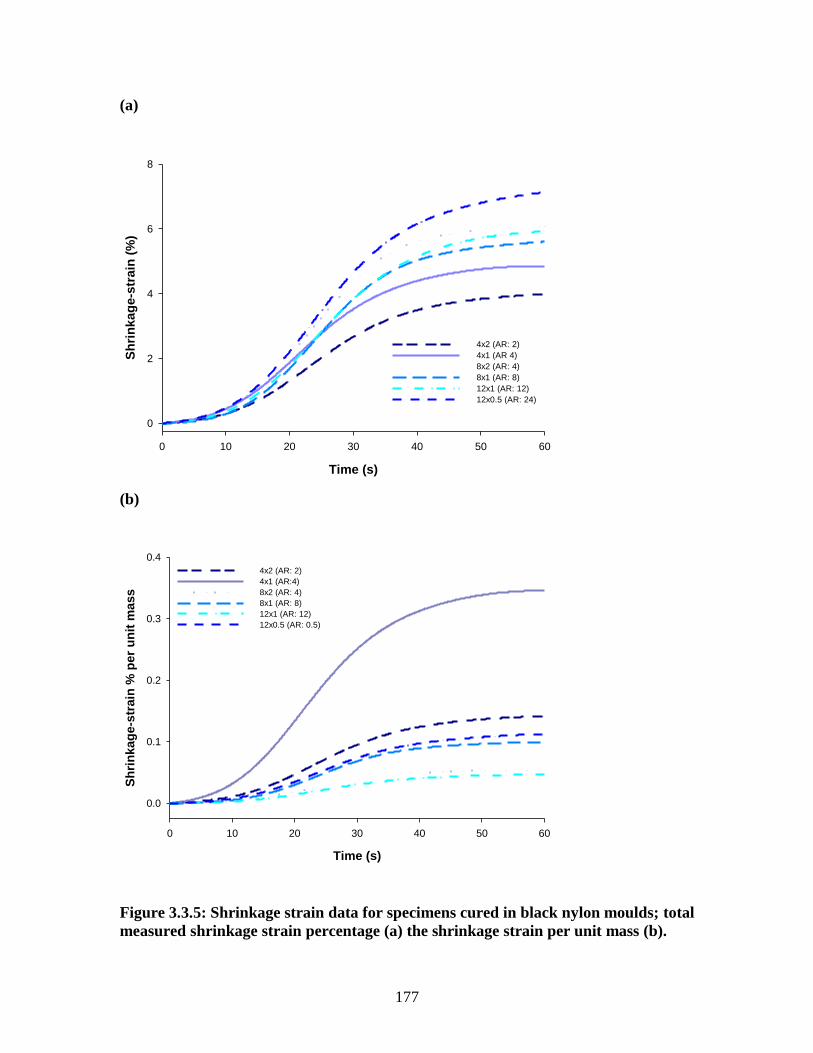
177
(a)
Time (s)
0 10 20 30 40 50 60
Sh
rin
ka
ge
-str
ain
(%
)
0
2
4
6
8
4x2 (AR: 2)
4x1 (AR 4)
8x2 (AR: 4)
8x1 (AR: 8)
12x1 (AR: 12)
12x0.5 (AR: 24)
(b)
Time (s)
0 10 20 30 40 50 60
Sh
rin
kag
e-s
train
% p
er
un
it m
ass
0.0
0.1
0.2
0.3
0.4
4x2 (AR: 2)
4x1 (AR:4)
8x2 (AR: 4)
8x1 (AR: 8)
12x1 (AR: 12)
12x0.5 (AR: 0.5)
Figure 3.3.5: Shrinkage strain data for specimens cured in black nylon moulds; total
measured shrinkage strain percentage (a) the shrinkage strain per unit mass (b).
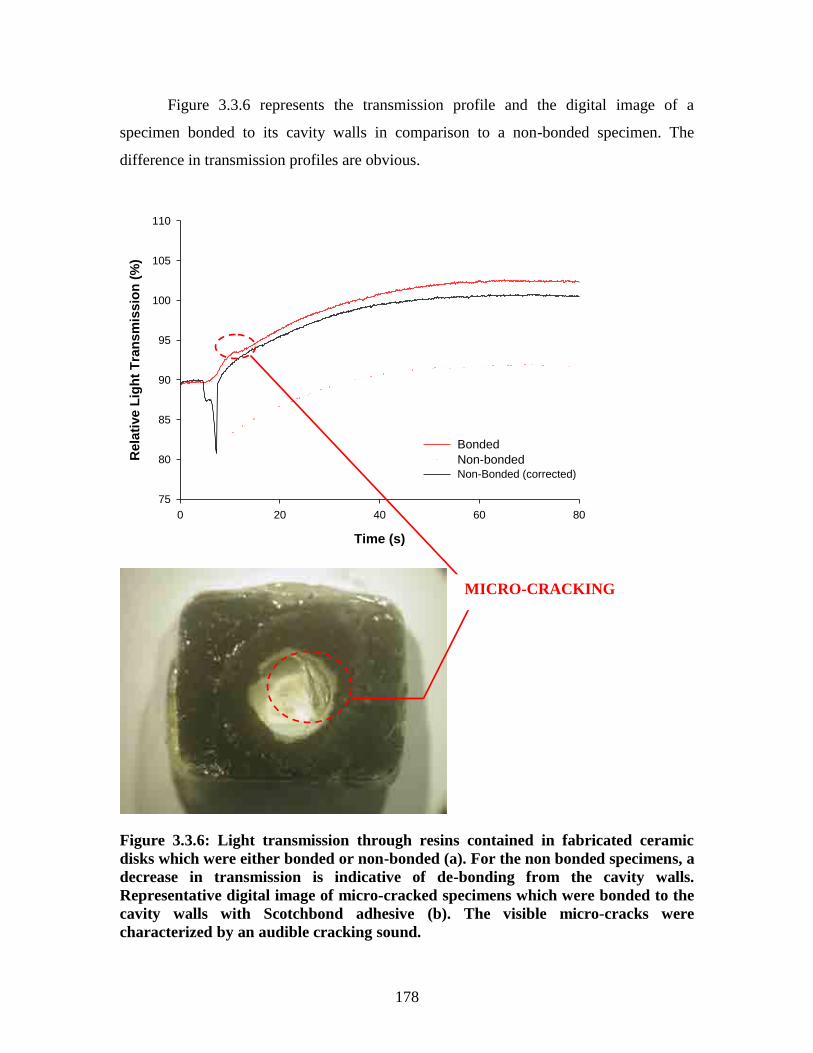
178
Figure 3.3.6 represents the transmission profile and the digital image of a
specimen bonded to its cavity walls in comparison to a non-bonded specimen. The
difference in transmission profiles are obvious.
Time (s)
0 20 40 60 80
Re
lati
ve
Lig
ht
Tra
ns
mis
sio
n (
%)
75
80
85
90
95
100
105
110
Bonded
Non-bondedNon-Bonded (corrected)
Figure 3.3.6: Light transmission through resins contained in fabricated ceramic
disks which were either bonded or non-bonded (a). For the non bonded specimens, a
decrease in transmission is indicative of de-bonding from the cavity walls.
Representative digital image of micro-cracked specimens which were bonded to the
cavity walls with Scotchbond adhesive (b). The visible micro-cracks were
characterized by an audible cracking sound.
MICRO-CRACKING
179
3.3.5 Discussion
The first hypothesis was accepted as mould cavity dimensions affected light
transmission. The transmission of light is governed by Beer-Lamberts law (Equation
3.3.2) and as such it should be expected that only changes in specimen height (l) will
affect light transmission. Therefore, it might have been expected that diametrical changes
(i.e. increasing specimen diameter at constant height) would have had no affect on initial
light transmission as light is only detected at the center of each specimen. However, this
was not observed and interestingly at similar thickness, wider specimens showed less
initial light transmission, significantly in the case of 1 mm thick specimens. This may
seem unexpected as a previous study reported that narrow specimens at similar thickness
exhibited reduced light transmission as a greater amount of light was attenuated due to
absorption by the cavity walls of the black nylotron moulds (Harrington et al., 1993).
Interestingly in the present investigation, this was only observed for the control groups
(without photoinitiator), which showed improved light transmission with increasing
diameter at similar thickness. The reduced initial light transmission in the curing resins
for wider specimens may be related to the greater volume of resin (and increased
photoinitiator molecules within the volume), which may increase the absorption and
attenuation of light. The peripheral absorption and attenuation may be related to the fact
that greater absorption occurs by the photoinitiator than the cavity walls of the mould,
which resulted in the reduced transmission. Such an effect may be reduced in relatively
wide specimens as the CC3-UV cosine corrector is only capable of registering directly
transmitted light normal to the specimen surface with a field of view of 180◦, which may
account for the non-significant decrease in initial light transmission for the 12x1 mm
specimen when compared to the 8x1 mm specimen (Table 3.3.2b). Furthermore, typical
halogen lights such as the XL2500 have a Gaussian distribution of light irradiance across
the tip diameter (Price et al., 2010) and therefore any edge effects on light transmission
for wider specimens will be reduced which may also account for the non-significant data.
Nonetheless, the highest initial light transmission was seen for the thinnest and widest
specimen whereas the thickest and widest specimens showed the lowest initial light
transmission (Tables 3.3.2 and Figure 3.3.3). This might be directly related to Beer-
180
Lamberts law as absorption increases proportionally with optical pathlength (i.e.
thickness) and concentration of absorbing species (i.e. photoinitiator molecules as the
given volume increases), which would reduce the intensity of the propagating light.
During polymerisation, the light transmission is also governed by the same law,
and is affected by dynamic changes in pathlength and photoinitiator properties (Section
3.1 and 3.2). Consequently, the observed light transmission traces may not represent the
„true‟ transmission as correcting for such changes become complicated. Therefore, part of
the observed increase in light transmission traces may be due to specimen shrinkage and
photoinitiator decomposition (Chen et al., 2007). However, the effect of sample
deformation to increase light transmission is also a possibility where a „lens effect‟ due to
shrinkage causes the surface of the sample to bow. Convex lenses typically converge
light into a focused beam and will tend to improve the intensity of light detected by the
cosine corrector. In contrast to this, concave lenses typically „diverge‟ the light and
spread the beam, which will reduce the intensity detected by the cosine corrector (Figure
3.3.7). It is interesting to note that Asmussen and Peutzfeldt (1999) reported finding a
convexity of the sample surface closest to the light and concavity of the surface furthest
away from the light for composites cured in 6 mm diameter moulds having thickness of
up to 6 mm, which indicates a convex-concave scenario (Figure 3.3.7). Therefore the
increased light transmission may well be due to the formation of a convex-concave lens,
which will tend to focus the beam onto the cosine corrector. The deformation may be
greater in narrow-thick specimens (i.e. 4x2 mm) due to shrinkage vectors occurring
axially as well as non-axially as a consequence of the lower aspect ratio (Watts et al.,
2003), which may account for the substantially high increase in light transmission
(>100%). However, without surface profilometry (ideally 3-D), this may not be
confirmed and remains speculative. Nonetheless, improved light transmission is
associated with improved degree of conversion and improved mechanical properties such
as strength, elastic modulus and hardness (Price et al., 2002; Palin et al., 2008), although
some physical properties such as shrinkage may increase for conventional resins with
improved degree of conversion (Braga et al., 2005).
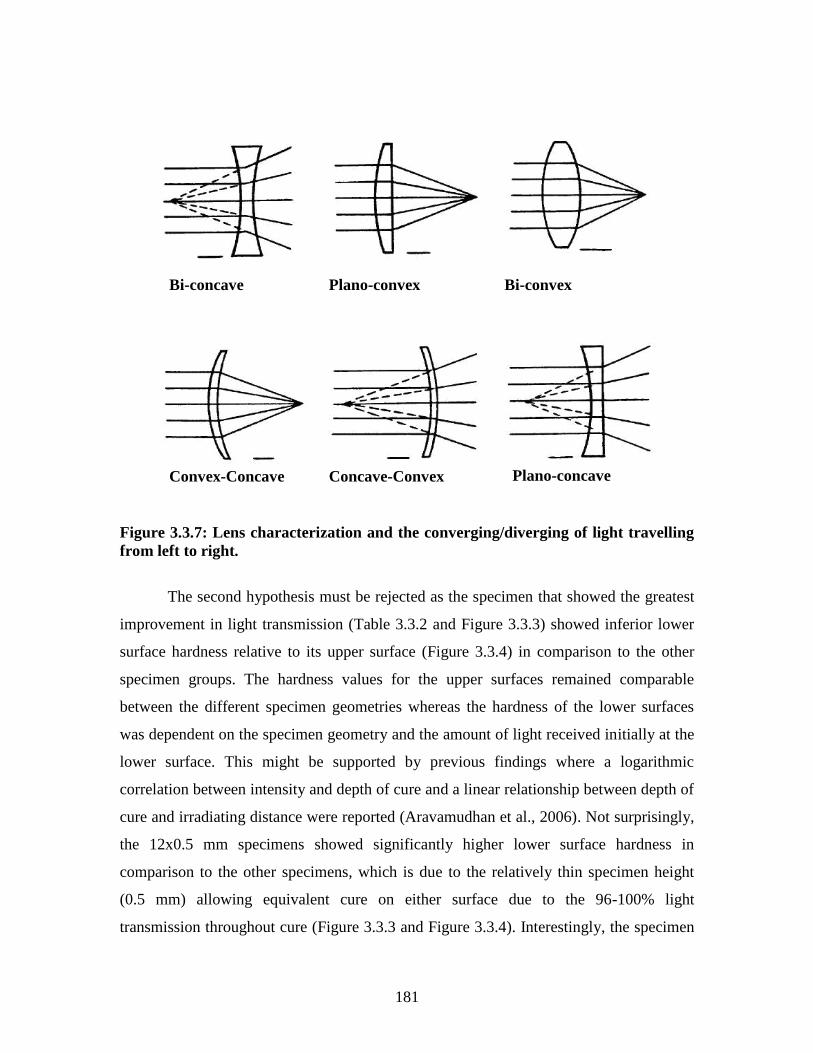
181
Figure 3.3.7: Lens characterization and the converging/diverging of light travelling
from left to right.
The second hypothesis must be rejected as the specimen that showed the greatest
improvement in light transmission (Table 3.3.2 and Figure 3.3.3) showed inferior lower
surface hardness relative to its upper surface (Figure 3.3.4) in comparison to the other
specimen groups. The hardness values for the upper surfaces remained comparable
between the different specimen geometries whereas the hardness of the lower surfaces
was dependent on the specimen geometry and the amount of light received initially at the
lower surface. This might be supported by previous findings where a logarithmic
correlation between intensity and depth of cure and a linear relationship between depth of
cure and irradiating distance were reported (Aravamudhan et al., 2006). Not surprisingly,
the 12x0.5 mm specimens showed significantly higher lower surface hardness in
comparison to the other specimens, which is due to the relatively thin specimen height
(0.5 mm) allowing equivalent cure on either surface due to the 96-100% light
transmission throughout cure (Figure 3.3.3 and Figure 3.3.4). Interestingly, the specimen
Bi-concave Plano-convex Bi-convex
Convex-Concave Concave-Convex
Plano-concave
182
group that showed the highest final light transmission had the lowest lower surface
hardness. However, the substantially high increase in light transmission (>100%; Figure
3.3.3) for the lowest aspect ratio mould may not reflect „true‟ transmission as previously
mentioned. The lower surface hardness for the 4 mm and 12 mm diameter moulds were
significantly lower for the thickest mould but for the 8 mm diameter moulds, there was
no significant difference in lower surface hardness percentage with height variation. This
was not expected as the initial light transmission is significantly lower for the thicker of
the two. This may be related to adequate light transmission through the unfilled resins,
which may not occur in 4 mm diameter moulds due to absorption by the cavity walls.
The dimensions of the cavity will play a significant role in the viscous flow of the
specimen during polymerisation and any developing stresses and strain, which may affect
light transmission. During polymerisation, the resin transforms from a viscous resin to a
viscoelastic phase (de Gee and Davidson, 1981). This transformation is characterized by
the so called „gel-point‟. Prior to the gel-point, any developing stress can be compensated
by the intrinsic flow of the resin (Sakaguchi et al., 2004). The shrinkage vectors (which
are dependent upon height and diameter) will govern how light transmission is affected.
When uni-axial shrinkage dominates and the shrinkage leads to a reduction in the height,
it might be expected that the outcome would be improved light transmission and
associated improvement in curing extent. For cavities with low aspect ratios, uni-axial
shrinkage dominates with some non-axial shrinkage occurring due to the low aspect ratio
(Watts et al., 2003). The constraint caused in such specimens may cause specimen
deformation and a non-uniform transmission profile, which improves transmission
significantly during polymerisation. The sudden increase in light transmission for the 4
mm diameter moulds may be due to the high shrinkage strain imposed by the low mass
and the constraint of the specimen (Figure 3.3.5). A sharp increase in transmission is
expected at the point where the resin can no longer relax due to pre-gel flow.
Interestingly, transmission above hundred percent is observed which may be due to the
shrinkage vectors dominating axially (with some non-axial contribution) and the
constraint causing the samples to become convex on the irradiated side and concave on
the non-irradiated side as previously mentioned (Figure 3.3.7). The increase in diameter
from 4 mm to 8 mm will increase the aspect ratio, which will reduce the constraint,
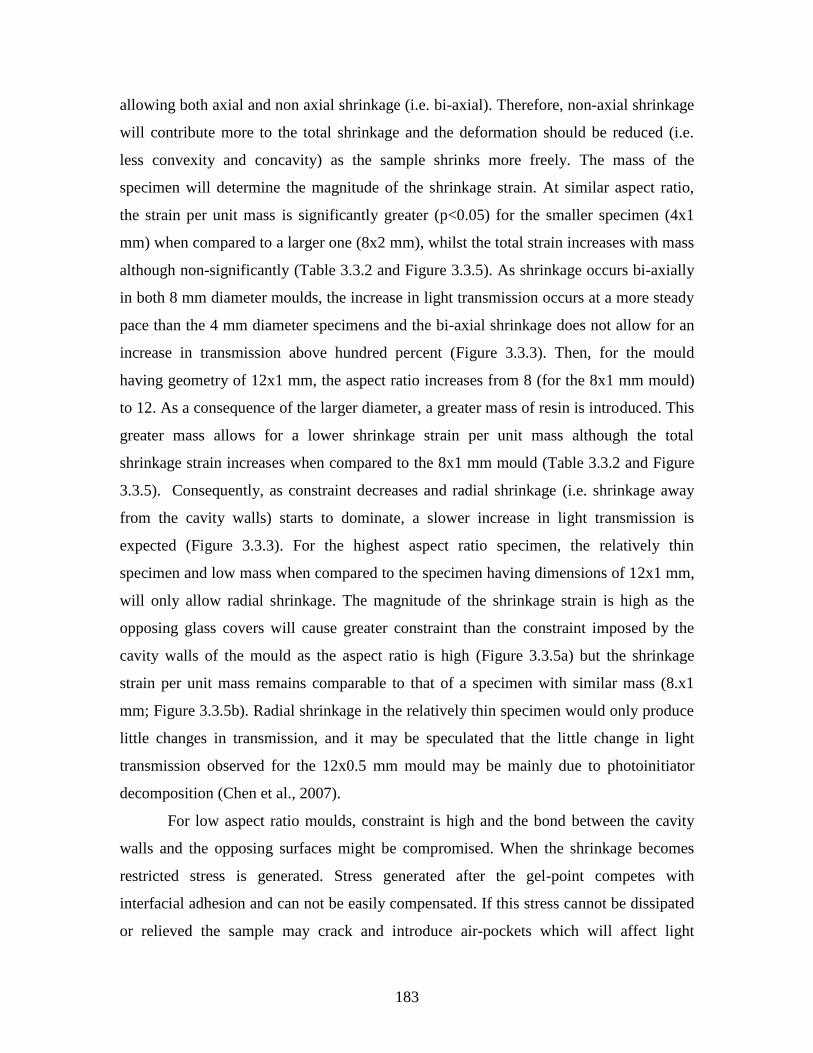
183
allowing both axial and non axial shrinkage (i.e. bi-axial). Therefore, non-axial shrinkage
will contribute more to the total shrinkage and the deformation should be reduced (i.e.
less convexity and concavity) as the sample shrinks more freely. The mass of the
specimen will determine the magnitude of the shrinkage strain. At similar aspect ratio,
the strain per unit mass is significantly greater (p<0.05) for the smaller specimen (4x1
mm) when compared to a larger one (8x2 mm), whilst the total strain increases with mass
although non-significantly (Table 3.3.2 and Figure 3.3.5). As shrinkage occurs bi-axially
in both 8 mm diameter moulds, the increase in light transmission occurs at a more steady
pace than the 4 mm diameter specimens and the bi-axial shrinkage does not allow for an
increase in transmission above hundred percent (Figure 3.3.3). Then, for the mould
having geometry of 12x1 mm, the aspect ratio increases from 8 (for the 8x1 mm mould)
to 12. As a consequence of the larger diameter, a greater mass of resin is introduced. This
greater mass allows for a lower shrinkage strain per unit mass although the total
shrinkage strain increases when compared to the 8x1 mm mould (Table 3.3.2 and Figure
3.3.5). Consequently, as constraint decreases and radial shrinkage (i.e. shrinkage away
from the cavity walls) starts to dominate, a slower increase in light transmission is
expected (Figure 3.3.3). For the highest aspect ratio specimen, the relatively thin
specimen and low mass when compared to the specimen having dimensions of 12x1 mm,
will only allow radial shrinkage. The magnitude of the shrinkage strain is high as the
opposing glass covers will cause greater constraint than the constraint imposed by the
cavity walls of the mould as the aspect ratio is high (Figure 3.3.5a) but the shrinkage
strain per unit mass remains comparable to that of a specimen with similar mass (8.x1
mm; Figure 3.3.5b). Radial shrinkage in the relatively thin specimen would only produce
little changes in transmission, and it may be speculated that the little change in light
transmission observed for the 12x0.5 mm mould may be mainly due to photoinitiator
decomposition (Chen et al., 2007).
For low aspect ratio moulds, constraint is high and the bond between the cavity
walls and the opposing surfaces might be compromised. When the shrinkage becomes
restricted stress is generated. Stress generated after the gel-point competes with
interfacial adhesion and can not be easily compensated. If this stress cannot be dissipated
or relieved the sample may crack and introduce air-pockets which will affect light
184
transmission, as indicated by the inflection of the „bonded‟ transmission profile and
digital image in Figure 3.3.6, respectively. Free-shrinkage (by means of separation or due
to low constraint) will allow stress dissipation or relief. Free shrinkage will also reduce
the „lens‟ effect as the specimen will shrink freely both axially and non-axially.
Therefore, the lower transmission of the corrected „non-bonded‟ transmission in
comparison to the „bonded‟ trace may support the greater deformation in the 4x2 mm
specimens. However, in the ceramic moulds, the increase above 100% was lower than
that observed in the nylon moulds (Figure 3.3.3 and Figure 3.3.6). This maybe related to
the fact that acid etching ensured mechanical adhesion to both cavity walls and opposing
surfaces and therefore deformation was almost impossible causing stress to build up and
samples to crack. Nonetheless, for separated samples, de-bonding from the ceramic
cavity walls and opposing surfaces resulted in a sharp decrease in light transmission
following gelation of the curing resin as larger air gaps (than for sample micro-cracking)
are introduced between the surfaces (Figure 3.3.6). This may be due to the much lower
refractive index (RI) of air (RI~1) compared to that of resins cured or un-cured (RI~1.50-
1.55) (Section 3.2). De-bonding will allow light to travel down the sides of the sample
(through air) and through air gaps between the microscope slides and samples. The
sudden mismatch in RI between glass, air and curing resin will increase scattering and
account for the sudden decrease in light transmission that was observed (Figure 3.3.6).
From the current investigation, it is evident that the cavity dimension influence how light
is transmitted through curing specimens and the constraint controls strain vectors and
magnitude, which may also affect light transmission. Further work is required to fully
understand this phenomenon at similar material mass and how other material properties
are affected by such changes in light transmission. In addition to correcting for absorption
and shrinkage, surface profilometry and more specimen geometries should be used which
may help confirm these speculations.
185
3.3.6 Conclusion
Specimen geometry and constraint affected light transmission throughout
polymerization of dental resins. The light transmission was dictated by how the shrinkage
vectors and strain developed during cure. Unexpected light intensity variations may occur
for low configuration factors, which may increase or decrease curing extent of resin
based restorations and ultimately compromise the success and longevity of the
restoration. Characterizing fundamental aspects of photo-induced polymerization of
dental resins such light transmission, with respect to shrinkage and shrinkage strain will
provide a greater insight into the shrinkage behaviour of such materials and this will
ultimately aid to improve longevity of such restorations. Furthermore, improving light
transmission through depth may consequently improve degree of conversion.
186
3.4 Summary
The aim of this chapter was to investigate the changes in optical properties of
curing dental resins and introduce a novel technique to dynamically measure refractive
index change and physical thickness change of photoactive dental resins. Changes in
optical properties in RBCs occur as light is absorbed, attenuated, scattered and refracted
through the specimen. Not only does the material composition affect such properties, i.e.
the resin matrix composition, filler type and percentage, photoinitiator type and
concentration and the addition of pigments and dyes, the conversion from monomer to
polymer is also expected to affect optical properties.
Along with dyes and pigments used to create varying shades of resin composite
materials, the photoinitiator is a strong absorber of light in photoactive dental resin
composites, which decomposes during activation therefore decreasing absorption and
increasing the amount of light transmitted through the specimen. Alternative colourless
photoinitaitors are mainly used for aesthetic reasons as camphoroquinone has a distinct
yellow tint due to its chromophore group which is partly unbleachable (Jakubiak et al.,
2003). As well as improved aesthetics, non pigmented photoinitaitors have been
suggested to have additional benefits such as reduced curing time (Section 2.3) due to
their higher efficiency. However, the use of such initiators is expected to have a
significant influence on the optical and physical properties of the curing resin composite.
Firstly, inferior depth of cure of Lucirin TPO-based resin composites was reported in
Section 2.3 as a consequence of low wavelength scattering of light and high molar
absorptivity causing in-efficient light transmission at depth. Secondly, such a high molar
absorptivity is expected to affect reaction kinetics and increase the rate of polymerisation.
Section 3.1 aimed to investigate some optical properties of resins made with
camphoroquinone and Lucirin TPO with respect to reaction kinetics. Photoinitiator
decomposition during cure is expected to increase light transmission proportionally
according to Beer-Lamberts law (Chen et al., 2007). However, the inverse absorption
observed for Lucirin TPO resins maybe related to monomer discolouration associated
with high reaction exotherms by rapid rates of polymerisation. As such, the initially
colourless resins become stained and an increase in yellowing was observed, verified by
187
the increase in b-value of the CIELAB co-ordinates. Conversely, for camphoroquinone
resins, the initially yellow resins bleach upon irradiation and a decrease in yellowing is
observed (decrease in b-value). Any discolouration during irradiation may potentially
reduce light transmission through depth and affect depth of cure, even for photocurable
resins that utlilise so-called, “colourless” photoinitiators such as Lucirin-TPO.
Characterising photoinitiator properties dynamically will ultimately improve
photoinitiator chemistry in such materials.
The optical properties of resin-based composites are essential to optimise light
transport through the material and to aid curing depth. Although refractive index of dental
resins are well characterised statically, the change during cure is not well understood.
Section 3.2 aimed to demonstrate a novel technique whereby refractive index can be
measured during cure. The ability to measure refractive index change of curing
photoactive resins will allow for the design of composite formulations, which exhibit
optimum evolution of translucency (as the RI of the curing resin approaches that of the
filler) and enable precise control of aesthetic quality, light transport through material bulk
and curing depth.
The shrinkage of dental RBCs is also an important consideration. When
composites shrink, the affect on light transmission may be predicted by Beer-Lamberts
law, where a decrease in optical path length will increase light transmission. Not only is
the shrinkage affected by material composition, i.e. filler type and percentage and resin
matrix composition, specimen geometry is likely to significantly affect the shrinkage
vectors of the curing specimen, which may affect light transmission. As such, in Section
3.3 it was observed that low aspect ratio moulds may result in unexpected light
transmission profiles due to sample deformation caused by the relatively high constraint.
The current Chapter demonstrated for the first time the ability to simultaneously
measure refractive index change and physical thickness change in photoactive dental
resins during polymerisation and reported the effect of monomer composition and
specimen constraint on optical and physical properties (Section 3.2 and 3.3). Such
information may be useful in order to optimise the resin matrix / filler interaction to
improve light transmission through depth, with the aim of improved depth of cure and
clinical success of such restorations.
188
References
Alvim HH, Alecio AC, Vasconcellos WA, Furlan M, de Oliveira JE, Saad JRC. Analysis
of camphoroquinone in composite resins as a function of shade. Dental Materials, 2007;
23: 1245-1249
Anseth KS, Goodner MD, Reil MA, KAnnurpatti AR, Newman SM, Bowman CN. The
influence of comonomer composition on dimethacrylate resin properties for dental
composites. Journal of Dental Research, 1996; 75: 1607-1612
Aravamudhan K, Rakowski D and Fan PL. Variation of depth of cure and intensity with
distance using LED curing lights. Dental Materials, 2006; 22: 988-994
Asmusen S, Arenas G, Cook WD, Vallo C. Photobleaching of camphoroquinone during
polymerization of dimethacrylate based resins. Dental Materials, 2009; 25: 1603-1611
Asmussen E and Peutzfeldt A. Direction of shrinkage of light-curing resin composites.
Acta Odontologica Scandinavica, 1999; 57: 310-315
Asmussen E. Clinical relevance of physical, chemical, and bonding properties of
composite resins. Operative Dentistry, 1985; 10: 61-73
Barres CE. Mechanism of vinyl polymerisation I: Role of Oxygen. Journal of American
Chemistry Society, 1945; 67: 217
Bouschlicher MR, Rueggeberg FA. Effect of ramped light intensity on polymerization
force and conversion in photactivated composite. Journal of Esthetic Dentistry 2000; 12:
328-329
Brackett MG, Brackett WW, Browning WD, Rueggeberg FA. The effect of light curing
source on the residual yellowing of resin composites. Operative Dentistry, 2007; 35: 443-
450
Braga RR, Ballester RY, Ferracane JL. Factors involved in the development of
polymerization shrinkage stress in resin composites: A systematic review. Dental
Materials, 2005; 21: 962-970.
Braga RR, Boaro LCC, Kuroe T, Azevedo CLN, Singer JM. Influence of cavity
dimensions and their derivatives (volume and „C‟ factor) on shrinkage stress
development and microleakage of composite restorations. Dental Materials, 2006; 22:
818-823
Braga RR, Ferracane JL. Contraction stress related to degree of conversion and reaction
kinetics. Journal of Dental Research, 2002; 81: 114-118

189
Brie M, Grecu RM, Moldovan M, Premerean C, Musat O, Vezsenyi. The optical
properties of some dimethacrylic composites. Materials Chemistry and Physics, 1999; 60:
240-246
Burke F.J.T. Amalgam to tooth-coloured materials-implications for clinical practice and
dental education: government restrictions and amalgam-usage survey results. Journal of
Dentistry, 2004; 32: 343-350
Chen YC, Ferracane JL, Prahl SA. Quantum yield of conversion of the photoinitiator
camphoroquinone. Dental Materials, 2007; 23: 655-664
Condon JR, Ferracane JL. Assessing the effect of composite formulation on
polymerization stress. Journal of American Dental Association, 2000; 131: 497-503
Cook WD, Chong MP. Colour stability and visual perception of dimetacrylate based
dental composite resins. Biomaterials, 1985; 6: 257-264
Curtis AR, Palin WM, Fleming GJP, Shortall ACC, Marquis PM. The mechanical
properties of nanofilled resin-based composites: The impact of dry and wet cyclic pre-
loading on bi-axial flexure strength. Dental Materials, 2009; 25: 188-197.
Davidson CL, de Gee AJ. Relaxation of polymerization contraction stresses by flow in
dental composites. Journal of Dental Research, 1984; 63: 146-148
Davidson CL, Feilzer AJ. Polymerisation shrinkage and polymerization shrinkage stress
in polymer-based restoratives. Journal of Dentistry, 1997; 25: 435-440
dos Santos GB, Alto RV, Filho HR, da Silva EM, Fellows CE. Light transmission in
dental resin composites. Dental Materials, 2008; 24: 571-576.
Emami N, Sjodhal M, Soderholm KM. How filler properties, filler fraction, sample
thickness and light source affect light attenuation in particulate filled resin composites.
Dental Materials, 2005; 21: 721-730.
Emami N, Soderholm KJ. Influence of light-curing procedures and photo-initiator/co-
initiator composition on the degree of conversion of light curing resins. Journal of
Material Science: Materials in Medicine, 2005; 16: 47-52
Feilzer AJ, De Gee AJ, Davidson CL. Setting stress in composite resin in relation to
configuration of the restoration. Journal of Dental Research, 1987; 66: 1636-1639
Feng L, Suh BI, Shortall AC. Formation of gaps formed at the resin-filler interface
induced by polymerization contraction stress. Gaps at the interface. Dental Materials ,
2010;26:719-729.
190
Ferracane JL, Moser JB, Greener EH. Ultraviolet light-induced yellowing of dental
restorative resins. Journal of Prosthetic Dentistry, 1985; 54: 483-487
Gee AJ, Davidson CL. A modified dilatometer for continuous recording of volumetric
polymerization shrinkage of composite restorative materials. Journal of Dentistry, 1981;
9: 36-42
Halvorson RH, Erickson RL, Davidson CL. Energy dependent polymerisation of resin-
based composites. Dental Materials, 2002; 25: 463-469
Harrington E, Wilson HJ, Shortall AC. Light activated restorative materials: a method of
determining effective radiation times. Journal of Oral Rehabilitation 1996; 23: 210-218
Harrington E and Wilson JH. Depth of cure of radiation-activated materials- effect of
mould material and cavity size. Journal of Dentistry, 1999; 21: 305-311
Harrington E, Wilson HJ. Determination of radiation energy emitted by light activation
units. Journal of Oral Rehabilitation, 1995; 22: 377-385
Hübsch PF, Middleton J, Feilzer AJ. Identification of the constitutive behaviour of dental
composite cements during curing. Computer Methods in Biomechanics and Biomedical
Engineering 1999; 2: 245-256
Ilie N, Hickel R. Can CQ be completely replaced by alternative initiators in dental
adhesives?. Dental Materials Journal, 2008; 27: 221-228
Jakubiak J, Allonas X, Fouassier JP. Camphoroquinone-amines photoinitiating systems
for the initiation of free radical polymerization. Polymer, 2003; 44: 5219-5226
Kahler B, Koutousov A, Swain MV. On the design of dental resin based composites: A
micromechanical approach. Acta Biomaterialia, 2008; 4: 165-172
Kenning NS, Ficek BA, Hoppe CC, Scranton AB. Spatial and temporal evolution of the
photoinitiation rate for thick polymer systems illuminated by polychromatic light:
selection of efficient photoinitiators for LED or mercury lamps. Polymer International,
2008; 57: 1134-1140.
Kenning NS, Kriks D, El-Maazawi M, Scranton AB. Spatial and temporal evolution of
the photoinitiation rate for thick polymer systems illuminated by polychromatic light.
Polymer International, 2006; 55: 994-1006.
Kopietz M, Lechner MD, Steinmeier DG, Marotz J, Kratzig E. Light induced refarctive
index changes in polymethylmethacrylate (PMMA) blocks. Polymer Photochemistry,
1984; 5: 109-119.
Lambert CR, Black HS, Truscott TG. Reactivity of Butylated Hydroxytoluene. Free
radical Biology and Medicine, 1996; 21: 395-400
191
Lehtinen J, Laurila T, Lassila LJ, Vallittu PK, Raty J, Hernberg R. Optical
characterization of bisphenol-A-glycidyldimethacrylate-triethyleneglycoldimethacrylate
(BisGMA/TEGDMA) monomers and copolymer. Dental Materials, 2008; 24: 1324-1328.
Loguercio AD, Reis A, Ballester RY. Polymerisation shrinkage: effects of constraint and
filling technique in composite restorations. Dental Materials, 2004; 20: 236-243
Lovell LG, Stansbury JW, Syrpes DC, Bowman SN. Effects of composition and
reactivity on the reaction kinetics of dimethacrylate/dimethacrylate copolymerizations.
Macromolecules, 1999; 32: 3913-3921.
Lu H, Stansbury JW, Bowman CN. Toward the elucidation of shrinkage stress
development and relaxation in dental composites. Dental Materials, 2004; 20: 979-986
Morel EN, Torga JR. Dimensional characterization of opaque samples with a ring
interferometer. Optics and Lasers in Engineering, 2009; 47: 607-611.
Mucci V, Artenas G, Duchowicz R, Cook WD, Vallo CL. Influence of thermal
expansionon shrinkage during photopolymerisation of dental resins based on bis-
GMA/TEGDMA. Dental Materials, 2009; 25: 103-114
Musanje L, Ferracane JL, Sakaguchi RL. Determination of the optimal photoinitiator
concentration in dental composites based on essential material properties. Dental
Materials, 2009; 25: 994-1000
Neumann MG, Miranda WG Jr, Schmitt CC, Rueggeberg FA, Correa IC. Molar
extinction coefficients and the photon absorption efficiency of dental photoinitiators and
light curing units. Journal of Dentistry, 2005; 33: 525-532
Neumann MG, Schmitt CC, Ferreira GC, Correa IC. The initiating radical yields and the
efficiency of polymerisation for various dental photoinitiators excited by different light
curing units. Dental Materials, 2006; 22: 576-584
Ogunyinka A, Palin WM, Shortall AC, Marquis PM. Photoinitiation chemistry affects
light transmission and degree of conversion of curing experimental dental resin
composites. Dental Materials, 2007; 23: 807-813
Palin WM, Fleming G, Nathwani H, Burke T, Randall RC. In vitro cuspal deflection and
microleakage of maxillary premolars restored with novel low-shrink dental composites.
Dental Materials, 2005; 21: 324-335
Palin WM, Senyilmaz DP, Marquis PM, Shortall AC. Cure width potentional for MOD
resin composite molar restorations. Dental Materials, 2008; 24: 1083-1094
192
Park YJ, Chae KH, Rawls HR. Development of new photoinitiation system for dental
light-cure composite resins. Dental Materials, 1999; 15: 120-127
Patel MP, Davy KWM, Braden M. Refractive index and molar refraction of methacrylate
monomers and polymers. Biomaterials, 1992; 13: 643-645.
Price RB, Dérand T, Loney RW, Andreou P. Effect of light source and specimen
thickness on the surface hardness of resin composites. American Journal of Dentistry,
2002; 15: 47-53
Price RB, Felix CA. Effect of delivering light in specific narrow bandwidths from 394 to
515nm on the micro-hardness of resin composites. Dental Materials, 2009; 25: 899-908
Price RBT, Rueggeberg FA, Labrie D and Felix CM. Irradiance uniformity and
distributiob from dental light curing units. Journal of Esthetic Restorative Dentistry,
2010; 22: 86-103.
Rogers JR, Hopler MD, Conversion of group refractive index to phase refractive index.
Journal of Optical Society of America A, 1988; 5:1595-1600
Rosentritt M, Shortall AC, Palin WM, Dynamic monitoring of curing photoactive resins:
A methods comparison. Dental Materials, 2010; 26: 565-570
Rueggeberg FA, Ergle JW, Lockwood PE. Effect of photoinitiator level on properties on
properties of a light-cured and post-cure heated model resin system. Dental Materials.
1997; 13: 360-364
Sakaguchi RL, Ferracane JL. Stress transfer from polymerization shrinkage of a
chemical-cured composite bonded to a pre-cast composite substrate. Dental Materials,
1998; 14: 106-111
Sakaguchi RL, Wiltbank BD, Murchison CF. Contraction force rate of polymer
composite is linearly correlated with irradiance. Dental Materials, 2004; 20: 402-407
Shin DH, Rawis RH. Degree of conversion and colour stability of the light curing resin
whith new photoinitiator systems. Dental Materials, 2009; 25: 1030-1038
Shoemaker DP, Garland CW, Nibler JW. Experiments in physical chemistry, 1989; 5th
Ed., Chapter 17: McGraw-Hill, New York.
Shortall AC, Palin WM, Burtscher P. Refractive index mismatch and monomer reactivity
influence composite curing depth. Journal of Dental Research, 2008; 87: 84-88.
Sorin WV, Gray DF, Simultaneous thickness and group index measurement using optical
low-coherence reflectometry. IEEE photonics technology letters 1992; 4:105-107
193
Stansbury JW, Trujillo-Lemon M, Lu H, Ding X, Lin Y, Ge J. Conversion-dependent
shrinkage stress and strain in dental resins and composites. Dental Materials, 2005; 21:
56-67.
Stansbury JW. Curing dental resins and composites by photopolymerisation. Journal of
Esthetic Dentistry, 2000; 12: 300-308
Stephenson N, Kriks D, El-Maazawi M, Scranton AB. Spatial and temporal evolution of
the photoinitiation rate for thick polymer systems illuminated on both sides. Polymer
International, 2005; 54: 1429-1439.
Stephenson Kenning N, Ficek BA, Hoppe CC, Scranton AB. Spatial and temporal
evolution of the photoinitiation rate for thick polymer systems illuminated by
polychromatic light : selection of efficient photoinitiators for LED or mercury lamps.
Polymer International, 2008; 57:1134-1140.
Stephenson Kenning N, Kriks D, El-Maazawi M and Scranton A. Spatial and temporal
evolution of the photinitiation rate for thick polymer systems illuminated with
polychromatic light. Polymer International, 2006; 55: 94-1006
Studer K, Koniger R. Initial photoyellowing of photocrosslinked coatings. European
Coatings Journal, 2001; 1: 26-37
Suh BI. Controlling and understanding the polymerization shrinkage-induced stresses in
light cured composites. Compendium, 1999; 20: 34-41
Sun GJ, Chae KH. Properties of 2,3-butanedione and 1-phenyl-1,2 propanedione as new
photosensitizers for visible light cured dental resin composites. Polymer, 2000; 41: 6205-
6212
Taira M, Urabe H, Hirose T, Wakasa K, Yamaki M. Analysis of photo-initiators in
visible-light-cured dental composite resins. Journal of Dental Research, 1988; 67: 24-28.
Tomlins PH, Palin WM, Shortall AC, Wang RK. Time-resolved simultaneous
measurement of group index and physical thickness during photopolymerization of resin-
based dental composite. Journal of Biomedical Optics, 2007; 12: 014020.
Truffier-Boutry D, Demoustier-Champagne S, Devaux J, Biebuyck JJ, Mestdagh M,
Larbanois P, Leloup G. A physico-chemical explanation of the post-polymerization
shrinkage in dental resins. Dental Materials, 2006; 22: 405-412.
Watts DC, Cash AJ. Analysis of optical transmission by 400-500 nm visible light into
aesthetic dental biomaterials. Journal of Dentistry, 2004; 22: 112-7.
Watts DC, Marouf AS, and Al-Hindi AM. Photo-polymerisation shrinkage-stress kinetics
in resin composites: methods development. Dental Materials, 2000; 19: 1-11.
194
Watts DC, Marouf AS. Optimal specimen geometry in bonded-disk shrinkage strain
measurements on light-cured biomaterials. Dental Materials, 2000; 16: 447-451.
Watts DC and Satterthwaite JD. Axial Shrinkage-stress depends upon both C-factor and
composite mass. Dental Materials, 2008; 24: 1-8
Weinmann W, Thalacker C, Guggenberger R. Siloranes in dental composites. Dental
Materials, 2005; 21: 68-74
Yoshida K, Greener EH. Effect of photoinitiator on degree of conversion of unfilled
light-cured resin. Journal of Dentistry, 1994; 22: 296-299

CHAPTER 4
Recommendations for Further Work
195
4.0 Recommendations for Further Work
In order the compare the anomalies of the exposure reciprocity law, commercial
and experimental materials were tested. Although static rheology measurements provide
some insight into the mobility of propagating species and reaction kinetics, the increase
in density increases the viscosity during cure. Consequently, dynamic rheological
changes will differ remarkably according to the reactivity of the monomer, the filler
percentage and the photoinitiator chemistry throughout and proceeding light irradiation.
Therefore dynamic rheological measurements may give a better insight into mobility of
propagating species. Furthermore dielectric spectroscopy may also be used to measure
mobility within a curing resin directly through Stroke‟s law where ionic conductivity is
inversely proportional to the viscosity, in which the ionic species is considered to be rigid
spheres moving through the liquid monomers. As such, the utilisation of real time
rheology measurements and dielectric spectroscopy would afford a more detailed insight
into the differences in polymerisation kinetics and failures in the exposure reciprocity law
and should be the subject of further studies.
Exposure reciprocity was verified even at low viscosity with the use of Lucirin
TPO, however inferior cure depths were reported. Clinically, this maybe problematic as
an increased number of technique sensitive incremental steps will be required to fill a
relatively large cavity, which may also increase procedural time rather than decrease it.
The increased scattering at low wavelength may be responsible for the inferior cure
depths. Optimising the filler particle and resin matrix according to photoinitiator
absorption spectrum may reduce scattering and aid curing at depth. In addition to this,
using camphoroquinone or another photoinitiator which absorbs at higher wavelengths
synergistically with Lucirin TPO will allow light at higher wavelengths to penetrate
deeper with less scattering and may improve curing depth. Therefore it is proposed that
further investigations are conducted with different resin and filler constituents and a
variety of photoinitiators such as camphoroquinone, phenyl propanedione and benzyl
used synergistically with Lucirin TPO in order to try and improve cure depths.
196
Much of the current investigation has focussed on the applicability of the
exposure reciprocity law based on degree of conversion data. However, degree of
conversion data should not be considered the gold-standard of material properties. The
polymer chain length and cross linking may also be influenced by irradiation time and
intensity and thus even at similar degree of conversion reported in the current
investigation, the mechanical properties such as flexural strength, flexural modulus, water
sorption and cure depths will be affected. Therefore, in order to better understand how the
reduction in curing time will influence clinically important parameters, it is proposed that
the materials tested in the current investigation are tested for their performance under
mechanical testing regimes, such as dynamic mechanical thermal analysis which may be
useful for real time development of mechanical properties or static load-to-failure tests
such as three-point bend to assess flexural strength and modulus.
The introduction of a novel low coherence interferometer used to assess optical
and physical change dynamically in the present study may provide valuable information
on optical and physical change in resin-based composites whilst under cure. The
development of such a technique may allow for the design of composite formulations,
which exhibit optimum evolution of translucency to enable precise control of aesthetic
quality and light transport through material bulk and curing depth. Consequently, it is
proposed that further work utilising model composites with different resin matrix
constituents/ratios and filler type/percentage be tested for a more detailed insight into the
evolution of translucency and its affect on depth of cure.
Additionally, although 2-D measurement of refractive index and physical
thickness change provided useful information on the optical properties and shrinkage
behaviour of experimental resins, such changes are not uniform throughout the specimen.
Precise control of optical properties such as refractive index will optimise light
transmission at depth and enable greater depths of cure. However, to fully understand
bulk optical change, a spatial, 3-D measurement of refractive index and physical
thickness change would be more appropriate. Modification of the bespoke software used
to control the measurement parameters in the current study to allow axial measurement
during cure will enable precise mapping of the sample under measurement. The mapping
197
of which will further optimise the design of composites to allow optimal light
transmission at depth by better design of composite formulations.
Light transmission is an important factor for degree of conversion and depth of
cure. As refractive index changes and approaches that of the filler, interfacial scattering
decreases and light transmission increases. Therefore, light transmission is an important
measurement parameter to optimise curing of resin-based composites. However, as
optical measurements are sensitive to the experimental set-up, it seems more appropriate
to measure them simultaneously. Thus, developing a device which allows the
simultaneous measurement of refractive index/shrinkage and light transmission will
reduce experimental errors and allow a better analysis of the data obtained.
Finally, to truly optimise the experimental set up and procedure, degree of
conversion and temperature measurements should also be made simultaneously.
Experimentally, this is problematic as there will be many probes and sensors to operate
simultaneously. Consequently, the „one-hit‟ measurement device seems almost
impossible to construct for the measurement of multiple parameters in a relatively small
sample. However, both the low coherence interferometer and the FT-IR spectrometer are
based on the Michelson interferometer and the broadband light source used in the low
coherence interferometer has a centre wavelength of 1624 nm, which corresponds with
the vinyl carbon double bond absorption wavenumber at 6164 cm-1
(as the wavenumber
is given by the reciprocal of wavelength). Consequently, it is possible to apply a Fourier
Transform function on the low coherence interferometer data to obtain the absorption
spectra for measuring conversion and curing kinetics. This would reduce number of
probes and sensors in the „one-hit‟ measuring device and may allow for real time
simultaneous measurements of refractive index, shrinkage, degree of conversion,
temperature and light transmission which will ultimately aid material development by
providing a greater insight into the curing behaviour of resin based composites.
As mentioned previously, 3-D mapping of dental resins and dental resin
composites may optimise the design of composites to allow optimal light transmission at
depth by better design of composite formulations. However, such mapping may also be
used to validate the „lens‟ effect theory discussed in Section 3.3.3. Currently, 2-D
mapping may be used to map the thickness across the specimen on one axis but the data
198
remains limited as it only indicates the physical thickness and not how the sample shrinks
(i.e. the type of lens formed). The most appropriate currently available solution to
validating the „lens‟ effect theory may well be profilometry, which will directly indicate
how the samples shrink and their resultant geomtery.

APPENDIX
199
APPENDIX
Appendix 1 Physical thickness change of Camphoroquinone resins and Lucirin
TPO resins.
Camphoroquinone and Lucirin TPO resins were tested to verify that no expansion
occurred during irradiation and reject the possibility that the initial increase in absorbance
for Lucirin TPO resins was due to expansion by the high reaction exotherm (Section 3.1).
The resins were tested with a Swiss Master halogen Light (EMS, Switzerland) under the
hypothesis:
i) Lucirin TPO resins will show initial expansion due to the high reaction
exotherm whereas camphoroquinone resins will not.
ii) The expansion would be greater for high irradiance protocols as rates of
polymerisation and exotherm are expected to increase.
Figure A1 represents the physical thickness change of camphoroquinone resins
and Lucirin TPO resins measured using the low coherence interferometry method
described in Section 3.2. It is evident from the charts that no expansion occurred during
irradiation, even for the highest irradiance protocols. Interestingly however, the highest
irradiance protocol showed the greatest shrinkage for Lucirin TPO resins and an opposite
trend was observed for camphoroquinone resins. Consequently, both hypotheses must be
rejected and the possibility of increased absorption due expansion in Lucirin TPO resins
must be ruled out.
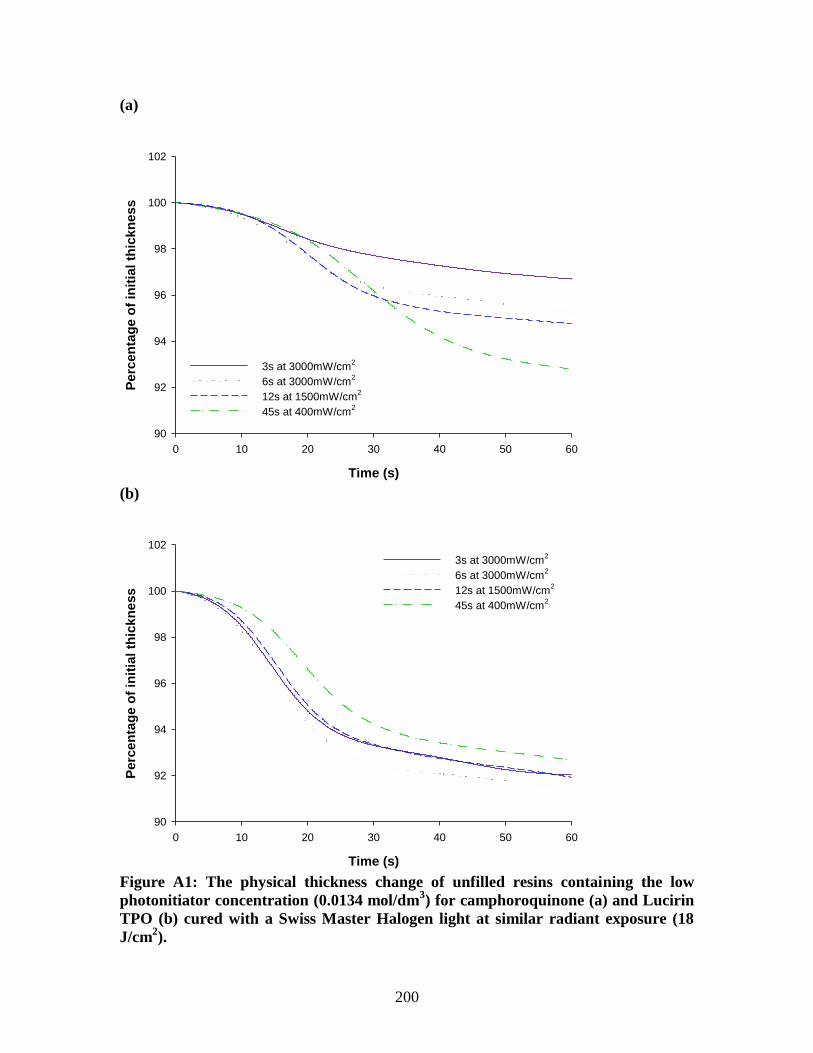
200
(a)
Time (s)
0 10 20 30 40 50 60
Perc
en
tag
e o
f in
itia
l th
ickn
ess
90
92
94
96
98
100
102
3s at 3000mW/cm2
6s at 3000mW/cm2
12s at 1500mW/cm2
45s at 400mW/cm2
(b)
Time (s)
0 10 20 30 40 50 60
Perc
en
tag
e o
f in
itia
l th
ickn
ess
90
92
94
96
98
100
102
3s at 3000mW/cm2
6s at 3000mW/cm2
12s at 1500mW/cm2
45s at 400mW/cm2
Figure A1: The physical thickness change of unfilled resins containing the low
photonitiator concentration (0.0134 mol/dm3) for camphoroquinone (a) and Lucirin
TPO (b) cured with a Swiss Master Halogen light at similar radiant exposure (18
J/cm2).