Polymer thin film photodegradation and photochemical ...nsmn1.uh.edu/nanostructure/CV/Millan...
13
Polymer thin film photodegradation and photochemical crosslinking: FT-IR imaging, evanescent waveguide spectroscopy, and QCM investigations Mitchel D. Millan, Jason Locklin, Timothy Fulghum, Akira Baba, Rigoberto C. Advincula * Department of Chemistry, University of Houston, 136 Fleming Building, Houston, TX 77204-5003, USA Received 3 January 2005; received in revised form 9 May 2005; accepted 10 May 2005 Abstract Photodegradation and photocrosslinking of benzophenone blended polystyrene (PS) thin films were investigated primarily using Fourier transform infrared (FT-IR) imaging, evanescent waveguide spectroscopy (WS), and quartz crystal microbalance (QCM) methods. The main objective is to observe the changes (spectral and chemical) indicative of these competitive processes in an ultrathin polymer film. This also serves as a model study in the application of combined spectroscopic, optical, and acoustic methods towards understanding crosslinking and degradation phenomena within the same time frame of observation. To induce photocrosslinking, 1,12-dodecanediylbis(oxy-4,1-phenylene)] [bis[phenylmethanone] (2BP12), a small molecule with two benzophenone groups, was blended with PS in solution, spincast onto glass and silicon substrates, and irradiated with ultraviolet light. Photodegradation and benzophenone-mediated crosslinking were observed both directly via functional group spectroscopies and indirectly via their effects on thin film surface properties and morphologies. Atomic force microscopy (AFM) and QCM were used to elucidate local morphology change and mass-uptake kinetics in the presence of O 2 in air, respectively. All results correlated well with the two photoprocesses occurring simultaneously and competitively on these films with the refractive index, thickness, and mass change differing with the presence of 2BP12. Crosslinking was observed to cause an increase in thickness while photodegradation gave a decrease. Both processes resulted in an increase in the refractive index and mass. While various methods have separately identified these observations, this is the first instance that the in situ chemical, optical, and structural dimensionality of the photodegradation and photocrosslinking phenomena in a thin polymer film is correlated within the same time frame of observation. q 2005 Elsevier Ltd. All rights reserved. Keywords: FT-IR imaging; Evanescent waveguide; Photodegradation 1. Introduction Polysytrene (PS) is one of the most ubiquitous of commercial polymers. Due to the huge variety of its applications, photoinitiated degradation and oxidation in air are important issues. These decomposition processes have been reported to typically occur over the range of 250– 400 nm [1], and can be initiated even by ordinary sunlight [2]. According to accepted terminology, photodegradation refers to light-initiated chain scission, crosslinking and other processes under vacuum or inert atmosphere. On the other hand, oxidative photodegradation (or degradative photoox- idation) occurs in air and includes, in addition to the processes described above, the formation of various oxygen-containing functional groups such as peroxides or carbonyls. In this work, the term photodegradation will be used in general, and the environment in which occurs will be obvious from context. Numerous mechanisms for PS photodegradation have been proposed over the years [3], but a totally consistent theory is yet to be agreed upon, due to the complexity of the kinetics and the formation of various photodegradation products. An accepted classical mechanism [1,4] for PS degradation under ultraviolet (UV) light is given in Scheme 1. When irradiated at l!300 nm, PS forms the PS radical (Eq. (1)), which in air leads to a peroxyradical, and eventually a PS hydroperoxide (Eq. (2)). The latter photolyzes into an alkoxy radical (Eq. (3)), leading to Polymer 46 (2005) 5556–5568 www.elsevier.com/locate/polymer 0032-3861/$ - see front matter q 2005 Elsevier Ltd. All rights reserved. doi:10.1016/j.polymer.2005.05.050 * Corresponding author. Tel.: C1 713 743 1760; fax: C1 713 743 1755. E-mail address: [email protected] (R.C. Advincula).
Transcript of Polymer thin film photodegradation and photochemical ...nsmn1.uh.edu/nanostructure/CV/Millan...

Polymer thin film photodegradation and photochemical crosslinking:
FT-IR imaging, evanescent waveguide spectroscopy,
and QCM investigations
Mitchel D. Millan, Jason Locklin, Timothy Fulghum, Akira Baba, Rigoberto C. Advincula*
Department of Chemistry, University of Houston, 136 Fleming Building, Houston, TX 77204-5003, USA
Received 3 January 2005; received in revised form 9 May 2005; accepted 10 May 2005
Abstract
Photodegradation and photocrosslinking of benzophenone blended polystyrene (PS) thin films were investigated primarily using Fourier
transform infrared (FT-IR) imaging, evanescent waveguide spectroscopy (WS), and quartz crystal microbalance (QCM) methods. The main
objective is to observe the changes (spectral and chemical) indicative of these competitive processes in an ultrathin polymer film. This also
serves as a model study in the application of combined spectroscopic, optical, and acoustic methods towards understanding crosslinking and
degradation phenomena within the same time frame of observation. To induce photocrosslinking, 1,12-dodecanediylbis(oxy-4,1-phenylene)]
[bis[phenylmethanone] (2BP12), a small molecule with two benzophenone groups, was blended with PS in solution, spincast onto glass and
silicon substrates, and irradiated with ultraviolet light. Photodegradation and benzophenone-mediated crosslinking were observed both
directly via functional group spectroscopies and indirectly via their effects on thin film surface properties and morphologies. Atomic force
microscopy (AFM) and QCM were used to elucidate local morphology change and mass-uptake kinetics in the presence of O2 in air,
respectively. All results correlated well with the two photoprocesses occurring simultaneously and competitively on these films with the
refractive index, thickness, and mass change differing with the presence of 2BP12. Crosslinking was observed to cause an increase in
thickness while photodegradation gave a decrease. Both processes resulted in an increase in the refractive index and mass. While various
methods have separately identified these observations, this is the first instance that the in situ chemical, optical, and structural dimensionality
of the photodegradation and photocrosslinking phenomena in a thin polymer film is correlated within the same time frame of observation.
q 2005 Elsevier Ltd. All rights reserved.
Keywords: FT-IR imaging; Evanescent waveguide; Photodegradation
1. Introduction
Polysytrene (PS) is one of the most ubiquitous of
commercial polymers. Due to the huge variety of its
applications, photoinitiated degradation and oxidation in air
are important issues. These decomposition processes have
been reported to typically occur over the range of 250–
400 nm [1], and can be initiated even by ordinary sunlight
[2]. According to accepted terminology, photodegradation
refers to light-initiated chain scission, crosslinking and other
processes under vacuum or inert atmosphere. On the other
0032-3861/$ - see front matter q 2005 Elsevier Ltd. All rights reserved.
doi:10.1016/j.polymer.2005.05.050
* Corresponding author. Tel.: C1 713 743 1760; fax: C1 713 743 1755.
E-mail address: [email protected] (R.C. Advincula).
hand, oxidative photodegradation (or degradative photoox-
idation) occurs in air and includes, in addition to the
processes described above, the formation of various
oxygen-containing functional groups such as peroxides or
carbonyls. In this work, the term photodegradation will be
used in general, and the environment in which occurs will be
obvious from context.
Numerous mechanisms for PS photodegradation have
been proposed over the years [3], but a totally consistent
theory is yet to be agreed upon, due to the complexity of the
kinetics and the formation of various photodegradation
products. An accepted classical mechanism [1,4] for PS
degradation under ultraviolet (UV) light is given in Scheme
1. When irradiated at l!300 nm, PS forms the PS radical
(Eq. (1)), which in air leads to a peroxyradical, and
eventually a PS hydroperoxide (Eq. (2)). The latter
photolyzes into an alkoxy radical (Eq. (3)), leading to
Polymer 46 (2005) 5556–5568
www.elsevier.com/locate/polymer
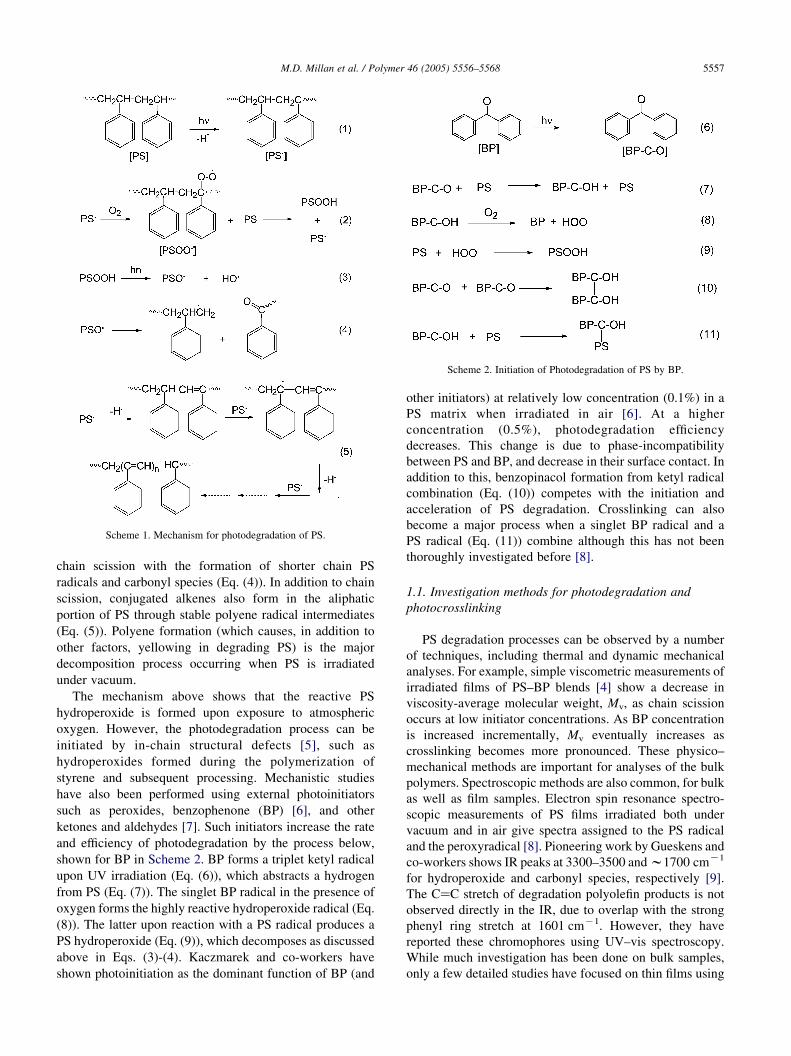
Scheme 1. Mechanism for photodegradation of PS.
Scheme 2. Initiation of Photodegradation of PS by BP.
M.D. Millan et al. / Polymer 46 (2005) 5556–5568 5557
chain scission with the formation of shorter chain PS
radicals and carbonyl species (Eq. (4)). In addition to chain
scission, conjugated alkenes also form in the aliphatic
portion of PS through stable polyene radical intermediates
(Eq. (5)). Polyene formation (which causes, in addition to
other factors, yellowing in degrading PS) is the major
decomposition process occurring when PS is irradiated
under vacuum.
The mechanism above shows that the reactive PS
hydroperoxide is formed upon exposure to atmospheric
oxygen. However, the photodegradation process can be
initiated by in-chain structural defects [5], such as
hydroperoxides formed during the polymerization of
styrene and subsequent processing. Mechanistic studies
have also been performed using external photoinitiators
such as peroxides, benzophenone (BP) [6], and other
ketones and aldehydes [7]. Such initiators increase the rate
and efficiency of photodegradation by the process below,
shown for BP in Scheme 2. BP forms a triplet ketyl radical
upon UV irradiation (Eq. (6)), which abstracts a hydrogen
from PS (Eq. (7)). The singlet BP radical in the presence of
oxygen forms the highly reactive hydroperoxide radical (Eq.
(8)). The latter upon reaction with a PS radical produces a
PS hydroperoxide (Eq. (9)), which decomposes as discussed
above in Eqs. (3)-(4). Kaczmarek and co-workers have
shown photoinitiation as the dominant function of BP (and
other initiators) at relatively low concentration (0.1%) in a
PS matrix when irradiated in air [6]. At a higher
concentration (0.5%), photodegradation efficiency
decreases. This change is due to phase-incompatibility
between PS and BP, and decrease in their surface contact. In
addition to this, benzopinacol formation from ketyl radical
combination (Eq. (10)) competes with the initiation and
acceleration of PS degradation. Crosslinking can also
become a major process when a singlet BP radical and a
PS radical (Eq. (11)) combine although this has not been
thoroughly investigated before [8].
1.1. Investigation methods for photodegradation and
photocrosslinking
PS degradation processes can be observed by a number
of techniques, including thermal and dynamic mechanical
analyses. For example, simple viscometric measurements of
irradiated films of PS–BP blends [4] show a decrease in
viscosity-average molecular weight, Mv, as chain scission
occurs at low initiator concentrations. As BP concentration
is increased incrementally, Mv eventually increases as
crosslinking becomes more pronounced. These physico–
mechanical methods are important for analyses of the bulk
polymers. Spectroscopic methods are also common, for bulk
as well as film samples. Electron spin resonance spectro-
scopic measurements of PS films irradiated both under
vacuum and in air give spectra assigned to the PS radical
and the peroxyradical [8]. Pioneering work by Gueskens and
co-workers shows IR peaks at 3300–3500 andw1700 cmK1
for hydroperoxide and carbonyl species, respectively [9].
The CaC stretch of degradation polyolefin products is not
observed directly in the IR, due to overlap with the strong
phenyl ring stretch at 1601 cmK1. However, they have
reported these chromophores using UV–vis spectroscopy.
While much investigation has been done on bulk samples,
only a few detailed studies have focused on thin films using

M.D. Millan et al. / Polymer 46 (2005) 5556–55685558
combined spectroscopic, microscopic, and acoustic
methods within the same time frame of observation.
1.2. Analysis techniques for thin films
There is a lot of interest in polymers (including PS) cast
as thin films. In this form, many novel applications present
themselves for mechanical, optical, and electronic thin film
devices and coatings. It is also known that the physical
properties of polymers can deviate significantly from those
of bulk samples when the film thickness is less than 150–
100 nm [10,11]. Therefore, techniques that are sensitive to
the physico–chemical processes occurring with ultrathin
films are of great interest for structure–property correlation
and understanding of phenomena. Thus, we have sought in
this work to investigate the analysis of PS photodegradation
and photocrosslinking using such methods.
1.2.1. FT-IR imaging
FT-IR Imaging [12] is a technique for obtaining spatially
and temporally-resolved chemical and structural infor-
mation. As such, it can provide a ‘still picture’ of specific
functional groups, e.g. a carbonyl moiety, over a relatively
large sample area at specific periods of time. As a non-
destructive technique, it has been applied to numerous
polymeric systems for observing processes as diverse as
oxidation [13], crosslinking [14], and crystallization [15].
Physical blends [16], and dissolution of polymers in various
solvents [17] including supercritical CO2 [18] have also
been monitored. The use of synchrotron radiation as the IR
source drastically improves spectral quality [19a,b], and
new sampling techniques like internal reflection IR imaging
(IRIRI) or micro-ATR provide enhanced spatial resolution
[19c,d]. Since FT-IR imaging allows real-time observation
of chemical changes in functional groups, we have utilized
it to observe the photochemical processes in a PS-initiator
polymer blend degradation and cross-linking study.
1.2.2. Evanescent waveguide spectroscopy (WS)
WS can be used to determine the thickness and refractive
indices of polymer films when deposited on a noble metal
surface. Typically, gold (45 nm) is coated on a glass slide,
the polymer film is cast on the gold side, and the glass side
of the substrate is then put into optical contact with a glass
prism using a refractive index matching liquid, using the
Kretschmann coupling technique [21].
When the polymer is of sufficient thickness, guided
optical waves can propagate in a direction parallel to the
substrate plane. These waveguide modes exist subject to the
following condition [22]:
kzd ZmpCb1 Cb2 (12)
where kz is the component of the wave vector normal to the
substrate plane, and d is the thickness of the polymer film, m
is the order of the waveguide mode, and bi (iZ1,2) are the
phase shifts of the propagating wave at the film boundaries.
bI are dependent on the polarization of light, and are defined
by Fresnel formulas.
For very thin layers of polymer, a surface plasmon
resonance (SPR) mode (mZ0) can be observed using p-
polarized light. With increased thickness, two possible
waveguide modes can be excited depending on the
polarization of light: (i) a transverse magnetic (TM) mode
under p-polarization, which is sensitive to both the out-of-
plane refractive index nz and the in-plane ny in the direction
of guided wave propagation, and (ii) a transverse electric
(TE) mode under s-polarization, sensitive to the in-plane nx
perpendicular to the guided wave direction. When reflec-
tivity (R) is measured versus angle of incidence q, minima
are observed beyond a critical angle qc according to the
number of modes (mZinteger) excited. The angle q of these
minima depend on the dielectric constants 3 and the
thicknesses of the waveguide layers, including the glass,
gold, and polymer [23]. The thickness(es) and 3 of the gold
layer (and any underlying metal) can be determined from
SPR data (using the same Kretschmann set-up) by
simulating the spectrum of the bare gold-coated substrate
using Fresnel calculations. The experimental waveguide
spectra can then be fit to generate thickness d and refractive
index n (n2Z3) for the polymer layer. WS can be a powerful
tool to determine thickness, optical properties, and even
molecular orientation of thin films. For instance, anisotropy
in the film can be detected by non-identical values of nx, ny,
and nz. Again, a series of spectra periodically obtained can
be used to observe changes as a function of time.
1.2.3. Quartz crystal microbalance (QCM)
The QCM is a highly sensitive technique for observing
mass changes due to physical or chemical changes occurring
in a thin layer of material deposited on a quartz crystal [24].
The piezoelectric properties of the crystal changes with
mass adsorption at the interface of the crystal and air,
causing a change in the oscillating frequency Fq. The
resulting change in frequency DF can be used to measure a
mass change Dm in the nanogram scale, using the Sauerbrey
equation [25], tailored to the parameters in the QCM
experiment:
DF ZK2F2
qDm
Affiffiffiffiffiffiffiffiffiffi
rqmqp (13)
where Fq is the resonant frequency of the QCM crystal, A is
the area of the electrode, rq is the density of quartz (2.65 g/
cm3) and mq is the shear modulus of quartz (2.95!106 N/
cm2). The values pertinent to our work are FqZ5 MHz, and
AZ1.227 cm2. Plugging in the appropriate values, the
change in mass can be determined directly from the
equation:
Dm ZK2:17!10K8DF ðHzÞ (14)
This equation is taken to be valid for measurements taken

M.D. Millan et al. / Polymer 46 (2005) 5556–5568 5559
both in air and in vacuum [26]. By measuring the frequency
or mass changes as a function of time, kinetic data can be
obtained.
2. Experimental section
2.1. Materials
Polystyrene (average Mw 250,000) was purchased from
Acros Organics. All other materials were purchased from
Aldrich and used without further purification. All solvents
were purchased from EM Science and used without further
purification.
2.1.1. Synthesis of 2BP12
[1,12-Dodecanediylbis(oxy-4,1-phenylene)][bis[phenyl-
methanone], 2BP12 (Scheme 3) was obtained as the
secondary product in a published procedure [27] for the
synthesis of 4-(12-bromododecyloxy)benzophenone. 4-
Hydroxybenzophenone (3.15 g, 15.9 mmol), 1,12-dibromo-
dodecane (5.22 g, 15.9 mmol), and potassium carbonate
(2.76 g, 20 mmol) were combined in 40 mL acetone in a
one-neck flask. The mixture was refluxed overnight and then
poured into water, extracted with ether, and dried over
magnesium sulfate. Upon removal of solvent, a mixed solid
was obtained. Dissolution and recrystallization of the solid
yielded 4-(12-bromododecyloxy)benzophenone. Evapor-
ation of the supernatant liquid gave 2.1 g (yield 23.5%) of
the desired product 2BP12. 1H NMR (300 MHz, CDCl3,
ppm) d 7.82 (d, 4H), 7.75 (d, 4H), 7.56 (dd, 2H), 7.46 (dd,
4H), 6.95 (d, 4H), 4.03 (t, 4H), 1.81 (dt, 4H) 1.47 (m, 4H),
1.31 (m, 12H). 13C NMR (75 MHz, CDCl3, ppm) d 192.52,
162.84, 138.34, 132.52, 131.79, 129.86, 129.66, 128.13,
122.65, 113.97, 68.24, 29.53, 29.33, 29.10, 25.97.
2.1.2. Substrate preparation
All glass and silicon substrates were cleaned by dipping
in piranha solution (30:70 v/v of 30% w/w hydrogen
peroxide and 98% w/w sulfuric acid) for at least 30 min,
rinsing thoroughly with deionized water (resistivity
18.2 MU), purified through a Milli-Q Academic System
(Millipore Corporation) with a 0.22 mm Millistack filter.
Substrates were then dried with an air-jet, then cleaned with
Scheme 3. Synthesis of 2BP12.
a March Plasmod (March Instruments, Inc.) oxygen plasma
cleaner prior to use.
2.2. Characterization and instrumentation
2.2.1. UV-irradiation of samples
All irradiation experiments were performed with an Oriel
Hg–Xe lamp with a typical power of 100 mW/cm2 at an
average distance of 25 cm from the substrate.
2.2.2. UV–vis spectroscopy
UV–vis spectra were obtained using an Agilent 8453
UV–vis spectrometer. A blend of 50:50 wt% PS:2BP12 was
suspended in enough CHCl3 to make a 10% solution,
filtered, and spincast on clean glass slides at 1000 rpm for
120 s. This solution and all subsequent ones described
below were filtered through 0.2 mM hydrophobic fluoropore
(PTFE) filters (Millex, Millipore). All samples were
irradiated for specified times, and the absorption spectrum
taken after each time increment.
2.2.3. FT-IR spectroscopy and imaging
All spectra and images were obtained using a Digilab
Stingray system consisting of a FTS 7000 Step-scan
spectrometer and UMA 600 IR Microscope. IR images
were obtained using a 32!32 array MCT-FPA detector,
covering a sample area of 176!176 mm2 in transmission
mode. All images were taken with a nominal spectral
resolution of 8 cmK1 and an undersampling ratio of four. A
typical imaging experiment used 5000 scans with a total
acquisition time of about 30 min. All images were processed
using the included software Win-IR Pro 3.4. For PS:2BP12
irradiated in solution, a blend of 50:50 wt% PS:2BP12 was
suspended in enough CHCl3 to make 2 mL of a 10%
solution in a 1 cm quartz cuvette. This concentration was
necessary in order to attenuate the spectral data based on
previous optimization studies. With constant stirring, the
mixture was irradiated through the cuvette for specified
times. A small aliquot was then obtained after each time
increment, and spincast on silicon wafers at 1000 rpm for
120 s. For PS:2BP12 irradiated as thin films, a blend of
50:50 wt% PS:2BP12 was suspended in enough CHCl3 to
make a 10% solution, filtered, and spincast on a clean
silicon wafer at 1000 rpm for 120 s.
2.2.4. Optical waveguide spectroscopy
A Multiskop (Optrel, Germany) instrument was used
with samples in the Kretschman prism-coupling configur-
ation at attenuated total reflection (ATR) conditions. A p-
polarized He–Ne laser (632.8 nm) was used to illuminate
the prism in both TM and TE modes. Reflected light vs.
angle of incidence data was converted by computer to a R
vs. q scan, qZ30–708 (PS) and to 758 (PS:2BP12). BK7
glass substrates were coated with a w9 nm layer of
chromium (to ensure gold adhesion) and a w30–33 nm
layer of gold. A solution of 50 mg/mL PS in CHCl3 was

M.D. Millan et al. / Polymer 46 (2005) 5556–55685560
filtered, and spincast on a gold substrate at 1000 rpm for
120 s. A solution of 50 mg/mL of 90:10 wt% PS:2BP12 in
CHCl3 was filtered, and spincast on the gold substrate under
identical conditions. This concentration produced homo-
geneous films suitable for WS. Higher concentrations (e.g.
50:50 wt% PS:2BP12) gave unsuitable phase-separated
films. After obtaining initial waveguide spectra, the
PS:2BP12 film was irradiated ex situ for 3 h, and post-
irradiation spectra were taken. Due to the necessity of
moving the sample to irradiate, a sample holder was
configured to hold the glass prism firmly onto the glass side
of the substrate before and after irradiation. This allowed us
to carefully realign the laser on the prism, and thus take
waveguide spectra of the same position on the film. Three
pre-irradiation and three post-irradiation waveguide spectra
were taken, and averages of the simulated thickness and
refractive indices are reported.
2.2.5. AFM
The surface morphologies were recorded using a
PicoSPM II system (Pico Plus, Molecular Imaging) using
a 10!10 mm2 scanner. Magnetic AC (MAC) mode was
used for all images. Magnetically coated Type II MAC-
levers with a spring constant of 2.8 nN/M with about 10 nm
tip radius were used in the top-down configuration.
2.2.6. Contact angle
Static contact angles were measured using a CAM 200
optical contact angle meter (KSV Instruments, Ltd) with
CAM 200 Software as supplied, from the same samples
used for WS. A 1 mL drop of deionized water was used in all
measurements. Multiple measurements were made for each
substrate at various positions protected by the sample
holder, as well as those exposed to UV light, to effectively
give before-and-after data.
2.2.7. QCM
The QCM, crystals and the RQCM Data-Log Software
(for data acquisition and monitoring) were obtained from
Maxtek, Inc. A research quartz crystal microbalance
(RQCM) was used to measure the oscillation frequency.
Two solutions of 50 mg/mL of 90:10 and 50:50 wt%
PS:2BP12 in CHCl3 were filtered, and spincast at
1000 rpm for 120 s, on a polished QCM AT cut crystals
(25.5 mm diameter, 5 MHz) with a Ti–Pt electrode
(12.5 mm diameter). The crystals were dried overnight
under vacuum at room temperature to remove all traces of
solvent. For kinetics measurements, DFrequency was
measured versus time while irradiating at ambient con-
ditions for about 3 h, and for about 1 h after irradiation.
Fig. 1. FT-IR spectra of PS:2BP12 irradiated in solution and spincast onto
silicon. (a) Transmission spectrum of blend prior to irradiation. (b)
Decreasing 2BP12 CaO stretch (1640 cmK1) with irradiation time relative
to constant PS phenyl ring stretch (1601 cmK1).
3. Results and discussion
For all FT-IR, IR imaging, and UV–vis work described
below, a higher concentration of 2BP12 (50 mg/mL
50:50 wt% with PS: 2BP12) was used than is typical of
most photodegradation studies [4,6]. Our objective in using
this PS:2BP12 ratio was to ensure a significant signal
attenuation within the time of observation for the BP
carbonyl suitable for all FT-IR imaging, UV–vis, WS, and
QCM measurements (Fig. 1(a)). Our early experiments
showed that at lower amounts of 2BP12 or PS:2BP12 ratio
of 90:10 wt%, all BP carbonyls was consumed within
30 min of irradiation. We judged as impractical any kinetic
experiments where the reaction time is significantly shorter
than the measurement time (w30 min for the imaging
experiments). A second rationale for the high ratio was also
to ensure and increase the occurrence of crosslinking
relative to photodegradation, and to monitor these two
competing processes by the techniques utilized in this study
in the same time frame of observation. In the future, other
compositions could be considered but would require a
binary composition–property correlation plot which is
beyond the reasonable scope for this study. The focus of
this work is correlation of phenomena on the same time
frame of observation for all measurements.

M.D. Millan et al. / Polymer 46 (2005) 5556–5568 5561
3.1. PS:2BP12 irradiated in solution
The ideal FT-IR imaging experiment to observe
maximum crosslinking and minimum chain scission
would be to irradiate PS:2BP12 in vacuo, and scan the
identical region on the same film as a function of irradiation
time. Due to experimental design constraints for an oxygen-
free environment, we decided to irradiate a sealed, stirred
PS:2BP12 solution in CHCl3 to minimize exposure to
oxygen, and spincast separate aliquots per irradiation time
on a substrate. Although IR images could give an indication
of the distribution of functional groups in each film, trends
of crosslinking (and chain scission, if any) versus time
might not be readily observable across separate samples.
Thus, the films were observed by simple transmission IR.
Since the solution was stirred to ensure homogeneity and
consistent aliquot sizes were spincast, absorbance intensi-
ties should give an accurate indication of the trends sought.
As solution irradiation is continued incrementally, a
continuous decrease in the CaO stretch at 1640 cmK1 is
seen (Fig. 1(b)) up to 120 min. No new peak atw1700 cmK1
is observed, where degradation carbonyls are expected.
Fig. 2 shows the absorbances of the peaks at 1640 (CaO
stretch), 1601 (phenyl ring stretch) and 1449 (CH2 bend)
cmK1, taken relative to that at 1257 cmK1 (C–O stretch) and
plotted versus irradiation time. A decrease is seen for the
carbonyl moiety, while trends are relatively linear for the
phenyl and methylene groups. This indicates that
the photocrosslinking event is the major process occurring
in the absence of oxygen. As described previously, the
formation of conjugated double bonds does occur during
vacuum irradiation, but cannot be observed in the IR due to
the overlap with the phenyl ring stretch.
Fig. 3. UV–vis spectra of PS:2BP12. (a) Increasing absorbance at 280 nm.
(b) Expanded region (300–350 nm) focusing on 310 and 340 nm.
3.2. UV–vis spectroscopyTo verify that the polyene formation in the photode-
gradation could be monitored by UV–vis spectroscopy,
glass slides were spincast with PS:2BP12, and irradiated
over time as shown in Fig. 3 up to 180 min. The absorption
Fig. 2. Absorbances for CaO (1640 cmK1), phenyl ring (1601 cmK1), and
CH2 (1449 cmK1) relative to C–O (1257 cmK1).
maximum at 280 nm has been attributed to both the diene
chromophore (Eq. (5), nZ2) [9] and degradation carbonyls
[28]. Longer wavelength maxima have also been reported,
and assigned to polyenes of greater conjugation lengths, at
310 nm (nZ3) and 340 nm (nZ4) [1,28]. The latter are
extremely difficult to observe as pronounced maxima, but
nonetheless exhibit an increase in absorbance intensity with
time (Fig. 3(b)). Thus, UV–vis is a convenient method for
looking at this aspect of the PS photodegradation, i.e.
conjugated CaC formation.
3.3. PS:2BP12 irradiated as thin films
Transmission FT-IR spectra (Fig. 4(a)) versus irradiation
time showed an increase in intensity for a broad peak
centered at w1735 cmK1, due to carbonyls that form upon
PS photodegradation in the presence of atmospheric
oxygen. A decrease in peak intensity at 1640 cmK1 also
occurs, although not as rapidly as the former. A steady
increase at w3350 cmK1, due to hydroperoxide production

Fig. 4. (a) Increasing vs. decreasing intensities in degradation CaO(1735 cmK1) and 2BP12 CaO (1640 cmK1) bands, respectively. (b)
Absorbances for degradation CaO, 2BP12 CaO, and PS phenyl ring
stretch (1601 cmK1) relative to CH2 bend (1257 cmK1).
Fig. 5. (a) FT-IR spectra highlighting the loss of 1735 cmK1 peak upon
exposure of film to ammonia vapor. (b) Carbonyl region of the subtracted
spectrum from (a). Arrow points to the region formerly attributed to the
amide.
M.D. Millan et al. / Polymer 46 (2005) 5556–55685562
is also observed, but has not been included in the figure. In
Fig. 4(b), the absorbances of the peaks for degradation
CaO, 2BP12 CaO, and PS phenyl ring stretch (1601 cmK1)
were taken relative to the methylene bend at 1449 cmK1,
and plotted versus irradiation time. Since hydroperoxides
are produced, the number of C–O groups increases with
time. On the other hand, Kaczmarek and co-workers have
reported that polyene formation (Eq. (5)) is inhibited by
benzophenone initiators relative to chain scission [6], and
thus the methylene signal would be more useful to
normalize the other peak absorbances. The trends in the
plots above show an increase in the number of degradation
carbonyls formed. The decrease in the 2BP12 carbonyls
show that crosslinking occurs as a process simultaneous to
photodegradation. The trend for decomposition of the
phenyl ring is not as clear, but the fate of this functional
group has been discussed extensively in the literature.
Absorbance values at 3350 cmK1 were difficult to extract
from the transmission spectra and were not plotted in Fig.
4(b).
The actual identity of the degradation carbonyl products
has been reported as peroxy or carboxylic acids [4,9],
aldehydes [4,6], aliphatic and aromatic ketones [8,9], and
carboxylic esters and peresters [29]. The acetophenone end
group [9,30] (1685–1690 cmK1) is a particularly favored
species, and is considered to be one of the species
responsible for the yellowing of photodegrading PS. The
new carbonyl peak in our spectra is very broad, going from
w1660 to w1850 cmK1, in excellent agreement with the
data from Geetha and others [28]. Assignments of the peak
in the latter work were made to ketones, aldehydes and
peroxy esters (1720, 1732 and 1782 cmK1, respectively).
On the other hand, Otocka and co-workers [4] have
described the species at 1730 cmK1 as either a carboxylic
or peroxy acid, due to a quantitative peak shift to 1660 cmK1
upon exposure of the irradiated PS to concentrated
ammonia vapor. We repeated their procedure on our films
(exposure to NH3 vapor for 1 h), and found nearly complete
loss of the broad peak centered at 1735 cmK1, and a
shoulder to higher frequency of the 2BP12 CaO signal (Fig.
5(a)). Subtraction of the spectrum of irradiated PS:2BP12
from the ammonia-treated spectrum reveals the shoulder to

M.D. Millan et al. / Polymer 46 (2005) 5556–5568 5563
be a peak at 1665 cmK1, presumably due to an amide
carbonyl (Fig. 5(b)).
3.4. FT-IR imaging
To our knowledge, this is the first reported use of FT-IR
imaging to directly observe the photodegradation process in
a PS polymer thin film system. By FT-IR imaging, it is
possible to obtain ‘before and after’ spectral micrographs of
both photodegradation and crosslinking upon UV
irradiation at specific stages. For example, when small
molecule photoinitiators are used, they may be readily
observed by unique absorption frequencies in the IR. BP, for
instance, is readily observed from the CaO stretch at
w1660 cmK1. The peak is not expected to change when BP
is regenerated from the singlet BP radical with formation of
the hydroperoxide radical. However, crosslinking of the
radical leads to the loss of the carbonyl group and a decrease
in CaO peak intensity. Crosslinking in BP-modified
polymers in the form of benzophenone dianhydride
copolymerized with both hydrogen donor and non-donor
molecules has been previously reported [20]. GPC results
revealed that photocrosslinking efficiency is a nearly linear
function of aliphatic hydrogen donor content in the polymer.
Therefore, to facilitate the observation of both crosslinking
and photodegradation in air-irradiated PS, we decided to use
2BP12, a molecule containing two BP moieties held by
ether linkages to a dodecyl chain. 2BP12 should function as
a more efficient crosslinker due to its bifunctional nature.
We have chosen to focus on the three pertinent
wavenumbers, specifically 1640 cmK1 (CaO stretch,
2BP12), 1735 cmK1 (CaO stretch, degradation carbonyls),
and 3350 cmK1 (O–H, hydroperoxide). All images at each
wavenumber are adjusted to the same highest and lowest
intensities using the IR software for maximum contrast in
the changes for each functional group (Fig. 6). The images
chosen at the specified irradiation times are the most
illustrative of the trends in photodegradation and cross-
linking in a 176!176 mm2 area of a sample (for 3D
rendering, see Supporting information). These images are
typical and several scans were made on different spots of the
film to verify that these images are representative. The IR
images provide a chemical map of both degradation and
photocrosslinking processes in PS:2BP12 films where each
pixel is actually equivalent to one spectra (Supporting
information). An apparent orientation can be seen along the
diagonal of the spectral slices from bottom left to top right.
This effect may be due to a morphological ordering of the
deposited material, as it is spincast on silicon. Upon
irradiation, the images of the functional groups involved
would be expected to roughly follow this orientation.
The changes in the IR images of the PS degradation
products are more pronounced than those for the benzo-
phenone carbonyl. This is expected as the degradation
carbonyls and hydroperoxides begin from zero intensity. On
the other hand, crosslinking is not expected to proceed
completely, i.e. the carbonyl group at 1640 cmK1 would not
drop to zero absorbance. This has been shown in previously-
described crosslinking experiments using benzophenone-
containing polymers [20]. In a film, not all benzophenone
moieties are within reasonable proximity of hydrogen
donors (C–H bonds). It has also been argued that hydrogen
abstraction (Eq. (7)) by the ketyl radical may be reversible,
and can lead to a decrease in singlet radical content without
subsequent crosslinking. An important observation is that
this process in not typically homogeneous as shown be the
distribution intensities on the false color map. On a 32!32 pixel array or roughly an area of 176!176 mm2, the
crosslinking process is not necessarily uniformly distrib-
uted. It should be noted that in FT-IR imaging it is possible
to obtain the 2D spectra from each pixel of the image
(Supporting information). For future practical reasons, it
should be possible to investigate patterns or arrays prepared
by photodegradation or photochemical crosslinking
methods using FT-IR imaging.
3.5. WS, AFM, and contact angle measurements
Fig. 7 shows the changes in the WS spectra for pure PS
(a) and PS:2BP12 (b) after irradiation for 180 min. Film
thicknesses and refractive indices from WS simulations are
also given in the figure. The refractive indices for all film
directions (x, y, z planes) were equal all at any one time
throughout the experiments, as expected for PS without any
photo-orientable groups. No anisotropy was observed, even
from the spincasting process [22]. The presence of 2BP12
did not cause any anisotropy in the film either. However, its
presence affects the resulting film thickness and refractive
index with irradiation. The increase in n reflects the increase
in the dielectric constant (3Zn2) of PS upon the introduction
of polar and polarizable groups (e.g. CaO and conjugated
CaC). Most polymers exhibit an increase in dielectric
constant upon oxidative photodegradation.
The trends in thickness change, unlike n, are not as
straightforward. At high concentrations, 2BP12 tends to
phase separate from the polymer. When PS:2BP12
90:10 wt% (compared to 50:50) is used, the cloudiness
and observable heterogeneity of the films are decreased
enough to give meaningful WS spectra. However, the
phase-incompatibility is such that as the irradiation is
performed, crosslinking will be localized in the areas where
2BP12 is aggregated. Due to the inherent film dimensions,
crosslinking would occur more favorably parallel to the
substrate, rather than across the thickness of the film. This
contraction in the former direction could result in an
increase in the dimension normal to the film, and would be
detected by WS as an increase in thickness. Also, chain-
scission would be less pronounced in the crosslinked areas
due to decreased diffusion of oxygen. On the other hand,
pure PS would undergo oxidation and chain-scission, and
disruption in the film surface would result in an observed
decrease in thickness. These contrasting results were clearly

Fig. 6. FT-IR images for spectral slices extracted from 1640, 1735, and 3350 cmK1 as a function of irradiation time in 30 min increments. Scale bars indicate
highest and lowest intensities, respectively. Area is 176!176 mm2.
M.D. Millan et al. / Polymer 46 (2005) 5556–55685564
verified by the waveguide measurements and by QCM
(discussed later). We have attempted to correlate the
kinetics behavior of photodegradation and photocrosslink-
ing by WS but the results have been inconclusive in terms of
fit parameters (Supporting information).
Topography flattened AFM images are shown in
Fig. 8, for the samples used for WS before and after
irradiation. The pre-irradiation films for both pure PS
and PS:2BP12 blend show smooth deposition on gold,
with uniformly distributed globular features (seen as
white spots in these images). After irradiation for 3 h,
the globules have increased in both number and size in
both samples. Post-irradiation PS shows pronounced,
dark, crevice-like features through the film. On the other
hand, post-irradiation PS:2BP12 shows numerous large
globules up to 5 nm in diameter, while the height profile
increases about 10 nm.
These AFM images are consistent with those obtained by
Greenwood and co-workers [31]. They exposed six different
polymer samples (including PS) to low pressure non-
isothermal O2 plasma, and observed the differences in the
pre- and post-treatment surfaces by AFM and XPS.
However, in our case, the presence of 2BP12 also influences
the internal morphology of the film, which comprises some
phase-separated domains within PS. While the experimental
conditions of oxygen plasma and UV irradiation in air are
obviously different, surface effects of the former include
plasma oxidation, chain scission, and aggregation of the
oxidized species. Thus, the net effect (if not extent) of
oxidation on the surface is expected to be similar for both

Fig. 7. (a) TM (p-polarization) and (b) TE (s-polarization) modes for PS. (c) TM (p-polarization) and (d) TE (s-polarization) modes for PS:2BP12. Dashed and
dotted curves are spectra at 0 and 180 min irradiation time, respectively. Solid curves are best experimental fits from Fresnel calculations. Included table
summarizes results for thicknesses and refractive indices.
M.D. Millan et al. / Polymer 46 (2005) 5556–5568 5565
techniques. Their pre-plasma AFM images of PS show even
distributions of hemispherical features, effects due to the
film casting methods used. Post-plasma images of all
polymers studied exhibit a highly globular surface,
attributed to agglomeration of lower-molecular weight
oxidation and chain scission products. Interestingly, an
inverse correlation is seen between the degree of oxidation
(from D O:C data by XPS) and mean globule size.
Assuming that these O2 plasma treatment AFM data parallel
those we obtained with photodegradation in air, both WS
and AFM results show that PS alone is more extensively
oxidized compared to PS:2BP12 under identical conditions.
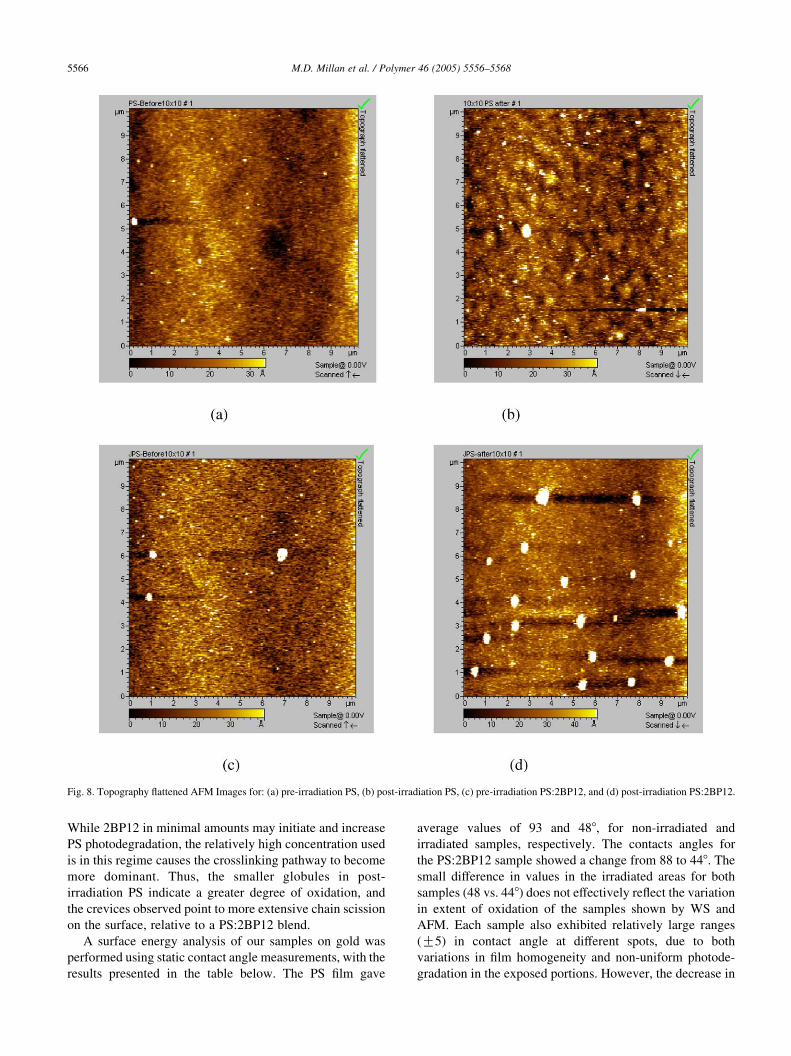
Fig. 8. Topography flattened AFM Images for: (a) pre-irradiation PS, (b) post-irradiation PS, (c) pre-irradiation PS:2BP12, and (d) post-irradiation PS:2BP12.
M.D. Millan et al. / Polymer 46 (2005) 5556–55685566
While 2BP12 in minimal amounts may initiate and increase
PS photodegradation, the relatively high concentration used
is in this regime causes the crosslinking pathway to become
more dominant. Thus, the smaller globules in post-
irradiation PS indicate a greater degree of oxidation, and
the crevices observed point to more extensive chain scission
on the surface, relative to a PS:2BP12 blend.
A surface energy analysis of our samples on gold was
performed using static contact angle measurements, with the
results presented in the table below. The PS film gave
average values of 93 and 488, for non-irradiated and
irradiated samples, respectively. The contacts angles for
the PS:2BP12 sample showed a change from 88 to 448. The
small difference in values in the irradiated areas for both
samples (48 vs. 448) does not effectively reflect the variation
in extent of oxidation of the samples shown by WS and
AFM. Each sample also exhibited relatively large ranges
(G5) in contact angle at different spots, due to both
variations in film homogeneity and non-uniform photode-
gradation in the exposed portions. However, the decrease in
M.D. Millan et al. / Polymer 46 (2005) 5556–5568 5567
q in non-irradiated versus irradiated samples is entirely
consistent with the introduction of highly polar groups
(hydroperoxides and carbonyls) and decreased
hydrophobicity.
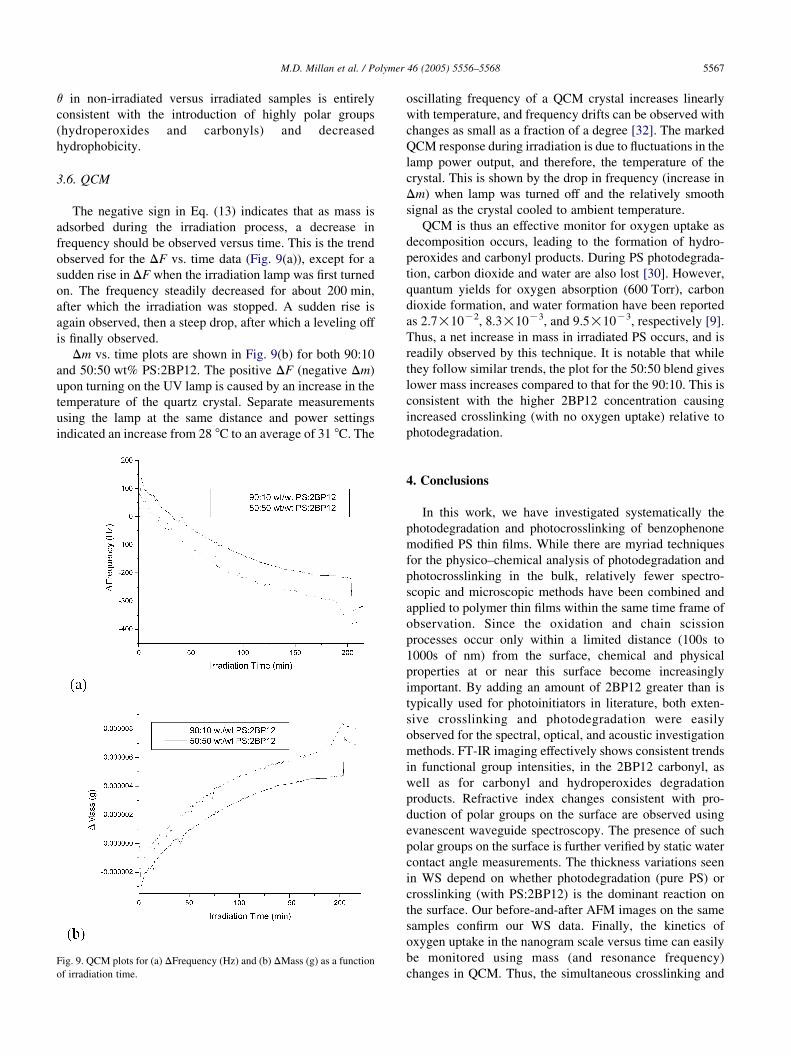
3.6. QCM
The negative sign in Eq. (13) indicates that as mass is
adsorbed during the irradiation process, a decrease in
frequency should be observed versus time. This is the trend
observed for the DF vs. time data (Fig. 9(a)), except for a
sudden rise in DF when the irradiation lamp was first turned
on. The frequency steadily decreased for about 200 min,
after which the irradiation was stopped. A sudden rise is
again observed, then a steep drop, after which a leveling off
is finally observed.
Dm vs. time plots are shown in Fig. 9(b) for both 90:10
and 50:50 wt% PS:2BP12. The positive DF (negative Dm)
upon turning on the UV lamp is caused by an increase in the
temperature of the quartz crystal. Separate measurements
using the lamp at the same distance and power settings
indicated an increase from 28 8C to an average of 31 8C. The
Fig. 9. QCM plots for (a) DFrequency (Hz) and (b) DMass (g) as a function
of irradiation time.
oscillating frequency of a QCM crystal increases linearly
with temperature, and frequency drifts can be observed with
changes as small as a fraction of a degree [32]. The marked
QCM response during irradiation is due to fluctuations in the
lamp power output, and therefore, the temperature of the
crystal. This is shown by the drop in frequency (increase in
Dm) when lamp was turned off and the relatively smooth
signal as the crystal cooled to ambient temperature.
QCM is thus an effective monitor for oxygen uptake as
decomposition occurs, leading to the formation of hydro-
peroxides and carbonyl products. During PS photodegrada-
tion, carbon dioxide and water are also lost [30]. However,
quantum yields for oxygen absorption (600 Torr), carbon
dioxide formation, and water formation have been reported
as 2.7!10K2, 8.3!10K3, and 9.5!10K3, respectively [9].
Thus, a net increase in mass in irradiated PS occurs, and is
readily observed by this technique. It is notable that while
they follow similar trends, the plot for the 50:50 blend gives
lower mass increases compared to that for the 90:10. This is
consistent with the higher 2BP12 concentration causing
increased crosslinking (with no oxygen uptake) relative to
photodegradation.
4. Conclusions
In this work, we have investigated systematically the
photodegradation and photocrosslinking of benzophenone
modified PS thin films. While there are myriad techniques
for the physico–chemical analysis of photodegradation and
photocrosslinking in the bulk, relatively fewer spectro-
scopic and microscopic methods have been combined and
applied to polymer thin films within the same time frame of
observation. Since the oxidation and chain scission
processes occur only within a limited distance (100s to
1000s of nm) from the surface, chemical and physical
properties at or near this surface become increasingly
important. By adding an amount of 2BP12 greater than is
typically used for photoinitiators in literature, both exten-
sive crosslinking and photodegradation were easily
observed for the spectral, optical, and acoustic investigation
methods. FT-IR imaging effectively shows consistent trends
in functional group intensities, in the 2BP12 carbonyl, as
well as for carbonyl and hydroperoxides degradation
products. Refractive index changes consistent with pro-
duction of polar groups on the surface are observed using
evanescent waveguide spectroscopy. The presence of such
polar groups on the surface is further verified by static water
contact angle measurements. The thickness variations seen
in WS depend on whether photodegradation (pure PS) or
crosslinking (with PS:2BP12) is the dominant reaction on
the surface. Our before-and-after AFM images on the same
samples confirm our WS data. Finally, the kinetics of
oxygen uptake in the nanogram scale versus time can easily
be monitored using mass (and resonance frequency)
changes in QCM. Thus, the simultaneous crosslinking and

M.D. Millan et al. / Polymer 46 (2005) 5556–55685568
photodegradation trends can be quantitatively determined
based on correlation of the IR, UV–vis, WS, and QCM
measurements since all of the data obtained were within the
same time frame of observation. The percentage differences
(before and after) or time correlation plots (kinetics) can be
used to prepare a more quantitative picture of composition–
property or structure–property relationships in the future.
The use of these combined techniques can also be extended
to the analysis of any number of polymeric thin film systems
undergoing other types of degradation and reactive
processes. Studies are underway to investigate in situ
patterning processes in polymer thin films.
Acknowledgements
We acknowledge partial financial support from NSF-
CTS (0330127) and DMR-0315565. We would also like to
acknowledge technical support from Molecular Imaging
Inc., Maxtek Inc., and Optrel GmBH.
Supplementary data
Supplementary data associated with this article can be
found at doi:10.1016/j.polymer.2005.05.050
References
[1] Rabek JF. Polymer photodegradation: mechanism and experimental
methods. Cambridge: Chapman & Hall; 1995, p. 185–217.
[2] Grassie N, Weir WA. J Appl Polym Sci 1965;9:987–98.
[3] The following is a list of representative publications and is by
no means exhaustive: (a) Achhammer BG, Reiney MJ, Wall LA,
Reinhart FW. J Polym Sci 1952;8:555–71.
(b) Reiney MJ, Tyron J, Achhammer BG. J Res Natl Bur Stand 1953;
51:155–61.
(c) Grassie N, Weir NA. J Appl Polym Sci 1965;9:963–74 [see also p.
975–86; 999–1003].
(d) Ranby B, Rabek JF. Photodegradation, photooxidation and
photostablization of polymers: principles and applications. New
York: Wiley; 1975, p. 165–184.
(e) Weir NA. Eur Polym J 1978;14:9–14.
(f) Weir NA. J Polym Sci, Polym Chem Ed 1978;13–31:1123–36.
(g) Lucas PC, Porter RS. Macromolecules 1994;27:3666–8.
[4] (a) OtockaEP,Curran S, PorterRS. JAppl PolymSci 1983;28:3227–33.
(b) Tamai T, Hashida I, Ichinose N, Kawanishi S, Inoue H, Mizuno K.
Polymer 1996;37:5525–8.
[5] Gueskens G, Bastin P, Lu-Vinh Q, Rens M. Polym Degrad Stab 1981;
3:295–306.
[6] Kaczmarek H, Kaminska A, Swiatek M, Sanyal S. Eur Polym J 2000;
36:1167–73.
[7] Kubica J, Waligora B. Eur Polym J 1977;13:325–9.
[8] Torikai A, Takeuchi T, Fueki K. Polym Photochem 1983;3:307–20.
Scherzer T, Tauber A, Mehnert R. Vib Spectrosc 2002;29:125–31.
[9] Gueskens G, Baeyens-Volant D, Delaunois G, Lu-Vinh Q, Piret W,
David C. Eur Polym J 1978;14:291–7.
[10] Tanaka K, Takahara A, Kajiyama T. Macromolecules 1997;30:6626.
[11] Tawa K, Knoll W. Macromolecules 2002;35:7018–23.
[12] (a) Koenig JL, Wang S-Q, Bhargava R. Anal Chem A-Pages 2001;
73:360A–39.
(b) Colarusso P, Kidder LH, Levin IW, Fraser JC, Arens JF,
Lewis EN. Appl Spectrosc 1998;52:106A–120.
(c) Bhargava R, Levin IW. Anal Chem 2001;73(21):5157–67.
[13] Li G-Y, Koenig JL. Appl Spectrosc 2002;56:1390–6.
[14] Rafferty DW, Koenig JL, Magyar G, West JL. Appl Spectrosc 2002;
56:1549–51.
[15] Gupper A, Chan KLA, Kazarian SG. Macromolecules 2004;37(17):
6498–503.
[16] Gupper A, Wilhelm P, Schmied M, Kazarian SG, Chan KLA,
Reussner J. Appl Spectrosc 2002;56:1515–23.
[17] Miller-Chou BA, Koenig JL. Macromolecules 2003;36:4851–61.
[18] Kazarian SG, Chan KLA. Macromolecules 2004;37:579–84.
[19] (a) Ellis G, Marco C, Gomez M. Infrared Phys Technol 2004;45(5–
6):349–64.
(b) Dumas P, Tobin MJ. Spectrosc Eur 2003;15(6):17–23.
(c) Otts DB, Zhang P, Urban MW. Langmuir 2002;18:6473–7.
(d) Chan KLA, Kazarian SG, Mavraki A, Williams DR. Appl
Spectrosc 2005;59(2):149–55.
[20] Lin AA, Sastri VR, Tesoro G, Reiser A, Eachus R. Macromolecules
1988;2:1165–9.
[21] Knoll W. Annu Rev Phys Chem 1998;49:569–638.
[22] Patton D, Park M, Wang S, Advincula RC. Langmuir 2002;18:
1688–94.
[23] Lau KHA, Tan L-S, Tamada K, Sander MS, Knoll W. J Phys Chem B
2004;108:10812–8.
[24] Okahata Y, En-na G, Ebato H. Anal Chem 1990;62:1431–8.
[25] Sauerbrey G. Z Phys 1959;155:206–22.
[26] Baba A, Kaneko F, Advincula RC. Colloids Surf A 2000;173:
39–49.
[27] Fan X, Zou Q, Xia C, Cristofoli W, Mays J, Advincula R. Langmuir
2002;18:4511–8.
[28] Geetha R, Torikai A, Nagaya S, Fueki K. Polym Degrad Stab 1987;9:
279–92.
[29] Khalil Z, Michaille S, Lemaire J. Makromol Chem 1987;188:
1743–56.
[30] Grassie N, Weir WA. J Appl Polym Sci 1965;9:987–98.
[31] Greenwood OD, Hopkins J, Badyal JPS. Macromolecules 1997;30:
1091–8.
[32] Snook G. Investigation of solid-state reactions by electrochemical and
quartz crystal microbalance measurements. Doctoral Dissertation,
Monash University; 2000.