Polymer Reviews Model for the Viscosity of Particle - Lorentz Center
84
PLEASE SCROLL DOWN FOR ARTICLE This article was downloaded by: On: 19 January 2011 Access details: Access Details: Free Access Publisher Taylor & Francis Informa Ltd Registered in England and Wales Registered Number: 1072954 Registered office: Mortimer House, 37- 41 Mortimer Street, London W1T 3JH, UK Polymer Reviews Publication details, including instructions for authors and subscription information: http://www.informaworld.com/smpp/title~content=t713597276 Model for the Viscosity of Particle Dispersions Jozef Bicerano a ; Jack F. Douglas b ; Douglas A. Brune a a Dow Chemical Company, M. E. Pruitt Research Center, Midland, MI, U.S.A. b Polymers Division, Polymer Blends and Processing Group, National Institute of Standards and Technology, Gaithersburg, MD, U.S.A. Online publication date: 11 September 1999 To cite this Article Bicerano, Jozef , Douglas, Jack F. and Brune, Douglas A.(1999) 'Model for the Viscosity of Particle Dispersions', Polymer Reviews, 39: 4, 561 — 642 To link to this Article: DOI: 10.1081/MC-100101428 URL: http://dx.doi.org/10.1081/MC-100101428 Full terms and conditions of use: http://www.informaworld.com/terms-and-conditions-of-access.pdf This article may be used for research, teaching and private study purposes. Any substantial or systematic reproduction, re-distribution, re-selling, loan or sub-licensing, systematic supply or distribution in any form to anyone is expressly forbidden. The publisher does not give any warranty express or implied or make any representation that the contents will be complete or accurate or up to date. The accuracy of any instructions, formulae and drug doses should be independently verified with primary sources. The publisher shall not be liable for any loss, actions, claims, proceedings, demand or costs or damages whatsoever or howsoever caused arising directly or indirectly in connection with or arising out of the use of this material.
Transcript of Polymer Reviews Model for the Viscosity of Particle - Lorentz Center

PLEASE SCROLL DOWN FOR ARTICLE
This article was downloaded by:On: 19 January 2011Access details: Access Details: Free AccessPublisher Taylor & FrancisInforma Ltd Registered in England and Wales Registered Number: 1072954 Registered office: Mortimer House, 37-41 Mortimer Street, London W1T 3JH, UK
Polymer ReviewsPublication details, including instructions for authors and subscription information:http://www.informaworld.com/smpp/title~content=t713597276
Model for the Viscosity of Particle DispersionsJozef Biceranoa; Jack F. Douglasb; Douglas A. Brunea
a Dow Chemical Company, M. E. Pruitt Research Center, Midland, MI, U.S.A. b Polymers Division,Polymer Blends and Processing Group, National Institute of Standards and Technology, Gaithersburg,MD, U.S.A.
Online publication date: 11 September 1999
To cite this Article Bicerano, Jozef , Douglas, Jack F. and Brune, Douglas A.(1999) 'Model for the Viscosity of ParticleDispersions', Polymer Reviews, 39: 4, 561 — 642To link to this Article: DOI: 10.1081/MC-100101428URL: http://dx.doi.org/10.1081/MC-100101428
Full terms and conditions of use: http://www.informaworld.com/terms-and-conditions-of-access.pdf
This article may be used for research, teaching and private study purposes. Any substantial orsystematic reproduction, re-distribution, re-selling, loan or sub-licensing, systematic supply ordistribution in any form to anyone is expressly forbidden.
The publisher does not give any warranty express or implied or make any representation that the contentswill be complete or accurate or up to date. The accuracy of any instructions, formulae and drug dosesshould be independently verified with primary sources. The publisher shall not be liable for any loss,actions, claims, proceedings, demand or costs or damages whatsoever or howsoever caused arising directlyor indirectly in connection with or arising out of the use of this material.

J.M.S.—REV. MACROMOL. CHEM. PHYS., C39(4), 561–642 (1999)
Model for the Viscosity ofParticle Dispersions
JOZEF BICERANO,1,* JACK F. DOUGLAS,2,* andDOUGLAS A. BRUNE1
1Dow Chemical CompanyM. E. Pruitt Research Center1702 BuildingMidland, MI 486742National Institute of Standards and TechnologyPolymers DivisionPolymer Blends and Processing GroupGaithersburg, MD 20899
1. INTRODUCTION................................................................................ 563
2. VISCOSITY OF POLYMER FLUIDS ............................................... 565
3. DISPERSION VISCOSITY AT LOW CONCENTRATIONS .......... 5673.1. Viscosity Virial Expansion ........................................................ 5673.2. Dilute Concentration Regime .................................................... 5683.3. Concentrated and Semidilute Dispersions ................................. 5683.4. Intrinsic Viscosity and Influence of Particle Shape on the
Viscosity of Dilute Particle Dispersions ................................... 5693.5. Huggins Coefficient as a Measure of Interparticle
Interaction................................................................................... 573
4. PERCOLATION MODELING OF DISPERSION VISCOSITY ATHIGH CONCENTRATIONS............................................................... 576
*To whom correspondence should be addressed.
561
Copyright 1999 by Marcel Dekker, Inc. www.dekker.com
Downloaded At: 12:45 19 January 2011

ORDER REPRINTS
562 BICERANO, DOUGLAS, AND BRUNE
4.1. Approximation for Viscosity in Semidilute andConcentrated Dispersions........................................................... 576
4.2. Analogy Between Electrical Conductivity and Viscosity andIts Theoretical Ramifications..................................................... 576
4.3. Observations Supporting the Percolation Model-ScalingExpression for Dispersion Viscosity ......................................... 578
4.4. Influence of Shear on the Viscosity PercolationThreshold Φ*.............................................................................. 580
5. GENERAL EXPRESSION FOR DISPERSION VISCOSITY .......... 581
6. Φ*, PERCOLATION, AND PARTICLE PACKING......................... 5856.1. Geometrical Versus Transport Property Percolation
Thresholds .................................................................................. 5856.2. Background Information on the Geometrical Percolation
Threshold pc ............................................................................... 5866.3. Shape Dependence of pc and Its Relation to [η] ...................... 587
7. VISCOSITY PERCOLATION THRESHOLD Φ* ANDDISPERSION GELATION ................................................................. 5907.1. Importance of Φ* for Dispersion Processing............................ 5907.2. Estimating Φm from pc Data and Experimental
Particle-Packing Data................................................................. 5907.3. Difficulties in Estimating Φm for Anisotropic Particles............ 5937.4. Dispersion Gelation for Φ > Φ* ................................................ 5957.5. Some Phenomenological Observations on the Effects of
Filler Polydispersity on Φm ........................................................ 5977.6. Phenomenological Estimate for Shear Rate and Temperature
Dependence of Φ* ..................................................................... 5987.7. Yield Stress of Dispersion Gels................................................. 6057.8. Effects of Particle Aggregation on Φ*...................................... 607
8. DISPERSIONS OF FLEXIBLE PARTICLES AND DROPLETS .... 6118.1. Dispersion Types........................................................................ 6118.2. Dilute Dispersions of Spherical and Deformable Droplets ...... 6138.3. Dilute Dispersions of Flexible Anisotropic Particles of
General Shape ............................................................................ 6168.4. Observations on Flexible Particle Dispersions.......................... 6188.5. An Idealized Model for Concentrated Dispersions of
Flexible Particles ........................................................................ 6208.6. Concentrated Dispersions of Liquids and Gases....................... 624
9. CLAY MINERAL DISPERSIONS IN POLYMERS......................... 6259.1. Introduction to Clay Minerals.................................................... 6259.2. Dispersion of Clay Minerals in Polymer Matrices ................... 625
Downloaded At: 12:45 19 January 2011

ORDER REPRINTS
VISCOSITY OF PARTICLE DISPERSIONS 563
9.3. Viscosity of Dispersions of Clay Platelets in PolymerMatrices ...................................................................................... 627
10. SUMMARY AND CONCLUSIONS .................................................. 630
11. REMAINING CHALLENGES............................................................ 632
APPENDIX: VARIATION OF PARTICLE RIGIDITY WITHPARTICLE PROPERTIES .................................................................. 632
NOTATION ......................................................................................... 633
REFERENCES..................................................................................... 635
1. INTRODUCTION
The difficulty in processing filled materials is often a limiting factor in ad-vanced materials development because of the large changes in fluid viscosityobserved in these materials. It is widely appreciated that the shear viscosity ηtends to rise rapidly with increasing filler aspect ratio Af and volume fraction Φ[1–4]. Moreover, the increase in η for fluids containing highly anisotropic fillerparticles can sometimes be much larger than the increase in stiffness (Young’smodulus) for these same filler particles dispersed at the same Φ in a solid poly-mer matrix [5, 6]. Such large viscosity increases cause important limitationsin the processing of filled polymers. (These limitations have been discussedspecifically in the case of polyurethane elastomers filled with cellulosic microfi-bers [5, 6].) It is also important for process modeling to account for the largeshear thinning effects found in anisotropic particle dispersions. These shear thin-ning effects have their origins in particle orientation, in the breakup of particleclusters under flow conditions, and in the non-Newtonian flow properties of theentangled polymer fluid matrix.
A predictive model of the viscosity of filled polymers is evidently a signifi-cant challenge for theory as well as for engineering practice. Such a model, withbroad potential applicability to dispersions of fillers of different shapes dis-persed in different types of fluids, is developed in the present work. Particularemphasis is given to dispersions of platelet-shaped particles because of theirwide availability in the form of clays and the commercial interest in dispersingsuch anisotropic particles in polymers.
The literature relevant to describing the viscosity of filled polymers is bothmultidisciplinary and vast in scope. It includes publications in mathematics (es-pecially percolation theory and fractals), geology (especially structures and in-terlayer energies of clays) and biology (especially the movement of microorgan-isms in various environments) and the more familiar types of resources in
Downloaded At: 12:45 19 January 2011

ORDER REPRINTS
564 BICERANO, DOUGLAS, AND BRUNE
physics, chemistry, rheology, and polymer science. Hundreds of empirical,semiempirical, and theoretical relationships have been developed for the η ofdispersions as a function of the volume fraction, particle shape, and, to a morelimited extent, shear rate γ. Although a historical survey of this literature is notattempted in the present paper, we review the literature that was helpful indeveloping our own model. We also indicate important reference works that wethink industrial scientists will find useful. The following publications treat keyaspects of dispersion viscosity. In an engineering-oriented review, Mewis andMacosko [1] discussed the rheological constitutive equations for dilute disper-sions of fibers and platelets. These authors also considered the influence ofparticle-particle interactions, which can stabilize a dispersion or lead to floccula-tion for predominantly repulsive or attractive interparticle forces, respectively.Metzner [2] reviewed the viscosity of particle dispersions in polymeric liquids.These fluid “matrices” can be non-Newtonian even in the absence of fillers, andthese dispersions can thus have complications not found in fluids more nearlyidentified as Newtonian. Russel [3] and Israelachvili [7] discussed the role ofinterparticle forces in dispersion viscosity. Brenner [4] provided convenient nu-merical tabulations of intrinsic viscosity data as a function of the shear rate foraxisymmetric particles having a range of shapes.
We show below that key information about dispersion shear viscosity can beobtained using simple modeling and the concepts of universality and scaling.The arguments for invoking universality and scaling ideas are based on a num-ber of mathematical and phenomenological observations. Our development of ageneral expression for η of particle dispersions is based on recent theory thatindicates a direct relationship between the electrical conductivity and the shearviscosity of dilute dispersions of particles having general shape [8]. More specif-ically, it was found that the intrinsic viscosity [η] divided by the trace of theaverage electric polarizability tensor is an invariant to a good approximation, sothat [η] is roughly proportional to the intrinsic conductivity [8]. (A generalrelation between conductivity and fluid viscosity was advocated long ago byLondon [9] in the context of a discussion of the viscosity of liquid helium.) Thisconnection between the conductivity and the viscosity of a dispersion is arguedto hold more generally, but in a modified form, at higher particle volume frac-tions. It is well known that, when the particles are either far more or far lessconductive than the dispersing matrix, percolation theory can be applied to de-scribe the conductivity of particle dispersions with “universal” scaling relationsin terms of the particle volume fraction relative to a critical “percolation” valueof Φ* and critical exponents. The argued correspondence between the viscosityand conductivity of dispersions predicts that viscosity data can be organizedsimilarly and understood in terms of the concepts of percolation theory. Wewill thus speak of the “viscosity percolation threshold” and invoke universality
Downloaded At: 12:45 19 January 2011

ORDER REPRINTS
VISCOSITY OF PARTICLE DISPERSIONS 565
concepts to justify applying these theoretical expressions for η to arbitrarilyshaped filler particle dispersions.
It must be admitted at the onset of our development that some difficultiesexist in invoking universality ideas from percolation theory to describe realmaterials. The problem revolves around the translation of results shown to holdin lattice percolation calculations to off-lattice applications. Some authors [10–12] have suggested that the critical exponents describing the conductivity of off-lattice materials are not strictly universal, while Heaney [13] has suggested that“crossover” effects can explain the exponent deviations that are sometimes ob-served experimentally. (These crossover effects are associated with data takennot sufficiently close to the critical percolation volume fraction of Φ*, at whichthe critical scaling of the conductivity with the volume fraction difference Φ −Φ* should actually be observed.) Despite this lack of perfect confidence inutilizing lattice percolation properties in modeling real materials, the observeddeviations of the conductivity exponent relevant to our discussion of viscositymodeling are commonly small [13]. Thus, we utilize results from lattice percola-tion theory and ignore these complications in our discussion below, which isdevoted to developing a good qualitative description of the viscosity of filledpolymer liquids.
A universal expression (with platelets, spheres, and fibers as very importantspecial cases) is obtained for η(dispersion) relative to the dispersing fluid. Thisreduced viscosity is a function of the reduced volume fraction (Φ/Φ*), whereΦ* is the viscosity percolation threshold. The maximum packing volume frac-tion Φm is then used as an approximation for Φ* and estimated by scaling argu-ments relating Φm to the geometrical percolation threshold pc. The model is alsoextended to treat the effects of shear, temperature, particle flexibility, and parti-cle aggregation in fractal clusters. The results of these model calculations areillustrated with several examples, including comparisons with experimental datafor clay-filled polymers.
2. VISCOSITY OF POLYMER FLUIDS
Theoretical expressions for η(dispersion) are usually expressed as a productof the dispersing fluid viscosity with a dimensionless function of the volumefraction Φ of the dispersed particles and of other relevant parameters, such asthe dimensionless shear rate and temperature. The description of polymer fluiddispersions is complicated by the strong dependence of η(dispersion) on flowconditions and material parameters. Since we are particularly interested in filledpolymer fluids, we summarize briefly some of the basic phenomenology for theviscosity of polymer fluids. This discussion is based on a general description ofη(polymer) as a function of material parameters given by Bicerano [14].
Downloaded At: 12:45 19 January 2011

ORDER REPRINTS
566 BICERANO, DOUGLAS, AND BRUNE
The zero-shear viscosity η0 of a pure polymer is a function of the absolutetemperature T and of the weight-average molecular weight Mw. 1 Its behavior isdescribed roughly in terms of three material parameters: the glass transitiontemperature Tg, the activation energy for viscous flow as defined in the high-Tand zero-shear limits Eη∞, and a critical molecular weight Mcr. The η0 of a purepolymer generally increases roughly linearly with (Mw/Mcr) for Mw ≤ Mcr androughly proportionally to (Mw/Mcr)
3,4 for Mw > Mcr. The η0 of a pure polymerdecreases rapidly with increasing (T/Tg), following a steep and nearly universalvariation as a function of (T/Tg) for 1.0 < (T/Tg) ≤ 1.2. Above this temperaturerange, it approaches as Arrhenius-like dependence, namely, η0 , exp(Eη∞ /RT).Although this Arrhenius-like behavior is only approached at very high T, thevalue of Eη∞ affects the slope and the curvature of ln(η0) versus 1/T above theregion of universal behavior by fixing the slope in the asymptotic high-tempera-ture regime.
Both η0(polymer) and η(polymer) can decrease by many orders of magnitudeas Mw decreases and/or as T increases. However, the lowering of many impor-tant performance characteristics in polymers of low molecular weight, alongwith limitations of practical fabrication equipment, do not allow the lowering ofη(polymer) to reduce η(dispersion) sufficiently for many processes.
The viscosities of polymer fluids can manifest significant dependencies onthe shear rate γ and the polydispersity [the Mw/Mn) ratio, where Mn denotes thenumber-average molecular weight], as well as having a small dependence onthe density of the polymer at the temperature of the melt. At low shear rates, ηis nearly independent of γ, and this plateau in the variation of η with γ is termedthe first Newtonian regime. As γ is increased further, however, a “shear-thin-ning” regime is reached, at which η can drop by several orders of magnituderelative to η0. Fabrication processes are typically performed either in the firstNewtonian regime or in the shear thinning regime. At exceedingly high γ values(achieved in laboratory-scale experiments, but thus far not in any practical poly-mer fabrication processes), a “second Newtonian regime” (η reaching a newplateau value, generally far below η0) may be reached unless the polymer de-grades first by shear-induced bond rupture. A large drop of η(polymer) obvi-ously can make a large contribution to the overall shear-thinning effect onη(dispersion).
In many dispersions, much of the total shear thinning originates from thebreakdown of transient particle clusters. It is unclear whether and how this im-portant source of shear thinning might couple to the entanglement phenomena
1According to ISO-31-8 [15], the term molecular weight has been replaced by thetechnically more correct term relative molecular mass. The older, more conventionalnotation for number-average and weight-average molecular weights is utilized in thisarticle.
Downloaded At: 12:45 19 January 2011

ORDER REPRINTS
VISCOSITY OF PARTICLE DISPERSIONS 567
of unfilled polymers. Furthermore, when polymer chains are confined betweenhighly anisotropic platelet-shaped fillers that are closer to each other than theaverage radius of gyration of a chain, the average conformational characteristics(including the Mcr) of the polymer may change relative to the “unperturbed”dimensions even in the zero-shear limit. The standard assumption that η(poly-mer) enters into all equations for η(dispersion) as a simple factor multiplyingan expression consisting of terms dependent only on particle characteristics im-plies the neglect of such potential perturbations of the polymeric matrix by theparticles. While this tremendous simplification is justified in the quest for apreliminary model aimed at reproducing the major trends observed in η(disper-sion), the future development of more refined models may require considerationof these complications.
For most commodity polymers, extensive amounts of experimental data areavailable for the dependence of η(polymer) on material parameters and differingflow conditions. If such a full “viscosity profile” [η(polymer) as a function ofall relevant parameters] has not been measured, it can be estimated very roughlyusing the phenomenological equations of Bicerano [14]. If at least some dataare available for η(polymer), the equations can be calibrated with these data toprovide more reliable predictions of η(polymer).
3. DISPERSION VISCOSITY AT LOW CONCENTRATIONS
3.1. Viscosity Virial Expansion
The viscosity of a dilute particle dispersion, η(dispersion), can be developedformally in a power series in the particle volume fraction Φ. Since this proce-dure is completely analogous to the development of a power series describingthe pressure of a gas, it is conventional to refer to such expansions as virialexpansions and to their coefficients as virial coefficients. Such power seriesmust be truncated at some finite order (as in Eq. 1) because the difficulty of thecalculation of the virial coefficients grows rapidly with increasing order.
η(relative) ≡η(dispersion)
η(dispersing fluid)< 1 + [η]Φ + kH?Φ 2 + . . . (1)
In the limit of infinitesimal particle volume fraction (Φ → 0), the term linearin Φ dominates so that the effect of the filler on the change in η is proportionalto [η]. As Φ increases, higher-order terms become important. [The expansionthen becomes generally less useful since the lower-order terms are no longersufficient to reproduce η(relative), and it is exceedingly difficult to developnonempirical models to estimate the coefficients of the higher-order terms.] Thefirst virial coefficient [η] is usually called the intrinsic viscosity in the rheology
Downloaded At: 12:45 19 January 2011

ORDER REPRINTS
568 BICERANO, DOUGLAS, AND BRUNE
literature, while the next virial coefficient kH is termed the Huggins coefficient.These quantities are dimensionless, given the dimensionless nature of the prop-erty ratio and the concentration units. The reader should be aware of the factthat virial expansions usually are expressed in the polymer solution literature(and occasionally also in the dispersion literature) in terms of powers of themass concentration (grams of dispersed phase per unit volume of solution) in-stead of powers of Φ, so that [η] and kH often have units of specific volume andspecific volume squared, respectively. Moreover, there are several conventionsfor these mass concentration units that have been introduced as a matter ofexperimental convenience or historical usage.
3.2. Dilute Concentration Regime
The dilute concentration regime is limited to Φ values for which the linearapproximation η(relative) < 1 + [η]Φ holds. This designation of the dilute re-gime range is appropriate because the calculation of this leading order virialexpansion does not depend on interparticle interactions. Even for spherical parti-cles, the “crossover volume fraction” Φx defining the boundary between thedilute regime and the semidilute regime is small (in the range 0.01 to 0.02 [16];see Sections 3.5 and 6.3). More generally, we can expect Φx to scale roughly inproportion to k/[η], where k is a proportionality constant with a value that de-pends on the units chosen for [η]. Thus, Φx decreases very rapidly for highlyanisotropic particles, namely, roughly in proportion to 1/A 2
f for rods (fibers) andto 1/Af for disks (platelets) (see Section 3.4), where Af is the aspect ratio. Thedilute regime is limited to very low volume fractions for highly anisotropicparticles.
3.3. Concentrated and Semidilute Dispersions
A dispersion of filler particles is defined as “concentrated” for Φ greater thanthe geometrical percolation threshold pc. The value of pc is determined by therandom placement of idealized particles that are allowed to overlap and definesthe volume fraction of space occupied by the overlapping particles when theyfirst span the region in which they are placed. (Monte Carlo simulations of pc
are discussed below.) This volume fraction is important because particles areexpected to form large contracting clusters at Φ < pc. Motions in such disper-sions are necessarily collective, but a dispersion continues to be “fluidlike” untilinterparticle interactions cause contacting particles to become “stuck” into arigid array. At a value of Φ that we will denote by Φ* (usually Φ* @ pc), thenecessity for collective motions becomes strong enough to cause a transitionfrom a highly viscous fluid to a true solid for which η → ∞. The semidiluteregime is defined to include the broad volume fraction range between Φx (at
Downloaded At: 12:45 19 January 2011

ORDER REPRINTS
VISCOSITY OF PARTICLE DISPERSIONS 569
which the interparticle interactions first become appreciable) and pc (at whichthey begin to predominate). In practice, however, it is difficult to perform equi-librium viscosity measurements for volume fractions Φ greater than a “glasstransition” volume fraction of about 0.53 to 0.57 for hard sphere dispersions.
In systems with strong attractive interactions between the particles, floccula-tion may occur (as discussed below in detail), and a large fraction of the parti-cles may associate into relatively diffuse aggregate structures so that the pc andthe Φ* of the aggregated particles can be reached at much lower volume frac-tions than those of the primary particles. Thus, the concentration regimes be-come dependent on interparticle interactions in these aggregating systems. Theeffective sizes of the particles can also be modified by long-range coulombicrepulsive interactions (see Section 9.2) and by the segregation of the polymerand the other components of a multicomponent fluid to the interfaces of thedispersed particles.
3.4. Intrinsic Viscosity and Influence of Particle Shape on theViscosity of Dilute Particle Dispersions
Douglas and Garboczi [8] derived an approximation relating the intrinsicviscosity [η] for dispersions of anisotropically shaped rigid particles and theleading concentration virial for the conductivity (intrinsic conductivity) of aninsulating medium with highly conducting inclusions. In testing this relation-ship, they tabulated data for the [η] of dilute dispersions of ellipsoidal particlesover a large Af range and discussed these data particularly for the special caseof ellipsoids of revolution to illustrate the magnitude of the shape dependenceof [η]. We briefly review the results of this analysis.
For a biaxially symmetric ellipsoid, Douglas and Garboczi [8] define the“aspect ratio” Af = (c/a) as a measure of particle asymmetry. Here, c is the lengthof the symmetry axis (major axis) of the ellipsoid, and a = b is the length of itstwo degenerate minor axes, so that Af > 1 for prolate ellopsoids (approximatingfibers), Af = 1 for spheres, and Af < 1 for oblate ellipsoids (approximating plate-lets). Exact results for [η] are listed in Table 1 and are shown graphically inFig. 1. Equation 2 gives a good fit to the data for 0.001 ≤ Af ≤ 1000 and is alsoshown in Fig. 1.
[η] < 1012 + 2904Af − 1855A 1.5f + 1604A 2
f + 80.44A 3f
1497Af + A 2f
(2)
It is emphasized that, while Eq. 2 interpolates [η] over the practically importantrange of 0.001 ≤ Af ≤ 1000, it should not be used to extrapolate too far outsidethis Af range since it does not give the correct asymptotic scaling behavior [η], A 2
f /ln(Af) as Af → ∞. Equation 2 is adequate for most practical applications,
Downloaded At: 12:45 19 January 2011

ORDER REPRINTS
570 BICERANO, DOUGLAS, AND BRUNE
TABLE 1
Exact Results for Isotropically Averaged [η] of Dilute Dispersionsand pc Calculated by Monte Carlo Simulations of Random
Dispersions [73] for Ellipsoids of Revolution [Ellipsoids withTwo Symmetrically Equivalent Axes (a = b)]
Af [η] pc Af [η] pc
0.0005 — 0.000637 1.5 — 0.27950.001 — 0.001275 2 2.908 0.26180.003333 204.9 — 3 3.685 0.22440.01 69.10 0.01248 4 4.663 0.19010.02 35.16 — 5 5.806 0.16270.04 18.19 — 6 7.099 —0.05 14.80 — 7 8.533 —0.055556 13.45 — 8 10.10 —0.0625 12.10 — 9 11.80 —0.071429 10.74 — 10 13.63 0.087030.083333 9.391 — 12 17.67 —0.1 8.043 0.1058 14 22.19 —0.111111 7.371 — 16 27.18 —0.125 6.700 0.1262 18 32.63 —0.142857 6.032 — 20 38.53 0.041500.166667 5.367 — 25 55.19 —0.2 4.708 0.1757 30 — 0.026460.25 4.059 0.2003 50 176.8 0.015020.333333 3.431 0.2289 100 593.7 0.0069490.5 2.854 0.2629 200 — 0.0031950.75 — 0.2831 300 4279 0.0020521 2.500 0.2854 500 — 0.001205
Af = (c/a), where c is the length of the third ellipsoidal axis. Af < 1 foroblate ellipsoids, which approximates platelets at large 1/Af. Af = 1 forspherical particles. Af > 1 for prolate ellipsoids, which approximates fibersat large Af.
however, since filler particles with asymmetries outside the specified range areuncommon.
For particles under steady shear, one must consider [η] as a tensor ratherthan as a scalar quantity because of the tendency of anisotropic particles toorient under shear. The results shown in Fig. 1 for [η] represent the dependenceof the shear viscosity on the particle shape in the limit of an infinitely dilutedispersion at low γ at which the so-called rotary Peclet number Pe is small (not
Downloaded At: 12:45 19 January 2011

ORDER REPRINTS
VISCOSITY OF PARTICLE DISPERSIONS 571
FIG. 1. Isotropically averaged [η] of dilute dispersions of ellipsoids of revolution.The aspect ratio is defined as Af = (c/a), where c is the length of the ellipsoid along itsaxis of symmetry and a = b is the length of the ellipsoid in the normal direction. Af > 1corresponds to prolate ellipsoids (top right, approximating fibers at large Af), Af = 1 tospherical particles (top middle), and Af < 1 to oblate ellipsoids (top left, approximatingplatelets at large 1/Af). In the bottom figure, squares indicate exact results [8], and thecurve represents a fit to the squares (Eq. 2).
larger than 1). Pe is a dimensionless shear rate defined as the ratio of the time-scales for rotary Brownian motion and convective motion:
Pe = γDr
= 6V?η(dispersing fluid)?F?γkBT
(3)
Downloaded At: 12:45 19 January 2011

ORDER REPRINTS
572 BICERANO, DOUGLAS, AND BRUNE
Here, Dr is the rotational diffusion coefficient, kB is Boltzmann’s constant, T isthe absolute temperature, V is the particle volume, and F is a particle shapefactor (a function of Af for biaxially symmetric particles [4]). Dr is importantbecause the particle orientation at low Φ is determined by the balance betweenhydrodynamic forces and rotary Brownian motion. At low Pe, rotary Brownianmotion randomizes the particle orientations so that Eq. 2 provides a good de-scription of [η]. At high Pe, hydrodynamic forces become strong enough toalign the particles in the flow direction, reducing their contribution to η(disper-sion) in dilute dispersions. This shear thinning effect on [η] vanishes for spheri-cal particles and increases with particle shape asymmetry. As γ → ∞, an aniso-tropic particle becomes fully aligned with the flow field so that [η] levels off toa limiting value of [η]∞. The dependence of [η] on γ for axisymmetric particlessuch as needles and disks can be estimated using an established formalism de-veloped by Brenner [4]. These useful results are also discussed in an accessiblereview article by Mewis and Macosko [1].
Figure 2 illustrates [η(γ)] for biaxially symmetric particles in terms of itsdependence on the dimensionless shear rate Pe. It is seen that the variation of[η(γ)] with shear is smooth and gradual, and that it becomes larger with increas-ing particle asymmetry.
The exact results for [η(γ)] are rather cumbersome because the results aregiven for selected values of Af in the form of a numerical tabulation. We ob-
FIG. 2. Effect of shear on intrinsic viscosity [η] of ellipsoids of revolution as afunction of the rotary Peclet number (Pe). See the legend of Fig. 1 for the definition ofAf. As Pe → ∞, [η] decreases slowly to [η]∞ in each case. Curves are labeled by Af
values.
Downloaded At: 12:45 19 January 2011

ORDER REPRINTS
VISCOSITY OF PARTICLE DISPERSIONS 573
serve, however, that (1) [η(γ)] is invariant to the shear direction and is thusalways an even function of γ, and (2) [η(γ)] approaches constant values as γ →0 and as γ → ∞. A useful “Pade approximant” for [η(γ)], constructed to beconsistent with these mathematical properties, is given in Section 7.6. Our ana-lytic approximation for [η(γ)] is extended in Section 7.6 to other properties thatshare the analytic properties of [η(γ)] but cannot currently be calculated exactly.
It is tempting to describe shear thinning by scaling relations based on thedependence of [η] on Pe, but this dependence will often not extrapolate well tohigher Φ for three reasons:
1. Interparticle collisions may reduce the particle alignment, and thus re-duce the amount of shear thinning, in the semidilute regime.
2. Geometrical packing constraints tend to impose some alignment on theparticles even in the absence of shear at high Φ values, enhancing the totalparticle alignment effect in the concentrated regime (see Section 9.2).
3. Attempts to extrapolate from the shear thinning behavior of [η] to shearthinning at higher values of Φ must necessarily be restricted to highlyanisotropic particles (fibers of aspect ratio Af and platelets of aspect ratio1/Af, where Af ≥ 10) because they neglect some types of much smallershear-induced ordering effects observed even for spherical particles.
3.5. Huggins Coefficient as a Measure ofInterparticle Interaction
While many reliable experimental data and theoretical derivations are avail-able for [η] as a function of the particle shape, such information is relativelyscarce for the Huggins coefficient kH. This situation is unfortunate since kH con-tains important information about particle shape and interparticle interactions.We begin our discussion by considering spherical particle dispersions for whichthe understanding of the behavior of kH is most advanced.
Many attempts have been made to calculate kH for noninteracting hardspheres. Calculations not taking Brownian motion into account [17–19] underes-timate kH, while the first calculations accounting for Brownian motion [20, 21]overestimated it. Batchelor [22] incorporated both effects by including bothopen particle trajectories arising from straining motions and closed trajectoriesarising from simple shear flow and allowing for translational Brownian motion.He found kH < 6.2 (with 5.2 from hydrodynamic effects and 1.0 from Brownianmotion). Others [23, 24] recently published the revised estimate kH = 5.9147(with 5.0022 coming from hydrodynamic effects and 0.9125 from Brownianmotion).
Furthermore, kH is also very sensitive to the strength and nature of interparti-cle interactions. For hard spheres with a short range attractive interaction (some-
Downloaded At: 12:45 19 January 2011

ORDER REPRINTS
574 BICERANO, DOUGLAS, AND BRUNE
times called “sticky hard spheres”) it has been proposed [25] that kH = (21.4 −12.2Ψ). Here, Ψ is the dimensionless second osmotic virial coefficient. Ψ = 1in the limit of a vanishing attractive interparticle contact interaction (i.e., in agood solvent), and Ψ = 0 at the “theta point” at which attractive interparticleinteractions balance the hard core repulsions of the spheres (i.e., a poor solvent).(The results given in Ref. 25 have been converted into a dimensionless formconsistent with the conventions of the present paper.) The sticky sphere valueof kH more than triples, from 6.2 for repulsive spherical particles to 21.4 formildly attractive particles at the theta point, indicating a substantial dependenceof kH on interparticle interactions. The effects of including the kHΦ 2 term in Eq.1 are shown in Fig. 3 for hard spheres. The concentration at which these curvesseparate defines the volume fraction Φx. We observe that Φx is insensitive to theinterparticle interaction, provided that the interparticle interaction is predomi-nantly repulsive.
The trends described above for dilute and semidilute hard-sphere dispersionsare rather general. Similar trends are found for flexible polymer chains in solu-
FIG. 3. Effects of the term proportional to Φ2 in Eq. 1 for the viscosity of disper-sions of spherical particles. “Relative viscosity” denotes η(dispersion)/η(polymer). Thelowest (thin) curve only considers the first-order term in the virial expansion (Einsteinlimit). The middle (thick) curve includes the second-order term in the limit of vanishingcontact interaction (good solvent). The uppermost (very thick) curve includes the effectof the second-order term at the theta point (poor solvent). The dilute regime extends upto the onset of the semidilute regime at Φx < 0.02.
Downloaded At: 12:45 19 January 2011

ORDER REPRINTS
VISCOSITY OF PARTICLE DISPERSIONS 575
tion (obviously a very different type of system than hard spheres), for which kH
increases monotonically with decreasing solvent quality. The decrease for flexi-ble polymers is by more than a factor of two; specifically, kH changes from avalue near 0.3[η]2 in a good solvent to a value near 0.7[η]2 under theta condi-tions [26]. The generality of the solvent quality dependence of kH suggests somedegree of regularity in the interaction dependence of this type of property.
The virial coefficients of other transport properties also depend strongly onthe thermodynamic interparticle interaction. For example, the leading virial co-efficient kD for the collective diffusion coefficient Dc of a particle dispersioneven changes sign with changing solvent quality, that is, kD(spheres) < 4 Ψ −2.5, and a similar variation is again found for kD of polymer solutions [27, 28].Evidently, kD and kH can acquire a significant temperature dependence, espe-cially in mixed solvents near their critical point for phase separation. This sensi-tivity offers a good way of estimating the basic interparticle thermodynamicinteraction parameter Ψ. This parameter can also be estimated by light- or neu-tron-scattering measurements under favorable circumstances.
Very little work has been done to develop theoretical estimates of kH fornonspherical particles. Berry and Russel [29] indicate that kH , 0.5[η]2(1 −0.0142Pe 2 + . . . ) for slender cylindrical fibers. On the other hand, Shaqfeh andFredrickson [30] found an alternative result as Af → ∞ for cylindrical fibers;namely, kH , A 4
f/[ln(Af)]3 , [η]2/ln(Af). Extension of these results to anisotropic
particles and particles with attractive interactions is a serious theoretical chal-lenge. More work is needed on this important problem.
Very little work has been done to develop theoretical estimates for thehigher-order coefficients of the virial expansion of η(relative) for particles ofarbitrary shape because of the extreme computational difficulty of this task. Ina valiant attempt based on multiple scattering theory (taking only hydrodynamiceffects into account), Thomas and Muthukumar [19] estimated a value of 6.4028for the third virial coefficient (which multiplies Φ 3) of η for hard spheres.
It is clear from the discussion above that the rigorous treatment of the viscos-ity of particle dispersions is limited to low-order virial expansions, and that eventhose virial expansion results are generally unavailable for interacting nonspheri-cal particles. Even if we had this kind of information to a few orders in perturba-tion theory, the concentration range in which these results can be applied be-comes increasingly small with increasing particle anisotropy. We clearly needsome nonperturbative framework for treating the high-concentration regime,which can be combined with the perturbative virial expansion to treat the viscos-ity of particle dispersions over a wide concentration range. In the next section,we develop an analogy between the electrical conductivity and the viscosity ofparticle dispersions that allows us to utilize ideas from percolation theory todevelop an expression for η(dispersion) for general Φ and particle shape.
Downloaded At: 12:45 19 January 2011

ORDER REPRINTS
576 BICERANO, DOUGLAS, AND BRUNE
4. PERCOLATION MODELING OF DISPERSION VISCOSITY ATHIGH CONCENTRATIONS
4.1. Approximation for Viscosity in Semidilute andConcentrated Dispersions
A good approximation can be obtained for η in the semidilute and concen-trated regimes (Φx ≤ Φ ≤ Φ*) in terms of (1) the viscosity of the pure dispersingfluid, (2) the Af and Φ of the dispersed particles, and (3) a particle-shape-depen-dent critical volume fraction Φ*. The formal extension of the relationship foundby Douglas and Garboczi [8] between the viscosity of dispersions of rigid parti-cles and the conductivity of dispersions of highly conducting particles leads oneto expect (see the discussion in Section 4.2) the following asymptotic relation-ship for high-volume fractions (Φ → Φ*):
η(relative) < K?S 1 − ΦΦ* D−2
(4)
In Eq. 4, Φ* < Φm < 0.64 for monodisperse spheres [1, 31], Φ* decreasesrapidly with increasing particle anisotropy (discussed below), and K is a propor-tionality constant on the order of 1, with a value that will be fixed below. SeeFig. 4 for a depiction of Eq. 4 over the entire reduced volume fraction range,0 ≤ (Φ/Φ*) ≤ 1, where K is fixed by the approximation K = 1 in the presentdiscussion.
4.2. Analogy Between Electrical Conductivity and Viscosityand Its Theoretical Ramifications
The analogy between the hydrodynamics and electrostatics of dilute disper-sions [8] can be generalized to finite volume fractions by relying on a phenome-nological observation. At intermediate volume fractions Φ > Φx, it is observedthat the velocity field of pipe flow characteristically becomes flattened so thata more nearly sliplike boundary condition is obtained for dispersion flow [32,33]. In the electrostatic problem, this boundary condition would correspond tothe problem of insulating particles in a conducting medium. The critical expo-nent for the particle “fluidity” (1/η), conductivity in the resulting hydrody-namics-electrostatics analogy at nonvanishing volume fractions, then has theapproximate values of 2 and 4/3 in three and two dimensions, respectively. Themean-field value of this “insulator exponent” is 3, so that crossover effectsassociated with Φ not being sufficiently close to Φ* might give rise to an effec-tive exponent closer to 3 in Eq. 4 in fits to experimental data restricted tointermediate volume fractions [13].
Downloaded At: 12:45 19 January 2011

ORDER REPRINTS
VISCOSITY OF PARTICLE DISPERSIONS 577
FIG. 4. Dispersion viscosity “master curves.” The “asymptotic form” (Eq. 4) origi-nally developed for the concentrated regime and the “universal form” (Eq. 5) for the fullvolume fraction range are seen to be almost indistinguishable for most practical purposes.“Relative viscosity” denotes η(dispersion)/η(polymer). “Relative volume fraction” de-notes Φ/Φ*.
Previously, de Gennes [34] made arguments for a hydrodynamic-electrostaticanalogy to describe the concentration dependence of dispersion viscosity. Heindicated that the percolation exponent for conducting particles in an insulatingmedium described the fluidity of dispersions, but his predictions were laterfound to be inconsistent with dispersion viscosity measurements [35]. Experi-ments on quasi-two-dimensional dispersions obtained by suspending smallspherical particles in a thin layer of oil spread on a water surface give an expo-nent near 4/3 [36], close to the two-dimensional insulating particle percolationexponent for conductivity. This finding is consistent with the prediction for twodimensions mentioned above. A correspondence between [η] for rigid particlesand the conductivity virial coefficient for conductive particles is reasonable atlow Φ values, however, and the explicit calculations of Douglas and Garboczi[8] confirm this relation.
It is emphasized that the extension of this analogy between the viscosity andthe electrical conductivity of concentrated particle dispersions is based on aphenomenological observation (velocity field flattening in concentrated disper-sions) that lacks a theoretical explanation. Our extension of the hydrodynamics-electrostatics analogy is thus phenomenological. Further theoretical work is
Downloaded At: 12:45 19 January 2011

ORDER REPRINTS
578 BICERANO, DOUGLAS, AND BRUNE
needed to justify this approximation, but at present we are satisfied that thisapproximation is physically sensible and is in accordance with observations onthese complex fluids.
4.3. Observations Supporting the Percolation Model-ScalingExpression for Dispersion Viscosity
Equation 4 has been invoked for many years as an empirical description ofthe η of diverse types of dispersions, such as of irregular coal particles andanisotropic particles in polymer fluids, and even of flocculated particle disper-sions. Some examples found in the literature are cited below.
Russel and Sperry [37] found that Eq. 4 can be applied to hard sphere disper-sions of fractal aggregates if the reducing volume fraction variable Φ* is modi-fied appropriately. They assumed that Φ* of the aggregated particles shouldequal Φ* < Φmp?N
1 − (3/ d ) where d is the fractal dimension of the aggregates, N isthe average number of particles per aggregate, and Φmp is the “packing volumefraction” Φm of the primary (nonaggregated) particles composing the aggregate.The scaling expression for Φ*(aggregate) utilized by Russel and Sperry is wellknown in polymer science literature, in which the power law scaling representsthe average inverse segmental density of the fractal aggregates. For specificity,we note that the fractal dimension d equals 2 for flexible polymer chains andslender platelet filler particles, so that we have the nontrivial scaling Φ* , N−1/2.Identical dimensional analysis arguments also apply to the intrinsic viscosity [η]of particle aggregates, which scales inversely to the average segmental densityof the aggregate, so that we have the approximate scaling relation Φ* , 1/[η].Evidence supporting this scaling relation is discussed in Section 7.2. Thesetrends are also in general agreement with a wide range of observations on theinternal structures and dimensions of fractals [38].
It is emphasized that the use of Eq. 4 and the scaling expression of Russeland Sperry for Φ* has some limitations. The expression is restricted to relatively“strong” aggregates that do not disintegrate at low shear rates. It is also evidentthat this modeling cannot apply if the aggregates form percolating structureswith a scale comparable to the dimensions of the measuring instrument. If Eq.4 is still to apply even approximately, then Φ* must saturate for some suffi-ciently large N value. In our modeling of aggregation effects on η in Section7.8, we argue that Φ* saturates to the value pc, Φ* → pc, and we denote thecharacteristic number of particles within the aggregate at which this crossoveroccurs as Nx.
These scaling arguments for Φ* have ramifications for the concept of “oc-cluded volume” in aggregating dispersions. It is not really the volume of fluidwithin the aggregate that is important in influencing the viscosity of the disper-sion; it is rather the effectiveness of the aggregate to screen its interior from the
Downloaded At: 12:45 19 January 2011

ORDER REPRINTS
VISCOSITY OF PARTICLE DISPERSIONS 579
flow field that determines [η] and thus Φ*. The occluded volume effect is under-stood more properly in terms of the screening of hydrodynamic interactions bythe aggregate structure.
Wildemuth and Williams [39] showed that Eq. 4 agrees well with data for aremarkable range of materials (irregular-shape coal particles, latex spheres, andaluminum particles). The data covered over two orders of magnitude of variationin solvent viscosity and in particle size and five orders of magnitude in the shearrate γ variation. They observed that the increase of Φ* is a direct function ofthe shear stress τ ≡ η γ rather than the shear rate γ and represents the effects ofτ on Φ* in terms of a simple model with two adjustable parameters, developedby considering the effects of τ on the relative rates of microstructural breakupand reformation. They also developed a simple model [39] for the yield stressτy [40] of concentrated dispersions, which we generalize in Section 7.7 basedon our dispersion viscosity model.
Kataoka et al. showed that Eq. 4 represents well the dependence of η on Φfor dispersions in polymeric fluids of spherical particles [41], calcium carbonateand talc particles of unspecified Af [42], and carbon and glass fibers of Af up to28 [42, 43]. Pal and Rhodes [44] showed that the η of emulsions containingdispersed phase volume fractions of less than 0.74 also obeys the concentrationscaling relation for the reduced η of hard spheres with appropriate adjustmentof Φ*. De Kruif et al. [45, 46] provided data of high quality for η(dispersion)for model spherical particle dispersions, obtained by both Couette and parallelplate rheometry, for both low and high shear rates. This work is considered inconnection with our modeling in the next section. Van Blaaderen et al. [47]used some of these data [46] to show an inverse relationship between η(disper-sion) and the long-time self-diffusion coefficient (measured by fluorescence re-covery after photobleaching) of dispersed spherical colloidal particles.
Finally, Chong, Christiansen, and Baer [48] collected experimental data fordispersions of spherical particles from many different literature sources and alsoobtained their own data with an orifice viscometer. They plotted all of thesedata (which included the effects of the polydispersity of the particle sizes) on asingle graph (Fig. 11 of their paper). They then fitted these data with their ownempirical expression for η(relative) as a function of (Φ/Φ*). Their expressiondiffered from Eq. 4, but inspection of Fig. 11 from their paper shows that thedata can be described just as well by Eq. 4, especially in the concentrated regimein which Eq. 4 is appropriate.
Brady [49] considered both hydrodynamic and Brownian contributions to themacroscopic stress of a dispersion of Brownian hard spheres to develop a simplemodel by which Eq. 4 with Φ* corresponding to random close packing is ob-tained at high concentrations.
The combined consideration of all of these results shows the broad applica-bility of Eq. 4 or an equation closely approximating it. This equation appears to
Downloaded At: 12:45 19 January 2011

ORDER REPRINTS
580 BICERANO, DOUGLAS, AND BRUNE
have been introduced first as a phenomenological expression by Maron andPierce [50], so engineers sometimes refer to it as the “Macron-Pierce equation.”
A rough inverse relationship is usually found between the Φ* and the Af ofdispersed particles [2, 23, 24, 43]. It is commonly assumed that the dependenceof Φ* on the particle shape is similar to the dependence of Φm [51]. Within thehydrodynamic-electrostatic analogy discussed above, the characteristic volumefraction at which η(dispersion) approaches infinity is identified as a “viscositypercolation threshold.” For a given particle shape, Φm is apparently smallest ifall particles are of equal size. It increases with increasing polydispersity sincethe smaller particles can often fit in the gaps between the larger particles, ap-proaching 1 for a very broad particle size distribution. For dispersions of plate-let-shaped particles obtained by exfoliating clays, as well as other types of lay-ered materials, the degree of exfoliation of the platelets should also have a majorimpact on the value of Φ*. Clumps of platelets (which occur naturally in clays)should have a Φ* value comparable to compact particles, while Φ* for dispersedparticles must be small for extended platelets. Attractive interparticle interac-tions can also influence Φ* if these interactions are strong enough to causeparticle aggregation [3]. These effects are discussed below.
4.4. Influence of Shear on theViscosity Percolation Threshold F*
Shear can also induce particle ordering, so that Φ* can increase with shear[39]. For example, for monodisperse hard spheres, the critical volume fractionΦ* < 0.63 for the approach of the viscosity to infinity as γ → 0 is near therandom close packing value of 0.64. However, it increases to Φ* < 0.71 at highshear rates (γ → ∞), near the maximum close packing value of 0.7405 for aface-centered cubic lattice [45, 46]. This result suggests some degree of shear-induced ordering of the spheres under flow. Notably, Eq. 4 provides a gooddescription of the viscosity under steady shear, provided that the volume fractionis not too high (see the discussion at the end of this section).
Ackerson [52] performed an instructive study of shear-induced ordering. Heprepared nearly hard poly(methyl methacrylate) spheres that were sterically sta-bilized against aggregation by surface modification, dispersed them in a mixtureof tetralin and decalin, and used light scattering to observe the interparticleordering (microstructure) under steady and oscillatory shear flows. He observedfour basic types of structures: (1) liquidlike (amorphous), (2) stringlike (disor-dered layers in which regular spacing of particles persists along the velocitydirection), (3) sliding or randomly stacked layers, and (4) face-centered cubic(layers stacked in a specific close-packed pattern). The microstructure dependedon Φ, as well as on γ, under steady shear and on the amplitude and the frequencyof the shear flow under oscillatory shear. In fact, it could be represented in the
Downloaded At: 12:45 19 January 2011

ORDER REPRINTS
VISCOSITY OF PARTICLE DISPERSIONS 581
form of microstructural phase diagrams as a function of Φ and γ under steadyshear and as a function of Φ and the shear amplitude under oscillatory shear,both for spherical particle dispersions [45, 46] and for a variety of other particleshapes [39].
As a final point about the influence of γ on η(dispersion), we note that, forvery high shear rates, we can expect interparticle collision processes to have anincreasingly disruptive effect on particle ordering, which would lead to a de-crease of Φ*. Shear dilatancy and shear thickening would be symptomatic ofthis regime. Woodcock [53] has proposed an explanation of shear thickening indispersions based on this concept of “shear-induced disordering.” This effecthas important implications for the processing of dispersions of anisotropic parti-cles and deserves further study.
5. GENERAL EXPRESSION FOR DISPERSION VISCOSITY
A crossover formula applicable in the dilute, semidilute, and concentratedregimes (0 ≤ Φ ≤ Φ*), Eq. 5, is next proposed for hard spheres; it is based onthe hydrodynamics-conductivity analogy discussed above and the exact virialexpansion (Eq. 1). The coefficients of (Φ/Φ*) and (Φ/Φ*)2 inside the squarebrackets are fixed by the requirement that Eq. 5 should reduce to Eq. 1 in thedilute regime (Φ → 0), with [η] = 2.5, kH = 6.2 [22] and Φ* < Φm < 0.64. Italso reduces to the asymptotic scaling indicated by the percolation model (withthe prefactor modified to K = 0.94) in the concentrated regime (Φ < Φ*). Fi-nally, it can also be extended to dispersions of interacting particles by replacingthe coefficient of 0.34 with a more general expression that takes into accountthe dependence of the Huggins coefficient kH (Section 3.5) on the dimensionlesssecond-order osmotic coefficient Ψ.
η(relative) < S 1 − ΦΦ* D−2
?F 1 − 0.4?S ΦΦ* D + 0.34?S Φ
Φ* D2G (5)
This type of approximant, involving a power law leading term with correctionsto the leading power law scaling, is accurate in many applications (e.g., thepressure dependence of the volume of hard sphere fluids [54]). Universalityarguments, as well as the experimental evidence summarized above for the va-lidity of the simpler Eq. 4 [which gives similar predictions for η(relative)] inrepresenting experimental data for dispersions of particles having a wide varietyof shapes, lead us to expect that Eq. 5 (with the appropriate value of Φ* insertedto account for particle anisotropy, shear-induced ordering, and any aggregationeffects) should be a good approximation for nonspherical particles as well.
Downloaded At: 12:45 19 January 2011

ORDER REPRINTS
582 BICERANO, DOUGLAS, AND BRUNE
In the discussion below, we try to show that Eq. 5 provides a predictivemodel of broad applicability, satisfying a number of essential characteristics forsuch a model:
1. It reproduces well the observed trends for η(relative) as a function of theparticle shape (for all particle shapes), volume fraction (over the entirerange of 0 ≤ Φ ≤ 1), and flow conditions.
2. It goes to the correct asymptotic limits, with η(relative) reducing to thevirial expansion (Eq. 1) as Φ → 0 and to an expression (in our prefer-ence, Eq. 4) that predicts η(relative) → ∞ at some value of Φ (i.e., Φ*)at which the dispersion loses its “fluidity.”
3. It only uses physically meaningful parameters that can be measured and/or predicted as a function of the properties of the dispersing fluid or thedispersed material, the dispersion microstructure, and the flow condi-tions.
Anticipating our further discussion showing the generality of Eq. 5, Table 2 listsη(relative) calculated as a function of (Φ/Φ*). Figure 4 shows that Eqs. 4 and5 depend similarly on (Φ/Φ*) over the volume fraction range 0 < Φ < Φ*.
It was discussed above that Eq. 4 has been validated experimentally againstdata [37, 39–48] involving dispersions of fillers with a great diversity of particleshapes, sizes, and size distributions (including fractal aggregates) and obtainedat many different shear rates. The fact that Eq. 5 also reduces to the correctlimiting form (Eq. 1) in the dilute solution limit is an obvious improvement.Some of the best available experimental data, obtained by de Kruif et al. [45],are plotted in a normalized form in Fig. 5 and compared with Eq. 5. The datawere normalized by dividing Φ by the Φ* values (0.63 for γ → 0 and 0.71 forγ → ∞) suggested by de Kruif et al. [45] to obtain η(relative) as a function of(Φ/Φ*) for each data series.
The effects of fractal aggregation, as incorporated into Eq. 5, are illustratedin Fig. 6, which shows the results of calculations at several N and d values.These results were obtained using Russel and Sperry’s estimate for Φ* [37], Φ*= Φmp?N
1−(3/ d ), where Φmp is the maximum packing fraction Φm of the particlesin the absence of aggregation. The limitations of this approximation are dis-cussed in Section 7.8. It is seen that the effect of fractal aggregate size on Φ*is highly nonlinear. Incorporation of even the very small fractal clusters of N =5 results in a substantial increase of η(relative). As N is increased further, therate of increase of η(relative) with N slows gradually. The effect of reducingthe “fractal dimension” d (more “open” aggregates) is even more drastic.
Next, we make some preliminary comments about the physical meaning ofthe maximum packing fraction Φm and its relation to Φ*. As discussed above, adispersion is necessarily considered to be concentrated for Φ > pc, where pc isthe geometrical percolation threshold, since an “infinite cluster” of dispersed
Downloaded At: 12:45 19 January 2011

ORDER REPRINTS
VISCOSITY OF PARTICLE DISPERSIONS 583
TABLE 2
Relative Viscosity η(dispersion)/η(polymer) as a Function ofRelative Volume Fraction Φ/Φ* Calculated Using Equation 5
Relative Relative Relative RelativeΦ/Φ* viscosity Φ/Φ* viscosity Φ/Φ* viscosity Φ/Φ* viscosity
0.01 1.016258 0.26 1.678203 0.51 3.683607 0.76 15.492780.02 1.033045 0.27 1.720372 0.52 3.836528 0.77 16.891980.03 1.050384 0.28 1.764383 0.53 3.999574 0.78 18.488760.04 1.068299 0.29 1.810343 0.54 4.173648 0.79 20.321860.05 1.086814 0.30 1.858367 0.55 4.359753 0.80 22.440000.06 1.105957 0.31 1.908578 0.56 4.559008 0.81 24.905100.07 1.125756 0.32 1.961107 0.57 4.772666 0.82 27.796790.08 1.146238 0.33 2.016097 0.58 5.002132 0.83 31.218890.09 1.167436 0.34 2.073701 0.59 5.248983 0.84 35.308750.10 1.189383 0.35 2.134083 0.60 5.515000 0.85 40.251110.11 1.212112 0.36 2.197422 0.61 5.802196 0.86 46.299180.12 1.235661 0.37 2.263910 0.62 6.112853 0.87 53.807460.13 1.260069 0.38 2.333757 0.63 6.449569 0.88 63.284440.14 1.285376 0.39 2.407186 0.64 6.815309 0.89 75.480500.15 1.311626 0.40 2.484444 0.65 7.213469 0.90 91.540000.16 1.338866 0.41 2.565797 0.66 7.647958 0.91 113.27830.17 1.367145 0.42 2.651534 0.67 8.123287 0.92 143.71500.18 1.396514 0.43 2.741970 0.68 8.644688 0.93 188.17670.19 1.427029 0.44 2.837449 0.69 9.218252 0.94 256.78440.20 1.458750 0.45 2.938347 0.70 9.851111 0.95 370.74000.21 1.491739 0.46 3.045075 0.71 10.55165 0.96 580.84000.22 1.526062 0.47 3.158085 0.72 11.32980 0.97 1035.4510.23 1.561791 0.48 3.277870 0.73 12.19734 0.98 2336.3400.24 1.599003 0.49 3.404975 0.74 13.16840 0.99 9372.3400.25 1.637778 0.50 3.540000 0.75 14.26000 1.00 ∞
Tables and graphs of η(dispersion) as a function of Φ can be generated for a specific dispersionfrom this master table by multiplying Φ/Φ* with the value of Φ* and the relative viscosity withthe value of η(polymer) appropriate for that dispersion.
particles can be expected to span the fluid at a comparable volume fraction. Thefraction of dispersed particles belonging to these particle clusters increases withΦ. At Φ = Φm, the particle mobility has been reduced to such an extent that thedispersion behaves “solid-like,” and η(relative) → ∞. Apparently, this is a kindof rigidity percolation threshold [55]. As Φ is increased further (i.e., as solventmolecules are removed, for example, by evaporation during solvent casting of
Downloaded At: 12:45 19 January 2011

ORDER REPRINTS
584 BICERANO, DOUGLAS, AND BRUNE
FIG. 5. Comparison of the behavior predicted from the universal form (Eq. 5) de-veloped in this manuscript with the data tabulated by de Kruif et al. [45] for the viscosityof dispersions of sterically stabilized hard silica spheres in cyclohexane. There are noadjustable parameters in Eq. 5. “Relative viscosity” denotes η(dispersion)/η(cyclohex-ane). “Relative volume fraction” denotes Φ/Φ*. “Couette” and “parallel” refer to mea-surements with a Couette rheometer and with a parallel plate rheometer, respectively.“Zero” and “infinite” refer to the limits of γ → 0 and γ → ∞, respectively.
fabricated articles), Φ > Φm, and the dispersion becomes an increasingly rigidsolid with a nonvanishing shear modulus G. Ultimately, if all remaining solventis removed, the limit of Φ → 1 can be approached if the particles are polydis-perse in size [56, 57], anisotropic in shape (see below), or deformable [58].
Particle flexibility effects on η(dispersion) can also be important for highlyanisotropic particles, such as thin platelets and slender fibers, which are subjectto large bending moments. The “flexural rigidity” of such a particle is less thanthat of more isotropic particles even when the particle is intrinsically very stiff(i.e., has a very high modulus). At the other extreme, we can have dispersionsfor which the dispersed phase is a fluid and the particle flexibility exerts anevident influence on the dispersion viscosity. These issues are addressed in sec-tions below because of their importance to clay particle dispersions. It is shownthat η(dispersion) can still be considered within the framework of Eq. 5 if theflexible dispersed particles retain their structural integrity (do not undergo liq-
Downloaded At: 12:45 19 January 2011

ORDER REPRINTS
VISCOSITY OF PARTICLE DISPERSIONS 585
FIG. 6. Effects of fractal aggregation on Φ* according to Eq. 5 combined with thescaling relationship Φ* < Φmaa?N
1−(3/d), which is valid for N ≤ Nx. N denotes the averagenumber of particles per aggregate, d denotes the fractal dimension, and “relative viscos-ity” denotes η(dispersion)/η(polymer). “Relative volume fraction” denotes Φ/Φmp, whereΦmp is the value of Φm in the absence of aggregation. Scaling Φ by Φmp allows us toillustrate the relative effects of aggregation independently of the particle shape.
uidlike processes such as breakup into smaller particles or coalescence intolarger particles).
6. F*, PERCOLATION, AND PARTICLE PACKING
6.1. Geometrical Versus Transport PropertyPercolation Thresholds
It is important to distinguish purely geometrical quantities, such as the geo-metrical percolation threshold pc and the maximum packing fraction Φm, fromtransport property “percolation thresholds” (such as Φ* for the shear viscosity)measured by observing the onset of a rapid variation of dispersion properties.We recall that pc is only defined for overlapping particles, while real particlesoften do not have this property. Interparticle and polymer-particle interactionsand the physical properties of the particles relative to their environment alsoinfluence the measured transport percolation thresholds. The viscosity and otherproperties (such as conductivity and dielectric constant) of dispersions tend tochange substantially as the dispersed material forms a connected structure sothat a relation between pc and transport percolation thresholds might be ex-
Downloaded At: 12:45 19 January 2011

ORDER REPRINTS
586 BICERANO, DOUGLAS, AND BRUNE
pected. This connection has only been established rigorously for idealized latticemodels of conductivity under specialized conditions. Many questions remainopen for continuum systems, which often provide a much better description ofreal materials.
6.2. Background Information on theGeometrical Percolation Threshold pc
We first cite some basic sources that describe percolation theory and provideinformation relevant to our model. We then summarize some recent contribu-tions to percolation theory that are useful for understanding properties of disper-sions of anisotropic (especially platelet-shaped) particles.
The books by Zallen [59] and Stauffer and Aharony [60] are excellent gen-eral references on percolation theory. The former has a more physical emphasis,while the latter has a more mathematical emphasis. The book by Hughes [61]also summarizes much useful information relating to past studies of percolationtheory.
Early Monte Carlo simulations of the pc of fibers with random orientationsin the three principal axis directions were performed by Boissonade, Barreau,and Carmona [62] on a simple cubic lattice, and conductivity percolation thresh-olds of 0.0904 and 0.0635 of highly conducting fillers were found for Af of 10and 15, respectively, with the conductivity percolation threshold decreasingroughly in inverse proportion to Af in the simulated range (1 to 15). This trendis in agreement with the more extensive numerical calculations of pc summa-rized in the next subsection.
The percolation of aligned platelets was addressed both experimentally andtheoretically by Celzard et al. [63–65]. They studied the electrical conductivityof partially oriented composite films made from an epoxy resin matrix filledwith slender micron-size exfoliated graphite platelets of Af < 100. They founda low apparent conductivity percolation threshold of 0.013 (i.e., 1.3% by vol-ume) for these anisotropic filler particles. In their latest paper [65], they alsoaddressed the effects of platelet orientation on conductivity percolation thresh-old due to excluded volume interactions. They showed that this threshold in-creases rapidly as the maximum angular orientation between the disks is re-duced, in other words, as the disks are oriented parallel to each other. Theircalculations illustrate a method by which orientation effects potentially could beincluded in the calculations of the conductivity percolation threshold.
The angular orientation between the platelets can be sensitive to Af and Φ, tothe nature of the dispersing medium, and to the actual sizes of and the totalcharge on the platelets [66]. Random, highly aligned, and various types ofstacked orientations are possible. Furthermore, the imposition of a shear fieldcan result in the alignment of the platelets [32, 67, 68], in depletion of the
Downloaded At: 12:45 19 January 2011

ORDER REPRINTS
VISCOSITY OF PARTICLE DISPERSIONS 587
platelets from the vicinity of the walls of the flow medium [32], and in dampedoscillations of the orientation distribution in the early stages of shearing [69].Consequently, under favorable combinations of polymer and platelet type andγ, both pc and Φ* could increase relative to their values for random dispersions,resulting in shear thinning and extending both the onset of the concentratedregime and the acceptable processability range above the expectation from thevalues of pc and Φ* calculated for a random dispersion.
Balberg [70] indicated that the criteria for the onset of percolation in thecontinuum are usually based on considering parallel-aligned, equal-size, pene-trable, convex objects. He presented criteria for more general macroscopicallyisotropic or anisotropic systems in which the objects may also be of variablesizes and of totally random orientation (rather than randomly oriented along afew selected directions, such as parallel to the edges and diagonals of a modellattice). He found that percolation could occur at much lower pc for these modelsystems.
Fizazi et al. [71] prepared conducting gels of ultrahigh molecular weightpolyethylene and a soluble conjugated polymer by thermoreversible gelationfrom semidilute solutions in decalin and subsequent doping with iodine. Theyfound evidence of connected conducting paths at Φ[poly[3-octylthiophene)] ,0.0005, with no indication of an “ordinary” pc. They discussed these results interms of the adsorption of poly(3-octylthiophene) onto a preformed polyethylenegel network that organizes this conductive material into connected paths. Levon,Margolina, and Patashinsky [72] introduced the concept of “multiple percola-tion.” They visualized percolation occurring in the restricted regions allowed tothe constrained particles, reducing pc from its bulk value. In phase-separatingblends, this restricted domain is the phase to which the conducting particlessegregate.
We next consider trends in the dependence of pc on particle shape.
6.3. Shape Dependence of pc and Its Relation to [h]
The baseline quantity in all of these considerations is the pc of a dispersionof randomly placed filler particles as a function of Af. The results of MonteCarlo simulations of pc by Garboczi et al. [73] for ellipsoids of revolution aretabulated in Table 1 and are represented graphically in Fig. 7. These results arereproduced very well by Eq. 6 [73] over the entire Af range used in the simula-tions (Af > 1 for fibers, Af = 1 for spheres, and Af < 1 for platelets):
pc < 9.875Af + A 2f
7.742 + 14.61Af + 12.33A 1.5f + 1.763A 2
f + 1.658A 3f
(6)
Downloaded At: 12:45 19 January 2011

ORDER REPRINTS
588 BICERANO, DOUGLAS, AND BRUNE
FIG. 7. The pc of randomly dispersed ellipsoids of revolution [73]. See the legendof Fig. 1 for the definition of Af. The squares show pc values calculated by Monte Carlosimulations. The curve represents a fit to the squares (Eq. 6).
The Af dependence of pc looks quite symmetric between fibers and platelets, butcareful inspection of the results shows that, just as [η] increases more rapidlywith Af for fibers (Fig. 1), pc decreases more rapidly as a function of Af forfibers. The increase of [η] in Fig. 1 is roughly the inverse of the decrease of pc
in Fig. 7. This interesting relation between the infinite dilution quantity [η] andthe geometric percolation threshold pc (marking the onset of the concentratedregime) is shown in Fig. 8. It is evident that particle anisotropy both facilitatesparticle percolation and causes a corresponding increase of η(dispersion) in di-lute dispersions.
The rough inverse relation between pc and [η] also follows from the observa-tion that the virial expansion for the conductivity σ of a dispersion of conductiveparticles has the form of Eq. 1, where [σ]∞ is the intrinsic conductivity (leadingvirial coefficient for the electrical conductivity of highly conductive particles[8]). We obtain a rough criterion for the conductivity percolation threshold bythe condition that the leading-order perturbation term in the expansion [σ]∞Φ ison the order of unity. (This estimate of the order of magnitude for the locationof the scaling regime is similar to the Ginzburg criterion of critical phenomena[74].) Thus, the conductivity percolation threshold is predicted to scale roughlyas 1/[σ]∞. Douglas and Garboczi [8] found that [η] is proportional to [σ]∞ to agood approximation (this is the basic result of the hydrodynamic-electrostaticanalogy discussed in Section 4.2), so that the viscosity percolation threshold Φ*should likewise scale as 1/[η] according to this argument [73]. The approximateproportionality between pc and Φ* suggests a proportional relation between pc
Downloaded At: 12:45 19 January 2011

ORDER REPRINTS
VISCOSITY OF PARTICLE DISPERSIONS 589
FIG. 8. Correlation between exact results [8] for intrinsic viscosity [η] (describingrheological effects of fillers at infinite dilution) and geometrical percolation threshold pc
(defining onset of concentrated regime) values calculated by Monte Carlo simulations[73] for platelets and fibers.
Downloaded At: 12:45 19 January 2011

ORDER REPRINTS
590 BICERANO, DOUGLAS, AND BRUNE
and Φ* to a reasonable approximation. This approximation is utilized as a work-ing hypothesis in Section 7 for estimating Φ* of anisotropic particle dispersions.
Finally, it is worth pointing out some preliminary calculations that couldform the basis for modeling how the “random close packing fraction” Φm relatesto the geometrical percolation threshold pc. Lee and Torquato [75a] consideredthe pc of partially overlapping disks, with the “core” of each disk impenetrablewhile the “shell” can overlap. They found that, as the core size of the disks isincreased, pc increases with the excluded volume interaction and seems to ap-proach the random close packing volume fraction Φm as the disks become im-penetrable. Bug et al. [75b] also considered whether interactions increase ordecrease pc. They used Monte Carlo simulations to show that increased interac-tion strength can either increase or decrease pc. The direction and the magnitudeof the change depends in a complex manner on the distance at which two parti-cles are considered to be connected, the dimensionality, and the temperature.Further calculations along these lines would be useful in establishing the mathe-matical definition of the random close packing volume fraction Φm and its varia-tion with shape.
7. VISCOSITY PERCOLATION THRESHOLD F* ANDDISPERSION GELATION
7.1. Importance of F* for Dispersion Processing
Although pc is an indicator of the onset of collective particle motions, theonset of dispersion rigidity manifests itself at a higher volume fraction Φ* [76,77]. Hence, while pc often can provide a good estimate of the upper volumefraction limit of “easy processability” for a dispersion, a more refined estimatefor η(dispersion) can be made using Eq. 5 in the concentrated regime of pc ≤ Φ< Φ* if we know Φ*. The estimation of the viscosity percolation threshold Φ*as a function of the relevant material and flow parameters is then the basicchallenge in developing a predictive model for dispersion shear viscosity forprocess design. In the discussion that follows, we generally identify Φ* withthe random close packing volume fraction Φm. This quantity can be estimatedfor particles of general shape, in dispersions subjected to a wide variety offlow conditions, by combining geometrical percolation data and experimentalparticle-packing data.
7.2. Estimating Fm from pc Data and ExperimentalParticle-Packing Data
It can be expected that Φm for randomly distributed particles of arbitraryshape at close packing should correspond to the volume fraction at which theviscosity approaches infinity. Intuitively, the rigidity percolation threshold Φ*
Downloaded At: 12:45 19 January 2011

ORDER REPRINTS
VISCOSITY OF PARTICLE DISPERSIONS 591
should decrease with increasing particle asymmetry just as pc does. These expec-tations are supported by the numerical results and theoretical arguments givenin Section 6.3. An assumption of a proportional relation between pc and Φm andexperimental data for certain particle shapes allows us to predict Φm in cases forwhich experimental data are not yet available.
The correlation between Φm and Af was investigated for cylindrical fibers [78,79]. Using raw spaghetti “fibers” of a single diameter over the range 6.8 ≤ Af ≤143 and also including data from other authors for packings of cylindrical glassfibers, chopped glass strands, and wooden rods, Parkhouse and Kelly [79] foundexperimentally (and rationalized by a mathematical derivation) that Eq. 7 holds,with “ln” denoting the natural logarithm, so that both pc and Φm vary roughly ininverse proportion to the largest particle dimension as Af → ∞.
Φm < 2?ln(Af)Af
(fibers with Af ≥ 10) (7)
Since the maximum random packing volume fraction Φm < 0.64 ± 0.02 ap-parently occurs for spherical particles (Af =1) [80], while 2ln(Af)/Af reaches amaximum of 0.736 for Af = 2.718 and goes to zero as Af → 1, Eq. 7 cannot beextrapolated much below the Af range of the data used to develop it. Parkhouseand Kelly [79] suggested that it may be a fair approximation down to Af = 6. Indeveloping our scaling arguments, we assume that Φm is proportional to pc withthe same factor for a fiber of aspect ratio Af and a platelet of aspect ratio 1/Af.This assumption gives Eq. 8, which can only be used safely in combination withEq. 7 down to Af , 10 because the asymptotic large-Af dependence of Eq. 7 isrestricted to this range.
Φm(platelet) < Φm(fiber)? pc(platelet)pc(fiber)
(8)
Values of pc, calculated by Monte Carlo simulations in many cases (Table 1)and by Eq. 6 otherwise, and Φm, calculated by Eq. 7 for fibers of Af ≥ 10, canbe inserted into Eq. 8 to estimate Φm for platelets of (1/Af) ≤ 0.1. The results arelisted in Table 3 and are shown in Fig. 9, including the result for spheres. It isseen that, at a given anisotropy level, platelets give a somewhat larger Φm thanfibers. Consequently, Eq. 5 indicates that, if Φm is substituted for Φ*, then asshown in Figs. 10 and 11, a platelet dispersion should have a somewhat lowerη than a fiber dispersion at the same anisotropy level. Note that Φm is calculateddirectly for cylindrical fibers, but estimated for cylindrical platelets by a scalingrelation based on the pc values for ellipsoidal particles with biaxial symmetryand the same value of Af.
Downloaded At: 12:45 19 January 2011

ORDER REPRINTS
592 BICERANO, DOUGLAS, AND BRUNE
TABLE 3
Maximum Packing Volume Fraction Φm of Randomly DispersedEllipsoidal Particles with Biaxial Symmetry [Ellipsoidal Particles with
Two Symmetrically Equivalent Axes (a = b)]
Af Φm Af Φm Af Φm Af Φm
0.000100 0.003906 0.01 0.165836 10 0.460517 150 0.0668080.000500 0.015985 0.02 0.255495 15 0.361073 200 0.0529830.001000 0.028957 0.025 0.315987 20 0.299573 300 0.0380250.001563 0.042022 0.033333 0.340745 25 0.257510 400 0.0299570.002000 0.052440 0.04 0.401921 30 0.226746 500 0.0248580.003125 0.073876 0.05 0.443958 40 0.184444 640 0.0201920.003333 0.078293 0.070711 0.508663 50 0.156481 1000 0.0138160.004419 0.096982 0.1 0.559838 80 0.109551 2000 0.0076010.005000 0.104772 1 0.640000 100 0.092103 10000 0.001842
In this notation, Af = (c/a), where c is the length of the third axis of the ellipsoid, so that Af > 1for prolate ellipsoids (approximating fibers at large Af), Af = 1 for spherical particles, and Af < 1 foroblate ellipsoids (approximating platelets at large 1/Af). The Φm values for fibers are calculatedusing an empirical correlation (Eq. 7). The experimental Φm value is used for spheres. A scalingrelationship (Eq. 8) is used to calculate Φm for platelets.
The hypothesis that Eq. 5 holds for objects of general shape and even fordispersions subject to steady shear provides an interesting prediction for theviscosity percolation threshold Φ*. This prediction can be checked against pack-ing data, as well as viscosity measurements, if we take Φ* < Φm. To obtainsuch an approximation, we expand Eq. 5 in the low volume fraction limit toobtain η(relative) < 1 + (1.6)?(Φ/Φ*) + O[(Φ/Φ*)2]. Since the leading virial co-efficient defines [η], consistency requires that Φ* < 1.6/[η]. (This prediction ofΦ* is similar in form to that of the “overlap concentration” c* in polymer solu-tions that scales as c* , 1/[η], where [η] is the intrinsic viscosity of the polymer[81–83].) A summary of experimental data on model nonaggregating hardsphere dispersions by Wildemuth and Williams [39b] suggests the empiricalrelation given by Eq. 9:
Φ* < 1.7/[η] (9)
This result holds to a good approximation over a wide range of shear stressin which both Φ* and [η] vary [39b] and is in accordance with our hypothesisof “universality.” We also recall that the geometrical percolation threshold pc
for ellipsoids of revolution was found to scale roughly as ,1/[η] over a wide
Downloaded At: 12:45 19 January 2011

ORDER REPRINTS
VISCOSITY OF PARTICLE DISPERSIONS 593
FIG. 9. Semiempirical estimate for the maximum packing volume fraction Φm ofrandomly dispersed cylindrical particles. Af = height/diameter for fibers and thickness/diameter for platelets. For comparison, Φm for spheres and geometrical percolationthreshold pc for ellipsoids with biaxial symmetry are also shown. Note that Φm is calcu-lated directly for cylindrical fibers, but estimated for cylindrical platelets with a scalingrelation based on pc values for ellipsoids.
aspect ratio range (Fig. 8b). This observation provides further support for thenear proportionality between pc and Φ* suggested above. It would be interestingto check the extent to which Eq. 9 holds for dispersions of monodisperse aniso-tropic particles.
7.3. Difficulties in Estimating Fm for Anisotropic Particles
It is difficult to determine Φm accurately, especially for highly anisotropicparticles, because of possibly significant deviations from equilibrium particleconfigurations in simulation modeling. For example, Buchalter and Bradley [84]analyzed the orientational order in random packings of hard ellipses in twodimensions [84a], as well as hard ellipsoids in three dimensions [84b] by MonteCarlo simulations. These calculations involved “pouring” such objects into a
Downloaded At: 12:45 19 January 2011

ORDER REPRINTS
594 BICERANO, DOUGLAS, AND BRUNE
FIG. 10. Examples of viscosity curves calculated as a function of the volume frac-tion Φ using Eq. 5 with Φ* replaced by Φm for dispersions of spheres, platelets, andfibers. “Relative viscosity” denotes η(dispersion)/η(polymer). Each curve is labeled bythe value of Af (with Af > 1 for fibers, Af = 1 for spheres, and Af < 1 for platelets), fol-lowed by the value of Φm used in its calculation, in other words, by its (Af,Φm) combina-tion.
container under the influence of a gravitational field. Ellipses packed so thattheir major axes were aligned preferentially in the horizontal direction. Oblateellipsoids also packed with their major (symmetry) axes preferentially alignedin the direction of gravity, while the major axes of prolate ellipsoids preferredto lie within the plane perpendicular to gravity. Oriented packings of the ellipsesor ellipsoids were thus formed. The orientational alignment effects depended onAf. For prolate ellipsoids, the orientational order parameter (ranging from 0 fortotally isotropic distribution to 1 for a perfectly aligned distribution) reached amaximum of about 0.4 at Af , 2 and then decreased to an apparently asymptoticlimit of about 0.2. For oblate ellipsoids, this parameter increased rapidly to
Downloaded At: 12:45 19 January 2011

ORDER REPRINTS
VISCOSITY OF PARTICLE DISPERSIONS 595
FIG. 11. Relative viscosities as a function of the volume fraction Φ for anisotropicparticles. Relative viscosities for dispersions of platelets of aspect ratio 1/Af were dividedby those for dispersions of fibers of aspect ratio Af (see Fig. 10). It is thus shown that,at a given level of particle asymmetry (see curve labels), a dispersion of platelets isexpected to have a lower viscosity than a dispersion of fibers. The comparison of thetwo curves shows that this effect increases with particle asymmetry.
about 0.42 by Af , (1/4) and appeared to level off around that value. The pack-ing fractions at given Af and 1/Af combinations were always larger for oblateellipsoids than they were for prolate ellipsoids, as expected. However, thesesimulated packing fractions were far below the Φm values reported by Parkhouseand Kelly [79] for fibers, and the deviations are especially large for prolateellipsoids. The simulated packing volume fraction also was not found to bemaximized for spheres, while experimental values of Φ* suggest that Φ* hasits maximum value for spheres [85]. These results underscore the difficulties inestimating Φm.
7.4. Dispersion Gelation for F > F*
The close-packing concentration Φm defines the critical volume fraction Φ*at which the viscosity approaches infinity in a dispersion at equilibrium. It is
Downloaded At: 12:45 19 January 2011

ORDER REPRINTS
596 BICERANO, DOUGLAS, AND BRUNE
possible for Φm to be exceeded through crystallization or other equilibrium or-dering processes or through the formation of a “jammed” nonequilibrium state.We define dispersion gels as particle dispersions for which Φ > Φm, based onan operational definition of a gel as a disordered material for which η → ∞.
Kanai et al. [86] investigated the elastic (storage) shear modulus G of floccu-lating colloidal dispersions, found the onset of elasticity beyond a critical vol-ume fraction of dispersed particles, and used the concept of “rigidity percola-tion” [55] to interpret their data. The percolation model of dispersion viscositythus also has some implications in understanding the rigidity of very concen-trated particle dispersions (Φ > Φ*), which are “solids” rather than “liquids.”Figure 12 illustrates dispersion gelation phenomena schematically by showingη and G as functions of Φ and highlighting the role of Φ* as a critical volumefraction at which a dispersion becomes solid.
The analogy between dispersion rheology and gelation also suggests that theshear relaxation function develops with a power law form above Φ < Φ*, withexponents governed by percolation theory [87–93]. Such power law scaling is
FIG. 12. Schematic illustration of the shear viscosity η and the equilibrium shearmodulus G as functions of the particle volume fraction Φ. Note that η approaches infinityas Φ approaches the viscosity percolation threshold Φ* from below, while the onset of anonzero G (indicative of the onset of true solidlike rigidity) occurs immediately above Φ*.
Downloaded At: 12:45 19 January 2011

ORDER REPRINTS
VISCOSITY OF PARTICLE DISPERSIONS 597
often found in the rheology of soft glassy materials [90] and is naturally associ-ated with the emergence of rigidity through a continuous rigidification transitionas occurs in gelation [91]. In de Gennes’s “percolation model of gelation” [92],the approach of the viscosity to infinity near the gelation (geometrical percola-tion) transition is described by the conducting inclusion exponent and the shearmodulus by the insulating inclusion exponent. As mentioned above, the viscos-ity exponent of the gelation problem is reversed relative to the case of particledispersions. Thus, the viscosity of a gelling sol approaches infinity with thecross-link concentration relative to a critical value, but with the conductor perco-lation exponent (,0.8 in three dimensions) rather than the insulator percolationexponent indicated in Eq. 5. These predictions agree with some gelation mea-surements [88, 89], but universality in the exponents has not generally beenobserved in gelling systems. It would be interesting to observe in future workwhether the shear moduli of dispersions of anisotropic particles scale as G ,(Φ-Φ*)0.8, where the conductor exponent of about 0.8 replaces the insulatorexponent of about 2.0 predicted for the shear modulus in the percolation modelof gelation [88, 89, 92]. This conjecture extends the reversal of the conductorand insulator percolation exponents in the dispersion and gelation problems tothe shear modulus.
While it is impossible to form a gel from rigid spherical particles with short-range interactions, recent measurements by Roovers [93] have shown that gelscan be formed with deformable many-arm star polymers. Dispersion gels havebeen observed in foams, in which the dispersed air bubbles are deformable [94].We suggest that dispersion gels of anisotropic particles can be made by exceed-ing the rigidity percolation threshold (Φ > Φ*). For rigid anisotropic particles,this can occur through adjustments in the local particle orientation, which canlead to packing densities greater than those obtained at random close packingunder equilibrium conditions. Such a dispersion gel of anisotropic particles canthus be considered a kind of glass. A sol-gel transition has also been observedin colloidal dispersions of platelet-shaped laponite particles [95] that might berelated to the concept of dispersion gelation. It seems likely that many softsolids with a colloidal origin may be dispersion gels.
7.5. Some Phenomenological Observations on the Effectsof Filler Polydispersity on Fm
Several different types of polydispersity can occur. First, all particles couldhave the same shape (i.e., platelets of equal Af), but different sizes. The effectwould be to increase Φm (and the loose packing volume fraction as shown byShapiro and Probstein [31]) since smaller particles could fit into the gaps leftby the packing of larger particles. This increase of Φm remains to be describedquantitatively in general as a function of Af and particle size distribution, but it
Downloaded At: 12:45 19 January 2011

ORDER REPRINTS
598 BICERANO, DOUGLAS, AND BRUNE
has been shown that space can be filled completely (reaching Φm = 1) for spheri-cal particles having a power law size distribution [56, 96].
Second, all particles could have the same shape type (i.e., platelets), but havedistributions of Af and of size. The effect of the size distribution should be asdescribed above. It is usually suggested that the distribution of Af values has alog-normal form. Unless the Af distribution is extraordinarily broad, its effectshould be relatively minor compared to the dominant effect of the most probablevalue of Af. This statement was verified for the Young’s and shear moduli inthe preliminary micromechanical calculations performed as a part of the workof Bicerano and Brewbaker [5, 6] on fiber-reinforced elastomers. Although thereare similarities between trends for the elastic moduli and viscosities of materials,the statement has not yet been verified for the viscosity either by calculations orby experiments on well-characterized dispersions and hence must be consideredmerely as a plausible hypothesis.
Third, the particles could have distributions of shape types (i.e., fibers, plate-lets, spheres, and/or irregular-shape objects) and of Af values and sizes for eachshape type. In this very complex general case, the trends described above stillwill influence the overall packing pattern. However, extensive numerical simula-tions will be needed to estimate Φm, and complications such as the tendency ofmixtures of objects of different shapes to exhibit “entropy-driven” phase separa-tion will need to be taken into account.
Preliminary attempts to model the shear viscosity of dispersions of mixturesof dissimilar particles, such as the effective medium approach of Tsenoglou andYang [97], show some progress, but there is much room for improvement.
7.6. Phenomenological Estimate for Shear Rate andTemperature Dependence of F*
A method for the calculation of the effects of shear rate and temperaturevariation is suggested below. This method will require testing by extensive nu-merical calculations, as well as by comparisons with shear viscosity measure-ments, on well-characterized dispersions.
Assume that anisotropic particles in a dispersion are packed in a three-dimen-sionally isotropic manner in the limit of γ → 0 and in an ordered closed-packedmanner in the limit of γ → ∞. Then, Eq. 5 can be used with Φ*(γ → 0) = Φm0
as the viscosity percolation threshold at vanishing shear rate, where Φm0 is calcu-lated by using Eqs. 6–8 for fibers of aspect ratio Af ≥ 10 and platelets of aspectratio (1/Af) ≤ 0.1. Equation 5 can also be used at γ → ∞, this time with Φ*estimated by the ordered close-packed volume fraction Φocp for particles of agiven shape subjected to a flow field of given symmetry.
1. Φocp < 0.7405 for close-packed spheres [59] and biaxially symmetric el-lipsoids.
Downloaded At: 12:45 19 January 2011

ORDER REPRINTS
VISCOSITY OF PARTICLE DISPERSIONS 599
2. Φocp < 0.9069 for hexagonal close-packed cylinders [98].3. Φocp = 1 for particles of orthorhombic symmetry (i.e., containing six faces
of square and/or rectangular shape, with all edge intersections at an angleof 90°).
The challenge involves estimating how Φ* increases from Φm0 to Φocp as afunction of T and γ. We will stipulate that Φ* increases monotonically andsmoothly from Φm0 to Φocp as described by Eq. 10, where θ is a characteristicrelaxation time specified below. Examples of Φ*(T,γ) calculated using Eq. 10are depicted below after we show how θ can be estimated.
Φ*(T, γ) = Φm0?F1 + S Φocp − Φm0
Φm0D?S (γθ)2
1 + (γθ)2 D G (10)
Before considering model calculations based on Eq. 10, we mention somelimitations of this model. The assumption that Φ* increases monotonically withshear is based on the presumption that shear induces particle alignment andordering along the fluid flow direction. However, the rotational component ofthe shear field an have a disruptive effect on this shear-induced particle ordering,especially at high volume fractions, at which interparticle collisions occur withgreater frequency. Thus, shear may have a disordering effect at high volumefractions and shear rates, leading to shear thickening instead of shear thinning[53]. Such an effect could create difficulties in processing dispersions. Thesepotential complications of the concentrated regime are neglected here due to theabsence of experimental data that support their importance.
In a shear-thinning non-Newtonian dispersing fluid such as a typical polymermelt, shear induces a change in the equilibrium structure of the fluid. In particu-lar, we believe that the large-scale clusters of chains responsible for entangle-ment phenomena are broken down by the flow process. Since this is a strongeffect, the viscosity of a particle dispersion should exhibit a transition to shear-thinning behavior at roughly the same characteristic γ as the pure polymericfluid. The breakdown of the cluster structure of the polymer chains is anticipatedto facilitate particle orientation. Hence, we propose, as an intuitively appealinghypothesis, that the non-Newtonian flow relaxation of the pure entangled poly-mer fluid can be identified with the relaxation time θ of Eq. 10. This relaxationtime is a function of Mw, Mw/Mn, T, and γ for a given type of polymeric dispers-ing fluid. We determine it from the Carreau model type of scaling relation forentangled polymer melts [99] given by Eq. 11, which involves the assumptionthat the viscous flow relaxation time can be identified with θ.
η(γ)η(0)
= [1 + (γθ)2]−0.35 (11)
Downloaded At: 12:45 19 January 2011

ORDER REPRINTS
600 BICERANO, DOUGLAS, AND BRUNE
Many important fluids (such as water and other small-molecule liquids) arereasonably well described as Newtonian over a wide range of γ. In this case,we identify γθ in Eq. 10 as proportional to the Peclet number Pe in Eq. 3. Asa first approximation, we take this proportionality constant to be unity in ourpresent discussion, that is, γθ < Pe. We can develop a good approximation forthe viscosity of Newtonian dispersions in the dilute filler regime and estimate θusing arguments similar to those proposed for Eq. 10. It is apparent from Fig.2 that the intrinsic viscosity [η(γ)] varies smoothly with γ and approaches aconstant value [η]∞ at large γ. Moreover, since it is a scalar quantity, [η(γ)] onlydepends on the invariants of the rate of deformation tensor, so that it is invariantto the shear direction (an even function of γ). Using Brenner’s results [4] for[η] as a fuction of Pe (Eq. 3) for the effects of γ, T, and η(dispersing fluid), a“viscous flow relaxation time” θ in a Newtonian fluid can be estimated by fitting[η] at low γ to Eq. 12 (compare approximant to Eq. 10).
[η(T,γ)] = [η]0?H 1 + S [η]∞ − [η]0
[η]0D?S (γθ)2
1 + (γθ)2 D J (12)
Equation 12 (in combination with Eq. 10) is only useful in extrapolating fromthe dilute regime for dispersions in Newtonian fluids of particles with significantanisotropy [e.g., fibers of Af ≥ 10 and platelets of (1/Af) ≤ 0.1]. We note that([η]∞ − [η]0) = 0 for spherical particles, so that shear thinning does not occur inthe isotropic (spherical) particle limit at infinitesimal volume fractions, whileshear thinning can and does occur in more concentrated dispersions of sphericalparticles because of particle packing and interparticle interaction effects.
Note that η(dispersing fluid) enters the calculation of Φ*(T,γ) in a compli-cated manner in either Newtonian or non-Newtonian dispersing fluids, so thatη(relative) estimated using Eq. 5 always depends implicitly on η(dispersing) incalculating the effects of a γ and T variation.
Figure 13a depicts Eq. 11 for the γ dependence of η for a polymeric dispers-ing fluid with an experimentally measured viscosity at a given T that varies asshown as a function of γ. According to our model assumptions, the value of θfor this shear-thinning fluid is independent of the Af of the particles dispersedin it, while the θ value of a dispersion in a Newtonian fluid is a function of Af.A model calculation of η for cylindrical platelets of Af = 0.01 in a Newtonianfluid is shown in Fig. 13b. If extended to higher γ values, the curve in Fig. 13bwould become S shape and reach an asymptotic limit as γ → ∞. (Again, weemphasize that further experimental work is needed to verify our assumed formof an appropriate viscous flow relaxation time θ in both types of liquids.) Forexample, θ can be determined experimentally by light-scattering measurementsthat monitor particle alignment. Simulation studies can also be used to establish
Downloaded At: 12:45 19 January 2011

ORDER REPRINTS
VISCOSITY OF PARTICLE DISPERSIONS 601
FIG. 13. Examples of calculation of relaxation time θ at a given temperature: (a)fitting of Eq. 11 to viscosity data for a representative non-Newtonian fluid (polymermelt) as a function of shear rate γ ; (b) shear-rate dependence of intrinsic viscosity [η]of cylindrical platelets of Af = 0.01 in a Newtonian fluid, with the data corresponding tothe exact numerical results for [η(γ)] and the curve representing Eq. 12.
Downloaded At: 12:45 19 January 2011

ORDER REPRINTS
602 BICERANO, DOUGLAS, AND BRUNE
the value of θ and the validity of our argument for a change in Φm with γ in thecase of a Newtonian dispersing fluid.
The results calculated for Φ* as a function of γ using Eq. 10 for cylindricalplatelets of Af = 0.01 (and hence Φm0 < 0.177 by combining Eqs. 6, 7, and 8;and Φocp < 0.907) are shown in Fig. 14, both for the polymeric fluid and for theNewtonian fluids used in (Fig. 13). The Φm0 values used in Fig. 14 differ fromthose used in Fig. 10 because pc values from Monte Carlo simulations were usedin Eq. 8 when available in preparing Fig. 10, while all pc values were calculatedusing Eq. 6 in preparing Fig. 14. It is seen that, as expected, Φm changes substan-tially as a function of γ. An important difference is seen, however, between thebehaviors in the two types of dispersing fluid. In the Newtonian fluid (represen-tative of simple molecular liquids), a small amount of shear is sufficient toinduce significant particle alignment, so that Φm approaches Φocp at a very lowvalue of γ. On the other hand, we expect that particle alignment will be inhibitedin polymer fluid dispersions at higher volume fractions by the presence of entan-gled polymer chains; this is based on measurements (discussed below) of η forthese dispersions. Consequently, the onset of the rapid increase of Φm should
FIG. 14. Maximum packing volume fraction Φ*. Calculated from Eq. 10 at a giventemperature as a function of the shear rate, for cylindrical platelets of Af = 0.01, dispersedin the Newtonian fluid (curve labeled “Eqn 10 using Eqn 12”) and in the polymer melt(curve labeled “Eqn 10 using Eqn 11”) indicated in Fig. 13.
Downloaded At: 12:45 19 January 2011

ORDER REPRINTS
VISCOSITY OF PARTICLE DISPERSIONS 603
occur at a much higher γ value when the dispersing fluid is a polymeric melt.In fact, Φm has reached a value very close to Φocp in the Newtonian fluid at theγ range at which significant increases of Φm have just begun to manifest them-selves in a polymeric fluid in our modeling.
The values of Φm(γ) < Φ*(γ) calculated for platelets of Af = 0.01 can be in-serted into Eq. 5 to estimate η(relative) as a function of Φ and γ. Figure 15shows our predictions for these dispersions in the polymeric fluid at each oneof a series of γ values as a function of Φ. It is seen that η(relative) should belowered substantially with increasing γ, corresponding to shear rates largeenough for the pure polymer melt to exhibit shear thinning.
Figure 16 illustrates the increasing sensitivity to the shear rate γ with increas-ing volume fraction and with particle aggregation. The curve labeled “0.175”shows the drastic effect of increasing γ for a dispersion of discrete axisymmetriccylindrical platelets of Af = 0.01 at a volume fraction of Φ = 0.175 (just belowΦm0 < 0.177); a large η(relative) in the low-shear region and very rapid shearthinning in the high-shear region. The curve labeled “0.175, d = 2.75, N = 5”shows the effects of very mild fractal aggregation (discussed below in great
FIG. 15. Relative viscosity [η(dispersion)/η(polymer)]. Calculated as a function ofshear rate and volume fraction, for cylindrical platelets of Af = 0.01, in the polymer witha viscosity in the absence of the particles that was shown in Fig. 13a. Curves are labeledby the shear rate in 1/s.
Downloaded At: 12:45 19 January 2011

ORDER REPRINTS
604 BICERANO, DOUGLAS, AND BRUNE
FIG. 16. Relative viscosity of a platelet dispersion as a function of shear rate γ atfixed volume fraction Φ. This figure illustrates a greater sensitivity to γ with increasingΦ and fractal aggregation. The cylindrical platelets with an aspect ratio Af = 0.01 aredispersed in a polymer with a shear-dependent viscosity that is indicated in Fig. 13a.“Relative viscosity” denotes η(dispersion)/η(polymer). The first number labeling eachcurve is the value of Φ. The curve labeled “0.175, d = 2.75, N = 5” shows the effects ofvery mild fractal aggregation (N = 5 particles per floc, aggregated with fractal dimensiond = 2.75) for Φ = 0.175. The curve labeled “0.175, d = 2.75, N = 5, flocs dissociating at10/s” shows what is predicted to happen if the flocs in that dispersion are so weak thatthey are unable to withstand the shear stress generated at shear rates above 10 s−1.
detail) in this dispersion. Φm0 decreases to 0.153, and η(relative) increases drasti-cally relative to the case of the discrete particles for Φ > 0.153. The curve la-beled “0.175, d = 2.75, N = 5, flocs dissociating at 10/s” indicates what happensif the flocs are so weak that they are unable to withstand the shear stressesgenerated at γ > 10 s−1, and they thus disintegrate into discrete particles (seeSection 7.8). The behavior is similar to that of strong flocs up to γ = 10 s−1 andof discrete particles for γ > 10 s−1. The lower curves (for Φ values of 0.16, 0.12,0.08, and 0.04) show the rapid reduction of the magnitude of shear thinningwith decreasing Φ.
Downloaded At: 12:45 19 January 2011

ORDER REPRINTS
VISCOSITY OF PARTICLE DISPERSIONS 605
7.7. Yield Stress of Dispersion Gels
Dispersion gels (Φ > Φ*) exhibit a yield stress τy below which they do notflow and above which they flow readily [40]. A semiempirical method for calcu-lating τy, originally created by Wildemuth and Williams [39], is summarized inthis section because such behavior has important processing implications. Ourcontribution consists of making the model of Wildemuth and Williams predict-ive by estimating its two parameters (A and m) from our dispersion viscositymodel.
For illustration, we restrict our attention to needle and platelet particles, thatis, to fibers of aspect ratio Af ≥ 10 and platelets of aspect ratio (1/Af) ≤ 0.1. Themodel of Wildemuth and Williams [39b] is first utilized to estimate the stressdependence of the maximum packing fraction Φm given by Eq. 13, with Φm(T,γ)values in Eq. 10 (θ from either Eq. 11 or Eq. 12) and η(T,γ) from Eq. 5, toobtain our yield stress estimates. The shear stress is defined as τ ≡ η γ. (Thisrelationship is exact for Newtonian fluids. It is often also used in treating anon-Newtonian fluid as a “generalized non-Newtonian fluid” with a shear-rate-dependent viscosity.) We define Φocp as the value of Φm in the limit of highshear rate (γ → ∞).
1/Φm = 1Φm0
−S 1
Φm0
− 1Φocp
D(1 + Aτ−m)
(13)
The model parameters A and m of the Wildemuth and Williams expression (Eq.13) can be fixed as follows:
1. Calculate Φm(T,γ) at selected values of γ and T using Eq. 10.2. Use Eq. 5 to calculate τ at many different combinations of Φm(T,γ)
and Φ.3. Treat these calculated τ values as a “data set” and fit Eq. 13 to it to fix
A and m.
The “yield stress” τy is defined by the condition that the shear viscosity ap-proaches infinity (η → ∞). It can be seen from Eq. 13 that such a yield stressshould occur in the volume fraction range Φm0 ≤ Φ ≤ Φocp. Equation 13 can berearranged to deduce the volume fraction dependence of the critical stress atwhich the viscosity approaches infinity. If this point is identified with the condi-tion for shear yeilding, this critical stress can be identified with the yield stressτy. Equation 14 corresponds to this rearrangement of Eq. 13. See Wildemuthand Williams [39b] for further discussion.
Downloaded At: 12:45 19 January 2011

ORDER REPRINTS
606 BICERANO, DOUGLAS, AND BRUNE
τy = F A?S ΦΦm0
− 1
1 − ΦΦocp
D G1/m
(14)
In Fig. 17, we show our estimate of the yield stress τy for cylindrical plateletsof Af = 0.01 dispersed in the polymeric fluid of Fig. 13a. The values of A andm were estimated by fitting Eq. 13 to Eq. 10 at several values of Φ. The fits arenot perfect, but the resulting curves of τy versus Φ over the range Φm0 ≤ Φ ≤ Φocp
all show the same asymptotic behavior (τy → 0 as Φ → Φm0 and τy → ∞ as Φ→ Φocp). Note that the volume fraction Φ at which the platelet dispersion “gels”is small relative to the viscosity percolation threshold Φ* of a sphere dispersion,and that the rise of τy with Φ is predicted to be mild up to rather high volumefractions.
FIG. 17. Yield stress τy of a model dispersion gel. Results of τy calculations usingEq. 14 for cylindrical platelets of Af = 0.01 dispersed in the polymer with a viscosity inthe absence of the particles that was shown in Fig. 13a. The three numbers labeling eachcurve indicate, respectively, the value of Φ for which Eq. 13 was fitted to Eq. 10 toestimate the parameters A and m and the values of A and m: (∆) 0.12, 3.7?1011, 2.41; (h)0.08, 2.4?109, 2.05; (e) 0.04, 1.8?108, 1.87.
Downloaded At: 12:45 19 January 2011

ORDER REPRINTS
VISCOSITY OF PARTICLE DISPERSIONS 607
7.8. Effects of Particle Aggregation on F*
7.8.1. General Remarks
Readers interested in a broad overview of fractal aggregation are referred tothe excellet book by Feder [38]. It is a major challenge to make quantitative apriori predictions of the likelihood and the extent of aggregation in particledispersions. For example, it has been shown [66] that the angular orientationbetween platelet-shaped fillers can be sensitive to Af and Φ, to the nature of thedispersing medium, and to the actual sizes of and the total layer charges on theplatelets. Random, orientationally ordered, or stacked configurations are pos-sible.
Although the development of a predictive model of dispersion microstructureremains an elusive goal, some qualitative trends can be anticipated:
1. The thermodynamics tendency to floc depends on a delicate interplayamong solvent-solvent, solvent-particle, and particle-particle interactions. Forexample, the average number N of particles in a floc tends to increase withincreasing Φ, and increased short-range attractive interparticle interactions asso-ciated with increasing the salt concentration or lowering the temperature alsotend to increase N. However, the formation of structures that have the lowestfree energy is often inhibited by kinetic factors, so that the processing historyof a dispersion affects its properties.
2. Aggregate growth far away from equilibrium conditions tends to formespecially diffuse fractal structures of low dimension. This type of structurearises because the incoming particles are screened from entering the interiors ofthe growing aggregates. If particle sticking is not irreversible, the flocs tend to“age” into more compact configurations governed by equilibrium conditions.These equilibrium structures may still be fractal structures having a form similarto branched polymers [100].
3. Flocs tend to disintegrate into their component particles under vigorousshear flow when the shear stress τ (namely, the magnitude of the stress tensor)becomes sufficiently large. The value of this critical shear stress τd directlyreflects the magnitude of the attractive interparticle energy. This leads tostrongly non-Newtonian flow properties. There can also be a tendency of flocsto form at low shear rates due to increased collision frequency between theparticles, leading to shear thickening.
4. If a flocculated microstructure falls apart as a result of shear or othertypes of deformation, it may or may not reform after this external perturbationis removed. The breakdown of flocs held together by weaker interparticle inter-actions (secondary bonds, such as dispersive forces, weak polar forces, and hy-drogen bonding) is generally more reversible than the breakdown of flocs heldtogether by stronger interactions (such as ionic, covalent, or metallic bonding).
Downloaded At: 12:45 19 January 2011

ORDER REPRINTS
608 BICERANO, DOUGLAS, AND BRUNE
The reason is that the reformation of strong bonds (which may have rearrangedthemselves into new patterns on the surfaces of the particles after a floc fellapart) may require the surmounting of prohibitively large energy barriers.
7.8.2. Observations on Flocculated Dispersions
There is a consdiderable amount of ongoing research, involving experimentalwork as well as theory and numerical simulations, to elucidate in detail thenature of the flow-induced changes in flocculated dispersions. For example,Pignon, Magnin, and Piau [101] studied the behavior of a thixotropic syntheticclay of the hectorite-type [Laponite) dispersion under steady shear by combiningrheometry with light scattering. Their Laponite samples contained disk-shapedparticles, 30 nm in diameter and 2 nm thick (and hence with Af = 1/15). In therest state, the gel structure consisted of micron-size fractal aggregates of ex-tremely “open” structure. The gels had a fibrous texture and d = 1 ± 0.05 closeto the sol-gel transition (0.0035 ≤ Φ ≤ 0.0056). They had a more heterogeneoustexture, with zones of lower and lower particle concentration and d = 1.8 ± 0.01in the higher Φ range (0.012 ≤ Φ ≤ 0.02). Between these two ranges of Φ values,there was a transition zone (with d gradually increasing from 1 to 1.8), corre-sponding to entanglement of the micron-size aggregate clusters to produce anincreasingly dense microstructure. Under steady shear, these micron-size fractalaggregates contracted and stretched perpendicularly to the shear direction by amechanism resembling that proposed DeGroot et al. in explaining their ownobservations [102] of flow-induced anisotropic small-angle light scattering insilica-filled poly(dimethyl siloxane) liquids. There was a critical shear rate [101]above which any additional contraction of the aggregate was impossible.Breakup could be attributed to mechanical stresses.
These experiments [101] also validated earlier theoretical results [103–106].In particular, they demonstrated the validity of Potanin’s theoretical conclusion[104] about the existence of a critical value of γ. While it is not phrased interms of concepts of fractal geometry, a paper by Tsenoglou [107] on the effectsof agglomeration and shear on the fluidity and plasticity of a dispersion ofnaturally buoyant particles in a Newtonian fluid matrix also provides usefulinformation on these topics.
Some important work has been concerned with the extent of the universalityof the fractal dimension of particle aggregates. Aubert and Cannell [108] per-formed experiments on the aggregation of colloidal silica spheres, showing thatslow aggregation always yields clusters of d = 2.08 ± 0.05, while rapid aggrega-tion can produce clusters with either d = 1.75 ± 0.05 or d = 2.08 ± 0.05. How-ever, the clusters with d = 1.75 ± 0.05 were always observed to restructure overtime into clusters of d = 2.08 ± 0.05. The lower d values observed under rapidaggregation were ascribed to diffusion-limited aggregation, for which the aggre-gation rate is limited solely by the time taken by particles and clusters to en-
Downloaded At: 12:45 19 January 2011

ORDER REPRINTS
VISCOSITY OF PARTICLE DISPERSIONS 609
counter each other by diffusion. The higher d values obtained under slow aggre-gation or restructuring over time were rationalized in terms of reaction-limitedaggregation for which substantial (but surmountable) repulsive barrieres areovercome by thermal activation so that aggregates reach their true equilibriumpacking arrangements. Several other studies of different materials also showsimilar behavior [109], with the d values falling in two narrow ranges.
There has been recent related research on “random surfaces,” which includeequilibrium cluster models (surfaces with holes) as a part of their description.These random surface models also give d < 2 for swollen clusters at equilib-rium, suggesting that an exponent of about 2 is general for swollen branchedpolymers, swollen membranes, and swollen equilibrium fractal aggregates at ornear equilibrium [100].
7.8.3. A Simple Model for the Viscosity of Aggregated Dispersions
An approximate method for the calculation of aggregation effects is nowsuggested. We neglect polydispersity effects to simplify the discussion. Theequations presented below can be averaged statistically for polydisperse flocs.Furthermore, because their prediction is beyond our scope, we will treat N, d,and τd as variables in a parametric study. As discussed above and shown in Fig.6, Eq. 5 can be used with the scaling relation given by Eq. 15 to account forfractal aggregation. We expect intuitively that the geometrical percolationthreshold pc should be a lower bound to the reduction of Φ* by aggregation. Ifthis expectation is taken provisionally as a hypothesis, Eq. 15 should hold onlyfor N values of up to a crossover value of Nx, and we take Φ* to equal pc for N> Nx. Nx is then calculated using Eq. 17, which is obtained by setting Φ* (Eq.15) equal to pc at N = Nx.
Φ* < Φm → Φmp?N1−(3/d) for N ≤ Nx (15)
Φ* < pc for N > Nx (16)
Nx = S Φm
pcDS d
3−d D (17)
Nx is depicted in Fig. 18 as a function of Af based on pc values calculated usingEq. 6 and Φm values calculated [only for fibers of aspect ratio Af ≥ 10 and plate-lets of aspect ratio (1/Af) ≤ 0.1] using Eqs. 7 and 8.
In incorporating fractal scaling into our dispersion shear viscosity model, theforms of Eqs. 2, 5, 10, 11, 12, 13, and 14 should remain invariant; but the valuesof Φm, Φm0, and Φocp prescribed by Eqs. 15, 16, and 17 should be used for theflocculated dispersion.
The model indicates that the viscosities of these flocculated dispersions aresensitive to the value of τd, as well as to the shear stress and the temperature:
Downloaded At: 12:45 19 January 2011
ORDER REPRINTS
610 BICERANO, DOUGLAS, AND BRUNE
FIG. 18. Crossover particle number Nx of flocculated aggregates. Nx is calculated atseveral values of the fractal dimension d for ellipsoids of revolution. See the legend ofFig. 1 for the definition of Af. The curve for d = 1.5 shows (Φm /pc), which is taken topowers of 5, 4, 3, and 2 in the calculations for d = 2.5, 2.4, 2.25, and 2. These resultsare approximate because the Φm values are more appropriate for cylindrical particles (forwhich pc values are not readily available), but the pc values are for biaxially symmetricellipsoidal particles (for which Φm values are not readily available).
1. In the idealized “strong floc” limit of τd → ∞, flocs remain intact regard-less of the value of τ. Since d < 3, Φ* decreases as described by Eq. 15 for N ≤Nx (with Nx calculated using Eq. 17) and remains constant at Φ* < pc (Eq. 16)for N > Nx. Since [η]0, [η(T,γ)], Φm0, and Φocp all scale similarly with N, the effectof shear on Φ*(T,γ) < Φm(T,γ) is identical to its effect on Φm0 for dispersions inboth Newtonian and non-Newtonian fluids according to Eq. 10. Consequently,at any combination of T and γ, Φm, Φm0, and Φocp all decrease by the same factorwith increasing N. The dispersion begins to behave like a solid, as shown inFig. 6 (having τy > 0 and τy changing more steeply as a function of Φ withincreasing N as calculated by combining Eqs. 10, 13, and 14) at a lower Φm0
with increasing N. The range of Φ values (Φm0 ≤ Φ ≤ Φocp) at which solid-likebehavior can be overcome by shearing narrows because of the reduction ofΦm(T,γ) and Φocp by the same factor. The decrease of Φocp implies that the onsetof true solid-like rigidity (which cannot be overcome by shear) occurs at a lowerΦ value and that the Φ range of solidity (Φ > Φocp) becomes broader.
2. In the idealized “weak floc” limit of τd → 0, flocs fall apart with a smallimposed value of τ. The dispersion then has the values of Φm, Φm0, and Φocp
scaled as described by Eqs. 15, 16, and 17. It manifests solid-like behavior only
Downloaded At: 12:45 19 January 2011

ORDER REPRINTS
VISCOSITY OF PARTICLE DISPERSIONS 611
for γ → 0. At any finite τ value, flocs fall apart so that Φm, Φm0, and Φocp jumpto their unscaled values for discrete particle dispersions for τ > 0, and the rheo-logical behavior becomes (most likely reversibly if shearing is stopped) that ofa discrete particle dispersion.
3. For most real particle dispersions with fractal aggregation, τd falls some-where between these idealized limits for strong and weak flocs. The behaviorof a real floc will thus usually resemble that of a strong foc for τ < τd and thatof a weak floc of τ > τd. The effects of fractal aggregation on the shear depen-dence are illustrated in Fig. 16.
More fundamental calculations of the viscosity of aggregated dispersions arepossible in the dilute limit. Mansfield, Douglas, and Garboczi [110] have devel-oped a numerical method to estimate [η] for rigid particle aggregates havingessentially arbitrary shape complexity. This method involves calculating theelectrical polarizability of a conducting form of the aggregate using a MonteCarlo algorithm in which the aggregate is “hit” with random walk pathslaunched from an enclosing sphere. Douglas and Garboczi [8] showed that [η] isproportional to the average electrical polarizability to a very good approximationfor particles of general shape. The translational friction coefficient of complex-shaped aggregates has also been shown to be approximately proportional to theelectrostatic capacity of a conductor particle having the same shape [111a, 111b].Furthermore, a probabilistic method involving integrating over random walk pathshas also been utilized to estimate the capacity (friction coefficient) for shapedaggregates [111b, 111c]. These random walk methods, in conjunction with theelectrostatic-hydrodynamic analogies mentioned above, allow the estimation of[η] and of the friction coefficient for particles having essentially arbitrary shape.Moreover, these computational methods become more efficient with increasingparticle complexity, allowing the computation of [η] in cases that would be pro-hibitively difficult to simulate by conventional finite-element methods.
The calculation of [η] for complex particle aggregates (such as fractal aggre-gates) allows the estimation of the viscosity of aggregated dispersions if wecalculate the average [η] for the dispersion and utilize Eq. 5 in conjunction withthe approximation given by Eq. 9. This type of calculation should also provideinsights into the scaling relation (Eq. 15) observed by Russel and Sperry [37].More generally, this type of calculation can be utilized to extract further struc-tural parameters describing flocculated aggregates. These methods will be devel-oped further in the near future.
8. DISPERSIONS OF FLEXIBLE PARTICLES AND DROPLETS
8.1. Dispersion Types
Emulsions (soaps, some paints, cosmetics, creams, mayonnaise, milk, andbutter) are examples of liquid-in-liquid dispersions, which consist of liquid drop-
Downloaded At: 12:45 19 January 2011
ORDER REPRINTS
612 BICERANO, DOUGLAS, AND BRUNE
lets dispersed in another liquid. Melts of blends, block and graft copolymers ofimmiscible components; and block and graft copolymer dispersions in a homo-polymer matrix are other familiar and technologically important examples offluid and flexible particle dispersions. The properties of these dispersions de-pend on the viscosity and deformability of the droplets and their state of disper-sion.
The properties of dispersed particles exhibit a wide range, from low viscosityand high deformability to high viscosity and low deformability. For example,wet foams are dispersions of gas bubbles in liquids for which Φ is relativelylarge [112], and the “particle” viscosity is low. The gas bubbles are spherical inearly stages of foam expansion, but they distort as they impinge on one anotherin the later stages of expansion. This deformability makes these dispersed parti-cles pack space more efficiently than hard spheres, and thus a change in Φm canbe anticipated. In a dilute dispersion of gas bubbles, it is possible to considerthe dispersion as a liquid droplet for which the viscosity of the dispersed phaseis usually relatively small. Thus, the viscosity of the droplet relative to thematrix fluid, zη = [η(dispersed phase/η(dispersing fluid)], can often be approxi-mated as zero (zη → 0). This is the opposite extreme of the “hard” droplet limit(zη → ∞), which is appropriate for modeling very viscous or solid dispersedparticles.
One often encounters dispersions of particles having intermediate flexibilityand viscosity. The influence of these factors on the dispersion viscosity is aproblem of great interest. The following are some examples for which sucheffects are expected to be important:
1. Exfoliated clay platelets of ,1 nm thickness and 100 to 1000 nm lateraldimensions dispersed in polymers were rather flexible and behaved me-chanically more like flexible sheets than rigid plates [113, 114]. Numeri-cal simulations showed that internal flexibility affects the detailed orbitsof dispersed platelets [115]. Hence, even particles of extremely highmodulus can have considerable internal flexibility if they are very aniso-tropic because of low flexural rigidity arising from large bending mo-ments induced by the very anisotropic geometry.
2. Another example of an inherently rigid, highly anisotropic particle withconsiderable internal flexibility is xanthan gum (a semirigid biopolymer),which has rheological properties that can be modeled reasonably well byneglecting its flexibility and treating it as a rigid rod [29, 116].
3. Synthetic “rigid-rod” high-performance polymeric fibers of all types, aswell as carbon fibers, also have considerable flexibility. Most important,these types of fibers all buckle at the microfibrillar and fibrillar scalesof their microstructures under compressive stresses, limiting the range oftheir potential aerospace applications [117].
Downloaded At: 12:45 19 January 2011

ORDER REPRINTS
VISCOSITY OF PARTICLE DISPERSIONS 613
4. High-resolution transmission electron microscopy of specimens sub-jected to mechanical stress, as well as atomistic simulations, showed thatcarbon nanotubes can be bent reversibly to large angles because of theremarkable flexibility of their hexagonal network, which resists bondbreaking and bond switching up to very large strains [118].
5. The flowing or swimming of organisms is an important area of biologicalresearch in which the concepts and methods of dispersion rheology offlexible “particles” have been applied for decades [119–122].
In particular, it seems likely that the exfoliation of layered silicates should leadto structures with a significant degree of flexibility and shape irregularity, whichcould substantially affect the properties of dispersions of these materials. Wemake some further observations about these materials, which are particularlyemphasized in the present paper.
Wen et al. [123] performed static light-scattering measurements on exfoliatedgraphite materials, showing that graphite sheets adopt a crumpled configurationin solution with a fractal dimension of d < 2.54. Under poorer solvent condi-tions, the sheetlike structures collapsed into more compact configurations. Theseconfigurational changes are much like the swelling of polymers in solution.Flexible surfaces and membranes, indeed, may be considered as polymers witha connectivity dimension greater than 1 [100]. This interpretation still holds if“sheetlike” or “networklike” polymers are torn in many places so that a“branched polymer” structure is obtained. Douglas [100] introduced a generaltheoretical treatment of the swelling of membrane and network polymers andthe transport properties of these structures in solution, but much more experi-mental and theoretical work is required in this area.
It is much simpler to understand the effects of the flexibility of solid particlesthan of liquid particles since complications such as breakup of dispersed do-mains, changes from one type of dispersed domain shape to another, co-continu-ity of two or more liquid phases, occlusion of subdomains of one phase withindomains of another, and phase inversion are often crucial in dispersions of liq-uids [124–133]. The present paper only considers liquid dispersions for whichthe interfacial tension is relatively large and the liquid droplets are dispersed atlow concentrations in the suspending fluid.
8.2. Dilute Dispersions of Spherical and Deformable Droplets
The effects of particle flexibility have been studied most extensively forspherical particles, including gas bubbles, liquid droplets, and deformable solidparticles. We summarize some results that give insights into the nature of thesedispersions.
Downloaded At: 12:45 19 January 2011

ORDER REPRINTS
614 BICERANO, DOUGLAS, AND BRUNE
The importance of both the finite shear modulus G of a flexible sphere [134,135] and the interfacial tension between the dispersed spheres and the dispersingfluid [112, 136] as sources of the viscoelastic behavior of dispersions of flexiblespheres has been established. It has also been shown, by experiments on oil-in-water emulsions [137], that there exists a critical volume fraction at which theviscosity approaches infinity, similar to solid-in-liquid dispersions.
The calculation of the intrinsic viscosity of a dispersion of spherical dropletsis a classical hydrodynamic result credited to Taylor [138]. Frankel and Acrivos[139] have elaborated on the theory of the hydrodynamics of dilute emulsions.The intrinsic viscosity of a spherical droplet is given by Eq. 18, where zη ≡η(droplet)/η(dispersing fluid) is the relative viscosity of the dispersed particle.
[η(droplet)] = 1 + (3zη/2)(1 + zη)
undeformable spherical droplet (18)
The derivation of this equation assumes that the droplet is undeformable so that[η(droplet)] is always greater than zero. Equation 18 reduces to the hard-spherevalue of 2.5 for highly viscous droplets (zη → ∞) and to 1 (as originally derivedby Taylor [140] in his studies on foam rheology) in the case of a gas bubble ina viscous liquid where zη → 0. Many experimental observations confirm Eq. 18for dilute droplet dispersions [1, 141], but deviations are observed for very smalldroplets and also when surfactants are present [142, 143]. Deviations shouldalso be expected when the interfacial tension becomes small (near the criticalpoint and with surfactant emulsions) and the droplets become readily deform-able by even very small shear fields. We expect that these values of [η] forundeformable spherical droplets are minimal for any object having a fixed shapeand zη.
Some insight into the effects of particle deformation can be obtained from thecorresponding calculation of [η(droplet)] for droplets with an ideally deformablesurface [9]. The intrinsic viscosity of a deformable droplet is given by Eq. 19,which still recovers the hard sphere value of 2.5 at zη → ∞, but shows thatη(dispersion) becomes reduced relative to the viscosity of the dispersing liquidwhen the droplet viscosity is lower than the viscosity of the dispersing fluid.
[η(droplet)] =(zη − 1)
[1 + (2/5)?(zη − 1)]freely deformable liquid droplet (19)
We also compare the influence of particle deformability on the shear modulusG to η of a particle dispersion. The effect of the deformable droplets onη(dispersion) is equivalent to the modification of G(dispersion) for which thefirst virial coefficient for the shear modulus G of incompressible materials is
Downloaded At: 12:45 19 January 2011

ORDER REPRINTS
VISCOSITY OF PARTICLE DISPERSIONS 615
given by Eq. 20 [8], with the relative shear modulus of the dispersed particlebeing equal to zG ≡ G(elastic particle)/G(matrix).
[G] = (zG − 1)[1 + (2/5)?(zG − 1)]
deformable elastic droplet (20)
Intuition suggests, and Eqs. 19 and 20 confirm and quantify, that adding“soft” materials (lower η or G) to a dispersing medium softens the medium asa whole (lowers its η or G). Equation 18 indicates that, if the inclusions arenondeformable, then η(dispersion) generally increases. A similar effect occursin the elastic case. Imagine the contrasting effects of putting holes in a rubbersheet and of introducing metal grommets. G is reduced in one case, while it canbe increased substantially in the other. These simple considerations suggest thatit should be possible to increase the viscosities and moduli of filled polymerssubstantially by simply introducting air in the presence of a surfactant, whichintroduces rigidity to the matrix-air boundary [144, 145]. We also expect thatthe addition of salt can substantially affect the rigidity of exfoliated mica “sheetpolymers” in solution in a fashion similar to polyelectrolytes in solution. Thiseffect would modify the reinforcing properties of these particles. We can alsoobtain some qualitative understanding of the effects of particle deformability onthe reinforcing effect of fluid and elastic fillers in fluid and elastic matrices,respectively, from these model calculations. These calculations are useful inunderstanding the general tendency for η(dispersion) and G(dispersion) to dropat higher Φ values of even relatively rigid particles since the particle aggregatesthat arise inevitably in these systems become “deformable” under shear flow orelastic deformation.
It is apparent from Eqs. 19 and 20 that the η(relative) and G(relative) ofdilute dispersions of flexible spheres are equal provided that the boundaries ofthe spheres are freely deformable. Similar results for these properties shouldalso obtain for ideally rigid boundaries, so that it is tempting to use η and Ginterchangeably in our theoretical modeling. It is well established that the η(rel-ative) and G(relative) of hard-sphere dispersions are equal [37, 48], assumingan incompressible medium. Then, it is reasonable to suppose this type of relationwill hold for general volume fractions and particles of general shape. This as-sumption is supported somewhat by the empirical Cox-Merz rule [146], whichindicates that the frequency dependence of the shear modulus and the shear ratedependence of the viscosity of viscoelastic materials often have a similar form.We develop this elastostatic-hydrodynamic analogy further in the next sectionafter making a few cautionary comments about how these results should beinterpreted.
An elastic solid is defined by the condition G > 0. This statement applies tosystems in thermodynamic equilibrium, but we can generalize this concept to
Downloaded At: 12:45 19 January 2011

ORDER REPRINTS
616 BICERANO, DOUGLAS, AND BRUNE
the common situation of materials that are out of equilibrium. All polymershave some resistance to shear under ordinary processing conditions, and thisresistance can be quite persistent. Even if a fluid is in equilibrium at some stage,there are variations in stress associated with the fluid relaxation processes, sothat the apparent G depends on the processing rate. For a constant processingrate, however, it is usual to discuss relative values of the material “shear rigid-ity” G (i.e., shear relaxation modulus at fixed shear rate) in fluids that flowslowly. We can formally apply theoretical results for describing G in elasticsolids to describe this transient behavior. For example, as discussed by Bicerano[14], glassy amorphous polymers have G , 103 MPa, while rubbery amorphouspolymers have G , 1 MPa at equilibrium. Substantial variations occur aroundthese orders of magnitude as a function of the polymeric structure and averagemolecular weight. However, even at the inception of the “terminal zone,” afinite G , 10−3 MPa usually remains over the timescale of a typical fabricationprocess. This use of G for fluids a well as solids is clearly based on engineeringexpediency.
8.3. Dilute Dispersions of Flexible AnisotropicParticles of General Shape
The development of an expression for [η] for flexible particles of generalshape is facilitated by considering the mathematically closely related problemof the conductivity σ of a dispersion of particles of arbitrary shape and conduc-tivity σ(dispersed particle) in a matrix of conductivity σ0 = σ(matrix). First, con-sider the simpler case of a spherical particle. The intrinsic conductivity virialcoefficient [σ] is given by Eq. 21, for which the relative conductivity of thedispersed particle equals zσ ≡ σ(dispersed particle)/σ(matrix).
[σ] = (zσ − 1)[1 + (zσ − 1)/3]
(21)
Equation 21 [8], which Maxwell originated, is written in a notation that makesthe correspondence with Eqs. 19 and 20 evident. Thus, we make the generalobservation that adding a soft particle to a viscous fluid or hard matrix is quitesimilar to adding insulating particles (i.e., particles with a small σ) to a conduc-tive matrix. This analogy between conductivity and viscosity was discussedabove in the deduction of the master curve for the viscosity of dispersions ofrigid particles. The advantage of this analogy for the present discussion is thataccurate approximants of essentially the same form have been developed [147]for (1) [σ] for arbitrary shaped particles for which zσ is also arbitrary and (2) Gfor arbitrary shaped particles, arbitrary zG (see Eq. 20), and Poisson’s ratio. It is
Downloaded At: 12:45 19 January 2011

ORDER REPRINTS
VISCOSITY OF PARTICLE DISPERSIONS 617
possible, then, to state a fairly reasonable approximation for [η] for deformableparticles using these established results.
The intrinsic shear modulus [G] of arbitrary-shaped particles dispersed in anincompressible medium is described well by the approximant given in Eq. 22[147], where f is given by Eq. 23, [G]∞ is the intrinsic shear modulus for per-fectly rigid particle inclusions (zG → ∞), and [G]0 is the intrinsic shear modulusfor perfectly deformable particles.
[G] < [G]∞?(zG − 1)2 + f?(zG − 1)(zG − 1)2 + {[G]∞ + (2f/5)}?(zG − 1) + f
(22)
f = [G]∞ − [G]0 + [G]∞?[G]0
1 + 3[G]0 /5(23)
As for the [σ] of insulating particles, [G] for highly extended deformableparticles is rather insensitive to particle shape [8, 147]. The exact value of [G]0
for a sphere equals −5/3 and only changes to −28/15 in the extreme case ofneedle-shaped flexible inclusions. The average value [G]0 < 53/30 should pro-vide a good approximation for deformable particles of modest anisotropy. Thisapproximant is not reliable for extended flat particles, for which [G]0 has agreater variation [147]. Note that f → ∞ in Eq. 23 in the sphere limit, so thatEq. 22 then reduces to the exact result given by Eq. 20. Our approximant for[η] for deformable particles involves simply replacing G by η in Eq. 22, arelation that holds exactly for spherical inclusions in an incompressible matrix.Bounds relating conductivity σ and elastic modulus G for general filler concen-trations have been discussed rigorously [148], and the electrostatic-elastostaticanalogy between G and σ has been employed widely in engineering applicationsinvolving inhomogeneous materials [149–151]. The relation between G and σis certainly not exact as sometimes implied, but the correspondence is oftenfound to be sufficiently strong to make many useful qualitative predictions forthe properties of filled materials.
Figure 19 shows that predictions based on Eq. 22 are reasonable:
1. As zη increases, [η] increases monotonically.2. We obtain [η] → −5/3 independently of Af in the limit of highly elon-
gated deformable low-viscosity particles. Even if one were somehowable to inject a highly anisotropic gas bubble into a fluid, the thermody-namic drive to minimize the interfacial area would result in the rapidconversion of this bubble into a nearly undeformable spherical shape.These reductions of η with deformable particle inclusions should not bemet often in practice, but the reduced enhancement of the viscosity fordeformable particles of high Af should be robust.
Downloaded At: 12:45 19 January 2011

ORDER REPRINTS
618 BICERANO, DOUGLAS, AND BRUNE
FIG. 19. Intrinsic viscosity [η] for anisotropic fluid particles. Estimate of [η] as afunction of dispersed particle viscosity relative to droplet viscosity, zη = η(dispersed par-ticles)/η(dispersing fluid), for ellipsoidal particles with biaxial symmetry. Curves arelabeled by the values of Af. The inset shows the more gradual zη dependence for lowervalues of the particle asymmetry Af.
3. At any fixed zη, the [η] values retain the same ordering as a functionof Af.
4. Since 1/[η(rigid particle)] decreases with increasing anisotropy, [η]shows a larger zη variation with increasing anisotropy.
8.4. Observations on Flexible Particle Dispersions
Nawab and Mason [152] measured the viscosity of dilute dispersions ofthreadlike (flexible solid) regenerated cellulose (rayon) fibers. They showed that[η] is sensitive to a mean particle orientation factor, just like the [η] of rigid
Downloaded At: 12:45 19 January 2011

ORDER REPRINTS
VISCOSITY OF PARTICLE DISPERSIONS 619
anisotropic particles. There was, however, a qualitative difference for rigid fi-bers of equal Af in that the mean orientation factor of the flexible rayon fiberswas sensitive to the permanent and recoverable deformation of the fibers by theshear gradient. Dispersions with Af > 113 also showed the Weissenberg effect,which is defined as the liquid climbing up the inner cylinder of the Couetterheometer on application of shear. It was also observed that [η] decreased withdecreasing Af, but that it increased (rather than decreasing as expected) on theplasticization of the fibers of high Af by absorbing water.
Eirich and Sverak [153] also measured the effects of the swelling and flexi-bility of rayon fibers on the viscosity of dilute dispersions; they used severalcriteria in softening the fibers. They required that (1) the fiber length shouldchange as little as possible; (2) the boundaries should remain sharp; (3) thesoftened fibers must not stick, fuse with each other, or break up easily; and (4)the softness ought to be such as to allow the fiber to bend readily if held at oneend and subjected to a shear rate of about 10 s−1. They were able to swell thefibers by up to a factor of 25 relative to their original volume. Such swellingreduced Af by a factor of up to 25 since the fiber length essentially remainedconstant, while softening the fibers parallel to the amount of swelling in a fairlyregular and reproducible extent. They found that η(relative) increased with in-creasing Af for the rigid fibers. It also invariably decreased with greater swelling,which simultaneously reduced Af and increased flexibility (making the deconvo-lution of the relative magnitudes of these two effects difficult). There was nonoticeable stretching of the swollen coil-like fibers at the shear rates of 10 to40 s−1 that were used. While some internal movement of the swollen flexiblefibers was observed, overall fiber orientation (which was very marked with therigid fibers) was absent in the swollen flexible fibers.
Zia, Cox, and Mason [154] considered ordered aggregates of rigid spheres,disks, and rods in planar Couette flow as simple physical model systems (forwhich the experimental data could be analyzed in a straightforward manner) ofthreads, aggregate of disk-shaped red blood cells, and other flexible particles.They found that chains of spheres formed in an electric field behaved like rigidrods at low shear gradients, but broke up at high gradients, possibly from cavita-tion of the liquid between the spheres. On the other hand, chains of spheres heldtogether by liquid menisci behaved like flexible threads and formed disorderedaggregates at high gradients. Symmetrical (but nonlinear) aggregates of spheresrotated like single spheres at low shear gradients. Aggregates of disks behavedlike deformable rods and were easily broken as the disks slid apart.
Forgacs and coworkers [155, 156] studied the flexibility of cylindrical woodpulp fibers by subjecting dilute dispersions to laminar shear and observing theorbits of rotation. They found that the orbits are related to the ability of thefibers to deform under the stresses generated by the liquid. The fibers of greatestrigidity only underwent the types of rigid rotations predicted in Jeffery’s classic
Downloaded At: 12:45 19 January 2011

ORDER REPRINTS
620 BICERANO, DOUGLAS, AND BRUNE
paper [157]. However, three other types of orbits appeared [158], in the follow-ing order, as fibers of increasing flexibility were considered: springy rotation,flexible rotation, and complex orbits. Some fibers also exhibited a fifth type oforbit, described as a jointed fiber orbit and attributed to the localized fractureof the cell wall. Forgacs and Mason indicated that the shear stress τ determinesthe types of orbits that are observed. For example, they proposed based, ontheoretical considerations [158], that if E denotes the flexural modulus (equalto Young’s modulus when a fiber has ideal isotropic elasticity), then the pre-dominant type of fiber orbit will change from rigid rotation to springy rotationat a critical value τc that is roughly proportional to E/Af
4. Note that their proposalincorporates, correctly, the three key factors that affect the flexural rigidity ofan anisotropic particle in a flow field. The inherent flexural rigidity increasesinherent stiffness (E) and decreases very rapidly with increasing anisotropy (Af).For example, if Af is increased 10-fold, the critical shear stress would onlyremain unchanged if E is increased 10000-fold. The apparent flexural rigidity(whether a particle of given inherent flexural rigidity will actually behave likea rigid particle) also depends on the third important factor, namely, the magni-tude of the applied shear stress. While there was no theory to predict the τc
values for the onset of flexible particle rotations and complex orbits, the authorsalso suggested that, by analogy, τc should exist for these higher orbit transitions.
8.5. An Idealized Model for Concentrated Dispersionsof Flexible Particles
Let us define a flexible solid particle as a flexible dispersed particle thatretains its structural integrity (does not undergo breakup into smaller particlesor coalescence into larger particles) under flow. We consider next how flexibil-ity alters η(dispersion). The aim here is to develop a working expression forestimating the viscosity of clay dispersions. This application is considered inSection 9.
As discussed above, the viscosity of dispersions of solid particles of consider-able flexibility (such as exfoliated clay platelets and fibers of xanthan gum) canbe modeled reasonbly by neglecting the flexibity of the particles. The relativelysmall deviations between the calculated and observed results are consistent indirection with the errors expected from the neglect of flexibility. These results,as well as the universality of Eq. 5 that allows it to represent the effects ofmany factors on η(relative) as we showed above, lead us to propose (with someexperimental support) that Eq. 5 should be used to estimate η(relative) over 0≤ Φ ≤ Φ* for dispersions of solid particles that are somewhat (but not exceed-ingly) flexible. To follow this procedure and obtain results of high accuracy,Φ* must be increased by the appropriate amount to account for the greaterpacking efficiency of flexible particles of a given shape. A model is presented
Downloaded At: 12:45 19 January 2011

ORDER REPRINTS
VISCOSITY OF PARTICLE DISPERSIONS 621
to accomplish this task. It is validated below by comparing its predictions withthe experimental data of Krishnamoorti, Vaia, and Giannelis [113]. It should benoted, incidentally, that the data of these authors for poly(dimethyl siloxane) atT = 301K were used as the pure dispersing fluid viscosity in all illustrative ex-amples for a polymer melt shown in Figs. 13 to 17.
It is expected that allowing particles to flex should increase Φm, so that η(rel-ative) is reduced in comparison to rigid particles. The magnitude of this effectshould decrease with increasing γ since flexibility should not affect Φocp nearlyas much as it may affect Φm0. We do not anticipate such a large effect of particledeformability on Φocp. We introduce the following hypotheses:
1. The effects of flexibility can be described completely by making Φm0 afunction of flexibility, calculated so that as γ → ∞ the flexibility effectsvanish in the same manner as Φ* → Φocp.
2. The effects of flexibility on Φm0 for a concentrated dispersion can bepredicted from the effects on the [η]0 of a dilute dispersion.
3. The results summarized by Bird et al. [159], based on “three-bead, two-rod” model, for the ratio of the [η]0 values of flexible and rigid polymerchains can be utilized as a primitive model of flexible particles.
It should be evident that our modeling is highly idealized, but we expect thismodel to represent the essential features of real flexible particle dispersions.With these three basic assumptions, we obtain Eq. 24, where P is a flexibilityparameter ranging from 0 in the limit of infinite rigidity to 1 in the limit ofcomplete flexibility:
Φ*flex
Φ*inflex
< [η]inflex
[η]flex
< S 1 − P3 D−1
(24)
For polymer solutions, P = 0 describes true rigid-rod polymer chains, P = 1 de-scribes freely jointed chains, and P is calculated using Eq. 25, where KB is thebending energy:
P = kBT/KB polymer solutions (25)
Readers interested in the assumptions underlying the derivation of Eqs. 24 and25 should consult Section 16.4 of Bird et al. [159]. Below, we apply the modelformally to dispersions of flexible particles generally.
For dispersions of biaxially symmetric particles, P = 0 describes infinitelyrigid particles, and P = 1 describes completely flexible particles. P can be esti-mated based on the theory of beam deflection (as discussed below in detail)using Eq. 26, where L is the length of the longest axis of the particle, and r isthe minimum radius of curvature of the particles in the dispersion.
Downloaded At: 12:45 19 January 2011

ORDER REPRINTS
622 BICERANO, DOUGLAS, AND BRUNE
P = (L/r)[1 + (L/r)]
dispersions of biaxially symmetric particles (26)
The radius of curvature in Eq. 26 can be determined by simply matchingcircular regions of calibrated dimensions with the particle contours in opticalmicrographs of the particles. This procedure is illustrated schematically in Fig.20 for the case of a clay dispersion. Using the lateral dimension of a plateletdivided by its thickness as their definition of Af, Krishnamoorti et al. [113]indicated that the platelets in their exfoliated samples had 100 ≤ Af ≤ 1000. Withour definition of Af, we used their electron micrographs to measure r for exfoli-ated cylindrical platelets, assuming monodisperse platelets of Af = (1/100) = 0.01for simplicity. These platelets had a thickness of about 1 nm, so that Af = 0.01implied that their diameter L was 100 nm. We measured r < 225 nm from themicrographs, so Eq. 26 gave P < 0.31.
More generally, if the particles are assumed to flex as monolithic beams, itcan be shown (see the Appendix) that (L/r) , (A 3
f/E), where E is Young’s modu-
FIG. 20. Schematic image of method for estimating particle radius of curvaturefrom optical micrographs. The minimum observed radius of curvature r of filler particles(curved lines in figure) can be estimated readily from micrographs by matching circlesof calibrated size with the contours of the particle image. The estimates of the dispersionviscosity given in Section 9.3 utilize the theoretical model developed therein to accountfor the effects of particle flexibility on the dispersion viscosity, along with this techniquefor estimating r.
Downloaded At: 12:45 19 January 2011
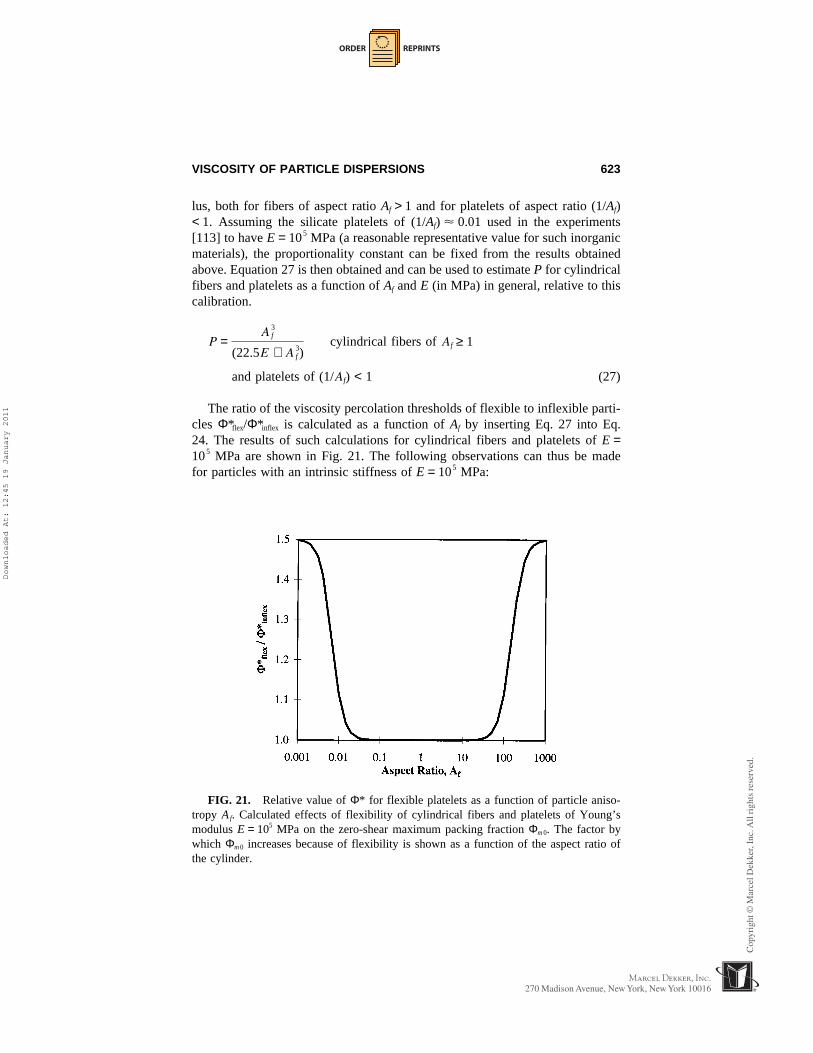
ORDER REPRINTS
VISCOSITY OF PARTICLE DISPERSIONS 623
lus, both for fibers of aspect ratio Af > 1 and for platelets of aspect ratio (1/Af)< 1. Assuming the silicate platelets of (1/Af) < 0.01 used in the experiments[113] to have E = 105 MPa (a reasonable representative value for such inorganicmaterials), the proportionality constant can be fixed from the results obtainedabove. Equation 27 is then obtained and can be used to estimate P for cylindricalfibers and platelets as a function of Af and E (in MPa) in general, relative to thiscalibration.
P =A
3f
(22.5E + A 3f )
cylindrical fibers of Af ≥ 1
and platelets of (1/Af) < 1 (27)
The ratio of the viscosity percolation thresholds of flexible to inflexible parti-cles Φ*flex/Φ*inflex is calculated as a function of Af by inserting Eq. 27 into Eq.24. The results of such calculations for cylindrical fibers and platelets of E =105 MPa are shown in Fig. 21. The following observations can thus be madefor particles with an intrinsic stiffness of E = 105 MPa:
FIG. 21. Relative value of Φ* for flexible platelets as a function of particle aniso-tropy Af. Calculated effects of flexibility of cylindrical fibers and platelets of Young’smodulus E = 105 MPa on the zero-shear maximum packing fraction Φm 0. The factor bywhich Φm 0 increases because of flexibility is shown as a function of the aspect ratio ofthe cylinder.
Downloaded At: 12:45 19 January 2011

ORDER REPRINTS
624 BICERANO, DOUGLAS, AND BRUNE
1. Φm0 does not begin to increase in a visible manner until Af ≥ 30 or (1/Af)≤ (1/30).
2. At Af = 1000 or (1/Af) = 0.001, P is so close to its limit of 1 for com-pletely flexible particles that Φm0 has almost reached its upper limit of1.5 times its value for infinitely rigid particles. Cylindrical silicate fibersof Af ≥ 1000 and platelets of (1/Af) ≤ 0.001, therefore, are expected tobehave like totally flexible “ropes” or “sheets” rather than like rigid“needles” or “plates.”
3. Since Eq. 27 contains the anisotropy effects in terms of the form A 3f,
while the intrinsic stiffness only enters in a term proportional to E, thisconclusion remains valid even if the platelets are assumed to be of fargreater stiffness. For example, at Af = 1000 or (1/Af) = 0.001, (Φ*flex/Φ*inflex) < 1.50 for both E = 105 MPa and E = 2?105 MPa.
The results of calculations using our complete model for the viscosity ofsolid particles in a polymeric fluid (including the effects of particle flexibility)are presented in Section 9.
8.6. Concentrated Dispersions of Liquids and Gases
The breakup of dispersed domains, droplet distortion, co-continuity of twoor more liquid phases, occlusion of subdomains of one phase in domains ofanother, phase inversion, and distinct maxima or minima (rather than a simplemonotonic change) as a function of Φ because of the presence of “specificinteractions” are often important in the rheology of liquid-in-liquid dispersions[124–133, 160–172]. Although data for the η(relative) of emulsions can some-times be represented by scaling relationships of the same form as for dispersionsof solids after appropriate adjustment of Φ* [44], the ability to predict the vis-cosities of liquids or gases dispersed in liquids is very limited. In the absenceof good theories, the existing expressions are often based on simple heuristic“rules of mixture.” Additional research is needed to address these fundamentalmaterials science problems.
In recent years, the frontiers of such research have moved toward the devel-opment of computationally intensive mesoscale simulation software based onmethods such as dynamic density functional theory [173], dissipative particledynamics [174], and lattice Boltzmann theory [175, 176]. While these simula-tion techniques currently leave out many of the pertinent aspects of the physicsof liquid-in-liquid dispersions and hence are not yet ready for routine use astools for quantitatively predictive rheological modeling, they may be improvedsufficiently over the next decade to become adequate for such use.
Downloaded At: 12:45 19 January 2011

ORDER REPRINTS
VISCOSITY OF PARTICLE DISPERSIONS 625
9. CLAY MINERAL DISPERSIONS IN POLYMERS
9.1. Introduction to Clay Minerals
Clay minerals [66, 177, 178], such as layered aluminosilicates and magne-sium silicates, are abundant in nature and hence currently are among the mostwidely used inexpensive sources of platelet-type fillers. In a study of such natu-ral materials, Hornby, Schwartz, and Hudson [179], in work on complex porousmedia composed of interpenetrating connected fluid and clay phases, estimatedthe clay platelet orientation distribution in a specimen from a digitized scanningelectron micrograph of model shales, they showed preference for horizontal ori-entation with the vast majority of the platelets at an angle between −45° and+45° to the horizontal in a roughly normal distribution. See Street [180] andObiakor and Whitmore [181] for interesting early rheological results on claydispersions.
The structures and properties of clays, and especially the interlayer forces inthem, are obviously relevant to both the dispersion of platelets in a matrix mate-rial and the flow of these dispersions. An article by Giese [182] on the calcula-tion of electrostatic interlayer forces in clays, and a review article by Bleam[183], are good starting points in considering these factors at a theoretical and/or computational level. In recent years, great increases in the speed and memorycapabilities of computer hardware, and major advances in molecular modelingsoftware, have rendered the very detailed atomistic simulation of these factorsfeasible.
9.2. Dispersion of Clay Minerals in Polymer Matrices
The reinforcing effects of fillers increase stongly with increasing anisotropyof filler shape, even within the context of traditional composite micromechanics[184–187], in which the filler is assumed to be dispersed in a matrix polymer,but does not modify the inherent properties of the matrix polymer itself. Theseeffects can be dramatic, and they suggest that the thermoelastic properties ofthe matrix polymer are being modified by the presence of the filler for fillers ofgreat anisotropy. Such synergistic effects involve processes such as the orienta-tion and/or crystallization of polymer chains as a result of their confinementbetween adjacent platelets [188, 189] or the formation of strongly interactingand/or percolating microfibrillar networks [5, 6, 190]. Consequently, there is asignificant experimental research effort to achieve high levels of dispersion ofplatelets of high Af in polymer fluids via “exfoliation” [188, 189, 191, 192].
The statistical mechanics of fluids of anisotropic particle dispersions providesome insight into the equilibrium properties of these systems. Onsager [193]showed that a distribution of platelets has an intrinsic tendency toward becom-
Downloaded At: 12:45 19 January 2011

ORDER REPRINTS
626 BICERANO, DOUGLAS, AND BRUNE
ing ordered (aligned) spontaneously with increasing Af and Φ as a result ofgeometrical (packing) constraints. This tendency is distinct from any additionalextrinsic alignment that can be induced by imposing shear. He also suggestedthat the effect of long-range interactions can be accounted for by varying theeffective size of the particles to include the screening length of these interac-tions. This effect generally reduces the effective volume fractions defining thedilute, semidilute, and concentrated regimes.
In a recent attempt to model the intrinsic alignment tendency, DiMarzio,Yang, and Glotzer [194] showed how entropic factors are sufficient to expect aphase transition from a three-dimensionally isotropic distribution of platelets toone that is highly ordered. This phenomenon is similar to the well-known liquidcrystalline (isotropic to nematic) transition in rigid rod dispersions, which isalso expected to occur even in the absence of attractive interparticle interactions[195], but that must be modified when interaction energies are taken into ac-count [196]. Working with platelets of square cross section (for which theydefined Af as the side length divided by the thickness), they [194] showed that,for Af < 3.55, one expects the distribution always to be isotropic. For Af > 3.55,at a given value of Af the dispersion is isotropic for Φ ≤ Φc1, where Φc1 is alower critical volume fraction. There is a mixture of the isotropic and orderedphases for Φc1 < Φ < Φc2, where Φc2 is an upper critical volume fraction and onlythe ordered phase for Φ ≥ Φc2. Defining Φr as the volume fraction at whichequal amounts of the isotropic and ordered phases are expected (i.e., the simpleaverage of Φc1 and Φc2 according to the “lever rule”), they found that Φr < 3.55/Af, and a similar variation of Φm with particle aspect ratio is found in rods. Thisscaling is also very similar to the scaling of the pc of oblate ellipsoids, for whichpc < 1.276/Af in the limit of large platelet asymmetry (as seen by inserting Af →0 into Eq. 6, which uses a different notation). The concentration Φr is a factorof about 3 larger than pc for slender plates, and this ratio is about 6 for slenderrods. Despite this factor, the Φ range is relevant to experiments on plateletdispersions. For example, Φr < 0.0355 if Af = 100, and Φr < 0.01 if Af = 355.
Vaia and Giannelis [197] developed a mean-field model by modifying theFlory-Huggins lattice theory of polymer-monomer mixtures to treat polymermelt intercalation in organically modified layered silicates. They showed howthe interplay of entropic and energetic factors, as reflected in the free energy,determines which one of the three possible types of thermodynamic equilibriumstates (immiscible, intercalated, or exfoliated) will be favored. In particular, theyshowed that the entropic penalty for polymer confinement may be compensatedfor by the increased conformational freedom of the surfactant chain as the layersseparate. When the total entropy change is small, small changes in the internalenergy of the system determine if intercalation is thermodynamically favored.Exfoliation (complete layer separation) depends on the establishment of favor-able interactions between the polymer chains and the organically modified lay-
Downloaded At: 12:45 19 January 2011

ORDER REPRINTS
VISCOSITY OF PARTICLE DISPERSIONS 627
ered silicate to overcome the entropic penalty of polymer confinement. Vaiaand Giannelis then compared the predictions of the model with their experi-mental results [198] on the effects of silicate functionalization, annealing tem-perature, polymer molecular weight, and constituent interactions or melt in-tercalation of polystyrene, poly(3-bromostyrene), poly(vinyl cyclohexane), andpoly(2-vinylpyridine). They showed that the predictions of the mean-field modelaccord reasonably well with experimental predictions and established some gen-eral guidelines for selecting potentially compatible combinations of polymersand organically modified layered silicates.
9.3. Viscosity of Dispersions of Clay Plateletsin Polymer Matrices
As stated above, well-tested closed-form expressions can provide first-orderestimates of the dispersion viscosity. Such estimates are often all that is neededfor engineering applications. However, the detailed treatment of the flow ofplatelet dispersions in all of its complexities will require large-scale simulationsthat incorporate the correct physical description of the system. Such an attemptwas made recently to model the effects of particle size, shape, internal flexibil-ity, and concentration on the flow of platelet dispersions by coarse-grained mo-lecular dynamics simulations, considering both intraparticle and interparticle hy-drodynamic interactions [115]. The calculated orbits for the motion of anisolated rigid symmetrical platelet agreed with the classic solution of Jeffery[157], leading to confidence in the detailed and complex simulation results onthe effects of the asymmetry, flexibility, and volume fraction of platelets. Forsimple shear flow of a concentrated dispersion of platelets with a square crosssection, planar orientation of the platelets was induced in the microstructure.For simple shear flow of platelike particles of rectangular cross section withunequal side lengths of the rectangle (and hence a shape that is intermediatebetween a platelet and a fiber), the major axis of the particles preferentiallyoriented in the shear direction. The simulations also showed how a platelet withsome internal flexibility may deform while undergoing shear flow.
It should also be noted that, as discussed a long time ago by Krieger andDougherty (as well as by others) in the context of dispersions of hard spheres[199], the most important source of shear thinning in clay dispersions is oftenthe breakdown of the clumps and stacks of platelets rather than platelet orienta-tion. Additional characterization (especially scattering data) are needed on suchsystems to assess the relative importance of this type of shear thinning.
Krishnamoorti et al. [113, 114] studied some important effects on plateletdispersion viscosity, and we have used their data as a test case to validate ourdispersion viscosity model. Their experimental observations and the results ofour calculations are now summarized:
Downloaded At: 12:45 19 January 2011

ORDER REPRINTS
628 BICERANO, DOUGLAS, AND BRUNE
1. Materials with polymer chains intercalated between inorganic plateletsmanifested shear thinning even at the lowest γ that they explored and thus didnot reach a Newtonian regime.
2. Materials with platelets exfoliated and dispersed in a polymer matrixmanifested Newtonian viscosity at low γ (with η0 increasing monotonically withfiller weight fraction), followed by shear thinning of magnitude comparable tothat of the polymer, but starting at a slightly lower γ. All of these trends aretypical of conventional filled polymers and are consistent with Eq. 5. Most ofthe shear thinning manifested by η(dispersion) originates from the effect ofshear on η(polymer). A small amount of additional shear thinning originatesfrom an increase of Φ* with increasing γ. Contrary to the conventional physicalpicture of a rigid filler dispersed in a polymer matrix, exfoliated platelets ofabout 1 nm thickness and 103 to 104 nm lateral dimensions were rather flexibleand behaved mechanically more like flexible sheets of paper than like rigidplates. This low flexural rigidity of platelets of high modulus arises from thelarge bending moments induced by the very anisotropic geometry.
3. Grafting polymer chains onto the platelets strengthens matrix-filler adhe-sion. This effect manifested itself in the shear viscosity of materials in whichpolymer chains were end-tethered to highly anisotropic exfoliated silicate plate-lets, which differed significantly from that of the ordinary exfoliated systems. Itmanifested features reminiscent of block copolymers with lamellar ordering andsmectic liquid crystals of small molecules. These features were interpreted bythe possible presence, in the end-tethered materials, of a layered long-rangedomain structure. In such a structure, “grains” in which the silicate layers areoriented in a preferred direction exist, introducing grain boundaries and thusincorporating defects.
4. The data shown in the first paper [113] for exfoliated platelet dispersionsin poly(dimethyl siloxane) were used to validate our model. The authors re-ported only the weight fractions of the platelets (0.06 and 0.13). Using about 1g/cm3 for polymer density and about 2.7 g/cm3 for platelet density, we estimatedΦ < 0.0231 at a weight fraction of 0.06 and Φ < 0.0524 at a weight fraction of0.13. The results depicted in Fig. 22 wer obtained using (1) the η(polymer)values shown in Figs. 13a, (2) Eq. 11 to calculate that θ < 0.0241 seconds, (3)Eq. 10 (with Φm0 < 0.242 obtained by combining Eqs. 6, 7, 8, 24, and 26, andwith Φocp < 0.907, as appropriate for these flexible cylindrical platelets of Af <0.01) to calculate Φm as a function of γ, and (4) Eq. 5 to calculate η(relative).The predictions of our model are in semiquantitative agreement with the experi-mental data. Most notably, the calculations do not involve any empiricism sincethey do not use any preexisting data for η(dispersion), as can be seen from thelist of the input parameters: T, γ, η(dispersing fluid, Φ, Af, L, and r. Figure 22also shows that, since the total shear thinning is a multiplicative superpositionof the shear thinning attributable to the polymeric fluid by itself and alignment
Downloaded At: 12:45 19 January 2011

ORDER REPRINTS
VISCOSITY OF PARTICLE DISPERSIONS 629
FIG. 22. Comparison between viscosity model and measurements for clays dis-persed in polymers. Viscosities observed as a function of shear rate by Krishnamoorti etal. [113] for a dispersion of exfoliated silicate platelets (weight fractions of 0.06 and0.13) in poly(dimethyl siloxane) at a temperature of T = 301K are indicated with sym-bols. Calculated results, assuming platelets to be monodisperse flexible cylinders withaspect ratio Af = (thickness/diameter) = 0.01, are indicated as lines: (a) relative viscosity= η(dispersion)/η(polymer); (b) dispersion viscosity, η(dispersion).
Downloaded At: 12:45 19 January 2011

ORDER REPRINTS
630 BICERANO, DOUGLAS, AND BRUNE
of the platelets, it is significantly greater than each of these separate effects.5. An interesting observation from the data is that, at very high shear rates,
η(dispersion) may fall below η(polymer), giving η(relative) < 1. It can be seenfrom Eq. 5 that our model can only give η(relative) ≥ 1. Hence, it is importantto consider the additional physical phenomena that may sometimes lower η(rela-tive) below 1. For example, one might imagine that the solid particles increasethe shear relaxation time θ of the fluid, causing an increased γ θ at a fixed γvalue. It is unlikely, however, that this shear thinning at lower shear rates wouldever be larger than the increase in viscosity from the presence of the filler.Another possibility, which needs to be evaluated, is that chain clustering associ-ated with entanglements may be diminished at high shear rates by the presenceof the filler, so that the filler “plasticizes” the entangled polymeric fluid.
In summary, the modeling of the viscosity of clay dispersions in a polymericdispersing fluid by Eq. 5 yields a good first approximation to the observedproperties of these materials. However, further measurements are needed to vali-date the modeling. It seems likely that some features not incorporated in thepresent model, such as the modification of chain entanglement phenomena be-cause of the presence of the filler, will be required for more quantitative estima-tion of dispersion properties. Our simple model of the viscosity of filled poly-mers should be useful in its present form, however, both in process design andin interpreting rheological measurements on these dispersions.
10. SUMMARY AND CONCLUSIONS
A simple unified model (based on the concepts of universality and scaling)for the shear viscosity η of dispersions was presented. Relevant earlier modelingefforts and experimental observations were reviewed in connection with thismodel.
Some general effects are indicated by our modeling. Filler anisotropy [in-creasing aspect ratio Af > 1 for fibers and decreasing (1/Af) < 1 for platelets] canlead to substantial increases in the fluid viscosity even in dilute solutions. Thiseffect is reflected in the rapid increase of the intrinsic viscosity [η] of particulatefillers with increasing anisotropy. Percolation phenomena at higher volume frac-tions Φ (reflected in the rapid decrease of the geometrical percolation thresholdpc and the viscosity percolation threshold Φ*) superimpose on this effect andfurther increase η. For particles that flocculate into fractal aggregates, there isstill a further increase in η when Φ is not too high. The inherent tendencytoward alignment of anisotropic particles, especially when augmented by shear,can mitigate these effects to some extent.
Downloaded At: 12:45 19 January 2011

ORDER REPRINTS
VISCOSITY OF PARTICLE DISPERSIONS 631
The key relationship of our model is Eq. 5, which expresses η(dispersion)relative to η(dispersing fluid) for particles of general shape. Equation 5 incorpo-rates the effects of particle volume fraction, shape, polydispersity, fractal aggre-gation, and flexibility; dispersing fluid viscosity; and shear rate and temperatureon the dispersion viscosity. Much consideration revolves around determiningthe viscosity percolation threshold Φ*, which is the volume fraction at whichthe viscosity approaches infinity.
The value of Φ* seems to be correlated with the geometrical percolationthreshold pc, and it is suggested that Φ* is a rigidity percolation threshold. Thevolume fraction at random close packing Φm is identified with Φ*. As particleasymmetry increases, both Φm and pc decrease rapidly. We obtain first estimatesof the limiting conditions for the processability of dispersions of filler particleshaving general shapes by assuming a proportional relation between Φm and pc
for ellipsoids of revolution. Shear-thinning and yielding effects are modeledthrough phenomenological arguments for how Φ* is modified under shear. Frac-tal aggregation and particle flexibility effects on η(dispersion) are estimated byconsidering how the intrinsic viscosity is modified with particle aggregates andin dispersion of flexible particles.
Our model for η(dispersion) is developed entirely in terms of experimentallyaccessible parameters, and its use does not require the existence of data onη(dispersion). Consequently, this model is both fundamental and predictive. Thefollowing are its parameters:
1. The flow conditions, as described by the temperature and the shear rate.2. The shear viscosity of the pure dispersing fluid, as described by its vis-
cosity under specified flow conditions. If this fluid is a polymer meltand its viscosity under the flow conditions of interest has not been mea-sured, it can be estimated roughly as described by Bicerano [14].
3. The amount of dispersed particles, as described by their volume fraction Φ.4. The morphology of the dispersed particles, as described by the aspect
ratio, length of longest axis, and minimum radius of the curvature in-duced by flexibility.
In conclusion, we have developed a simple predictive model for the shearviscosities of dispersions. This model is based on the concepts of universalityand scaling. Its implementation relies on a combination of mathematical argu-ments and phenomenological observations. It is a pragmatic model that willundoubtedly require future refinements and revisions, as discussed in the nextsection, which describes the remaining challenges. We are confident, however,that it should provide a good starting point for determining the conditions ofuseful processing in filled polymer liquids when the dispersed particles arehighly anisotropic.
Downloaded At: 12:45 19 January 2011

ORDER REPRINTS
632 BICERANO, DOUGLAS, AND BRUNE
11. REMAINING CHALLENGES
Refinements of our model for the shear viscosity of dispersions of solids inliquids will require improvements in the prediction of Φ*. A reliable methodfor obtaining Φ* by simulations for particles of general shape should hence besought. In particular, our prediction of Φ* for platelets needs to be validated bysimulations and/or measurements. Simulations may turn out to be especiallyuseful for platelets as it is more difficult to generate truly random equilibriumpackings of platelets experimentally than it is for fibers. Furthermore, our esti-mates of shear-thinning effects, yield stress, fractal aggregation, and particleflexibility effects need to be investigated by simulations and further experimentsto validate our often heuristic modeling.
The following additional topics, which fell outside the scope of this manu-script, are also important in developing general rheological models of greaterpredictive power for disperions:
1. Prediction of dispersion microstructure from fundamental thermody-namic and/or atomistic considerations so that such information can befed into the rheological model.
2. Prediction of extensional viscosity, which can sometimes be even moreimportant than the shear viscosity. The development of a model for ex-tensional viscosity may be hampered by the scarcity of reliable experi-mental data (especially at high Φ values).
3. Prediction of time-dependent phenomena such as thixotropy and dila-tancy [99, 200–205]. A study of dispersions of black coal in oil as afunction of the storage (aging) time [206] shows that η(relative) can beexpressed as a function of (Φ/Φm) in such time-dependent dispersions aswell, provided that the time dependence of Φm can be predicted. Forexample, in the coal dispersions [206], Φm decreased aymptotically as afunction of time from an initial value to a lower limit, resulting in anincrease in η(relative) by a combination of diffusion of oil within thecoal and particle agglomeration. The challenge is to predict such kineticeffects.
APPENDIX: VARIATION OF PARTICLE RIGIDITYWITH PARTICLE PROPERTIES
Assume that the particles flex as monolithic beams. Then, as discussed instandard textbooks on mechanics (such as Higdon et al. [207]), the radius ofcurvature r of the particles at any point is given by Eq. 30 (which is valid forboth fibers an platelets), where E is Young’s modulus, I is the area moment ofthe particle cross-section, and M is the bending moment at the point.
Downloaded At: 12:45 19 January 2011

ORDER REPRINTS
VISCOSITY OF PARTICLE DISPERSIONS 633
r = EI/M (30)
To estimate the variation of r with particle geometry, we need to estimatehow I and M vary with the length L of the long dimension and the thickness tof the particle.
For cylindrical fibers of length L, I is proportional to t 4. If we assume thatbending is produced by constant surface tractions, M is proportional to L 2t.Combining these relations, inserting the aspect ratio Af = (L/t) and denoting theproportionality constant by α, we obtain Eq. 31.
L/r = αA 3f /E (31)
For cylindrical platelets of diameter L, I is proportional to Lt 3. If we againassume that bending is produced by constant surface tractions, M is proportionalto L 3. Combining these relations and defining the aspect ratio (<1 in our nota-tion) as (1/Af) = t/L, we obtain Eq. 31 again. The particle rigidity parameter Pis related to L/r through Eq. 26.
NOTATION
one of the two minor axes of an ellipsoid with biaxial symmetrya(a = b)
A parameter of “dispersion gel” yield stress model (see Eqs. 13 and14)
Af aspect ratiob one of the two minor axes of an ellipsoid with biaxial symmetry
(b = a)c major axis of an ellipsoid with biaxial symmetry (a = b; sphere if
c = a = b)c* “overlap concentration” of polymer solutions; denotes onset of semi-
dilute concentration regimed fractal dimensionDc collective diffusion coefficientDr diffusion coefficient for rotary Brownian motionE Young’s modulus or flexural modulusEη∞ activation energy for viscous flow, defined in the limits of γ → 0
and T → ∞f dimensionless constant defined by Eq. 23F particle shape factor in the definition of the reduced shear rate (Pe)G shear modulus[G] intrinsic shear modulus (leading virial coefficient of shear modulus)
Downloaded At: 12:45 19 January 2011

ORDER REPRINTS
634 BICERANO, DOUGLAS, AND BRUNE
[G]0 intrinsic shear modulus for perfectly deformable particles[G]∞ intrinsic shear modulus for perfectly rigid particlesI area moment of particle cross sectionJ compliancek a proportionality constantK a proportionality constantkB Boltzmann’s constantKB force constant for bendingkD leading virial coefficient of the collective diffusion coefficient Dc
kH Huggins coefficientL length of longest axis of a particleln natural logarithmm parameter of “dispersion gel” yield stress model (see Eqs. 13 and
14)M bending momentMcr critical molecular weightMn number-average molecular weightMw weight-average molecular weightN average number of particles in a fractal aggregateNx the crossover value of Np cross-link concentrationP particle flexibility parameterpc geometrical percolation thresholdPe Peclet numberr minimum observed radius of curvature of a particle in a dispersiont thicknessT absolute temperature in KelvinTg glass transition temperature in KelvinV particle volumezG ratio of shear moduli of dispersed particle to matrix; “relative mod-
ulus”zη ratio of viscosities of dispersed fluid to dispersing fluid; “relative
viscosity”zσ ratio of conductivities of dispersed particle to dispersing particle;
“relative conductivity”
γ shear rateη shear viscosityη0 shear viscosity in the limit of vanishing shear rate[η] intrinisc viscosity[η]0 value of [η] at Pe → 0[η]∞ value of [η] as Pe → ∞
Downloaded At: 12:45 19 January 2011

ORDER REPRINTS
VISCOSITY OF PARTICLE DISPERSIONS 635
[η]flex value of [η], including effects of particle flexibility[η]inflex value of [η] for infinitely rigid particlesθ viscoelastic relaxation timeσ conductivityσ0 conductivity of matrix material[σ] intrinsic conductivity[σ]∞ intrinsic conductivity of highly conducting particle relative to sus-
pending matrixτ shear stressτc a critical value of shear stressτd shear stress at which a fractal aggregate dissociatesτy yield stress of “dispersion gel”Φ particle volume fractionΦ* critical volume fraction at which the viscosity approaches infinity,
termed viscosity percolation threshold in the present paperΦc1 lower critical volume fraction for isotropic-to-ordered transitionΦc2 upper critical volume fraction for isotropic-to-ordered transitionΦ*flex value of Φ*, including effects of particle flexibilityΦ*inflex value of Φ* for infinitely rigid particlesΦm maximum particle packing fraction for disordered particle dispersionΦmp value of Φm for primary particles of aggregate in the absence of
aggregationΦm0 value of Φm as Pe → 0Φocp ordered close-packed maximum volume fractionΦr arithmetic mean of Φc1 and Φc2
Φx crossover volume fraction for onset of semidilute concentration re-gime
Ψ dimensionless second osmotic virial coefficient
ACKNOWLEDGMENTS
We thank Eric Amis, Clive Bosnyak, Jim Chou, Chris Christenson, RichFibiger, Glenn Fredrickson, Ed Garboczi, Juan Garces, and Dave Moll for help-ful discussions. We also thank Giovanni Nisato and Richard Parnas for theirhelpful comments on our paper. This work was supported in part by the govern-ment under Cooperative Agreement No. 70NANB7H3028, awarded by the De-partment of Commerce, National Institute of Standards and Technology.
REFERENCES
1. J. Mewis and C. W. Macosko, Suspension Rheology in Rheology: Principles,Measurements, and Applications (C. W. Macosko, Ed.), VCH Publishers, NewYork, 1994, chap. 10.
Downloaded At: 12:45 19 January 2011

ORDER REPRINTS
636 BICERANO, DOUGLAS, AND BRUNE
2. A. B. Metzner, J. Rheol., 29, 739–775 (1985).3. W. B. Russel, J. Rheol., 24, 287–317 (1980).4. H. Brenner, Int. J. Multiph. Flow, 1, 195–341 (1974).5. J. Bicerano and J. L. Brewbaker, ANTEC ’95 Prepr., 2542–2546 (1995).6. J. Bicerano and J. L. Brewbaker, J. Chem. Soc., Faraday Trans., 91, 2507–2513
(1995).7. J. N. Israelachvili, Intermolecular and Surface Forces, 2nd ed., Academic, New
York, 1992.8. J. F. Douglas and E. J. Garboczi, Adv. Chem. Phys., 91, 85–153 (1995).9. F. London, Phys. Rev., 54, 947–954 (1938).
10. M. Kogut and J. P. Straley, J. Phys. C, 12, 2151–2159 (1979).11. I. Balberg, Phys. Rev. Lett., 59, 1305–1308 (1987).12. I. Halperin, S. Feng, and P. N. Sen, Phys. Rev. Lett., 54, 2391–2394 (1985).13. B. Heaney, Phys. Rev. B, 52, 477–480 (1995).14. J. Bicerano, Prediction of Polymer Properties, 2nd ed., Marcel Dekker, New
York, 1996.15. International Organization for Standardization, ISO-31-8.16. G. J. Kynch, Br. J. Appl. Phys., 3(suppl. 3), 5–11 (1954).17. J. M. Peterson and M. Fixman, J. Chem. Phys., 39, 2516–2523 (1963).18. B. Cichocki and B. U. Felderhof, J. Chem. Phys., 89, 3705–3709 (1988).19. C. U. Thomas and M. Muthukumar, J. Chem. Phys., 94, 5180–5189 (1991).20. G. K. Batchelor and J. T. Green, J. Fluid Mech., 56, 375–400 (1972).21. G. K. Batchelor and J. T. Green, J. Fluid Mech., 56, 401–427 (1972).22. G. K. Batchelor, J. Fluid Mech., 83, 97–117 (1977).23. A. R. Altenberger and J. S. Dahler, J. Colloid Interface Sci., 189, 379–381 (1997).24. E. Wajnryb and J. S. Dahler, Adv. Chem. Phys., 102, 193–313 (1997).25. W. B. Russel, J. Chem. Soc., Faraday Trans., Part 2, 80, 31–41 (1984).26. M. Muthukumar and K. F. Freed, Macromolecules, 10, 899–905 (1977).27. J. F. Douglas and K. F. Freed, Macromolecules, 27, 6088–6099 (1994).28. A. L. Kholodenko and J. F. Douglas, Phys. Rev. E, 51, 1081–1090 (1995).29. D. H. Berry and W. B. Russel, J. Fluid Mech., 180, 475–494 (1987).30. E. S. G. Shaqfeh and G. H. Fredrickson, Phys. Fluids, A, 2, 7–24 (1990).31. A. P. Shapiro and R. F. Probstein, Phys. Rev. Lett., 68, 1422–1425 (1992).32. A. Karnis, H. L. Goldsmith, and S. G. Mason, J. Colloid Interface Sci., 22, 531–
553 (1966).33. H. L. Goldsmith and S. G. Mason, J. Colloid Sci., 17, 448–476 (1962).34. P. G. de Gennes, J. Phys., 40, 783–787 (1979).35. P. M. Adler, A. Nadim, and H. Brenner, Adv. Chem. Eng., 15, 1–72 (1990).36. J. L. Bouillot, C. Camoin, M. Belzons, R. Blanc, and E. Guyon, Adv. Colloid
Interface Sci., 17, 299–305 (1982).37. W. B. Russel and P. R. Sperry, Prog. in Org. Coat., 23, 305–324 (1994).38. J. Feder, Fractals, Plenum, New York, 1988.39. (a) C. R. Wildemuth and M. C. Williams, Rheol. Acta, 24, 75–91 (1985); (b)
C. R. Wildemuth and M. C. Williams, Rheol. Acta, 23, 627–635 (1984).40. N. Q. Dzuy and D. V. Boger, J. Rheol., 27, 321–349 (1983).41. T. Kataoka, T. Kitano, M. Sasahara, and K. Nishijima, Rheol. Acta, 17, 149–155
(1978).
Downloaded At: 12:45 19 January 2011

ORDER REPRINTS
VISCOSITY OF PARTICLE DISPERSIONS 637
42. T. Kitano, T. Kataoka, T. Nishimura, and T. Sakai, Rheol. Acta, 19, 764–769(1980).
43. T. Kitano, T. Kataoka, and T. Shirota, Rheol. Acta, 20, 207–209 (1981).44. R. Pal and E. Rhodes, J. Rheol., 33, 1021–1045 (1989).45. C. G. de Kruif, E. M. F. van Lersel, A. Vrij, and W. B. Russel, J. Chem Phys.,
83, 4717–4725 (1985).46. J. C. van der Werff and C. G. de Kruif, J. Rheol., 33, 421–454 (1989).47. A. van Blaaderen, J. Peetermans, G. Maret, and J. K. G. Dhont, J. Chem. Phys.,
96, 4591–4603 (1992).48. J. S. Chong, E. B. Christiansen, and A. D. Baer, J. Appl. Polym. Sci., 15, 2007–
2021 (1971).49. J. F. Brady, J. Chem. Phys., 99, 567–581 (1993).50. S. H. Maron and P. E. Pierce, J. Colloid Sci., 11, 80–95 (1956).51. A. P. Philipse, Langmuir, 12, 1127–1133 (1996).52. B. J. Ackerson, J. Rheol., 34, 553–589 (1990).53. L. V. Woodcock, Chem. Phys. Lett., 111, 455–461 (1984).54. Y. Song, E. A. Mason, and R. M. Stratt, J. Phys. Chem., 93, 6916–6919 (1989).55. (a) M. F. Thorpe, in Physics of Disordered Materials (D. A. Adler, H. Fritzsche,
and S. R. Ovshinsky, Eds.), Plenum, New York, 1985, pp. 55–61; (b) D. J. Jacobsand M. F. Thorpe, Phys. Rev. E, 53, 3682–3693 (1996).
56. T. Aste, Phys. Rev. E, 53, 2571–2579 (1996).57. N. Pape, L. Riepe, and J. R. Schopper, Part. Charact., 1, 66–73 (1984).58. M. S. Spector, J. A. Zasadzinski, and M. B. Sankaram, Langmuir, 12, 4704–4708
(1996).59. R. Zallen, The Physics of Amorphous Solids, John Wiley and Sons, New York,
1983.60. D. Stauffer and A. Aharony, Introduction to Percolation Theory 2nd ed., Taylor
and Francis, London, 1994.61. B. D. Hughes, Random Walks and Random Environments, Volume 2: Random
Environments, Clarendon Press, Oxford, 1996.62. J. Boissonade, F. Barreau, and F. Carmona, J. Phys. A: Math. Gen., 16, 2777–
2787 (1983).63. A. Celzard, G. Furdin, J. F. Mareche, E. McRae, M. Dufort, and C. Deleuze, Solid
State Commun., 92, 377–383 (1994).64. A. Celzard, E. McRae, J. F. Mareche, G. Furdin, M. Dufort, and C. Deleuze,
J. Phys. Chem. Solids, 57, 715–718 (1996).65. A. Celzard, E. McRae, C. Deleuze, M. Dufort, G. Furdin, and J. F. Mareche,
Phys. Rev. B, 53, 6209–6214 (1996).66. M. Dijkstra, J.-P. Hansen, and P. A. Madden, Phys. Rev. E, 55, 3044–3053 (1997).67. E. Anczurowski and S. G. Mason, J. Colloid Interface Sci., 23, 522–532 (1967).68. E. Anczurowski and S. G. Mason, J. Colloid Interface Sci., 23, 533–546 (1967).69. A. Okagawa and S. G. Mason, J. Colloid Interface Sci., 45, 330–358 (1973).70. I. Balberg, Phys. Rev. B, 31, 4053–4055 (1985).71. A. Fizazi, J. Moulton, K. Pakbaz, S. D. D. V. Rughooputh, P. Smith, and A. J.
Heeger, Phys. Rev. Lett., 64, 2180–2183 (1990).72. K. Levon, A. Margolina, and A. Z. Patashinsky, Macromolecules, 26, 4061–4063
(1993).
Downloaded At: 12:45 19 January 2011

ORDER REPRINTS
638 BICERANO, DOUGLAS, AND BRUNE
73. E. J. Garboczi, K. A. Snyder, J. F. Douglas, and M. F. Thorpe, Phys. Rev. E, 52,819–828 (1995).
74. J. Dudowicz, M. Lifschitz, K. F. Freed, and J. F. Douglas, J. Chem. Phys., 99,4804–4820 (1993).
75. (a) S. B. Lee and S. Torquato, Phys. Rev. A, 5338–5344 (1999); (b) A. L. R.Bug, S. A. Safran, G. S. Grest, and I. Webman, Phys. Rev. Lett., 55, 1896–1899(1985).
76. A. R. Boccaccini, J. Mater. Sci., 29, 4273–4278 (1994).77. J. Bicerano and D. Adler, Pure Appl. Chem., 59, 101–144 (1987).78. M. Nardin, E. Papirer, and J. Schultz, Powder Technol., 44, 131–140 (1985).79. J. G. Parkhouse and A. Kelly, Proc. Roy. Soc. London A, 451, 737–746 (1995).80. (a) J. G. Berryman, Phys. Rev. A, 27, 1053–1061 (1983); (b) M. D. Rintoul and
S. Torquato, Phys. Rev. Lett., 77, 4198–4201 (1996).81. L. A. Utracki and R. J. Simha, J. Polym. Sci. A, 1, 1089–1098 (1963).82. W. Burchard, Macromol. Chem., Macromol. Symp., 18, 1–35 (1988).83. W. Brown and T. Nicolai, Colloid Polym. Sci., 268, 977–990 (1990).84. (a) B. J. Buchalter and R. M. Bradley, Orientational order in random packings of
ellipses, Phys. Rev. A, 46, 3046–3056 (1992); (b) B. J. Buchalter and R. M. Brad-ley, Orientational order in amorphous packings of ellipsoids, Europhys. Lett., 26,159–164 (1994).
85. S. W. Churchill, Viscous Flows: The Practical Use of Theory, Butterworths, Bos-ton, 1988, pp. 504, 505.
86. H. Kanai, R. C. Navarrete, C. W. Macosco, and L. E. Scriven, Rheol. Acta, 31,333–344 (1992).
87. B. Gauthier-Manuel, E. Guyon, S. Roux, S. Gits, and F. Lefaucheux, J. Phys.(France), 48, 869–875 (1987).
88. F. Devreux, J. P. Boilot, F. Chaput, L. Malier, and M. A. V. Axelos, Phys. Rev.E, 47, 2689–2694 (1993).
89. (a) S. Arbabi and M. Sahimi, Phys. Rev. Lett., 65, 725–728 (1990); (b) M. A. V.Axelos and M. Kolb, Phys. Rev. Lett., 64, 1457–1460 (1990).
90. P. Sollich, F. Lequeux, P. Hebraud, and M. E. Cates, Phys. Rev. Lett., 78, 2020–2023 (1997).
91. N. Goldenfeld and P. Goldbart, Phys. Rev. A, 45, 5343–5345 (1992).92. P. G. de Gennes, J. Phys., Lett., 37, L1–L2 (1976).93. J. Roovers, Macromolecules, 27, 5359–5364 (1994).94. (a) D. J. Durian, Phys. Rev. Lett., 75, 4780–4783 (1995); (b) M.-D. Lacasse,
G. S. Grest, D. Levine, T. G. Mason, and D. A. Weitz, Phys. Rev. Lett., 76,3448–3451 (1996).
95. A. Mourchid, A. Delville, and P. Levitz, Faraday Disc., 101, 275–285 (1995).96. S. S. Manna and H. J. Herrmann, J. Phys. A, 24, L481–L490 (1991); see also
D. Jones, Nature, 332, 310 (1988).97. C. Tsenoglou and S. Yang, Polym. Eng. Sci., 30, 1407–1412 (1990).98. H. M. Princen, J. Colloid Interface Sci., 71, 55–66 (1979).99. J. F. Douglas, Macromolecules, 25, 1468–1474 (1992).
100. J. F. Douglas, Phys. Rev. E, 54, 2677–2689 (1996).101. F. Pignon, A. Magnin, and J.-M. Piau, Phys. Rev. Lett., 79, 4689–4692 (1997).
Downloaded At: 12:45 19 January 2011

ORDER REPRINTS
VISCOSITY OF PARTICLE DISPERSIONS 639
102. J. V. DeGroot, Jr., C. W. Macosco, T. Kume, and T. Hashimoto, J. Colloid Inter-face Sci., 166, 404–413 (1994).
103. R. C. Sonntag and W. B. Russel, J. Colloid Interface Sci., 115, 378–389 (1987).104. A. A. Potanin, J. Colloid Interface Sci., 145, 140–157 (1991).105. A. A. Potanin, J. Colloid Interface Sci., 157, 399–410 (1993).106. A. A. Potanin, R. de Rooij, D. van den Ende, and J. Mellema, J. Chem. Phys.,
102, 5845–5853 (1995).107. C. Tsenoglou, Rheol. Acta, 28, 311–315 (1989).108. C. Aubert and D. S. Cannell, Phys. Rev. Lett., 56, 738–741 (1986).109. (a) M. Y. Lin, H. M. Lindsay, D. A. Weitz, R. C. Ball, R. Klein, and P. Meakin,
Nature, 339, 360–362 (1989); (b) H. J. M. Hanley, G. C. Straty, and F. Tsvetkov,Langmuir, 10, 3362–3364 (1994); (c) M. Kawaguchi, A. Mizutani, Y. Matsushita,and T. Kato, Langmuir, 12, 6179–6183 (1996).
110. M. L. Mansfield, J. F. Douglas, and E. J. Garboczi, manuscript in preparation.111. (a) J. B. Hubbard and J. F. Douglas, Phys. Rev. E, 47, R2983–R2986 (1993); (b)
J. F. Douglas, H.-X. Zhou, and J. B. Hubbard, Phys. Rev. E, 49, 5319–5331(1994); (c) H.-X. Zhou, A. Szabo, J. F. Douglas, and J. B. Hubbard, J. Chem.Phys., 100, 3821–3826 (1994).
112. A. M. Kraynik, Anu. Rev. Fluid Mech., 20, 325–357 (1988).113. R. Krishnamoorti, R. A. Vaia, and E. P. Giannelis, Chem. Mater., 8, 1728–1734
(1996).114. R. Krishnamoorti and E. P. Giannelis, Macromolecules, 30, 4097–4102 (1997).115. S. Yamamoto and T. Matsuoka, J. Chem. Phys., 107, 3300–3308 (1997).116. P. J. Whitcomb and C. W. Macosco, J. Rheol., 22, 493–505 (1978).117. S. Kumar and T. E. Helminiak, in The Materials Science and Engineering of
Rigid-Rod Polymers (W. W. Adams, R. K. Eby, and D. E. McLemore, (Eds.),Materials Research Society Symposium Proceedings, 134, Materials Research So-ciety, Pittsburgh, PA, 1989, pp. 363–374.
118. (a) S. Iijima, C. Brabec, A. Maiti, and J. Bernholc, J. Chem. Phys., 104, 2089–2092 (1996); (b) B. I. Yakobson, C. J. Brabec, and J. Bernholc, Phys. Rev. Lett.,76, 2511–2514 (1996).
119. G. I. Taylor, Proc. Roy. Soc. A, 209, 447–461 (1951).120. Th. Y.-T. Wu, in Advances in Applied Mechanics, Vol. 11 (C.-S. Yih, Ed.), Aca-
demic, New York, 1971, pp. 1–63.121. C. Brennen and H. Winet, Anu. Rev. Fluid Mech., 9, 339–398 (1977).122. L. J. Fauci, J. Comput. Phys., 86, 294–313 (1990).123. X. Wen, C. W. Garland, T. Hwa, M. Kardar, E. Kokufuta, Y. Li, M. Orkisz, and
T. Tanaka, Nature, 355, 426–428 (1992).124. A. E. Woodward, Atlas of Polymer Morphology, Hanser, Munich, 1989.125. J. A. Manson and L. H. Sperling, Polymer Blends and Composites, Plenum, New
York, 1976.126. N. R. Legge, G. Holden, and H. E. Schroeder (Eds.), Thermoplastic Elastomers:
A Comprehensive Review, Hanser, Munich, 1987.127. I. S. Miles and S. Rostami (Eds.), Multicomponent Polymer Systems, Longman
Scientific and Technical, Essex, England, 1992.128. P. M. Subramanian, Polym. Eng. Sci., 25, 483–487 (1985).
Downloaded At: 12:45 19 January 2011

ORDER REPRINTS
640 BICERANO, DOUGLAS, AND BRUNE
129. M. W. Matsen and F. S. Bates, Macromolecules, 29, 1091–1098 (1996).130. P. K. Janert and M. Schick, Macromolecules, 30, 137–144 (1997).131. C. A. Orr, A. Adedeji, A. Hirao, F. S. Bates, and C. W. Macosco, Macromole-
cules, 30, 1243–1246 (1997).132. N. Mekhilef and H. Verhoogt, ANTEC ’97 Prepr., 2156–2163 (1997).133. V. M. Avila-Garcia, E. Mendizabal, M. Arellano, and R. Gonzalez-Nunez,
ANTEC ’97 Prepr., 3756–3760 (1997).134. R. Roscoe, J. Fluid Mech., 28, 273–293 (1967).135. J. D. Goddard and C. Miller, J. Fluid Mech., 28, 657–673 (1967).136. Y. Otsubo and R. K. Prud’homme, Rheol. Acta, 33, 29–37 (1994).137. Y. Otsubo and R. K. Prud’homme, Rheol. Acta, 33, 303–306 (1994).138. G. I. Taylor, Proc. Roy. Soc. London, 138A, 41–48 (1932).139. N. A. Frankel and A. Acrivos, J. Fluid Mech., 44, 65–78 (1970); see also S. J.
Choi and W. R. Schowalter, Phys. Fluids, 18, 420–427 (1975).140. G. I. Taylor, Proc. Roy. Soc. London, 226A, 34–37 (1954).141. M. A. Nawab and S. G. Mason, J. Colloid Sci., 13, 179–187 (1958).142. W. N. Bond, Philos. Mag., 4, 889–898 (1927).143. W. N. Bond, Philos Mag., 5, 794–800 (1928).144. R. Bagheri and R. A. Pearson, Polymer, 36, 4883–4885 (1995).145. N. P. Louat, M. S. Duesbery, M. A. Imam, V. Provenzano, and K. Sadananda,
Philos. Mag. Lett., 63, 159–163 (1991).146. W. P. Cox and E. H. Merz, J. Polym. Sci., 28, 619–622 (1958).147. E. J. Garboczi and J. F. Douglas, Phys. Rev. E, 53, 6169–6180 (1996).148. L. V. Gibiansky and S. Torquato, Phys. Rev. Lett., 71, 2927–2930 (1993).149. L. E. Nielsen, Ind. Eng. Chem. Fund., 13, 17–20 (1974).150. G. S. Springer and S. W. Tsai, J. Comp. Mat., 1, 166–173 (1967).151. D. M. Bigg, Polym. Comp., 7, 125–140 (1986).152. M. A. Nawab and S. G. Mason, J. Phys. Chem., 62, 1248–1253 (1958).153. F. Eirich and J. Sverak, Trans. Faraday Soc., 42B, 57–66 (1946).154. I. Y. Z. Zia, R. G. Cox, and S. G. Mason, Proc. Roy. Soc. A, 300, 421–441 (1967).155. O. L. Forgacs and S. G. Mason, Tappi J., 41, 695–704 (1958).156. O. L. Forgacs, A. A. Robertson, and S. G. Mason, Pulp Paper Mag. Canada, 59,
117–128 (1958).157. G. B. Jeffery, Proc. Roy. Soc. A, 102, 161–179 (1992).158. O. L. Forgacs and S. G. Mason, J. Colloid, Sci., 14, 457–472 (1959).159. R. B. Bird, C. F. Curtiss, R. C. Armstrong, and O. Hassager, Dynamics of Poly-
meric Liquids, Volume 2: Kinetic Theory, 2nd ed., John Wiley and Sons, NewYork, 1987.
160. L. E. Nielsen, Polymer Rheology, Marcel Dekker, New York, 1977.161. R. F. Heitmiller, R. Z. Naar, and H. H. Zabusky, J. Appl. Polym. Sci., 8, 873–880
(1964).162. S. Uemura and M. Takayanagi, J. Appl. Polym. Sci., 10, 113–125 (1966).163. M. Takayanagi, S. Uemura, and S. Minami, J. Polym. Sci., Part C, 5, 113–122
(1964).164. L. B. Kandyrin and V. N. Kuleznev, Kolloid Zhurn. [English trans.], 36, 431–436
(1974).
Downloaded At: 12:45 19 January 2011

ORDER REPRINTS
VISCOSITY OF PARTICLE DISPERSIONS 641
165. C. B. Arends, Polym. Eng. Sci., 32, 841–844 (1992).166. J. Lyngaae-Jorgensen and L. A. Utracki, Makromol. Chem., Macromol. Symp.,
48/49, 189–209 (1991).167. J. Lyngaae-Jorgensen, A. Kuta, K. Sondergaard, and K. Veno Poulsen, Polym.
Network Blends, 3, 1–13 (1993).168. T. I. Ablazova, M. B. Tsebrenko, A. B. V. Yudin, G. V. Vinogradov, and B. V.
Yarlykov, J. Appl. Polym. Sci., 19, 1781–1798 (1975).169. J. Kolarik, Polym. Network Blends, 5, 87–93 (1995).170. J. Kolarik, Polym. Eng. Sci., 36, 2518–2524 (1996).171. G. I. Taylor, Proc. Roy. Soc. A London, 146, 501–523 (1934).172. C. Tsenoglou, J. Rheol., 34, 15–24 (1990).173. (a) B. A. C. van Vlimmeren, M. Postma, P. Huetz, A. Brisson, and J. G. E. M.
Fraaije, Phys. Rev. E, 54, 5836–5839 (1996); (b) J. G. E. M. Fraaije, B. A. C. vanVlimmeren, N. M. Maurits, M. Postma, O. A. Evers, C. Hoffmann, P. Altevogt,and G. Goldbeck-Wood, J. Chem. Phys., 106, 4260–4269 (1997); (c) N. M. Maur-its, B. A. C. van Vlimmeren, and J. G. E. M. Fraaije, Phys. Rev. E, 56, 816–825(1997).
174. R. D. Groot and P. B. Warren, J. Chem. Phys., 107, 4423–4435 (1997).175. N. S. Martys and H. Chen, Phys. Rev. E, 53, 743–750 (1996).176. (a) X. Shan and H. Chen, Phys. Rev. E, 47, 1815–1819 (1992); (b) X. Shan and
H. Chen, Phys. Rev. E, 49, 2941–2948 (1994).177. R. E. Grim, Clay Mineralogy, McGraw-Hill, New York, 1968.178. R. M. Barrer, Zeolites and Clay Minerals as Sorbents and Molecular Sieves, Aca-
demic, New York, 1978.179. B. E. Hornby, L. M. Schwartz, and J. A. Hudson, Geophys., 59, 1570–1583
(1994).180. N. Street, Aust. J. Chem., 9, 467–479 (1956).181. E. K. Obiakor and R. L. Whitmore, J. Oil Colour Chem. Assoc., 47, 334–345
(1964).182. R. F. Giese, Clays Clay Miner., 26, 51–57 (1978).183. W. F. Bleam, Rev. Geophys., 31, 51–73 (1993).184. R. M. Christensen, J. Eng. Mater. Tecnnol., 101, 299–303 (1979).185. T. S. Chow, J. Mater. Sci., 15, 1873–1888 (1980).186. J. C. Halpin and J. L. Kardos, Polym. Eng. Sci., 16, 344–352 (1976).187. L. A. Utracki and T. Vu Khanh, Filled polymers, in Multicomponent Polymer
Systems (I. S. Miles and S. Rostami, Eds.), Longman Scientific and Technical,Essex, England, 1992, chap. 7.
188. T. Kurauchi, A. Okada, T. Nomura, T. Nishio, S. Saegusa, and R. Deguchi, SAETechnical Papers Series, No. 910584, International Congress and Exposition, De-troit, MI February 25–March 1, 1991.
189. E. P. Giannelis, JOM, 28–30 (March 1992).190. V. Favier, H. Chanzy, and J. Y. Cavaille, Macromolecules, 28, 6365–6367 (1995).191. E. Giannelis, Nanoscale, two-dimensional organic-inorganic materials, in Materi-
als Chemistry: An Emerging Discipline (L. V. Interrante, L. A. Caspar, and A. B.Ellis, Eds.), Adv. Chem. Ser. 245, American Chemical Society, Washington, DC,1995, chap. 10.
Downloaded At: 12:45 19 January 2011

ORDER REPRINTS
642 BICERANO, DOUGLAS, AND BRUNE
192. M. Kawasumi, N. Hasegawa, M. Kato, A. Usuki, and A. Okada, Macromolecules,30, 6333–6338 (1997).
193. L. Onsager, Ann. New York Acad. Sci., 51, 627–659 (1949).194. E. A. DiMarzio, A. J.-M. Yang, and S. C. Glotzer, J. Res. Nat. Inst. Stand. Tech-
nol., 100, 173–186 (1995).195. P. J. Flory and G. Ronca, Mol. Cryst. Liq. Cryst., 54, 289–310 (1979).196. P. J. Flory and G. Ronca, Mol. Cryst. Liq. Cryst., 54, 311–330 (1979).197. R. A. Vaia and E. P. Giannelis, Macromolecules, 30, 7990–7999 (1997).198. R. A. Vaia and E. P. Giannelis, Macromolecules, 30, 8000–8009 (1997).199. I. M. Krieger and T. J. Dougherty, Trans. Soc. Rheol., 3, 137–152 (1959).200. W. H. Bauer and E. A. Collins, Thixotropy and dilatancy, in Rheology: Theory
and Applications, Vol. 4 (F. R. Eirich, Ed.), Academic, New York, 1967, chap. 8.201. A. Parts, Nature, 155, 236–237 (1945).202. D. C.-H. Cheng, Nature, 245, 93–94 (1973).203. O. C. C. Lin, J. Appl. Polym. Sci., 19, 199–214 (1975).204. R. G. Green and R. G. Griskey, Trans. Soc. Rheol., 12, 27–37 (1968).205. H. Freundlich and H. L. Roder, Faraday Soc. Trans., 34, 308–316 (1938).206. A. K. Ghosh and S. N. Bhattacharya, Rheol. Acta, 23, 195–206 (1984).207. A. Higdon, E. H. Ohlsen, W. B. Stiles, J. A. Weese, and W. F. Riley, Mechanics
of Materials, 3rd ed., John Wiley and Sons, New York, 1976.
Downloaded At: 12:45 19 January 2011

Order now!
Reprints of this article can also be ordered at
http://www.dekker.com/servlet/product/DOI/101081MC100101428
Request Permission or Order Reprints Instantly!
Interested in copying and sharing this article? In most cases, U.S. Copyright Law requires that you get permission from the article’s rightsholder before using copyrighted content.
All information and materials found in this article, including but not limited to text, trademarks, patents, logos, graphics and images (the "Materials"), are the copyrighted works and other forms of intellectual property of Marcel Dekker, Inc., or its licensors. All rights not expressly granted are reserved.
Get permission to lawfully reproduce and distribute the Materials or order reprints quickly and painlessly. Simply click on the "Request Permission/Reprints Here" link below and follow the instructions. Visit the U.S. Copyright Office for information on Fair Use limitations of U.S. copyright law. Please refer to The Association of American Publishers’ (AAP) website for guidelines on Fair Use in the Classroom.
The Materials are for your personal use only and cannot be reformatted, reposted, resold or distributed by electronic means or otherwise without permission from Marcel Dekker, Inc. Marcel Dekker, Inc. grants you the limited right to display the Materials only on your personal computer or personal wireless device, and to copy and download single copies of such Materials provided that any copyright, trademark or other notice appearing on such Materials is also retained by, displayed, copied or downloaded as part of the Materials and is not removed or obscured, and provided you do not edit, modify, alter or enhance the Materials. Please refer to our Website User Agreement for more details.
Downloaded At: 12:45 19 January 2011
![Agilent GPC Solutions · Agilent PL-GPC 220 Fully integrated, ... (Rg) Viscosity detector detector response proportional to the intrinsic viscosity [ ] of the polymer](https://static.fdocuments.in/doc/165x107/5b2ce86d7f8b9abb6e8b868b/agilent-gpc-solutions-agilent-pl-gpc-220-fully-integrated-rg-viscosity.jpg)