POLYMER BLENDS FOR MULTI-EXTRUDED WOOD … · POLYMER BLENDS FOR MULTI-EXTRUDED WOOD-THERMOPLASTIC...
110
POLYMER BLENDS FOR MULTI-EXTRUDED WOOD-THERMOPLASTIC COMPOSITES By VIVIANE LOUISE VILLECHEVROLLE A thesis submitted in partial fulfillment of the requirements for the degree of MASTER OF SCIENCE IN CIVIL ENGINEERING WASHINGTON STATE UNIVERSITY Department of Civil and Environmental Engineering December 2008
Transcript of POLYMER BLENDS FOR MULTI-EXTRUDED WOOD … · POLYMER BLENDS FOR MULTI-EXTRUDED WOOD-THERMOPLASTIC...

POLYMER BLENDS FOR MULTI-EXTRUDED
WOOD-THERMOPLASTIC COMPOSITES
By
VIVIANE LOUISE VILLECHEVROLLE
A thesis submitted in partial fulfillment of the requirements for the degree of
MASTER OF SCIENCE IN CIVIL ENGINEERING
WASHINGTON STATE UNIVERSITY Department of Civil and Environmental Engineering
December 2008

To the Faculty of Washington State University:
The members of the Committee appointed to examine the thesis of VIVIANE LOUISE VILLECHEVROLLE find it satisfactory and recommend that it be accepted.
___________________________________ Chair ___________________________________ ___________________________________
ii

ACKNOWLEDGMENT
I am grateful to the Civil and Environmental Engineering department of Washington State
University and more specifically Dr. David McLean for his welcome and his assistance throughout
my stay in the USA, as well as my advisor Karl Englund and the members of my committee Mari-
Pierre Laborie and Vikram Yadama for their patience and helpful advice.
My thanks also go to the Wood Materials and Engineering Laboratory, especially Scott Lewis,
Brent Olson and Robert Duncan for their assistance and dedication. I would have been helpless
without them. Finally, I want to thank my fellow research assistants who taught and helped me on
a daily basis.
iii

POLYMER BLENDS FOR MULTI-EXTRUDED
WOOD-THERMOPLASTIC COMPOSITES
Abstract
by Viviane Louise Villechevrolle, M.S.
Washington State University December 2008
Chair: Karl Englund
Wood-plastic composites (WPC’s) are usually composed of wood blended with a single polymer.
To address the issue of WPC’s recycling and appraise the potential offered by using polymer
blends in the making of WPC’s, composites made of wood flour and several blends of isotactic
polypropylene (PP), high density polyethylene (HDPE) and polyvinyl-chloride (PVC) were
extruded. Both polymer blends and WPC’s require intensive mixing to sufficiently homogenize
the composite, therefore the influence of additional mixing was evaluated by re-extruding the
composites another three times. Torque rheometry, bending tests and water sorption tests were
performed to determine the influence of the repeated extrusions and the use of polymer blends on
the composites’ performances. The results indicated that the subsequent re-extrusions increased
the water resistance and the brittleness of the composites. The use of polymer blends did not
interfere with the processability and the strength. Within the tests performed, no disadvantage
related to the use of polymer blends was discovered. Composites containing PVC were found
easier to process and stiffer but more brittle and less water resistant than the composites made of
PP or HDPE. PP-based composites were the most difficult to process, primarily due to extruder
temperatures, but had the best water resistance. The performances of the composites depended on
the nature of their components, not on the eventual presence of a polymer blend. Thermal
properties were also investigated. The transition temperatures and the crystallinity of the samples
iv

were determined through differential scanning calorimeters (DSC). Tests for oxidation induction
times (OIT) were conducted utilizing DSC techniques as well. Wood increased the melting point
of most blends and reduced the crystallization temperature of HDPE-based composites. On the
contrary, PVC diminished the melting point of PP-based blends. The different components were
deemed immiscible and seemed to melt and crystallize separately. Repeated extrusions on the
WPC’s apparently increased the crystallinity degree as well as the rate and temperature of
crystallization, but decreased the melting temperature, indicating a potential structural degradation
of the composites. PVC blends showed the best resistance to oxidation while the OIT of PP and
HDPE blends were particularly short. The number of extrusions did not change the oxidation times
of the composites tested.
v

TABLE OF CONTENTS
Page
ACKNOWLEDGMENT.................................................................................................................. iii
TABLE OF CONTENTS..................................................................................................................vi
LIST OF TABLES ............................................................................................................................ix
Chapter I – INTRODUCTION...........................................................................................................1
I. Background ............................................................................................................................1
II. Problem statement ..................................................................................................................3
III. Objectives of the project ....................................................................................................4
References ......................................................................................................................................6
Chapter II – STRENGTH, STIFFNESS, CAPACITY OF DEFORMATION AND WATER
RESISTANCE OF WPC’s CONTAINING POLYMER BLENDS ..................................................8
Abstract ..........................................................................................................................................8
I. Introduction ............................................................................................................................9
Polymer blends...........................................................................................................................9
Mechanical properties of WPC’s .............................................................................................10
Objectives.................................................................................................................................11
II. Materials and testing methods..............................................................................................13
1. Materials...........................................................................................................................13
2. Torque rheometry: processability.....................................................................................14
3. Extrusion ..........................................................................................................................14
4. Flexural testing: strength and deformation.......................................................................15
5. Water sorption: moisture resistance .................................................................................15
vi

III. Mechanical properties of the tested WPC’s .....................................................................16
1. Torque rheometry.............................................................................................................16
2. Strength and deformation capacity...................................................................................23
3. Moisture resistance...........................................................................................................28
IV. Conclusion on the effect of re-processing and polymers blends on WPC’s mechanical
behavior........................................................................................................................................38
References ....................................................................................................................................39
Chapter III – CRYSTALLIZATION, MELTING AND OXIDATION ASPECTS ........................41
Abstract ........................................................................................................................................41
I. WPC’s and polymers blending issues ..................................................................................42
Objectives.................................................................................................................................47
II. Materials and testing methods..............................................................................................48
1. Extrusion ..........................................................................................................................48
2. Thermal transitions and crystallization ............................................................................49
3. Oxidation Induction..........................................................................................................50
III. Thermal and morphological response of the tested WPC’s .............................................52
1. Thermal transitions and crystallization ............................................................................52
2. Oxidation Induction Time (OIT)......................................................................................67
IV. Conclusion on the effects of mixing and polymer blends on WPC’s structural and
thermal properties.........................................................................................................................70
References ....................................................................................................................................71
CHAPTER FOUR – CONCLUSIONS........................................................................................73
vii

APPENDIX ......................................................................................................................................75
A. Results of the bending tests for virgin WPC’s .....................................................................75
B. Thickness swelling for extrusions #2 to #4..........................................................................88
C. Thickness swelling vs. number of extrusions.......................................................................90
D. Extrusion processing parameters..........................................................................................93
E. List of abbreviations and variables.......................................................................................95
viii

LIST OF TABLES
Table 2-1 Composition of the wood-plastic blends studied in this project. .....................................13
Table 3-1 Heating segments used on the differential scanning calorimter (DSC)...........................50
Table 3-2 Thermal properties of neat polymers and polymer blends. .............................................52
Table 3-3 Crystallization temperatures for HDPE-based WPC’s tested in DSC.............................58
Table 3-4 Crystallization temperatures for PP-based WPC’s tested in DSC...................................59
Table 3-5 Average degrees of crystallinity of the WPC’s tested in DSC. .......................................60
Table 3-6 Average times of half crystallization of the WPC’s tested in DSC. ................................62
Table 3-7 Melt temperature of the HDPE-based WPC’s tested in DSC..........................................65
Table 3-8 Melting points of the PP-based WPC’s tested in DSC. ...................................................66
Table 3-9 Synthesis of the impact of the number of extrusions of the crystallization parameters of
the WPC’s (↑ indicates an increase, ↓ indicates a decrease) ..........................................66
Table 3-10 Oxidation Induction Times (OIT) obtained by DSC. ....................................................68
Table A-1 Bending tests results for the wood/HDPE blend. ...........................................................75
Table A-2 Bending tests results for wood/PP blend. .......................................................................75
Table A-3 Bending tests results for wood/PVC blend. ....................................................................76
Table A-4 Bending tests results for wood/HDPE/PP blend.............................................................76
Table A-5 Bending tests results for wood/HDPE/PVC blend..........................................................76
Table A-6 Bending tests results for wood/PP/PVC blend. ..............................................................77
Table A-7 Application of the rule of mixture on the MOE..............................................................77
Table E-1 Extrusion processing parameters for the first extrusion..................................................93
Table E-2 Extrusion processing parameters for the second extrusion. ............................................93
Table E-3 Extrusion processing parameters for the third first extrusion. ........................................93
Table E-4 Extrusion processing parameters for the fourth extrusion...............................................94
ix

LIST OF FIGURES
Figure 2-1 Curve of energy vs. time for each polymer. ...................................................................18
Figure 2-2 Curve of torque vs. time for each polymer.....................................................................18
Figure 2-3 Curve of energy vs. time for each polymer blend. .........................................................20
Figure 2-4 Curve of torque vs. time for each polymer blend...........................................................20
Figure 2-5 Curve of energy vs. time for each blend.........................................................................22
Figure 2-6 Curve of required torque vs. time for each blend...........................................................23
Figure 2-7 Modulus of elasticity of the blends, using representative curves...................................26
Figure 2-8 Strain at break of the blends, using representative curves..............................................26
Figure 2-9 Modulus of rupture applied on the blends, using representative curves. .......................27
Figure 2-10 Plot of the water sorption, for the first extrusion..........................................................30
Figure 2-11 Plot of the water sorption, for the second extrusion.....................................................31
Figure 2-12 Plot of the water sorption, for the third extrusion. .......................................................31
Figure 2-13 Plot of the water sorption, for the fourth extrusion. .....................................................32
Figure 2-14 Plot of the thickness swelling versus immersion time, first extrusion. ........................33
Figure 2-15 Plot of the water sorption versus the number of extrusions for wood/HDPE, after 2660
hours of immersion...................................................................................................................34
Figure 2-16 Plot of the thickness swelling versus the number of extrusions for wood/PP, after 2660
hours of immersion...................................................................................................................35
Figure 2-17 Plot of the thickness swelling versus the number of extrusions for wood/PVC, after
2660 hours of immersion..........................................................................................................35
Figure 2-18 Plot of the thickness swelling versus the number of extrusions for wood/HDPE/PP,
after 2660 hours of immersion. ................................................................................................36
x

Figure 2-19 Plot of the thickness swelling versus the number of extrusions for wood/HDPE/PVC,
after 2660 hours of immersion. ................................................................................................36
Figure 2-20 Plot of the thickness swelling versus the number of extrusions for wood/PP/PVC, after
2660 hours of immersion..........................................................................................................37
Figure 3-1 Principle sequence of OIT according to ISO 11357-6 (Schmitt et al. [10]). ....................51
Figure 3-1 Crystallization of neat polymers.....................................................................................53
Figure 3-2 Crystallization of polymer blends during their cooling in DSC.....................................54
Figure 3-3 Melting of neat polymers. ..............................................................................................55
Figure 3-4 Melting of polymer blends during their heating in DSC................................................55
Figure 3-5 Crystallization of HDPE-based composites after one extrusion. ...................................56
Figure 3-6 Crystallization of PP-based composites after one extrusion. .........................................57
Figure 3-7 Degree of crystallinity versus number of extrusions......................................................61
Figure 3-8 Half time of crystallization versus number of extrusions...............................................63
Figure 3-9 Melting of HDPE-based composites after one extrusion. ..............................................64
Figure 3-10 Melting of PP-based composites after one extrusion. ..................................................64
Figure 3-11 Oxidation induction times in function of the number of extrusions.............................69
Figure B-1 Plot of the exothermic curves showing the crystallization for the wood/HDPE blends
after every extrusion.................................................................................................................78
Figure B-2 Plot of the exothermic curves showing the crystallization for the wood/PP blends after
every extrusion. ........................................................................................................................79
Figure B-3 Plot of the exothermic curves showing the crystallization for the wood/HDPE/PP
blends after every extrusion. ....................................................................................................79
Figure B-4 Plot of the exothermic curves showing the crystallization for the wood/HDPE/PVC
blends after every extrusion. ....................................................................................................80
xi

Figure B-5 Plot of the exothermic curves showing the crystallization for the wood/PP/PVC blends
after every extrusion.................................................................................................................80
Figure B-6 Exothermic curves showing the blends crystallization after the 1st extrusion...............81
Figure B-7 Exothermic curves showing the blends crystallization after the 2nd extrusion. .............81
Figure B-8 Exothermic curves showing the blends crystallization after the 3rd extrusion. .............82
Figure B-9 Exothermic curves showing the blends crystallization after the 4th extrusion...............82
Figure B-10 Plot of the endothermic curves showing the melting for the wood/HDPE blends after
every extrusion. ........................................................................................................................83
Figure B-11 Plot of the endothermic curves showing the melting for the wood/PP blends after
every extrusion. ........................................................................................................................84
Figure B-12 Plot of the endothermic curves showing the melting for the wood/HDPE/PP blends
after every extrusion.................................................................................................................84
Figure B-13 Plot of the endothermic curves showing the melting for the wood/HDPE/PVC blends
after every extrusion.................................................................................................................85
Figure B-14 Plot of the endothermic curves showing the melting for the wood/PP/PVC blends
after every extrusion.................................................................................................................85
Figure B-15 Endothermic curves showing the blends melting after the 1st extrusion. ....................86
Figure B-16 Endothermic curves showing the blends melting after the 2nd extrusion. ...................86
Figure B-17 Endothermic curves showing the blends melting after the 3rd extrusion.....................87
Figure B-18 Endothermic curves showing the blends melting after the 4th extrusion. ....................87
Figure C-1 Plot of the thickness swelling versus immersion time, second extrusion......................88
Figure C-2 Plot of the thickness swelling versus immersion time, third extrusion. ........................88
Figure C-3 Plot of the thickness swelling versus immersion time, fourth extrusion. ......................89
xii
Figure D-1 Plot of the thickness swelling after 2660 hours of immersion, for the different
extrusions of the wood/HDPE blend........................................................................................90
Figure D-2 Plot of the thickness swelling after 2660 hours of immersion, for the different
extrusions of the wood/PP blend..............................................................................................90
Figure D-3 Plot of the thickness swelling after 2660 hours of immersion, for the different
extrusions of the wood/PVC blend...........................................................................................91
Figure D-4 Plot of the thickness swelling after 2660 hours of immersion, for the different
extrusions of the wood/HDPE/PP blend. .................................................................................91
Figure D-5 Plot of the thickness swelling after 2660 hours of immersion, for the different
extrusions of the wood/HDPE/PVC blend. ..............................................................................92
Figure D-6 Plot of the thickness swelling after 2660 hours of immersion, for the different
extrusions of the wood/PP/PVC blend. ....................................................................................92
xiii

xiv
Dedication
This thesis is dedicated to my parents, for their constant love and support.

1
CHAPTER I – INTRODUCTION
I. Background
The wood-plastic composites (WPC’s) industry has been experiencing an important
growth over the last decade and is thought to take a place more and more important in the
construction materials market during the coming years [1][2]. A wood-plastic product is
constituted of wood, in form of flour or short fibers, blended with a thermoplastic, the
most common being high density polyethylene (HDPE) ), polyvinyl chloride (PVC), and
isotactic polypropylene (PP).
Usually, WPC’s contain only one kind of polymer where polymer blends have been
rarely considered in the making of such products. Knowledge in such a wide domain as
that of polymers and polymer blends is still building up, limiting the range of products
and the variety of polymers used and studied in the purpose of creating WPC’s. Polymer
blends can be especially complex to process, manipulate and study. Most polymers are
immiscible, sometimes making blending difficult. The components dipersion in an
immiscible blend is an issue that defines a blend’s morphology, which has direct impacts
on the thermal and physical behavior of the blend. The objective of creating polymer
blends is the same as creating composites: two elements are mixed or associated in order
to create a new product that could possess some properties of each of its components.
Even if making these sort of product is challenging, the resulting performance can be
extremely interesting. In the case of the WPC’s, for example, the idea is to manufacture a
2
product having some of the wood’s natural tensile strength to the water resistance and
easy maintenance of plastic.
WPC’s can be made of recycled materials, but recycling is sometimes difficult and
expensive, especially because of the necessity of cleaning the waste and separating the
different kinds of polymers. HDPE, PP and PVC figure among the most frequent plastic
waste. If their separation was feasible, it would reduce the price of recycling, which is
another reason to consider the possibility to use polymer blends and evaluate the
feasability of using non-separated recycled polymers to produce WPC’s.
The other aspect of recycling would be the re-use of old WPC’s. Many manufacturers
regularly reprocess their out-of-use WPC’s to produce new ones. Multiple processing can
be harmful by degrading the structure and eventually weakening the product. On the
other hand, several extrusions can help achieve a homogeneous mix of the materials and
thus improve the blends miscibility, adhesion and resistance. A blend well mixed offers
less voids for the moisture to penetrate and more surface to enable stress transfer because
of the increased dispersion of the fiber within the matrix. That said, mixing must be done
carefully because heat and shear might deteriorate the materials.
The stresses are transferred in the composites by friction between the wood flour and the
surrounding plastic. The wood gives its strength to the WPC’s and to do that, contact
must exist between the wood and the polymers. Having a good stress transfer means that
all the components will contribute with the maximum of their capacity to the strength of
the composite. Having a good stress transfer implies that the constituents of a composites
will share the load applied on that composite, making it stronger [21].

3
Blending the composites is extremely important and influences the structure and the
mechanical behavior of the products. Several authors state that the structure and
morphology of a blend or a composite is directly linked to its mechanical properties and
macroscopic behavior [6-9].
II. Problem statement
Today, the WPC’s industry manufactures and sells mostly single polymer-based
composites. This project focuses on the use of polymer blends in the making of
composites of wood and the performances of those composites. The impact of multi-
processing and re-mixing will also be adressed. HDPE, PP and PVC are the most
common plastic on the market, the most recycled ones and the most often used by WPC’s
companies. Using these products separately limits the opportunities of facilitating
recycling and restrains the potential for WPC technology to offer manufacturing
flexibility. With oil prices steadily increasing, plastic is getting more and more expensive.
Using recycled plastic materials with minimum additional processing steps, or a wider
range of them would be quite economical in these critical times.
Blending several polymers can be challenging but extensive research has been
accomplished by researchers from chemistry and polymer science. Blends of PP and
HDPE, for example, have been studied for a long time and exhibit good mechanical
performances [9-18]. In the case of WPC’s, using coupling agents and compatibilizers
usually helps the adhesion of the materials and strengthens the composite [19-20]. With this
knowledge, one can assume that utilizing polymer blends to prepare WPC’s should be
possible and even constructive, since both WPC’s and neat polymer blends have already

4
been investigated for a while. Moreover, the strength of a blend directly relates to its
morphology and this morphology greatly depends on the phase dispersion, at least in the
case of immiscible blends. Thus, improving the dispersion of the components in the blend
should impact the mechanical performance, especially in terms of tensile strength and
moisture resistance of the composites. Re-mixing is a way to insure better blending and
will be assessed here.
III. Objectives of the project
The goal of the following project is to investigate and determine the performances of
polymer blends-based WPC’s in comparison with single polymer based composites.
Utilizing polymer blends to create WPC’s should not be an issue since polymers are
already used and polymer blends, even if immiscible, can show good properties. The
impact of the polymer blends on the mechanical performance should not be significant,
although the processing effort might increase and the strength be intermediate, depending
on the nature of the blended polymers. Problems at the interface between polymers might
also arise and diminish water resistance and stress transfer.
Mixing is decisive for the components dispersion and to guarantee good performances of
the WPC’s. Re-processing should increase the degree of blending and homogenize the
blends, improving the resistance of the composites. Yet, degradation might occur as well.
the real impact of multiple processing will be investigated.
The impact of the presence of polymer blends within WPC’s will be looked at, as well as
the repercussions of re-mixing on the physical and thermal properties of the composites.

5
To attain these goals, the following objectives were undertaken:
• Utilize torque rheometry to evaluate the mixing and processing
characteristics of WPC’s containing polymer blends,
• Compute the strength characteristics and the water resistance of polymer-
blend WPC’s,
• Determine the crystallization mechanism, the melting point and the
oxidative resistance of composites made of polymer blends,
• Use multiple extrusions to determine the influence of extensive mixing on
the thermal characteristics and mechanical properties of the polymer-blend
WPC’s,
• Compare the evaluated performances of the polymer-blend WPC’s with the
single-polymer WPC’s.

6
References
[1] Clemons CM. Wood-Plastic Composites in the United States. The interfacing of two industries. Forest Products Journal vol. 52, No. 6, June 2002.
[2] Wolcott MP, Englund K. A technology Review of Wood-Plastic Composites. 33rd International Particleboard / Composite Materials Symposium.
[3] Principia Partners. “Natural & Wood Fiber Composites: the Principia Newsletter, Vol. 1, No. 9. September 30, 2002.
[4] Farahmand F, Mehrabzadeh M. Recycling of Commingled Plastic Waste Containing Polypropylene, Polyethylene and Paper. Journal of Applied Polymer Science 2001, Vol. 80, 2573-2577.
[5] Farahmand F, Shokrollahi P, Mehrabzadeh M. “Recycling of Commingled Plastic Waste Containing Polyvinylchloride, Polypropylene, Polyethylene and Paper. Iranian Polymer Journal 2003, 12 (3), 185-190.
[6] Kunori T, Geil PH. Morphology-property relationships in polycarbonate-based blends. II. Tensile and impact strength. Journal of Macromolecular Science, part B, volume 18, issue 1 1980 , pages 135 – 175.
[7] Paul DR, Buchnal CB. Polymer Blends in Performance. Vol. 2, Wiley, NY (2000).
[8] Huang HX, Huang YF, Li XJ. Fiber-particle morphological transition and its effect on impact strength of PS/HDPE blends. Polymer Engineering and Science, volume 48, issue 8, pages 1600 – 1607, 2008.
[9] Dhoble A, Kulshreshtha B, Ramaswami S, Zum-brunnen DA. Mechanical properties of PP-LDPE blends with novel morphologies produced with a continuous chaotic advection blender. Polymer, 46, 2244 (2005).
[10] Privalko VP, Novikov VV. The science of heterogeneous polymers. Structure and thermophysical properties. John Wiley & Sons 1995.
[11] Li J, Shanks RA, Olley RH, Greenway GR. Miscibility and isothermal crystallization of polypropylene in polyethylene melts. Elsevier ScienceDirect, Polymer 42, 2001, 7685-7694.
[12] Shanks RA, Li J, Yu L. Polypropylene-polyethylene blend morphology controlled by time-temperature-miscibility. Elsevier ScienceDirect, Polymer 41, 2002, 2133-2139.
[13] Jianglei Qin, Jungang Gao, Zhiting Li, Mingtao Run. Nonisothermal Crystallization, Melting Behavior, and Morphology of Polypropylene/Linear Bimodal Polyethylene Blends. Journal of Applied Polymer Science 2008, Vol. 107, 1235-1242.
[14] Camacho W, Karlsson S. Assessment of thermal and thermo-oxidative stability of multi-extruded PP, HDPE and a blend thereof. Elsevier Science, Polymer Degradation and Stability 2002, 78, 385-391.
[15] Krumme A, Lehtinen A, Viikna A. Crystallisation behaviour of high density polyethylene blends with bimodal molar mass distribution 2. Non-isothermal crystallisation. European Polymer Journal 40 (2004) 371–378.

7
[16] Fonseca CA, Harrison IR. An investigation of co-crystallization in LDPE/HDPE blends using DSC and TREF. Thermochimica Acta 313 (1998) 37-41.
[17] Martuscelli E. Polymer blends: processing, morphology and properties. Springer 1999.
[18] Blom HP, Teh JW, Bremner T, Rudin A. Isothermal and non-isothermal crystallization of PP: effect of annealing and of the addition of HDPE. Elsevier Science, PII: S0032.3861(97)10305-6, Polymer Vol. 39 No. 17, pp. 4011-4022, 1998.
[19] Adhikary K, Pang S, Staiger MP. Long-term moisture absorption and thickness swelling behaviour of recycled thermoplastics reinforced with Pinus radiata sawdust. Chemical Engineering Journal 30 (2007).
[20] Adhikary K, Pang S, Staiger MP. Dimensional stability and mechanical behaviour of wood-plastic composites based on recycled and virgin high-density polyethylene (HDPE). Composites: Part B 39 (2008) 807-815.
[21] ASM Handbook, composites, vol. 21. 2001.

8
CHAPTER II – STRENGTH, STIFFNESS, CAPACITY OF
DEFORMATION AND WATER RESISTANCE OF WPC’S
CONTAINING POLYMER BLENDS
Abstract
Composites made of wood flour and blends of isotactic polypropylene (PP), high density
polyethylene (HDPE) and polyvinyl-chloride (PVC) were extruded, granulated and re-
extruded three more times. The wood-plastic composites (WPC’s) were extruded several
times to monitor the influence of melt-blending on the behavior and product performance
of WPC’s made with polymer blends. To determine the implication of re-extruding and
introducing polymers blends on the composites’ performances, torque rheometry,
bending tests and water sorption tests were performed. The results suggested that re-
mixing increased the water resistance and the brittleness of the WPC’s. Polymer blends
did not impact the results obtained during torque rheometry tests, nor the results found
during flexural testing. In fact, these results were due to the nature of the polymers used.
Composites of PVC were particularly stiff, brittle and easy to process, but lacked of water
resistance in comparison with WPC’s made of PP or HDPE. PP-based composites were
the most difficult to process because of the extruder temperatures, but had the best water
resistance.

I. Introduction
Polymer blends
Usually, WPC’s contain a single polymer species and polymer blends have been rarely
considered in the making of such composites. Polymer blends can be especially complex
to process, manipulate and study. Most polymers are immiscible with each other, adding
to their complexity. The creation of a polymer blend generally results in a new product
that will exhibit some of the properties of each of its components. Even if making such a
product is challenging, its new performance can be very interesting. In the case of the
wood-plastic products, for example, the idea is to manufacture a product having some of
the wood’s natural tensile strength to the water resistance and easy maintenance of
plastic. Blends of PP and HDPE have been studied for a long time [1][20-26]. These blends
can display good mechanical performances. Using coupling agents and compatibilizers
usually helps the adhesion of the materials and strengthens the blend.
Most polymers are immiscible even if they apparently blend. In thermodynamic terms,
miscibility refers to a single-phase system at the molecular level, but in practice, a
seemingly homogenous blend will be considered miscible or more exactly compatible [21-
22][31]. The necessary condition for two polymers to mix is that the Gibbs free energy of
their blend is smaller than the sum of the Gibbs free energies of the separate polymers,
meaning that ∆G, the change in free energy on mixing, should be negative. The change in
Gibbs free energy is expressed as STHG ∆−∆=∆ . , where ∆G is the change in free
energy, ∆H is the change in enthalpy, T is the temperature of mixing and ∆S is the
9
10
change in entropy. If ∆G<0, blending is favored, also implying that an increase in the
entropy will help polymer mixing [31]. Entropy can be defined as the amount of energy
which is not available to do work, or as a measure of the disorder of a system [32].
Some pairs of polymers will be more or less miscible, depending on temperature and
composition. Even if polymers often are immiscible, some techniques are still available
to the scientist to make stable and reproducible blends of immiscible materials, like using
copolymers or crosslinking. A mixture of immiscible polymers will give a phase-
separated solution called an immiscible blend. The miscibility and morphology of a blend
directly influences its mechanical properties [21-22][27-30].
Mechanical properties of WPC’s
As the market steadily grew, the mechanical and physical properties of WPC’s have been
widely investigated. In their review of the general assets and properties of the WPC’s,
Wolcott and Englund [4] explained how the performances of the composites varied in
function of their components. In general, the wood increased the mechanical properties
and the thermal stability of the thermoplastic matrix, while the moisture barriers of plastic
increased the water resistance of the wood.
In a WPC, the water sorption is due to voids or wood particles located at the surface of
the composite. Any filler that is at the surface and therefore, susceptible to moisture
exposure will undergo water sorption until the composite reaches an equilibrium moisture
content (EMC). Klason et al. [5] exposed molded PP-wood flour composites to a 50%
relative humidity (RH) at 23°C for a hundred and fifty days and observed an EMC of
1.6% at a filler loading of 60%. The EMC decreased with the flour percentage. Then,

11
they subjected the same samples to a water immersion test in a 90°C water bath during
seven days and found that wood flour percentages between 20% and 60% resulted in an
8% to 10% moisture content.
A very interesting aspect of the WPC’s is that they can be created with all recycled
materials. These environment-friendly materials can be made of recycled wood as well as
recycled thermoplastics. Not only HDPE, PP and PVC are the most common plastics on
the market and therefore, the most recycled ones, but they are also the main constituents
of most WPC’s [3][10-11]. Plastic wastes are one of the major volumes of global municipal
solid waste. Today, a city in a developing country with a population of three million
inhabitants daily produces around 400 tons of plastic waste. This generation of plastic is
said to increase of 25% every year [20]. If recycling efforts have been done over time,
finding new ways of using these recycled materials is still crucial and the WPC’s seem to
offer good opportunities in that prospect.
Objectives
Most of the knowledge supported today in the domain of WPC’s concerns products made
of a single polymer, but nothing indicates that polymers blends cannot be used to
manufacture wood-plastic materials that would still show correct performances. This
project explored and determined the performances of polymer blends based WPC’s in
comparison with single-polymer-based composites and proved that they are viable
products for the industry. The other important issue of the project was to determine the
effect of extensive melt-blending through multi-extrusions on the properties of the
composites.

12
Composites made of wood floor with different concentrations of PP, HDPE and PVC
were extruded several times and their processability, strength and water resistance
investigated.
The objectives were to:
• Identify the processability of mixed polymer systems for WPC’s utilizing
torque rheometry.
• Utilize repeated extrusions to determine the influence of melt-blending on the
composite properties,
• Test the composite blends for mechanical and physical performance

13
II. Materials and testing methods
1. Materials
HDPE, PP and PVC are common polymers often used for WPC’s. Petrothene®
LB010000 from Equistar was chosen for HDPE, Innovene H04F (HB9200) from BP
Amoco Chemical Company was selected for PP and PVC came from Georgia Gulf
Compound. HDPE’s melt index was 0.5 and PP’s melt index was 4.0 g/10 min.
The wood floor was a commercial 60-mesh eastern white pine (Pinus strobus) from
American Wood Fibers. Lubricants, ethylene bis stearamide (EBS) wax and zinc
stearate, were added to the blends for improved processability of the composites. The
general formulation of the blends was to use 58% of wood floor and 39% of
thermoplastics (see Table 2-1). The amount of lubricants was constant at 3%. The
individual components were weighed and mixed in a drum blender before being extruded
into a solid profile of 38x10 mm (1.5×0.4 inches). 10 kg batches were used so that there
would be enough material to prepare several extrusions of the materials.
Table 2-1 Composition of the wood-plastic blends studied in this project.
Blend 1 Blend 2 Blend 3 Blend 4 Blend 5 Blend 6
Wood 58% 58% 58% 58% 58% 58%
HDPE 39% 19.5% 19.5%
PP 39% 19.5% 19.5%
PVC 39% 19.5% 19.5%
Zinc
Stearate 2% 2% 2% 2% 2% 2%
EBS wax 1% 1% 1% 1% 1% 1%
14
2. Torque rheometry: processability
The torque rheometer used was a Haake Rheomix 600p. No lubricants were used for this
test since the goal is to evaluate the natural processability of the materials. Blends
following the compositions of Table 2-1 without lubricants (60% of wood flour and 40%
of thermoplastics) were mixed for 10 minutes at screw speed of 20 rpm and a temperature
of 180ºC with a roller rotor. Virgin polymers, polymer blends and WPC’s were tested and
for each material, three samples were run into the rheometer. As these tests were made
before any extrusion, only one set of tests was carried out.
3. Extrusion
The products were extruded four times through a 35 mm twin-screw extruder. The
approximate melting point (Tm) of HDPE and PP are respectively 130 ºC and 160 ºC and
wood usually begins degrading around 210 ºC. Moreover, the required processing zone of
PVC is 162ºC to 168ºC. To ensure that PP would melt without making the wood burn, the
extrusion was carried out at a die and an extruder temperature of 180ºC. The velocity of
the screws was set on 20 rpm for the first extrusion but was changed to 10 rpm for
following three extrusions due to the higher feeding capacity of the pelleted material.
The composites were extruded into the 38x10 mm (1.5×0.4 inches) solid profile and were
cut and ground through a 40 mesh screen in a knife mill after each extrusion so they
could be re-extruded. A sufficient amount of material was reserved to perform the
flexural and water resistance tests. Extrusion processing parameters are located in
Appendix E.

15
4. Flexural testing: strength and deformation
Flexure tests were conducted in accordance with ASTM D 790 [17] requirements. Six
samples of 203×38×10 mm (8×1.5×0.4 inches) were cut and stored 24 hours in a 20ºC
and 60% relative humidity conditioning room. The test span was 152 mm (6 inches). A
universal testing apparatus was utilized for the test, while load and deflection were
collected in real-time and used to calculate the MOE, the MOR and εbreak .
5. Water sorption: moisture resistance
The composites obtained from the four extrusions were planned to a thickness of
approximately 6 mm (0.25 inches) to remove the polymer-rich surface of the boards and
cut into specimens of 127×25 mm (5×1 inches). The samples were then immersed in
distilled water at ambient temperature (20ºC) for 16 weeks. The thickness and weight of
the samples were measured at several moments in time to determine their water sorption
(mass change) and thickness swelling (thickness change). They were measured everyday
during the first three days and then every week for a month. After that first month, the
measurements were taken every two weeks until the end of the test at sixteen weeks or
about 2660 hours of immersion. Before any measurement, the surface water was wiped
away to avoid any additional mass.

16
III. Mechanical properties of the tested WPC’s
1. Torque rheometry
This test measures the torque and the energy needed to mix a blend of polymers, reflects
the resistance of the material to shear deformation during the mixing process and gives an
idea of the viscosity and processability of the components. As noted by Yang et al. [14],
the most interesting similarities are that the thermal stress and oxygen will influence the
structure of the melt and change its apparent viscosity. This apparent viscosity is related
to the shear stress, and thus the torque. Here, only the torques and energies will be looked
at since they can express the same general behavior of the blends.
As the maximum torque corresponds to the time when the plunger pushed the material
and closed the chamber, the value of this maximum torque is not accurate and will not
examined. Instead, a closer look at the equilibrium or stabilized torques (Te) should give a
sufficient insight on the processability and viscosity of the materials. Here, the time “0”
corresponds to the time when the chamber is completely closed. After four minutes of
blending, the torque T usually converged to a constant value corresponding to Te [15]. Te
can also be an indicator of a complete melt or softening or with filled polymers a fully
mixed system. The trends provided in the following torque rheometry figures are
representative curves taken from a sample of three runs.

17
Tests on neat polymers
During the unfilled polymers’ tests, the highest Te and the highest energy were that of the
HDPE, even if PP developed a greater energy for the five first minutes of blending. PVC
was the polymer that required the least energy and shear stress. On Figure 2-1, the slopes
of the curves of the energy for PP and HDPE look very steep at the beginning, in the
linear part of the curve, and then diminishes greatly. On the contrary, the energy curve of
PVC is almost linear all along after the fusion. The observed behavior of the can be due
to the processing temperature of the tested polymers.
The results from torque analysis gave a different insight. On Figure 2-2, the Te of HDPE
was still the highest but PVC required a higher Te than PP. These observations could
mean that HDPE has a higher apparent viscosity than PP and PVC, PVC having the least
apparent viscosity. Nevertheless, the curve of the PVC on figure 2-2 exhibited a bump
between one and two minutes after the onset of the test. This is due to the fusion of PVC,
as explained through similar work with WPC’s by Matuana and Kim[2]. The fusion is the
thermal reduction of PVC’s particles (grains) boundary surface. The grains are destroyed
and the resulting microparticles are compacted when the heat increases. The fusion of
PVC might have increased Te and could explain why the torque is high and the energy
gets linear.

Energy (representative curves)
0
2000
4000
6000
8000
10000
12000
0 2 4 6 8 10
t (min)
E (J
)
HDPEPPPVC
HDPE
PVC
PP
Figure 2-1 Curve of energy vs. time for each polymer.
Torque (representative curves)
0
10
20
30
40
50
60
0 1 2 3 4 5 6 7 8 9t (min)
M (
Nm
)
HDPE
PP
PVC
HDPE PVC PP
Figure 2-2 Curve of torque vs. time for each polymer.
18

19
Tests on polymer blends
The curves of the energies of HDPE/PP/PVC and HDPE/PP, Figure 2-3, almost
superpose. They are joined by the curve corresponding to the HDPE/PVC blend at the
end of the test. Only the PP/PVC curve stands out, with smaller values than the others.
Interestingly, the plot of the torques on figure 2-4 shows a different hierarchy, with
HDPE/PVC developing the highest torque. The curves of HDPE/PP/PVC and HDPE/PP
are very close again and the curve of the PP/PVC blend is still under the others.
Apparently, HDPE/PP/PVC and HDPE/PP have the same processability, which means
PVC did not influence the blend. The blends containing HDPE seem to need more energy
and shear stress than the blends containing PP but the difference remains small.
The different processability noticed might be due to the higher melt index of PP over
HDPE which means PP is less viscous than HDPE. The reasons why HDPE is more
viscous than PP are that the molecular weight of HDPE (0.953 here) is higher than that of
PP (0.900 here) and that HDPE has long linear chains favoring entanglement.

Energy (representative curves)
0
2000
4000
6000
8000
10000
12000
0 2 4 6 8 10t (min)
E (J
)
12
HDPE/ PPHDPE/ PVCPP/ PVCHDPE/ PP/ PVC
HDPE/ PP/ PVC
PP/ PVC
HDPE/ PVC
HDPE/ PP
Figure 2-3 Curve of energy vs. time for each polymer blend.
Torque (representat ive curves)
0
10
20
30
40
50
60
0 2 4 6 8 10
t (min)
M (
Nm
)
12
HDPE/ PP
HDPE/ PVC
PP/ PVC
HDPE/ PP/ PVC
HDPE/ PP/ PVC
PP/ PVC
HDPE/ PVCHDPE/ PP
Figure 2-4 Curve of torque vs. time for each polymer blend.
20

21
Wood-plastic composites testing
After the experimentations conducted on the polymers, the six formulations of WPC’s
were run under the same torque rheometry conditions as with the polymers and their
blends. On Figure 2-5, all the energy curves seem to grow steadily, their slopes at the
beginning are smaller than those of polymer blends and their curves get more or less
linear after the first three or four minutes of melting. From the results on the tests of the
polymer blends, expecting to find the energy and the torque of the composites of HDPE
higher than those of the composites containing PP would make sense but, surprisingly,
WPC’s made of PP are the ones requiring the highest energy and shear stress. Wood/PP
has the highest curve, followed by wood/HDPE/PP and wood/PP/PVC. The torques,
Figure 2-6, come on the same order, with wood/PP and wood/HDPE/PP curves almost
superposing and greater than for the others blends. These observations show that
composites of PP are being more difficult to process than composites of HDPE and PVC.
HDPE has a lower melt index and is more viscous but the higher Tm of PP (Tm = 160ºC
for HDPE and 160ºC for PP, see chapter 3, section 3.1.2.4) might be the cause of the high
energy and torque required by PP-based blends.
Composites of wood and polymer blends
When compared to those resulting from the tests of polymer blends, the torque and
energies required for WPC’s were much higher because of the addition of wood,
particularly for blends containing PP. Whereas Te slightly increased for composites of
HDPE and PVC, Te doubled for these composites. The high Tm of PP can be an
explanation to the difficult processing of the PP-based composites. Wood certainly

increased the overall viscosity of the blend and reinforced the effects of the high Tm that
characterizes PP. The best processability was found for wood/HDPE/PVC, PVC seeming
neutral on the viscosity on the blends. The WPC’s containing several polymers did not
seem to be more difficult to process than the other ones; they developed torques and
energies depended on the nature of the polymers they were made of, not the fact that they
contained several polymers.
Energy ( representative curves)
0
2000
4000
6000
8000
10000
12000
14000
16000
18000
0 2 4 6 8 1t (min)
0
Wood/ HDPE
Wood/ PVC
Wood/ PP
Wood/ HDPE/ PP
Wood/ HDPE/ PVC
Wood/ PP/ PVC
Figure 2-5 Curve of energy vs. time for each blend.
22

Torque ( representative curves)
0
10
20
30
40
50
60
0 2 4 6 8t (min)
10
Wood/ HDPEWood/ PPWood/ PVCWood/ HDPE/ PPWood/ HDPE/ PVCWood/ PP/ PVC
Wood/ HDPE
Wood/ PVC
Wood/ PP
Wood/ HDPE/ PP
Wood/ HDPE/ PVC Wood/ PP/ PVC
Figure 2-6 Curve of required torque vs. time for each blend.
2. Strength and deformation capacity
The goal of the bending tests is to determine the mechanical capacities of each board.
With the load and the related extension, the MOE as well as the MOR and the εbreak can
be calculated, using the formulas provided by ASTM D 790 [17]. Tables displaying more
results can be found in Appendix A.
The MOE is presented on Figure 2-7. As expected, the wood/PVC exhibited a much
higher MOE than its counterparts. The other composites made of PVC followed,
wood/PP/PVC first, then wood/HDPE/PVC. Obviously, the products made with PVC
were not only more brittle but also stiffer. The three other WPC’s exhibited values similar
to one another.
23
24
Looking at εbreak on Figure 2-8 confirms the stiffness and brittleness of the PVC-based
composites. PP increased the capacity of deformation of the blends. The composites
made of both HDPE and PP showed intermediate capacity of deformation and strength, at
mid-way between those of wood/HDPE and wood/PP.
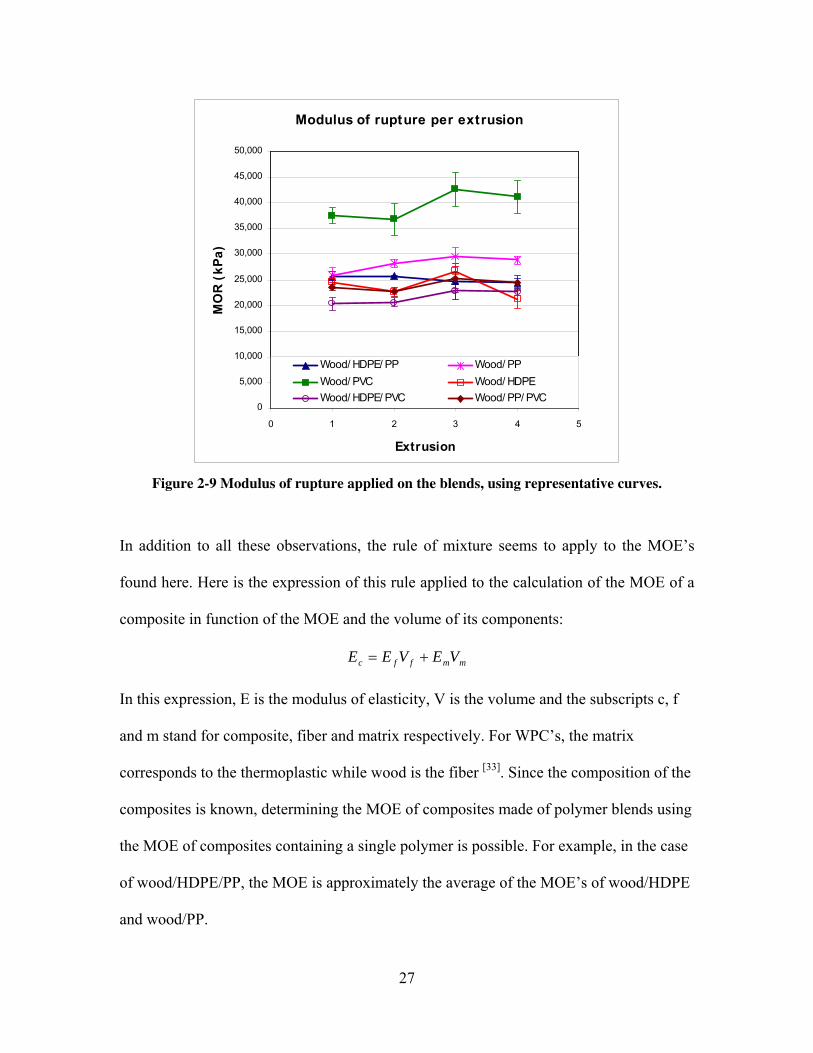
The MOR corresponding to the maximum load applied on the samples is presented
Figure 2-9. Here, the blend of wood/PVC stands out again with a very high MOR but the
other blends made of PVC did not experience any particularly high MOR this time.
Wood/PP/PVC and wood/HDPE/PVC had a high MOE but small ultimate strain and
MOR. They were rather brittle but did not bear a high load before breaking, while
wood/PVC and wood/PP were the strongest composites according to their MOR.
The polymers strongly influenced the composites: PVC enhanced their brittleness and
stiffness while HDPE and PP favored their ductility and increased their capacity of
deformation.
As mentioned earlier, the samples seemed to become more brittle after each extrusion.
These visual observations are backed up by the data on Figure 2-7 to 2-8. When the
number of extrusions increased, the MOE increased and the εbreak decreased. Repeated
extrusions tended to stiffen the boards and increase their brittleness. Likewise, in 2004,
Clemons wrote a review of WPC’s and emphasized the importance of recycling these
materials. He pointed out some recycling issues, among them multiple-processing, and
explained how processing could lead to a thermal degradation of the components. He
cited the example of HDPE that could result in cross-linking if exposed to a high heat
during its processing, and thus increase the brittleness. The fiber could also degrade
because of repeated heat cycle exposures and mechanical degradation (fiber attrition). In

25
the end, multi-processing helps mixing the composites and increases the strength but
sacrifices some ductility along the way. An increase in the degree of crystallinity C might
also explain the better strength and high brittleness of multi-extruded composites, but
must be proven by further testing. However, in crystaline polymers, toughness is mainly
dependent on C because the crystals create molecular inflexibility, resulting in moderate
impact strength and ductility [27].
Wolcott and Englund [4] wrote a review on the industry of WPC’s and presented some of
the general mechanical behavior to be expected from these products. They explained how
WPC’s are more ductile but weaker than solid wood. The data presented here agrees with
that notion, the maximum MOE being 6,200 MPa for wood/PVC whereas common MOE
values for a 51 mm (2 inches) wide #3 southern pine would have been 9600 MPa (NDS
2005 edition [18]). In 2005, Kazemi-Najafi et al. [7] conducted several mechanical tests on
pressed composites of wood flour and recycled and virgin PP and HDPE. They found PP
composites stronger and stiffer than HDPE composites, but of lower unnotched impact
strengths and attributed these results to the superior mechanical properties of PP in
comparison with those of HDPE. They also discovered that the composites made of PP
and HDPE blends showed tensile properties comparable to those of composites made of
PP or HDPE and concluded that using both plastics in a composite was possible and did
not threaten the mechanical properties of the composite. The same observations can be
done here, with PP blends usually having a slightly higher MOE and MOR.

Modulus of elast icity per extrusion
0
1,000
2,000
3,000
4,000
5,000
6,000
7,000
0 1 2 3 4 5
Extrusion
MO
E (M
Pa)
Wood/ HDPE/ PP Wood/ PP
Wood/ PVC Wood/ HDPE
Wood/ HDPE/ PVC Wood/ PP/ PVC
Figure 2-7 Modulus of elasticity of the blends, using representative curves.
Strain at break per extrusion
0
0.005
0.01
0.015
0.02
0.025
0 1 2 3 4 5
Extrusion
ε br
eak
Wood/ HDPE/ PP Wood/ PPWood/ PVC Wood/ HDPEWood/ HDPE/ PVC Wood/ PP/ PVC
Figure 2-8 Strain at break of the blends, using representative curves.
26
Modulus of rupture per extrusion
0
5,000
10,000
15,000
20,000
25,000
30,000
35,000
40,000
45,000
50,000
0 1 2 3 4 5
Extrusion
MO
R (
kPa)
Wood/ HDPE/ PP Wood/ PPWood/ PVC Wood/ HDPEWood/ HDPE/ PVC Wood/ PP/ PVC
Figure 2-9 Modulus of rupture applied on the blends, using representative curves.
In addition to all these observations, the rule of mixture seems to apply to the MOE’s
found here. Here is the expression of this rule applied to the calculation of the MOE of a
composite in function of the MOE and the volume of its components:
mmffc VEVEE +=
In this expression, E is the modulus of elasticity, V is the volume and the subscripts c, f
and m stand for composite, fiber and matrix respectively. For WPC’s, the matrix
corresponds to the thermoplastic while wood is the fiber [33]. Since the composition of the
composites is known, determining the MOE of composites made of polymer blends using
the MOE of composites containing a single polymer is possible. For example, in the case
of wood/HDPE/PP, the MOE is approximately the average of the MOE’s of wood/HDPE
and wood/PP.
27
28
Calculations can be found in Appendix A, Table A.7. Apparently, Wood/HDPE/PP
followed this rule very closely but PVC introduced errors in the evaluation of the MOE.
Interestingly, when the number of extrusions increased, the calculations became more
accurate in the case of wood/HDPE/PP and wood/HDPE/PVC. On the contrary, the
results obtained from the rule of mixture became less accurate in the case of
Wood/PP/PVC. This loss of accuracy is possibly due to a degradation of the fiber during
processing, especially because of fiber shortening. On the other hand, the enhance
dispersion of the components might have improve the accuracy of the results for
wood/HDPE/PP and wood/HDPE/PVC.
3. Moisture resistance
Kazemi-Najafi et al. clearly explained the water sorption mechanics in 2007 [8], stating
that sorption usually occurs by capillarity because of gaps and flaws at the interface
between wood and polymers, in addition to the natural sorption of the wood particles
themselves. Studying the sorption properties of WPC’s made of flour and virgin and
recycled HDPE and PP, they found that the water sorption (∆W) and the thickness swell
(∆T) increased with immersion time and reached a saturation point. In their analysis, they
pointed out that composites made of HDPE showed a longer saturation time than those
containing PP and that the ∆W of composites with PP was generally higher than that of
composites from HDPE. They understood the poor water resistance of PP blends as a
consequence of the incomplete adhesion of the components, creating gaps and flaws at
the interfaces between polymers and wood.

In this investigation, wood/PE/PVC blends usually presented the shortest saturation time
and the highest ∆W. ∆W and ∆T values were high for wood/PP/PVC as well. In general,
the blends containing PVC presented the most important ∆W and ∆T, highlighting the
poor water resistance of blends of PVC.
Even if all the blends experienced some sorption during the test, the water resistance of
the WPC’s was still better than that of solid wood. When the composites contained
polymer blends, they did not react in any recognizable manner that could be due to the
use of these polymer blends.
Water sorption
The values of the ∆W were calculated with the following formula:
( )0
0 100*)()(
WWtW
tW−
=∆
In this equation, ∆W(t) is the percentage of water absorption at given time t of
immersion, W(t) represents the weight of the specimen after the time t and W0 is the
conditioned initial weigh.
For the diverse extrusions, the blend of wood/HDPE/PVC usually was the one absorbing
the most water, closely followed by wood/PP/PVC (Figures 2-10 to 2-13). After that,
wood/HDPE/PP and wood/HDPE showed more ∆W than wood/PVC and wood/PP,
except after the first extrusion.
The repeated extrusions obviously influenced the structure of the blends, leading to a
reduction of ∆W. As noticed during the flexural tests, the extrusions changed the
structure by re-mixing the blends. Since ∆W diminishes, it would make sense that the
29

structure gets more compact, with less gaps and a better adhesion between the
components.
The curves of the water absorption all plateau around 20% because of the fiber saturation
of the wood. The fiber saturation point is around 30% in most wood species [34]. Since the
composites contained approximately 60% of wood, the fiber saturation point of the
composites would be around 60%*30% = 18%. Then, by additioning the free water
present in the voids, the final plateau values can be obtained.
Water sorption - Extrusion 1
0.000
5.000
10.000
15.000
20.000
25.000
0 500 1000 1500 2000 2500 3000
Time (hrs)
Mas
s ch
ange
(%)
Wood/HDPE/PP
Wood/PP
Wood/PVC
Wood/HDPE
Wood/HDPE/PVC
Wood/PP/PVC
Figure 2-10 Plot of the water sorption, for the first extrusion.
30

Water sorption - Extrusion 2
0.000
5.000
10.000
15.000
20.000
25.000
0 500 1000 1500 2000 2500 3000
Time (hrs)
Mas
s ch
ange
(%)
Wood/HDPE/PP
Wood/PP
Wood/PVC
Wood/HDPE
Wood/HDPE/PVC
Wood/PP/PVC
Figure 2-11 Plot of the water sorption, for the second extrusion.
Water sorption - Extrusion 3
0.000
5.000
10.000
15.000
20.000
25.000
0 500 1000 1500 2000 2500 3000
Time (hrs)
Mas
s ch
ange
(%)
Wood/HDPE/PP
Wood/PP
Wood/PVC
Wood/HDPE
Wood/HDPE/PVC
Wood/PP/PVC
Figure 2-12 Plot of the water sorption, for the third extrusion.
31

Water sorption - Extrusion 4
0.000
5.000
10.000
15.000
20.000
25.000
0 500 1000 1500 2000 2500 3000
Time (hrs)
Mas
s ch
ange
(%)
Wood/HDPE/PPWood/PPWood/HDPEWood/HDPE/PVCWood/PP/PVC
Figure 2-13 Plot of the water sorption, for the fourth extrusion.
Thickness swelling
∆T values were calculated with the following equation:
( )0
0 100*)()(
TTtT
tT−
=∆
In this equation, ∆T(t) is the percentage of thickness swelling at a given time t of
immersion, T(t) is the thickness of the specimen at the time t and T0 is the conditioned
initial thickness.
Very similar observations and conclusions can be made on ∆T. Again, the samples that
experienced the highest ∆T were wood/HDPE/PVC and wood/PP/PVC. The ∆T of
wood/PVC was very high as well, once more demonstrating PVC blends’ weakness to
water. Perhpa, PVC did not adhere well to the wood and left gaps at the interface.
Another explanation would be that, since PVC is denser, there is more wood flour in the
32

PVC-based WPC’s (the composition was calculated by mass, not by volume). Besides,
∆T decreased as well when the samples underwent multiple extrusions. The results in
terms of ∆T are indicated Figure 2-14 while the graphs of the other extrusions can be
found in Appendix C.
Thickness swelling - Extrusion 1
0
2
4
6
8
10
12
14
16
18
0 500 1000 1500 2000 2500 3000
Time (hrs)
Thic
knes
s ch
ange
(%)
Wood/HDPE/PPWood/PPWood/PVCWood/HDPEWood/HDPE/PVCWood/PP/PVC
Figure 2-14 Plot of the thickness swelling versus immersion time, first extrusion.
Impact of the number of extrusions
As noticed before, the number of extrusions had an influence on the water resistance of
the composites. To verify that observation, ∆W and ∆T curves were compared for each
formulation in function of the number of extrusion, Figures 2-15 to 2-20. Apparently, the
water resistance greatly increased between the first two extrusions, except in the cases of
wood/HDPE and wood/HDPE/PP blends whose ∆W diminished less noticeably.
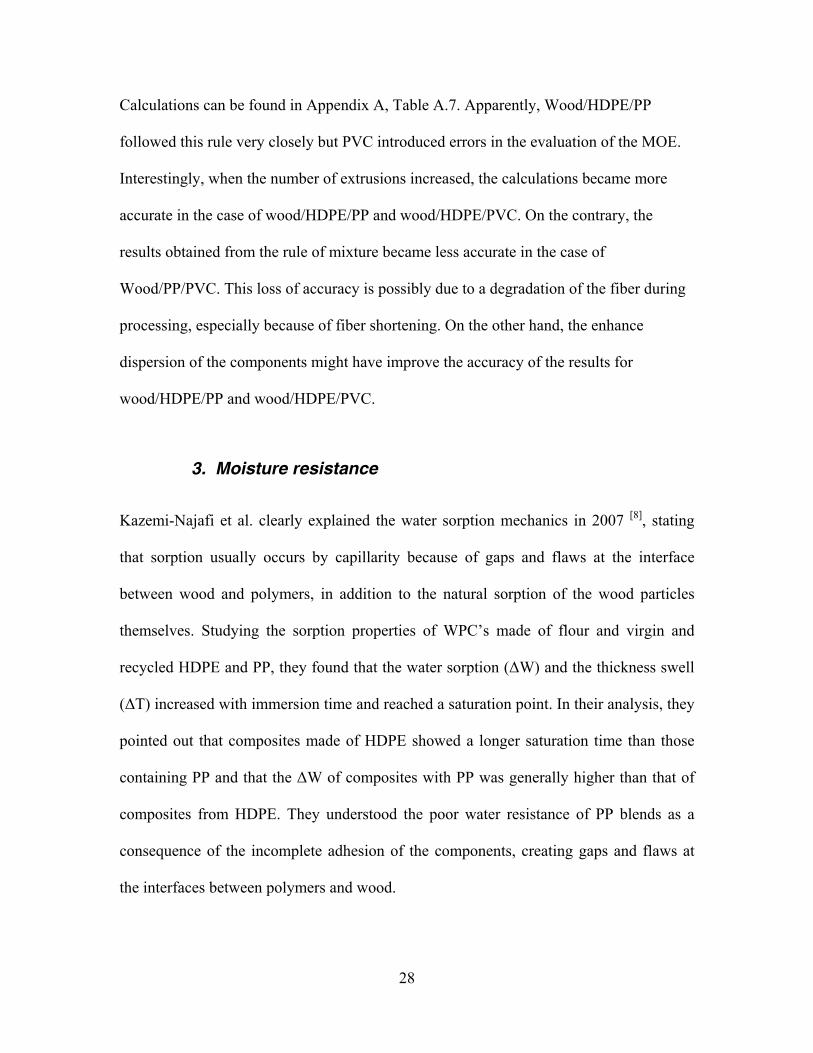
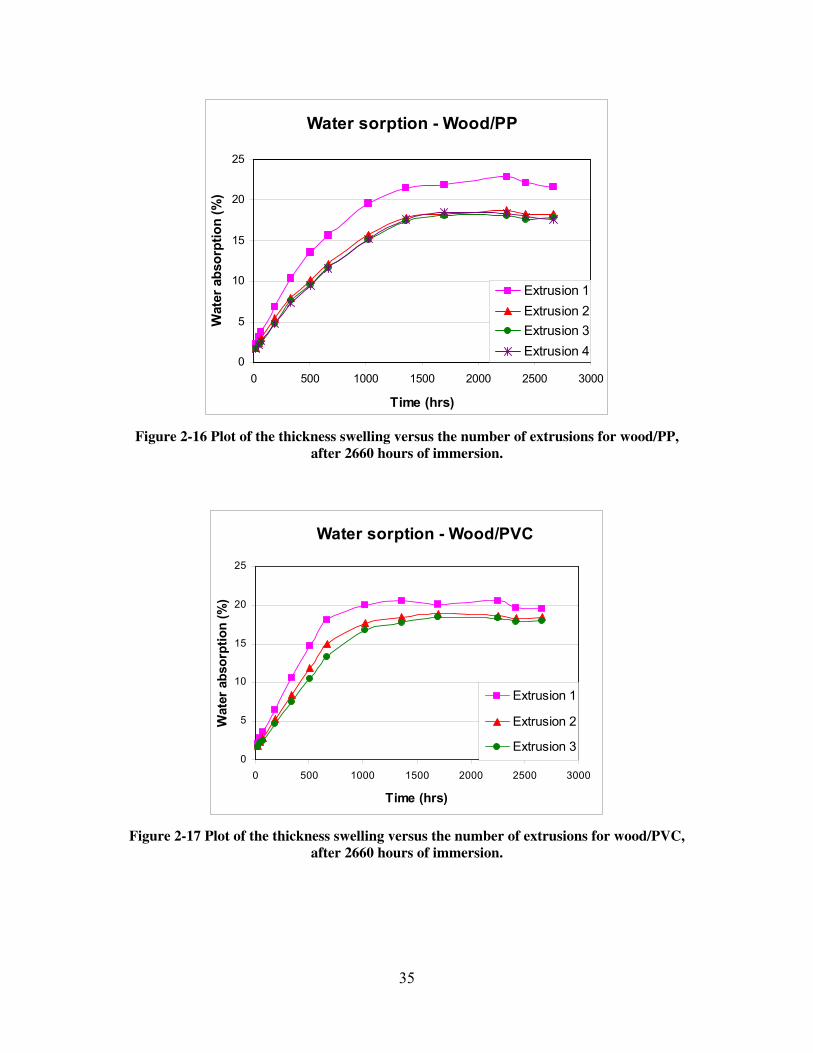
The plots Figure 2-15 to Figure 2-20 confirm that the additional extrusions decreased ∆W
and ∆T for all the blends. The multiple processing apparently improved the structure of
33
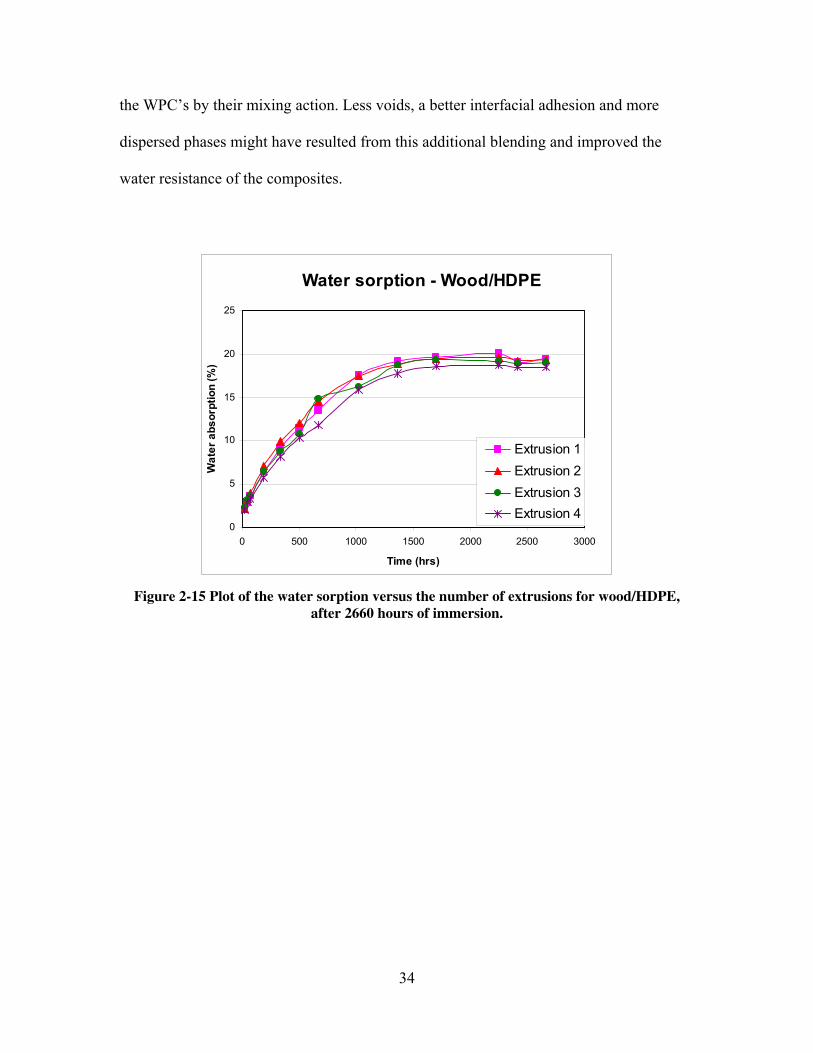
the WPC’s by their mixing action. Less voids, a better interfacial adhesion and more
dispersed phases might have resulted from this additional blending and improved the
water resistance of the composites.
Water sorption - Wood/HDPE
0
5
10
15
20
25
0 500 1000 1500 2000 2500 3000
Time (hrs)
Wat
er a
bsor
ptio
n (%
)
Extrusion 1Extrusion 2Extrusion 3Extrusion 4
Figure 2-15 Plot of the water sorption versus the number of extrusions for wood/HDPE,
after 2660 hours of immersion.
34
Water sorption - Wood/PP
0
5
10
15
20
25
0 500 1000 1500 2000 2500 3000
Time (hrs)
Wat
er a
bsor
ptio
n (%
)
Extrusion 1Extrusion 2Extrusion 3Extrusion 4
Figure 2-16 Plot of the thickness swelling versus the number of extrusions for wood/PP,
after 2660 hours of immersion.
Water sorption - Wood/PVC
0
5
10
15
20
25
0 500 1000 1500 2000 2500 3000
Time (hrs)
Wat
er a
bsor
ptio
n (%
)
Extrusion 1
Extrusion 2
Extrusion 3
Figure 2-17 Plot of the thickness swelling versus the number of extrusions for wood/PVC,
after 2660 hours of immersion.
35

Water sorption - Wood/HDPE/PP
0
5
10
15
20
25
0 500 1000 1500 2000 2500 3000
Time (hrs)
Wat
er a
bsor
ptio
n (%
)
Extrusion 1Extrusion 2Extrusion 3Extrusion 4
Figure 2-18 Plot of the thickness swelling versus the number of extrusions for
wood/HDPE/PP, after 2660 hours of immersion.
Water sorption - Wood/HDPE/PVC
0
5
10
15
20
25
0 500 1000 1500 2000 2500 3000
Time (hrs)
Wat
er a
bsor
ptio
n (%
)
Extrusion 1Extrusion 2Extrusion 3Extrusion 4
Figure 2-19 Plot of the thickness swelling versus the number of extrusions for
wood/HDPE/PVC, after 2660 hours of immersion.
36

Water sorption - Wood/PP/PVC
0
5
10
15
20
25
0 500 1000 1500 2000 2500 3000
Time (hrs)
Wat
er a
bsor
ptio
n (%
)
Extrusion 1Extrusion 2Extrusion 3Extrusion 4
Figure 2-20 Plot of the thickness swelling versus the number of extrusions for
wood/PP/PVC, after 2660 hours of immersion.
37
38
IV. Conclusion on the effect of re-processing and polymers
blends on WPC’s mechanical behavior
Blends containing PVC were the easier to process, stiffer and more brittle than the other
blends, but their water resistance was not as effective. For its part, PP has a high Tm
which made this polymer more difficult to process. Nevertheless, blends of PP were more
ductile than PVC blends and presented the best water resistance. Finally, HDPE made
ductile WPC’s that had an average water resistance and an average processability.
Using polymer blends to create the WPC’s did not show any particular disadvantage. The
mechanical and physical properties observed depended on the components of the blends,
not the fact that polymer blends were used. WPC’s containing polymer blends often
exhibited intermediate properties that depended on the blends they were made of, leaving
no real objection to the use of several polymers to manufacture a WPC.
Repeated extrusions increased the stiffness, the brittleness and the water resistance of the
composites. Possibly, the molecular structure of the samples was changed during these
extrusions. The re-mixing impacted the structure and the morphology of the composites,
certainly improving the homogeneity and reducing the occurrence of flaws and gaps.
Other possibilities are that some degradation occurred, increasing the brittleness.
Eventually, an increase in crystallinity cannot be excluded since the molecular flexibility
of a polymer is related to Xc [27], but that assumption need to be proven. In the end, multi-
processing has advantages as well as disadvantages and the future application of the
processed material needs to be taken in account before applying this technique.

39
References
[1] Camacho W, Karlsson S. Assessment of thermal and thermo-oxidative stability of multi-extruded PP, HDPE and a blend thereof. Elsevier, Polymer Degradation and Stability 2002 78, 385-391.
[2] Matuana LM., Kim JW. Fusion characteristics of rigid PVC/wood-flour composites by torque rheometry. Journal of vinyl & additive technology 2007.
[3] Clemons CM. Wood-Plastic Composites in the United States. The interfacing of two industries, Forest Products Journal vol. 52, No. 6, June 2002.
[4] Wolcott M, Englund K. A technology review of wood-plastic composites. 33rd International Particleboard / Composite Materials Symposium.
[5] Klason C, Kubat J, Stromvall HE. The efficiency of cellulosic fillers in common thermoplastics. Part I. Filling without processing aids or coupling agents. International Journal of Polymeric Materials 1984. 10:159-187.
[6] Youngquist JA, Myers GE, Muehl JM, Krzysik AM, Clemons CM. Composites From Recycled Wood and Plastics. Final Report for U.S. Environmental Protection Agency, Project #IAG-DW-12934608-2. USDA, forest service, forest products laboratory, Madison WI, 1993.
[7] Kazemi-Najafi S, , Hamidinia E, Tajvidi M. Mechanical Properties of Composites from Sawdust and recycled Plastics. Wiley Intersciences 2005.
[8] Kazemi-Najafi S, Kiaefar A, Hamidina E, Tajvidi M. Water Sorption Behavior of Composites from Sawdust and Recycled Plastics. Journal of Reinforced Plastics and Composites 2007; 26; 341. DOI: 10.1177/0731684407072519.
[9] Winandy JE, Stark NM and Clemons CM. Considerations in recycling of wood-plastic composites. RWU4706 Performance Engineered Composites, 5th Global Wood and Natural Composites Symposium, 2004.
[10] Farahmand F, Mehrabzadeh M. Recycling of Commingled Plastic Waste Containing Polypropylene, Polyethylene and Paper. Journal of Applied Polymer Science 2001, Vol. 80, 2573-2577.
[11] Farahmand F, Shokrollahi P, Mehrabzadeh M. “Recycling of Commingled Plastic Waste Containing Polyvinylchloride, Polypropylene, Polyethylene and Paper. Iranian Polymer Journal 2003, 12 (3), 185-190.
[12] Lei Y, Wu Q, Yao F, Xu F.Preparation and properties of recycled HDPE/natural fiber composites. Elsevier, Composites: Part B 39 807-815 (2008).
[13] Augier L, Sperone G, Vaca-Garcia C, Borredon ME. Influence of the wood fiber filler on the internal recycling of poly(vinyl chloride)-based composites. Elsevier, Polymer Degradation and Stability 2007, 92, 1169-1176.
[14] Yang W, Liu Z, Shan G, Li Z, Xie B, Yang M. Study on the melt flow behavior of glass bead filled polypropylene. Elsevier, Polymer Testing 2005, 24, 490-497.
[15] Wang X, Chen X, Yu W, Ji Y, Hu X, Xu J. Applications of rheological torque-time curves to the study of thermooxidative degradation of

40
polypropylene powder. Journal of applied polymer science 2007, vol. 105, no 3, 1316-1330.
[16] Migneault S, Koubaa A, Erchiqui F, Chaala A, Englund K, Krause C, Wolcott M. Effect of Fiber Length on Processing and Properties of Extruded Wood-Fiber/HDPE Composites. Journal of Applied Polymer Science 2008, DOI 10.1002.
[17] American Society of Testing and Materials standards. ASTM D 790 [18] ANSI/AF&PA NDS-2005. National Design Specification (NDS) for Wood
Construction [19] Sanadi AR, Young RA, Clemons CM, Rowell RM. Recycled newspaper
fibers as reinforcing fillers in thermoplastics: Part 1 – Analysis of tensile and impact properties in polypropylene. Journal of Reinforced Plastics and Composites
[20] Principia Partners. “Natural & Wood Fiber Composites: the Principia Newsletter, Vol. 1, No. 9. September 30, 2002.
[21] Li J, Shanks RA, Olley RH, Greenway GR. Miscibility and isothermal crystallization of polypropylene in polyethylene melts. Elsevier ScienceDirect, Polymer 42, 2001, 7685-7694.
[22] Shanks RA, Li J, Yu L. Polypropylene-polyethylene blend morphology controlled by time-temperature-miscibility. Elsevier ScienceDirect, Polymer 41, 2002, 2133-2139.
[23] Jianglei Qin, Jungang Gao, Zhiting Li, Mingtao Run. Nonisothermal Crystallization, Melting Behavior, and Morphology of Polypropylene/Linear Bimodal Polyethylene Blends. Journal of Applied Polymer Science 2008, Vol. 107, 1235-1242.
[24] Krumme A, Lehtinen A, Viikna A. Crystallisation behaviour of high density polyethylene blends with bimodal molar mass distribution 2. Non-isothermal crystallisation. European Polymer Journal 40 (2004) 371–378.
[25] Fonseca CA, Harrison IR. An investigation of co-crystallization in LDPE/HDPE blends using DSC and TREF. Thermochimica Acta 313 (1998) 37-41.
[26] Martuscelli E. Polymer blends: processing, morphology and properties. Springer 1999.
[27] Kutz M. Handbook of Materials Selection. John Wiley and Sons, 2002, p. 574 [28] Gedde UW. Polymer physics. Chapman & Hall 1995. [29] Stein RS, Powers J. Topics in polymer physics. Imperial College Press 2006. [30] Privalko VP, Novikov VV. The science of heterogeneous polymers. Structure
and thermophysical properties. John Wiley & Sons 1995. [31] Bower DL. An introduction to polymer physics. Cambridge University Press,
2002, page 344-349. [32] Department of physics and astronomy, Georgia State University.
Hyperphysics 2006. [33] Bhargava AK. Engineering materials: polymers, ceramics and composites.
PHI Learning Pvt. Ltd. 2005. [34] Rowell RM. Handbook of wood chemistry and wood composites. CRC Press
2005.

41
CHAPTER III – CRYSTALLIZATION, MELTING AND
OXIDATION ASPECTS
Abstract
The thermal and structural characteristics of WPC’s made of polymer blends were
evaluated by differential scanning calorimetry. These composites were also extruded four
times to experiment extensive mixing on these products. Transition temperatures such as
the melting point and the crystallization temperature were calculated, as well as the
degree of crystallinity, the rate of crystallization and the oxidation induction times (OIT)
of the samples. Results show that wood increased the melting point of most blends and
reduced the crystallization temperature of HDPE-based composites. On the other hand,
PVC diminished the melting point of PP-based blends. The different components were
deemed immiscible and melted and crystallized separately. Re-mixing increased the
degree of crystallinity, the half-time of crystallization and temperature of crystallization,
but decreased the melting temperature, which might indicate structural degradation.
Blends containing PVC experienced much higher OIT than PP or HDPE. The number of
extrusions did not change the OIT of the composites tested.

42
I. WPC’s and polymers blending issues
Polymers can be complex materials to deal with. They can be divided in two main
categories: the amorphous and the semicrystalline [1][2][3][4]. Amorphous polymers are
usually atactic polymers, copolymers or highly branched polymers. Their irregular
structure prevents them to crystallize and melt. Instead, as they cool down they will
experience a glass transition. Below their glass transition temperature (Tg), amorphous
polymers are in a glassy state and become hard and brittle. Above Tg, they are in a
rubbery state and soft and flexible, showing viscoelastic behavior. On the contrary,
semicrystalline polymers can crystallize at a crystallization temperature (Tc). They
consist of two components; one is crystalline and composed of thin lamella-shaped
crystals. The other one is amorphous. The degree of crystallinity C can vary substantially
from one polymer to another. As semicrystalline polymers have an amorphous and a
crystalline component, they can have both Tg and Tc (the crystals will be melting and the
amorphous components will be undergoing a glass transition).
Some of the most common polymers in the WPC’s industry are HDPE, PP and PVC.
HDPE has a linear morphology and is relatively strong. This thermoplastic polymer is
highly crystalline and usually presents a Tm ranging from 128°C to 130 °C and a Tc of
between 112°C and 116°C [6][7][8][13][17]. PP is a polyolefin similar to HDPE, the only
difference being that on every other carbon atom in the backbone chain has a methyl
group attached to it. PP is a thermoplastic that crystallizes from 112°C to 130°C and
melts around 159-165°C [6][7][8][17][21]. Additionally, PVC is a vinyl polymer known for its
capacity to resist both fire and water. This thermoplastic is often highly amorphous and

43
experiences a Tg around 81°C [20]. As the PVC used here is amorphous, this polymer will
not melt but may soften to a point of viscous flow similar to melting when heated.
Most polymers are immiscible with each other and their blends will give a phase-
separated solution. This kind of substance is called an immiscible blend, even if the word
“blend” is supposedly reserved to miscible materials. Immiscible blends can show
interesting properties. The morphology of the blend depends on the concentration of each
polymer, usually showing either co-continuous or spherical shaped phases. The
processing method plays also an important role on the morphology. Blend morphology is
directly linked to its mechanical properties. In immiscible blends, phases are not bound
very efficiently but using compatibilizers can solve this problem, improving the transfer
of stress and energy throughout the blend. Properties of polymer blends mainly depend
on morphology and thermal stability, for example a blend with dispersed phases will be
stronger. In heterogeneous systems, the components preserve some of their individual
properties because the polymers are incompatible. When the blends contain crystalline
components, the crystallinity strongly influences the properties of the components
[1][2][3][4][5][6][7].
Many researchers have taken interest in polymer blends of HDPE and PP. Qin et al. [8]
investigated PP and linear bimodal polyethylene (LBPE) blends and showed that PP and
LBPE were miscible to a certain extent and that there was no obvious separation of
phases in the blend. LBPE is a new polyolefin that contains both a high-molecular-weight
and a low-molecular-weight component. Good rheological properties, thermal stability
and aging resistance characterize this polymer. They looked at the non-isothermal
crystallization kinetics of the blends and found that the crystallization nucleation was

44
homogeneous, that the growth of spherulites was three-dimensional and that the
crystallization mechanism of PP was hardly affected by LBPE. All DSC traces showed
two crystallization peaks for the blends of LBPE/PP, indicating that two crystallizable
components co-exist in the blends. Observing the influence of LBPE on the crystallinity
of PP, Qin et al. found that for an 80% PP / 20% LBPE blend, the crystallinity was much
higher than that of pure PP because the LBPE molecules had entered the PP crystal. On
the other hand, for a 60% PP / 40% LBPE blend, the crystallinity was a little lower than
that of pure PP because some PP chains dissolved in the LBPE melt.
For their part, Shanks and Li et al. [7] investigated blends of PP and different kinds of
polyethylene in various studies. The polyethylenes in question were high density
(HDPE), low density (LDPE), linear low density (LLDPE), very low density (VLDPE)
and ultra low density polyethylene (ULDPE). Each blend contained 20% PP by mass.
They used the Avrami equation to determine the crystallization rates of the blends. To
determine the miscibility of the polymers, they compared the isothermal crystallization
half-times (t1/2) of the blends. When t1/2 was the same as pure PP, they concluded that the
components of this blend were immiscible. PP was found immiscible with HDPE, LDPE
and VLDPE, miscible with LLDPE. With the immiscible polyethylenes, among them
HDPE, the two phases of the blend crystallized independently. Under these conditions,
the t1/2 of PP was very similar to that of pure PP. In the case of LLDPE, The
crystallization took place from a solution in the molten polyethylene and the
crystallization rate of PP was decreased. Broad diffuse spherulites formed and PP
crystallized as a homogeneous phase. They also found that the crystallization of PP
occurred at varying Tc, depending on the blend’s miscibility, even if the polymer always
melted between 159°C and 163°C. HDPE crystallized at 112°C, which was the highest Tc

45
among the polyethylenes. The blend of PP/HDPE crystallized at 114.8°C and had two
melting peaks at 131.1°C and 159.5°C. Several crystallization peaks were recorded for
blends containing VLDPE, ULDPE or LDPE but only one for blends containing LLDPE
or HDPE. In the PP/HDPE blend, PP appeared as large droplets dispersed in the HDPE
melt. From the dimension of those droplets and the crystallization curves recorded, they
understood that heterogeneous nucleation dominated in this blend, as well as in the other
immiscible blends. Microscopy analysis showed that the bond between PP and HDPE
was mechanically weak and easily penetrated. The phases were not continuous.
Martuscelli [17] also investigated the morphology and crystallization behavior of
PP/HDPE blends and explained that even if these blends generally formed a multiphase
system, the interphase adhesion could be sufficient to determine good properties. For
some blend composition, a certain synergy existed because of interfacial effects and
partial miscibility of HDPE and PP chains in the molten state. Co-crystallization was
impossible because of the molecular structure differences between the polymers, and the
presence of individual Tm indicated their incompatibility in the solid state. In his studies,
he showed that the kinetics of crystallization of HDPE were delayed by the addition of a
small amount of PP (10% by weight), and found a significant increase in the Avrami
coefficient from 2.3 for pure HDPE to 3.2 for PP/HDPE (10/90), attributing this increase
to a change from instantaneous to sporadic nucleation. He finally concluded that, even
indirectly, PP and HDPE were immiscible but had a certain degree of compatibility in the
melt.
A correctly mixed blend will have co-continuous or dispersed phases, with good
interfacial adhesion to prevent voids that would weaken the blend and insure correct

46
stress transfer. But, mixing need to be done carefully because the heat and the shear
developed during processing might damage the materials. To watch for oxidative
degradation on the blends, understanding the oxidation properties of the processed
materials is necessary. In 2009, Camacho and Karlsson [9] studied the oxidation and
thermal stability of multi-extruded blends of recycled PP, HDPE and a blend of 20% PP /
80% HDPE. They showed that the OIT and the temperature of oxidation of the polymers
and their blend decreased with the number of extrusion cycles. Because the thermal
stability of the HDPE decreased with the number of extrusions, they concluded that the
shear forces applied on the polymer during processing might induce the chain scission of
the polymer backbone and shorten the chains. In the case of PP, however, the decrease in
thermal stability was recorded until the third extrusion only. For both PP and HDPE,
chain scission occurred during all the extrusions while no cross-linking nor chain
branching were observed. The behavior of a blend of those two polymers, with 20% of
PP, showed a synergetic tendency and two peaks appeared on the DSC curves, one for
HDPE and the other for PP. The PP seemed to oxidize first and accelerate the oxidation
of HDPE due to the presence of oxidation sites in the HDPE-PP interfaces. The blend
appeared to be a two-phase blend.
However, concerning the oxidation of the blends, Schmidt et al. [14] compared the data
obtained from three round robin tests campaigns and showed that the determination of
OIT on several species of polyethylene (low and high density) were associated with a
high degree of uncertainty, especially for low values (up to 70% for OIT = 3 minutes,
around 15% for OIT ≥ 20 minutes).

47
Objectives
Even if immiscible, polymers can be mixed into useful blends. Using polymer blends to
create WPC’s is not common but would offer great development opportunities for the
industry. Having the possibility to use polymer blends instead of pure polymers should
give more manufacturing flexibility and mixed plastic extrusion of WPC’s could lower
the price point, open up new recovered polymer sources, which can potentially extend the
range of WPC products already on the market and maybe open the doors to new
applications of these products. Moreover, the use of polymer blends can find the greatest
benefit within the single-stream recycling markets. In post-consumer single-stream
recycling, polymers are not separated curbside, resulting in added processing costs to
separate the polymers. Using several types of polymers together, without prior separation
or treatment would be very economical. This project focus is to evaluate the potential of
using polymer blends to manufacture WPC’s and the impact of multiple extrusions on
those same composites with respect to their thermal and oxidative properties
The objectives were:
• To identify the crystallization characteristics of the composites,
• To estimate the impact of processing and polymer blends on the WPC’s melting
point,
• To evaluate the changes in oxidative resistance of the WPC’s in function of the
presence of polymer blends and the number of applied extrusions,
• To determine the impact of repeated processing on those thermal properties of and
look for any degradation of the structure of the composites.
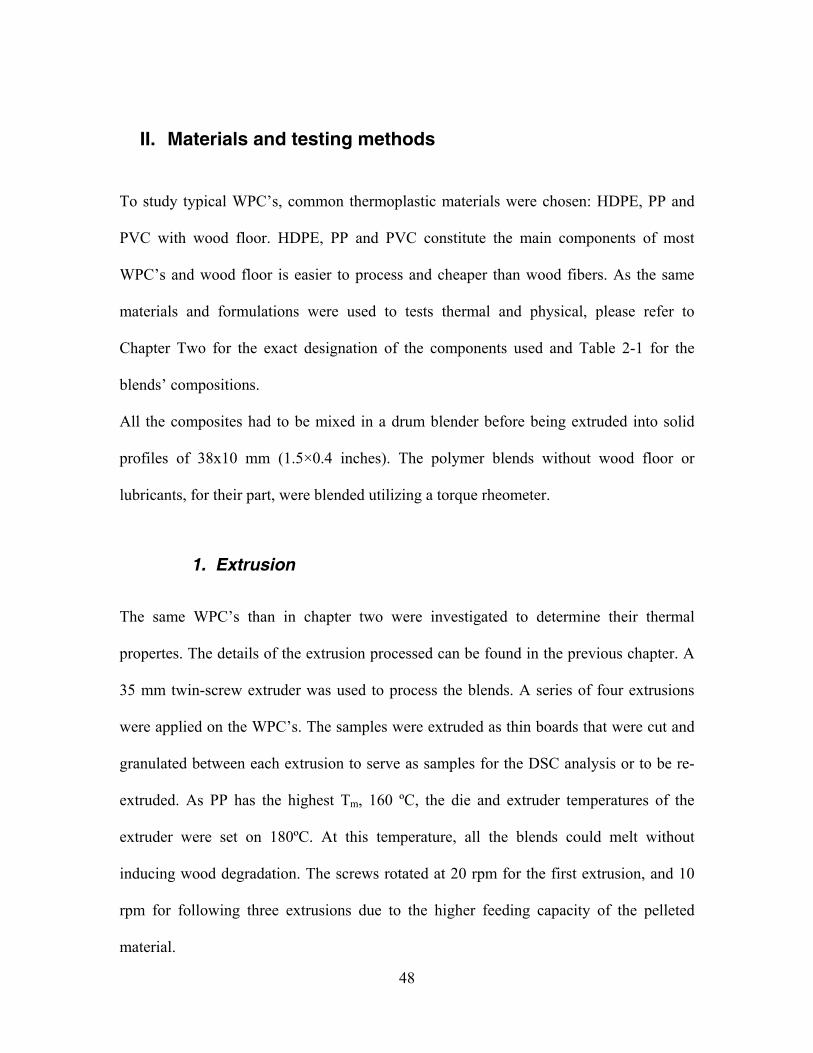
48
II. Materials and testing methods
To study typical WPC’s, common thermoplastic materials were chosen: HDPE, PP and
PVC with wood floor. HDPE, PP and PVC constitute the main components of most
WPC’s and wood floor is easier to process and cheaper than wood fibers. As the same
materials and formulations were used to tests thermal and physical, please refer to
Chapter Two for the exact designation of the components used and Table 2-1 for the
blends’ compositions.
All the composites had to be mixed in a drum blender before being extruded into solid
profiles of 38x10 mm (1.5×0.4 inches). The polymer blends without wood floor or
lubricants, for their part, were blended utilizing a torque rheometer.
1. Extrusion
The same WPC’s than in chapter two were investigated to determine their thermal
propertes. The details of the extrusion processed can be found in the previous chapter. A
35 mm twin-screw extruder was used to process the blends. A series of four extrusions
were applied on the WPC’s. The samples were extruded as thin boards that were cut and
granulated between each extrusion to serve as samples for the DSC analysis or to be re-
extruded. As PP has the highest Tm, 160 ºC, the die and extruder temperatures of the
extruder were set on 180ºC. At this temperature, all the blends could melt without
inducing wood degradation. The screws rotated at 20 rpm for the first extrusion, and 10
rpm for following three extrusions due to the higher feeding capacity of the pelleted
material.

49
2. Thermal transitions and crystallization
The non-isothermal crystallization of the WPC’s was examined and Tc, Tm, C and t1/2
were determined by using DSC. After each extrusion, some of the boards were ground
into powder with a 20 mesh screen and conditioned in hermetic containers to protect
them against moisture. Then, they were placed in 40µl aluminum crucibles, those pans
were sealed and the samples could be tested in the DSC. Each pan contained
approximately 5 mg of powdered material. Three samples were scanned for each
specimen from each extrusion.
Two cycles of heating and cooling were applied on the specimens, with a starting
temperature of 40ºC. The samples were heated up to 220ºC, kept at this temperature for 3
minutes and then cooled and heated again at a heating rate of 20ºC/min, creating seven
thermal segments as shown Table 3-1. In these seven segments, only two were
meaningful: the third and the fifth. The exothermic reaction due to the crystallization of
the samples appeared on the third segment, when the temperature cooled down form 220
ºC to 40 ºC. The second cooling, segment 7, was not used because the multiple
temperature changes could have affected the structure of the blend and degraded it. On
the fifth segment the samples were heated and melted. Two heating cycles were
performed to first erase the thermal history of the samples (in segment #1) and obtain
more accurate results on segment #5, when the next endothermic reaction occurred.

Table 3-1 Heating segments used on the differential scanning calorimter (DSC)
Seg. 1 Seg. 2 Seg. 3 Seg. 4 Seg. 5 Seg. 6 Seg. 7
Start temp. 40ºC 220ºC 40ºC 220ºC
End temp. 220ºC 40ºC 220ºC 40ºC
Heating rate 20ºC/min
Isotherm – 3 m
in
20ºC/min
Isotherm – 3 m
in
20ºC/min
Isotherm – 3 m
in
20ºC/min
Tc and Tm correspond on the curve to the peak heat flow recorded by the DSC, as shown
on Figure 2. Even if Tg could theoretically be determined as well, this thermal transition
did not appear during this investigation because of the crystalline nature of most blends.
Even tests on PVC, which is amorphous, did not show any recognizable glass transition.
The degree of crystallinity Xc was evaluated using the heat of fusion and according to the
following formula [24][25];
100.X%100
c HH
∆∆
=
In this equation, Xc represents the percentage of crystallinity of the semicrystalline
material, ∆H is the measured heat of fusion in J/g , ∆H100% is the heat of fusion of 100%
crystalline material. The following enthalpy values were provided by Mettler Toledo and
used for the thermoplastics: ∆H100% of HDPE = 293.6 J/g and ∆H100% of PP = 207.1 J/g.
3. Oxidation Induction
Determination of the thermal oxidation behavior of the wood-filled and unfilled polymers
and there blends were conducted according to ASTM D 3895-02 requirements and
carried out on a DSC. Three samples of 6 mg ± 0.1 were run for each sample of each 50

series of extrusions, again with the ground material from the extruded boards. These
samples were placed in unsealed aluminum pans.
Like illustrated on Figure 3-1, nitrogen and oxygen were alternatively used on the DSC.
The samples of were heated in a nitrogen environment, which is an inert gas, up to
200°C. After that, the gas was switched from nitrogen to oxygen and the temperature of
200°C was maintained. The time when the gases switched was recorded and served as
point zero time (t0) for the experiment. When the oxidative reaction occurred, the test was
then terminated.
The recorded baseline before the oxidative exotherm needs to be extended while the
steepest linear slope of this exotherm is extrapolated and intercepts the extended baseline
at the interception time ti. The OIT is defined as the time measured from point zero time
t0 to this intercept point ti:
OIT = ti - t0.
51
Figure 3-1 Principle sequence of OIT according to ISO 11357-6 (Schmitt et al. [10]).
Time
(min)t0 ti
Heat
Flow Nitrogen Oxygen
OIT

52
III. Thermal and morphological response of the tested WPC’s
1. Thermal transitions and crystallization
The curves presented are representative curves. All curves of a same set of tests
(corresponding to an extrusion) are very similar, their general shapes are identical. Tm
and Tc were evaluated when the heat flow peaks occurred, the endothermic reaction
corresponding to the melting and the exothermic reaction corresponding to the
crystallization of the blends. These calculations seem very accurate since the coefficients
of variation between the results were remarkably small, except when the degrees of
crystallinity were evaluated. This is mostly due to the difficulties to identically draw a
straight baseline for all the blends.
Neat polymers and polymer blends
Table 3-2 Thermal properties of neat polymers and polymer blends.
Crystallization temperature
Melting temperature Degree of
Crystallinity
Tc (°C) % cov Tm1 (°C) % cov 1 Tm2 (°C) % cov 2 Xc(%) % cov
HDPE 115.2 0.25 129 0.22 / / 44.40 7.10
PP 106.7 0.07 / / 159.4 1.69 35.70 4.90
HDPE/PP 114.1 1.35 130.8 2.01 160.4 2.0 39.64 39.64
HDPE/PVC 115.2 0.92 130.2 0.94 / / 23.11 15.74
PP/PVC 109.9 2.07 / / 155.5 0.08 20.15 11.12
HDPE/PP /PVC
114.2 0.92 129.3 0.10 156.8 0.77 26.71 4.50

In Table 3-2, the term “cov” corresponds to the coefficient of variation between the
results of each sample of a blend. Peaks occurred around 115°C for virgin HDPE and
107°C for PP (Table 3-2 and Figure 3-3). These Tc’s are backed up by the literature
[6][7][13][14] where authors usually found temperatures between 112°C and 115°C for HDPE
and 106°C for PP. The Tc’s of polymer blends and WPC’s containing HDPE were very
close to the Tc of HDPE: 114.1°C for HDPE/PP and 114.2°C for HDPE/PP/PVC for
example (Figure 3-3). In the case of the HDPE/PVC blend, the same temperature as
virgin HDPE was found, 115.2°C. PP apparently tended to reduce the Tc of HDPE by
1%; PVC did not affect the Tc of HDPE.
HDPE and PP: Crystallization
-5
0
5
10
15
20
25
30
25 50 75 100 125 150 175 200 225
Ref. Temp. ( °C)
Hea
ting
Flo
w (
mW
)- E
xo -
HDPE
PP
Figure 3-1 Crystallization of neat polymers.
53

Polymer blends: Crystallization
-10
-5
0
5
10
15
20
25
30
35
40
0 50 100 150 200 250
Ref. temp. (°C)
Hea
ting
Flow
(mW
)- E
xo -
HDPE/PP
HDPE/PVCPP/PVC
HDPE/PP/PVCHDPE
PP
Figure 3-2 Crystallization of polymer blends during their cooling in DSC.
Concerning the melting behavior, the tests on virgin HDPE and PP displayed in Figure 3-
4 revealed Tm’s of 129°C for HDPE and 159°C for PP, confirmed by several authors
[6][7][13][14] who usually found temperatures around 130°C for HDPE and 160°C for PP.
Blends containing HDPE melted around the Tm of this polymer while blends that
contained PP melted around that of PP (Figure 3-5).
54

HDPE and PP: Melting
-25
-20
-15
-10
-5
0
5
25 50 75 100 125 150 175 200 225
Ref. Temp. (°C)
Hea
ting
Flo
w (
mW
)- E
ndo
-
HDPE
PP
Figure 3-3 Melting of neat polymers.
Polymer blends: Melting
-25
-20
-15
-10
-5
0
5
10
0 50 100 150 200 250
Ref. temp. (°C)
Hea
ting
Flow
(mW
)- E
ndo
-
HDPE/PP HDPE/PVCPP/PVC HDPE/PP/PVCHDPE PP
Figure 3-4 Melting of polymer blends during their heating in DSC.
55

Wood-plastic composites
• Temperature of crystallization
For the HDPE-based composites in Table 3-3, after the first two extrusions, adding wood
to the polymer blends reduced Tc by approximately 4°C. For the next extrusions, this
reduction in Tc diminished greatly. The difference between the Tc’s of the polymer blends
and the WPC’s almost disappeared. Wood appeared to have an impact on the
crystallization of HDPE-based blends. When the number of extrusions increased, this
impact diminished, possibly because of the degradation of the material’s structure and an
alteration of the wood or the polymers.
CRYSTALLI ZATI ON, extrusion 1 / HDPE-based blends
-5
0
5
10
15
20
25
30
35
40
0 50 100 150 200 250
Ref. Temp. ( °C)
Hea
ting
Flo
w (
mW
)- E
xo -
Wood / HDPEWood/ HDPE/ PPWood/ HDPE/ PVCHDPE
Wood/ HDPE/ PP Wood/ HDPE/ PVC
Wood/ HDPE
Figure 3-5 Crystallization of HDPE-based composites after one extrusion.
56

When PP was a component, the addition of wood had a different impact on the
crystallization of the blends, as shown in Table 3-4. In the case of wood/PP composites,
adding wood to the PP increased its Tc. For the wood/HDPE/PP blend, concerning the
two first extrusions, Tc was closer to the temperature of PP. For the next couple of
extrusions, Tc was closer to the temperature of HDPE. In fact, for the extrusions number
1 and 2, Tc was between those of PP and HDPE. The Tc of the wood/PP/PVC blend
regularly increased after each extrusion. For the two first extrusions, Tc was smaller than
that of PP/PVC but higher than that one of PP alone. For the third and fourth extrusions,
Tc became almost the same as that of PP/PVC.
CRYSTALLI ZATI ON, extrusion 1 / PP-based blends
0
2
4
6
8
10
12
14
16
18
0 50 100 150 200 250
Ref. Temp. ( °C)
Hea
ting
Flo
w (
mW
)- E
xo -
Wood/ PPWood/ HDPE/ PPWood/ PP/ PVCPP
Wood/ HDPE/ PP
Wood/ PP Wood/ PP/ PVC
Figure 3-6 Crystallization of PP-based composites after one extrusion.
57

58
On one hand, the blends of HDPE/PP and PP/PVC crystallized at a higher Tc than PP,
which could mean that PVC increased Tc and HDPE/PP crystallized at HDPE’s Tc. But,
on the other hand, Tc was also increased by the addition of wood (contrarily to HDPE-
based composites) as explained earlier, except in the case of wood/PP/PVC. This proves
that PP’s crystallization behavior changed in the presence of wood or PVC, and in a
different way than HDPE. Besides, increasing the number of extrusions always increased
the Tc of the WPC’s in the cases of both HDPE and PP based blends.
In the literature, several authors pointed out that the introduction of cellulose fiber in a PP
melt changed the morphology and the crystallization behavior of this melt [28][29]. The
cellulose fibers formed a larger surface for the crystals to nucleate, helping the
crystallization. With enough nucleation density, the nucleating crystals could invade one
another and grow in a radial direction from the cellulosic surface. As a result, a particular
form of interphase was created: a transcrystalline layer. Possibly, Tc increased here for
PP-based composites because the wood floor helped the nucleation, leading
crystallization to happen earlier.
Table 3-3 Crystallization temperatures for HDPE-based WPC’s tested in DSC.
Crystallization temperature Tc (°C) for HDPE-based blends and composites
HDPE wood/HDPE HDPE/PP wood/HDPE/PP HDPE/PVC wood/HDPE/PVC
Extrusion 1 115.2 111.8 114.1 109.7 115.2 111.6
% cov 0.25 1.01 1.35 1.03 0.92 1.09
Extrusion 2 - 110.4 - 109.7 - 113.0
% cov - 1.86 - 2.18 - 2.04
Extrusion 3 - 114.5 - 113.7 - 114.4
% cov - 0.05 - 1.00 - 0.05
Extrusion 4 - 114.6 - 113.2 - 114.4
% cov - 0.00 - 0.94 - 0.10
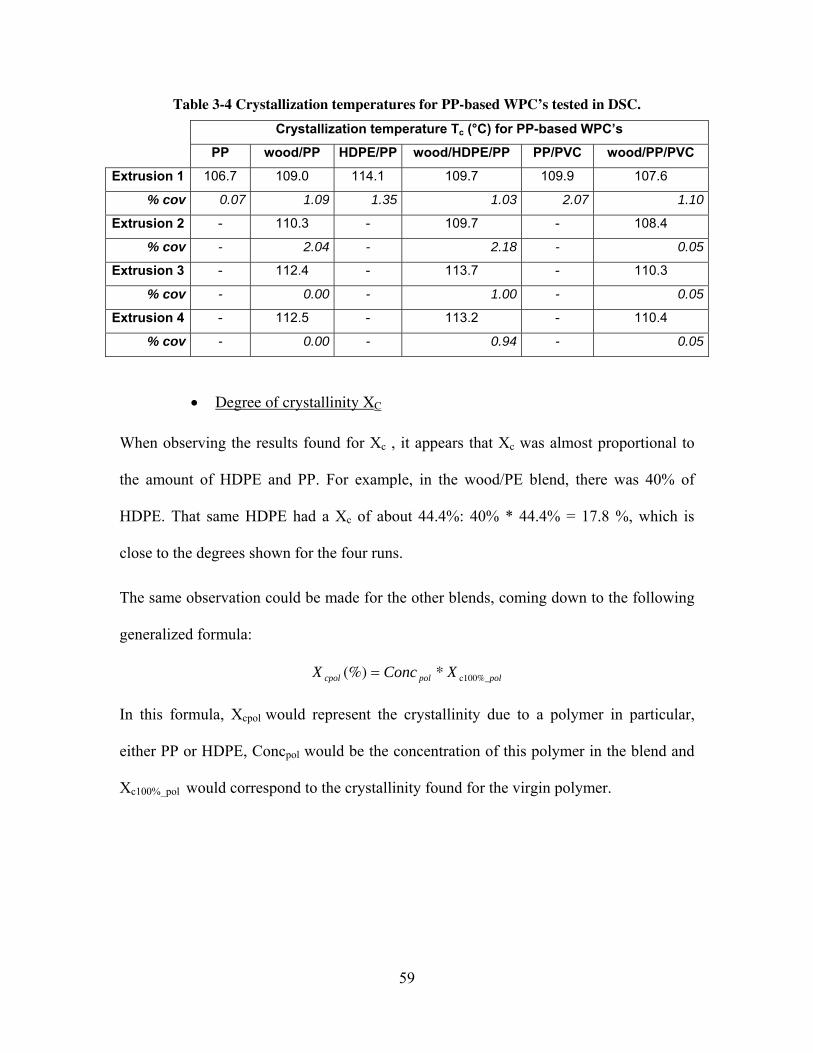
Table 3-4 Crystallization temperatures for PP-based WPC’s tested in DSC.
Crystallization temperature Tc (°C) for PP-based WPC’s
PP wood/PP HDPE/PP wood/HDPE/PP PP/PVC wood/PP/PVC
Extrusion 1 106.7 109.0 114.1 109.7 109.9 107.6
% cov 0.07 1.09 1.35 1.03 2.07 1.10
Extrusion 2 - 110.3 - 109.7 - 108.4
% cov - 2.04 - 2.18 - 0.05
Extrusion 3 - 112.4 - 113.7 - 110.3
% cov - 0.00 - 1.00 - 0.05
Extrusion 4 - 112.5 - 113.2 - 110.4
% cov - 0.00 - 0.94 - 0.05
• Degree of crystallinity XC
When observing the results found for Xc , it appears that Xc was almost proportional to
the amount of HDPE and PP. For example, in the wood/PE blend, there was 40% of
HDPE. That same HDPE had a Xc of about 44.4%: 40% * 44.4% = 17.8 %, which is
close to the degrees shown for the four runs.
The same observation could be made for the other blends, coming down to the following
generalized formula:
polpolcpol XConcX c100%_*(%) =
In this formula, Xcpol would represent the crystallinity due to a polymer in particular,
either PP or HDPE, Concpol would be the concentration of this polymer in the blend and
Xc100%_pol would correspond to the crystallinity found for the virgin polymer.
59

60
Table 3-5 Average degrees of crystallinity of the WPC’s tested in DSC.
Degrees of crystallinity Xc
HDPE PP wood/HDPE wood/PP wood/HDPE/PP
wood/HDPE /PVC
wood/PP /PVC
Extrusion 1 44.4% 35.7% 19.5% 15.6% 15.1% 8.6% 8.2%
% cov 7.07 4.90 6.28 7.12 3.38 4.13 7.43
Extrusion 2 - - 18.2% 13.8% 14.9% 8.6% 7.7%
% cov - - 7.11 11.83 8.85 11.03 2.50
Extrusion 3 - - 18.9% 15.9% 13.5% 9.6% 6.9%
% cov - - 6.58 4.95 1.52 5.84 11.64
Extrusion 4 - - 22.3% 16.2% 15.2% 10.2% 8.6%
% cov - - 5.46 8.47 11.53 9.14 3.89
On figure 3-8, Xc apparently increased slightly from an extrusion to another but that
change is not obvious. Keeping in mind that the measure of Xc can lack of accuracy and
that the coefficient of variability associated vary from 3% and 12% (Table 3-5), the real
impact of the extrusions on the crystallinity is still doubtful.

Variation of the degree of crystallinity in function of the number of extrusions
5.0%
7.0%
9.0%
11.0%
13.0%
15.0%
17.0%
19.0%
21.0%
23.0%
0 1 2 3 4Number of extrusions
Crys
talll
init
y (%
)
5
Wood/ HDPE Wood/ PP Wood/ HDPE/ PPWood/ HDPE/ PVC Wood/ PP/ PVC
Figure 3-7 Degree of crystallinity versus number of extrusions.
• Half time of crystallization t1/2
The half time of crystallization t1/2 is a measure of the crystallization rate and used by
many authors [6][8][22][23], represents the length of time required for a blend to complete
50% of the crystallization, corresponding to a relative crystallinity X(t) of 50%. The
relative crystallinity was calculated in function of the time t with this formula
[1][6][8][22][23]:
100*.
.
)(
0
0
∫
∫∞
= t
t
c
t
t
c
dtdt
dH
dtdt
dH
tX
61
In this equation, X(t) is the percentage of completion of the crystallization, t0 and t∞
represent respectively the onset and end times of the crystallization and dHc/dt is the rate
of heat evolution. After plotting X(t), t1/2 was calculated.

Table 3-6 Average times of half crystallization of the WPC’s tested in DSC.
Half times of crystallization t1/2 (in seconds)
HDPE PP Wood/HDPE Wood/PP Wood/HDPE
/PP Wood/HDPE
/PVC Wood/PP
/PVC
Extrusion 1 275.0 321.6 305.3 315.6 309 309.8 323.0
% cov 0.21 0.26 0.23 0.50 0.08 0.49 0.72
Extrusion 2 - - 306.8 310.0 309.9 307.7 321.2
% cov - - 0.33 0.02 0.69 0.66 0.56
Extrusion 3 - - 302.9 307.1 304.0 304.5 318.6
% cov - - 0.15 0.16 0.53 0.21 0.13
Extrusion 4 - - 302.5 306.2 303.5 304.3 319.1
% cov - - 0.15 0.36 0.28 0.19 0.13
t1/2 increased greatly when wood was added to HDPE but decreased when wood was
mixed with PP, except in the case where PVC was also in the blend. PVC apparently
increased the time of crystallization as well, or in other terms, the blends took more time
to crystallize in the presence of PVC (and wood in the case of HDPE).
Interestingly, t1/2 decreased of a few seconds after every extrusion. Thus, not only the
repeated extrusions seem to have increased the degree of crystallinity but they also
reduced the time needed to crystallize. Extruding apparently facilitated crystallization.
62

Variation of the half time of crystallization in function of the number of extrusions
300.0
305.0
310.0
315.0
320.0
325.0
330.0
0 1 2 3 4 5Number of extrusions
Wood/ HDPE Wood/ PP Wood/ HDPE/ PP
Wood/ HDPE/ PVC Wood/ PP/ PVC
Figure 3-8 Half time of crystallization versus number of extrusions.
• Melting point
Wood/HDPE/PP, HDPE/PP/PVC and HDPE/PP blends showed two endothermic peaks
because the blends were immiscible and the phases of PP and HDPE did not melt at the
same time. The first heating flow peak occurred at the Tm of HDPE, around 130°C. The
second peak occurred at the Tm of PP, around 160°C.
63
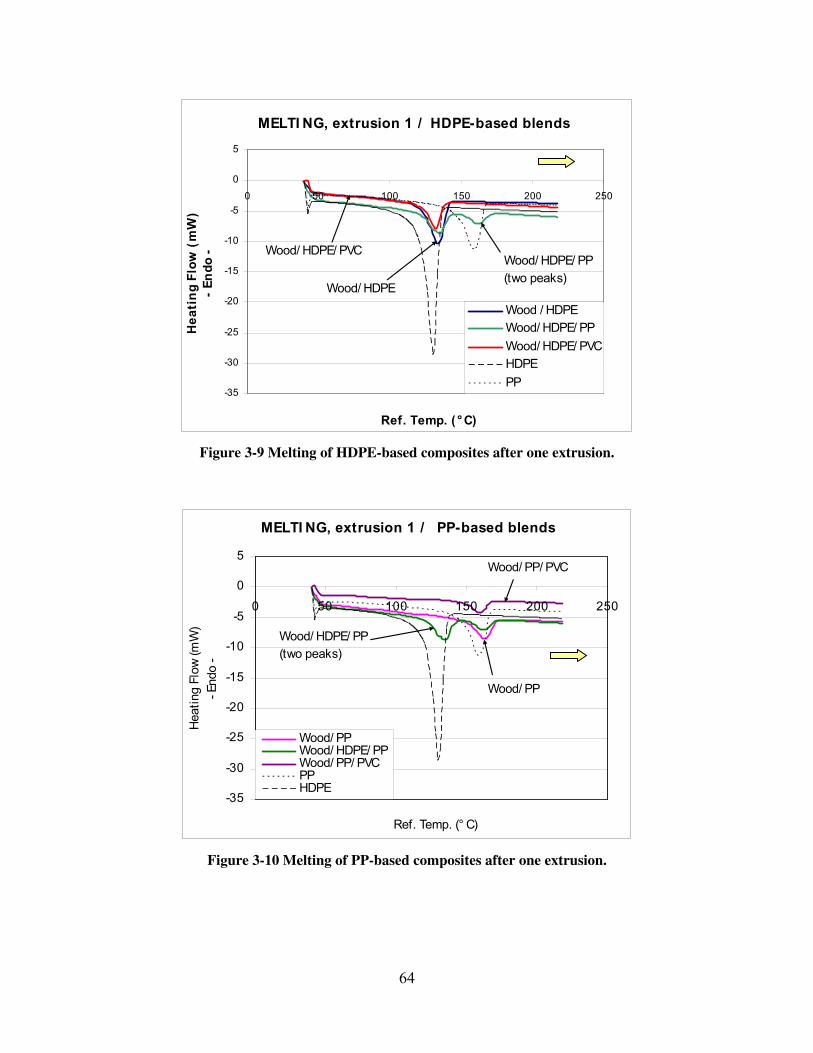
MELTI NG, extrusion 1 / HDPE-based blends
-35
-30
-25
-20
-15
-10
-5
0
5
0 50 100 150 200 250
Ref. Temp. ( °C)
Hea
ting
Flo
w (
mW
)- E
ndo
-
Wood / HDPEWood/ HDPE/ PPWood/ HDPE/ PVCHDPEPP
Wood/ HDPE
Wood/ HDPE/ PP(two peaks)
Wood/ HDPE/ PVC
Figure 3-9 Melting of HDPE-based composites after one extrusion.
MELTI NG, extrusion 1 / PP-based blends
-35
-30
-25
-20
-15
-10
-5
0
5
0 50 100 150 200 250
Ref. Temp. (° C)
Hea
ting
Flow
(mW
)- E
ndo
-
Wood/ PPWood/ HDPE/ PPWood/ PP/ PVCPPHDPE
Wood/ PP
Wood/ HDPE/ PP(two peaks)
Wood/ PP/ PVC
Figure 3-10 Melting of PP-based composites after one extrusion.
64

65
Composites containing HDPE as a component were compared in Table 3-7. In the cases
of wood/PE and wood/PE/PVC blends, when compared to the temperature of the
associated polymer blends, Tm increased for the two first extrusions (+6°C for wood/PE
and +2°C for wood/HDPE/PVC) and decreased for the last extrusions. Wood/PE melted
at a higher temperature than HDPE, but the difference diminished when the number of
extrusions increased. Wood/HDPE/PP also showed variations of Tm when the number of
extrusions increased: for the first two extrusions, this temperature increased but for the
last extrusions Tm decreased and settled around that of PP and HDPE.
Table 3-7 Melt temperature of the HDPE-based WPC’s tested in DSC.
Melting point Tm (°C) for HDPE-based WPC’s
HDPE wood/HDPE HDPE/PP wood/HDPE/PP HDPE/PVC wood/HDPE/PVC
Extrusion 1 129.0 134.2 130.8 160.4 133.0 161.1 130.2 132.4
% cov 0.22 0.86 2.01 2.04 0.78 0.63 0.94 0.92
Extrusion 2 - 136.2 - - 133.6 162.3 - 132.4
% cov - 0.89 - - 1.50 0.68 - 0.85
Extrusion 3 - 132.1 - - 130.4 160.5 - 131,0
% cov - 0.90 - - 0.86 0.69 - 0.84
Extrusion 4 - 131.3 - - 130.9 159.6 - 129.6
% cov - 0.04 - - 0.79 0.06 - 0.09
Composites containing PP as a component were compared in Table 3-8. In the case of
wood/PP blend, the addition of wood to the polymer seemed to increase Tm but with
increasing extrusions, the temperature difference lessened. For wood/PP/PVC, Tm was
higher than that of PP/PVC and closer to PP’s Tm. PVC seemingly diminished the Tm of
PP when those polymers were mixed, but adding wood eventually increased Tm.
When the number of extrusions increased, Tm decreased and the effect of wood became
less important and the Tm of the wood/PP/PVC blend got closer to the one of PP/PVC.
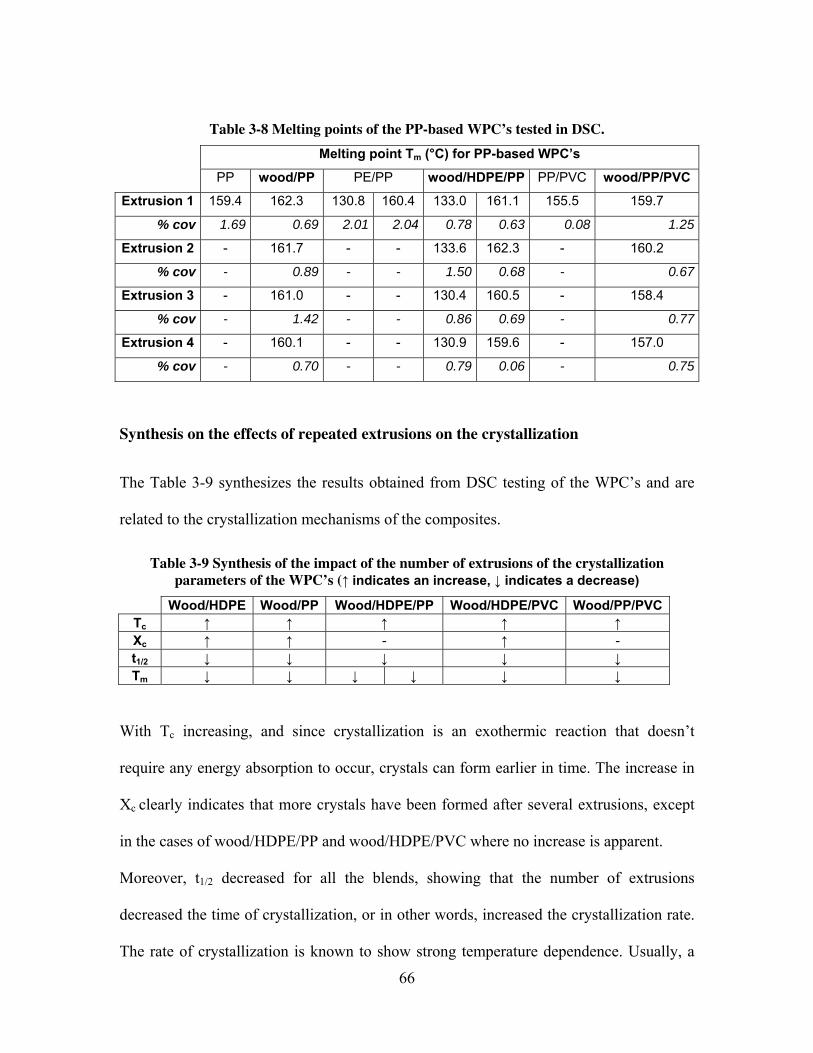
66
Table 3-8 Melting points of the PP-based WPC’s tested in DSC.
Melting point Tm (°C) for PP-based WPC’s
PP wood/PP PE/PP wood/HDPE/PP PP/PVC wood/PP/PVC
Extrusion 1 159.4 162.3 130.8 160.4 133.0 161.1 155.5 159.7
% cov 1.69 0.69 2.01 2.04 0.78 0.63 0.08 1.25
Extrusion 2 - 161.7 - - 133.6 162.3 - 160.2
% cov - 0.89 - - 1.50 0.68 - 0.67
Extrusion 3 - 161.0 - - 130.4 160.5 - 158.4
% cov - 1.42 - - 0.86 0.69 - 0.77
Extrusion 4 - 160.1 - - 130.9 159.6 - 157.0
% cov - 0.70 - - 0.79 0.06 - 0.75
Synthesis on the effects of repeated extrusions on the crystallization
The Table 3-9 synthesizes the results obtained from DSC testing of the WPC’s and are
related to the crystallization mechanisms of the composites.
Table 3-9 Synthesis of the impact of the number of extrusions of the crystallization parameters of the WPC’s (↑ indicates an increase, ↓ indicates a decrease)
Wood/HDPE Wood/PP Wood/HDPE/PP Wood/HDPE/PVC Wood/PP/PVCTc ↑ ↑ ↑ ↑ ↑ Xc ↑ ↑ - ↑ - t1/2 ↓ ↓ ↓ ↓ ↓ Tm ↓ ↓ ↓ ↓ ↓ ↓
With Tc increasing, and since crystallization is an exothermic reaction that doesn’t
require any energy absorption to occur, crystals can form earlier in time. The increase in
Xc clearly indicates that more crystals have been formed after several extrusions, except
in the cases of wood/HDPE/PP and wood/HDPE/PVC where no increase is apparent.
Moreover, t1/2 decreased for all the blends, showing that the number of extrusions
decreased the time of crystallization, or in other words, increased the crystallization rate.
The rate of crystallization is known to show strong temperature dependence. Usually, a

67
decrease in Tm is believed to increase the rate of crystallization [4]. Also, a decrease in the
melting point might indicate smaller crystals, meaning that crystallization should be
facilitated.
These parameters agree on the fact that extensive mixing helped the crystallization and
increased the crystallinity. This increase might be due to the formation of particles of
smaller size. Possibly, extensive mixing dispersed better the wood flour within the
composite and extended the contact surface of the wood with the polymers. This
extended surface might have sustained the nucleation and growth of crystals. Besides,
more transcrystalline layers might have be created during mixing, again increasing the
crystallinity of the composites [30-31].
2. Oxidation Induction Time (OIT)
The OIT is the time taken by a material to begin an exothermic oxidation and degrade.
The tests evaluate the changes induced by different treatments on the specimen’s OIT and
determine wether the repeated extrusions reduced or increased the material's resistance to
oxidative decomposition. An increased OIT means that the material becomes more stable
and will need more time to degrade [15][26][27].
All formulations were tested but the wood/PVC samples did not show any oxidation
peak, so no OIT was recorded for this blend. When the number of extrusions applied to a
sample increased, no obvious drop in the times of oxidation was noted, which indicates
that the samples did not particularly degrade after these four extrusions, at least in terms
of resistance to oxidation (see Figure 3-12 and Table 3-10). Nevertheless, the high
coefficients of variation introduce some uncertainty about the influence of the repeated
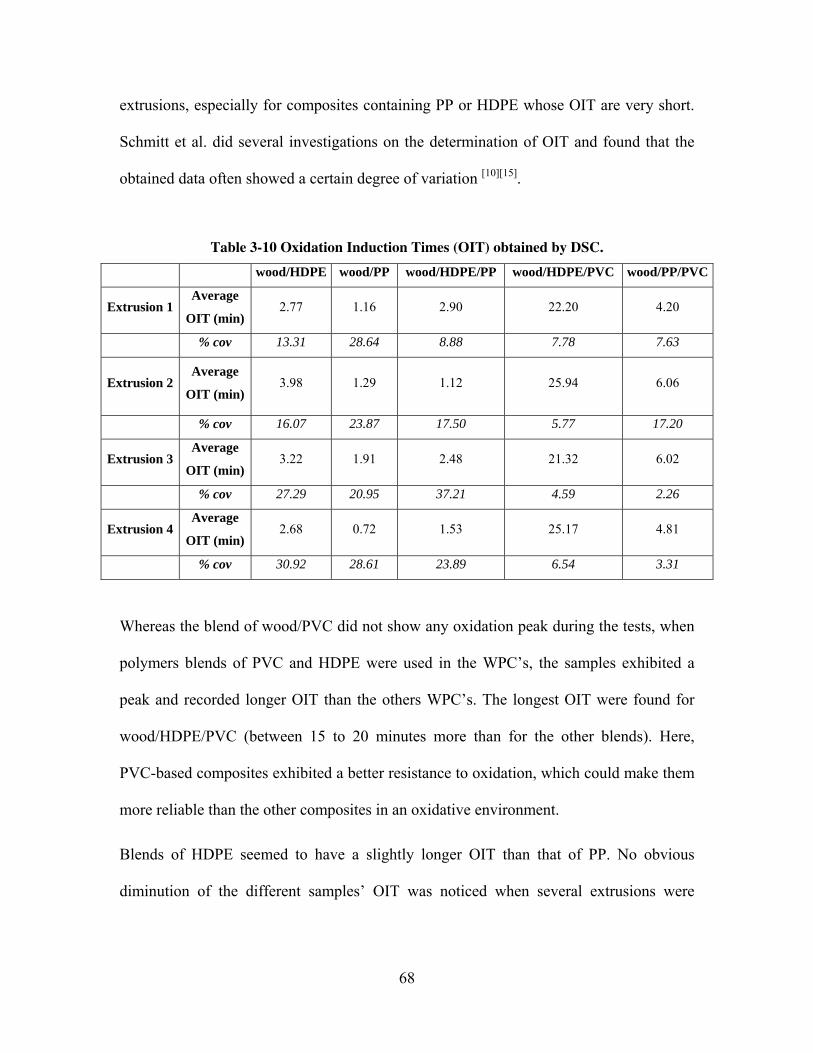
68
extrusions, especially for composites containing PP or HDPE whose OIT are very short.
Schmitt et al. did several investigations on the determination of OIT and found that the
obtained data often showed a certain degree of variation [10][15].
Table 3-10 Oxidation Induction Times (OIT) obtained by DSC.
wood/HDPE wood/PP wood/HDPE/PP wood/HDPE/PVC wood/PP/PVC
Extrusion 1 Average
OIT (min)2.77 1.16 2.90 22.20 4.20
% cov 13.31 28.64 8.88 7.78 7.63
Extrusion 2 Average
OIT (min)3.98 1.29 1.12 25.94 6.06
% cov 16.07 23.87 17.50 5.77 17.20
Extrusion 3 Average
OIT (min)3.22 1.91 2.48 21.32 6.02
% cov 27.29 20.95 37.21 4.59 2.26
Extrusion 4 Average
OIT (min)2.68 0.72 1.53 25.17 4.81
% cov 30.92 28.61 23.89 6.54 3.31
Whereas the blend of wood/PVC did not show any oxidation peak during the tests, when
polymers blends of PVC and HDPE were used in the WPC’s, the samples exhibited a
peak and recorded longer OIT than the others WPC’s. The longest OIT were found for
wood/HDPE/PVC (between 15 to 20 minutes more than for the other blends). Here,
PVC-based composites exhibited a better resistance to oxidation, which could make them
more reliable than the other composites in an oxidative environment.
Blends of HDPE seemed to have a slightly longer OIT than that of PP. No obvious
diminution of the different samples’ OIT was noticed when several extrusions were

applied, meaning that the WPC’s did not change the reaction to oxidation of the
composites. This last observation might be interesting for recycling purposes.
Variation of the OI T in function of the number of extrusions
0.00
5.00
10.00
15.00
20.00
25.00
30.00
0 1 2 3 4 5Extrusions
Wood/ HDPE
Wood/ PP
Wood/ HDPE/ PP
Wood/ HDPE/ PVC
Wood/ PP/ PVC
Figure 3-11 Oxidation induction times in function of the number of extrusions.
69

70
IV. Conclusion on the effects of mixing and polymer blends on
WPC’s structural and thermal properties
Even if PVC and wood neither melt nor crystallize, they still influence the thermal
behavior of the other elements. The WPC’s components being immiscible, HDPE and PP
melted and crystallized separately. Repeated extrusions seemed to increase Xc and Tc, but
decrease the Tm and t1/2. In other words, processing apparently facilitated crystallization.
The increase in Xc is a significant change of the structure of the blends and must be
overseen because it might harden the composites and increase their brittleness.
In comparison with the composites containing PP or HDPE, blends of PVC showed the
longest OIT. Moreover, multi-processing did not change the OIT of the composites
tested, meaning that apparently, recycling those materials should prove possible without
degradation. That said, the poor accuracy of the results in terms of OIT must be
remembered. After more extrusions cycles, degradation might take place but no proof of
that potential damage could be found during this investigation. Others researchers [9]
found proof of increased oxidative degradation after repeated processing on PP, HDPE
and their blend.

71
References
[1] Gedde UW. Polymer physics. Chapman & Hall 1995. [2] Schultz JM. Polymer crystallization. The development of crystalline order in
thermoplastic polymers. Oxford University Press 2001. [3] Sommer JU, Reiter G. Polymer crystallization. Observations, concepts and
interpretations. Lecture notes in physics, Springer 2003. [4] Stein RS, Powers J. Topics in polymer physics. Imperial College Press 2006. [5] Privalko VP, Novikov VV. The science of heterogeneous polymers. Structure
and thermophysical properties. John Wiley & Sons 1995. [6] Li J, Shanks RA, Olley RH, Greenway GR. Miscibility and isothermal
crystallization of polypropylene in polyethylene melts. Elsevier ScienceDirect, Polymer 42, 2001, 7685-7694.
[7] Shanks RA, Li J, Yu L. Polypropylene-polyethylene blend morphology controlled by time-temperature-miscibility. Elsevier ScienceDirect, Polymer 41, 2002, 2133-2139.
[8] Jianglei Qin, Jungang Gao, Zhiting Li, Mingtao Run. Nonisothermal Crystallization, Melting Behavior, and Morphology of Polypropylene/Linear Bimodal Polyethylene Blends. Journal of Applied Polymer Science 2008, Vol. 107, 1235-1242.
[9] Camacho W, Karlsson S. Assessment of thermal and thermo-oxidative stability of multi-extruded PP, HDPE and a blend thereof. Elsevier Science, Polymer Degradation and Stability 2002, 78, 385-391.
[10] Schmidt M, Ritter A, Affolter S. Determination of oxidation time and temperature by DSC. Journal of Thermal Analysis and Calorimetry 2006, Vol. 83, 367-371.
[11] Clemons CM. Wood-Plastic Composites in the United States. The interfacing of two industries. Forest Products Journal vol. 52, No. 6, June 2002.
[12] Wolcott MP, Englund K. A technology Review of Wood-Plastic Composites. 33rd International Particleboard / Composite Materials Symposium.
[13] Krumme A, Lehtinen A, Viikna A. Crystallisation behaviour of high density polyethylene blends with bimodal molar mass distribution 2. Non-isothermal crystallisation. European Polymer Journal 40 (2004) 371–378.
[14] Fonseca CA, Harrison IR. An investigation of co-crystallization in LDPE/HDPE blends using DSC and TREF. Thermochimica Acta 313 (1998) 37-41.
[15] Schmid M, Affolter S. Interlaboratory tests on polymers by differential scanning calorimetry (DSC): determination and comparison of oxidation induction time (OIT) and oxidation induction temperature (OIT*). Polymer Testing 22 (2003) 419–428.
[16] Principia Partners. “Natural & Wood Fiber Composites: the Principia Newsletter, Vol. 1, No. 9. September 30, 2002.
[17] Martuscelli E. Polymer blends: processing, morphology and properties. Springer 1999.

72
[18] American Society of Testing and Materials standards. ASTM D 3895-02 [19] Gordon JE. The new science of strong materials (or why you don’t fall
through the floor). 2nd Edition Princeton University Press, 1988. [20] Cheremisinoff NP. Handbook of Engineering Polymeric Materials. CRC
Press, 1997, ISBN 082479799X, 9780824797997, page 327. [21] Blom HP, Teh JW, Bremner T, Rudin A. Isothermal and non-isothermal
crystallization of PP: effect of annealing and of the addition of HDPE. Elsevier Science, PII: S0032.3861(97)10305-6, Polymer Vol. 39 No. 17, pp. 4011-4022, 1998.
[22] Lee SW, Ree M, Park CE, Jung YK, Park CS, Jin YS, Bae DC. Synthesis and non-isothermal crystallization behaviors of poly(ethylene isophthalate-co-terephthalate)s. Polymer, volume 40, issue 25, 1999, pages 7137-7146.
[23] Hea Y, Fana F, Hua Y, Wua T, Weia J, Lia B. DSC analysis of isothermal melt-crystallization, glass transition and melting behavior of poly(l-lactide) with different molecular weights. European Polymer Journal, volume 43, issue 10, 2007, pages 4431-4439.
[24] Karagiannidisa PG, Stergioua AC, Karayannidisb GP. Study of crystallinity and thermomechanical analysis of annealed poly(ethylene terephthalate) films. European Polymer Journal, volume 44, issue 5, 2008, pages 1475-1486.
[25] Rao YQ, Greener J, Avila-Orta CA, Hsiao BS, Blanton TN. The relationship between microstructure and toughness of biaxially oriented semicrystalline polyester films. Polymer, volume 49, issue 10, 2008, pages 2507-2514.
[26] ASTM standards, D3895 – 02. [27] Dobkowski Z. Thermal analysis techniques for characterization of polymer
materials. Polymer Degradation and Stability 91 (2006) 488-493. [28] Harper D, Wolcott M. Interaction between coupling agent and lubricants in
wood–polypropylene composites. Composites Part A: Applied Science and Manufacturing, volume 35, issue 3, 2004, pages 385-394
[29] Gray DG. Polypropylene transcrystallization at the surface of cellulose fibers. J Polym Sci: Polym Lett 1974;12:509-15.
[30] Araujo JR, Waldman WR, De Paoli MA. Thermal properties of high density polyethylene composites with natural fibres: coupling agent effect. Polymer degradation and stability, Vol. 93, issue 10, 2008, pages 1770-1775.
[31] Joseph PV, Joseph K, Thomas S, Pillai CKS, Prasad VS, Groeninckx G, Sarkissova M. The thermal and crystallization studies of short sisal fibre reinforce polypropylene composites. Composites: Part A (2003) 253-266.

73
CHAPTER FOUR – CONCLUSIONS
Composites made of wood and thermoplastics have been tested mechanically, physically
and thermally to determine the impact of extensive mixing and the introduction of
polymer blends on the structure and the macroscopic behavior of these WPC’s. Four
extrusions were applied on the composites in order to create additionnal blending and try
to improve the components dispersion. These repeated extrusions on the WPC’s had
impacts on the structure of the composites in seevral ways. First, they slightly increased
the MOE and the MOR of the tested samples. They also decreased the capacitity of
deformation of those samples, leading to more brittle specimens. Brittle materials are
characterized by a low ductility and break suddenly, leaving these products potentially
more dangerous than ductile materials. The increase in the brittleness is a serious issue
that needs overseeing and might interfere with a WPC’s usefulness. A lifetime after
which a WPC cannot be recycled anymore because this composite would get too brittle
might even be defined.
During thermal testing, the crystallization was apparently being favored by the repeated
extrusions and extensive mixing: Xc increased while t1/2 decreased. The additional
blending action probably helped the dispersion of the polymers and the wood flour,
possibly improving the homogeneity of the blends and insure a better adhesion of the
components to one another. This increased adhesion would have developed better stress
tansfer, thus strenghening the composites. Improved blending could also have eliminated
voids and increased the overall water resistance. However, another consequence of the
crystallinity is the brittleness of the material. If the recorded increase in brittleness might
74
be due to structural degradation caused by repeated extrusions, it is also possible that the
increase in crystallinity could have made the composites more brittle. The relationship
between crystallinity, strength and brittleness is not completely clear but the crystallinity
is believed to increase the brittleness and the stiffness in semicrystalline polymers.
During oxidation induction testing, the number of extrusions was not a factor in the OIT,
meaning that extruding did not damage the WPC’s by accelerating its oxidative
degradation. That said, other researchers that investigated the OIT of multi-processed PP
and HDPE found contrary results. Knowing that the coefficients of variation of the OIT
tests were rather high, these conclusions must be made with precaution.
Finally, the polymer blends did not influence the behavior of the composites, in fact this
behavior was strongly linked to the nature of the polymer used. No disadvantage in using
blends of polymers appeared during the different tests, should these tests be on the
strength of the composites or on their morphology. Using blends of polymers presents
many advantages and opportunities that need to be investigated and evaluated during
future investigations. Certainly, new applications of WPC’s might be found with
polymer blends and this new area of research needs more specific attention.

75
APPENDIX
A. Results of the bending tests for virgin WPC’s
Table A-1 Bending tests results for the wood/HDPE blend.
WOOD/HDPE
Max
load (N) % cov MOR
(kPa) % cov εbreak % cov MOE (MPa)
% cov
Extrusion 1 356 4.21 24,550 4.27 0.0142 7.75 3,347 2.31
Extrusion 2 334 0.56 22,705 0.48 0.0119 4.20 3,123 1.16
Extrusion 3 440 1.83 26,814 2.96 0.0139 8.63 3,504 1.77
Extrusion 4 329 8.86 21,278 8.54 0.0103 10.68 3,172 13.50
Average 365 3.87 23,837 4.06 0.0125 7.82 3,286 4.69
Table A-2 Bending tests results for wood/PP blend.
WOOD/PP
Max
load (N) % cov MOR
(kPa)% cov εbreak % cov
MOE (MPa)
% cov
Extrusion 1 489 5.77 25,936 5.76 0.0189 10.00 3,053 7.50
Extrusion 2 480 3.43 28,268 2.98 0.0175 13.14 3,276 2.31
Extrusion 3 516 5.70 29,537 6.40 0.0151 17.22 3,528 3.04
Extrusion 4 503 2.88 28,878 2.53 0.0145 11.03 3,731 5.06
Average 497 4.45 28,155 4.42 0.0165 12.86 3,397 4.48

76
Table A-3 Bending tests results for wood/PVC blend.
WOOD/PVC
Max
load (N) % cov MOR
(kPa)% cov εbreak % cov
MOE (MPa)
% cov
Extrusion 1 596 4.13 37,611 4.12 0.0083 4.82 5,553 2.11
Extrusion 2 600 5.21 36,801 8.51 0.0078 5.13 5,225 6.13
Extrusion 3 694 6.36 42,742 7.71 0.0082 7.32 6,206 9.76
Extrusion 4 667 4.27 41,260 7.61 0.0073 6.85 6,161 4.03
Average 639 4.99 39,603 6.99 0.0079 6.03 5,786 5.51
Table A-4 Bending tests results for wood/HDPE/PP blend.
WOOD/HDPE/PP
Max load (N)
% cov MOR (kPa)
% cov εbreak % cov MOE (MPa)
% cov
Extrusion 1 405 1.05 25,819 0.47 0.0156 5.13 3,280 3.37
Extrusion 2 405 1.05 25,819 0.47 0.0156 5.13 3,280 3.37
Extrusion 3 365 4.43 24,797 14.08 0.0111 6.31 3,438 14.45
Extrusion 4 405 2.62 24,338 3.63 0.0132 14.39 3,460 2.85
Average 395 2.29 25,193 4.66 0.01388 7.74 3,365 6.01
Table A-5 Bending tests results for wood/HDPE/PVC blend.
WOOD/HDPE/PVC
Max
load (N) % cov MOR
(kPa)% cov εbreak % cov
MOE (MPa)
% cov
Extrusion 1 316 6.25 20,352 6.26 0.0089 7.87 3,628 2.14
Extrusion 2 320 4.15 20,675 4.08 0.008 7.50 3,655 1.61
Extrusion 3 365 1.33 22,938 1.39 0.0074 5.41 4,373 3.06
Extrusion 4 347 3.78 22,787 3.44 0.007 5.71 4,352 3.17
Average 337 3.88 21,688 3.79 0.00783 6.62 4,002 2.50

Table A-6 Bending tests results for wood/PP/PVC blend.
WOOD/PP/PVC
Max load (N)
% cov MOR (kPa)
% cov εbreak % cov MOE (MPa)
% cov
Extrusion 1 383 2.59 23,508 2.61 0.0081 6.17 4,325 2.34
Extrusion 2 369 4.07 22,691 4.25 0.0065 6.15 4,393 3.32
Extrusion 3 427 3.69 25,270 4.50 0.0073 12.33 4,671 3.37
Extrusion 4 405 6.45 24,372 6.11 0.0076 15.79 4,247 12.34
Average 396 4.20 23,960 4.37 0.00738 10.11 4,409 5.34
Table A-7 Application of the rule of mixture on the MOE.
Wood/HDPE Wood/PP Wood/PVC Wood/HDPE/PP
Wood/HDPE/PP
Wood/HDPE/PP
test test test test Rule mixture % error Extrusion 1 3 347 3 053 5 553 3 280 3200 2.51%Extrusion 2 3 123 3 276 5 225 3 280 3199 2.54%Extrusion 3 3 504 3 528 6 206 3 438 3516 -2.22%Extrusion 4 3 172 3 731 6 161 3 460 3451 0.27%Average 3 286 3 397 5 786 3 365 3342 0.68%
Wood/HDPE/PVC
Wood/HDPE/PVC
Wood/HDPE/PVC
Wood/PP /PVC
Wood/PP /PVC
Wood/PP /PVC
test Rule mixture % error test Rule mixture % error Extrusion 1 3 628 4450 -18.47% 4 325 4303 0.51%Extrusion 2 3 655 4174 -12.43% 4 393 4251 3.33%Extrusion 3 4 373 4855 -9.92% 4 671 4867 -4.03%Extrusion 4 4 352 4666 -6.73% 4 247 4946 -14.13%Average 4 002 4536 -11.77% 4 409 4592 -3.99%
77

DSC curves obtained for each WPC’s
Results concerning crystallization
Tc corresponds to a peak toward a maximum positive heating flow in the 3rd segment.
• Effect of the number of extrusions on the crystallization, per blend
Crystallization, Wood/HDPE
-5
0
5
10
15
20
25
30
35
40
0 50 100 150 200 250
Ref. temp. (°C)
Hea
ting
Flow
(mW
)- E
xo -
HDPEPPExtrusion 1Extrusion 2Extrusion 3Extrusion 4
Figure A-1 Plot of the exothermic curves showing the crystallization for the wood/HDPE
blends after every extrusion.
78

Crystallization, Wood/PP
-5
0
5
10
15
20
25
30
35
40
0 50 100 150 200 250
Ref. temp. (°C)
Hea
ting
Flow
(mW
)- E
xo -
HDPEPPExtrusion 1Extrusion 2Extrusion 3Extrusion 4
Figure A-2 Plot of the exothermic curves showing the crystallization for the wood/PP blends
after every extrusion.
Crystallization, Wood/HDPE/PP
-5
0
5
10
15
20
25
30
35
40
0 50 100 150 200 250
Ref. temp. (°C)
Hea
ting
Flow
(mW
)- E
xo -
HDPEPPExtrusion 1Extrusion 2Extrusion 3Extrusion 4
Figure A-3 Plot of the exothermic curves showing the crystallization for the wood/HDPE/PP
blends after every extrusion.
79

Crystallization, Wood/HDPE/PVC
-5
0
5
10
15
20
25
30
35
40
0 50 100 150 200 250
Ref. temp. (°C)
Hea
ting
Flow
(mW
)- E
xo -
HDPEPPExtrusion 1Extrusion 2Extrusion 3Extrusion 4
Figure A-4 Plot of the exothermic curves showing the crystallization for the
wood/HDPE/PVC blends after every extrusion.
Crystallization, Wood/PP/PVC
-5
0
5
10
15
20
25
30
35
40
0 50 100 150 200 250
Ref. temp. (°C)
Hea
ting
Flow
(mW
)- E
xo -
HDPEPPExtrusion 1Extrusion 2Extrusion 3Extrusion 4
Figure A-5 Plot of the exothermic curves showing the crystallization for the wood/PP/PVC
blends after every extrusion.
80

• Comparison of the WPC’s for each extrusion
Extrusion 1: crystallization
0
5
10
15
20
25
30
35
0 50 100 150 200 250
Ref. Temp. (°C)
Hea
ting
Flow
(mW
)- E
xo -
Wood /HDPEWood/PPWood/HDPE/PPWood/HDPE/PVCWood/PP/PVCHDPEPP
Figure A-6 Exothermic curves showing the blends crystallization after the 1st extrusion.
Extrusion 2: Crystallization
-5
0
5
10
15
20
25
30
35
40
0 50 100 150 200 250
Ref. Temp. (°C)
Hea
ting
Flow
(mW
)- E
xo -
Wood/HDPEWood/PPWood/HDPE/PPWood/HDPE/PVCWood/PP/PVCHDPEPP
cooling
Figure A-7 Exothermic curves showing the blends crystallization after the 2nd extrusion.
81

Extrusion 3: Crystallization
0
5
10
15
20
25
30
35
40
0 50 100 150 200 250
Ref. Temp. (°C)
Hea
ting
Flow
(mW
)- E
xo -
Wood/HDPE
Wood/PP
Wood/HDPE/PP
Wood/HDPE/PVCWood/PP/PVC
HDPE
PP
Figure A-8 Exothermic curves showing the blends crystallization after the 3rd extrusion.
Extrusion 4: Crystallization
-5
0
5
10
15
20
25
30
35
40
0 50 100 150 200 250
Ref. Temp. (°C)
Hea
ting
Flow
(mW
)- E
xo -
Wood/HDPE
Wood/PP
Wood/HDPE/PP
Wood/HDPE/PVCWood/PP/PVC
HDPE
PP
Figure A-9 Exothermic curves showing the blends crystallization after the 4th extrusion.
82

Results concerning melting
Tm corresponds to a peak toward a maximum negative heating flow in the 5th segment of
a DSC cycle.
• Effect of the number of extrusions on the melting, per blend
Melting, Wood/HDPE
-35
-30
-25
-20
-15
-10
-5
0
5
0 50 100 150 200 250
Ref. temp. (°C)
Hea
ting
Flow
(mW
)- E
ndo
-
HDPE
PPExtrusion 1
Extrusion 2
Extrusion 3Extrusion 4
Figure A-10 Plot of the endothermic curves showing the melting for the wood/HDPE blends
after every extrusion.
83

Melting, Wood/PP
-35
-30
-25
-20
-15
-10
-5
0
5
0 50 100 150 200 250
Ref. temp. (°C)
Hea
ting
Flow
(mW
)- E
ndo
-
HDPEPPExtrusion 1Extrusion 2Extrusion 3Extrusion 4
Figure A-11 Plot of the endothermic curves showing the melting for the wood/PP blends
after every extrusion.
Melting, Wood/HDPE/PP
-35
-30
-25
-20
-15
-10
-5
0
5
0 50 100 150 200 250
Ref. temp. (°C)
Hea
ting
Flow
(mW
)- E
ndo
-
HDPE
PP
Extrusion 1
Extrusion 2
Extrusion 3
Extrusion 4
Figure A-12 Plot of the endothermic curves showing the melting for the wood/HDPE/PP
blends after every extrusion.
84

Melting, Wood/HDPE/PVC
-35
-30
-25
-20
-15
-10
-5
0
5
0 50 100 150 200 250
Ref. temp. (°C)
Hea
ting
Flow
(mW
)- E
ndo
-
HDPE
PPExtrusion 1
Extrusion 2
Extrusion 3Extrusion 4
Figure A-13 Plot of the endothermic curves showing the melting for the wood/HDPE/PVC
blends after every extrusion.
Melting, Wood/PP/PVC
-35
-30
-25
-20
-15
-10
-5
0
5
0 50 100 150 200 250
Ref. temp. (°C)
Hea
ting
Flow
(mW
)- E
ndo
-
HDPEPPExtrusion 1Extrusion 2Extrusion 3Extrusion 4
Figure A-14 Plot of the endothermic curves showing the melting for the wood/PP/PVC
blends after every extrusion.
85

• Comparison of the WPC’s for each extrusion
Extrusion 1: Melting
-29
-24
-19
-14
-9
-40 50 100 150 200 250
Ref. Temp. (°C)
Hea
ting
Flow
(mW
)- E
ndo
-
Wood /HDPEWood/PP
Wood/HDPE/PPWood/HDPE/PVCWood/PP/PVCHDPE
PP
Figure A-15 Endothermic curves showing the blends melting after the 1st extrusion.
Extrusion 2: Melting
-35
-30
-25
-20
-15
-10
-5
0
5
0 50 100 150 200 250
Ref. Temp. (°C)
Hea
ting
Flow
(mW
)- E
ndo
-
Wood/HDPEWood/PPWood/HDPE/PPWood/HDPE/PVCWood/PP/PVCHDPEPP
Figure A-16 Endothermic curves showing the blends melting after the 2nd extrusion.
86

Extrusion 3: Melting
-35
-30
-25
-20
-15
-10
-5
00 50 100 150 200 250
Ref. Temp. (°C)
Hea
ting
Flow
(mW
)- E
ndo
-
Wood/HDPEWood/PPWood/HDPE/PPWood/HDPE/PVCWood/PP/PVCHDPEPP
Figure A-17 Endothermic curves showing the blends melting after the 3rd extrusion.
Extrusion 4: Melting
-35
-30
-25
-20
-15
-10
-5
00 50 100 150 200 250
Ref. Temp. (°C)
Hea
ting
Flow
(mW
)- E
ndo
-
Wood/HDPE
Wood/PP
Wood/HDPE/PP
Wood/HDPE/PVC
Wood/PP/PVC
HDPE
PP
Figure A-18 Endothermic curves showing the blends melting after the 4th extrusion.
87

B. Thickness swelling for extrusions #2 to #4
Thickness swelling - Extrusion 2
0
2
4
6
8
10
12
14
16
0 500 1000 1500 2000 2500 3000
Time (hrs)
Thic
knes
s ch
ange
(%)
Wood/HDPE/PPWood/PPWood/PVCWood/HDPEWood/HDPE/PVCWood/PP/PVC
Figure B-1 Plot of the thickness swelling versus immersion time, second extrusion.
Thickness swelling - Extrusion 3
0
2
4
6
8
10
12
14
16
0 500 1000 1500 2000 2500 3000
Time (hrs)
Thic
knes
s ch
ange
(%)
Wood/HDPE/PPWood/PPWood/PVCWood/HDPEWood/HDPE/PVCWood/PP/PVC
Figure B-2 Plot of the thickness swelling versus immersion time, third extrusion.
88

Thickness swelling - Extrusion 4
0
2
4
6
8
10
12
14
16
0 500 1000 1500 2000 2500 3000
Time (hrs)
Thic
knes
s ch
ange
(%)
Wood/HDPE/PP
Wood/PP
Wood/HDPE
Wood/HDPE/PVC
Wood/PP/PVC
Figure B-3 Plot of the thickness swelling versus immersion time, fourth extrusion.
89

C. Thickness swelling vs. number of extrusions
Thickness change - Wood/HDPE
0
2
4
6
8
10
12
14
0 500 1000 1500 2000 2500 3000
Time (hrs)
Wat
er a
bsor
ptio
n (%
)
Extrusion 1
Extrusion 2
Extrusion 3Extrusion 4
Figure C-1 Plot of the thickness swelling after 2660 hours of immersion, for the different
extrusions of the wood/HDPE blend.
Thickness change - Wood/PP
0
2
4
6
8
10
12
0 500 1000 1500 2000 2500 3000
Time (hrs)
Wat
er a
bsor
ptio
n (%
)
Extrusion 1
Extrusion 2
Extrusion 3
Extrusion 4
Figure C-2 Plot of the thickness swelling after 2660 hours of immersion, for the different
extrusions of the wood/PP blend.
90

Thickness change - Wood/PVC
0
2
4
6
8
10
12
14
16
18
0 500 1000 1500 2000 2500 3000
Time (hrs)
Wat
er a
bsor
ptio
n (%
)
Extrusion 1
Extrusion 2
Extrusion 3
Figure C-3 Plot of the thickness swelling after 2660 hours of immersion, for the different
extrusions of the wood/PVC blend.
Thickness change - Wood/HDPE/PP
0
2
4
6
8
10
12
14
0 500 1000 1500 2000 2500 3000
Time (hrs)
Wat
er a
bsor
ptio
n (%
)
Extrusion 1Extrusion 2Extrusion 3Extrusion 4
Figure C-4 Plot of the thickness swelling after 2660 hours of immersion, for the different
extrusions of the wood/HDPE/PP blend.
91

Thickness change - Wood/HDPE/PVC
0
2
4
6
8
10
12
14
16
0 500 1000 1500 2000 2500 3000
Time (hrs)
Wat
er a
bsor
ptio
n (%
)
Extrusion 1
Extrusion 2
Extrusion 3
Extrusion 4
Figure C-5 Plot of the thickness swelling after 2660 hours of immersion, for the different
extrusions of the wood/HDPE/PVC blend.
Thickness change - Wood/PP/PVC
0
2
4
6
8
10
12
14
16
0 500 1000 1500 2000 2500 3000
Time (hrs)
Wat
er a
bsor
ptio
n (%
)
Extrusion 1
Extrusion 2
Extrusion 3
Extrusion 4
Figure C-6 Plot of the thickness swelling after 2660 hours of immersion, for the different
extrusions of the wood/PP/PVC blend.
92

D. Extrusion processing parameters
Table D-1 Extrusion processing parameters for the first extrusion.
EXTRUSION #1 Extruder temperature Die temperatureall zones 180° C / 356° F 180° C / 356° F
Blend Screw speed (rpm) Melt temperature Melt stress Electric charge (Amp)1 20 180° C / 356° F 416 psi / 2868 kPa 82 20 180° C / 356° F 515 psi / 3551 kPa 73 20 180° C / 356° F 496 psi / 3420 kPa 64 20 180° C / 356° F 581 psi / 4006 kPa 75 20 180° C / 356° F 511 psi / 3523 kPa 66 20 180° C / 356° F 577 psi / 3978 kPa 6
Table D-2 Extrusion processing parameters for the second extrusion.
EXTRUSION #2 Extruder temperature Die temperature
all zones 180° C / 356° F 180° C / 356° F
Blend Screw speed (rpm) Melt temperature Melt stress Electric charge (Amp)1 10 180° C / 356° F 387 psi / 2668 kPa 72 10 180° C / 356° F 311 psi / 2144 kPa 113 10 180° C / 356° F 189 psi / 1303 114 10 180° C / 356° F 115 10 180° C / 356° F 311 psi / 2144 kPa 106 10 180° C / 356° F 320 psi / 2206 kPa 10
Table D-3 Extrusion processing parameters for the third first extrusion.
EXTRUSION #3 Extruder temperature Die temperature
all zones 180° C / 356° F 180° C / 356° F
Blend Screw speed (rpm) Melt temperature Melt stress Electric charge (Amp)1 10 180° C / 356° F 291 psi / 2006 kPa 112 10 180° C / 356° F 288 psi / 1917 kPa 113 10 180° C / 356° F 115 psi / 792 kPa 84 10 180° C / 356° F 194 psi / 1338 kPa 105 10 180° C / 356° F 236 psi / 1627 kPa 106 10 180° C / 356° F 262 psi / 1806 kPa 10
93

Table D-4 Extrusion processing parameters for the fourth extrusion.
EXTRUSION #4 Extruder temperature Die temperature
all zones 180° C / 356° F 180° C / 356° F
Blend Screw speed (rpm) Melt temperature Melt stress Electric charge (Amp)1 10 180° C / 356° F 364 psi / 2506 kPa 102 10 180° C / 356° F 335 psi / 2310 kPa 113 10 180° C / 356° F 262 psi / 1806 kpa 84 10 180° C / 356° F 266 psi / 1834 kPa 105 10 180° C / 356° F 322 psi / 2220 kPa 106 10 180° C / 356° F 324 psi / 2234 kPa 8
94

95
E. List of abbreviations and variables
PP Isotactic polypropylene
PVC Polyvinyl-chloride
HDPE High density polyethylene
LDPE Low density polyethylene
LLDPE Linear low density polyethylene
VLDPE Very low density polyethylene
ULDPE Ultra low density polyethylene
EPDM Ethylene-propylene-diene (copolymer)
EBS Ethylene bis stearamide
Te Equilibrium torque
MOE Modulus of elasticity
MOR Modulus of rupture or maximum stress
εbreak Strain at break
∆W Percentage of water absorption or mass change
Wo Conditioned initial weight of a sample prior to water soaking tests
∆T Percentage of thickness swelling
To Conditioned initial thickness of a sample prior to water soaking tests
EMC Equilibrium moisture content
RH Relative humidity
DSC Differential scanning calorimeter/calorimetry
Tc Temperature of crystallization

96
Tm Melting point
Xc Degree of crystallinity
X(t) Relative crystallinity
dHc/dt Rate of heat evolution.
t1/2 Half-time of crystallization
OIT Oxidation induction time
cov Coefficient of variation (%)