Polyfluorene – Perylene Diimide Blends … · Topham,6 Daniel T. W. Toolan,*7 Frederic Laquai,2...
26
SUPPLEMENTARY MATERIAL Efficient Long - Range Electron Transfer Processes in Polyfluorene – Perylene Diimide Blends Anna Isakova, 1 Safakath Karuthedath, 2 Thomas Arnold, 3,4 Jonathan R. Howse, 5 Paul D. Topham, 6 Daniel T. W. Toolan,* 7 Frederic Laquai, 2 Larry Luer 1 * 1. Madrid Institute for Advanced Studies, IMDEA Nanoscience, Calle Faraday 9, Campus Cantoblanco, 28049 Madrid, Spain. 2. King Abdullah University of Science and Technology (KAUST), KAUST Solar Center (KSC), Physical Sciences and Engineering Division (PSE), Material Science and Engineering Program (MSE), Thuwal 23955-6900, Saudi Arabia. 3. Diamond Light Source Ltd., Harwell Science and Innovation Campus, Didcot OX11 0DE, U.K. 4. European Spallation Source, ERIC P.O Box 176, SE-221 00 Lund, Sweden 5. Department of Chemical and Biological Engineering, University of Sheffield, Sheffield. S1 3JD. U.K. 6. Aston Institute of Materials Research, Aston University, Birmingham, B4 7ET, U.K. 7. Department of Chemistry, Dainton Building, University of Sheffield, Sheffield, S3 7HF, U.K. * Corresponding authors: [email protected]; [email protected]. Contents A Absorption cross-section in the condensed phase ....................................................................... 2 B Calculation of excited state delocalization ................................................................................... 3 Quantitative theory of transient photobleach.................................................................................. 3 PDI ..................................................................................................................................................... 5 PFO.................................................................................................................................................... 6 PDI:PFO Blends ................................................................................................................................. 6 C Transient absorption in samples with non-uniform coverage ...................................................... 8 Effect of absorption saturation on transient absorption spectra ................................................... 10 D Role of exciton diffusion and Förster transfer in exciton dissociation in PDI:PFO blends ..........11 E Absolute Absorption cross-section of the PDI anion band in the blends at 1.7 eV ....................13 F Characterization of excited states and relaxation paths in PDI:PFO films ..................................14 G Femtosecond delayed charge separation in the intercalated PDI:PFO phase ............................19 H Nanosecond transient absorption spectra.................................................................................. 21 Electronic Supplementary Material (ESI) for Nanoscale. This journal is © The Royal Society of Chemistry 2018
Transcript of Polyfluorene – Perylene Diimide Blends … · Topham,6 Daniel T. W. Toolan,*7 Frederic Laquai,2...

SUPPLEMENTARY MATERIAL
Efficient Long - Range Electron Transfer Processes in Polyfluorene – Perylene Diimide Blends
Anna Isakova,1 Safakath Karuthedath,2 Thomas Arnold,3,4 Jonathan R. Howse,5 Paul D.
Topham,6 Daniel T. W. Toolan,*7 Frederic Laquai,2 Larry Luer1*
1. Madrid Institute for Advanced Studies, IMDEA Nanoscience, Calle Faraday 9, Campus
Cantoblanco, 28049 Madrid, Spain.
2. King Abdullah University of Science and Technology (KAUST), KAUST Solar Center
(KSC), Physical Sciences and Engineering Division (PSE), Material Science and
Engineering Program (MSE), Thuwal 23955-6900, Saudi Arabia.
3. Diamond Light Source Ltd., Harwell Science and Innovation Campus, Didcot OX11 0DE,
U.K.
4. European Spallation Source, ERIC P.O Box 176, SE-221 00 Lund, Sweden
5. Department of Chemical and Biological Engineering, University of Sheffield, Sheffield.
S1 3JD. U.K.
6. Aston Institute of Materials Research, Aston University, Birmingham, B4 7ET, U.K.
7. Department of Chemistry, Dainton Building, University of Sheffield, Sheffield, S3 7HF,
U.K.
* Corresponding authors: [email protected]; [email protected].
ContentsA Absorption cross-section in the condensed phase .......................................................................2
B Calculation of excited state delocalization ...................................................................................3
Quantitative theory of transient photobleach..................................................................................3
PDI.....................................................................................................................................................5
PFO....................................................................................................................................................6
PDI:PFO Blends .................................................................................................................................6
C Transient absorption in samples with non-uniform coverage......................................................8
Effect of absorption saturation on transient absorption spectra ...................................................10
D Role of exciton diffusion and Förster transfer in exciton dissociation in PDI:PFO blends ..........11
E Absolute Absorption cross-section of the PDI anion band in the blends at 1.7 eV ....................13
F Characterization of excited states and relaxation paths in PDI:PFO films ..................................14
G Femtosecond delayed charge separation in the intercalated PDI:PFO phase ............................19
H Nanosecond transient absorption spectra..................................................................................21
Electronic Supplementary Material (ESI) for Nanoscale.This journal is © The Royal Society of Chemistry 2018
I GIWAXS data of PS:PDI and pure PDI crystals.............................................................................22
A Absorption cross-section in the condensed phaseLambert-Beer’s Law relates the optical density OD to the concentration of an absorber or molecule or monomer, Cm, given in M = moles/liter:
. (S1)𝑂𝐷 =‒ 𝑙𝑜𝑔10𝑇 = 𝜀𝑚 ∙ 𝐶𝑚 ∙ 𝑑
Herein, is the transmission, given by the ratio of transmitted to incident light (Itr and I0, 𝑇 = 𝐼𝑡𝑟/𝐼0
respectively), d is the film thickness, and εm is the molar extinction coefficient, given in units of cm-1 M-1. This definition is handy for analytical chemistry. Physicists define Lambert-Beer’s law by the natural absorbance An:
, (S2)𝐴𝑛 =‒ ln 𝑇 = 𝜎𝑚 ∙ 𝑐𝑚 ∙ 𝑑
Herein, the film thickness d is given in cm, the concentration cm is given in cm-3 so that the absorption cross-section σm attains the unit cm2. By using the definition of the base of a logarithm,
, (S3)log10 𝑇 = ln 𝑇/ln 10
we can insert S1 and S2 into S3 and obtain
(S4)𝜀𝑚 ∙ 𝐶𝑚 ∙ 𝑑 = 𝜎𝑚 ∙ 𝑐𝑚 ∙ 𝑑 /ln 10
Expressing Cm in units of cm, that is
, (S5)𝐶𝑚 = 𝑐𝑚 ∙ 𝑟𝑐𝑜𝑛𝑣/𝑁𝐴
NA = 6.022e23 mol-1 being Avogadro’s constant and rconv = 1000 cm3/dm3 the conversion factor between cubic centimeters and liters, we obtain
, (S6) 𝜎𝑚 = 𝜀𝑚 ∙ 𝑟𝑐𝑜𝑛𝑣 ∙ ln 10/𝑁𝐴
showing that it is simple to go from σm to εm and back. Both depend on the wavelength λ in the same way. The definition of an absorber can be freely chosen; the choice will define the unit for the exciton size in section B. In conjugated polymers, it is convenient to choose a repetition unit as the monomer, while in small molecules, the monomer is obviously the molecule itself. Once a monomer is chosen, its concentration is calculated by
, (S7)𝑐𝑚 = 𝜌/𝑚𝑚
where ρ is the specific density of the film (in g cm-3), and mm is the mass of a monomer in g.
The PDI:PFO blends of this paper have been produced at different blade speeds and measured by profilometry. We obtained film thicknesses of 140, 330, 550, and 850 nm for blade speed of 2.5 mm s-1, 9 mm s-1, 30 mm s-1, and 50 mm s-1, respectively. In all blends, the PFO:PDI weight ratio was 3:1. Assuming the same specific density of the PFO and PDI regions in the blends, we can 𝜌 = 1.2𝑔/𝑐𝑚2
therefore formally ascribe 25% of the measured film thickness to PDI, and 75% to PFO. We remove scattering contributions by subtracting a straight line, obtained by a linear regression in the limits of 1.57 – 1.7 eV where no absorption of either PDI or PFO prevails. Restating S2,
, (S8)𝐴𝑛(𝐸𝑝𝑟)/𝑐𝑚 = 𝜎𝑚(𝐸𝑝𝑟) ∙ 𝑑
we find σm by a linear regression of against the film thickness d. PDI and PFO have the 𝐴𝑛(𝐸𝑝𝑟)/𝑐𝑚
same molar weight of Mmono = 530 and 388 g/mol, respectively, which gives a monomer
concentration and , respectively. We use the probing 𝑐𝑚 = 1.36 ∙ 1021𝑐𝑚 ‒ 3 𝑐𝑚 = 1.86 ∙ 1021𝑐𝑚 ‒ 3
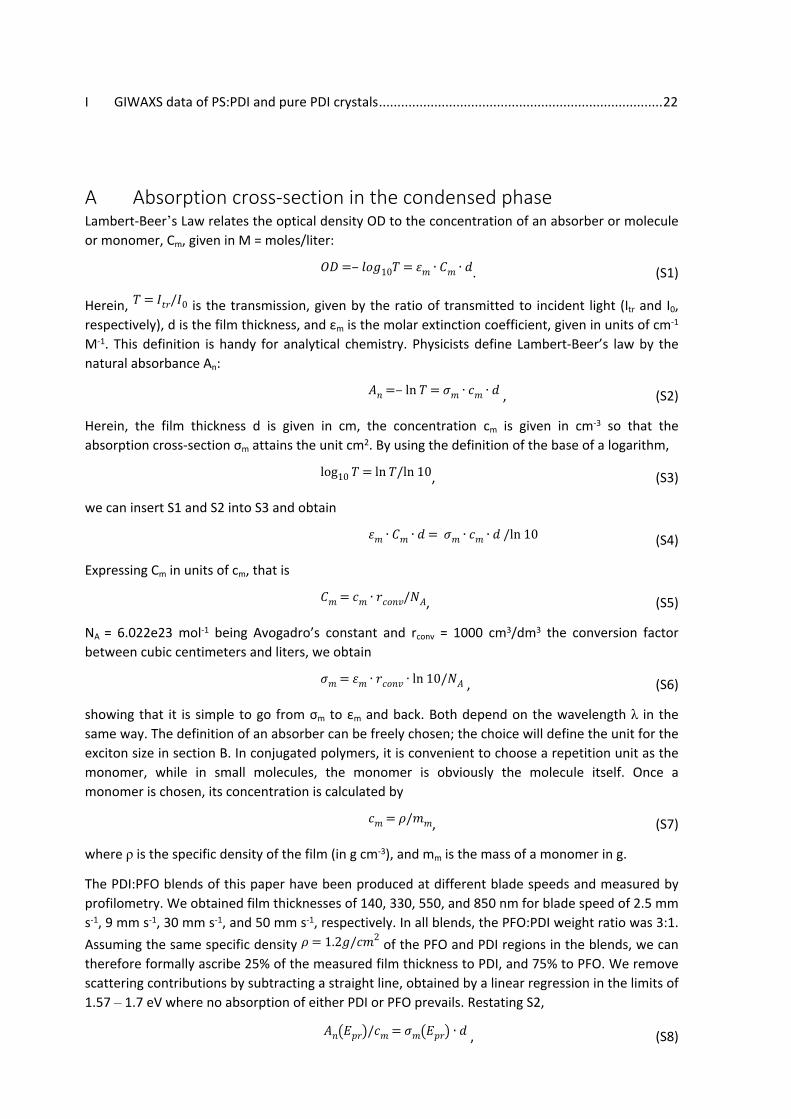
energies Epr = 2.35, 2.85, and 3.2 eV, allowing us to selectively probe PDI, the ordered β phase of PFO, and the main absorption peak of PFO, respectively. Figure S1 gives the linear fits, and Table S1 shows the results.
Figure S1: Linear fits according to eq. S8. The film thickness is given as relative contribution by the pure material probed at the respective probe energy, as given in the legend.
Table S1: Absorption cross-sections, as obtained from the slopes in Fig. S1, and associated uncertainties. For PFO, cross-sections are given per repetition unit (monomer).
Material Absorption cross-section σm (cm2) Probe energy (eV)PDI (5.9 ±0.6) X 10-18 2.35
PFO β phase (1.05 ±0.06) X 10-17 2.85PFO main absorption (2.3 ±0.4) X 10-17 3.2
B Calculation of excited state delocalizationQuantitative theory of transient photobleachThe theory of transient excitonic optical nonlinearities has been elaborated for two-dimensional excitons1 and later applied also to quasi one-dimensional excitons in carbon nanotubes.2 The theory relies on the phase space filling model (PSF) requiring that an exciton state cannot be excited twice, because the Pauli exclusion principle must hold. Therefore, the presence of excited states causes a reduction of the ability of the electronic system to absorb further photons at the same wavelength. In transient absorption (TA) spectra, this reduction of the total oscillator strength due to the presence of excited states becomes visible as a transient photobleach (PB). According to

the PSF, the relative change of the total oscillator strength f of an absorption band is equal to the relative occupation of available excitations:
(S9)𝛿𝑓𝑓
=‒ 𝑁/𝑁𝑠
where N is the density of excited states and Ns is the saturation density. In Frenkel exciton theory, Ns is the number of chromophors; it can be shown that the ground state bleach of Frenkel excitons is proportional to the extension of the excitonic wavefunction.3 The relative change of the total oscillator strength is experimentally accessible by measuring the relative photobleach:
, (S10)
∂𝑓𝑓
= ‒ 𝑃𝐵𝑟𝑒𝑙 =∆𝐴𝐴𝑛
The differential absorption ΔA is given by
, (S11)∆𝐴 = 𝐴𝑝 ‒ 𝐴𝑛𝑝 = ln (𝑇𝑛𝑝) ‒ ln (𝑇𝑝) =‒ 𝑙𝑛( 𝑇𝑝
𝑇𝑛𝑝) =‒ 𝑙𝑛(𝑇𝑝 ‒ 𝑇𝑛𝑝
𝑇𝑛𝑝+ 1) =‒ 𝑙𝑛(Δ𝑇
𝑇+ 1)
where An is the natural absorbance defined in S2, and the suffices “p” and “np” signify “pump pulse on” and “pump pulse off”, respectively. The differential transmission ΔT/T in the right most term in eq. S5 is the quantity usually measured in TA spectroscopy.
Lambert-Beer’s law for the differential absorption is given by
, (S12)Δ𝐴 = 𝜎𝑒𝑥𝑐 ∙ 𝑐𝑒𝑥𝑐 ∙ 𝑑 = 𝜎𝑒𝑥𝑐 ∙ 𝑁𝑒𝑥𝑐
where σexc is the cross-section in cm2 of the ground state bleach caused by one excited state, Nexc is the area density of excited states, and cexc is the concentration of excited states, which can be calculated by
, (S13)𝑐𝑒𝑥𝑐 = 𝑁𝑝 ∙ (1 ‒ 𝑇)/𝑑
with Np as the surface density of pump pulse photons (in cm-2) and T is the transmission at the pump wavelength, ignoring reflection and scattering losses. Inserting S12 and S2 into S10, we obtain:
. (S14)
𝜎𝑒𝑥𝑐
𝜎𝑚∙
𝑐𝑒𝑥𝑐
𝑐𝑚=
𝑁𝑁𝑠
According to the definition, . The saturation density Ns finally, is related to the size of the 𝑁 = 𝑐𝑒𝑥𝑐
excited state Lexc, i.e the electron hole correlation length, i.e., the distance at which the probability to find both electron and hole at the same time is 1/e or 1/e2 of the maximum value for one-dimensional or two-dimensional excited states, respectively. Thus, and therefore𝑁𝑠 = 𝑐𝑚/𝐿𝑒𝑥𝑐
(S15)𝐿𝑒𝑥𝑐 = 𝜎𝑒𝑥𝑐/𝜎𝑚
In the absence of disorder, the result for Lexc in S11 should be independent of the chosen detection wavelength as long it is the same for σexc and σm. However, in the presence of disorder, energy relaxation by energy transfer and transient hole burning effects generally cause the spectral shape of the PB band to be markedly different from that of the ground state absorption (A) band. Assuming that disorder acts on the transition energies but not on the transition cross-sections, we can integrate over the respective bands to get a better approximation for Lexc for disordered systems:
(S16)
𝐿𝑑𝑖𝑠𝑜𝑟𝑑𝑒𝑟𝑒𝑥𝑐 =
𝜔𝑚𝑎𝑥
∫𝜔𝑚𝑖𝑛
𝜎𝑒𝑥𝑐(𝜔)
𝜔𝑚𝑎𝑥
∫𝜔𝑚𝑖𝑛
𝜎𝑚(𝜔)
=𝑓𝑒𝑥𝑐
𝑓𝑚
where the integration limits are chosen such as to minimize overlap with adjacent bands. The total oscillator strengths for the monomer and the excited states (fm and fexc, respectively), if defined this way, will have a unit of [cm2 eV].
The biggest sources of error are:
- Uncertainty of pump pulse intensity (20%)- Uncertainty of density and local thickness (20%)- Superposition of PB band with PA so that PB is underestimated (20%)- Superposition with stimulated emission (SE) so that PB is overestimated (< 5% in
conjugated polymers but up to 50% in rigid systems like phthalocyanines and carbon nanotubes)
The first two contributions dominate if Lexc values from different samples must be compared, while excited state localization due to exciton dissociation in a single experiment can be traced with higher precision.
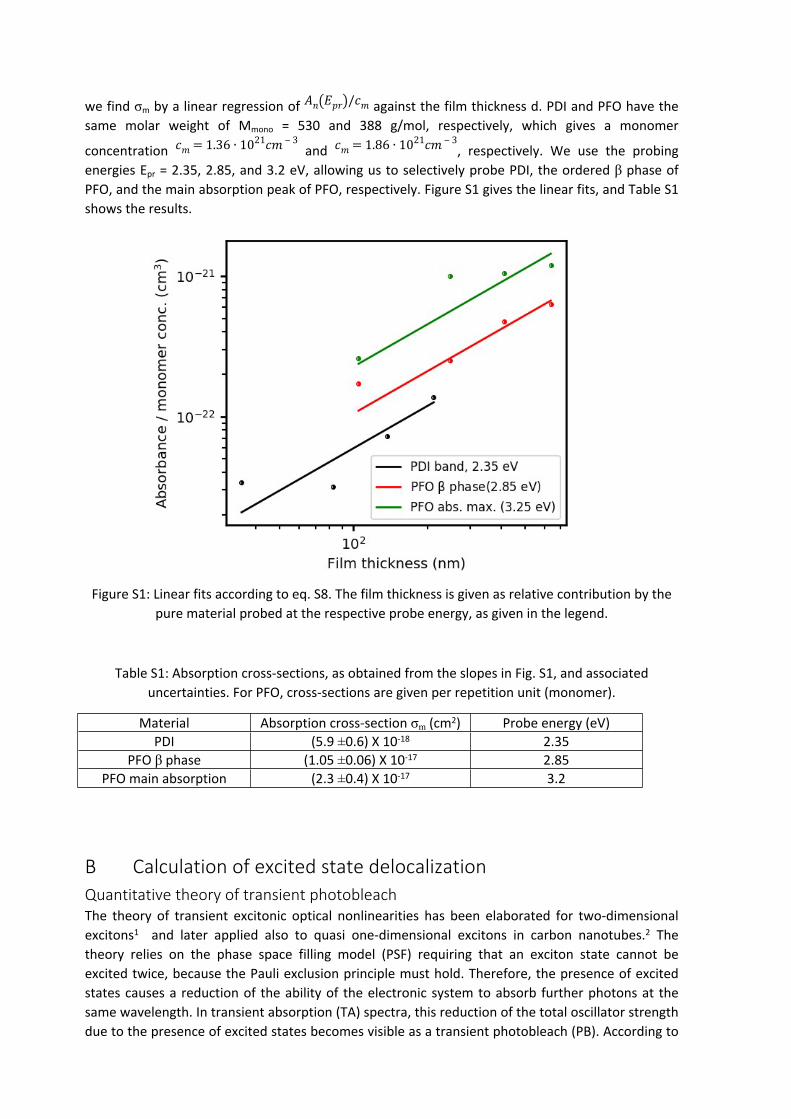
PDIIn Fig. S2 we show a TA spectrum of the PDI film at a delay time t = 1 ps after pumping at 520 nm with 267 nJ. One photon at 2.38 eV has an energy of 3.8e-19 J. The number of photons is therefore
Np = 7e11. At a spot size of 0.616 mm, we have an area of . The average 𝐴𝑝 = 𝜋𝑟2𝑝 = 0.011 𝑐𝑚2
intensity is therefore . Since the probe pulse has a similar spot size as the 𝐼𝑎𝑣
𝑝 =𝑁𝑝
𝐴𝑝= 6.4 ∙ 1013𝑐𝑚 ‒ 2
pump pulse, we make only a little error if we use the average intensity. At the pumping wavelength of 520 nm, the OD of the PDI film is about 0.07. Ignoring reflection and scattering losses, the absorption (not to be confused with the absorbance!) is given by A = 1-T. Considering S1, we find A = 1 – 10-OD = 0.13. Our pump pulse therefore creates (at the position where the probe is located) an
area density of excitations of . Since , from S12 it follows 𝑁𝑒𝑥𝑐 = 𝐴 ∙ 𝐼𝑎𝑣𝑝 = 8.5 ∙ 1012𝑐𝑚 ‒ 2 𝑁𝑒𝑥𝑐 = 𝑐𝑒𝑥𝑐 ∙ 𝑑
that . At the same probe energy (2.35 eV), Table S1 yields 𝜎𝑒𝑥𝑐 =
∆𝐴𝑁𝑒𝑥𝑐
= 9.4 ∙ 10 ‒ 17𝑐𝑚2
. It is therefore obvious that the contribution of a single excited state to the 𝜎𝑚 ≈ 5.9 ∙ 10 ‒ 18𝑐𝑚2
photobleach is more than an order of magnitude larger than the contribution of a single repetition unit to the ground state absorption. With S15, we find . Applying S16, we take into account 𝐿𝑒𝑥𝑐 ≈ 16
the stronger structuring of the TA spectra compared to the GSA spectra (see Fig. S2), yielding . This means that the wavefunction of a single excited state is delocalized over many 𝐿𝑒𝑥𝑐 ≈ 25
molecules. This is to be expected following the GIWAXS correlation length of 58 nm of the signals at 3.8 and 7.55 Angstroms, as well as the reduction of the ratio of the (0-0) and (1-0) vibronic replicas of the GSA spectrum, both speaking for strong H type excitonic coupling of the single monomers.
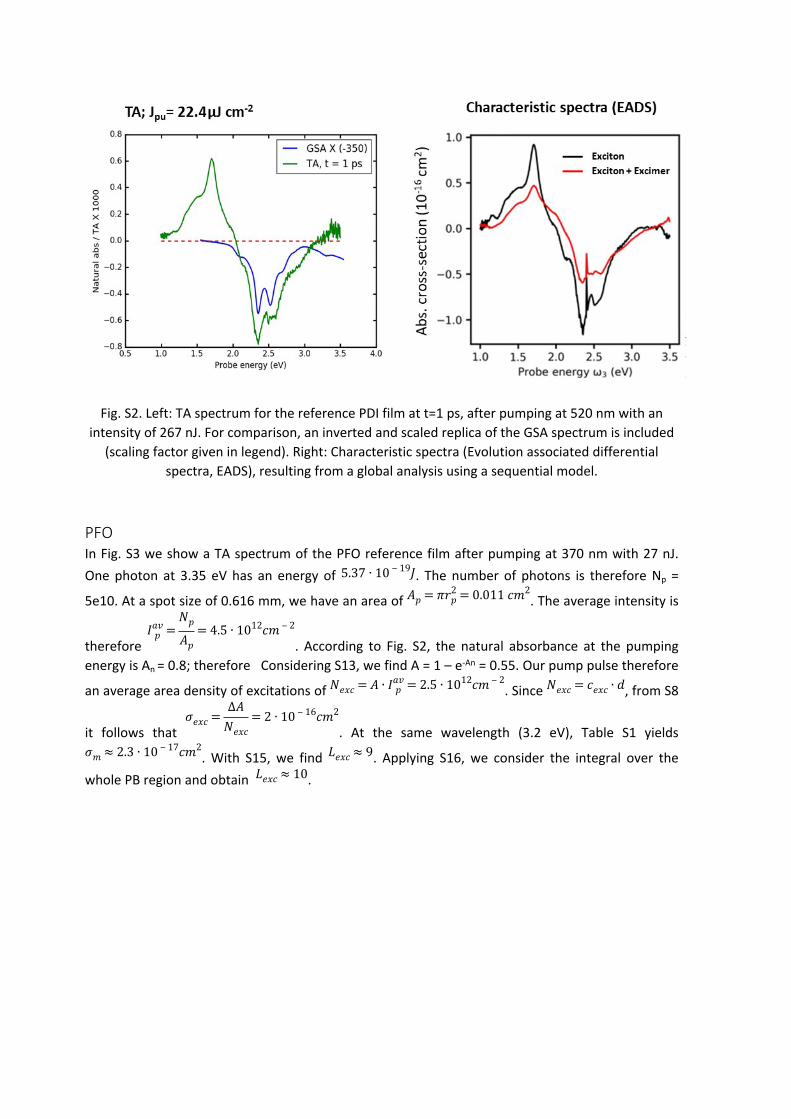
Fig. S2. Left: TA spectrum for the reference PDI film at t=1 ps, after pumping at 520 nm with an intensity of 267 nJ. For comparison, an inverted and scaled replica of the GSA spectrum is included
(scaling factor given in legend). Right: Characteristic spectra (Evolution associated differential spectra, EADS), resulting from a global analysis using a sequential model.
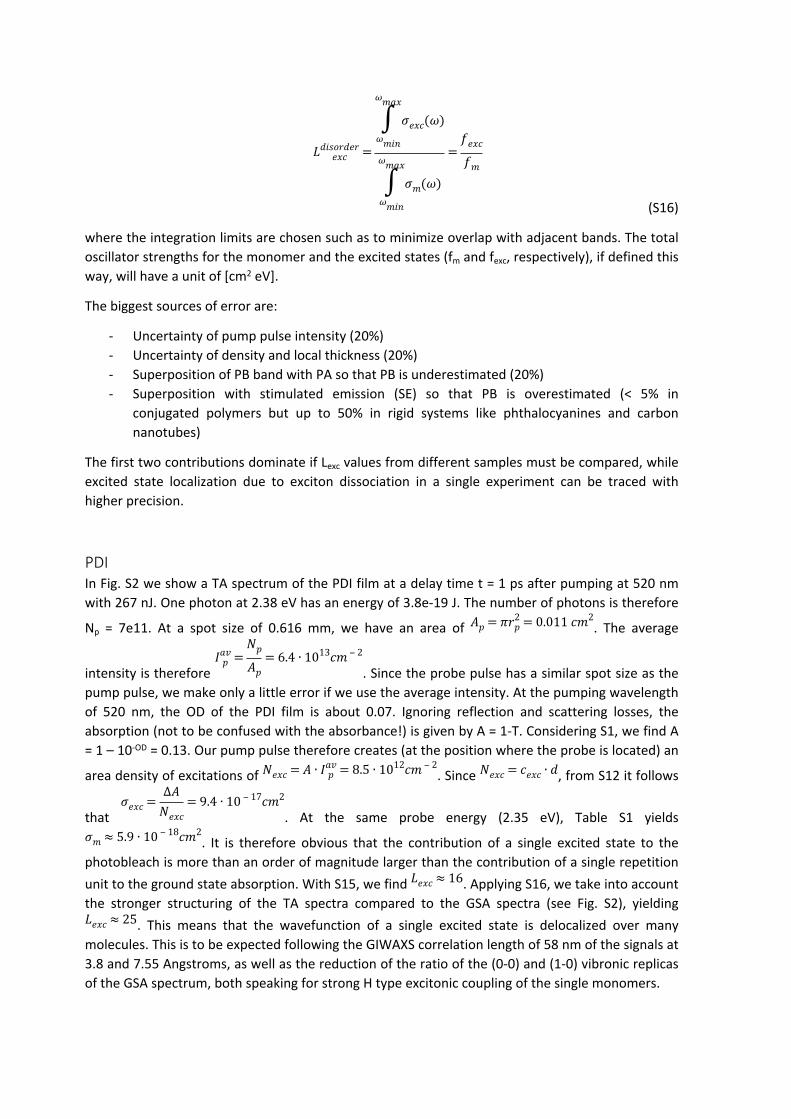
PFOIn Fig. S3 we show a TA spectrum of the PFO reference film after pumping at 370 nm with 27 nJ. One photon at 3.35 eV has an energy of . The number of photons is therefore Np = 5.37 ∙ 10 ‒ 19𝐽
5e10. At a spot size of 0.616 mm, we have an area of . The average intensity is 𝐴𝑝 = 𝜋𝑟2𝑝 = 0.011 𝑐𝑚2
therefore . According to Fig. S2, the natural absorbance at the pumping 𝐼𝑎𝑣
𝑝 =𝑁𝑝
𝐴𝑝= 4.5 ∙ 1012𝑐𝑚 ‒ 2
energy is An = 0.8; therefore Considering S13, we find A = 1 – e-An = 0.55. Our pump pulse therefore
an average area density of excitations of . Since , from S8 𝑁𝑒𝑥𝑐 = 𝐴 ∙ 𝐼𝑎𝑣𝑝 = 2.5 ∙ 1012𝑐𝑚 ‒ 2 𝑁𝑒𝑥𝑐 = 𝑐𝑒𝑥𝑐 ∙ 𝑑
it follows that . At the same wavelength (3.2 eV), Table S1 yields 𝜎𝑒𝑥𝑐 =
∆𝐴𝑁𝑒𝑥𝑐
= 2 ∙ 10 ‒ 16𝑐𝑚2
. With S15, we find . Applying S16, we consider the integral over the 𝜎𝑚 ≈ 2.3 ∙ 10 ‒ 17𝑐𝑚2 𝐿𝑒𝑥𝑐 ≈ 9
whole PB region and obtain . 𝐿𝑒𝑥𝑐 ≈ 10
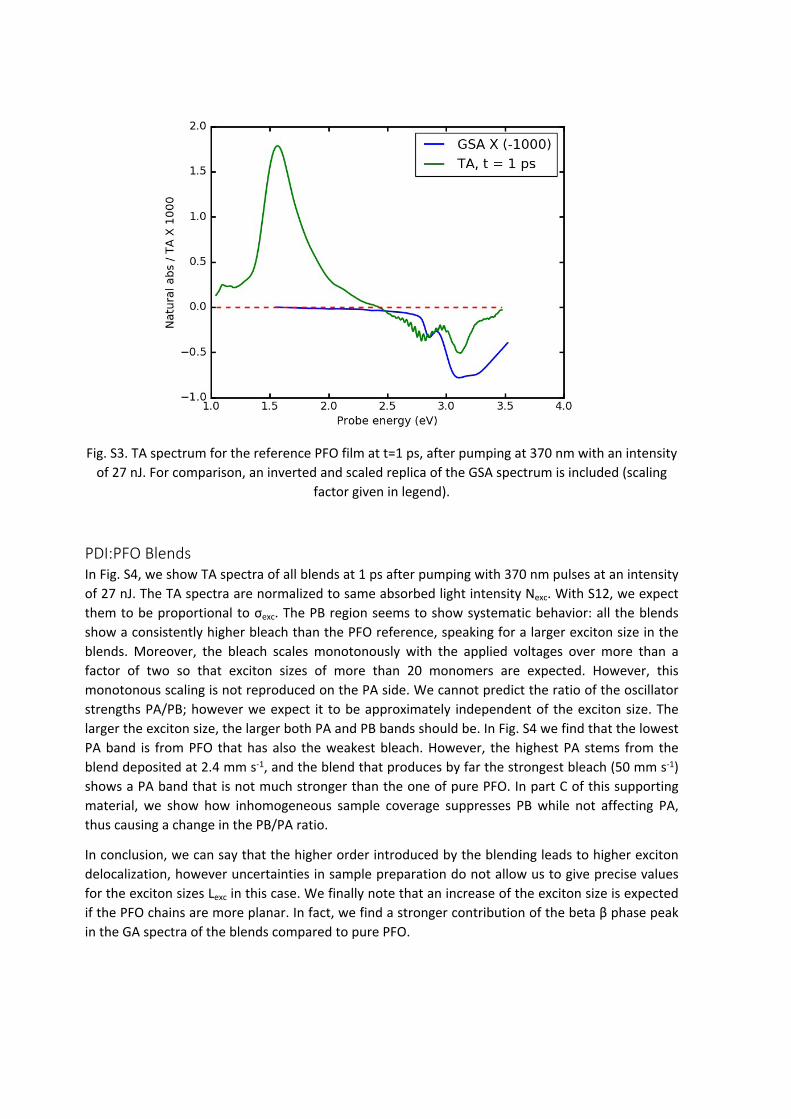
Fig. S3. TA spectrum for the reference PFO film at t=1 ps, after pumping at 370 nm with an intensity of 27 nJ. For comparison, an inverted and scaled replica of the GSA spectrum is included (scaling
factor given in legend).
PDI:PFO BlendsIn Fig. S4, we show TA spectra of all blends at 1 ps after pumping with 370 nm pulses at an intensity of 27 nJ. The TA spectra are normalized to same absorbed light intensity Nexc. With S12, we expect them to be proportional to σexc. The PB region seems to show systematic behavior: all the blends show a consistently higher bleach than the PFO reference, speaking for a larger exciton size in the blends. Moreover, the bleach scales monotonously with the applied voltages over more than a factor of two so that exciton sizes of more than 20 monomers are expected. However, this monotonous scaling is not reproduced on the PA side. We cannot predict the ratio of the oscillator strengths PA/PB; however we expect it to be approximately independent of the exciton size. The larger the exciton size, the larger both PA and PB bands should be. In Fig. S4 we find that the lowest PA band is from PFO that has also the weakest bleach. However, the highest PA stems from the blend deposited at 2.4 mm s-1, and the blend that produces by far the strongest bleach (50 mm s-1) shows a PA band that is not much stronger than the one of pure PFO. In part C of this supporting material, we show how inhomogeneous sample coverage suppresses PB while not affecting PA, thus causing a change in the PB/PA ratio.
In conclusion, we can say that the higher order introduced by the blending leads to higher exciton delocalization, however uncertainties in sample preparation do not allow us to give precise values for the exciton sizes Lexc in this case. We finally note that an increase of the exciton size is expected if the PFO chains are more planar. In fact, we find a stronger contribution of the beta β phase peak in the GA spectra of the blends compared to pure PFO.
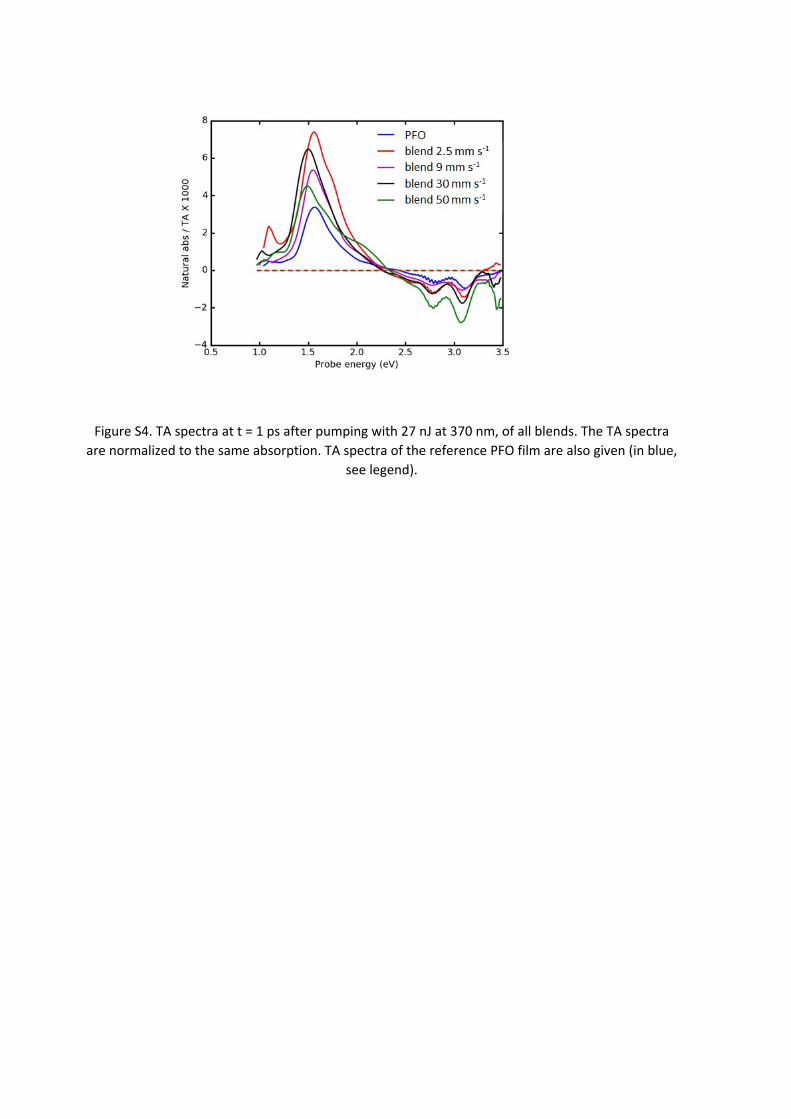
Figure S4. TA spectra at t = 1 ps after pumping with 27 nJ at 370 nm, of all blends. The TA spectra are normalized to the same absorption. TA spectra of the reference PFO film are also given (in blue,
see legend).
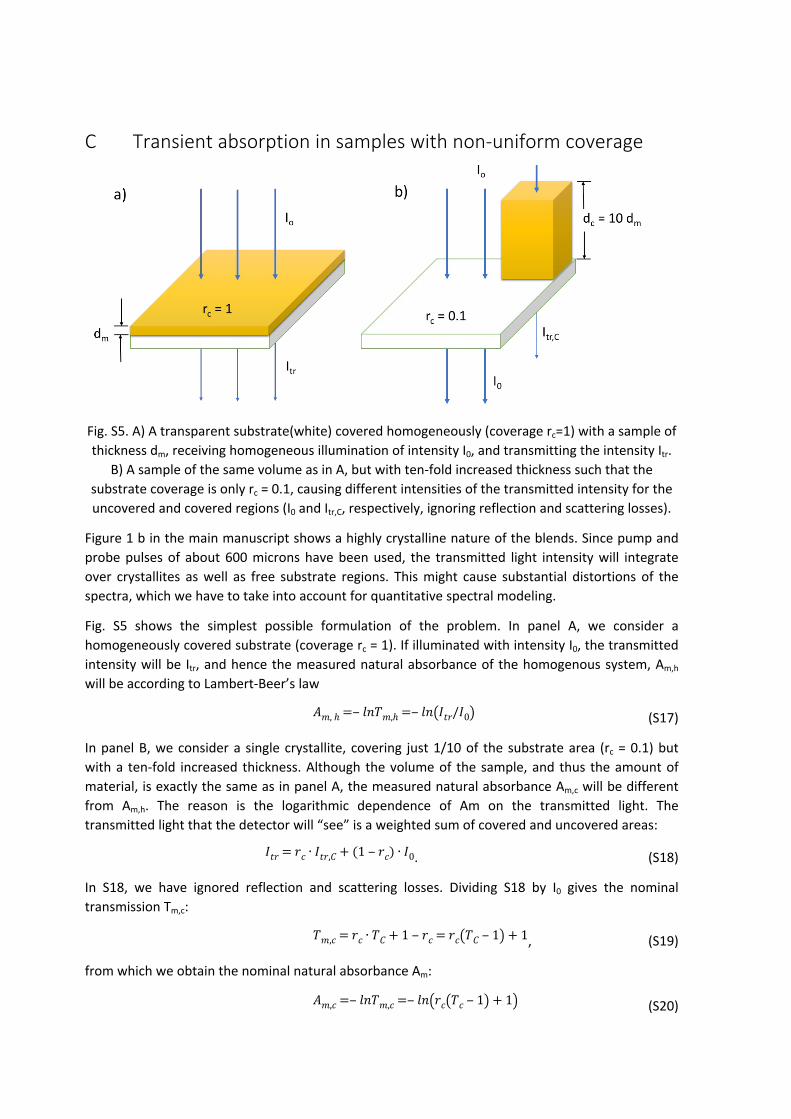
C Transient absorption in samples with non-uniform coverage
Fig. S5. A) A transparent substrate(white) covered homogeneously (coverage rc=1) with a sample of thickness dm, receiving homogeneous illumination of intensity I0, and transmitting the intensity Itr.
B) A sample of the same volume as in A, but with ten-fold increased thickness such that the substrate coverage is only rc = 0.1, causing different intensities of the transmitted intensity for the uncovered and covered regions (I0 and Itr,C, respectively, ignoring reflection and scattering losses).
Figure 1 b in the main manuscript shows a highly crystalline nature of the blends. Since pump and probe pulses of about 600 microns have been used, the transmitted light intensity will integrate over crystallites as well as free substrate regions. This might cause substantial distortions of the spectra, which we have to take into account for quantitative spectral modeling.
Fig. S5 shows the simplest possible formulation of the problem. In panel A, we consider a homogeneously covered substrate (coverage rc = 1). If illuminated with intensity I0, the transmitted intensity will be Itr, and hence the measured natural absorbance of the homogenous system, Am,h will be according to Lambert-Beer’s law
(S17)𝐴𝑚, ℎ =‒ 𝑙𝑛𝑇𝑚,ℎ =‒ 𝑙𝑛(𝐼𝑡𝑟/𝐼0)
In panel B, we consider a single crystallite, covering just 1/10 of the substrate area (rc = 0.1) but with a ten-fold increased thickness. Although the volume of the sample, and thus the amount of material, is exactly the same as in panel A, the measured natural absorbance Am,c will be different from Am,h. The reason is the logarithmic dependence of Am on the transmitted light. The transmitted light that the detector will “see” is a weighted sum of covered and uncovered areas:
. (S18)𝐼𝑡𝑟 = 𝑟𝑐 ∙ 𝐼𝑡𝑟,𝐶 + (1 ‒ 𝑟𝑐) ∙ 𝐼0
In S18, we have ignored reflection and scattering losses. Dividing S18 by I0 gives the nominal transmission Tm,c:
, (S19)𝑇𝑚,𝑐 = 𝑟𝑐 ∙ 𝑇𝐶 + 1 ‒ 𝑟𝑐 = 𝑟𝑐(𝑇𝐶 ‒ 1) + 1
from which we obtain the nominal natural absorbance Am:
(S20)𝐴𝑚,𝑐 =‒ 𝑙𝑛𝑇𝑚,𝑐 =‒ 𝑙𝑛(𝑟𝑐(𝑇𝑐 ‒ 1) + 1)
If the crystal is only weakly absorbing, and therefore , irrespective of the 𝑇𝑐 ≈ 1 𝑥 = 𝑟𝑐(𝑇𝐶 ‒ 1) ≈ 0
value of rc because it can vary only between 0 and 1. We can then use the relation and 𝑙𝑛(1 + 𝑥) ≈ 𝑥
therefore . From and , we understand that , allowing us 𝐴𝑚,𝑐 ≈ 𝑟𝑐(𝑇𝑐 ‒ 1) 𝑇𝑐 = 𝑒𝑥𝑝( ‒ 𝐴𝑐) 𝑇𝐶 ≈ 1 𝐴𝑐 ≈ 0
to use the approximation and thus . Since , σ and c being the exp (𝑥) ≈ 1 + 𝑥 𝐴𝑚,𝑐 ≈ 𝑟𝑐 ∙ 𝐴𝑐 𝐴𝑐 = 𝜎𝑐𝑑𝑐
absorption cross-section and chromophore concentration, respectively, and , see Fig. S5, 𝑑𝑐 = 𝑑𝑚/𝑟𝑐
we finally find for very low values of Ac:
. (S21)𝐴𝑚,𝑐 ≈ 𝜎𝑐𝑑𝑚 ≠ 𝑓(𝑟𝑐)
In spectral regions where σ is small, the absorbance is independent of the coverage rc (if the nominal film thickness is kept constant) and the spectral shape for partially covered and fully covered samples will be identical. In contrast, if σ is large, then the transmitted light through the crystal will be negligible, and S18 will reduce to
, (S22)𝐼𝑡𝑟 ≈ (1 ‒ 𝑟𝑐) ∙ 𝐼0
and hence . The sample in Fig. S5B cannot have a transmission less than 90% even if the 𝑇𝑚,𝑐 ≈ 1 ‒ 𝑟𝑐
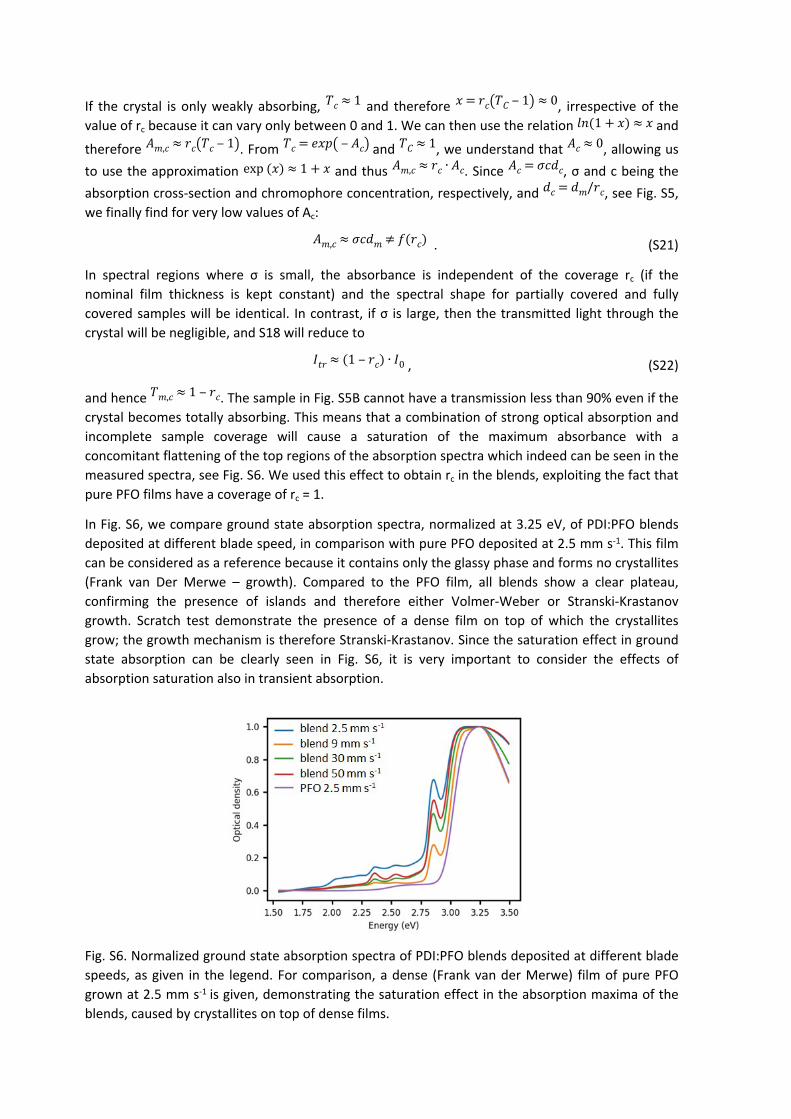
crystal becomes totally absorbing. This means that a combination of strong optical absorption and incomplete sample coverage will cause a saturation of the maximum absorbance with a concomitant flattening of the top regions of the absorption spectra which indeed can be seen in the measured spectra, see Fig. S6. We used this effect to obtain rc in the blends, exploiting the fact that pure PFO films have a coverage of rc = 1.
In Fig. S6, we compare ground state absorption spectra, normalized at 3.25 eV, of PDI:PFO blends deposited at different blade speed, in comparison with pure PFO deposited at 2.5 mm s-1. This film can be considered as a reference because it contains only the glassy phase and forms no crystallites (Frank van Der Merwe – growth). Compared to the PFO film, all blends show a clear plateau, confirming the presence of islands and therefore either Volmer-Weber or Stranski-Krastanov growth. Scratch test demonstrate the presence of a dense film on top of which the crystallites grow; the growth mechanism is therefore Stranski-Krastanov. Since the saturation effect in ground state absorption can be clearly seen in Fig. S6, it is very important to consider the effects of absorption saturation also in transient absorption.
Fig. S6. Normalized ground state absorption spectra of PDI:PFO blends deposited at different blade speeds, as given in the legend. For comparison, a dense (Frank van der Merwe) film of pure PFO grown at 2.5 mm s-1 is given, demonstrating the saturation effect in the absorption maxima of the blends, caused by crystallites on top of dense films.
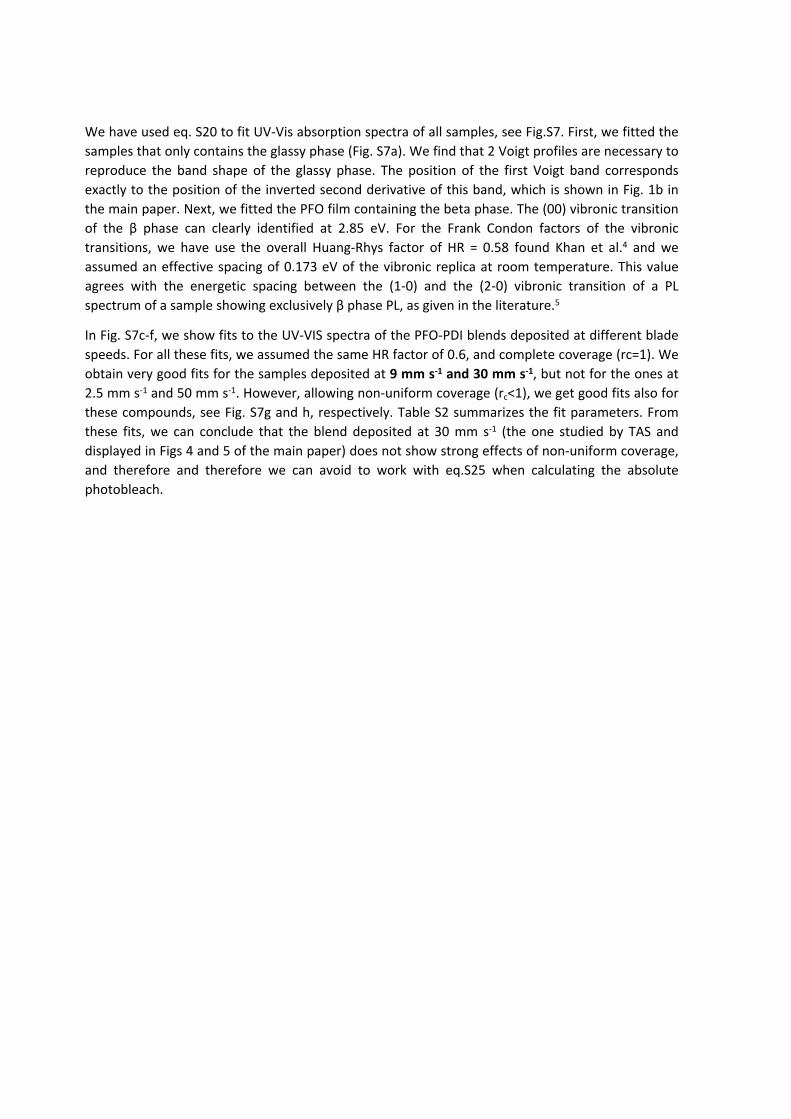
We have used eq. S20 to fit UV-Vis absorption spectra of all samples, see Fig.S7. First, we fitted the samples that only contains the glassy phase (Fig. S7a). We find that 2 Voigt profiles are necessary to reproduce the band shape of the glassy phase. The position of the first Voigt band corresponds exactly to the position of the inverted second derivative of this band, which is shown in Fig. 1b in the main paper. Next, we fitted the PFO film containing the beta phase. The (00) vibronic transition of the β phase can clearly identified at 2.85 eV. For the Frank Condon factors of the vibronic transitions, we have use the overall Huang-Rhys factor of HR = 0.58 found Khan et al.4 and we assumed an effective spacing of 0.173 eV of the vibronic replica at room temperature. This value agrees with the energetic spacing between the (1-0) and the (2-0) vibronic transition of a PL spectrum of a sample showing exclusively β phase PL, as given in the literature.5
In Fig. S7c-f, we show fits to the UV-VIS spectra of the PFO-PDI blends deposited at different blade speeds. For all these fits, we assumed the same HR factor of 0.6, and complete coverage (rc=1). We obtain very good fits for the samples deposited at 9 mm s-1 and 30 mm s-1, but not for the ones at 2.5 mm s-1 and 50 mm s-1. However, allowing non-uniform coverage (rc<1), we get good fits also for these compounds, see Fig. S7g and h, respectively. Table S2 summarizes the fit parameters. From these fits, we can conclude that the blend deposited at 30 mm s-1 (the one studied by TAS and displayed in Figs 4 and 5 of the main paper) does not show strong effects of non-uniform coverage, and therefore and therefore we can avoid to work with eq.S25 when calculating the absolute photobleach.

Fig. S7. Spectral modeling of PFO absorption bands. Black dots: experimental UV-Vis spectra; blue line: fit, composed of two Voigt profiles (purple and green) and the vibronic progression of the β phase (red lines). For panels a through f, homogeneous substrate coverage has been assumed (rc=1 in eq. S20). In panels g and h, incomplete coverage has been assumed. In this case, the black dots and blue lines refer to the nominal (measured) absorbance, while the single bands are given as calculated absorbance in the covered regions due to the fitted value of rc, as given in Table S2.
Table S2: fitting parameters for the fits given in Fig. S7. C means band center positions, Bg and Bl refer to Gaussian and Lorentzian widths of the respective Voigt profiles, respectively, S means Skewness, and Rc is the fitted relative substrate coverage. Parameters with an asterisk have been
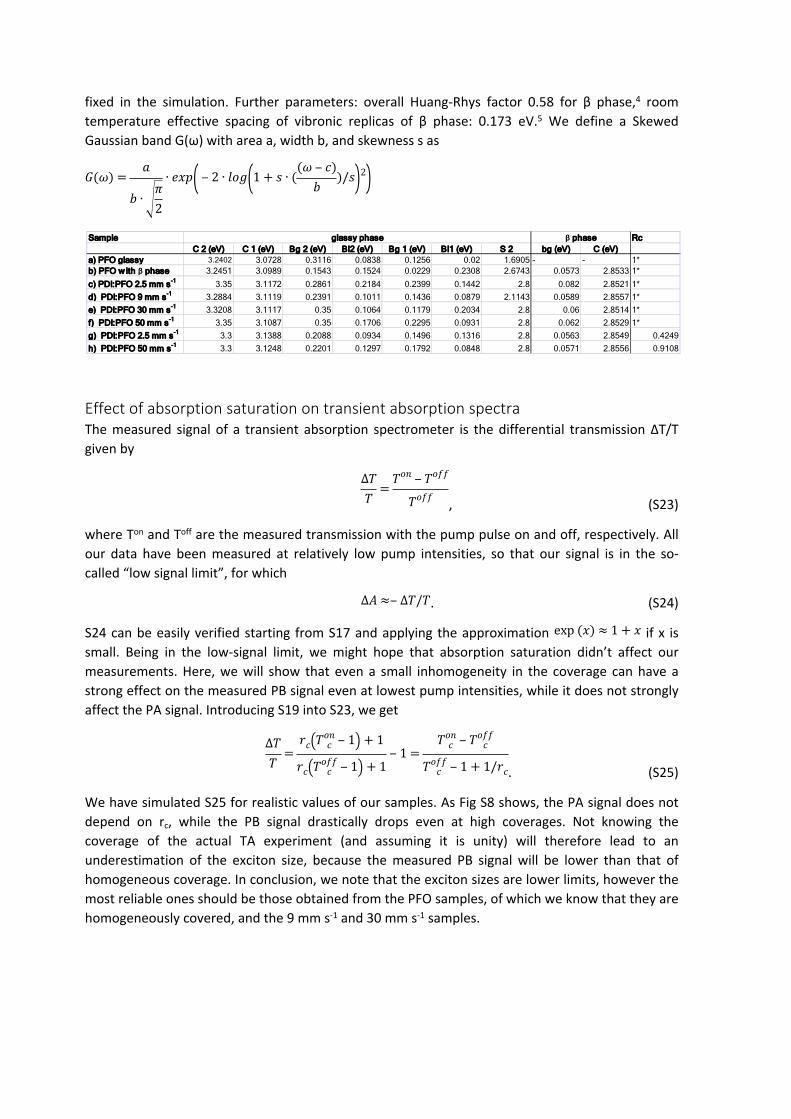
fixed in the simulation. Further parameters: overall Huang-Rhys factor 0.58 for β phase,4 room temperature effective spacing of vibronic replicas of β phase: 0.173 eV.5 We define a Skewed Gaussian band G(ω) with area a, width b, and skewness s as
𝐺(𝜔) =𝑎
𝑏 ∙𝜋2
∙ 𝑒𝑥𝑝( ‒ 2 ∙ 𝑙𝑜𝑔(1 + 𝑠 ∙ ((𝜔 ‒ 𝑐)
𝑏)/𝑠)2)
Sample RcC 2 (eV) C 1 (eV) Bg 2 (eV) Bl2 (eV) Bg 1 (eV) Bl1 (eV) S 2 bg (eV) C (eV)
a) PFO glassy 3.2402 3.0728 0.3116 0.0838 0.1256 0.02 1.6905 - - 1*b) PFO w ith β phase 3.2451 3.0989 0.1543 0.1524 0.0229 0.2308 2.6743 0.0573 2.8533 1*
c) PDI:PFO 2.5 mm s-1 3.35 3.1172 0.2861 0.2184 0.2399 0.1442 2.8 0.082 2.8521 1*d) PDI:PFO 9 mm s-1 3.2884 3.1119 0.2391 0.1011 0.1436 0.0879 2.1143 0.0589 2.8557 1*e) PDI:PFO 30 mm s-1 3.3208 3.1117 0.35 0.1064 0.1179 0.2034 2.8 0.06 2.8514 1*f) PDI:PFO 50 mm s-1 3.35 3.1087 0.35 0.1706 0.2295 0.0931 2.8 0.062 2.8529 1*g) PDI:PFO 2.5 mm s-1 3.3 3.1388 0.2088 0.0934 0.1496 0.1316 2.8 0.0563 2.8549 0.4249h) PDI:PFO 50 mm s-1 3.3 3.1248 0.2201 0.1297 0.1792 0.0848 2.8 0.0571 2.8556 0.9108
glassy phase β phase
Effect of absorption saturation on transient absorption spectraThe measured signal of a transient absorption spectrometer is the differential transmission ΔT/T given by
, (S23)
∆𝑇𝑇
=𝑇𝑜𝑛 ‒ 𝑇𝑜𝑓𝑓
𝑇𝑜𝑓𝑓
where Ton and Toff are the measured transmission with the pump pulse on and off, respectively. All our data have been measured at relatively low pump intensities, so that our signal is in the so-called “low signal limit”, for which
. (S24)∆𝐴 ≈‒ ∆𝑇/𝑇
S24 can be easily verified starting from S17 and applying the approximation if x is exp (𝑥) ≈ 1 + 𝑥
small. Being in the low-signal limit, we might hope that absorption saturation didn’t affect our measurements. Here, we will show that even a small inhomogeneity in the coverage can have a strong effect on the measured PB signal even at lowest pump intensities, while it does not strongly affect the PA signal. Introducing S19 into S23, we get
. (S25)
∆𝑇𝑇
=𝑟𝑐(𝑇𝑜𝑛
𝑐 ‒ 1) + 1
𝑟𝑐(𝑇𝑜𝑓𝑓𝑐 ‒ 1) + 1
‒ 1 =𝑇𝑜𝑛
𝑐 ‒ 𝑇𝑜𝑓𝑓𝑐
𝑇𝑜𝑓𝑓𝑐 ‒ 1 + 1/𝑟𝑐
We have simulated S25 for realistic values of our samples. As Fig S8 shows, the PA signal does not depend on rc, while the PB signal drastically drops even at high coverages. Not knowing the coverage of the actual TA experiment (and assuming it is unity) will therefore lead to an underestimation of the exciton size, because the measured PB signal will be lower than that of homogeneous coverage. In conclusion, we note that the exciton sizes are lower limits, however the most reliable ones should be those obtained from the PFO samples, of which we know that they are homogeneously covered, and the 9 mm s-1 and 30 mm s-1 samples.
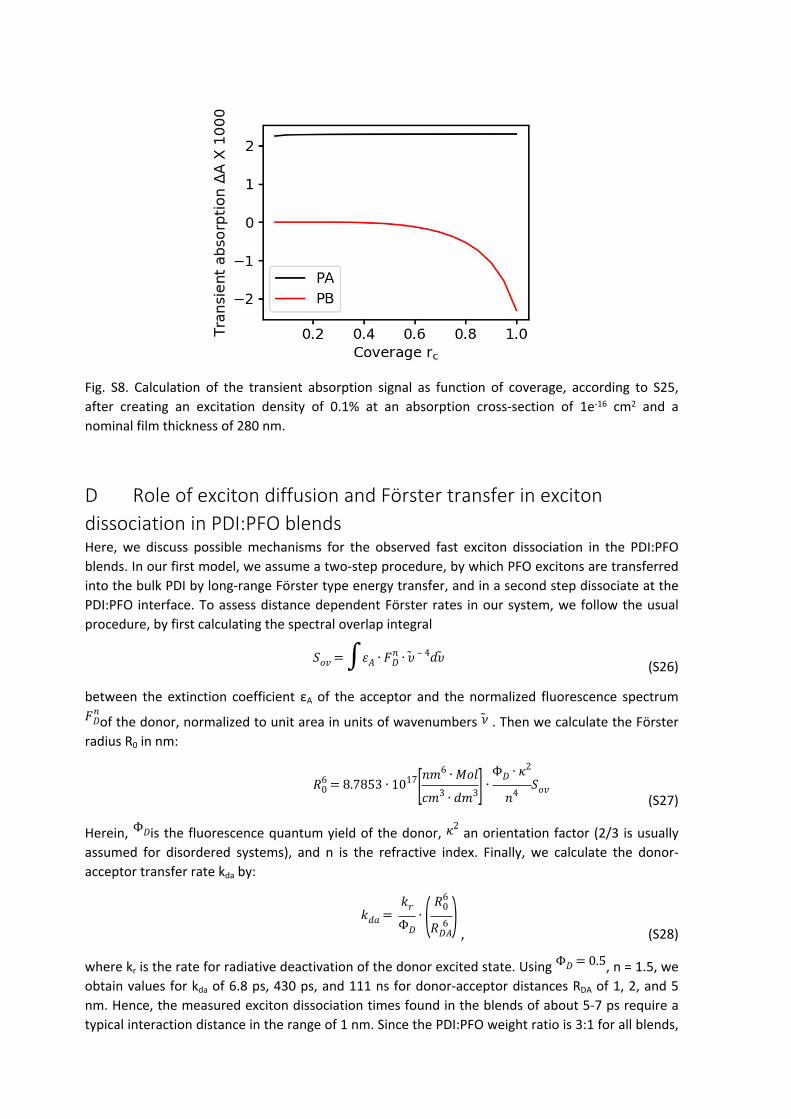
Fig. S8. Calculation of the transient absorption signal as function of coverage, according to S25, after creating an excitation density of 0.1% at an absorption cross-section of 1e-16 cm2 and a nominal film thickness of 280 nm.
D Role of exciton diffusion and Förster transfer in exciton dissociation in PDI:PFO blendsHere, we discuss possible mechanisms for the observed fast exciton dissociation in the PDI:PFO blends. In our first model, we assume a two-step procedure, by which PFO excitons are transferred into the bulk PDI by long-range Förster type energy transfer, and in a second step dissociate at the PDI:PFO interface. To assess distance dependent Förster rates in our system, we follow the usual procedure, by first calculating the spectral overlap integral
(S26)𝑆𝑜𝑣 = ∫𝜀𝐴 ∙ 𝐹𝑛
𝐷 ∙ �̃� ‒ 4𝑑�̃�
between the extinction coefficient εA of the acceptor and the normalized fluorescence spectrum
of the donor, normalized to unit area in units of wavenumbers . Then we calculate the Förster 𝐹𝑛𝐷 �̃�
radius R0 in nm:
(S27)𝑅6
0 = 8.7853 ∙ 1017[𝑛𝑚6 ∙ 𝑀𝑜𝑙
𝑐𝑚3 ∙ 𝑑𝑚3] ∙Φ𝐷 ∙ 𝜅2
𝑛4𝑆𝑜𝑣
Herein, is the fluorescence quantum yield of the donor, an orientation factor (2/3 is usually Φ𝐷 𝜅2
assumed for disordered systems), and n is the refractive index. Finally, we calculate the donor-acceptor transfer rate kda by:
, (S28)𝑘𝑑𝑎 =
𝑘𝑟
Φ𝐷∙ ( 𝑅6
0
𝑅 6𝐷𝐴
)where kr is the rate for radiative deactivation of the donor excited state. Using , n = 1.5, we Φ𝐷 = 0.5
obtain values for kda of 6.8 ps, 430 ps, and 111 ns for donor-acceptor distances RDA of 1, 2, and 5 nm. Hence, the measured exciton dissociation times found in the blends of about 5-7 ps require a typical interaction distance in the range of 1 nm. Since the PDI:PFO weight ratio is 3:1 for all blends,

such a short typical interaction distance would require a domain size for both PFO and PDI in a few nm range. This notion is in contradiction with the high GIWAXS correlation lengths, typically in the tens on nm range. Furthermore, most of the GIWAXS peaks are at the same position as in the pure samples. Both facts indicate rather pure separated domains with domain sizes in the tens of nm range and only a weak contribution from mixed phases. Therefore, we can discard a strong contribution of Förster transfer to the exciton dissociation in the PDI:PFO blends.
Our second model is diffusional transfer of PFO excitons to the PDI:PFO interface. Approximate exciton diffusion coefficients for mixed-phase PFO have been obtained by Shaw et al.6 In glassy PFO, they found which was found to increase significantly at higher 𝐷 = 1.5 ∙ 10 ‒ 2𝑐𝑚2𝑠 ‒ 1
concentration of the β phase. From the GIWAXS studies, we can model our blends as intercalated PDI:PFO phase immersed in a bulk consisting of a mixture of glassy and β-phase PFO. We do not know which of these phases is directly surrounding the intercalated PDI:PFO phase. Our quantitative estimation is therefore based on the following assumptions: 1) we neglect the presence of glassy phase PFO, because due to the shorter excitons in that phase, it will contribute less to the overall signal that we find in TA spectroscopy. 2) We assume that the intercalated PDI:PFO phase extends further than the exciton diffusion length, in which case exciton diffusion towards the intercalated phase can be treated as a one-dimensional problem. This assumption is justified because on the time scale of interest, the displacement of excitons is only
, while the coherence lengths of PDI in the intercalated ⟨𝑥⟩ = 𝐷𝑡 = 1.5 ∙ 10 ‒ 2 ∙ 10 ‒ 11𝑐𝑚 < 10 𝑛𝑚
PDI:PFO phase largely exceed 10 nm, as described in the main text.
For purely one-dimensional diffusion, one has the following concentration-time law for the concentration S(t) of singlet excitons:7
, (S29)𝑆𝑑𝑖𝑓𝑓(𝑡) = 𝑆(0) ∙ 𝑒𝑥𝑝[ ‒ 4𝑐𝑞 ∙ 𝑅2𝑞 ∙ 𝜋𝐷𝑡]
where Rq is the reaction radius which for electron transfer reactions is usually set to 1 nm.3 As we know the exciton diffusion constant, we can get an estimate for cq by fitting S29 to the experimentally obtained concentrations of PFO excitons. Since the cross-section spectra σs and σc of PFO excitons and the charge separated states, respectively, are known (Fig. 5d of main text), we can find the experimental PFO concentration S(t) by starting with the Beer-Lambert law:
(S30)∆𝐴(𝑡) = 𝑑𝑓𝑖𝑙𝑚 ∙ (𝜎𝑠 ∙ 𝑆(𝑡) + 𝜎𝑐 ∙ 𝐶(𝑡))
Below, we will show that the transfer yield is close to unity; we can thus express the concentration of charge separated states C(t) as
, (S31)𝐶(𝑡) = 𝑆0 ‒ 𝑆(𝑡)
yielding
(S32)∆𝐴(𝑡) = 𝑑𝑓𝑖𝑙𝑚 ∙ (𝜎𝑠 ‒ 𝜎𝑐) ∙ 𝑆(𝑡) + 𝑑𝑓𝑖𝑙𝑚 ∙ 𝜎𝑐 ∙ 𝑆0
After long times, and with , which means that the right term of S32 equals 𝑆(𝑡→∞) = 0 𝐶(𝑡→∞) = 𝑆0
S30 for :𝑡→∞
(S33)∆𝐴(𝑡) = 𝑑𝑓𝑖𝑙𝑚 ∙ (𝜎𝑠 ‒ 𝜎𝑐) ∙ 𝑆(𝑡) + ∆𝐴∞
yielding
(S34)𝑆(𝑡) = (∆𝐴(𝑡) ‒ ∆𝐴∞)/(𝜎𝑠 ‒ 𝜎𝑐) ∙ 𝑑 ‒ 1𝑓𝑖𝑙𝑚
In practice, solving S34 at the probe energy of maximum PFO singlet absorption leads to spurious exciton dynamics due to exciton thermalization. Under the assumption that exciton thermalization redistributes oscillator strength without affecting its integral (which essentially means neglecting a change in contributions from Herzberg-Teller coupling), it is better to integrate over the whole band
(S35) 𝑆(𝑡) =
1.95 𝑒𝑉
∫𝜔 = 1.35 𝑒𝑉
(∆𝐴(𝜔,𝑡) ‒ ∆𝐴∞)𝑑𝜔/1.95 𝑒𝑉
∫𝜔 = 1.35 𝑒𝑉
[𝜎𝑆 ‒ 𝜎𝐶]𝑑𝜔 ∙ 𝑑 ‒ 1𝑓𝑖𝑙𝑚
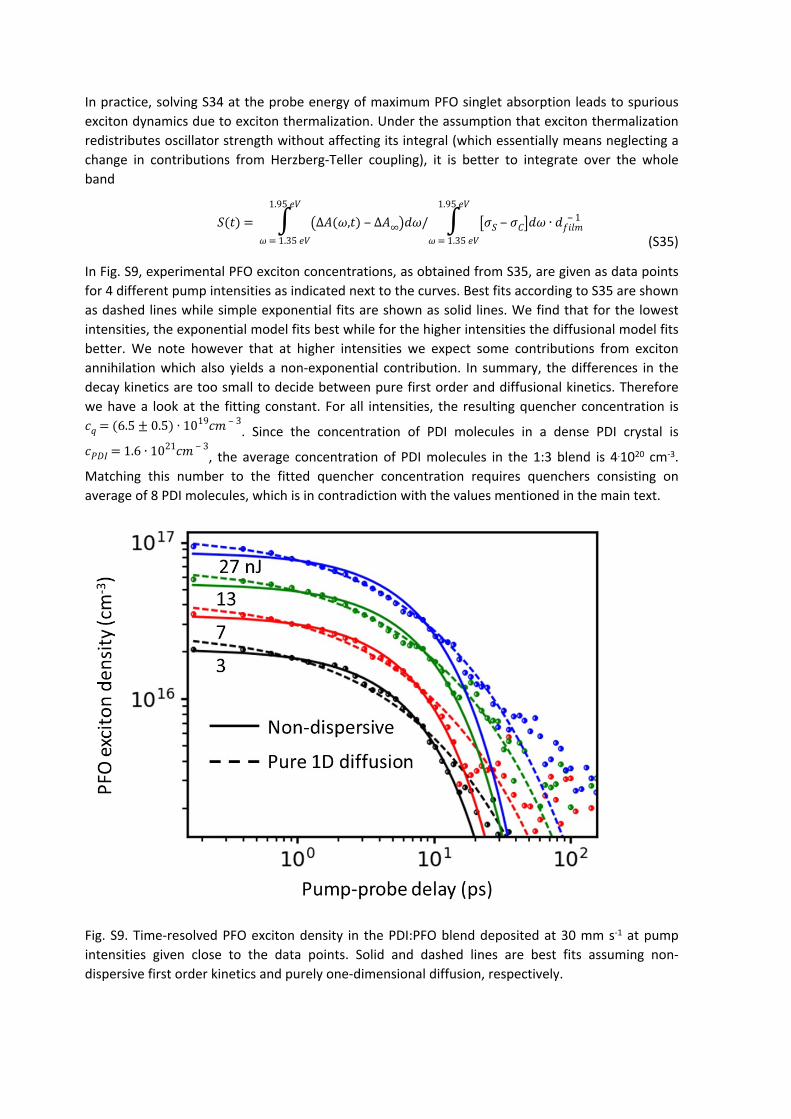
In Fig. S9, experimental PFO exciton concentrations, as obtained from S35, are given as data points for 4 different pump intensities as indicated next to the curves. Best fits according to S35 are shown as dashed lines while simple exponential fits are shown as solid lines. We find that for the lowest intensities, the exponential model fits best while for the higher intensities the diffusional model fits better. We note however that at higher intensities we expect some contributions from exciton annihilation which also yields a non-exponential contribution. In summary, the differences in the decay kinetics are too small to decide between pure first order and diffusional kinetics. Therefore we have a look at the fitting constant. For all intensities, the resulting quencher concentration is
. Since the concentration of PDI molecules in a dense PDI crystal is 𝑐𝑞 = (6.5 ± 0.5) ∙ 1019𝑐𝑚 ‒ 3
, the average concentration of PDI molecules in the 1:3 blend is 4.1020 cm-3. 𝑐𝑃𝐷𝐼 = 1.6 ∙ 1021𝑐𝑚 ‒ 3
Matching this number to the fitted quencher concentration requires quenchers consisting on average of 8 PDI molecules, which is in contradiction with the values mentioned in the main text.
Fig. S9. Time-resolved PFO exciton density in the PDI:PFO blend deposited at 30 mm s-1 at pump intensities given close to the data points. Solid and dashed lines are best fits assuming non-dispersive first order kinetics and purely one-dimensional diffusion, respectively.
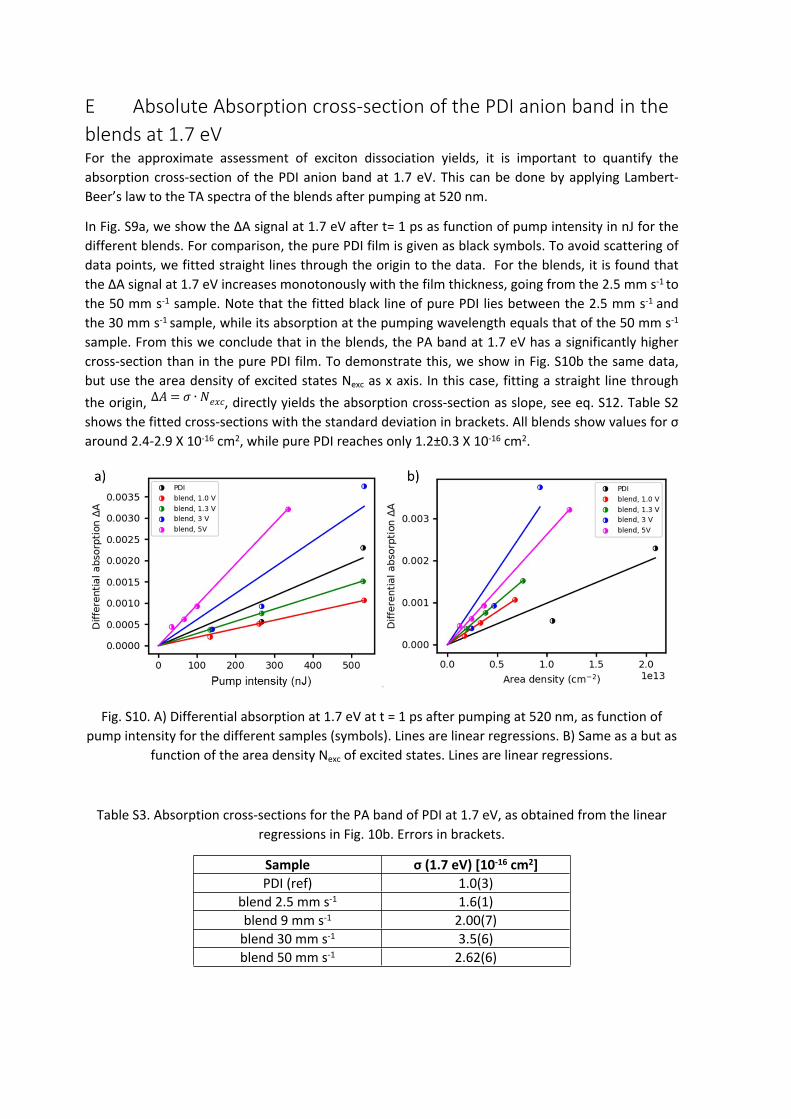
E Absolute Absorption cross-section of the PDI anion band in the blends at 1.7 eVFor the approximate assessment of exciton dissociation yields, it is important to quantify the absorption cross-section of the PDI anion band at 1.7 eV. This can be done by applying Lambert-Beer’s law to the TA spectra of the blends after pumping at 520 nm.
In Fig. S9a, we show the ΔA signal at 1.7 eV after t= 1 ps as function of pump intensity in nJ for the different blends. For comparison, the pure PDI film is given as black symbols. To avoid scattering of data points, we fitted straight lines through the origin to the data. For the blends, it is found that the ΔA signal at 1.7 eV increases monotonously with the film thickness, going from the 2.5 mm s-1 to the 50 mm s-1 sample. Note that the fitted black line of pure PDI lies between the 2.5 mm s-1 and the 30 mm s-1 sample, while its absorption at the pumping wavelength equals that of the 50 mm s-1
sample. From this we conclude that in the blends, the PA band at 1.7 eV has a significantly higher cross-section than in the pure PDI film. To demonstrate this, we show in Fig. S10b the same data, but use the area density of excited states Nexc as x axis. In this case, fitting a straight line through the origin, , directly yields the absorption cross-section as slope, see eq. S12. Table S2 ∆𝐴 = 𝜎 ∙ 𝑁𝑒𝑥𝑐
shows the fitted cross-sections with the standard deviation in brackets. All blends show values for σ around 2.4-2.9 X 10⁻¹⁶ cm2, while pure PDI reaches only 1.2±0.3 X 10⁻¹⁶ cm2.
Fig. S10. A) Differential absorption at 1.7 eV at t = 1 ps after pumping at 520 nm, as function of pump intensity for the different samples (symbols). Lines are linear regressions. B) Same as a but as
function of the area density Nexc of excited states. Lines are linear regressions.
Table S3. Absorption cross-sections for the PA band of PDI at 1.7 eV, as obtained from the linear regressions in Fig. 10b. Errors in brackets.
Sample σ (1.7 eV) [10-16 cm2]PDI (ref) 1.0(3)
blend 2.5 mm s-1 1.6(1)blend 9 mm s-1 2.00(7)
blend 30 mm s-1 3.5(6)blend 50 mm s-1 2.62(6)

F Characterization of excited states and relaxation paths in PDI:PFO filmsBefore looking at the blends, it is useful to start with the discussion of the reference PDI sample. TA spectra after pumping at 520 nm are shown in Fig. S11.
Fig. S11. TA spectra of reference PDI after pumping at 520 nm with 267 nJ.
This TA spectrum is very similar to the TA spectrum of a PDI foldamer studied by the Würthner group,8 in both spectral features and evolution, only that in the dense film the evolution occurs much faster than in the dissolved foldamers in solution. From the ground state absorption spectrum, we can conclude that the negative bands at 2.3, 2.6, and 2.8 eV are caused by transient photobleach (PB) of the (00), (01), and (02) vibronic replica of the fundamental ground state absorption. PDI is a rigid molecule with very little Stokes shift, therefore the PB(00) band at 2.3 eV is superposed with the (00) vibronic replica of stimulated emission (SE); the corresponding SE(01) and SE(02) can be seen at early times at 2.1 and 1.9 eV, respectively. Note however that there is no mirror symmetry between SE(01) and (PB(01).9 This means that at early times we do not have a pure state but a mixture of states one of which is the emissive singlet states with only little geometrical reorganization. This state is possibly superposed with an excimer state, showing photoinduced absorption (PA) around 2.0-2.1 eV.
The electronic origin of the PA band at 1.7 eV is somewhat unclear. In ref. 6, it is associated to the radical anion, while in a different foldamer,10 it is shown to belong to the neutral singlet state as evidenced by perfect mirror symmetry between SE(01) and PB(01) (see Fig 10, lower panel, of ref. [6]). A subsequent broadening and blue shift of the band at 1.7 eV was ascribed to the formation of a CT state. In contrast, in a cofacially stacked PDI dimer in solution,11 the opposite evolution was found, namely a narrowing and red shift of the band at 1.7 eV, but also ascribed to CT formation, in this case justified by the observation of bands at 1.3 and 2.15/2.26 eV, which are specific for PDI anions and cations, respectively. It seems that the position and width of the 1.7 eV band depends on minute details of geometrical and charge rearrangement and therefore should not be used to trace photoexcitation dynamics.
As Fig. S11 shows, the spectral evolution on a few picosecond time scale is characterized by a reduction of the sharp PA band at 1.7 eV, accompanied by a reduction of all SE features including
SE(00), while the PB bands not superposed with SE, namely PB(01) and PB(02), stay constant. This means that an emissive singlet state is converted into a non-emissive state. On the same time scale, we observe an absolute increase of PA around 2.0 eV. We therefore describe the early events in PDI by resonant excitation of neutral singlets that converge into excimer states on a 3 ps time scale.
In Fig. S12, we show TA spectra of the PDI:PFO blend deposited at 9 mm s-1, after pumping selectively the PFO phase at 370 nm. At early times, the TA spectra exclusively show optical probes for the excited singlet state of PFO, namely a strong PA band at 1.6 eV and the PFO bleach region from 2.7-3.5 eV; the PB peak of the β phase at 2.8 eV is probably superposed with SE. On a 10 ps time scale, we observe in Fig. S12 the formation of the PDI PB bands at 2.3 and 2.6 eV, accompanied by a loss of PB in the PFO region. In the PA region, we observe a strong reduction of the PFO singlet PA at 1.6 eV, a build-up of the PDI anion bands at 1.3, 1.5, and 1.7 eV as well as the PFO polaron band at 1.85 eV. Therefore, we conclude the formation of a charge separated state across the PDI:PFO interface, formed by the dissociation of excitons.
In order to quantify photophysical pathways, we set up a target model for a global analysis. From the overall loss of PB in the PFO region we concluded the presence of an exciton quenching process in parallel to exciton dissociation; the latter process should not change the number of excited states in the PFO phase. We therefore required the integral PB(PFO) to be the same in all evolution-associated differential spectra (EADS). The result of this first target analysis is shown in Fig. S12b. We obtain an absorption cross-section of the PA band at 1.7 eV in the second EADS of
and an exciton dissociation yield of only about 35%. This cross-section is 𝜎(1.7𝑒𝑉) = 10 ‒ 15𝑐𝑚2
however in contrast with table S2 in which the cross-section was calculated to be only about . We have therefore to conclude that we are underestimating the concentration of the 3 ∙ 10 ‒ 16𝑐𝑚2
charge separated states in Fig. S11a by about a factor of 3. In our second target analysis we therefore set the dissociation yield to 100% and allowed the integral PFO PB to change from one EADS to another. This second target analysis yielded the same perfect fits as the previous one and yielded , in perfect agreement with table S3. 𝜎(1.7 𝑒𝑉) = 3 ∙ 10 ‒ 16𝑐𝑚2
What is the reason for the reduction of the photobleach in PFO if the number of excitations in the PFO phase is constant? We distinguish two contributions. First, due to polarization effects, the charged state is expected to have a shorter correlation length and therefore each charged state on the PFO chain contributes less to the overall PB than the strongly delocalized excitons. Second, a part of the PFO excitons could have formed excimers in the PDI phase. If energy transfer instead of charge transfer occurs, effectively a loss of PB in the donor phase is expected. Moreover, the spectra of electrochemically generated PDI anions, (ref 12, Figure 4) consist of sharp and fully separated absorption bands at 1.3,1.5, and 1.7 eV; in the second EADS of Fig. S12c these bands seem to reside on top of a broad background PA which could be due to excimers. Finally, we note that PDI excimer emission is clearly observed in all blends. We have so far not been able to find the species-associated differential spectra (SADS) of the isolated excimer without any contribution from charged states. For this reason, we and others have so far not managed to quantify the excimer yields.

Fig. S12a. TA spectra of PDI:PFO 9 mm s-1, pumped at 370 nm (symbols). Lines are global fits according to a target model discussed in the text.
Fig. S12b. EADS of target analysis of Fig. S12a for all measured pump intensities, assuming an exciton quenching process in parallel with exciton dissociation and requiring same bleach of PFO.

Fig. S12c. EADS of target analysis of Fig. S12a for all measured pump intensities, assuming exciton dissociation with unity efficiency and allowing the PFO bleach to change.
Fig. S13 shows TA spectra of the PDI:PFO blend at 9 mm s-1 after pumping at 520 nm. The striking feature is the immediate presence of all PA bands of the PDI anion; the presence of the PDI cation can not be assessed due to their spectral vicinity with the pump pulse. In the early spectra, no PFO related feature can be observed. Therefore we must assume the ultrafast formation of a symmetry breaking CT state as has been described in the cofacial dimer of ref 9.
Fig. S13. Left: TA spectra of the PDI:PFO sample prepared at 30 mm s-1, after pumping at 520 nm. Right: target analysis following a sequential model
Typically, in cofacial homo-dimers, charge transfer contributions to the first excited states are strong but symmetric so that the resulting CT state has no permanent dipole moment. In the case of ref. 9, the symmetry breaking is caused by polar solvent molecules, able to stabilize a charge separated state with a permanent dipole moment. The question is how symmetry breaking can be caused in the PDI phase of our PDI:PFO blends but not (or only very weakly) in the reference PDI film. Obviously the presence of the PFO segments can also stabilize a charge separated state. The point is however that PFO does not carry any photoexcitations on the subpicosecond time scale; hole transfer to PFO occurs in the early picosecond time domain. We conjecture therefore that the

presence of the PFO chains, by virtue of their polarizability, influences the largely delocalized crystal states in PDI, promoting a symmetry breaking charge transfer within the PDI moiety.
As shown in Fig. S13, hole transfer from PDI to PFO occurs within 3 picoseconds, as evidenced by the growth of the PFO polaron PA at 1.85 eV and the PFO PB at 3.1 eV with the same kinetics, see target analysis in Fig. S13, right. Note that virtually no oscillator strength is lost in our spectral observation window; the charge transfer seems to create oscillator strength out of nothing. This fact clearly shows that the mechanism is indeed a hole transfer from PDI towards PFO. If the mechanism were dissociation of excimers, then the transfer should be accompanied by a loss of broad background PA and a growth of the sharp PDI anion features at 1.3 and 1.5 eV, which is not observed. Note that the PDI cationic bands, that are expected to disappear following hole transfer towards PFO, are situated in the region of strong scattering of the pump pulse, so this additional confirmation of our mechanism cannot be obtained.
Scheme S1 summarizes our findings. After excitation at 370 nm, the resulting PFO excitons are so large that virtually no diffusion is needed towards the PDI:PFO interface. The presence of PDI disturbs the structure, so that in the interfacial region the PFO chains do not exhibit β phase behavior. Due to being incommensurate with the underlying PDI crystal structure, the PFO excited state wavefunctions are strongly disturbed and localized. This causes much lower cross-sections of the excited states residing in the mixed phase compared to the pure PFO; it also causes additional GIWAXS resonances. Energy transfer into this mixed phase is therefore the rate limiting step, followed by ultrafast electron transfer into the PDI phase. This scenario explains the fast first order reaction of only 5-7 ps lifetime. Exciting at 520 nm, we create neutral excited states in the PDI bulk. Due to the polarizability effects of the nearby PFO chains, a symmetry breaking CT state is formed within 400 fs. Hole transfer across the interface into the PFO chains occurs on a 5 ps time scale.
G Femtosecond delayed charge separation in the intercalated PDI:PFO phaseIn the main manuscript (fig. 5b), we demonstrate that when pumping directly the intercalated phase of PDI:PFO, a symmetry breaking charge transfer is induced on a subpicosecond time scale. Here we present a detailed analysis of ultrafast spectral evolution.
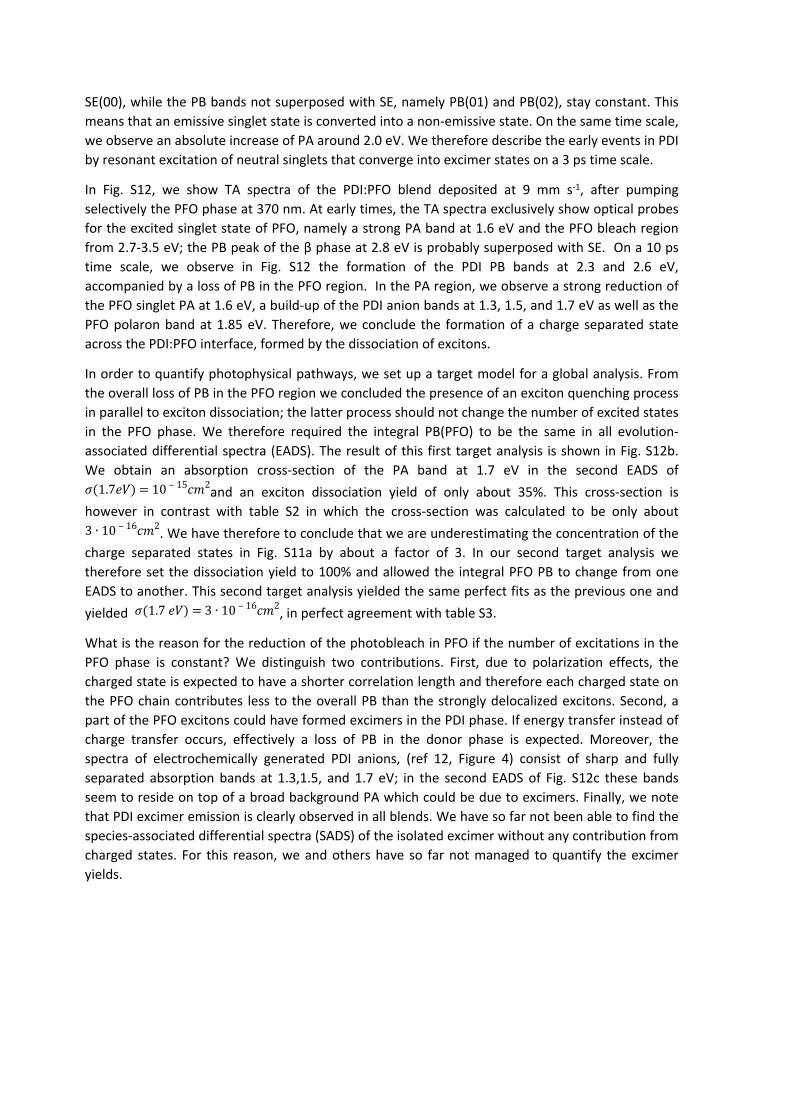
In Fig. S14, we show early transient absorption spectra for pumping at 520 nm, for the PDI:PFO blend produced at 50 mm s-1 blade speed (this blade speed was chosen to match that for pure PDI). The main PA band at 1.7 eV develops to maximum signal within 0.5 ps. The sharp bands at 1.3 and 1.5 eV, associated with PDI anions, also develop during the pump pulse; speaking either for resonant creation of charge separated states or for an exciton dissociation rate on the order of the instrumental time resolution (about 200 fs). However, the TA spectra at -0.4 and -0.2 ps seem to suggest that the evolution of the PA band at 1.5 is slightly lagging behind the build-up of the main PA band at 1.7 eV. To exclude that this delayed rise of the band at 1.5 eV might be caused by an incorrect removal of the chirp of the probe pulse, we chose the following approach: in Fig. S13b, we compare a normalized TA transient at 1.7 eV to the average of the normalized TA transients at 1.46 and 1.56 eV (black and red curves, respectively). Their perfect congruence shows that chirp removal in the probe energy range from 1.46 up to 1.7 eV is better than 100 fs. Subtracting the red curve, representative of the broad background PA, from the TA dynamics at 1.5 eV, we obtain the green curve in Fig. S14b, showing a clear delay of about 400 fs against the black and red curves. A similar behavior was found for the other blade speeds (data not shown). We therefore conjecture that
charge separation in PDI:PFO blends does not occur by resonant excitation but in a sequential step after resonant creation of neutral excitons, with an approximate time constant of 400 fs.
Fig. S14. A) Transient absorption (TA) spectra of PDI:PFO, deposited at 50 mm s-1, at an early time scale after pumping at 520 nm. Numbers in inset: pump-probe delay in ps. B) Normalized TA dynamics at a probe energy of 1.7 eV (black), average of TA dynamics at 1.46 and 1.56 eV to demonstrate correctness of deployed de-chirping algorithm (red) and TA dynamics at 1.5 eV with red curve subtracted (green).
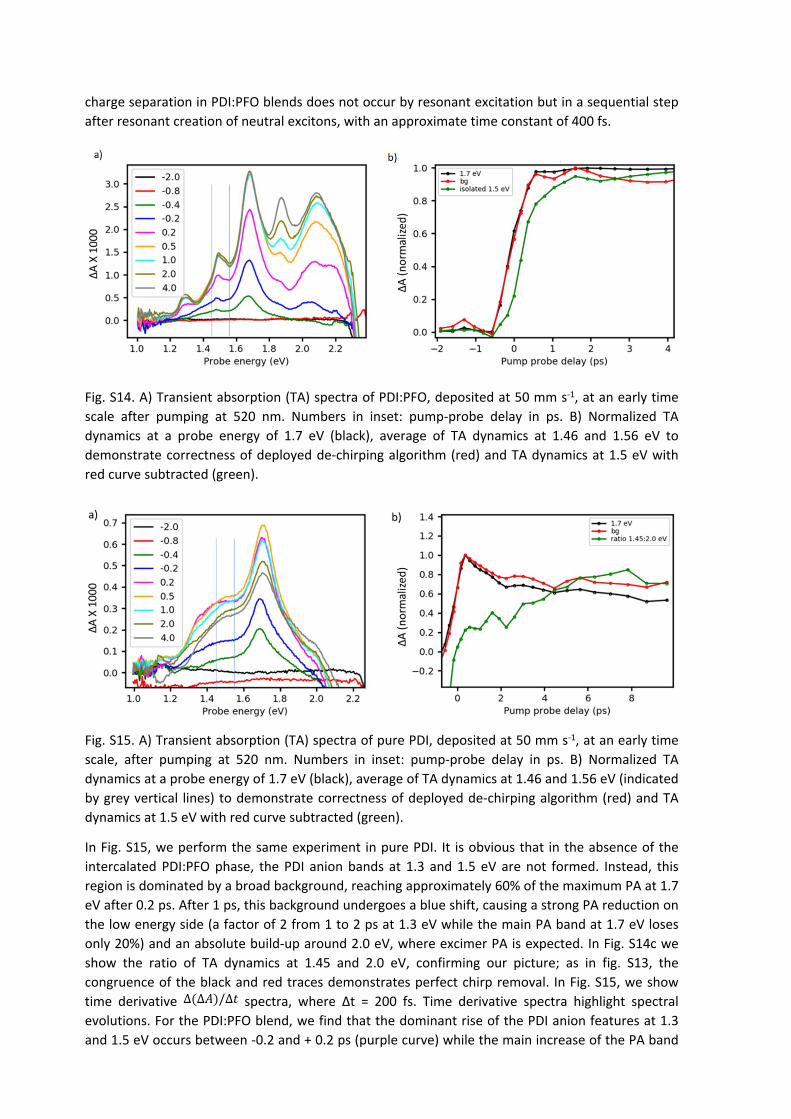
Fig. S15. A) Transient absorption (TA) spectra of pure PDI, deposited at 50 mm s-1, at an early time scale, after pumping at 520 nm. Numbers in inset: pump-probe delay in ps. B) Normalized TA dynamics at a probe energy of 1.7 eV (black), average of TA dynamics at 1.46 and 1.56 eV (indicated by grey vertical lines) to demonstrate correctness of deployed de-chirping algorithm (red) and TA dynamics at 1.5 eV with red curve subtracted (green).
In Fig. S15, we perform the same experiment in pure PDI. It is obvious that in the absence of the intercalated PDI:PFO phase, the PDI anion bands at 1.3 and 1.5 eV are not formed. Instead, this region is dominated by a broad background, reaching approximately 60% of the maximum PA at 1.7 eV after 0.2 ps. After 1 ps, this background undergoes a blue shift, causing a strong PA reduction on the low energy side (a factor of 2 from 1 to 2 ps at 1.3 eV while the main PA band at 1.7 eV loses only 20%) and an absolute build-up around 2.0 eV, where excimer PA is expected. In Fig. S14c we show the ratio of TA dynamics at 1.45 and 2.0 eV, confirming our picture; as in fig. S13, the congruence of the black and red traces demonstrates perfect chirp removal. In Fig. S15, we show time derivative spectra, where Δt = 200 fs. Time derivative spectra highlight spectral ∆(∆𝐴)/∆𝑡
evolutions. For the PDI:PFO blend, we find that the dominant rise of the PDI anion features at 1.3 and 1.5 eV occurs between -0.2 and + 0.2 ps (purple curve) while the main increase of the PA band

at 1.7 eV occurs between -0.4 and -0.2 eV, confirming the evaluation in Fig. S13b. In pure PDI, the anion bands at 1.3 and 1.5 eV do not occur even in the time derivative spectra.
Fig. S16. Time differential TA spectra obtained by subtracting from each spectrum in Fig. S15A and S14A, the temporally preceding TA spectrum (panel a and b, respectively).
Based on these findings, we propose a qualitative alignment of potential energy surfaces for neutral and charged excited states in PDI bulk and PDI:PFO. Upon excitation at 520 nm, a PDI* excited state is formed that stabilizes into an excimer. Formation of a charge separated state (C.S.) is governed by Marcus theory. In the absence of a polarizable medium, the equilibrium is on the excimer site. If electron accepting PFO chain is nearby, then the C.S. state is stabilized strongly enough so that it is formed within 400 fs. Due to weak electronic coupling between PDI and the PFO backbone, standing perpendicular to one another, the hole transfer towards PFO occurs within picoseconds.
Scheme S1: proposed photophysical model for ultrafast symmetry breaking charge transfer in a PDI in bulk and in the intercalated PDI:PFO phase. Dashed lines: weak coupling between the respective potential surfaces. In the top part, graphical representations are given for various points along the
trajectory (rectangles: PDI; elipses. PFO backbone; wavy lines: PFO side chains)
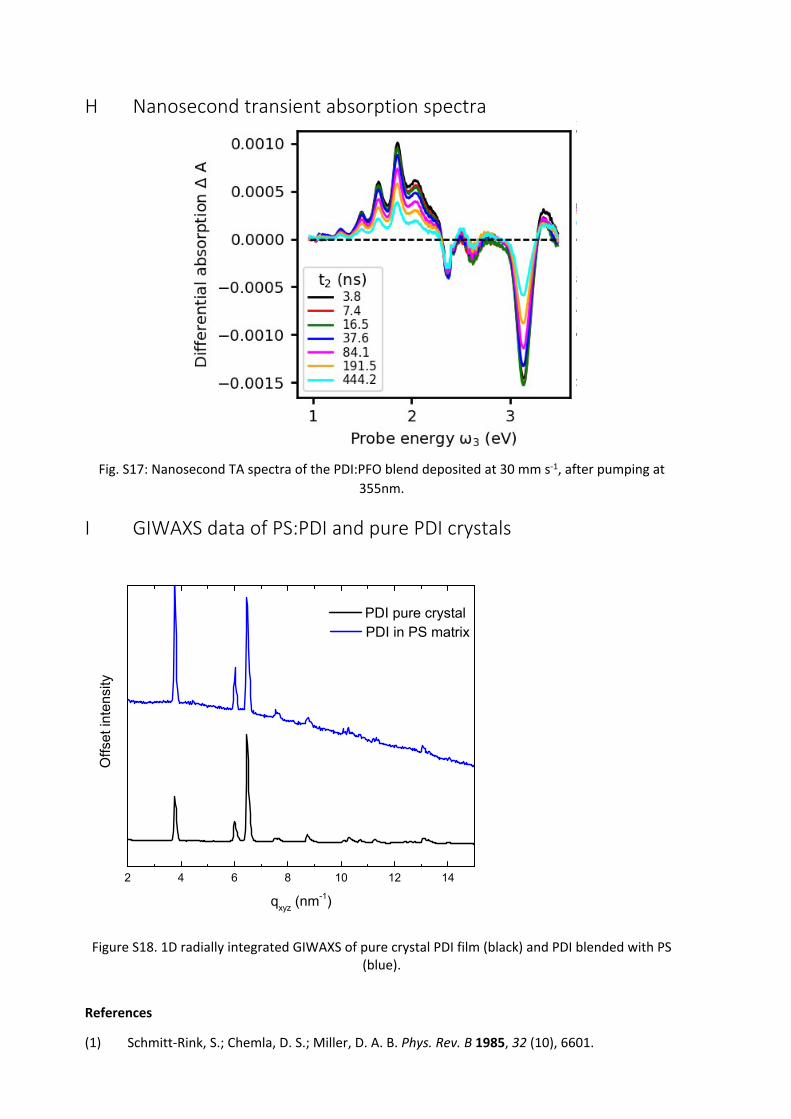
H Nanosecond transient absorption spectra
Fig. S17: Nanosecond TA spectra of the PDI:PFO blend deposited at 30 mm s-1, after pumping at 355nm.
I GIWAXS data of PS:PDI and pure PDI crystals
2 4 6 8 10 12 14
Offs
et in
tens
ity
qxyz (nm-1)
PDI pure crystal PDI in PS matrix
Figure S18. 1D radially integrated GIWAXS of pure crystal PDI film (black) and PDI blended with PS (blue).
References
(1) Schmitt-Rink, S.; Chemla, D. S.; Miller, D. A. B. Phys. Rev. B 1985, 32 (10), 6601.
(2) Lüer, L.; Hoseinkhani, S.; Polli, D.; Crochet, J.; Hertel, T.; Lanzani, G. Nat. Phys. 2009, 5 (1), 54.
(3) van Burgel, M.; Wiersma, D. A.; Duppen, K. J. Chem. Phys. 1995, 102 (1), 20–33.
(4) Khan, A. L. T.; Sreearunothai, P.; Herz, L. M.; Banach, M. J.; Köhler, A. Phys. Rev. B 2004, 69 (8), 85201.
(5) Perevedentsev, A.; Chander, N.; Kim, J.; Bradley, D. D. C. J. Polym. Sci. Part B Polym. Phys. 2016, 54 (19), 1995–2006.
(6) Shaw, P. E.; Ruseckas, A.; Peet, J.; Bazan, G. C.; Samuel, I. D. W. Adv. Funct. Mater. 2010, 20 (1), 155–161.
(7) Gösele, U. M. ChemInform 1985, 16 (2).
(8) Fimmel, B.; Son, M.; Sung, Y. M.; Grüne, M.; Engels, B.; Kim, D.; Würthner, F. Chem. Eur. J. 2015, 21 (2), 615–630.
(9) Vân Anh, N.; Schlosser, F.; Groeneveld, M. M.; Van Stokkum, I. H. M.; Würthner, F.; Williams, R. M. J. Phys. Chem. C 2009, 113 (42), 18358–18368.
(10) Hippius, C.; van Stokkum, I. H. M.; Zangrando, E.; Williams, R. M.; Wykes, M.; Beljonne, D.; Würthner, F. J. Phys. Chem. C 2008, 112 (37), 14626–14638.
(11) Sung, J.; Nowak-Król, A.; Schlosser, F.; Fimmel, B.; Kim, W.; Kim, D.; Würthner, F. J. Am. Chem. Soc. 2016, 138 (29), 9029–9032.
(12) Hippius, C.; van Stokkum, I. H. M.; Zangrando, E.; Williams, R. M.; Würthner, F. J. Phys. Chem. C 2007, 111 (37), 13988–13996.