Pollution Probe August 2, 2006 Profitably Reducing CO 2 by Recycling Energy
27
Pollution Probe August 2, 2006 Profitably Reducing CO 2 by Recycling Energy Some ‘Convenient Truths’ Thomas R. Casten Chairman & CEO Primary Energy, LLC
-
Upload
wyatt-garner -
Category
Documents
-
view
24 -
download
0
description
Pollution Probe August 2, 2006 Profitably Reducing CO 2 by Recycling Energy Some ‘ Convenient Truths ’ Thomas R. Casten Chairman & CEO Primary Energy, LLC. Presentation Summary. Ontario can profitably eliminate coal fired generation with unconventional, innovative governance - PowerPoint PPT Presentation
Transcript of Pollution Probe August 2, 2006 Profitably Reducing CO 2 by Recycling Energy
Pollution ProbeAugust 2, 2006
Profitably Reducing CO2 by Recycling Energy
Some ‘Convenient Truths’
Thomas R. Casten
Chairman & CEOPrimary Energy, LLC
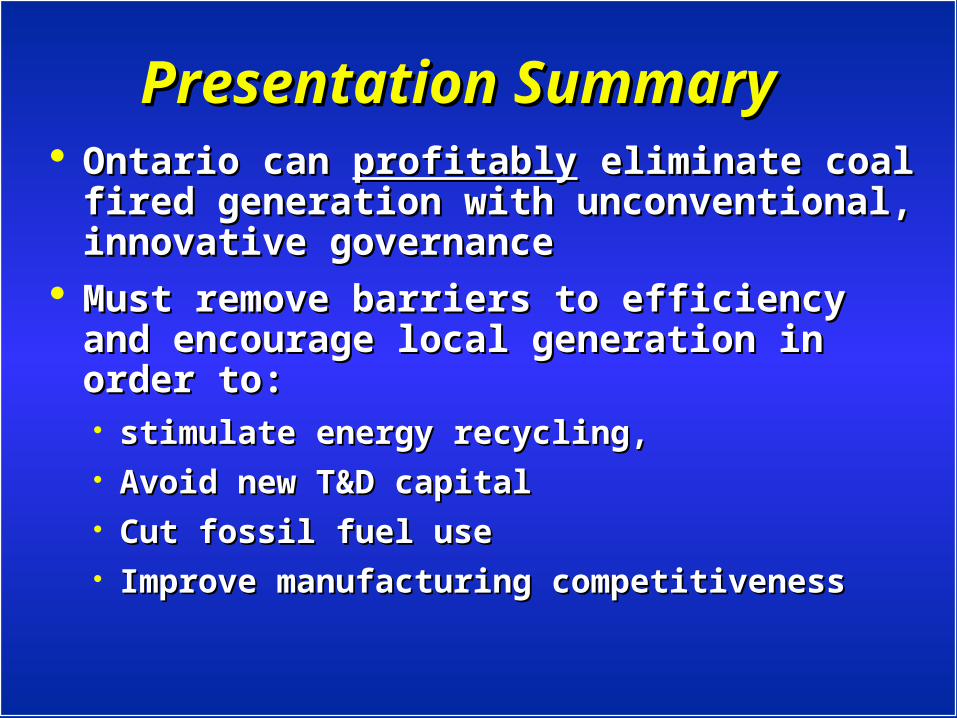
Presentation SummaryPresentation Summary Ontario can Ontario can profitablyprofitably eliminate coal eliminate coal
fired generation with unconventional, fired generation with unconventional, innovative governanceinnovative governance
Must remove barriers to efficiency and Must remove barriers to efficiency and encourage local generation in order to:encourage local generation in order to: stimulate energy recycling, stimulate energy recycling, Avoid new T&D capitalAvoid new T&D capital Cut fossil fuel useCut fossil fuel use Improve manufacturing competitivenessImprove manufacturing competitiveness
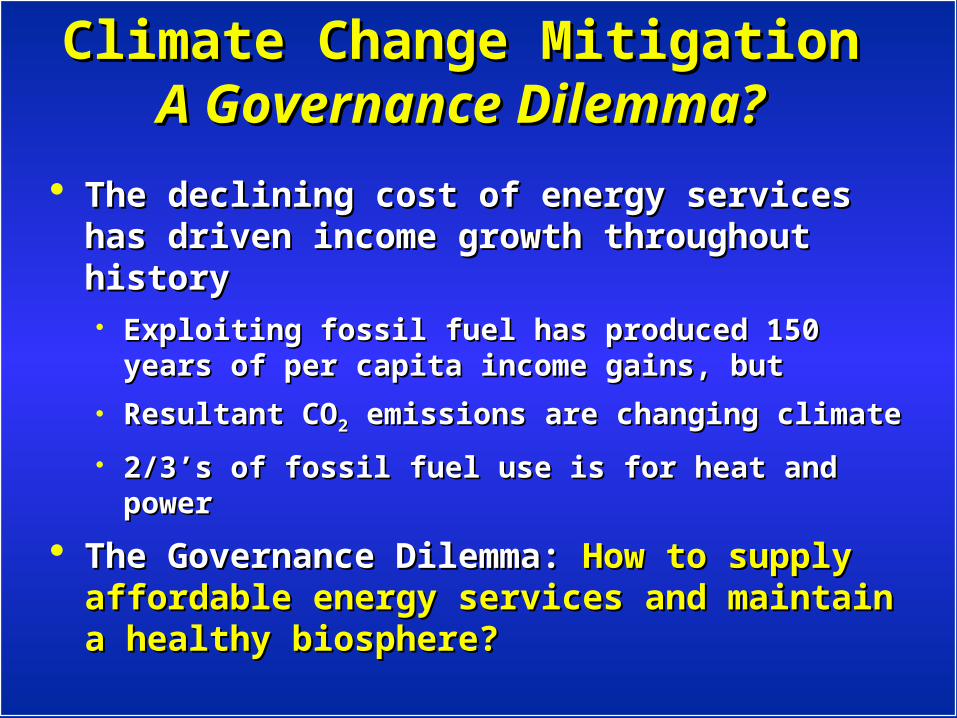
Climate Change MitigationClimate Change MitigationA Governance Dilemma?A Governance Dilemma?
The declining cost of energy services has The declining cost of energy services has driven income growth throughout history driven income growth throughout history
Exploiting fossil fuel has produced 150 years of per Exploiting fossil fuel has produced 150 years of per capita income gains, butcapita income gains, but
Resultant COResultant CO22 emissions are changing climate emissions are changing climate
2/3’s of fossil fuel use is for heat and power2/3’s of fossil fuel use is for heat and power
The Governance Dilemma:The Governance Dilemma: How to supply How to supply affordable energy services and maintain a affordable energy services and maintain a healthy biosphere?healthy biosphere?
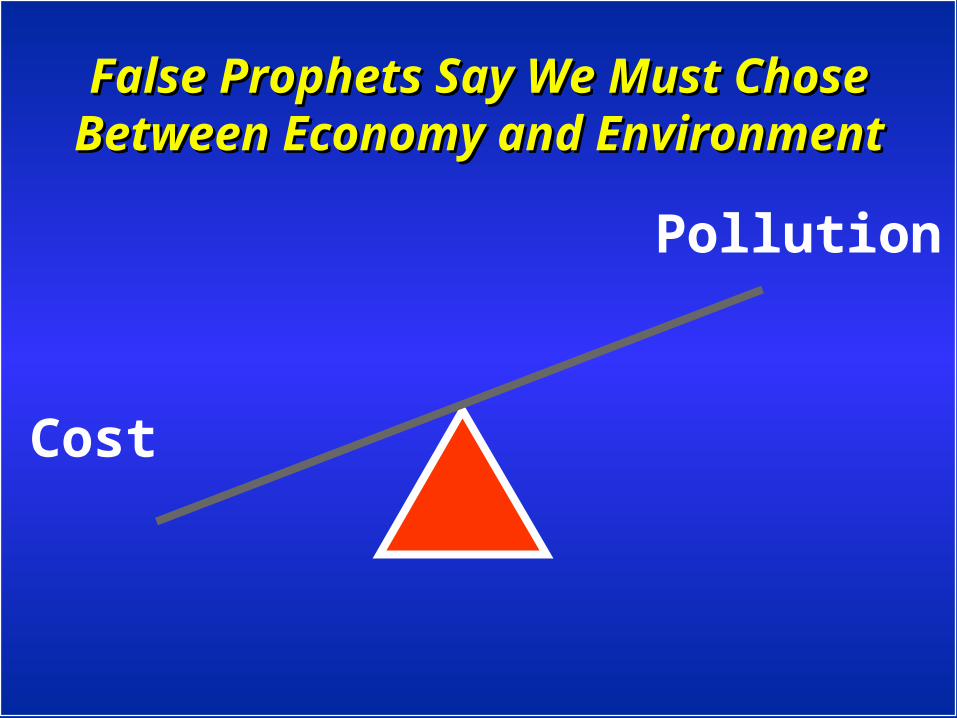
Cost
Pollution
False Prophets Say We Must Chose False Prophets Say We Must Chose Between Economy and EnvironmentBetween Economy and Environment
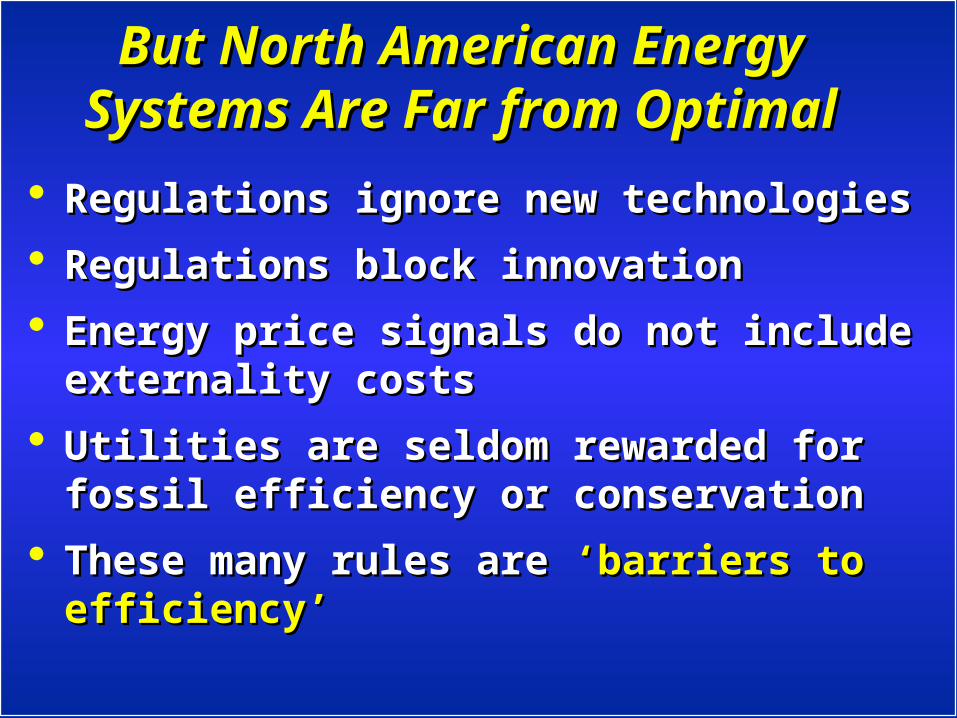
But North American Energy But North American Energy Systems Are Far from OptimalSystems Are Far from Optimal
Regulations ignore new technologies Regulations ignore new technologies
Regulations block innovationRegulations block innovation
Energy price signals do not include Energy price signals do not include externality costsexternality costs
Utilities are seldom rewarded for fossil Utilities are seldom rewarded for fossil efficiency or conservationefficiency or conservation
These many rules are These many rules are ‘barriers to ‘barriers to efficiency’efficiency’
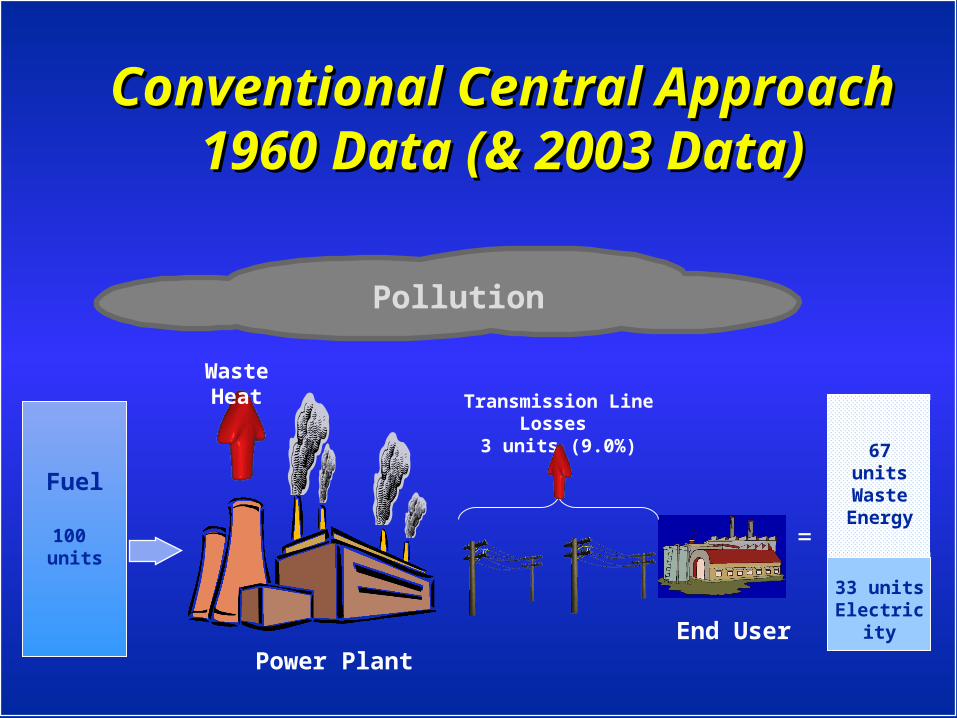
Conventional Central ApproachConventional Central Approach1960 Data (& 2003 Data)1960 Data (& 2003 Data)
Pollution
Fuel
100 units
Power Plant
=
67 units Waste Energy
33 units Electricity
End User
Waste HeatTransmission Line Losses
3 units (9.0%)
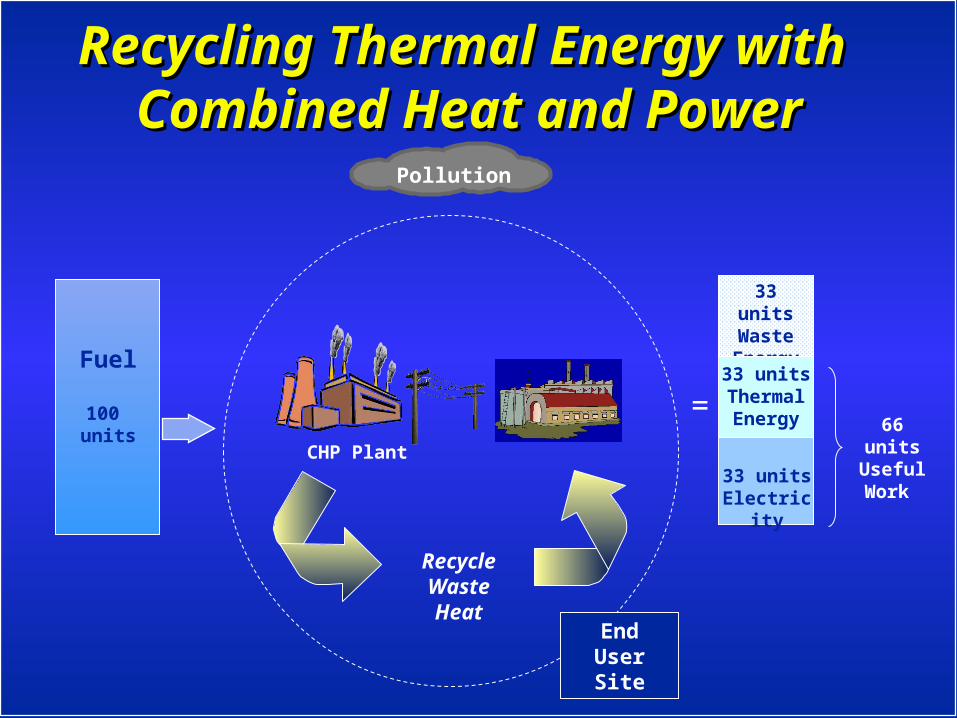
Recycling Thermal Energy with Recycling Thermal Energy with Combined Heat and PowerCombined Heat and Power
Pollution
Recycle Waste Heat
CHP Plant
End User Site
33 units Waste Energy
=66 units Useful Work 33 units
Electricity
33 units Thermal Energy
Fuel
100 units
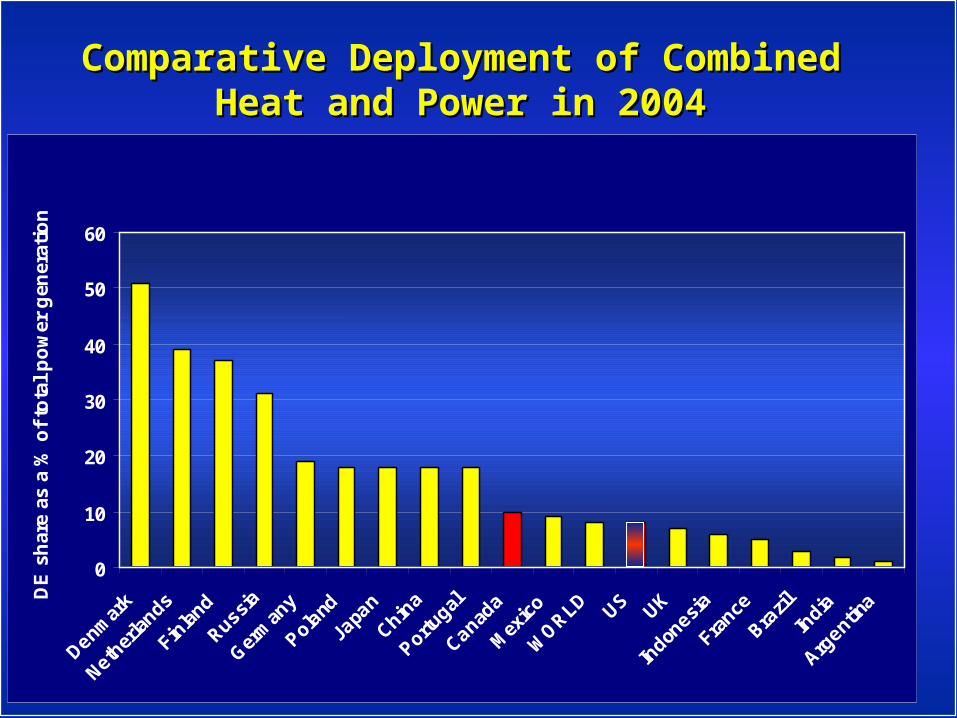
Comparative Deployment of Combined Heat Comparative Deployment of Combined Heat and Power in 2004and Power in 2004
0
10
20
30
40
50
60
Denmar
k
Nether
lands
Finlan
d
Russia
Germ
any
Poland
Japa
n
China
Portugal
Canada
Mex
ico
WORLD US UK
Indon
esia
France
Brazil
India
Argentin
aDE
sh
are
as a
% o
f to
tal
po
wer
gen
erat
ion
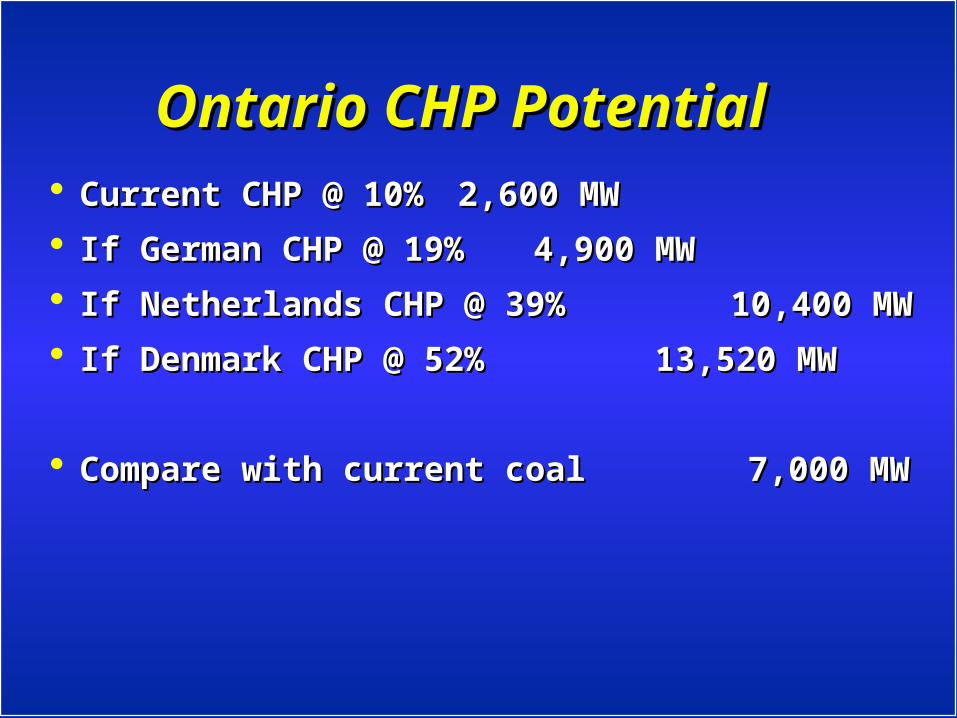
Ontario CHP PotentialOntario CHP Potential Current CHP @ 10%Current CHP @ 10% 2,600 MW2,600 MW
If German CHP @ 19% If German CHP @ 19% 4,900 MW4,900 MW
If Netherlands CHP @ 39%If Netherlands CHP @ 39% 10,400 MW 10,400 MW
If Denmark CHP @ 52%If Denmark CHP @ 52% 13,520 MW 13,520 MW
Compare with current coal 7,000 MWCompare with current coal 7,000 MW
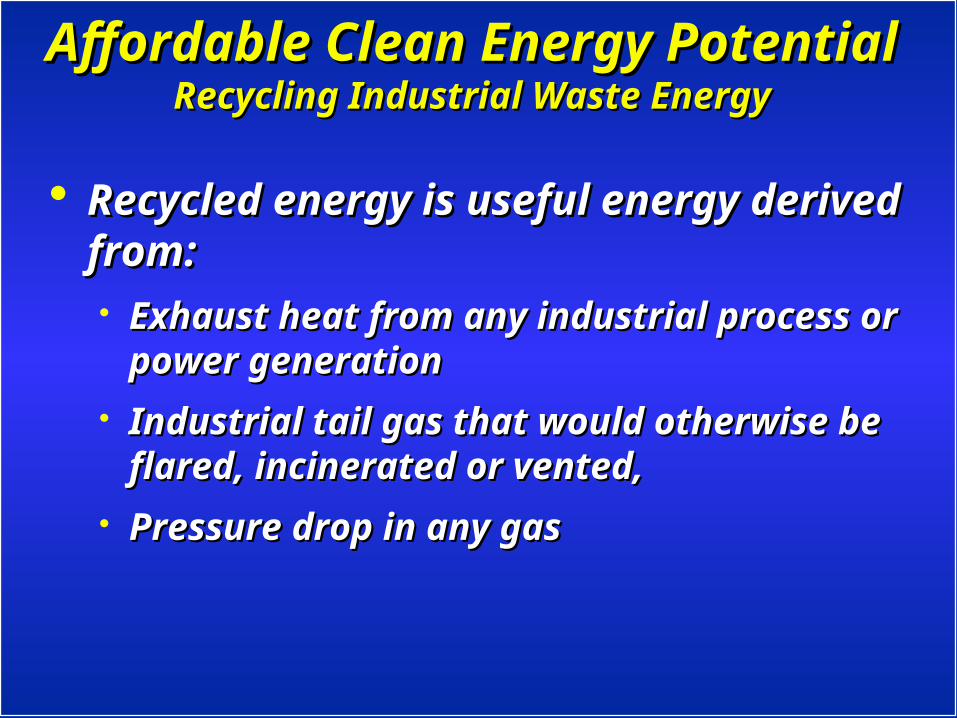
Affordable Clean Energy PotentialAffordable Clean Energy PotentialRecycling Industrial Waste EnergyRecycling Industrial Waste Energy
Recycled energy is useful energy Recycled energy is useful energy derived from:derived from: Exhaust heat from any industrial process or Exhaust heat from any industrial process or
power generation power generation Industrial tail gas that would otherwise be Industrial tail gas that would otherwise be
flared, incinerated or vented, flared, incinerated or vented, Pressure drop in any gas Pressure drop in any gas
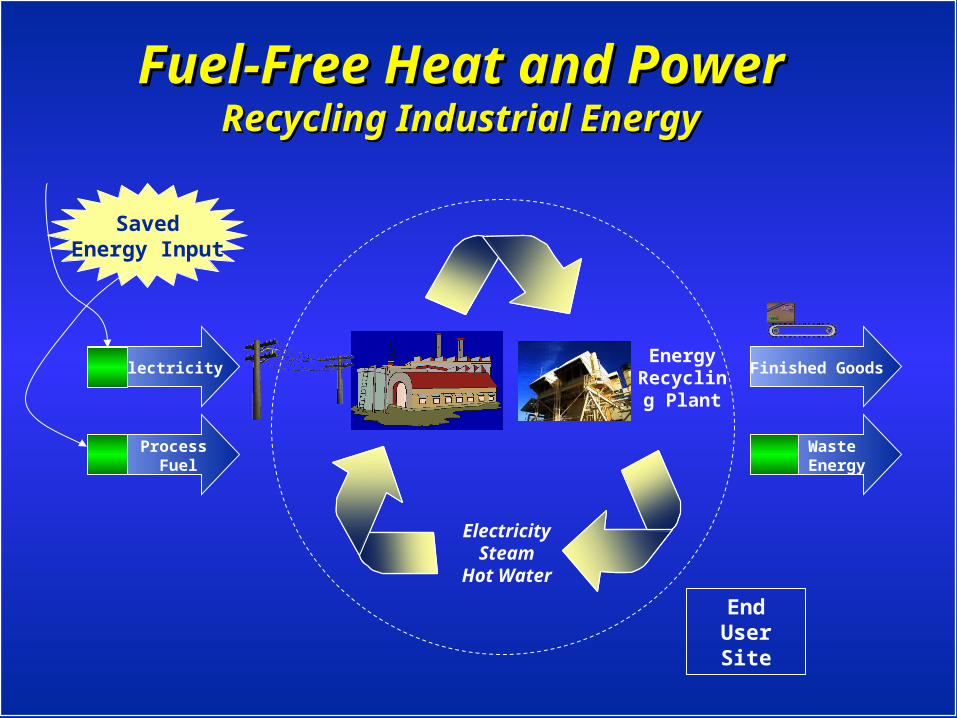
Fuel-Free Heat and Power Fuel-Free Heat and Power Recycling Industrial EnergyRecycling Industrial Energy
ElectricitySteam
Hot Water
End User Site
Energy Recycling
Plant
Electricity
Process Fuel
Finished Goods
Waste Energy
SavedEnergy Input
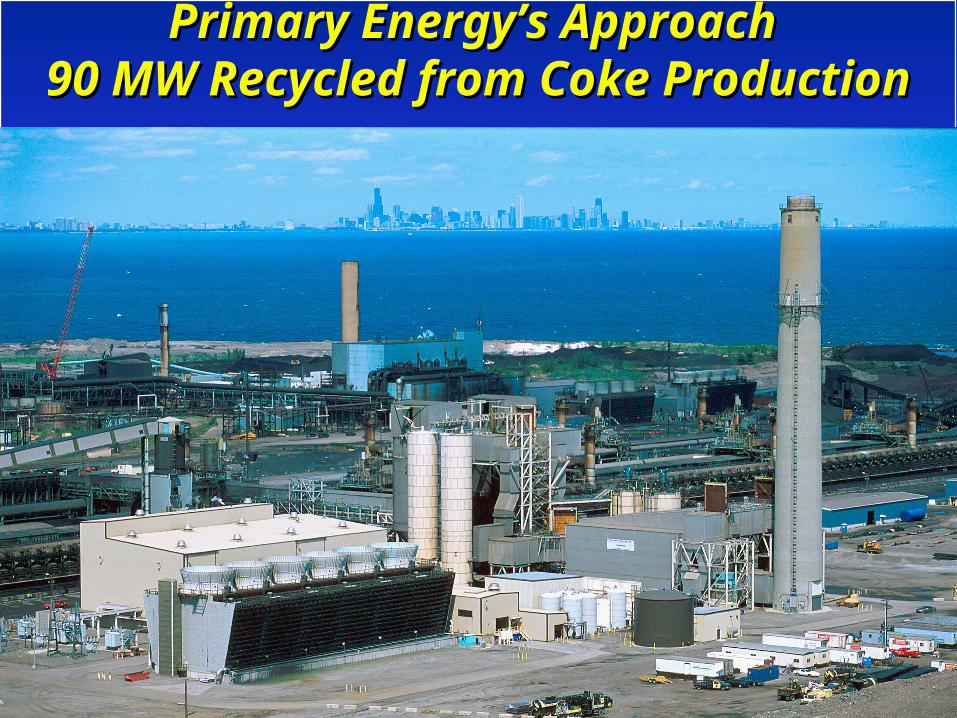
Primary Energy’s Approach Primary Energy’s Approach 90 MW Recycled from Coke Production90 MW Recycled from Coke Production
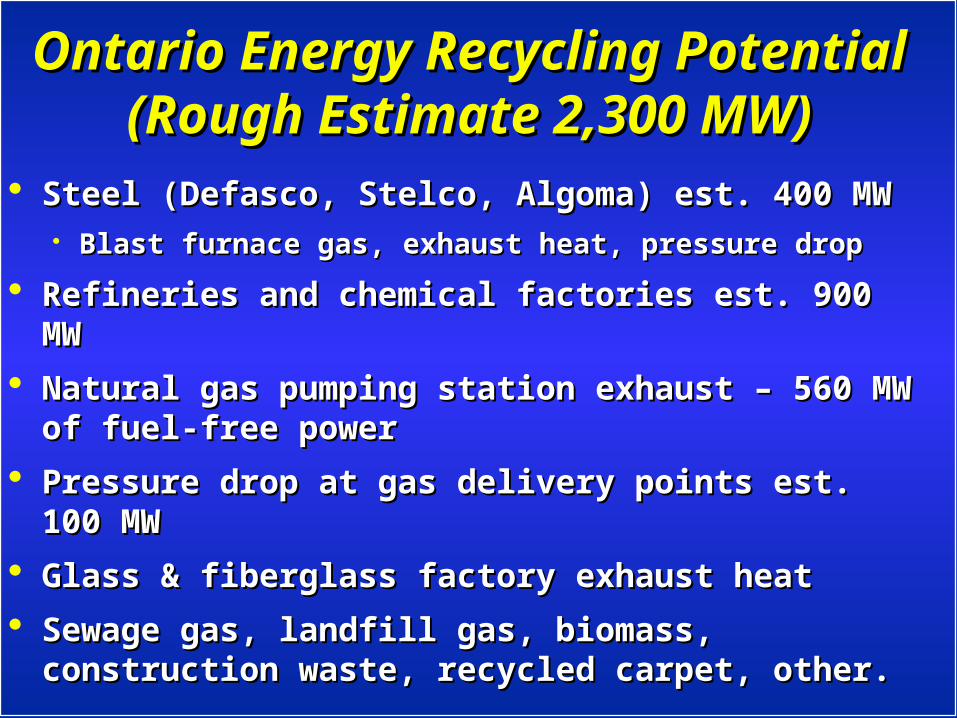
Ontario Energy Recycling PotentialOntario Energy Recycling Potential(Rough Estimate 2,300 MW)(Rough Estimate 2,300 MW)
Steel (Defasco, Stelco, Algoma) est. 400 MWSteel (Defasco, Stelco, Algoma) est. 400 MW Blast furnace gas, exhaust heat, pressure dropBlast furnace gas, exhaust heat, pressure drop
Refineries and chemical factories est. 900 MWRefineries and chemical factories est. 900 MW
Natural gas pumping station exhaust – 560 MW Natural gas pumping station exhaust – 560 MW of fuel-free powerof fuel-free power
Pressure drop at gas delivery points est. 100 MWPressure drop at gas delivery points est. 100 MW
Glass & fiberglass factory exhaust heatGlass & fiberglass factory exhaust heat
Sewage gas, landfill gas, biomass, construction Sewage gas, landfill gas, biomass, construction waste, recycled carpet, other.waste, recycled carpet, other.
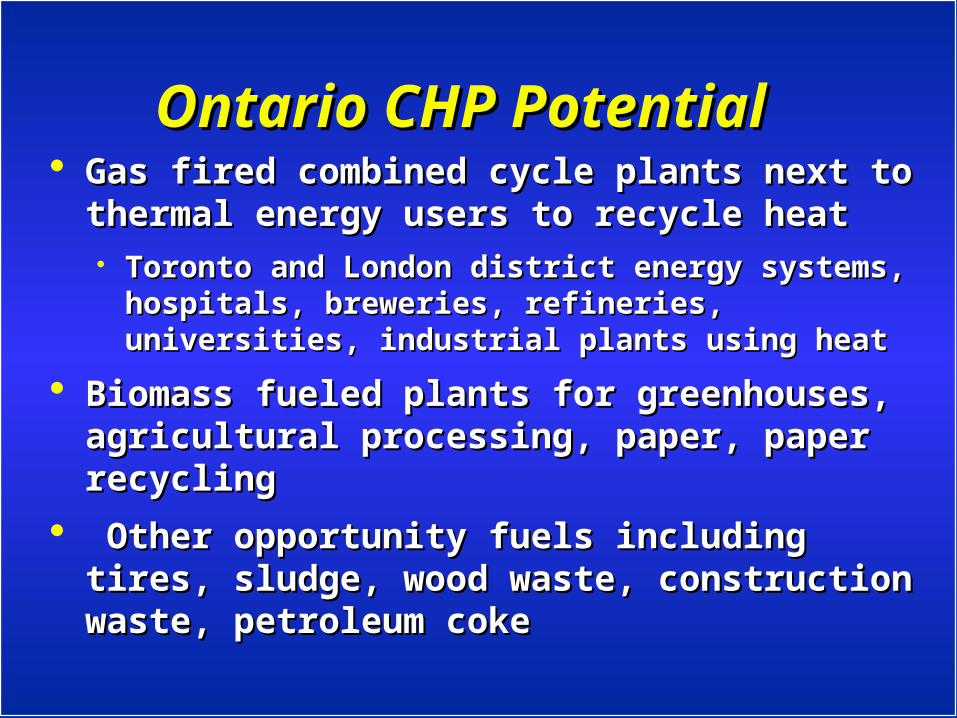
Ontario CHP PotentialOntario CHP Potential Gas fired combined cycle plants next to Gas fired combined cycle plants next to
thermal energy users to recycle heatthermal energy users to recycle heat Toronto and London district energy systems, Toronto and London district energy systems,
hospitals, breweries, refineries, universities, hospitals, breweries, refineries, universities, industrial plants using heatindustrial plants using heat
Biomass fueled plants for greenhouses, Biomass fueled plants for greenhouses, agricultural processing, paper, paper agricultural processing, paper, paper recyclingrecycling
Other opportunity fuels including tires, Other opportunity fuels including tires, sludge, wood waste, construction waste, sludge, wood waste, construction waste, petroleum cokepetroleum coke
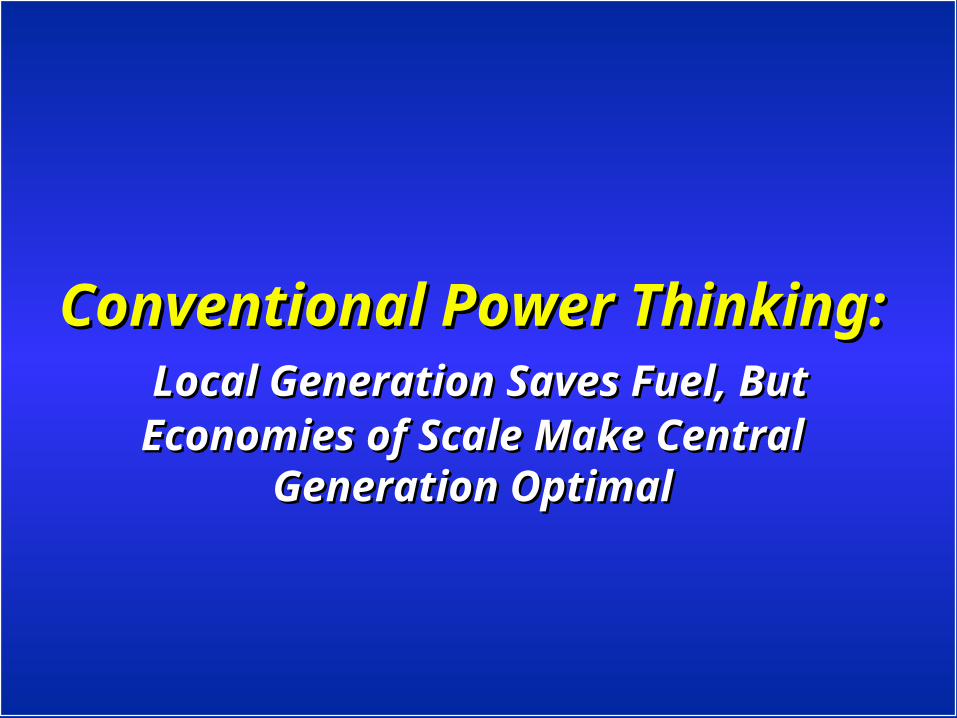
Conventional Power Thinking:Conventional Power Thinking: Local Generation Saves Fuel, But Local Generation Saves Fuel, But Economies of Scale Make Central Economies of Scale Make Central
Generation OptimalGeneration Optimal
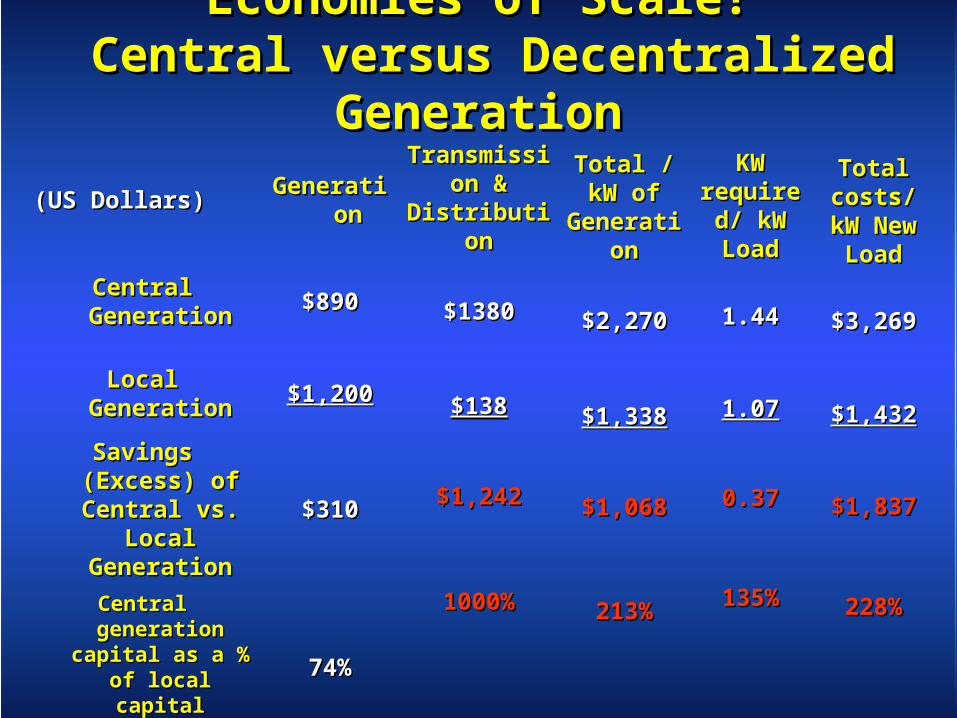
Economies of Scale?Economies of Scale? Central versus Decentralized Generation Central versus Decentralized Generation
Transmission Transmission & Distribution& Distribution
$1380$1380
$138$138
$1,242$1,242
1000%1000%
(US Dollars)(US Dollars) GenerationGeneration
Central GenerationCentral Generation $890$890
Local GenerationLocal Generation $1,200$1,200
Savings (Excess) of Savings (Excess) of Central vs. Local Central vs. Local
GenerationGeneration$310$310
Central generation Central generation capital as a % of capital as a % of
local capitallocal capital 74%74%
Total / kW Total / kW of of
GenerationGeneration
$2,270$2,270
$1,338$1,338
$1,068$1,068
213%213%
KW KW required/ required/ kW LoadkW Load
1.441.44
1.071.07
0.370.37
135%135%
Total Total costs/ kW costs/ kW New LoadNew Load
$3,269$3,269
$1,432$1,432
$1,837$1,837
228%228%
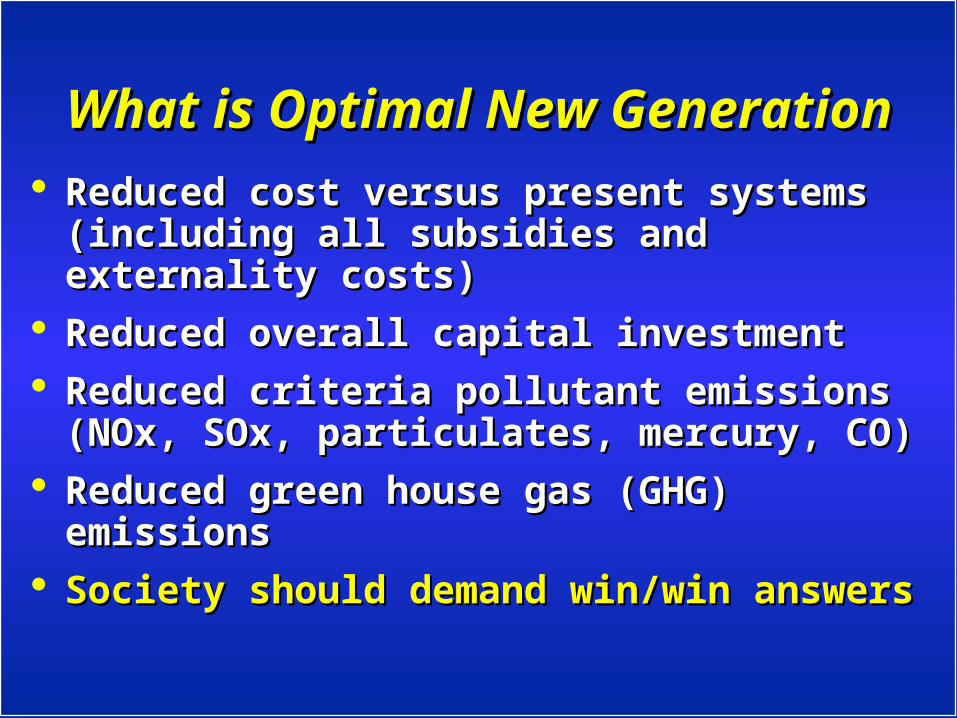
What is Optimal New GenerationWhat is Optimal New Generation
Reduced cost versus present systems Reduced cost versus present systems (including all subsidies and externality (including all subsidies and externality costs)costs)
Reduced overall capital investmentReduced overall capital investment Reduced criteria pollutant emissions Reduced criteria pollutant emissions
(NOx, SOx, particulates, mercury, CO)(NOx, SOx, particulates, mercury, CO) Reduced green house gas (GHG) Reduced green house gas (GHG)
emissionsemissions Society should demand win/win answersSociety should demand win/win answers
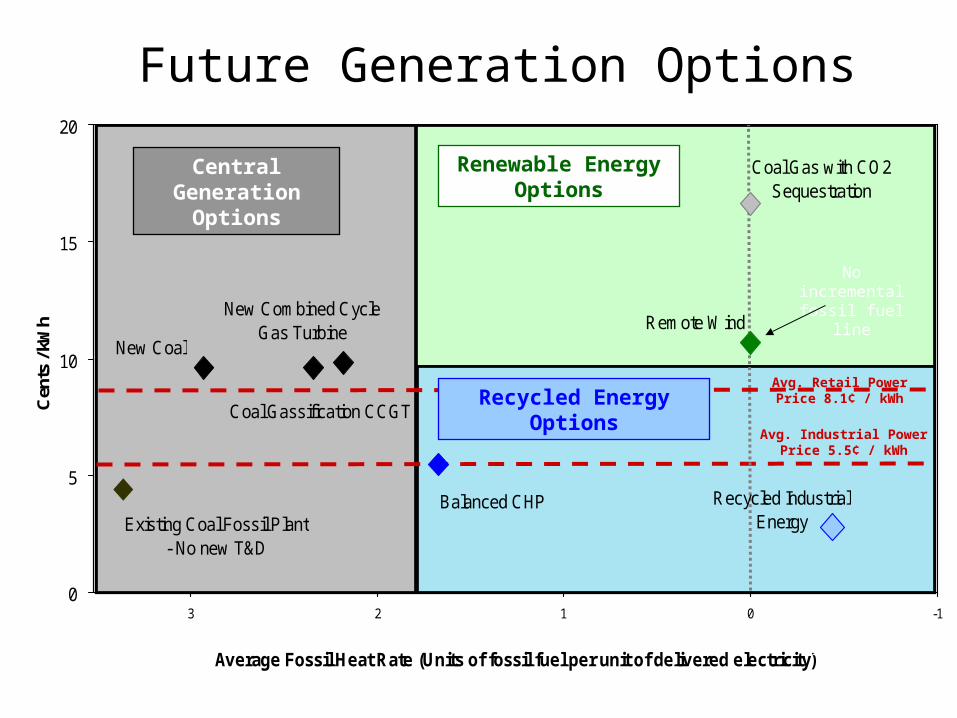
Future Generation Options
Existing Coal Fossil Plant - No new T&D
New Coal
New Combined Cycle Gas Turbine
Coal Gassification CCGT
Remote Wind
Coal Gas with CO2 Sequestration
Balanced CHP Recycled Industrial Energy
0
5
10
15
20
-10123
Average Fossil Heat Rate (Units of fossil fuel per unit of delivered electricity)
Cen
ts /
kWh
Renewable Energy Options
Central Generation
Options
No incremental fossil fuel line
Recycled Energy Options
Avg. Industrial Power Price 5.5¢ / kWh
(33% efficiency) (50% efficiency) (100% efficiency) (net fossil savings)
Avg. Retail Power Price 8.1¢ / kWh
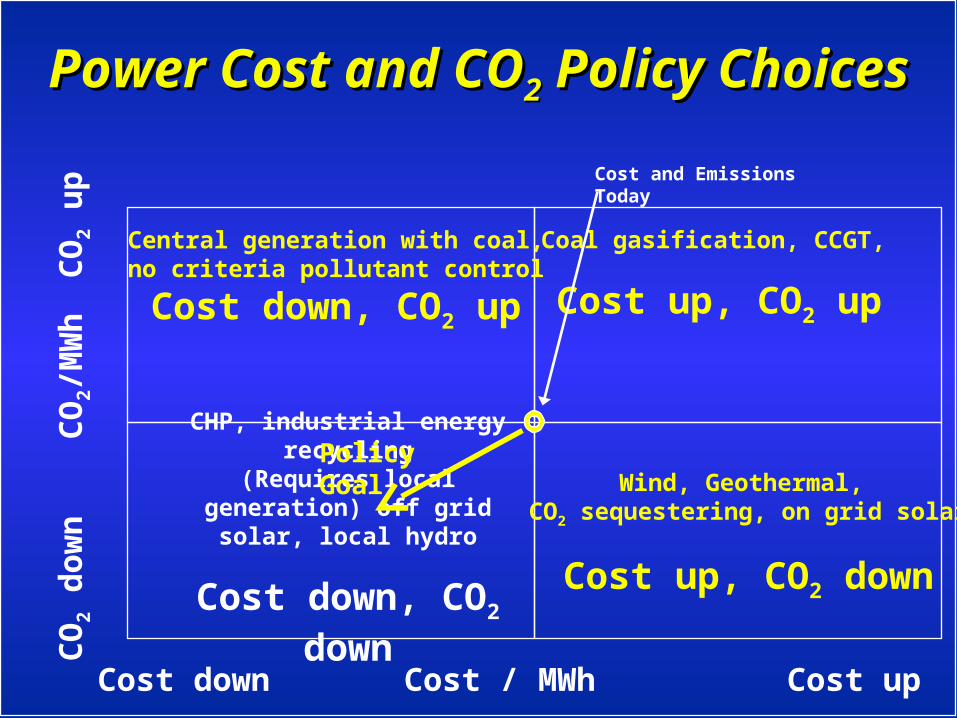
Power Cost and COPower Cost and CO22 Policy Choices Policy Choices
Cost down Cost / MWh Cost up
CO
2 dow
n
CO
2/M
Wh
C
O2 u
p
Coal gasification, CCGT,
Cost up, CO2 up
Central generation with coal, no criteria pollutant control
Cost down, CO2 up
Wind, Geothermal, CO2 sequestering, on grid solar
Cost up, CO2 down
CHP, industrial energy recycling(Requires local generation) off
grid solar, local hydro
Cost down, CO2 down
Cost and Emissions Today
Policy Goal
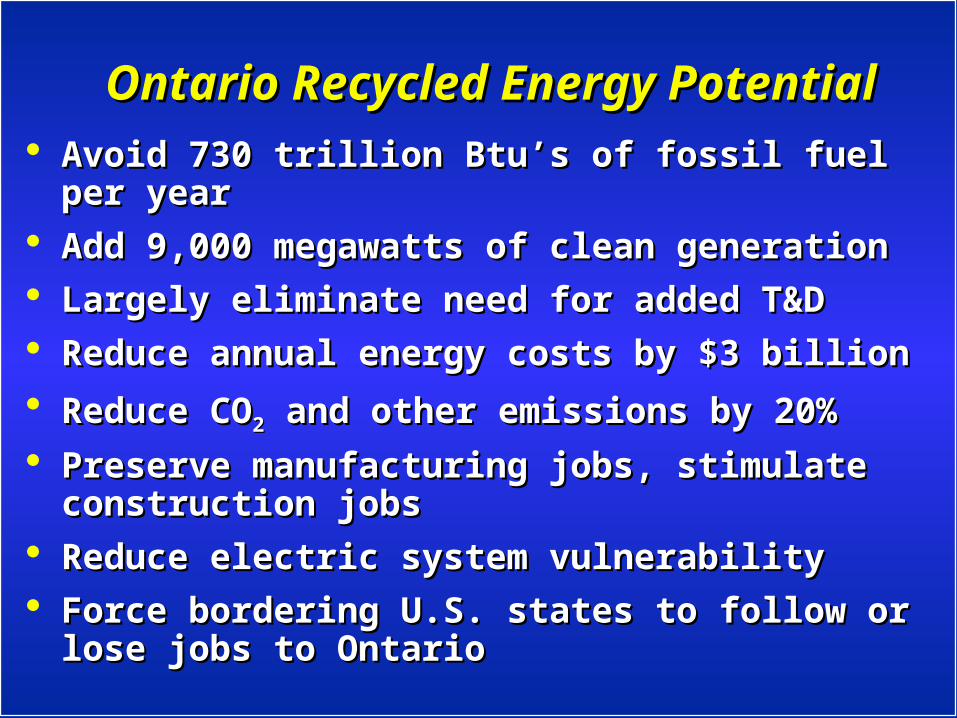
Ontario Recycled Energy PotentialOntario Recycled Energy Potential Avoid 730 trillion Btu’s of fossil fuel per yearAvoid 730 trillion Btu’s of fossil fuel per year Add 9,000 megawatts of clean generationAdd 9,000 megawatts of clean generation Largely eliminate need for added T&D Largely eliminate need for added T&D Reduce annual energy costs by $3 billionReduce annual energy costs by $3 billion
Reduce COReduce CO22 and other emissions by 20% and other emissions by 20%
Preserve manufacturing jobs, stimulate Preserve manufacturing jobs, stimulate construction jobsconstruction jobs
Reduce electric system vulnerabilityReduce electric system vulnerability Force bordering U.S. states to follow or lose Force bordering U.S. states to follow or lose
jobs to Ontario jobs to Ontario
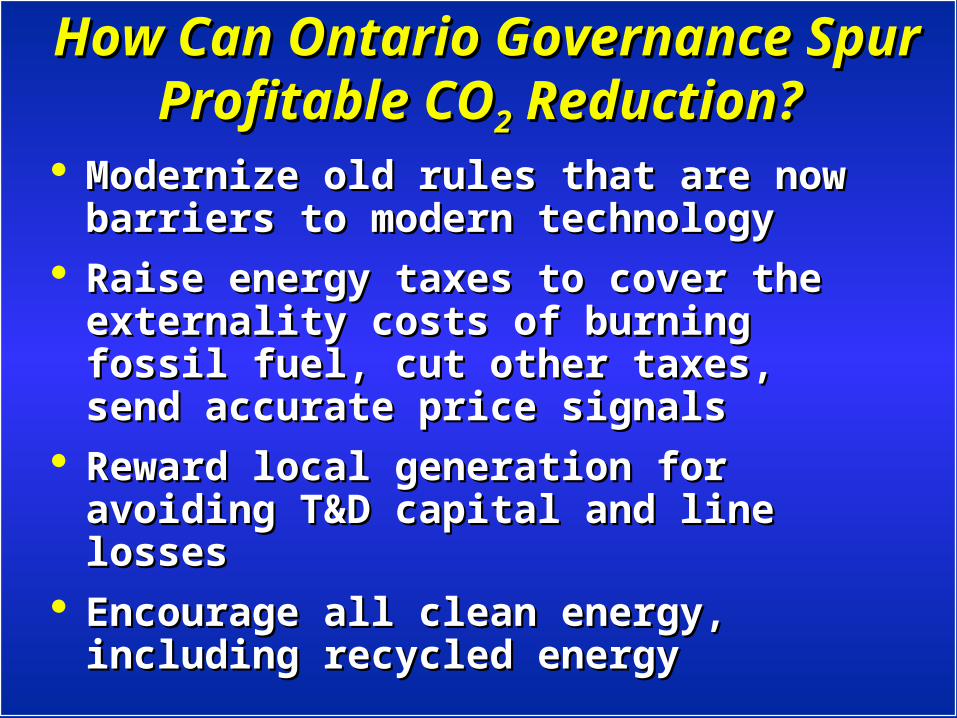
How Can Ontario Governance Spur How Can Ontario Governance Spur Profitable COProfitable CO22 Reduction? Reduction?
Modernize old rules that are now Modernize old rules that are now barriers to modern technologybarriers to modern technology
Raise energy taxes to cover the Raise energy taxes to cover the externality costs of burning fossil fuel, externality costs of burning fossil fuel, cut other taxes, send accurate price cut other taxes, send accurate price signalssignals
Reward local generation for avoiding Reward local generation for avoiding T&D capital and line lossesT&D capital and line losses
Encourage all clean energy, including Encourage all clean energy, including recycled energy recycled energy
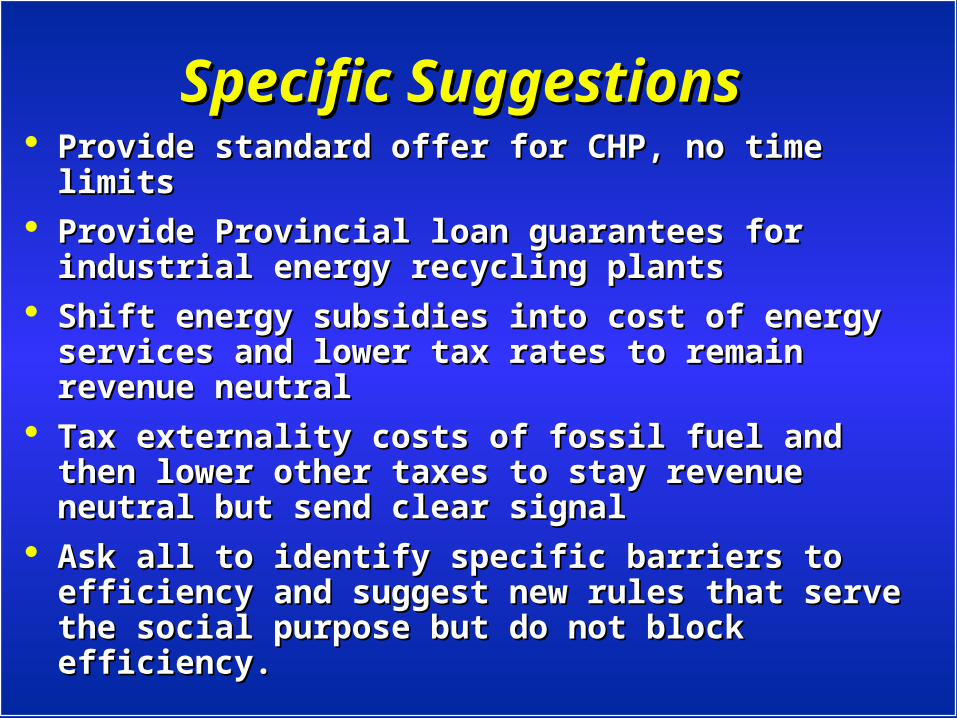
Specific SuggestionsSpecific Suggestions Provide standard offer for CHP, no time limitsProvide standard offer for CHP, no time limits Provide Provincial loan guarantees for Provide Provincial loan guarantees for
industrial energy recycling plants industrial energy recycling plants Shift energy subsidies into cost of energy Shift energy subsidies into cost of energy
services and lower tax rates to remain revenue services and lower tax rates to remain revenue neutralneutral
Tax externality costs of fossil fuel and then Tax externality costs of fossil fuel and then lower other taxes to stay revenue neutral but lower other taxes to stay revenue neutral but send clear signalsend clear signal
Ask all to identify specific barriers to efficiency Ask all to identify specific barriers to efficiency and suggest new rules that serve the social and suggest new rules that serve the social purpose but do not block efficiency.purpose but do not block efficiency.
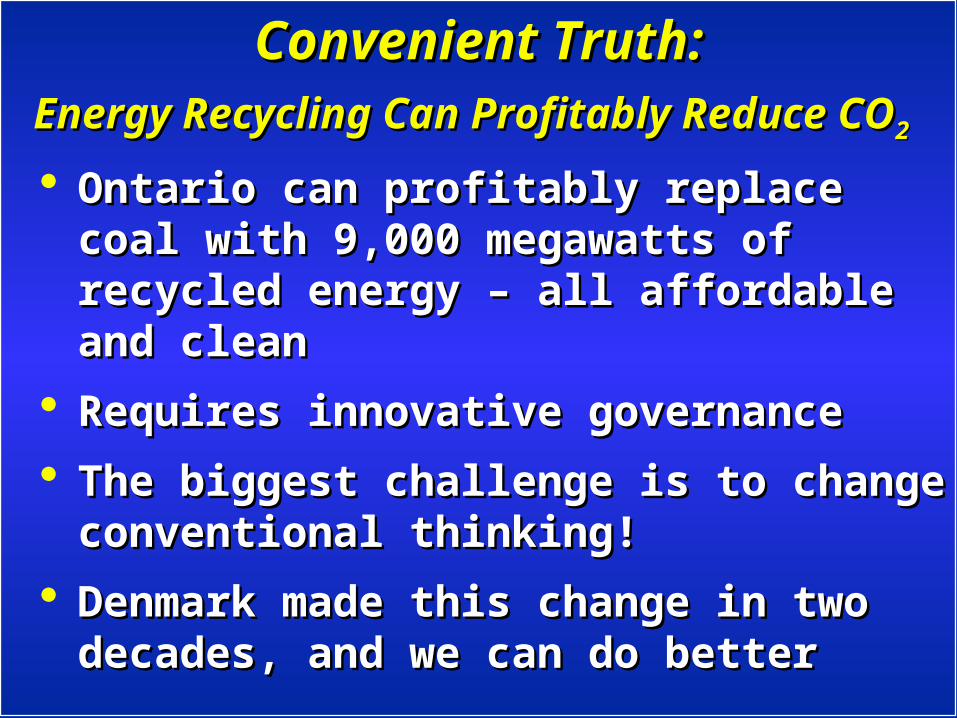
Convenient Truth:Convenient Truth:Energy Recycling Can Profitably Reduce COEnergy Recycling Can Profitably Reduce CO22 Ontario can profitably replace coal with Ontario can profitably replace coal with
9,000 megawatts of recycled energy – all 9,000 megawatts of recycled energy – all affordable and cleanaffordable and clean
Requires innovative governanceRequires innovative governance
The biggest challenge is to change The biggest challenge is to change conventional thinking!conventional thinking!
Denmark made this change in two Denmark made this change in two decades, and we can do betterdecades, and we can do better
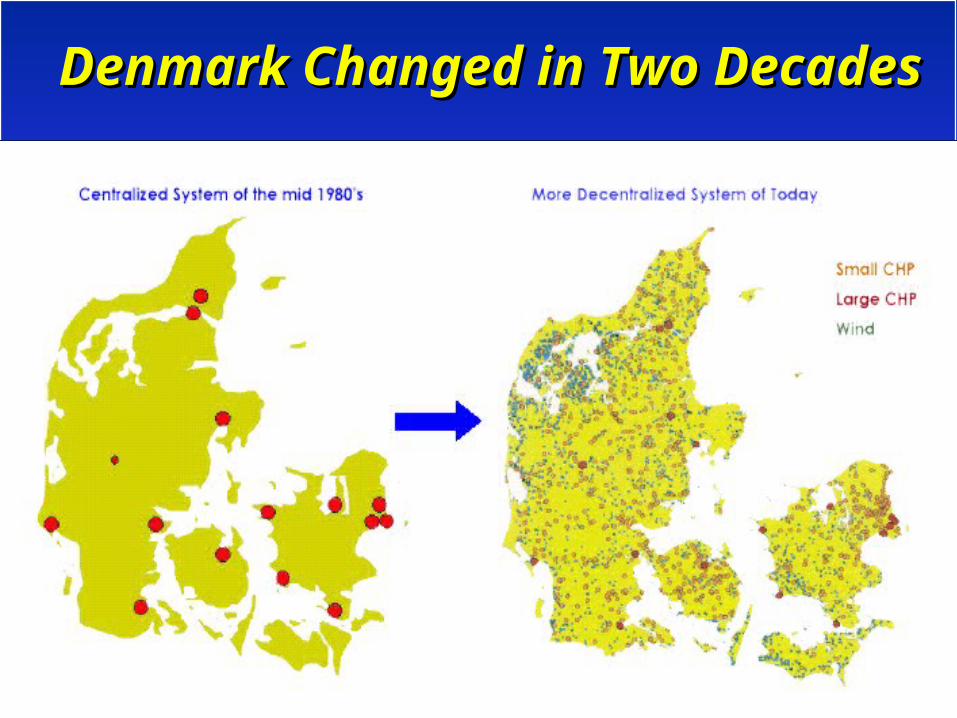
Denmark Changed in Two DecadesDenmark Changed in Two Decades
Source: Danish Energy CenterSource: Danish Energy Center
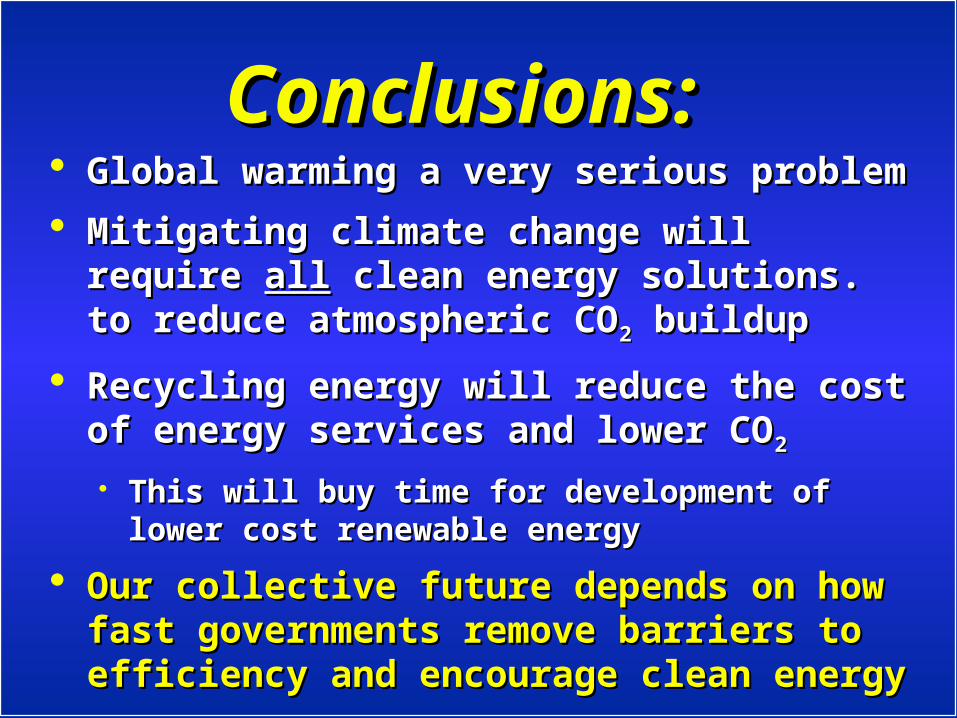
Conclusions:Conclusions: Global warming a very serious problem Global warming a very serious problem
Mitigating climate change will require Mitigating climate change will require allall clean clean energy solutions. to reduce atmospheric COenergy solutions. to reduce atmospheric CO22
buildupbuildup
Recycling energy will reduce the cost of Recycling energy will reduce the cost of energy services and lower COenergy services and lower CO22
This will buy time for development of lower cost This will buy time for development of lower cost renewable energy renewable energy
Our collective future depends on how fast Our collective future depends on how fast governments remove barriers to efficiency governments remove barriers to efficiency and encourage clean energyand encourage clean energy

Thank you for listening