Pollution in Sydney Harbour: sewage, toxic chemicals and ...
112
Pollution in Sydney Harbour: sewage, toxic chemicals and microplastics Briefing Paper No 03/2015 by Daniel Montoya
Transcript of Pollution in Sydney Harbour: sewage, toxic chemicals and ...

Pollution in Sydney Harbour: sewage,
toxic chemicals and microplastics
Briefing Paper No 03/2015 by Daniel Montoya

RELATED PUBLICATIONS
A statistical portrait of the environment in NSW. Statistical Indicators 02/2011 by Talina Drabsch
Biodiversity: regulatory frameworks. Briefing Paper 03/2010 by Holly Park
Marine protected areas. Briefing Paper 08/2008 by Tom
Edwards
The management of Sydney Harbour foreshores. Briefing Paper 12/1998 by Stewart Smith
ACKNOWLEDGEMENT
The author would like to thank Gavin Birch from the University of Sydney for his comments on a draft of this paper. Any errors are the author’s responsibility.
ISSN 1325-5142
ISBN 978-0-7313-1930-5
March 2015
© 2015
Except to the extent of the uses permitted under the Copyright Act 1968, no part of this document may be reproduced or transmitted in any form or by any means including information storage and retrieval systems, without the prior consent from the Manager, NSW Parliamentary Research Service, other than by Members of the New South Wales Parliament in the course of
their official duties.

Pollution in Sydney Harbour: sewage, toxic chemicals and microplastics
by
Daniel Montoya

NSW PARLIAMENTARY RESEARCH SERVICE
Gareth Griffith (BSc (Econ) (Hons), LLB (Hons), PhD), Manager, Politics & Government/Law .......................................... (02) 9230 2356 Daniel Montoya (BEnvSc (Hons), PhD), Senior Research Officer, Environment/Planning ......................... (02) 9230 2003 Lenny Roth (BCom, LLB), Senior Research Officer, Law ....................................................... (02) 9230 2768 Christopher Angus (BA(Media&Comm), LLM(Juris Doctor)), Research Officer, Law .................................................................. (02) 9230 2906 Tom Gotsis (BA, LLB, Dip Ed, Grad Dip Soc Sci) Research Officer, Law .................................................................. (02) 9230 3085 Andrew Haylen (BResEc (Hons)), Research Officer, Public Policy/Statistical Indicators .................. (02) 9230 2484 John Wilkinson (MA, PhD), Research Officer, Economics ...................................................... (02) 9230 2006
Should Members or their staff require further information about this publication please contact the author.
Information about Research Publications can be found on the Internet at:
http://www.parliament.nsw.gov.au/prod/parlment/publications.nsf/V3LIstRPSubject
Advice on legislation or legal policy issues contained in this paper is provided for use in parliamentary debate and for related parliamentary purposes. This paper is not professional legal opinion.

CONTENTS
List of Tables
List of Figures
Summary ............................................................................................................ i
List of abbreviations ....................................................................................... ix
1. Introduction ............................................................................................... 1
Part One – Background and history ............................................................... 4
2. Sydney harbour and its catchment.......................................................... 4
2.1 Sydney Harbour .................................................................................... 5
2.2 Lane Cove River ................................................................................. 13
2.3 Middle Harbour .................................................................................... 14
2.4 Parramatta River ................................................................................. 14
2.5 Port Jackson ....................................................................................... 15
2.6 Threats facing the Harbour .................................................................. 15
3. History of pollution in Sydney Harbour ................................................. 19
3.1 1788 to 1860s: Waste receptacle ........................................................ 19
3.2 1870s to 1910s: Industrial expansion .................................................. 21
3.3 1920s to 1960s: The forgotten river .................................................... 23
3.4 1970 to present: A river reviving .......................................................... 25
Part Two – Pollution in Sydney Harbour ...................................................... 28
4. Water quality ............................................................................................ 28
4.1 Sydney Water data .............................................................................. 28
4.2 Water quality at Sydney Harbour beaches .......................................... 33
4.3 Nutrients and total suspended solids in stormwater entering the Harbour ......................................................................................................... 37
5. Dioxins ..................................................................................................... 39
5.1 What are dioxins? Types, measurement, toxicity and sources ............ 39

5.2 History of dioxins in Sydney Harbour: Agent Orange manufacturing in Rhodes and fishing bans .............................................................................. 41
5.3 Dioxins in fish ...................................................................................... 43
5.4 Dioxins in Sydney Harbour: where it is and what can be done ............ 49
6. Heavy metals and sediment toxicity ...................................................... 62
6.1 Heavy metals ...................................................................................... 62
6.2 Sediment quality and toxicity ............................................................... 71
7. Microplastics ........................................................................................... 79
7.1 Plastic pollution ................................................................................... 79
7.2 Environmental impacts ........................................................................ 80
7.3 Sydney Harbour .................................................................................. 81
8. A Sydney Harbour report card ............................................................... 84
8.1 Catchment pressures .......................................................................... 84
8.2 Water quality ....................................................................................... 85
8.3 Sediment quality .................................................................................. 87
8.4 Final assessment grade and management implications ...................... 87
9. Conclusion ............................................................................................... 90
Appendix 1 ...................................................................................................... 91

LIST OF TABLES
Table 1: Sydney Harbour – area, volume and average depth ............................ 5
Table 2: Significant environmental features of Sydney Harbour ......................... 9
Table 3: Land use in the Sydney Harbour catchment ....................................... 12
Table 4: Land use and population density in the Sydney Harbour sub-catchments ....................................................................................................... 12
Table 5: Nutrient and total suspended solids entering Sydney Harbour, comparison with Australian and international catchments ................................ 38
Table 6: Chemicals manufactured at the Union Carbide/Lednez site ............... 42
Table 7: Fishing bans in Sydney Harbour and public health reports ................ 44
Table 8: Recommended maximum intake of popular species and their dioxin concentration findings ...................................................................................... 48
Table 9: International dioxin sediment quality guidelines ................................. 50
Table 10: Dioxin sediment concentrations in the part of Homebush Bay adjacent to the Lednez site (pg I-TEQ/g) ........................................................................ 51
Table 11: Dioxin water concentrations in Homebush Bay (pg TEQ/L) .............. 54
Table 12: Australian State and Territory dioxin sediment concentrations ......... 58
Table 13: Sydney Harbour and Australian normalised (<62.5µm) metal concentrations (mg/kg) in surficial sediment..................................................... 62
Table 14: Sydney Harbour and global normalised (<62.5µm) metal concentrations (mg/kg) in surficial sediment..................................................... 63
Table 15: Heavy metal inventories in Sydney Harbour (tonnes)....................... 64
Table 16: Stormwater heavy metal yields for Australian and international urban catchments (grams per hectare per year) ........................................................ 69
Table 17: Number of years for heavy metal concentrations to reach 2 times background concentrations .............................................................................. 71
Table 18: Sydney Harbour sediment chemical analysis ................................... 73
Table 19: Summary of sediment chemical data for the most prevalent chemicals in four classes in Sydney Harbour .................................................................... 75
Table 20: Comparing sediment toxicity in Sydney Harbour and US estuaries (% of estuary) ........................................................................................................ 78
Table 21: International comparisons of microplastic contamination ................. 83
Table 22: Management priorities for Sydney Harbour ...................................... 89

LIST OF FIGURES
Figure 1: Sydney Harbour and its catchment ..................................................... 3
Figure 2: Sydney Harbour sub-catchments ........................................................ 4
Figure 3: Sydney Regional Environmental Plan (Sydney Harbour Catchment) 2005 – Zoning Map ............................................................................................ 6
Figure 4: Land use in the Sydney Harbour catchment ..................................... 13
Figure 5: Average dissolved oxygen saturation for selected sites in Sydney Harbour compared to upper and lower ANZECC (2000) guidelines ................. 29
Figure 6: Average total nitrogen concentration for selected sites in Sydney Harbour compared to ANZECC (2000) guidelines ........................................... 30
Figure 7: Average total phosphorus concentration for selected sites in Sydney Harbour compared to ANZECC (2000) guidelines ........................................... 31
Figure 8: Average chlorophyll-a concentration for selected sites in Sydney Harbour compared to ANZECC (2000) guidelines ........................................... 32
Figure 9: Average enterococci count for selected sites in Sydney Harbour compared to ANZECC (2000) guidelines ......................................................... 33
Figure 10: Sampling sites and Beach Suitability Grades in Sydney Harbour ... 34
Figure 11: Beach grades for Sydney Harbour: 2009-10 to 2013-14 ................. 35
Figure 12: Historical trends in water quality for Sydney Harbour beaches ....... 36
Figure 13: Swimming in the Parramatta River .................................................. 37
Figure 14: Levels of dioxins recorded in 36 composite prawn samples harvested from 7 different locations in Sydney Harbour.................................................... 45
Figure 15: Levels of dioxins recorded in 40 composite bream samples harvested from 8 different locations in Sydney Harbour ................................... 46
Figure 16: Dioxin sediment concentrations in Homebush Bay (0-100mm) ....... 52
Figure 17: Remediation of sediments in Homebush Bay .................................. 54
Figure 18: Water quality sampling locations in Homebush Bay ........................ 55
Figure 19: Sample locations: 2007 study into dioxins in Sydney Harbour sediments ......................................................................................................... 57
Figure 20: Dioxin concentrations in Sydney Harbour extending east and west from Homebush Bay (S7, S8, S13, S14; pg TEQ/g) ......................................... 58
Figure 21: International dioxin concentrations ((pg TEQ/g) .............................. 59
Figure 22: Dioxin levels in Sydney Harbour (2008 study) ................................. 60
Figure 23: Cobalt, chromium and nickel enrichment in six Sydney Harbour embayments ..................................................................................................... 65

Figure 24: Copper, lead and zinc enrichment in six Sydney Harbour embayments ..................................................................................................... 66
Figure 25: Mean Enrichment Quotient (MEQ) for heavy metals in six Sydney Harbour embayments ....................................................................................... 67
Figure 26: Summary of temporal trends in surficial sediment metal concentrations and sources of metals .............................................................. 68
Figure 27: Four priority categories for Sydney Harbour sediments according to the probability of sediment toxicity .................................................................... 76
Figure 28: Combined chemistry and toxicity scores for Sydney Harbour sediments ......................................................................................................... 77
Figure 29: The distribution of microplastics in Sydney Harbour ....................... 82
Figure 30: Sub-catchment/sub-estuary systems of Sydney Harbour ................ 84
Figure 31: Pressure grades for Sydney Harbour .............................................. 85
Figure 32: Water quality grades for Sydney Harbour ....................................... 86
Figure 33: Sediment quality grades for Sydney Harbour .................................. 87
Figure 34: Final assessment grade for Sydney Harbour .................................. 88


i
SUMMARY
Sydney Harbour is a paradox. On the one hand, it is known as one of the most beautiful harbours in the world; on the other, few other estuaries are as modified and polluted. This paper deals primarily with the what and where of pollution in the Harbour, briefly noting at several points the environmental impacts of the pollution. A description of the Harbour and brief history of how it became polluted precede coverage of pollution in the Harbour today, with particular reference to water quality, dioxins, heavy metals and sediment toxicity, and microplastics. A timeline of relevant regulatory and parliamentary events is attached as an appendix. No research was found on the social and economic impacts of the pollution.
Sydney Harbour
Sydney Harbour is a tide dominated, drowned valley estuary, formed approximately 10,000 years ago when the sea level rose. It is 30km long, 2km wide, occupies about 48km2 and has a volume of 540,600ML. Its catchment of 480km2 extends across to Blacktown in the west, Terrey Hills and Normanhurst in the north, and Bankstown and Dulwich Hill in the south. For the purposes of this paper, from the entrance between North and South heads, Sydney Harbour opens into Port Jackson and its three main branches – Middle Harbour, Parramatta River and Lane Cove River. [2.1]
Sydney Harbour supports a diversity of organisms rarely matched elsewhere. It is also home to a number of endangered species and ecological communities. Leading up to the 2015 NSW general election, several parties and key stakeholders have come out in support of establishing a Sydney Marine Park including the Labor Party, The Greens NSW, Alex Greenwich, the Independent Member for Sydney, and the National Parks Association of NSW. In December 2014, the NSW Government announced a year-long study that would inform any decision about the creation of an integrated marine protected area along the metropolitan coast by 2016. [2.1.2]
Sydney Harbour is a major economic driver of the city. As a port, it has three main functions: cruise ship destination; the importation of bulk products; and hosting a naval base. These functions are expected to increase in importance into the future. [2.1.3]
Modification of the estuary and its catchment
Sydney Harbour’s depth and sheltered waters made it an ideal location for European settlement. The expansion of Sydney has substantially changed the Harbour. Due to reclamation, 77 km of the original 322km of shoreline and 11.5km2 (22%) of the total 48km2 of the estuary have been lost, mostly upstream of Sydney Harbour Bridge. The Sydney Harbour catchment has similarly been substantially modified, with approximately 80% being urbanised or industrialised. [2.1]
Sydney Harbour, its tributaries and catchment, were polluted within years of European settlement. Industries were first established on the banks of Darling

Harbour in 1800, from where they gradually spread along the southern shore of the Parramatta River. Small-scale industry also polluted the waters of the Lane Cove River and Middle Harbour. While regulatory reforms were introduced in the 1940s and 1950s to address pollution of the Harbour, it wasn’t until the Clean Waters Act 1970 that pollution levels entering the Harbour began to decline. [3.0]
Pollution in Sydney Harbour
Threats remain to the biodiversity and ecosystems of the Harbour. Six key threats have been identified, the first two of which are discussed in depth in this paper: heavy metal and toxic chemical contamination; nutrients and turbidity; invasive species; habitat modification; fishing and aquaculture; and climate change. This paper also deals with an emerging problem – microplastics.
Water quality
A 2011 report averaged Sydney Water data for several water quality parameters in the Lane Cove River (3 sites), Middle Harbour (3 sites), Parramatta River (5 sites) and Port Jackson (3 sites). For dissolved oxygen, 9 of 14 sites in the Harbour met guidelines on average. For four other indicators (total nitrogen, total phosphorus, chlorophyll-a and enterococci), only three sites met guidelines on average – Quakers Hat Bay in Middle Harbour, and Little Sirius Cove and Rushcutters Bay in Port Jackson.
Water quality parameters in Sydney Harbour (2011)
Water quality indicator Number of sites which met guidelines (14 sites in total)
Dissolved oxygen Lane Cove River (1 site) Middle Harbour (2 sites) Port Jackson (3 sites) Parramatta River (3 sites)
Total nitrogen Middle Harbour (1 site) Port Jackson (2 sites)
Total phosphorus Middle Harbour (1 site) Port Jackson (2 sites)
Chlorophyll-a Middle Harbour (1 site) Port Jackson (2 sites)
Enterococci Middle Harbour (1 site) Port Jackson (2 sites)
The number of enterococci is the preferred faecal indicator for marine waters. Enterococci counts are monitored at swimming beaches in the Harbour, where they have significantly improved since the late 1990s. In 2013-14, 76% of beaches were graded good or very good, up from 68% in 2009-10. [4.1 & 4.2]
Dioxins
The name “dioxins” often refers to three families of compounds, the first two of which are structurally and chemically related: PCDDs or dioxins; PCDFs or furans; and dioxin-like polychlorinated biphenyls (PCBs). Each of these three families of compounds has a number of variants; of 419, 29 have high toxic potential. The most toxic of these, and one of the most toxic chemicals ever tested, is 2,3,7,8-tetrachlorodibenzo-p-dioxin (2,3,7,8-TCDD). The presence of toxic dioxins in seafood, water or sediment is measured in a single toxicity value, the 2,3,7,8-TCDD Toxicity Equivalence Concentration (TEQ).

iii
Dioxins are one of 23 persistent organic pollutants (POPs) listed in the 2001 Stockholm Convention to which Australia is a signatory. Short-term exposure of humans to high levels of dioxins may result in lesions and altered liver function. Long-term exposure has been linked to impairment of the immune system, the developing nervous system, the endocrine system and reproductive functions. 2,3,7,8-TCDD has also been classified as a “known human carcinogen”. Signatories to the Convention are required to take measures to reduce the unintentional releases of dioxins with the goal of continuing minimization and, where feasible, ultimate elimination. [5.1]
Between 1928 and 1985, Timbrol (later known as Union Carbide) manufactured a variety of chemicals on the Rhodes Peninsula. Dioxins, including 2,3,7,8-TCDD, were released in industrial effluent disposed of in part in Homebush Bay. The Timbrol site on Rhodes Peninsula and adjacent Homebush Bay sediments were remediated between 2005 and 2011, at a cost of $21 million. Only the most contaminated sediments of the Bay were remediated by removal of the upper 0.5m of sediment and replacement with clean fill. As of 2014, the effectiveness of the remediation program was unknown. [5.2]
International dioxin sediment quality guidelines range from 0.0011 to 210pg TEQ/g, depending on factors such as the level of effects expected at a certain concentration. [5.4.1]
The 2002 Environmental Impact Statement (EIS) conducted prior to the remediation of the Timbrol site and parts of Homebush Bay found surface sediment dioxin concentrations ranging from 90 to 154,000pg I-TEQ/g, with a mean of 7,600pg I-TEQ/g. The estimated bay-wide average dioxin sediment concentration was 3,014pg I-TEQ/g. The remediation was expected to reduce the bay-wide average to 2,033pg I-TEQ/g.
Dioxin sediment concentrations in the part of Homebush Bay adjacent to the Timbrol site (pg I-TEQ/g) (2002)
Sediment depth Minimum Maximum Mean
Surface (0-100mm) 90 154,000 7,600
Subsurface (400-500mm) 20 380,000 7,930
Subsurface (900-1,000mm) 50 238,000 25,680
The EIS contained several readings of water dioxin levels taken in the eastern part of the Bay, all of which significantly exceeded the value set in the Canadian Water Quality Guidelines for the Protection of Aquatic Life of 10pg TEQ/L.
Dioxin water concentrations in Homebush Bay (pg TEQ/L) (2002)
Weather Site
WQ1 WQ2 WQ3
Wet weather 690 12,100 815
Dry weather 3,080 652 445
Five groundwater readings for the Lednez site are presented in the EIS. These range from 4 to 157pg TEQ/L, with no mean provided. It appears therefore that
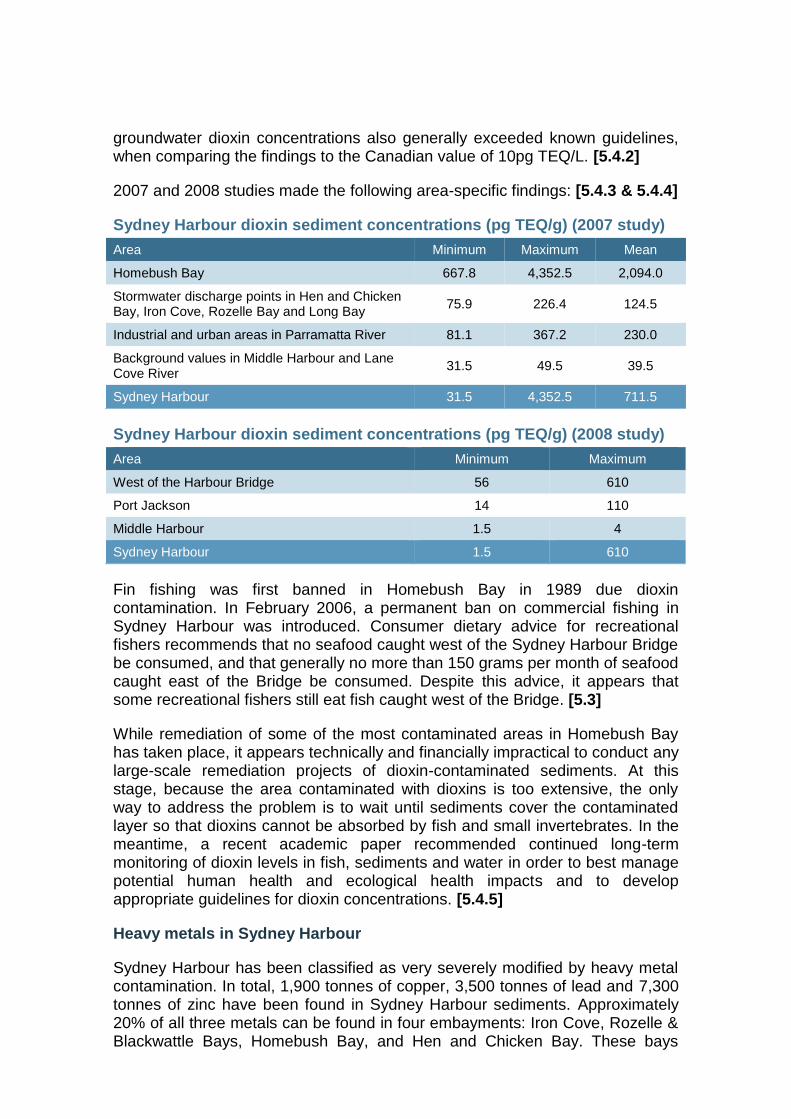
groundwater dioxin concentrations also generally exceeded known guidelines, when comparing the findings to the Canadian value of 10pg TEQ/L. [5.4.2]
2007 and 2008 studies made the following area-specific findings: [5.4.3 & 5.4.4]
Sydney Harbour dioxin sediment concentrations (pg TEQ/g) (2007 study)
Area Minimum Maximum Mean
Homebush Bay 667.8 4,352.5 2,094.0
Stormwater discharge points in Hen and Chicken Bay, Iron Cove, Rozelle Bay and Long Bay
75.9 226.4 124.5
Industrial and urban areas in Parramatta River 81.1 367.2 230.0
Background values in Middle Harbour and Lane Cove River
31.5 49.5 39.5
Sydney Harbour 31.5 4,352.5 711.5
Sydney Harbour dioxin sediment concentrations (pg TEQ/g) (2008 study)
Area Minimum Maximum
West of the Harbour Bridge 56 610
Port Jackson 14 110
Middle Harbour 1.5 4
Sydney Harbour 1.5 610
Fin fishing was first banned in Homebush Bay in 1989 due dioxin contamination. In February 2006, a permanent ban on commercial fishing in Sydney Harbour was introduced. Consumer dietary advice for recreational fishers recommends that no seafood caught west of the Sydney Harbour Bridge be consumed, and that generally no more than 150 grams per month of seafood caught east of the Bridge be consumed. Despite this advice, it appears that some recreational fishers still eat fish caught west of the Bridge. [5.3]
While remediation of some of the most contaminated areas in Homebush Bay has taken place, it appears technically and financially impractical to conduct any large-scale remediation projects of dioxin-contaminated sediments. At this stage, because the area contaminated with dioxins is too extensive, the only way to address the problem is to wait until sediments cover the contaminated layer so that dioxins cannot be absorbed by fish and small invertebrates. In the meantime, a recent academic paper recommended continued long-term monitoring of dioxin levels in fish, sediments and water in order to best manage potential human health and ecological health impacts and to develop appropriate guidelines for dioxin concentrations. [5.4.5]
Heavy metals in Sydney Harbour
Sydney Harbour has been classified as very severely modified by heavy metal contamination. In total, 1,900 tonnes of copper, 3,500 tonnes of lead and 7,300 tonnes of zinc have been found in Sydney Harbour sediments. Approximately 20% of all three metals can be found in four embayments: Iron Cove, Rozelle & Blackwattle Bays, Homebush Bay, and Hen and Chicken Bay. These bays

v
represent only 5% of the total Sydney Harbour area. Metal concentrations in surficial sediments of Rozelle & Blackwattle Bays, Iron Cove, Hen and Chicken Bay and Homebush Bay have generally declined over the past few decades. In the Lane Cove Estuary, heavy metal concentrations have either generally remained stable or increased. In Middle Harbour, heavy metal concentrations have generally remained stable or decreased. [6.1.1]
Stormwater is the most significant contemporary source of heavy metal contamination in Sydney Harbour. It has been estimated that Sydney Harbour receives an average annual loading of arsenic, cadmium, chromium, copper, nickel, lead and zinc of 0.8, 0.5, 1.7, 3.2, 1.1, 3.6 and 17.7 tonnes respectively (28.6 tonnes in total). Copper concentrations in stormwater almost always exceed the guidelines, zinc concentrations frequently exceed guidelines and arsenic, chromium and lead concentrations exceed guidelines on occasion. Nickel concentrations never exceed guidelines. [6.1.2]
Researchers have modelled the length of time it would take for heavy metal concentrations to decrease to two times pre-anthropogenic concentrations based on recent trends. The time taken for particular metals to decline to two times background concentrations ranged from 2 to 92 years. However, this is optimistic given sediment concentrations cannot decrease below the levels found in stormwater entering the Harbour, which is up to 10-20 times background levels in some locations. [6.1.3]
Sediment quality and toxicity
Researchers from the University of Sydney’s School of Geosciences have investigated the quality and toxicity of sediment in Sydney Harbour, examining in particular concentrations of heavy metals, organochlorine pesticides (e.g. DDT), total polychlorinated biphenyls (PCBs) and polycyclic aromatic hydrocarbons (PAHs). The highest priority Sydney Harbour sediments (16% of the Harbour) were subject to ecotoxicological tests. This data was combined with chemical data to produce a sediment chemistry and toxicity score. All the sediment in the areas tested was found to be either highly toxic (17%), moderately toxic (52%) or slightly toxic (31%). [6.2]
Microplastics
The term microplastics was first coined in 2004 as researchers attempted to account for all the plastic in the ocean. Microplastics are tiny plastic fragments, fibres and granules generally smaller than 5mm in diameter. A wide-ranging study into microplastics published in 2011 concluded that microplastic particles in the marine environment are mainly derived from sewage via washing clothes, rather than fragmentation of larger pieces or cleaning products. [7.1]
In 2014, researchers from the Sydney Institute of Marine Science found “alarming” levels of microplastic pollution in Sydney Harbour. Sediment samples taken at 27 sites across the Harbour found concentrations of microplastics ranged from 0-10 to a high of 61-100 particles per 100ml of sediment in Middle Harbour. In August 2014, Rob Stokes, the NSW Minister for the Environment, announced that he had convened a working group to work towards phasing out

microbeads by 2016 through voluntary means. Rob Stokes also called for a national ban on the sale and production of shampoos and other products containing microbeads.
Australian and international comparisons
A summary of Australian and international comparisons for water quality, dioxins, heavy metals, sediment toxicity and microplastics is contained in the Tables below. The data was sourced from Tables 5, 10, 12 to 14, 16, 20 and 21, and Figure 21 of this paper. Note that the maximum dioxin reading for Sydney Harbour was taken prior to remediation; the current maximum is likely to be in the vicinity of the maximum found by a 2007 study of 4,352.5pg TEQ/g.
Stormwater quality
Total nitrogen
yield
(kg/km/year)
Total phosphorus
yield
(kg/km/year)
Total suspended
solids
(kg/km/year)
% of catchment developed
Sydney Harbour 990 132 71,384 86
Australian estuaries 282–460 49–65 na na
NW Europe 1,300 101 na na
NE USA 1,070 139 na na
Danish estuaries 2,400 112 na 10
NE Canada 76 4.5 na na
Dioxins (pg TEQ/g)
Minimum Mean Maximum
Sydney Harbour 31.5 711.5 154,000
Australian estuaries 0.89 na 35
Finland na na 80,000
Norway 6,234 na 19,444
Venice Lagoon, Italy 427 na 2,857
St. Laurensharbour, Netherlands 352 na 1,849
Passaic River, USA 310 na 1,400
Hong Kong Harbour 4 na 33
Tokyo Bay 3.3 na 52
Stormwater heavy metal yields (grams per hectare per year)
Chromium Copper Nickel Lead Zinc
Sydney Harbour 41 72 23 82 378
Yarra River, Vic na 7.7–11 na 5.7–31 23–190
Four US urban catchments 12 0.4–40 11 0.0–31 18–398

vii Heavy metal concentrations in surficial sediments (mg/kg)
Cadmium Copper Nickel Lead Zinc
Sydney Harbour
Mean 0.8 188 21.7 364 651
Range 0–24.3 9–1,053 5–245 38–3,604 108–7,622
Five Australian urbanised estuaries
Means na 13–87 na 30–172 134–393
Range na 1–596 na 1–924 13–2,641
Australian non-urbanised estuary
Mean na 5 na 19 49
Range na 2–9 na 5–28 12–82
Six international estuaries
Means 0.21–1.22 39–183 14–37 22–189 65–391
Range 0.1–5.3 1–4,000 5–447 9–589 17–1,133
ANZECC guidelines
ISQG-Low 1.5 65 21 50 200
ISQG-High 10 270 52 220 410
Sediment toxicity
No chemicals
exceeded an ERL value
At least one chemical exceeded an ERL value, but not an
ERM value
At least one chemical exceeded an ERM
value
Sydney Harbour 8% 45% 46%
US estuaries 31% 42% 27%
Microplastics
Particles per 100ml sediment
Sydney Harbour 0-10 to 61-100
Western Australia, beach 0.8
International estuaries 2 to 24
International beaches 0.8 to 12.4
Deep sea sediments 26.8
A Sydney Harbour report card
Research completed at Sydney University in 2014 assessed the condition of Sydney Harbour and its sub-catchments and sub-estuaries. Three indicators were graded – catchment pressures, water quality and sediment quality – and their grades were combined into an overall grade. Management priorities were allocated to each sub-catchment/sub-estuary according to their condition. Note that this research did not include some pollutants, including dioxins. The research is therefore indicative of the state of the Harbour and its sub-catchments. [8.0]

Final assessment grade for Sydney Harbour1
Management priorities for Sydney Harbour
Sub-catchment/
sub-estuary Overall priority
Sediment quality priority
Water quality priority
Blackwattle/Rozelle Bay High High Medium Low
Iron Cove High High Medium Low
Homebush Bay High Medium High High
Duck River High Medium High High
Hen and Chicken Bay Medium High High Medium Low
Upper Estuary Medium High Medium High Medium High
Lower Parramatta River Medium High Medium Low High
Parramatta River Medium High Low High
Lower Estuary Medium Low Low Low
Middle Estuary Medium Low Medium Low Low
Lane Cove River Medium Low Low Medium High
Central Middle Harbour Medium Low Medium High Low
Lower Middle Harbour Low Low Low
Upper Middle Harbour Low Low Medium Low
North Harbour Low Low Low
1 Gunns, T., The development and implementation of a hierarchical assessment scheme for the management of estuaries in New South Wales, unpublished Masters Thesis, University of Sydney, 2014, p.80

ix
LIST OF ABBREVIATIONS
2,3,7,8-TCDD 2,3,7,8-tetrachlorodibenzo-p-dioxin, one of the most toxic chemicals ever tested
2,4,5-T 2,4,5-trichlorophenoxyacetic acid, a herbicide used in Agent Orange
2,4-D 2,4-dichlorophenoxyacetic acid, a herbicide used in Agent Orange
DDT Dichlorodiphenyltrichloroethane, a banned organochlorine pesticide
EIS Environmental Impact Statement
ERL Effects Range Low, the value below which adverse biological effects are seldom observed
ERM Effects Range Median, the value above which adverse biological effects are expected to occur frequently
HpCDD 1,2,3,4,6,7,8-heptachlorodibenzo-p-dioxin, a toxic dioxin
ISQG-Low Interim Sediment Quality Guidelines-Low, the value below which adverse biological effects are seldom observed
ISQG-High Interim Sediment Quality Guidelines-High, the value above which adverse biological effects are expected to occur frequently
I-TEQ 2,3,7,8-TCDD Toxicity Equivalence Concentration, using NATO/CCMS-assigned dioxin toxicity factors
MEQ Mean Enrichment Quotient, a measure of heavy metal enrichment of sediments
MERMQ Mean Effects Range Median Quotient
OCDD 1,2,3,4,6,7,8,9 octachlorodibenzo-p-dioxin, a toxic dioxin
PCB Polychlorinated biphenyl, a chemical, some types of which have toxic properties similar to dioxins
PCDD Polychlorinated dibenzo-p-dioxins (dioxins)
PCDF Polychlorinated dibenzofurans (furans)
PCP Pentachlorophenol, a chemical used in the production of pesticides
pg Picograms, 10-12 grams or one trillionth of a gram
POP Persistent Organic Pollutant
TEQ 2,3,7,8-TCDD Toxicity Equivalence Concentration
WHO-TEQ 2,3,7,8-TCDD Toxicity Equivalence Concentration, using WHO-assigned dioxin toxicity factors


Briefing Paper No 03/2015
1
1. INTRODUCTION
Sydney Harbour is one of the most beautiful harbours in the world (Figure 1). For the people of NSW and Australia it possesses significant cultural, historic, spiritual, environmental and economic value. In 2013, Sydney Harbour became Australia’s 16th National Landscape as part of the Australian National Landscapes Program, which selects areas of outstanding natural beauty and cultural significance. As described by Tourism Australia:
Hugging the shores of one of the world’s most cosmopolitan cities, the beguiling waters of Sydney Harbour are a blue-green wonderland of sparkling, yacht-studded bays, secluded beaches and coastline framed by parks and native bushland. The green heart is the great expanse of Sydney Harbour National Park, encircling the headlands and entrance to Port Jackson. It is the gateway to a region of natural beauty, rich with Aboriginal and convict history, World Heritage sites and even wildlife on the doorstep. Humpback whales have been known to seek shelter in the harbour’s coves, while a colony of little penguins have made themselves at home on Manly’s foreshore.
Most visitors will get their first glimpse of the harbour while exploring The Rocks, parks like the Royal Botanic Gardens and coastal walkways that snake around the foreshore. With unmistakable icons like the Sydney Harbour Bridge and Sydney Opera House, it’s an enticing view from any vantage point.2
Sadly, the history of Sydney Harbour since European settlement is marked by anything but respect for its values, research having found it to be one of the most modified and polluted estuaries in the world. Since its early days as cesspit for the colony, at various times Sydney Harbour has been subject to a stream of sewage, rubbish, industrial effluent and pollutant-laden stormwater. Today the Harbour has some of the highest concentrations of heavy metals and dioxins in the world, as well as being contaminated by organochlorine pesticides (e.g. DDT), other toxic chemicals, and microplastics. While many of the practices that disposed of these pollutants into the Harbour have ceased, there remains a legacy of sediment contamination that will take centuries to dissipate.3
Leading up to the 2015 NSW general election, several parties and key stakeholders have come out in support of establishing a Sydney Harbour Marine Park. In September 2014, the Labor Party announced that, if elected, it would create a Sydney Marine Park which would incorporate Sydney Harbour, Pittwater, Narrabeen Lakes, Dee Why Lagoon, Botany Bay and Port Hacking. The purpose would be to protect Sydney’s marine environment while maintaining the Harbour’s functions as a working harbour and well-loved and used recreational resource. The Greens NSW and Alex Greenwich, the Independent Member for Sydney, have similar positions, and the National Parks
2 Tourism Australia, Natural Australia: Sydney Harbour, no date [online – accessed 12/11/2014]
3 Hedge, L.H. et al., Sydney Harbour: a systematic review of the science, 2014. Sydney Institute of Marine Science, Sydney, Australia, 80p

NSW Parliamentary Research Service
2
Association of NSW is also campaigning for a Sydney Marine Park.
In December 2014, the NSW Government announced a year-long study into new conservation areas for the Sydney region, which would examine in part the Hawkesbury Shelf marine bioregion which stretches from Newcastle to Wollongong. The NSW Environment Minister, Rob Stokes, stated that the study, due to commence at the beginning of 2015, would “inform decision making about the creation of an integrated marine protected area along the metro coast by 2016”.
A related development was the launch in December 2014 of the Parramatta River Catchment Group’s Our Living River campaign. Their mission is to make Parramatta River swimmable again by 2025. At present, the upper and middle reaches of the River are too polluted for swimming and related activities.
This paper deals primarily with the what and where of pollution in the Harbour, briefly noting at several points the environmental impacts of the pollution.4 No research was found on the social and economic impacts of the pollution. Other than brief mentions in Chapter 3 and a timeline in Appendix 1, the paper generally does not deal with the regulatory framework that applies to the Harbour.
Part One of the paper describes the Harbour and its sub-catchments with reference to its environmental features, economic functions and the use of the waters and surrounding catchment. A short history of pollution is also set out. Part Two covers the findings of an expanding body of research into pollution in the Harbour. The first four chapters deal with water quality, dioxins, heavy metals and sediment toxicity, and microplastics. The last presents a report card of the Harbour and its sub-catchments.
4 For a summary of the environmental effects of pollution in the Harbour, an area which is under-researched, see: Hedge, L.H. et al., Sydney Harbour: a systematic review of the science, 2014. Sydney Institute of Marine Science, Sydney, Australia, 80p

Briefing Paper No 03/2015
3
Figure 1: Sydney Harbour and its catchment5
5 Amended from: NSW Department of Environment, Climate Change and Water, NSW Water Quality and River Flow Objectives: Sydney Harbour and Parramatta River, 1 May 2006 [online – accessed 12/11/2014]

NSW Parliamentary Research Service
4
PART ONE – BACKGROUND AND HISTORY
2. SYDNEY HARBOUR AND ITS CATCHMENT
This chapter describes some of Sydney Harbour’s environmental, social and economic characteristics. Sydney Harbour and its components are variously defined.6 For the purposes of this paper, from the entrance between North and South heads, Sydney Harbour opens into Port Jackson and its three main branches – Middle Harbour, Parramatta River and Lane Cove River (Figure 2).7 The chapter finishes by identifying threats to the Harbour’s environment.
Figure 2: Sydney Harbour sub-catchments8
6 Birch, G., A short geological and environmental history of the Sydney estuary, Australia, pp217-246; In: Birch, G (ed), Water, Wind, Art and Debate, 2007. Sydney University Press, Sydney, 433p
7 Sydney Institute of Marine Science, About Sydney Harbour, no date [online – accessed 12/11/2014]. In contrast, the Geographical Names Board of NSW describes Port Jackson as “A harbour which comprises of all the waters within an imaginary line joining North Head and South Head. Within this harbour lies North Harbour, Middle Harbour and Sydney Harbour”.
8 Hedge, L.H. et al., Sydney Harbour: a systematic review of the science, 2014. Sydney Institute of Marine Science, Sydney, Australia, p.17

Briefing Paper No 03/2015
5
2.1 Sydney Harbour
2.1.1 Description
Sydney Harbour is a tide dominated, drowned valley estuary, formed approximately 10,000 years ago when the sea level rose. Characterized by steep sided banks carved into Sydney sandstone, the estuary is 30km long, 2km wide, occupies about 48km2 and has a volume of 540,600ML (Table 1). Its catchment of 480km2 extends across to Blacktown in the west, Terrey Hills and Normanhurst in the north, and Bankstown and Dulwich Hill in the south.9
Table 1: Sydney Harbour – area, volume and average depth10
Catchment area (km
2)
Estuary area (km
2)
Estuary volume (ML)
Average depth (m)
Lane Cove River 95.4 3 12,600 4.2
Middle Harbour 77 6.1 81,900 13.4
Parramatta River 252.4 13.7 69,700 5.1
Port Jackson 55.7 29.1 376,400 13
Sydney Harbour 480.5 51.9 540,600 n/a
2.1.2 Zoning and environmental protection
The waters of Sydney Harbour are zoned for different uses under the Sydney Regional Environmental Plan (Sydney Harbour Catchment) 2005 (Harbour REP). 9 zones are established under Part 3 of the Regulation (Figure 3):
Zone No W1—Maritime Waters
Zone No W2—Environment Protection
Zone No W3—Naval Waters
Zone No W4—Aviation
Zone No W5—Water Recreation
Zone No W6—Scenic Waters: Active Use
Zone No W7—Scenic Waters: Casual Use
Zone No W8—Scenic Waters: Passive Use
Zone No 8 (a)—National Parks
9 Birch, G., op. cit.; Hedge, L.H. et al., Sydney Harbour: a systematic review of the science, 2014. Sydney Institute of Marine Science, Sydney, Australia, 80p
10 Sources: Office of Environment & Heritage, Lane Cove River, 26 April 2012 [online – accessed 11/11/2014]; Office of Environment & Heritage, Middle Harbour Creek, 27 April 2012 [online – accessed 11/11/2014]; Office of Environment & Heritage, Parramatta River, 27 April 2012 [online – accessed 11/11/2014]; Office of Environment & Heritage, Port Jackson, 27 April 2012 [online – accessed 11/11/2014]

NSW Parliamentary Research Service
6
Figure 3: Sydney Regional Environmental Plan (Sydney Harbour Catchment) 2005 – Zoning Map
The Maritime Waters zone covers the main navigation channels, public

Briefing Paper No 03/2015
7
transport, port and maritime industry activities of the Harbour and permits a wide range of waterway activities and facilities. The zone includes the important marine precincts and transport nodes of Sydney Cove, Darling Harbour, White Bay, Rozelle Bay, Blackwattle Bay, Mort Bay, Breakfast Point, Berrys Bay and parts of Balls Head Bay, Neutral Bay and Gore Cove. The main navigation channels from the Heads to Parramatta are also included in the zone.11
In order to effectively implement the Control of Naval Waters Act 1918 (Cth), the Naval Waters zone restricts the use of the waterway incompatible with naval interests. The zone applies to waters around Garden Island, Clark Island, Shark Island, Steel Point, Rushcutters Bay, Bradleys Head, Chowder Bay, Hunters Bay, Spectacle Island and Balls Head Bay.12
The Water Recreation zone gives priority to public use and access to the water through appropriate water recreation facilities, including charter and tourism facilities and commercial marinas. Generally, the adjoining land is in public ownership and is intensively used by the public (e.g. parks). The zone includes important public beaches (e.g. Balmoral Beach), commercial marina precincts (e.g. The Spit) and bays containing existing water recreation facilities and activities (e.g. parts of Hen and Chicken Bay and Canada Bay).13
The Harbour REP protects important environmental areas of the Harbour in two ways. The Environment Protection zone provides for the protection, rehabilitation and long term management of the natural and cultural values of the waterways and adjoining foreshores. The zone covers a range of areas including significant estuarine ecosystems and habitats in parts of Manly Cove and Middle Harbour, estuarine and wetlands habitats along the Parramatta River, and significant riverine environments of the Lane Cove River and Duck Creek.14
Part 6 of the Harbour REP provides for Wetland Protection Areas.15 These comprise mangroves, seagrasses, saltmarshes, sedgelands, wet meadows and mudflats and a 40m buffer zone to address movement, growth and seasonal variation. Development consent is required for certain types of development on land within a wetlands protection area that may have a detrimental impact on a wetland.
Important environmental areas of the Harbour are also protected under the Fisheries Management (General) Regulation 2010 and the Marine Estate Management Act 2014. Under the Regulation, the entire Sydney Harbour shoreline is an intertidal protected area (IPA), excluding the shoreline of North
11
Department of Infrastructure, Planning and Natural Resources, Sydney Harbour Catchment: Sydney Regional Environmental Plan 2005, June 2004, 11p
12 Ibid.
13 Ibid.
14 Ibid.
15 These Areas are identified on a map split into 16 sheets published by the NSW Department of Planning and Environment.

NSW Parliamentary Research Service
8
Harbour from Manly Point to the southern end of Forty Baskets Beach. The IPA extends from the mean high water mark to 10m seaward from the mean low water mark. Collecting seashore animals such as crabs, snails, octopus, sea urchins, pipis, mussels and oysters is prohibited, as are all fishing methods.16
The Sydney Harbour shoreline between Manly Point and the southern end of Forty Baskets Beach falls within the North Harbour aquatic reserve, established under the Marine Estate Management Act 2014. The reserve was set up to conserve important habitat and nursery areas for protected species. Line fishing for fin fish, and the use of landing nets, lobster traps and bait traps are permitted within the reserve. The collection or disturbance of habitat or all other marine life is prohibited, including collecting shellfish, pumping for worms, spearfishing and collecting dead or empty shells.17
As a drowned river valley, Sydney Harbour hosts a wide variety of habitats. These include saltmarsh, seagrass beds, mangroves, rocky reefs, rockpools, beaches and open water systems. These habitats support a diversity of organisms rarely matched in estuaries anywhere else in the world. For example, 586 species of fish have been identified in Sydney Harbour, several of which are endemic to the Harbour. In comparison, the entire coast of the United Kingdom is home to approximately 200 species.18
A number of endangered species and ecological communities are found within Sydney Harbour and its catchment. Table 2 lists those found within Sydney Harbour.19 Bicentennial Park and Newington wetlands are located in Homebush on the Parramatta River, and are listed on the Directory of Important Wetlands in Australia. The Endangered Ecological Communities and Endangered population of little penguins are listed under the Threatened Species Conservation Act 1995. The habitat of the little penguin is listed as critical habitat under the Threatened Species Conservation Regulation 2010.
16
NSW Department of Primary Industries, Factsheet: Sydney Harbour and northern beaches recreational fishing guide, March 2012, 8p; Fishing Management (General) Regulation 2010
17 Ibid.
18 Hedge, L.H. et al., Sydney Harbour: a systematic review of the science, 2014. Sydney Institute of Marine Science, Sydney, Australia, 80p; Booth, D., Natural history of Sydney’s Marine Fishes: where south meets north, pp143-153; In: Lunney, D., Hutchings, P., and Hochuli, D. (eds) The Natural History of Sydney, 2010. Royal Zoological Society of NSW, Mosman, NSW, Australia, 438p
19 For more detail on the environmental features of Sydney Harbour, see: Sydney Metropolitan Catchment Management Authority, Sydney Metropolitan Catchment Management Authority Catchment Action Plan, 2009, 224p; Hedge, L.H. et al., Sydney Harbour background report 2014, Report prepared for NSW Department of Primary Industries by the Sydney Harbour Research Program at the Sydney Institute of Marine Science, April 2014, Sydney, 105p

Briefing Paper No 03/2015
9
Table 2: Significant environmental features of Sydney Harbour20
Type Features Location
Important Wetlands
Bicentennial Park
Newington wetlands
Parramatta River
Parramatta River
Endangered Ecological Communities
NSW Coastal Saltmarsh in the New South Wales North Coast, Sydney Basin and South East Corner Bioregions
Swamp Oak Floodplain Forest of the NSW North Coast, Sydney Basin and South East Corner Bioregions
Sydney Turpentine-Ironbark Forest21
Lane Cove River, Middle Harbour & Parramatta River
Lane Cove River & Parramatta River
Parramatta River
Endangered population
Little penguin population in the Manly point area, together with its critical habitat
Port Jackson
2.1.3 Economic functions
NSW’s ports are significant trade gateways and critical links between the landside and seaside elements of the supply chain. NSW has four major ports (Port Jackson, Port Botany, Port Kembla and the Port of Newcastle), two regional ports (Eden and Yamba) and 23 coastal harbours. Half of all annual ship visits to NSW arrive in Port Jackson and Port Botany.22
As a port, Sydney Harbour has three main functions: cruise ship destination; the importation of bulk products; and hosting a naval base. The number of cruise ships coming to Sydney has more than doubled in the last four years, from 119 in 2009-10 to 259 scheduled for 2013-14.23 To cater for increased cruise ship numbers, the domestic cruise passenger terminal at White Bay was recently upgraded. An upgrade of the Overseas Passenger Terminal in Circular Quay is currently underway.24
Bulk product facilities are located at Glebe Island/White Bay and Gore Cove, Greenwich. The Shell terminal at Gore Cove, Greenwich, receives petroleum products.25 The Glebe Island/White Bay precinct contains eight working berths for the discharge of dry bulk cargo (e.g. cement, gypsum and sugar) and bulk liquids (e.g. oils and tallow). Sydney Harbour is an ideal port for the import of
20
Sources: Environment Australia, A Directory of Important Wetlands in Australia, 3rd
edition, 2001. Environment Australia, Canberra; Sydney Metropolitan Catchment Management Authority, op. cit.
21 This is also listed as a critically Endangered Ecological Community under the Environment Protection and Biodiversity Conservation Act 1999 (Cth).
22 NSW Government, NSW Freight and Ports Strategy, November 2013, 236p
23 Port Authority of NSW, Cruising, no date [online – accessed 19/11/2014]
24 NSW Government, op. cit.
25 Sydney Ports Corporation, Commercial shipping in Sydney Harbour: past, present and future, Presentation by Marika Calfas, General Manager Planning Sydney Ports Corporation, 20 August 2012. This presentation charts the rise and decline in the number of port facilities located in Sydney Harbour from 1901 to 2012.

NSW Parliamentary Research Service
10
low value, dry bulk products as it minimises the transport costs associated with their distribution throughout Sydney. Consolidation of existing and future dry bulk trade is expected to occur at Glebe Island.26
The Royal Australian Navy Fleet Base East is located at Garden Island, located to the east of the CBD on the southern side of Sydney Harbour. Fleet Base East is primarily used for ship maintenance and repair. Significant Navy future plans for Fleet Base East and Garden Island include initial home-porting with the associated System Program Offices of three new Air Warfare Destroyers and two new Landing Helicopter Dock amphibious vessels.27
The Draft Metropolitan Strategy for Sydney has nominated Sydney Harbour as one of nine key ‘city shapers’ that:
… have been identified because of their size and scale and the opportunities they present for the change and investment that are critical for the growth of Sydney. They will shape how our city functions and are critical in delivering the vision for Sydney.28
The Strategy describes the Harbour as:
… the defining feature of Sydney and one of our biggest economic advantages. It has influenced where and how Sydney has grown and attracts considerable investment from both public and private sectors.
Over the next 20 years, Sydney Harbour and its surroundings will continue to be the major economic driver for our city. It is the site of a nationally significant working port complementing Port Botany, a national and international tourist attraction, a destination of cruise ship companies and a sought-after location for investment in housing and commerce.29
Several priorities were identified for Sydney Harbour:
Protect Port Jackson and support its function as a major working port;
Recognise and protect Glebe Island and White Bay for their maritime and working harbour role and investigate the long-term future of the area with the community;
Promote the arts and culture venues around Sydney Harbour and Sydney CBD;
Develop long-term options for expanding cruise ship terminal space;
Increase opportunities for recreational access to the foreshore and waters, including those offered through harbourside property
26
NSW Government, op. cit. 27
Ibid. 28
NSW Department of Planning & Infrastructure, Draft Metropolitan Strategy for Sydney to 2013, March 2013, p.18
29 Ibid., p.21

Briefing Paper No 03/2015
11
regeneration;
Improve water quality and protect biodiversity;
Provide a new pedestrian connection between Wynyard and Barangaroo;
Improve and expand ferry services throughout Sydney Harbour and along Parramatta River; and
Provide opportunities for sustainable visitor and tourism experiences on the islands and foreshores of Sydney Harbour National Park.30
2.1.4 Modification of the estuary and its catchment
Sydney Harbour’s depth and sheltered waters made it an ideal location for European settlement. The expansion of Sydney has brought about substantial change to the Harbour. Of the original 322km of shoreline, 77km have been lost due to reclamation and infilling of intertidal areas. Approximately 49% of the shoreline has been replaced by seawalls. Natural habitat accounts for 51.1%; of this amount, mangroves account for 17.5%, horizontal rock platform for 10.5% and cobbles/boulders for 10.4%.31
11.5km2 (22%) of the total 48km2 of the estuary have been reclaimed for industrial, recreational and residential uses, mostly upstream of Sydney Harbour Bridge.32 While reclamation activities took place from European settlement up to 2002, the majority occurred in the periods 1922-55 (5.74km2), 1889-1922 (2.08km2) and 1955-78 (2.03km2).33 Approximately 100 Megatonnes of garbage, industrial waste and contaminated estuarine sediments were used throughout the Harbour for reclamation.34
The Sydney Harbour catchment has similarly been substantially modified, with approximately 80% being urbanised or industrialised (Table 4). Key land uses include residential (47.0%), roads (18.5%), commercial (8.5%) and industrial (3.9%). 15% of the catchment is made up of undisturbed forest, preserved in areas like Lane Cove National Park and Sydney Harbour National Park (Figure 4). Population density in the catchment increased from 2,392 persons/km2 in 1996 to 2,629 persons/km2 in 2006 (Table 3). In 2011, approximately 1.2 million people lived in the catchment.35
30
Ibid., p.21 31
Creese, R. et al., Mapping the habitats of NSW estuaries, Report to the Hunter Central Rivers Catchment Management Authority, Industry & Investment NSW – Fisheries Final Report Series No. 113, September 2009, 95p
32 Birch, G., op. cit.
33 Birch, G. et al., Reclamation in Sydney Estuary, 1788-2002, Australian Geographer, 2009, Vol 40(30): 347-368
34 Lee, S. and Birch, G., Sydney Estuary, Australia: Geology, anthropogenic development and hydrodynamic processes/attributes, pp 17-30, In: Wolanski, E. (ed), Estuaries of Australia in 2050 and beyond, 2014, Springer, Dordrecht, 292p.
35 Raynor, D. et al., Sydney Harbour Catchment Water Quality Improvement Plan: data compilation and review, WRL Technical Report 2011/07, prepared for the Sydney

NSW Parliamentary Research Service
12
Table 3: Land use in the Sydney Harbour catchment36
Land use Area (km2) Area (%)
Bushland 30.25 6.3%
Parkland 67.91 14.0%
Residential 227.33 47.0%
Roads 89.47 18.5%
Railway 4.08 0.8%
Industrial 18.96 3.9%
Commercial 41.08 8.5%
Water 2.97 0.6%
Rural 1.6 0.3%
Sewer 0.04 0.01%
Total 483.69 100.0%
Table 4: Land use and population density in the Sydney Harbour sub-catchments37
Catchment
Land use Population density
(persons/km2)
(2006)
Undisturbed forest
Disturbed Other Total area
Lane Cove River (km2) 22.3 73.4 2.4 98.1 1,949
(% of catchment total) 23% 75% 2% 100% -
Middle Harbour (km2) 21.7 55.0 3.6 80.3 1,783
(% of catchment total) 27% 68% 5% 100% -
Parramatta River (km
2)
26.0 228.6 11.0 265.6 2,584
(% of catchment total) 10% 86% 4% 100% -
Port Jackson (km2) 6.1 43.8 3.6 53.6 5,164
(% of catchment total) 11% 82% 7% 100% -
Sydney Harbour (km2) 76.1 400.7 20.7 497.5 2,629
(% of catchment total) 15% 81% 4% 100% -
Metropolitan Catchment Management Authority, August 2011, 77p.
36 Freewater, P. et al., Sydney Harbour Catchment Water Quality Improvement Plan, 23
rd NSW
Coastal Conference 2014, Ulladulla, NSW, 11-14 November 2014, p.10 37
Roper, T. et al., Assessing the condition of estuaries and coastal lake ecosystems in NSW, Monitoring, reporting and evaluation program, Technical report series, Office of Environment and Heritage, Sydney, June 2012, 270p. Note that the totals do not equate with the figures in Tables 1 and 3. In part, this is due to the use of different mapping methods and incomplete land-use maps.

Briefing Paper No 03/2015
13
Figure 4: Land use in the Sydney Harbour catchment38
2.2 Lane Cove River
The Lane Cove River is a 24km long tributary of the Parramatta River, which it meets at Hunters Hill, and the smallest tributary of the Harbour in terms of estuary area (3km2) and volume (12,600ML).39 It has been substantially modified since European settlement. A weir was constructed in 1938 to provide a freshwater lake at one of Sydney’s most popular picnicking spots in Lane Cove National Park.40 Dredging has removed most of the River’s sandy spits and beaches. The shoreline has been significantly modified in some areas, particularly through infilling swamps. A number of swampy areas were filled as municipal garbage dumps.41
38
Freewater, P. et al., op. cit., p.11 39
Geographical Names Board of New South Wales, Lane Cove River, 14 November 2014 [online – accessed 14/11/2014]; Butler, R., and Jha, S., Lane Cove River Coastal Zone Management Plan, Final Report, Prepared for Lane Cove River Estuary Management Committee, Hunters Hill Council, Lane Cove Council, Ryde Council and Willoughby Council by BMT WBM Pty Ltd, September 2012, Sydney, 115p
40 NSW Department of Primary Industries, Reducing the impact of weirs on aquatic habitat: NSW detailed weir review, Report to the New South Wales Environmental Trust, Sydney Metropolitan CMA Region, 2006
41 McLoughlin, L. and Wyatt, M., The Upper Lane Cove: history, heritage, bibliography, 1993. Graduate School of the Environment, Macquarie University, 204p; McLoughlin, L., Shaping Sydney Harbour: sedimentation, dredging and reclamation 1788-1990s, Australian

NSW Parliamentary Research Service
14
Covering 95km2, the River’s catchment includes seven local government areas, either wholly or partially: Lane Cove, Hornsby (partial), Hunters Hill, Ku-ring-gai (partial), Parramatta (partial), Ryde and Willoughby. Three quarters of the catchment is urbanised; undisturbed forest makes up the remainder (Table 4). Despite considerable modification to the River and its catchment, large sections of the estuary and its shoreline still remain important natural remnants. One of the most significant natural areas is Lane Cove National Park, which covers 6 km2 (7%) of the catchment.42 Other significant environmental features include mangrove, NSW Coastal Saltmarsh and Swamp Oak communities.43
2.3 Middle Harbour
Middle Harbour is a 12km long tributary of Sydney Harbour, which it meets between Grotto Point and Middle Head.44 It is perhaps the least modified tributary of Sydney Harbour, having never had a significant role as a commercial port. Instead, it has generally provided for sheltered recreational boating and fishing areas for the adjacent residential suburbs.45 Nevertheless, some modification has occurred: sand mining within the river took place between 1955 and 1982 near Roseville bridge,46 and some areas of the estuary have been reclaimed using landfill.47
Six LGAs are partially located in Middle Harbour’s catchment: Ku-ring-gai; Manly; Mosman; North Sydney; Warringah; and Willoughby. Middle Harbour has the least urbanised catchment (68%), with 21.7km2 (27%) of the total 77km2 being undisturbed forest (Table 4). Much of this forest is preserved within Garigal National Park. Other significant environmental features include subtidal reefs, mangroves, seagrass meadows and NSW Coastal Saltmarsh.48
2.4 Parramatta River
The Parramatta River is a 19km tributary of Sydney Harbour, which it meets at Balmain. It has several significant tributaries, including the Duck River, Haslams Creek and Iron Cove Creek. The river has been significantly modified since European settlement. Five weirs are situated on the river or one of its
Geographer, 2000. Vol 31(2), pp.183-208
42 Butler, R., and Jha, S., op. cit.
43 Sydney Metropolitan Catchment Management Authority, op. cit.
44 Manly Council, Clontarf/Bantry Bay data compilation & estuary processes study, Final Report, August 2007
45 Godden Mackay, Sydney and Middle Harbours Heritage Study, Final Report, Report prepared for NSW Department of Planning, July 1991
46 Souter, G., Times & Tides: A Middle Harbour Memoir, 2004. Simon & Schuster, Pymble, 278p.; McLoughlin, L., Shaping Sydney Harbour: sedimentation, dredging and reclamation 1788-1990s, Australian Geographer, 2000. Vol 31(2), pp.183-208
47 Birch, G., op. cit.
48 Hedge, L.H. et al., Sydney Harbour: a systematic review of the science, 2014. Sydney Institute of Marine Science, Sydney, Australia, 80p

Briefing Paper No 03/2015
15
tributaries.49 The river has been dredged on a number of occasions, primarily to make the river amenable to industrial activity.50 Approximately 2.9km2 of the estuary are estimated to have been reclaimed.51 This includes the largest reclamation project in Sydney Harbour at Homebush Bay, where land was reclaimed for industrial purposes using, in part, waste materials from a variety of sources.52
At 252.4 km2, the Parramatta River has the largest catchment of the Harbour tributaries. Thirteen LGAs are located at least in part in the catchment: Ashfield; Auburn; Bankstown; Blacktown; Burwood; Canada Bay; The Hills; Holroyd; Hunters Hill; Leichhardt; Parramatta; Ryde; and Strathfield. The river also has the most urbanised catchment, with 86% being classified as disturbed and only 10% as undisturbed forest (Table 4). Important environmental features include mangroves, seagrass meadows, NSW Coastal Saltmarsh, Swamp Oak and Sydney Turpentine-Ironbark Forest communities.
2.5 Port Jackson
Port Jackson is 11km long and the largest part of Sydney Harbour in terms of estuary area (29.1km2) and volume (376,400ML). Dredging took place throughout most of the 19th and 20th centuries in bays such as Sydney Cove, Darling Harbour and Woolloomooloo Bay, and out to the Heads. Dredged material was often used in reclamation projects in areas including Woolloomooloo Bay, Sydney Cove, Farm Cove, Darling Harbour, White Bay, Blackwattle Bay and Rushcutters Bay. Most of the areas of the estuary which were reclaimed were mudflats, in part because they had become ‘unhealthy’, having been filled with sewage, dead animals and offal from abattoirs.53
Port Jackson has the smallest catchment area (55.7km2) in the Harbour. Eight LGAs are partially located in its catchment: Leichhardt; Manly; Marrickville; Mosman; North Sydney; Sydney; Waverley; and Woollahra. 82% of the catchment is urbanised. This includes the City of Sydney CBD and significant current and proposed urban development projects such as Barangaroo and the Bays Precinct Urban Renewal Program. Important environmental features include seagrass meadows and subtidal rocky reefs.
2.6 Threats facing the Harbour
In light of a 2014 systematic review of the science on Sydney Harbour, the Sydney Institute for Marine Science (SIMS) identified six key threats to the
49
Cardno, Parramatta River Estuary Coastal Zone Management Plan, Prepared for the Parramatta River Estuary Management Committee, 24 June 2013, 296p
50 McLoughlin, L., Shaping Sydney Harbour: sedimentation, dredging and reclamation 1788-1990s, Australian Geographer, 2000. Vol 31(2), pp.183-208
51 Cardno, op. cit.
52 McLoughlin, L., Shaping Sydney Harbour: sedimentation, dredging and reclamation 1788-1990s, Australian Geographer, 2000. Vol 31(2), pp.183-208
53 Ibid.

NSW Parliamentary Research Service
16
biodiversity and ecosystems of the Harbour:
Metalloids, organo-metallic and metallic contamination;
Nutrients and turbidity;
Neo biota: non indigenous and novel species in Sydney Harbour;
Habitat modification;
Fishing and aquaculture; and
Climate change.54
The first two are discussed in depth in Chapters 6 and 4 respectively; the other four are briefly summarised below. Note that these threats overlap in space and time and act simultaneously. For example:
Non indigenous species interact with increased metal contamination to reduce the abundance of native species in the Harbour;
Nutrient enrichment ameliorates the effect of metal contamination. This may be masking potential effects of metals on natural systems above those currently observed; and
Climate change effects are broad scale and generally synergistic. Increased pH, for example, increases the toxicity of a variety of common contaminants.55
Further research is required to understand how these threats may interact when impacting Sydney Harbour’s natural systems.
2.6.1 Neo biota: non indigenous and novel species in Sydney Harbour
Many non-indigenous species (NIS) have become established in Sydney Harbour, including the tunicate, Pacific oyster and the green alga, Caulerpa taxifolia.56 Several other high profile marine pests, such as the Asian shore clam, Chinese mitten crab and brown mussel, are not yet established in Australia. Singapore, Auckland, Port Villa, Tauranga and Napier are ports from which there is a high likelihood that these or other NIS may be introduced.
The ecological and economic impacts of NIS are poorly understood. Impacts may include competition with native species, modification of habitat and negative effects on sediment and water column properties. Further research is also required into issues like the role of unregulated recreational vessels in
54
Coastal Zone Management Plans for the Lane Cove River and Parramatta River identify threats particular to those tributaries. A Coastal Zone Management Plan for Middle Harbour and Port Jackson is under development.
55 Hedge, L.H. et al., Sydney Harbour: a systematic review of the science, 2014. Sydney Institute of Marine Science, Sydney, Australia, p.50
56 See also: Hedge, L.H. et al., Sydney Harbour background report 2014, Report prepared for NSW Department of Primary Industries by the Sydney Harbour Research Program at the Sydney Institute of Marine Science, April 2014, Sydney, 105p

Briefing Paper No 03/2015
17
distributing NIS and the local conditions which promote the establishment and spread of these species.
2.6.2 Habitat modification
As noted earlier in this chapter, Sydney Harbour has been extensively modified by reclamation and the construction of artificial structures such as seawalls and marinas. Unfragmented natural shores support greater biodiversity than habitats fragmented by artificial structures. The make-up of flora and fauna populations found on artificial structures is dramatically different to natural habitats. These structures are also home to many non-indigenous species. Further research is required into the effects of habitat modification on biodiversity.
2.6.3 Fishing and aquaculture
Commercial fishing in Sydney Harbour was banned in 2006 due to high levels of dioxins in fish. While data on recreational fishing in NSW is limited, on-site surveys suggest that estuaries in the Sydney region, including Sydney Harbour, experience approximately twice the effort and catch of other estuaries in the State. Data on fishing in Sydney Harbour suggest a relatively healthy fishery, based on catch per effort, but it does have a higher proportion of undersized catch than other estuaries. Several species (mulloway, kingfish and snapper) listed as overfished or ‘growth overfished’ by the Department of Primary Industries are commonly caught in Sydney.57 Topics for further research include the impacts of recreational fishing and the impacts of organic pollutants on food webs, including human consumption.
2.6.4 Climate change
According to SIMS, Sydney Harbour is located in a part of the world warming faster than the global average. A number of potential impacts are likely:
Sea surface temperature rise – a rise of 3 degrees Celsius is predicted in the waters off Sydney by 2070 which could contribute to increasing water temperatures in the estuary;
Acidification – elevated atmospheric CO2 concentrations and increased CO2 dissolution into the surface ocean changes the ocean’s chemistry, including by increasing the acidity of the ocean’s surface layer;
Changes in hydrology and ocean circulation – water entering the estuary at the seaward end is becoming warmer as well as less productive, with potential implications for recruitment of organisms into the harbour and other processes;
Sealevel rise – waters along Australia’s eastern seaboard are rising in line with global averages (1.7mm per year); potential impacts include a
57
Department of Primary Industries, Status of fisheries resources in NSW 2011-12, Summary, May 2014, 10p

NSW Parliamentary Research Service
18
reduction in saltmarsh habitats; and
Increased storm surge and severe weather – estuaries with significant coastal infrastructure like Sydney Harbour are at risk of damage from severe weather events. Mangrove and seagrass habitats, which play a role in buffering coastal settlements from erosion, will become more important to maintain.
Topics for future research include harbour organism responses to elevated temperatures and changing temperature dynamics, and ocean and atmospheric linkages that influence coastal oceanography as well as watershed hydrology.

Briefing Paper No 03/2015
19
3. HISTORY OF POLLUTION IN SYDNEY HARBOUR
Since European settlement, industry has generally gravitated towards Sydney Harbour for at least one of two reasons: the use of the waterways for transport; or for access to water needed in the industrial process.58 Together with the progressive urbanisation of the catchment, the spread of industry upriver from central Sydney eventually polluted all parts of the Harbour. This chapter charts the history of pollution in Sydney Harbour, from being a receptacle of sewage, abattoir waste and industrial effluent through to the last few decades when four sources of pollution remain: contaminated sediment in the Harbour; leachate from reclaimed land; stormwater; and sewage overflows.
3.1 1788 to 1860s: Waste receptacle
Sydney Harbour, its tributaries and catchment, were polluted within years of European settlement. At first, the waters of the Harbour were the receptacle of rubbish and sewage, and its banks were stripped of natural cover.59 Industries sprang up at different points on the Harbour from the 1800s onwards.
In Port Jackson, industries were first established on the banks of Darling Harbour in about 1800. From there, they spread to Cockle, Rozelle and Blackwattle Bays. Metal foundries were the first to be set up, followed closely by tanneries.60 Whale oil processing was consigned to the north shore of the Port, due to the noxious smell. Other industries located on the north shore that required isolation included a sugar works and distillery, a kerosene refinery, and a wool washing plant.61
Balmain and Pyrmont were the peninsulas that hosted the majority of Sydney Harbour’s waterfront industry. The onset of heavy metal sediment contamination in Blackwattle Bay occurred between 1866 and 1876 – a period when metal usage in the area rapidly increased.62 Industries in the area included coppersmiths, paint manufacturers, the first Sydney Gasworks, engineering works, sawmills, breweries, a distillery, coal depots, and a boiling down works.63 The Glebe Island abattoirs were the biggest water and air polluters in the city. Built in 1860 to replace dozens of unregulated fellmongers, the abattoirs were intended to end the practice of backyard disposal of blood
58
Godden Mackay, op. cit. 59
Powell, C., A River Revived: The Parramatta, 1987. New South Wales University Press, Kensington, 102p.
60 Birch, G., op. cit.
61 Godden Mackay, op. cit.
62 Taylor, S. et al., Historical catchment changes and temporal impact on the sediment of the receiving basin, Port Jackson, New South Wales, Australian Journal of Earth Sciences, 2004. Vol 51(2): 233-246.
63 Godden Mackay, op. cit.; Coltheart, L., Between wind & water: A history of the ports and coastal waterways of New South Wales, 1997. NSW Department of Public Works and Services, Hale & Iremonger, Sydney, 208p.; Hoskins, I., Sydney Harbour: A history, 2009. UNSW Press, Sydney, 359p.

NSW Parliamentary Research Service
20
and offal down drains and sewers. Not only did it fail to do so, it compounded the problem with its own flood of effluent.64
The Lane Cove River and Middle Harbour were relatively unpolluted by the mid-1800s. Agriculture was the primary land use, together with a small timber industry and, in the case of the Lane Cove River, tanneries and small-scale sand mining.65 In contrast, it appears that the Parramatta River had become significantly polluted; the upper reaches received waste from slaughter-houses, the mental hospital, raw sewage, domestic rubbish, and drainage from farmlands. In 1849, a newspaper report described the river as follows:
The abominable filthy state of this common cesspool was reported a short time since, and the stubborn facts which were then related in connection with this public and dangerous nuisance are of too filthy a nature to be repeated. The state of the water is such at present as to destroy the fish which are floating ashore to add to the numerous dead bodies, in a state of decomposition, impregnating the air and endangering the health of the inhabitants.66
Several attempts were made to address pollution of the Harbour (see Appendix 1 for a timeline of relevant regulatory and parliamentary events). The Harbours Act 1832 prohibited the disposal from a ship of any ballast, rubbish, gravel, earth, stone, wreck or filth into the Harbour; these materials were only to be disposed of upon land where tidal water never flowed.67 In the following year, the Sydney Police Act 1833 prohibited the disposal of filth or rubbish into any watercourse, and any dead animal into any part of Sydney Cove or Darling Harbour, or their foreshores.68 And in 1849, the Sydney Slaughter-houses Act 1849 removed polluting industries (tanneries, curriers, soap boilers, tallow melters and tripe boilers) from central Sydney,69 from which the Harbour benefitted incidentally.70 Tanneries relocated to Botany, Willoughby and Parramatta.71
Despite these attempts, a Commission was appointed in 1865 to inquire into the condition of Port Jackson, with particular regard to the causes of shoaling and the effect produced by disposal of the city’s sewerage.72 The Commission criticized the City Corporation for turning the Harbour into a cesspit due to the
64
Hoskins, I., op. cit. 65
State Pollution Control Commission, Lane Cove River: The north-west passage, Paper from Environmental Education Seminar – Man and His Environment, 8 August 1978, 6p.; McLoughlin, L. and Wyatt, M., op. cit.; Souter, G., op. cit.
66 Quoted in: State Pollution Control Commission, A River Reviving: Parramatta River, Papers from Environmental Education Seminar – Man and His Environment, organized by National Trust of Australia (NSW), 20 & 28 April 1979, p.9
67 Section 2
68 Sections 13 and 37
69 Section 7
70 Powell, C., op. cit.
71 Taylor, S. et al., op. cit.
72 Broadbent, J., Transformations: Ecology of Pyrmont peninsula 1788 – 2008, 2010. Sydney, 732p.

Briefing Paper No 03/2015
21
indiscriminate discharge of sewage:
In getting rid of the street matter in the cheapest manner, they have found a convenient receptacle in the harbour and have, as it were, converted it into a large cesspit, thus doing enormous injury to that which is the most valuable
possession of the citizens.73
It recommended the construction of more efficient silt traps and two large subsiding tanks on the main sewer to intercept sand and other solid matter.74
3.2 1870s to 1910s: Industrial expansion
Sydney spread rapidly westward between 1870 and 1920. Industry gradually replaced agriculture, taking advantage of large areas of flat land on the southern shores of the Harbour, and multiple transport modes including the river, tramways and railways. By 1900, industries were located along almost all southern shores of the lower Parramatta River. From Iron Cove to Homebush Bay, industries established during this time included chemical industries, metal working, dye use, electrical and glass manufacturing, a large base metal foundry and smelter, and brickworks.75 Closer to the CBD, while some new industries were founded, such as the White Bay Power Station in the early 1900s,76 others such as the gasworks moved upriver.77
Sewage remained a problem for Port Jackson and the Parramatta River during this period. In 1877, it was reported that sewers had deposited “all the filth of the city in the harbour, rendering all business occupations upon its shores disgustingly offensive”.78 In 1892, Hen and Chicken Bay was described as a “cess pan for the drainage of Burwood and Croydon”,79 and four years later the Engineer-in-Chief of the Public Works Department described the river near Parramatta in the following terms:
The wind at the time caused filthy scum to accumulate in large quantities on the surface of the water. Moreover, putrid matter had been deposited along the bank so that with the nauseous scum and black filthy deposit, it is scarcely possible to imagine anything worse. Fermentation then takes place under the action of the sun and noxious gases are emitted which must be most injurious
73
Commission appointed to inquire into the condition of the harbour of Port Jackson, Report into the Condition of the Harbour of Port Jackson, 19 April 1866, p.8; quoted in Hoskins, I., op. cit., p.177
74 Borchardt, D., Checklist of Royal Commissions, Select Committees of Parliament and Boards of Inquiry, Part IV New South Wales 1855 – 1960, 1975, 394p.
75 Department of Environment and Planning, Parramatta River Regional Environmental Study: Open Space and Recreation, Heritage Study, 1986, Sydney, 161p.; Taylor, S. et al., op. cit.; Birch, G., op. cit.
76 Broadbent, J., op. cit.
77 Hoskins, I., op. cit.
78 Quoted in: Broadbent, J., op. cit., p.444
79 Quoted in: Powell, C., op. cit., p.37

NSW Parliamentary Research Service
22
to the health.80
The impacts of sewage disposal on the Harbour were compounded by the continued operation of the Glebe Island Abattoirs. Algal blooms and toxic fish kills were common, and Blackwattle Bay was described as being coloured ‘blood red’.81
Five inquiries were held between 1875 and 1887 on sewage and/or the abattoirs and their impacts (see Appendix 1). While recommendations on managing and limiting sewage disposal in the Harbour were made by the 1875 inquiry,82 it wasn’t until 1889 that the central city was connected to the Bondi Ocean Outfall. Balmain, Annandale, Leichhardt and Glebe were soon added, and the suburbs between Haberfield and Lidcombe were progressively added to the Southern (Malabar) System after its completion in 1889. Parramatta built a septic-tank system in 1910.83
The sewage problem was not immediately resolved upon connection of the city to the Bondi Ocean Outfall. Sydney’s bubonic plague of 1899-1900 was caused in part by “raw sewage running into the bay at Darling Harbour”.84 The Sydney Harbour Trust was established under the Sydney Harbour Trust Act 1901 to prevent the plague re-occurring. The Act also prohibited the disposal of any rubbish, earth, ashes, dirt, mud, soil, or offensive matter into the port or upon its shores.85
A series of newspaper exposés in 1879 led to the first parliamentary inquiry into the Glebe Island abattoirs.86 This inquiry recommended improved management of the abattoirs; 1882 and 1887 inquiries recommended its removal further from the city.87 In 1916, the abattoirs were moved to Homebush.88
The Lane Cove River and Middle Harbour were gradually exposed to more pollution during this period, in part due to increased urbanisation. Between 1902 and 1918, concentrations of heavy metals began to increase in the Lane Cove
80
Quoted in: State Pollution Control Commission, A River Reviving: Parramatta River, Papers from Environmental Education Seminar – Man and His Environment, organized by National Trust of Australia (NSW), 20 & 28 April 1979, p.9
81 Hoskins, I., op. cit.; Broadbent, J., op. cit.
82 Borchardt, D., op. cit.
83 State Pollution Control Commission, A River Reviving: Parramatta River, Papers from Environmental Education Seminar – Man and His Environment, organized by National Trust of Australia (NSW), 20 & 28 April 1979, 12p.
84 Andrews, G., Port Jackson 200, 1986, Frenchs Forest, Reed, p.72, quoted in: Broadbent, J., op. cit., p.556
85 Section 86. The note attached to this section in the Act states that the section provides for penalties “on throwing ballast out of vessels into the port”, rather than dealing with all pollution sources.
86 Hoskins, I., op. cit.
87 Borchardt, D., op. cit.
88 Birch, G., op. cit.

Briefing Paper No 03/2015
23
River.89 Boiling down works, a bone mill, a corn/starch factory and tanneries were operating in the catchment by this time.90
Heavy metal contaminants in Middle Harbour sediments are present in the earliest available samples, dated at 1907.91 Together with sewage farms, industries such as tanneries, an abattoir, plaster works, boiling down works, and other factories were established from 1876 onwards. Tips were also set up adjacent to waterways, from which leachate carried contaminants into the Harbour.92
3.3 1920s to 1960s: The forgotten river
Up until the 1920s, the Parramatta River used to be a popular holiday destination. It had also been a significant transport corridor. In 1928, ferry services ceased beyond Hunters Hill. These changes were due in part to technological and social changes, and in part to industrial pollution. While newspaper articles describing the polluted state of the river began to appear regularly during the 1930s, the Department of Environment and Planning argues that it henceforth became ‘The Forgotten River’:
… little attention was paid to the River despite, or perhaps because of, increasing pollution which continued to degrade its quality. Running through the heart of the metropolis the river disappeared from the public mind until the effects of pollution could no longer be ignored.93
In the 1940s, the Sydney Morning Herald published no articles on the river. Media coverage increased during the 1950s and 1960s, and in 1972-73 the Sydney Morning Herald published a series of articles on ‘The Forgotten River’.94
During this period, sewage disposal in the Harbour gradually declined with the completion of the Northern Suburbs Ocean Outfall Sewer out to Parramatta in 1930; all suburbs on the southern side were connected to ocean outfalls by the 1950s.95 However, industrial pollution of the Harbour increased substantially. Between the World Wars, large-scale manufacturing of heavy electrical equipment, large oil refineries and power supply stations were constructed
89
Taylor, S. et al., op. cit. 90
McLoughlin, L., Mangroves and grass swamps: changes in the shoreline vegetation of the Middle Lane Cove River, Sydney, 1780’s – 1880’s, Wetlands (Australia), 1987, Vol 7(1): 13-24.; Patterson Britton & Partners Pty Ltd in association with W.S. Rooney & Associates, Lane Cove River Estuary Processes Study, Report for Lane Cove Council, Hunters Hill Council, Ryde City Council, Willoughby Council and the Department of Land and Water Conservation, October 2000, 103p.
91 Taylor, S. et al., op. cit.
92 Souter, G., op. cit.; Taylor, S. et al., op. cit.
93 Department of Environment and Planning, op. cit., p.43
94 Ibid., 161p.
95 State Pollution Control Commission, A River Reviving: Parramatta River, Papers from Environmental Education Seminar – Man and His Environment, organized by National Trust of Australia (NSW), 20 & 28 April 1979, 12p.

NSW Parliamentary Research Service
24
close to the estuary, primarily along the Parramatta River.96 Companies included Shell, Plessey, Petroleum and Chemical Corporation (PACCAL), James Hardie and Orica. Timbrol (which later became Union Carbide), the primary source of the dioxins now contaminating the Harbour, commenced operations in 1928.97
The waters of the Parramatta River offered a no cost waste disposal solution, a key incentive that drew and retained industries in the area.98 Attempts were made to address pollution of the River in the 1940s and 1950s. The Pollution of Navigable Waters Regulations 194199 prohibited the dumping of animals into any navigable waterways or on their shores and the disposal of ‘refuse matter’, by owners or occupants of industrial establishments, into navigable waterways near a city, town or municipality.100 These were replaced by the Navigable Waters (Anti-Pollution) Regulations 1955. The regulations prohibited disposal of any inflammable liquid, dangerous goods, oil, tar, liquid derived from petroleum, shale or coal, or any toxic substance including pesticides.101 Maximum effluent standards were set for biochemical oxygen demand, acidity, alkalinity, sulphur, ammonia and heavy metal concentrations.102 The Maritime Services Board could set stricter standards103 or relax the standards.104 Standards could be relaxed if they could only be implemented with the utmost difficulty or at inordinate inconvenience and expense, or if the waterway would not be unduly affected, after taking into consideration the comfort, convenience and health of water users and any potential environmental impact.105
These regulations appear to have had little effect on minimising industrial effluent entering the Harbour. Heavy metal concentrations in the sediment of Parramatta River generally reached maximum concentrations by approximately 1970, after which they gradually declined.106 Media coverage gradually revived interest in the River. According to media reports, in the 1950s thick black sludge blanketed ten miles of the foreshore and in the 1960s the river was covered with green slime. Fishing was prohibited above Gladesville in 1951, fish kills were reported during the 1950s and 1960s, and swimming in the River became dangerous to human health.107 Although the waters of the River were declared
96
Birch, G., op. cit. 97
Powell, C., op. cit.; Thiess Services and Parsons Brinckerhoff, Remediation of Lednez site, Rhodes and Homebush Bay: environmental impact statement, December 2002, Rhodes, NSW.
98 Beder, S., From pipe dreams to tunnel vision: engineering decision-making and Sydney’s sewerage system, unpublished PhD Thesis, 1989, University of New South Wales, 423p.
99 NSW Government Gazette, 24 December 1941, p.4450
100 Provision for regulations of this sort were included in the Navigation Act 1901 as made.
101 Clause 3(1)(a)
102 Clause 3(3)
103 Clause 4
104 Clause 7
105 Clause 7
106 Taylor, S. et al., op. cit.
107 Powell, C., op. cit.; Beder, S., op. cit.

Briefing Paper No 03/2015
25
to be ‘virtually dead’,108 a Maritime Services Board spokesman:
… emphasised the need for being realistic. He had argued that [the] Maritime Services Board couldn’t expect businesses to shut their factories and send their workers home just because they were putting some pollutants in the water.109
Pollutants entering the Parramatta River during this period included heavy metals, petroleum hydrocarbons, asbestos, chlorinated pesticides, chlorinated benzenes, polycyclic aromatic hydrocarbons and dioxins. Some of these entered the Harbour waters directly as effluent; others via leachate from land reclaimed using contaminated materials and tips sited next to the estuary.110
Pollution of Middle Harbour and the Lane Cove River also substantially increased between the 1920s and 1960s. Tips were located in or adjacent to minor tributaries, via which leachate carried pollutants directly into the Harbour and River.111 The construction of a weir on the Lane Cove River in 1938 exacerbated the effect of pollution from tips, industry and sewage; severe and persistent deoxygenation resulted in frequent fish kills and hydrogen sulphide (rotten egg) gas blackened metal and lead paintwork on nearby homes. Redirection of industrial effluent to the sewerage system helped ameliorate these problems.112
3.4 1970 to present: A river reviving
In May 1968, a Senate Select committee began an investigation into water pollution across Australia.113 Completed in June 1970, their report drew further attention to the polluted state of the nation’s rivers, finding that some waterways were so bad that they could no longer be used except as sewers. Three main causes of pollution were identified: sewage, industrial effluents and salinity. The Senate Select committee criticised the regulation of water pollution, arguing that it bordered on the chaotic.114 The report was followed by a spate of State legislation, including the NSW Clean Waters Act 1970.115
108
Department of Environment and Planning, op. cit., p.72 109
Beder, S., op. cit., p.173 110
Thiess Services and Parsons Brinckerhoff, Remediation of Lednez site, Rhodes and Homebush Bay: environmental impact statement, December 2002, Rhodes, NSW.; Blaxell, G., The River: Sydney Cove to Parramatta, 2004, Eastwood, Brush Farm Historical Society, 294p.; Suh, J-Y. et al., Spatial distribution and source of heavy metals in reclaimed lands of Homebush Bay: the venue of the 2000 Olympic Games, Sydney, New South Wales, Australian Journal of Earth Sciences, 2004, Vol 51(1): 53-66
111 Sinclair Knight Merz, Lane Cove River estuary data compilation study, for the Lane Cove River Estuary Management Committee, November 1997, 59p.; Souter, G., op. cit.
112 State Pollution Control Commission, Interim report on the impact of wet-weather conditions on the quality of waters in Lane Cove River, 1977, Sydney, 55p.; McLoughlin, L. and Wyatt, M., op. cit.
113 Staib, R., Solving major pollution problems: a new process model, unpublished PhD Thesis, 1997, Macquarie University, Graduate School of the Environment, 189p.
114 Beder, S., op. cit.
115 Wegner, J., Sludge on tap: Queensland’s first water pollution legislation, 1944-1985,

NSW Parliamentary Research Service
26
Under development throughout the 1960s, the Clean Waters Act 1970 came into force at the end of 1972 together with its regulations. It was administered by the State Pollution Control Commission (SPCC), which was established in June 1971.116 At first, a waterway had to be classified by the Clean Waters Advisory Committee before a licence could be issued regulating disposal of pollution into the waterway. Prior to classification, disposal of pollutants into a waterway was not prohibited. This changed in 1975 with new regulations which made it an offence to discharge wastes into waters without a licence whether or not those waters were classified.117 It has been argued that initial implementation of the legislation and administrative structure was compromised; the government of the day:
… in aiming to clean up waterways without harming industry, was careful to minimise the economic penalty that would be suffered by industry and was unwilling to set down hard and fast standards for effluents that industries might not be able to meet using cheap and readily available technologies.118
While implementation of the Clean Waters Act forced some industries to install rudimentary pretreatment equipment, the primary accomplishment was to divert industrial wastes from Sydney Harbour into the ocean via the sewerage system.119
According to the State Pollution Control Commission, before 1970 there were approximately 210 sites from which poorly-treated or untreated industrial wastewater was discharged into the Parramatta River. By 1985, this number had fallen to 19 licensed sites. Disposal of untreated wastes into Port Jackson was eliminated or controlled and only three licensed discharges into the Lane Cove River remained. Water quality in Middle Harbour improved as septic tanks were replaced by reticulated sewerage.120 In order to compel industry to recycle waste or relocate away from the River, the SPCC usually withdrew licences for discharge into the Harbour as they came up for review.121
Beginning in 1985, a number of investigations were made concerning pollution in Homebush Bay – one of the most contaminated parts of Sydney Harbour. Homebush Bay was the site of a significant amount of industry and the largest reclamation project in the Harbour. Of the 11.35km2 of the Harbour reclaimed, just under a third (3.72 km2) are located at Homebush Bay.
Environment and History, 2009, Vol 15(2): 199-216
116 The State Pollution Control Commission was established under the State Pollution Control Commission Act 1970.
117 Beder, S., op. cit.
118 Ibid., p.205
119 Ibid. Over 6,000 factories were connected to the sewerage system between 1972 and 1978.
120 State Pollution Control Commission, Pollution control in Sydney’s waterways, 1986, 4p.
121 State Pollution Control Commission, A River Reviving: Parramatta River, Papers from Environmental Education Seminar – Man and His Environment, organized by National Trust of Australia (NSW), 20 & 28 April 1979, 12p.

Briefing Paper No 03/2015
27
Two large scale clean-ups of the land and/or sediment around Homebush Bay have been undertaken in the past twenty years, at Olympic Park and on the Rhodes peninsula adjacent to Homebush Bay. The clean-up of Olympic Park prior to the 2000 Sydney Olympics dealt with 400 tonnes of hazardous waste, which included heavy metals, asbestos, dioxins, and organochlorine pesticides. At a cost of $137 million, it was one of the largest remediation projects carried out in Australia.122 82,000 tonnes of material were treated in the remediation of the Rhodes peninsula, extracted from approximately 900,000 tonnes of soil and 50,000 tonnes of sediment from Homebush Bay.123 A similar set of pollutants were found on the Rhodes peninsula.124
Since the introduction of the Clean Waters Act 1970, water quality in Sydney Harbour has improved markedly. Industrial effluents have been eliminated as a source of pollution. However, four other sources of pollution remain: contaminated sediment in the Harbour; leachate from reclaimed land; stormwater; and sewage overflows.125
122
Lee, S. and Birch, G., Sydney Estuary, Australia: Geology, anthropogenic development and hydrodynamic processes/attributes, pp 17-30, In: Wolanski, E. (ed), Estuaries of Australia in 2050 and beyond, 2014, Springer, Dordrecht, 292p.
123 Thiess Services, Former Lednez/Union Carbide site & Homebush Bay remediation, no date [online – accessed 19 December 2014]
124 Thiess Services and Parsons Brinckerhoff, Remediation of Lednez site, Rhodes and Homebush Bay: environmental impact statement, December 2002, Rhodes, NSW.
125 State Pollution Control Commission, A River Reviving: Parramatta River, Papers from Environmental Education Seminar – Man and His Environment, organized by National Trust of Australia (NSW), 20 & 28 April 1979, 12p.; Lee, S. and Birch, G., Sydney Estuary, Australia: Geology, anthropogenic development and hydrodynamic processes/attributes, pp 17-30, In: Wolanski, E. (ed), Estuaries of Australia in 2050 and beyond, 2014, Springer, Dordrecht, 292p.

NSW Parliamentary Research Service
28
PART TWO – POLLUTION IN SYDNEY HARBOUR
Sydney Harbour has been significantly affected by human activities. A 2014 study of 38 NSW estuaries within 300km of the Sydney CBD categorised the Harbour as one of four ‘severely modified’ estuaries.126 The five chapters in part two of this paper set out the contemporary picture of pollution in Sydney Harbour, showing in many cases how Sydney Harbour is not only one of the most polluted estuaries in Australia but also on an international scale. Water quality issues are dealt with briefly in the first chapter. Chapters 5 to 7 deal with some of the key pollutants of concern: dioxins; heavy metals; and microplastics. The last chapter presents a report card on the state of Sydney Harbour.
4. WATER QUALITY
Water quality parameters can be divided between those which have direct toxic effects on animals and plants (e.g. pesticides and heavy metals) and those that indirectly affect ecosystems causing a problem for a specified environmental value (e.g. nutrients, turbidity and enrichment with organic matter).127 This section briefly deals with the following parameters:
Dissolved oxygen;
Total nitrogen;
Total phosphorus;
Enterococci;
Chlorophyll-a; and
Total suspended solids (TSS).128
Where possible, the data on these parameters are compared with ANZECC (2000) guidelines for water quality.
4.1 Sydney Water data
A 2011 report averaged Sydney Water data for several parameters at different sites in Sydney Harbour (Figures 5 to 9). The averaged data covered the time period of 2005 to 2008 for every site except Lane Cove Weir and Parramatta Weir, for which data was available up to 2011. Listed by sub-catchment, the
126
The other three estuaries were the Cooks River, Curl Curl Lagoon and Manly Lagoon. Factors used in categorising the estuaries included the amount of key heavy metals in the catchment and their potential toxicity, the amount of the catchment that was urbanised, and population density. Gunns, T., The development and implementation of a hierarchical assessment scheme for the management of estuaries in New South Wales, unpublished Masters Thesis, University of Sydney, 2014, 115p.
127 ANZECC & ARMCANZ, Australian and New Zealand guidelines for fresh and marine water quality, Volume 1 – The guidelines, National Water Quality Management Strategy Paper No.4, October 2000, 314pp.
128 Note that these parameters are used, together with other indicators, to put together the
Sydney Harbour report card in chapter 8 of this paper

Briefing Paper No 03/2015
29
sites are as follows:
Lane Cove River – Figtree Bridge, Sugarloaf Hill, Lane Cove Weir;
Middle Harbour – Quakers Hat Bay, Davidson Park, Tunks Park;
Parramatta River – Homebush Bay, Silverwater Bridge, Iron Cove, Duck River, Parramatta Weir; and
Port Jackson – Blackwattle Bay, Little Sirius Cove, Rushcutters Bay.
Low levels of dissolved oxygen have an adverse effect on aquatic organisms which depend on dissolved oxygen for efficient functioning. It may also produce conditions that cause sediments to release previously-bound nutrients and toxicants into the water column.129 All sites in Port Jackson had good levels of dissolved oxygen (Figure 5), while the other three sub-catchments had at least one site with dissolved oxygen levels below or just on the lower ANZECC (2000) guideline.
Figure 5: Average dissolved oxygen saturation for selected sites in Sydney Harbour compared to upper and lower ANZECC (2000) guidelines130
High levels of nutrients, particularly nitrogen and phosphorus, can result in
129
ANZECC & ARMCANZ, op. cit. 130
Raynor, D. et al., op. cit., p.25

NSW Parliamentary Research Service
30
excessive growth of aquatic plants. This may lead to problems such as toxic effects, reduction in dissolved oxygen, and changes in biodiversity.131 The ANZECC (2000) guideline of 300 micrograms per litre (µg/L) was exceeded on average by every site in Sydney Harbour bar three – Little Sirius Cove and Rushcutters Bay in Port Jackson, and Quakers Hat Bay in Middle Harbour (Figure 6). The worst sites were in the Parramatta River – Silverwater Bridge, Duck River and Parramatta Weir. This pattern of compliance with guidelines and the worst performing sites was repeated for total phosphorus, chlorophyll-a and enterococci counts (Figures 7 to 9), except in the case of chlorophyll-a where Lane Cove Weir was slightly worse than the Duck River (Figure 8).
Figure 6: Average total nitrogen concentration for selected sites in Sydney Harbour compared to ANZECC (2000) guidelines132
131
ANZECC & ARMCANZ, op. cit. 132
Raynor, D. et al., op. cit., p.28

Briefing Paper No 03/2015
31
Figure 7: Average total phosphorus for selected sites in Sydney Harbour compared to ANZECC (2000) guidelines133
Chlorophyll-a is a general indicator of plant biomass. Increased levels of chlorophyll-a may indicate excessive growth of aquatic plants. On average, sites in Sydney Harbour generally exceeded the ANZECC (2000) guideline of 4 micrograms per litre (µg/L) (Figure 8).
133
Ibid., p.29

NSW Parliamentary Research Service
32
Figure 8: Average chlorophyll-a concentration for selected sites in Sydney Harbour compared to ANZECC (2000) guidelines134
The World Health Organization recommends the use of enterococci as the single preferred faecal indicator in marine waters. These bacteria are excreted in faeces and are rarely present in unpolluted waters.135 All but three sites in Sydney Harbour exceeded the ANZECC (2000) guideline of 230 colony forming units per 100mL (cfu/100mL) for secondary contact, where secondary contact refers to sports that generally have less-frequent body contact with water, for example, boating or fishing. Primary contact refers to sports where the user comes into frequent contact with water, such as swimming or surfing. The ANZECC (2000) guideline for primary contact is 35 cfu/100mL.
134
Ibid., p.31 135
National Health and Medical Research Council, Guidelines for managing risks in recreational water, February 2008, 215pp.; NSW Office of Environment & Heritage, State of the Beaches 2013-14 – Summary and how to read this report, October 2014, 21pp.

Briefing Paper No 03/2015
33
Figure 9: Average enterococci count for selected sites in Sydney Harbour compared to ANZECC (2000) guidelines136
4.2 Water quality at Sydney Harbour beaches
Enterococci counts are also monitored by the NSW Office of Environment & Heritage, the results of which are presented in the annual State of the Beaches report. The report grades beaches from very good to very poor based on a combination of sanitary inspection (identification and rating of potential pollution sources at a beach) and microbial assessment (water quality measurements gathered over previous years). The microbial assessment uses four categories:
Category A: ≤40 cfu/100mL
Category B: 40-200 cfu/100mL
Category C: 201-500 cfu/100mL
Category D: >500 cfu/mL.137
136
Raynor, D. et al., op. cit., p.30. Note that the data included in this figure is all post-2005, while the other data dates back to 1995. The report authors only included post-2005 data for enterococci counts in order to present likely “existing” conditions. This is because Sydney Water Corporation implemented a Sewer Fix program in 2001 (see page 32 of the report).
137 NSW Office of Environment & Heritage, State of the Beaches 2013-14 – Sydney Region New South Wales, October 2014, p.117

NSW Parliamentary Research Service
34
Figure 10: Sampling sites and Beach Suitability Grades in Sydney Harbour138
In 2013-14, of 25 swimming locations in Sydney Harbour, 2 were rated very good (Nielsen Park and Watsons Bay), 17 were good, 2 were fair and 4 were poor (Figure 10). The report notes that, as a precaution, swimming should be avoided at Sydney Harbour swimming sites during and for up to three days following rainfall or if there are signs of stormwater pollution such as discoloured water or floating debris. Sources of enterococci include boats, stormwater,
138
Ibid., p.45

Briefing Paper No 03/2015
35
sewage overflows, toilet facilities and bathers.139 Recent research has found that sewage overflows are a relatively small source, contributing approximately 2% of total enterococci despite there being over 550 sewer overflows located across the catchment.140
Since 2009-10, grades for the quality of Sydney Harbour beaches have improved slightly (Figure 11). In 2009-10, 68% of beaches were graded good or very good; this rose to 76% in 2012-13 and 2013-14.
Figure 11: Beach grades for Sydney Harbour: 2009-10 to 2013-14141
While not directly comparable to Figure 11, Figure 12 demonstrates that faecal contamination of Sydney Harbour has improved in the last 20 years, with a marked improvement from 2001-02 onwards.
139
Ibid. 140
Freewater, P. et al., op. cit. 141
Sources: State of the Beaches annual reports 2009-10 to 2013-14
0
2
4
6
8
10
12
14
16
18
20
2009-10 2010-11 2011-12 2012-13 2013-14
Very poor
Poor
Fair
Good
Very good

NSW Parliamentary Research Service
36
Figure 12: Historical trends in water quality for Sydney Harbour beaches142
The beaches covered by the State of the Beaches reports do not include most beaches in the Parramatta River. At the end of 2014, the Parramatta River Catchment Group launched its Our Living River campaign. The mission is to make the Parramatta River swimmable again by 2025 (Figure 13). As of the end of 2014, swimming was not recommended at the majority of beaches on the Parramatta River.
142
NSW Office of Environment & Heritage, Historical trends in water quality, 26 February 2015 [online – accessed 9 March 2015]

Briefing Paper No 03/2015
37
Figure 13: Swimming in the Parramatta River143
4.3 Nutrients and total suspended solids in stormwater entering the Harbour
Research published in 2010 modelled the amount of nutrients and suspended sediment entering Sydney Harbour. On average, every year 475 tonnes of total nitrogen, 63.5 tonnes of total phosphorus and 34,300 tonnes of total suspended solids enter Sydney Harbour via stormwater.144 This is equivalent to a rate of kg per km2 per year of 990, 132 and 71,384 respectively (Table 5). Sydney Harbour has substantially higher nutrient yields than other Australian urban areas, most probably due to the high level of urbanisation (86%). Sydney Harbour generally receives less nutrients per year than catchments in Europe and the USA.
143
Parramatta River Catchment Group, Locations, 2014 [online – accessed 21 January 2015] 144
Birch, G. et al., Modelling nutrient loads to Sydney estuary (Australia), Environmental Monitoring & Assessment, 2010, Vol 167(1-4): 333-348

NSW Parliamentary Research Service
38
Table 5: Nutrient and total suspended solids entering Sydney Harbour, comparison with Australian and international catchments145
Catchment
Total nitrogen yield
(kg/km/year)
Total phosphorus
yield
(kg/km/year)
Total suspended
solids
(kg/km/year)
% of catchment developed
Australian estuaries
Sydney Harbour 990 132 71,384 86
Port Phillip Bay 282/289* 65/53* na 11
Botany Bay 460 49 na 40
Regional zones
North Sea 1,450 117 na na
NW Europe 1,300 101 na na
NE coast USA 1,070 139 na na
NE Canadian 76 4.5 na na
47 Danish estuaries 2,400 112 na 10
Selected international estuaries
River Tamar, UK 3,890 140 na minor
Charlotte Harbour, USA 230 na na 7
Isle of Wight Bay, USA 740 na na 52
Neuse, USA 1,950 211 na 9
St Martin River, USA 3,400 na na na
Scheldt, France 17,220 na na 46
* The two Port Phillip Bay figures have been sourced from two different studies.
Most pristine catchments are considered to have a total nitrogen (TN) yield of 80–200 kg/km/year, moderately modified catchments have 500–2,000 kg/km/year and heavily influenced catchment have >10,000 kg/km/year, whereas the average total phosphorus (TP) yield for the UK is 152 kg/km/year. Sydney Harbour is therefore moderately influenced by TN discharge and receives a below average TP discharge.146
Nutrient load into Sydney Harbour was divided into three categories according to rainfall levels: base flow (<5 mm per day); moderate flow (5-50 mm per day); and high flow (>50 mm per day). The majority (60%) of the annual pollutant load is delivered during moderate flow conditions (5-50 mm per day), and only 2% of the annual load enters the Harbour during base flow conditions (<5 mm per day).147
145
Table adapted from: Ibid. p.344 146
Ibid. 147
Ibid.

Briefing Paper No 03/2015
39
5. DIOXINS
5.1 What are dioxins? Types, measurement, toxicity and sources
The name “dioxins” often refers to three families of compounds, the first two of which are structurally and chemically related:
Polychlorinated dibenzo-p-dioxins (PCDDs or dioxins);
Polychlorinated dibenzofurans (PCDFs or furans); and
Certain dioxin-like polychlorinated biphenyls (PCBs) with toxic properties similar to dioxins.
Each of these three families of compounds has a number of variants, or congeners – chemical substances related to each other by origin, structure or function. PCDDs consist of 75 congeners, of which 7 have high toxic potential; PCDFs consist of 135 congeners, of which 10 have high toxic potential; and PCBs consist of 209 congeners, 12 of which have high toxic potential.148 The most toxic of these, and one of the most toxic chemicals ever tested, is 2,3,7,8-tetrachlorodibenzo-p-dioxin (2,3,7,8-TCDD).149
2,3,7,8-TCDD is used as a toxicity reference compound, being given a toxicity value of 1. The other 28 toxic dioxins are each assigned a toxicity value relative to that of 2,3,7,8-TCDD. This allows for combinations of dioxins in seafood, sediment or water to be expressed in a single toxicity value, the 2,3,7,8-TCDD Toxicity Equivalence Concentration (TEQ).150 TEQs have been through several iterations. Prior to 1998, toxic equivalence was expressed using criteria from the North Atlantic Treaty Organization and Committee on the Challenges of Modern Society (NATO/CCMS) toxicity factors (I-TEQ). After 1998, the World Health Organization toxicity factors have generally been adopted (WHO-TEQ). The WHO-TEQ changed the toxicity value of 4 of the 17 PCDDs (dioxins) and PCDFs (furans), and took into account the toxicity of the 12 dioxin-like PCBs.151 2 of the PCDDs with modified toxicity values comprise a substantial proportion of the dioxins found in Sydney Harbour – 1,2,3,4,6,7,8,9 octachlorodibenzo-p-
148
Birch, G. et al., The source and distribution of polychlorinated dibenzo-p-dioxin and polychlorinated dibenzofurans in sediments of Port Jackson, Australia, Marine Pollution Bulletin, 2007, Vol 54(3): 295-308; World Health Organization, Dioxins and their effects on human health, Fact sheet N
o225, Updated June 2014, [online – accessed 23 January 2015]
149 Lee, S. and Birch, G., Sydney Estuary, Australia: Geology, anthropogenic development and hydrodynamic processes/attributes, pp 17-30, In: Wolanski, E. (ed), Estuaries of Australia in 2050 and beyond, 2014, Springer, Dordrecht, 292p.
150 Gatehouse, R., Ecological risk assessment of dioxins in Australia, National Dioxins Program Technical Report No. 11, Australian Government Department of the Environment and Heritage, 2004, Canberra, 146p.
151 Thiess Services and Parsons Brinckerhoff, Remediation of Lednez site, Rhodes and Homebush Bay: environmental impact statement: Technical Paper 5 – Detailed human health and ecological risk assessment of Homebush Bay sediments, December 2002, Rhodes, NSW, p.97

NSW Parliamentary Research Service
40
dioxin (OCDD) and 1,2,3,4,6,7,8-heptachlorodibenzo-p-dioxin (HpCDD).152 Their toxicity values were revised downwards from 0.001 to 0.0001 and 0.1 to 0.01 respectively. A 2005 updated version of the WHO-TEQ slightly modified the toxicity value of 14 of the 29 dioxins. In this paper, all TEQ values are 1998 WHO-TEQ values unless otherwise stated.
Dioxins are one of 23 persistent organic pollutants (POPs) listed in the 2001 Stockholm Convention to which Australia is a signatory. Others include chemicals also found in Sydney Harbour such as DDT (see further chapter 6.2 of this paper). Dioxins are listed under Annex C of the Convention, under which signatories are required to take measures to reduce the unintentional releases of dioxins with the goal of continuing minimization and, where feasible, ultimate elimination.
Dioxins are chemically stable, resist metabolism and are fat soluble, accumulating in fatty tissue. The release of stored dioxins from fatty tissue into the body’s circulation is extremely slow, and limits the rate of metabolism by the liver and subsequent excretion. Environmental persistence is a key characteristic of dioxins, persistence being defined as resistance to biological and chemical breakdown in the atmospheric, aquatic or terrestrial environment. Persistence is most commonly measured in half-life time – the time it takes for half of the chemical to be degraded. The average half-life of dioxins is 7 years, the shortest being 3.7 years and the longest 50 years.153
Short-term exposure of humans to high levels of dioxins may result in lesions and altered liver function. Long-term exposure has been linked to impairment of the immune system, the developing nervous system, the endocrine system and reproductive functions. 2,3,7,8-TCDD has also been classified as a “known human carcinogen”.154 Studies on animals have found that, depending on the duration of exposure, dose and type of animal, adverse responses include:
Acute lethality;
Reproductive impairment;
Developmental abnormalities in young;
Endocrine and immune dysfunction;
Neurological dysfunction;
Wasting syndrome; and
152
Birch, G. et al., The source and distribution of polychlorinated dibenzo-p-dioxin and polychlorinated dibenzofurans in sediments of Port Jackson, Australia, Marine Pollution Bulletin, 2007, Vol 54(3): 295-308
153 Legislative Council Standing Committee on State Development, Redevelopment and remediation of the Rhodes Peninsula, June 2002, 138pp. Note that half-life figures also depend on the environment in which the dioxin is located. For example, estimates of the half-life of 2,3,7,8-TCDD on the soil surface range from 9 to 15 years, whereas the half-life in subsurface soil may range from 25 to 100 years. Source: Gatehouse, R., op. cit.
154 World Health Organization, op. cit.

Briefing Paper No 03/2015
41
Edema and haemorrhaging.155
PCDDs and PCDFs are unintentional by-products of combustion (both natural such as bushfires and anthropogenic such as waste or fuel incineration and operation of the internal combustion engine) and certain types of chemical manufacturing and industrial processes. These include the manufacture of industrial and agricultural chemicals containing chlorinated phenols (e.g. wood preservatives and pesticides) and during combustion of materials treated with chlorophenols. Elemental chlorine bleaching of pulp and paper is another type of industrial process that may also produce PCDDs and PCDFs.156
Up until the 1970s, PCBs were produced for use in a range of industrial and commercial applications because of their low flammability, chemical stability, high boiling point and electrical insulating properties. These applications included; use in electrical, heat transfer, and hydraulic equipment; as plasticisers in paints, plastics and rubber products; and in pigments, dyes and carbonless copy paper.157
In aquatic environments, dioxins adsorb strongly to dissolved or particulate organic carbon suspended in the water column. Dioxins adsorbed to particulate matter tend to rapidly redistribute by settling out to bottom sediments. Dioxins adsorbed to organic matter in soil may enter aquatic environments via runoff and soil erosion.158
5.2 History of dioxins in Sydney Harbour: Agent Orange manufacturing in Rhodes and fishing bans
In 1928, Timbrol began manufacturing timber preservatives on the Rhodes Peninsula. In 1957, Timbrol was acquired by Union Carbide Australia, which was renamed Zendel Industries in 1988 and Lednez Industries in 1991.159 The name changes followed the Bhopal gas disaster at the Union Carbide India pesticide plant in 1984.160
A variety of chemicals were manufactured by Timbrol/Union Carbide between 1928 and 1985, when production ceased (Table 6). Research has shown that the dioxins in Sydney Harbour are primarily by-products of the production of two chemicals: pentachlorophenol (PCP) and 2,4,5-trichlorophenoxyacetic acid (2,4,5-T). PCP was used in the manufacture of pesticides and as a wood preservative by the timber industry. PCP typically contains elevated levels of
155
Gatehouse, R., op. cit. 156
Ibid. 157
Ibid. 158
Ibid. 159
Thiess Services and Parsons Brinckerhoff, Remediation of Lednez site, Rhodes and Homebush Bay: environmental impact statement, December 2002, Rhodes, NSW
160 McGrath, C., Mending holes in the green safety net, Precedent, November/December 2012, Issue 113: 4-8

NSW Parliamentary Research Service
42
two dioxins – OCDD and HpCDD.161
Table 6: Chemicals manufactured at the Union Carbide/Lednez site162
Years Chemicals
1928-1986 Timber products: koppers and coal tars
1932-1985 Xanthates
1940-1961 Aniline and nitrobenzene
1942-1971 Synthetic phenol
1947-1985 Chlorophenol and chlorobenzenes
1949-1976 2,4,5-T and 2,4-D herbicides
1952-1976 Chlorine gas
1955-1968 DDT and DDD insecticides
1960-1976 Bisphenol-A (DPP)
1964-1976 Phenol-formaldehyde resins and moulding components
Between 1949 and 1976, Union Carbide manufactured 2,4,5-trichlorophenoxyacetic acid (2,4,5-T) and 2,4-dichlorophenoxyacetic acid (2,4-D) herbicides, the two ingredients for Agent Orange that was used as a defoliant during the Vietnam War. 2,4,5-T herbicide production is characterised by elevated levels of 2,3,7,8-TCDD, the most toxic dioxin.163
Prior to 1970, waste including dioxins from Union Carbide chemical manufacturing was disposed at a landfill in Homebush.164 Contaminated soils were also used during several stages of land reclamation in Homebush Bay. Dioxins entered the waters and sediment of Homebush Bay via overflow during reclamation, stormwater and factory wastewater. After 1970, wastewater was intercepted to comply with the Clean Waters Act 1970.165
A number of studies have been conducted into the dioxin contamination of the soils and sediments of Homebush Bay.166 As a result of the first studies
161
Birch, G. et al., The source and distribution of polychlorinated dibenzo-p-dioxin and polychlorinated dibenzofurans in sediments of Port Jackson, Australia, Marine Pollution Bulletin, 2007, Vol 54(3): 295-308
162 Adapted from: Ibid. p306. For a substantial timeline of the industrial and remediation history of Rhodes Peninsula, see: City of Canada Bay, The industrial and remediation history of the Rhodes Peninsula 1911-2012, 11 September 2014 [online – accessed 23 January 2015]
163 Birch, G. et al., The source and distribution of polychlorinated dibenzo-p-dioxin and polychlorinated dibenzofurans in sediments of Port Jackson, Australia, Marine Pollution Bulletin, 2007, Vol 54(3): 295-308
164 Sydney Olympic Park Authority, Treatment of hazardous chemical wastes, Sydney Olympic Park, Project Summary Report to NSW Environment Protection Authority, May 2003, 267pp.
165 Thiess Services and Parsons Brinckerhoff, Remediation of Lednez site, Rhodes and Homebush Bay: environmental impact statement: site history, Technical Paper 2, December 2002, Rhodes, NSW.
166 See: Thiess Services and Parsons Brinckerhoff, Remediation of Lednez site, Rhodes and Homebush Bay: environmental impact statement, December 2002, Rhodes, NSW;

Briefing Paper No 03/2015
43
conducted in the late 1980s, the State Pollution Control Commission implemented a total fin fishing ban in Homebush Bay in 1989. This was extended to a commercial fishing ban upstream of the Gladesville Bridge in 1990.
In 1997, the NSW Government committed to remediating dioxin contamination in Homebush Bay. The Government acquired the Union Carbide/Lednez site and commissioned an Environmental Impact Statement (the Lednez EIS). The proposed remediation of the Union Carbide/Lednez site, parts of Homebush Bay and the adjacent Allied Feeds site was subject to a Parliamentary Inquiry and a Commission of Inquiry.167 The remediation projects went ahead in 2005 and were completed in March 2011.168
The remediation of the Union Carbide/Lednez site and parts of Homebush involved excavation of approximately 450,000 of fill and treatment of up to 200,000 m3 of soil on the Rhodes Peninsula. 27,000 m3 of sediment was excavated from Homebush Bay, 10,000 m3 of which was treated. Only the most contaminated sediments of the Bay were remediated by removal of the upper 0.5m of sediment and replacement with clean fill.169 Completed at the cost of $21 million,170 as of 2014 the effectiveness of the remediation program was unknown.171
5.3 Dioxins in fish
Following a preliminary study into dioxins in prawns caught in Parramatta River at the end of 2005, a full ban on commercial fishing in all of Sydney Harbour was introduced in February 2006 (Table 7).172 The preliminary study was followed by further prawn sampling as well as tests on bream as a representative of a bottom feeding finish species likely to contain higher levels
Department of the Environment, National Dioxins Program series of reports, 2004-2005 [online – accessed 23 January 2015]; Birch, G. et al., Modelling nutrient loads to Sydney estuary (Australia), Environmental Monitoring & Assessment, 2010, Vol 167(1-4): 333-348.
167 Cleland, K., Proposed remediation of the former Allied Feeds site, Rhodes, Report to the Honourable Craig Knowles, by the Commissioners of Inquiry for Environment and Planning, July 2003, 123pp.
168 Thiess Services, Rhodes Remediation Projects: Project timelines, no date [online – accessed 23 January 2015]
169 Birch, G. et al., Modelling nutrient loads to Sydney estuary (Australia), Environmental Monitoring & Assessment, 2010, Vol 167(1-4): 333-348
170 Birch, G. et al., The use of vintage surficial sediment data and sedimentary cores to determine past and future trends in estuarine metal contamination (Sydney estuary, Australia), Science of the Total Environment, 2013, Vol 454-455: 542-561
171 Lee, S. and Birch, G., Sydney Estuary, Australia: Geology, anthropogenic development and hydrodynamic processes/attributes, pp 17-30, In: Wolanski, E. (ed), Estuaries of Australia in 2050 and beyond, 2014, Springer, Dordrecht, 292p
172 See the following for a brief overview of commercial fishing in Sydney Harbour prior to the ban: Hedge, L.H. et al., Sydney Harbour background report 2014, Report prepared for NSW Department of Primary Industries by the Sydney Harbour Research Program at the Sydney Institute of Marine Science, April 2014, Sydney, 105p

NSW Parliamentary Research Service
44
of dioxins.
Table 7: Fishing bans in Sydney Harbour and public health reports173
Date Event
1989 Fin fishing ban in Homebush Bay
1990 Commercial fishing ban upstream of the Gladesville Bridge
November 2005 NSW Interdepartmental Committee on Contaminants in Fish conducts study into dioxins in seafood caught in Parramatta River
3 December 2005 Temporary ban on commercial and recreational prawn fishing in Sydney Harbour
24 January 2006 Temporary three-month ban on commercial fishing in Sydney Harbour
9 February 2006 Permanent commercial fishing ban in Sydney Harbour
24 February 2006 Dioxins in seafood in Port Jackson and its tributaries (NSW Food Authority)
23 May 2006 Interim report from expert panel considering the four blood dioxin levels for Sydney Harbour fishermen and their family members reported by ABC’s 7.30 report (NSW Health)
June 2006 Dioxins in prawns and fish from Sydney Harbour: An assessment of the public health and safety risk (Food Standards Australia New Zealand)
3 August 2006 Supplementary report from the expert panel considering the blood dioxin levels for Sydney Harbour fishermen and their family members (NSW Health)
9 December 2006 Dietary advice for recreational fishers in Sydney Harbour released
March 2007 Dioxins in seafood from Sydney Harbour: A revised assessment of the public health and safety risk (Food Standards Australia New Zealand)
19 December 2007 Further tests lead to changed dietary advice for recreational fishers
In 2002, the National Health and Medical Research Council adopted an Australian Tolerable Monthly Intake (TMI) of dioxins of 70pg (picograms or 1 trillionth of a gram) TEQ/kg bodyweight as an intake which should be adequately protective of the general population with respect to the effects of dioxins.174 While there is no national Action Level175 for dioxins in food in Australia, the NSW Food Authority applied a temporary Action Level of 6pg
173
Sources: NSW Food Authority, Authority alerts Sydney Harbour fishers, Foodwise, March 2006, Vol 2, 8pp.; Birch, G. et al., Modelling nutrient loads to Sydney estuary (Australia), Environmental Monitoring & Assessment, 2010, Vol 167(1-4): 333-348.
174 This TMI was first recommended by the Joint FAO/WHO Expert Committee on Food Additives in 2001. Also in 2001, the European Union Scientific Committee on Food adopted a Tolerable Weekly Intake of 14pg/kg bodyweight, which approximates to a TMI of 60pg/kg bodyweight.
175 The aim of an Action Level is to trigger an investigation of the reasons for high levels of dioxins. This approach, as opposed to a stringent Maximum Level approach that sets an absolute cut-off limit for consumer protection, has the advantage of focusing on product averages thus allowing enforcement agencies to take a holistic approach when a problem is identified.

Briefing Paper No 03/2015
45
TEQ/g fresh weight in seafood in its investigation.176 This Action Level was supported by later studies conducted by Food Standards Australia New Zealand (Table 7).
As part of the NSW Food Authority’s 2006 investigation, 36 composite prawn samples were taken across seven sites in Sydney Harbour (Figure 14). The content of dioxins in the samples ranged from 3.1-22.9pg TEQ/g fresh weight, with an average of 11.3pg TEQ/g fresh weight. 2,3,7,8-TCDD was the most common dioxin found. The majority of samples exceeded the temporary Action Level of 6pg TEQ/g fresh weight.
Figure 14: Levels of dioxins recorded in 36 composite prawn samples harvested from 7 different locations in Sydney Harbour177
176
The NSW Food Authority noted that the European Union has a Maximum Level for fish and fish products of 4pg TEQ/g fresh weight for dioxins, excluding dioxin-like PCBs.
177 NSW Food Authority, Dioxins in seafood in Port Jackson and its tributaries, Report of the Expert Panel, 24 February 2006, p.15

NSW Parliamentary Research Service
46
40 composite bream samples were taken from 8 sites in Sydney Harbour (Figure 15). The content of dioxins in the samples ranged from 6.6-141pg TEQ/g fresh weight, with an average of 29.1pg TEQ/g fresh weight. The average fell to 19.5pg TEQ/g fresh weight when Homebush Bay was excluded due to its high levels of contamination. 2,3,7,8-TCDD was again the most common dioxin except in one case, where a dioxin-like PCB compound was the most common toxin. All samples exceeded the temporary Action Level of 6pg TEQ/g fresh weight.
The NSW Food Authority Expert Panel concluded by noting in part that:
The research findings suggest widespread contamination of dioxins in seafood caught in Sydney Harbour;
Levels of dioxins in prawns and bream are equivalent to or higher than levels found in some seafood caught from other highly contaminated areas in the world; and
On average more than one 150 gram serve per month of fish, or two 150 gram serves of prawns, from Sydney Harbour would result in consumers exceeding the recommended TMI for dioxins.
Figure 15: Levels of dioxins recorded in 40 composite bream samples harvested from 8 different locations in Sydney Harbour178
178
Ibid., p.16

Briefing Paper No 03/2015
47
In the 12 months after the ban’s commencement, research was conducted into the health risks of eating fish from Sydney Harbour, the level of dioxins in a number of additional seafood species, and the exposure of Sydney Harbour fishermen and their families to dioxins in seafood sourced from Sydney Harbour (Table 7). The studies on fishermen and their families found that their dioxin levels were substantially higher than south east urban Australian background levels. However, not enough research had been conducted at the time to know whether the fishermen and their families were likely to experience negative health effects.179
Recreational fishing is permitted in most areas of Sydney Harbour, although it is banned in the Duck River and Homebush Bay for public health reasons.180 Consumer dietary advice for recreational fishers, last updated in December 2007, recommends that no seafood caught west of the Bridge be consumed, and that generally no more than 150 grams per month of seafood caught east of the Bridge be consumed. Based on research conducted in 2006/07, more specific dietary advice is provided on the recommended maximum consumption of popular species (Table 8). Despite the consumer dietary advice, it appears that some recreational fishers still eat fish caught in places like the Lane Cove River and east of Cockatoo Island.181
179
NSW Health, Supplementary report from the expert panel considering the blood dioxin levels for Sydney Harbour fishermen and their family members, 3 August 2006, 9p. The first study conducted by the ABC can be found here: Symons, R. et al., Sydney Harbour fishermen and families: elevated levels of dioxins resulting from consumption of TCDD-contaminated fish, Organohalogen Compounds, 2006, Vol 68: 375-378. See also the NSW Health Rhodes Serum Dioxin Study, which investigated dioxin levels in people living on the Rhodes Peninsula adjacent to the area remediated due to its contamination by pollutants including dioxins. According to the final report, the remediation did not expose the local residents in the study to levels of dioxin that would be expected to impact upon their health.
180 NSW Department of Primary Industries, Factsheet: Sydney Harbour and northern beaches recreational fishing guide, March 2012, 8p
181 ABC News, Anglers ignoring Sydney Harbour health warnings, fishing hotspots indicate, 16 August 2014

NSW Parliamentary Research Service
48
Table 8: Recommended maximum intake of popular species and their dioxin concentration findings182
Seafood
Dioxin concentration (pg TEQ/g) Recommended max. intake
Sydney Harbour average
West of Harbour Bridge
East of Harbour Bridge
Number of 150 gram
serves
Amount per month
Crustacea 11 13 6 - -
Prawns 12 13 6 4 per month 600g
Crabs 9 10 5 5 per month 750g
Fish 25 37 11 - -
Bream 27 31 18 1 per month 150g
Dusky Flathead 4 5 2 12 per month 1800g
Fanbelly Leatherjacket 1 1 1 24 per month 3600g
Flounder 6 9 2 12 per month 1800g
Kingfish 2 n/a 2 12 per month 1800g
Luderick 11 19 2 12 per month 1800g
Mulloway 21 21 n/a - -
Sand Whiting 3 4 3 8 per month 1200g
Sea Mullet 99 108 70 1 every 3 months
50g
Silver Biddie 41 54 23 1 per month 150g
Silver Trevally 29 42 5 5 per month 750g
Tailor 38 78 24 1 per month 150g
Trumpeter Whiting 4 6 2 12 per month 1800g
Yellowtail Scad 11 29 3 8 per month 1200g
Molluscs - - - - -
Squid 17 24 6 4 per month 600g
182
Sources: Food Standards Australia New Zealand, Dioxins in seafood from Sydney Harbour: A revised assessment of the public health and safety risk, Technical Report Series No. 44, March 2007, p.6; NSW Food Authority, Sydney Harbour seafood, 20 September 2013 [online – accessed 29 January 2015]. Note that the advice in the table is provided where only one species is being eaten in the month. Each guideline number of serves is therefore the recommended total intake for the month. For example eating 150 grams of Bream and 600 grams of prawns in one month would exceed the recommended intake.

Briefing Paper No 03/2015
49
5.4 Dioxins in Sydney Harbour: where it is and what can be done
As noted previously, Homebush Bay is the primary source of the dioxins in Sydney Harbour.183 Dispersal of dioxins throughout the rest of Sydney Harbour is likely attributable to three processes:
(1) Aerial deposition during the period when dioxins were produced as a by-product of combustion during pesticide production at Rhodes Peninsula;
(2) Diffuse and point source stormwater runoff generated by periods of heavy rain may transport dioxin-laden sediment from the contaminated Homebush Bay foreshore into the Bay where they travel upstream and downstream as part of the fresh-water plume on top of marine water; and
(3) Newly deposited sediments can be resuspended by wind-driven waves, after which they may be transported to other parts of the Harbour via spring tidal currents.184
Following identification of relevant international sediment quality guidelines for dioxins, this section summarises the three most recent studies of dioxins in Sydney Harbour before outlining what may be done to address the problem.
5.4.1 International sediment quality guidelines for dioxins
Although there are no Australian sediment quality guidelines against which dioxin concentrations in Sydney Harbour can be evaluated, international guidelines can provide benchmarks for this purpose (Table 9). Guideline values range from 0.0011 to 210pg TEQ/g, depending on factors such as the organism being exposed to the dioxins and the level of effects expected at a certain concentration. Background values ranged from 2 to 5pg TEQ/g, a finding similar to other studies.185 Note that the guidelines use 2005 WHO-TEQ values.186
183
Birch, G. et al., The source and distribution of polychlorinated dibenzo-p-dioxin and polychlorinated dibenzofurans in sediments of Port Jackson, Australia, Marine Pollution Bulletin, 2007, Vol 54(3): 295-308
184 Lee, S. and Birch, G., Sydney Estuary, Australia: Geology, anthropogenic development and hydrodynamic processes/attributes, pp 17-30, In: Wolanski, E. (ed), Estuaries of Australia in 2050 and beyond, 2014, Springer, Dordrecht, 292p.
185 Birch, G. et al., The source and distribution of polychlorinated dibenzo-p-dioxin and polychlorinated dibenzofurans in sediments of Port Jackson, Australia, Marine Pollution Bulletin, 2007, Vol 54(3): 295-308
186 US EPA, Memorandum: Compilation and discussion of sediment quality values for dioxin, and their relevance to potential removal of dams on the Klamath River, 13 January 2010, 10p.

NSW Parliamentary Research Service
50
Table 9: International dioxin sediment quality guidelines187
Basis Country Intent Sediment guideline
(pg TEQ/g) Comments
Background USA - 2 – 5 San Francisco Bay
Background USA - 5.3 11 non-impacted urban and rural lakes
Risk-based USA Protection of recreational fishers
15 -
Risk-based USA Protection of human consumers
0.0011/1.1
Threshold for potential risk to subsistence consumers/ Threshold for potential risk to the general population of consumers
Effects-based
USA Protection of ecological receptors
60/100 (fish)
2.5/25 (mammals)
21/210 (birds)
Threshold for low level risk/ Threshold for high level risk
Effects-based
USA Protection of wildlife consumers
0.052/1.4 (mammals)
0.7/3.5 (birds)
No Observed Adverse Effect Level/Low Observed Adverse Effect Level
Effects-based
USA Protection of fish
0.56
Level at and below which chemicals would not be expected to accumulate in tissues of fish or other aquatic organisms above acceptable levels
Effects-based
Canada Protection of
benthos188
0.85/21.5
Threshold Effect Level/ Probable Effect Level
Effects-based
Holland Protection of ecosystem
13
Level at which, with reasonable certainty, at least 95% of species will not experience adverse effects
Table 9 contains three values related to different human consumers, the first two of which came from the same study: 0.0011pg TEQ/g for subsistence consumers; 1.1pg TEQ/g for the general population; and 15pg TEQ/g for recreational fishers. The last two are more relevant to Sydney Harbour. The threshold for low level risk to wildlife values range from 0.56pg TEQ/g to 60pg
187
US EPA, Interim report on data and methods for assessment of 2,3,7,8-tetrachlorodibenzo-p-dioxin risks to aquatic life and associated wildlife, March 1993, 159p.; Canadian Council of Ministers of the Environment, Canadian sediment quality guidelines for the protection of aquatic life: Polychlorinated dioxins and furans (PCDD/Fs), 2001, 6p.; Hurst, M.R. et al., Determination of dioxin and dioxin-like compounds in sediments from UK estuaries using a bio-analytical approach: chemical-activated luciferase expression (CALUX) assay, Marine Pollution Bulletin, 2004, Vol 49(7-8): 648-658; US EPA, Memorandum: Compilation and discussion of sediment quality values for dioxin, and their relevance to potential removal of dams on the Klamath River, 13 January 2010, 10p.
188 The community of organisms which live on, in or near the seabed

Briefing Paper No 03/2015
51
TEQ/g; the threshold for high level risk to wildlife values range from 21.5pg TEQ/g to 210pg TEQ/g.
5.4.2 Remediation of Lednez site, Rhodes and Homebush Bay (2002)
The 2002 Environmental Impact Statement (the Lednez EIS) on the proposed remediation of the Union Carbide/Lednez site and parts of Homebush Bay published dioxin levels in the sediments and water of Homebush Bay and the groundwater under the Lednez site. The EIS uses I-TEQ values, rather than WHO-TEQ (see further section 5.1 of this paper). A Technical Paper189 produced for the EIS by Sinclair Knight Merz appears to argue that, in this case, the I-TEQ values contained in the EIS are generally comparable with WHO-TEQ values.190
Sediments in Homebush Bay were tested in a grid pattern alongside the eastern shore of the Bay at three depths (Table 10; Figure 16). At the surface level, readings ranged from 90 to 154,000pg I-TEQ/g, with a mean of 7,600pg I-TEQ/g. Note that the mean value at the 900-1,000mm depth is probably skewed high, with much fewer samples taken at this depth together with two very high readings.191 The estimated bay-wide average dioxin sediment concentration was 3,014pg I-TEQ/g.192
Table 10: Dioxin sediment concentrations in the part of Homebush Bay adjacent to the Lednez site (pg I-TEQ/g)193
Sediment depth Minimum Maximum Mean
Surface (0-100mm) 90 154,000 7,600
Subsurface (400-500mm) 20 380,000 7,930
Subsurface (900-1,000mm) 50 238,000 25,680
189
Thiess Services and Parsons Brinckerhoff, Remediation of Lednez site, Rhodes and Homebush Bay: environmental impact statement: Technical Paper 5 – Detailed human health and ecological risk assessment of Homebush Bay sediments, December 2002, Rhodes, NSW, 396p
190 Ibid., pp.66-68. This appears to be the case for two reasons. First, they note that the potential contribution of dioxin-like PCBs to the final TEQ reading is relatively low, in the order of 1%. Dioxin-like PCBs are included in WHO-TEQ values but not in I-TEQ values. Second, they appear to argue that, if anything, the I-TEQ values presented may be lower than the comparable WHO-TEQ values. They found that the 2,3,7,8-TCDD levels could be multiplied by 2.86 to provide the TEQ value to “an acceptable level of confidence”, in which case figures in the Surface (0-100mm) row of Table 10 would read as 28.6, 188,760 and 7,722 respectively.
191 Thiess Services and Parsons Brinckerhoff, Remediation of Lednez site, Rhodes and Homebush Bay: environmental impact statement: Technical Paper 3 – Extent of contamination in Homebush Bay, December 2002, Rhodes, NSW
192 Thiess Services and Parsons Brinckerhoff, Remediation of Lednez site, Rhodes and Homebush Bay: environmental impact statement, December 2002, Rhodes, NSW
193 Thiess Services and Parsons Brinckerhoff, Remediation of Lednez site, Rhodes and Homebush Bay: environmental impact statement: Technical Paper 3 – Extent of contamination in Homebush Bay, December 2002, Rhodes, NSW

NSW Parliamentary Research Service
52
Figure 16: Dioxin sediment concentrations in Homebush Bay (0-100mm)194
194
Ibid., p.5.32. Note that 1µg/kg = 1,000 pg/g

Briefing Paper No 03/2015
53
According to the main EIS report, the dioxin sediment concentration findings indicate that the extent of contamination was greatest at the surface of the sediments, with the size of the contamination footprint decreasing with depth. This confirmed that much of the organic contamination produced by the reclamation of the industrial sites (along the north-eastern side of the Bay) had migrated out over time into the sediments of Homebush Bay.
The EIS adopted the recommended Preferred Remediation Scenario,195 arguing that it would have the following benefits:
It would realise the greatest rate of reduction in dioxin levels in the bay sediments per unit area;
As dioxin levels in fish decrease, so would impacts to human health by lowering the potential for daily intake through the food chain;
It would ensure that future residential users of the Lednez, Meriton and Orica sites would be protected from unsafe exposure resulting from bay based recreational activities, including those involving direct contact with sediments along the foreshore;
It would ensure the health of the ecological communities that frequent the bay by removing the most heavily contaminated sediments from the bay; and
It would reduce the contaminant load available for future dispersion throughout the environment.196
According to Sinclair Knight Merz, implementation of this scenario would reduce the bay-wide average dioxin sediment concentration from 3,014pg I-TEQ/g to 2,033pg I-TEQ/g.197 Note that the final area remediated appears to be larger than that proposed in the EIS (Figure 17).198
The international sediment quality guideline values for dioxins range from 0.0011 to 210pg TEQ/g, depending on a range of factors. The minimum level (90pg I-TEQ/g) found in the area of Homebush Bay adjacent to the Lednez site exceeds all but two of the identified guideline values. The surface average for this area (7,600pg I-TEQ/g), the estimated average for Homebush Bay (3,014pg
195
Thiess Services and Parsons Brinckerhoff, Remediation of Lednez site, Rhodes and Homebush Bay: environmental impact statement: Technical Paper 5 – Detailed human health and ecological risk assessment of Homebush Bay sediments, December 2002, Rhodes, NSW, 396p
196 Thiess Services and Parsons Brinckerhoff, Remediation of Lednez site, Rhodes and Homebush Bay: environmental impact statement, December 2002, Rhodes, NSW
197 Thiess Services and Parsons Brinckerhoff, Remediation of Lednez site, Rhodes and Homebush Bay: environmental impact statement: Technical Paper 5 – Detailed human health and ecological risk assessment of Homebush Bay sediments, December 2002, Rhodes, NSW, p.49 of the Supplementary Final Report
198 For the proposed area, see page 5.6 of Thiess Services and Parsons Brinckerhoff, Remediation of Lednez site, Rhodes and Homebush Bay: environmental impact statement, December 2002, Rhodes, NSW

NSW Parliamentary Research Service
54
I-TEQ/g) and the expected bay-wide average following remediation (2,033pg I-TEQ/g) all exceed the guideline values.
Figure 17: Remediation of sediments in Homebush Bay199
The EIS contains several readings of dioxin levels for the waters of Homebush Bay (Table 11; Figure 18). Only six readings are reported, all of which exceed the guideline set in the Canadian Water Quality Guidelines for the Protection of Aquatic Life of 10pg TEQ/L. The ANZECC (2000) guidelines for water quality do not provide guidelines for dioxin concentrations.
Table 11: Dioxin water concentrations in Homebush Bay (pg TEQ/L)200
Weather Site
WQ1 WQ2 WQ3
Wet weather 690 12,100 815
Dry weather 3,080 652 445
Five groundwater readings for the Lednez site are presented in the EIS. These range from 4 to 157pg TEQ/L, with no mean provided. It appears therefore that the groundwater dioxin concentrations also generally exceeded known guidelines, when comparing the findings to the Canadian guideline of 10pg TEQ/L.201
199
Thiess Services, Rhodes Remediation Projects: Bay remediation map, no date [online – accessed 23 January 2015]
200 Thiess Services and Parsons Brinckerhoff, Remediation of Lednez site, Rhodes and Homebush Bay: environmental impact statement, December 2002, Rhodes, NSW, p.8.20
201 Ibid., p.8.8

Briefing Paper No 03/2015
55
Figure 18: Water quality sampling locations in Homebush Bay202
202
Ibid., p.8.16

NSW Parliamentary Research Service
56
It is important to note that all the dioxin findings set out in this section were recorded prior to the remediation of the most contaminated part of Homebush Bay and the Lednez site. While also conducted prior to the remediation of Homebush Bay, the following two studies provide a picture of dioxin contamination across the whole Harbour.
5.4.3 The source and distribution of dioxins in Sydney Harbour with international comparisons (2007)
A 2007 study examined the distribution of dioxins across Sydney Harbour, including within Homebush Bay. It took samples at 16 locations across the Harbour (Figures 19 and 20). Values across the Harbour ranged from 31.5 to 4,352.5pg TEQ/g with an average of 711.5pg TEQ/g, although this average is possibly biased high due to five of the samples being taken from the highly elevated sediment within Homebush Bay. Findings specific to particular areas of the Harbour include:
Homebush Bay had an average of 2,094.0pg TEQ/g with a range of 667.8 to 4,352.5pg TEQ/g;
Stormwater discharge points (S9 to S12) had an average of 124.5pg TEQ/g and a range of 75.9 to 226.4pg TEQ/g;
Industrial and urban areas (S3 to S6) had an average of 230pg TEQ/g and a range of 81.1 to 367.2pg TEQ/g; and
Background sediment samples (S1A, S1B and S2) had an average of 39.5pg TEQ/g and a range of 31.5 to 49.5pg TEQ/g.203
The study’s Homebush Bay findings are much lower than those contained in the Lednez EIS (average of 7,600pg I-TEQ/g and range of 90 to 154,000pg I-TEQ/g in surface sediment). Given how localised the highest readings were found to be in the EIS, it is quite possible that this study, which only took five samples across the whole of Homebush Bay, missed the most contaminated parts of the Bay.
In comparison with the guidelines contained in Table 9:
All findings, including those in the relatively uncontaminated areas of Lane Cove River and Upper Middle Harbour, exceeded the suggested guidelines for human consumers of 1.1 and 15pg TEQ/g;
All findings other than the background sediment samples exceeded every low level risk guideline. The background sediment samples exceeded every low level risk guideline but one – the US low level risk guideline for fish of 60pg TEQ/g; and
The threshold for high level risk to wildlife values range from 21.5pg
203
Birch, G. et al., The source and distribution of polychlorinated dibenzo-p-dioxin and polychlorinated dibenzofurans in sediments of Port Jackson, Australia, Marine Pollution Bulletin, 2007, Vol 54(3): 295-308

Briefing Paper No 03/2015
57
TEQ/g to 210pg TEQ/g. All findings exceeded the lowest of the guidelines for high level risk to wildlife. Almost every finding in the contaminated areas of the Harbour exceeded the US high level risk guideline for fish of 100pg TEQ/g.
Figure 19: Sample locations: 2007 study into dioxins in Sydney Harbour sediments204
204
Ibid. p.300

NSW Parliamentary Research Service
58
Figure 20: Dioxin concentrations in Sydney Harbour extending east and west from Homebush Bay (S7, S8, S13, S14; pg TEQ/g)205
This study found that dioxin readings in Sydney Harbour sediments are far higher than anywhere else in Australia (Table 12). The minimum Sydney Harbour reading of 31.5pg TEQ/g is only marginally lower than the highest reading outside of Sydney Harbour, namely 35pg TEQ/g in Botany Bay.
Table 12: Australian State and Territory dioxin sediment concentrations206
Location Concentration (pg TEQ/g)
Port Darwin (NT) 0.89
Brisbane River (Qld) 4.9
Sydney Harbour 31.5 – 4,352.5
Botany Bay 22 – 35
Lake Illawarra 6
Yarra River (Vic) 1 – 17
Central Port Phillips (Vic) 2.5 – 3.2
Lower Derwent River (Tas) 4.9
Torrens River (SA) 1.0 – 1.5
Swan/Canning River (WA) 5.5
The two highest international dioxin sediment concentrations after those found in the Lednez EIS (154,000pg I-TEQ/g in surface sediment) were recorded in
205
Ibid. p.300 206
Ibid. p.298

Briefing Paper No 03/2015
59
Finland (80,000pg TEQ/g) and at Frierfjorden, Norway (6,234 to 19,444pg TEQ/g). Figure 21 provides some other international examples for comparative purposes using the Sydney Harbour findings from this study. The Sydney Harbour average of 711.5pg TEQ/g is comparable to the maximum concentrations of several industrial areas including New York Harbor (880pg TEQ/g), Passiac River (1,400pg TEQ/g), New Bedford Harbor (761pg TEQ/g) and Lower Roanoke River (1,200pg TEQ/g). However, these areas would probably have average concentrations much lower than that of Port Jackson. The Homebush Bay average (2,094.9pg TEQ/g) is comparable to the maximum values of places like Venice Lagoon, Italy (2,857pg TEQ/g) and St Laurensharbour, Netherlands (1,849pg TEQ/g).207
Figure 21: International dioxin concentrations (pg TEQ/g)208
5.4.4 Department of Environment, Climate Change and Water (2008)
A study into dioxin sediment concentrations was conducted by the Department of Environment, Climate Change and Water using data collected in 2008 (Figure 22). According to this study:209
Dioxin concentrations in Sydney Harbour ranged from 1.5pg TEQ/g in Middle Harbour to 610pg TEQ/g in Parramatta River near Rhodes;
207
Ibid. 208
Ibid. 209
SMH, The poison that got away: Harbour dioxins hit critical level, 30 October 2010
0
500
1,000
1,500
2,000
2,500
3,000
3,500
4,000
4,500
Min
Max

NSW Parliamentary Research Service
60
West of the Harbour Bridge, concentrations ranged from 56 to 610pg TEQ/g;
In Port Jackson east of the Harbour Bridge, and including North Harbour, values ranged from 14 to 110pg TEQ/g; and
In Middle Harbour, values ranged from 1.5 to 4pg TEQ/g.210
This study does not appear to have collected data from Homebush Bay.
Figure 22: Dioxin levels in Sydney Harbour (2008 study)211
In comparison with the guidelines contained in Table 9:
All findings west of the Harbour Bridge exceeded guidelines for human consumers of 1.1 and 15pg TEQ/g. Only three findings east of the Harbour Bridge did not exceed the less strict guideline of 15pg TEQ/g – one in North Harbour, and two in Middle Harbour;
With one exception, all findings west of the Harbour Bridge exceeded the low level risk guidelines for wildlife. The exception was the finding of 56pg TEQ/g just west of the Bridge, which was marginally under the highest low level risk guideline of 60pg TEQ/g (for fish). The findings just to the east of the Harbour Bridge (71 to 110pg TEQ/g) all exceeded the low level risk guidelines for wildlife; and
Every finding west of the Harbour Bridge exceeded the Canadian Probable Effect Level of 21.5pg TEQ/g, and all but one exceeded the high level risk guideline for fish of 100pg TEQ/g. One finding east of the
210
SMH, Harbour spots with the fish you should reject, 30 October 2010 211
Ibid.

Briefing Paper No 03/2015
61
Bridge exceeded the high level risk guideline for fish (110pg TEQ/g just east of the Bridge) and five exceeded the Canadian Probable Effect Level.
5.4.5 What can be done?
According to the Department of Environment, Climate Change and Water, current dioxin contamination levels suggest that it will be decades before it will be safe to eat fish from west of the Sydney Harbour Bridge. While remediation of some of the most contaminated areas in Homebush Bay has taken place, it appears technically and financially impractical to conduct any large-scale remediation projects of dioxin-contaminated sediments. At this stage, because the area contaminated with dioxins is too extensive, the only way to address the problem is to wait until sediments cover the contaminated layer so that dioxins cannot be absorbed by fish and small invertebrates.212 A recent paper on Sydney Harbour recommended that:
With respect to the impact of dioxins on human health, long-term monitoring of fish tissue is required to determine the success of the dredging and capping program undertaken in Homebush Bay;
Long-term monitoring of bed sediment dioxin concentrations throughout the Harbour is required to ensure the source of dioxin contamination has been effectively capped;
Modelling investigations encompassing chemical, sediment and hydrodynamic transport would facilitate improved understanding of the long-term impact of dioxins and the potential recovery time for the Harbour with respect to these chemicals; and
Dioxin uptake studies would further advance our understanding of their impact on estuarine species and enable appropriate guidelines for dioxin concentrations within estuary waters and bed sediments to be put in place.213
212
SMH, The poison that got away: Harbour dioxins hit critical level, 30 October 2010 213
Lee, S. and Birch, G., Sydney Estuary, Australia: Geology, anthropogenic development and hydrodynamic processes/attributes, p.28, In: Wolanski, E. (ed), Estuaries of Australia in 2050 and beyond, 2014, Springer, Dordrecht, 292p.

NSW Parliamentary Research Service
62
6. HEAVY METALS AND SEDIMENT TOXICITY
6.1 Heavy metals
6.1.1 Distribution
Sydney Harbour has some of the highest recorded sediment concentrations of heavy metals in Australia (Table 13) and internationally (Table 14). Copper, lead and zinc mean and maximum concentrations in Sydney Harbour are higher than comparable estuaries such as Georges River/Botany Bay and Port Philip, and much higher than the relatively undisturbed Myall Lakes.214 For comparative purposes, ANZECC (2000) sediment quality guidelines have been included at the end of the Table.
Table 13: Sydney Harbour and Australian normalised (<62.5 µm) metal concentrations (mg/kg) in surficial sediment215
Estuary Copper Lead Zinc
Sydney Harbour Mean 188 364 651
Range 9 – 1,053 38 – 3,604 108 – 7,622
Pittwater Mean 87 65 134
Range 25 – 596 20 – 174 20 – 272
Georges River/Botany Bay Mean 70 155 393
Range 17 – 457 29 – 924 76 – 2,641
Hawkesbury River Mean 47 55 135
Range 17 – 203 19 – 174 68 – 272
Hunter River Mean - 172 -
Range 35 – 193 48 – 777 31 – 1,638
Myall Lakes Mean 5 19 49
Range 2 – 9 5 – 28 12 – 82
Brisbane Water Mean 30 57 157
Range 13 – 153 26 – 362 76 – 775
Port Philip Bay Mean 13 30 202
Range 1 – 62 1 – 197 13 – 1,600
ANZECC sediment quality guidelines
ISQG-Low 65 50 200
ISQG-High 270 220 410
The ISQG-Low value represents the value below which adverse biological effects are seldom observed. The ISQG-High value denotes the value above
214
Birch, G. et al., The use of vintage surficial sediment data and sedimentary cores to determine past and future trends in estuarine metal contamination (Sydney estuary, Australia), Science of the Total Environment, 2013, Vol 454-455: 542-561
215 Ibid. p.552; ANZECC & ARMCANZ, op. cit.

Briefing Paper No 03/2015
63
which adverse biological effects are expected to occur frequently. Lead and zinc mean concentrations in Sydney Harbour exceed the ISQG-High values, and the copper mean concentration lies approximately half-way between the ISQG-Low and ISQG-High values.
According to research published in 2013, in comparison with international estuaries, Sydney Harbour has the highest maximum concentration for cadmium, lead and zinc (Table 14) and the highest mean concentration for copper, lead and zinc. Only one other harbour has a higher maximum concentration for copper (Hong Kong, 4,000 mg/kg) and only one other harbour has a higher maximum concentration for nickel (Lima Estuary, Portugal, 447 mg/kg). ANZECC (2000) sediment quality guidelines have also been included in Table 14. While mean concentrations of cadmium and nickel in Sydney Harbour were either lower than or equal to the ISQG-Low value, the maximum values for each metal were substantially higher than the ISQG-High value.
Table 14: Sydney Harbour and global normalised (<62.5 µm) metal concentrations (mg/kg) in surficial sediment216
Estuary Cadmium Copper Nickel Lead Zinc
Sydney Harbour
Mean 0.8 188 21.7 364 651
Range 0–24.3 9–1,053 5–245 38–3,604 108–7,622
Hong Kong Mean 0.33 119 25 54 148
Range 0.1–5.3 1–4,000 5–220 9–260 17–790
Quanzhou Bay, China
Mean 0.59 71 33 68 180
Range 0.3–0.9 25–120 16–46 34–101 106–242
Lima Estuary, Portugal
Mean - 45 14 37 111
Range - 16–406 46–447 19–64 59–398
Port of Barcelona, Spain
Mean 1.22 183 25 189 391
Range 0.4–2.8 71–531 18–34 86–589 183–1,133
San Pablo Bay, San Francisco, USA
Mean 0.21 39 37 22 65
Range 0.1–0.4 25–49 27–45 15–27 48–79
Montevideo Harbour, Uruguay
Mean - 89 30 85 312
Range - 59–135 26–34 44–128 174–491
ANZECC sediment quality guidelines
ISQG-Low 1.5 65 21 50 200
ISQG-High 10 270 52 220 410
Research in the early 2000s quantified the amount of copper, lead and zinc in Sydney Harbour (Table 15). Approximately 20% of all copper, lead and zinc can
216
Ibid.

NSW Parliamentary Research Service
64
be found in four embayments: Iron Cove, Rozelle & Blackwattle Bays, Homebush Bay, and Hen and Chicken Bay (473, 730 and 1,490 tonnes respectively). These bays represent only 5% of the total Sydney Harbour area. The remaining 80% of heavy metals is located in both small, highly-concentrated areas of upper parts of other tributaries and embayments in the Harbour, and in low concentrations throughout the Harbour.217
Table 15: Heavy metal inventories in Sydney Harbour (tonnes)218
Location Copper Lead Zinc
Lower Harbour (east of Harbour Bridge) 600 1300 2300
Middle Harbour 200 350 580
Upper Harbour (west of Harbour Bridge) 1200 2100 4600
Iron Cove 120 250 470
Rozelle & Blackwattle Bays 100 190 350
Homebush Bay 33 80 210
Hen and Chicken Bay 220 210 460
Sydney Harbour 1900 3500 7300
Research published in 2013 evaluated the heavy metal contamination of Sydney Harbour by examining the degree to which the sediments have become enriched by heavy metals (Figures 23 to 25). Enrichment factors of 1.5–3, 3–5, 5–10 and>10 times were classified as minor, moderate, severe and very severe modification, respectively. A Mean Enrichment Quotient (MEQ) was calculated by adding enrichment factors for the most enriched metals (copper, lead and zinc) and dividing by three to provide an ‘average’ magnitude of human-induced change.219
Cobalt, chromium, copper, nickel, lead and zinc enrichment of Sydney Harbour sediments has been investigated. No area of Sydney Harbour was classified as very severely modified by contamination with cobalt, chromium or nickel (using mean enrichment factors) (Figure 23). Further, only Homebush Bay was severely modified by one of these three metals – chromium (mean enrichment factor of 5.2).220
217
Birch, G. and Taylor, S., The contaminant status of Sydney Harbour sediments: A handbook for the public and professionals, Environmental, Engineering and Hydrogeology Specialist Group (EEHSG) Geological Society of Australia, Public Education and Information Monograph No. 1, 2004, 100p.
218 Modified from: Birch, G. and Taylor, S., op. cit. p.80. Note that, as copied from the source, the figures for the Lower Harbour, Middle Harbour and Upper Harbour do not add to the total amount for Sydney Harbour.
219 Birch, G. et al., The use of vintage surficial sediment data and sedimentary cores to
determine past and future trends in estuarine metal contamination (Sydney estuary, Australia), Science of the Total Environment, 2013, Vol 454-455: 542-561
220 Ibid.

Briefing Paper No 03/2015
65
Figure 23: Cobalt, chromium and nickel enrichment in six Sydney Harbour embayments221
The opposite was true for copper, lead and nickel (Figure 24). All six embayments were very severely modified by copper, lead and nickel except for lead in Middle Harbour (mean enrichment factor of 9) and zinc in Lane Cove Estuary (mean enrichment factor of 9). Rozelle & Blackwattle Bays had the highest maximum enrichment factors for all three metals, copper (76), lead (101) and zinc (72).222
221
Ibid. p.554 222
Ibid.
0
2
4
6
8
10
12
Rozelle &Blackwattle
Bays
Iron Cove Hen andChicken
Bay
HomebushBay
Lane CoveEstuary
MiddleHarbour
Cobalt (mean)
Cobalt (max)
Chromium (mean)
Chromium (max)
Nickel (mean)
Nickel (max)
Very severe modification
Severe modification
Moderate modification
Minor modification

NSW Parliamentary Research Service
66
Figure 24: Copper, lead and zinc enrichment in six Sydney Harbour embayments223
All six embayments, as well as Sydney Harbour as a whole, were classified as very severely modified by heavy metal contamination with Mean Enrichment Quotients (MEQ) over 10 (Figure 25). Rozelle & Blackwattle Bays (39), Iron Cove (26), and Hen and Chicken Bay (21) all had much higher MEQ values than Sydney Harbour (12.6), indicating that all three are substantially more impacted than the majority of the waterway.224
223
Sources: Birch, G. and Olmos, M., Sediment-bound heavy metals as indicators of human influence and biological risk in coastal water bodies, ICES Journal of Marine Science, 2008, Vol 65(8): p.1,411; Birch, G. et al., The use of vintage surficial sediment data and sedimentary cores to determine past and future trends in estuarine metal contamination (Sydney estuary, Australia), Science of the Total Environment, 2013, Vol 454-455: p.554
224 Birch, G. et al., The use of vintage surficial sediment data and sedimentary cores to determine past and future trends in estuarine metal contamination (Sydney estuary, Australia), Science of the Total Environment, 2013, Vol 454-455: 542-561
0
20
40
60
80
100
120
Copper (mean)
Copper (max)
Lead (mean)
Lead (max)
Zinc (mean)
Zinc (max)
Very severe modification

Briefing Paper No 03/2015
67
Figure 25: Mean Enrichment Quotient (MEQ) for heavy metals in six Sydney Harbour embayments225
Metal concentrations in surficial sediments of Rozelle & Blackwattle Bays, Iron Cove, Hen and Chicken Bay and Homebush Bay have generally declined over the past few decades (Figure 26). This is due in part to the movement of industry out of these catchments. Improved regulation of industrial effluents and the progressive phasing out of leaded petrol since 1985 are other contributing factors. In the Lane Cove Estuary, heavy metal concentrations have remained stable or increased except for chromium and lead in Burns Bay. In Middle Harbour, heavy metal concentrations have remained relatively stable or decreased except for copper and zinc in Sailors Bay and copper in Long Bay, which have increased.226
225
Sources: Birch, G. and Olmos, M., op. cit. p.1,411; Birch, G. et al., The use of vintage surficial sediment data and sedimentary cores to determine past and future trends in estuarine metal contamination (Sydney estuary, Australia), Science of the Total Environment, 2013, Vol 454-455: p.554
226 Birch, G. et al., The use of vintage surficial sediment data and sedimentary cores to determine past and future trends in estuarine metal contamination (Sydney estuary, Australia), Science of the Total Environment, 2013, Vol 454-455: 542-561
0
20
40
60
80
100
MEQ (mean)
MEQ (max)
Very severe modification

NSW Parliamentary Research Service
68
Figure 26: Summary of temporal trends in surficial sediment metal concentrations and sources of metals227
6.1.2 Heavy metals in stormwater entering Sydney Harbour
Stormwater has been identified as the most significant contemporary source of heavy metal contamination in Sydney Harbour. Other sources include the redistribution of heavy metals from the bed of the Parramatta River into embayments and throughout the Harbour, and minor contribution from industry.228 Major sources of metals entering stormwater in urbanised catchments include road surfaces, atmospheric deposition, roof runoff, industrial activities, soil erosion, contaminated sites, sewer overflows and illegal discharges.229 Soils in some areas of the Sydney Harbour catchment have been found to have significant levels of copper, lead and zinc contamination, with mean enrichment of soils being 14, 35 and 29 times above background levels respectively.230
227
Ibid. p.559 228
Ibid. 229
Birch, G. and Rochford, L., Stormwater metal loading to a well-mixed/stratified estuary (Sydney Estuary, Australia) and management implications, Environmental Monitoring and Assessment, 2010, Vol 169(1-4): 531-551
230 Birch, G. et al., The nature and distribution of metals in soils of the Sydney Estuary catchment, Australia, Water, Air & Soil Pollution, 2011, Vol 216(1-4): 581-604

Briefing Paper No 03/2015
69
It has been estimated that Sydney Harbour receives an average annual loading of arsenic, cadmium, chromium, copper, nickel, lead and zinc of 0.8, 0.5, 1.7, 3.2, 1.1, 3.6 and 17.7 tonnes respectively (28.6 tonnes in total).231 Low-flow conditions, which contain 10% of total metal loadings, pose maximum risk to the ecosystem as all contaminants are trapped in the estuary under conditions highly favourable to their chemical and biological incorporation into sediments.232 A proportion of the metal loadings which enter the Harbour during medium- and high-flow conditions may leave the estuary; further research is needed to quantify the fate of these contaminants.233
Stormwater heavy metal loadings to Sydney Harbour are much higher than comparable estuaries (Table 16). For example, 72 grams per hectare per year of copper enter the Harbour from its catchment, seven times greater than copper yields in the Yarra River. Metal yields for Sydney Harbour are about three to ten times higher than the Yarra River catchment, and between 0 to 80 times greater than comparable urban catchments in the USA. 234
Table 16: Stormwater heavy metal yields for Australian and international urban catchments (grams per hectare per year)235
Location Chromium Copper Nickel Lead Zinc
Sydney Harbour 41 72 23 82 378
Yarra River, Vic - 7.7 – 11 - 5.7 – 31 23 – 190
Los Angeles River, USA - 6.3 – 21 - 0.0 – 0.9 19 – 78
San Gabriel River, USA - 0.4 – 4.2 - 0.1 – 1.4 268 – 398
San Jose Creek, USA - 5.5 – 7.2 - 1.0 – 1.5 144 – 313
Ballona Creek, USA 12 4.6 – 40 11 1.5 – 14 18 – 21
Heavy metal concentrations in stormwater entering Sydney Harbour have been evaluated against ANZECC (2000) guidelines. The guidelines provide trigger values for dissolved metals, below which no adverse effects on the aquatic ecosystem for chronic exposures should occur. If the trigger values are exceeded, further investigation to evaluate risk to the ecosystem is recommended. Dissolved copper poses the greatest risk to the ecosystem, with between 54% and 100% of samples exceeding the trigger value for creeks discharging to Iron Cove, Hen and Chicken Bay, Homebush Bay, Parramatta River and Lane Cove River under low-flow conditions and 100% of samples for
231
Birch, G. and Rochford, L., op. cit. 232
Beck, H. and Birch, G., Metals, nutrients and total suspended solids discharged during different flow conditions in highly urbanised catchments, Environmental Monitoring and Assessment, 2012, Vol 184(2): 637-653
233 Lee, S. and Birch, G., Utilising monitoring and modelling of estuarine environments to investigate catchment conditions responsible for stratification events in a typically well-mixed urbanised estuary, Estuarine, Coastal and Shelf Science, Vol 111: 1-16
234 Birch, G. and Rochford, L., op. cit
235 Modified from: Ibid. p.542

NSW Parliamentary Research Service
70
all creeks during medium/high flow.236
Dissolved zinc exceeded the trigger value for >95% of samples from creeks entering Iron Cove, Hen and Chicken Bay and Duck River, and for 33% of samples from the Lane Cove River under low-flow conditions. Under medium/high flow conditions, dissolved zinc exceeded the trigger value in >80% of samples entering Iron Cove, Duck River and Parramatta River. Dissolved arsenic and chromium trigger values were exceeded in specific sub-catchments only: Iron Cove (10-12% during low-flow) and Hen and Chicken Bay (36-53% during medium/high-flow) for arsenic, and Iron Cove (15-72% during low-flow) for chromium. Lead is poorly soluble, dissolved concentrations being less than the trigger level in >80% of samples under all conditions. Dissolved nickel trigger values were never exceeded.237
6.1.3 Environmental effects and modelled contamination trends
Heavy metal contamination has been linked to strong changes in the structure of infaunal assemblages, benthic larval fish assemblages and highly stressed biota.238 These effects can be expected to be ongoing for at least the next few decades given the current level of heavy metal contamination and the modelled rates (relaxation rates) at which these concentrations will decrease (Table 17). Based on recent sediment concentration trends for several locations in Sydney Harbour, researchers modelled the length of time it would take for heavy metal concentrations to decrease to two times background concentrations (i.e. two times pre-anthropogenic concentrations), assuming that dispersion processes within the estuary and activities which supply additional metals to the Harbour remain unchanged.
The time taken for particular metals to decline to two times background concentrations ranged from 2 to 92 years. Sediment concentrations in Hen and Chicken Bay could be expected to return to two times background levels most quickly of the areas investigated, being at most 13 years (copper). In contrast, the very earliest this could occur in Sugarloaf Bay, Middle Harbour, is in 41 years (zinc); it will be 92 years until copper levels in this Bay reach two times background concentrations.239
236
Ibid. 237
Ibid. 238
Hedge, L.H. et al., Sydney Harbour: a systematic review of the science, 2014. Sydney Institute of Marine Science, Sydney, Australia, 80p; SMH, Toxic estuaries in NSW making rock oysters infertile, 13 April 2014
239 Ibid.

Briefing Paper No 03/2015
71
Table 17: Number of years for heavy metal concentrations to reach 2 times background concentrations240
Location Chromium Copper Lead Zinc
Blackwattle Bay - 60 10 20
Rozelle Bay - 23 4 19
Iron Cove (Hawthorne canal) - 15 20 64
Iron Cove (central) - 20 23 20
Iron Cove (entrance) - IT 40 66
Hen and Chicken Bay - 13 6 2
Lane Cove River (Burns Bay) 15 IT 40 IT
Middle Harbour (Sugarloaf Bay) 76 92 73 41
Notes: IT – increasing trend at top of sediment core
The modelled times for a reduction in metal concentrations to two times background concentrations are optimistic for two reasons. The time required to achieve this objective assumes the rate of change to be constant over time. However, the rate of change will slow progressively as concentrations near the target concentration; the time to reach the target concentration will consequently increase. Sediment concentrations also cannot decrease below the levels found in stormwater entering the Harbour, which is up to 10-20 times background levels in some locations. While the high concentrations of metals that are a legacy of past industrial pollution are gradually being covered by less contaminated sediment, heavy metal contamination of Harbour sediments continues via stormwater. Improved stormwater management practices are therefore required in order to reduce sediment metal concentrations to acceptable levels.241
6.2 Sediment quality and toxicity
Over a number of years, researchers from the University of Sydney’s School of Geosciences have investigated the quality and toxicity of sediment in Sydney Harbour. This section sets out a broad overview of their findings. Note that Homebush Bay foreshore and bay sediments with some of the highest pollutant concentrations have been remediated since the research was conducted. As of 2014, the effectiveness of the remediation program was unknown.242
The research summarised here does not include dioxins and furans in its analysis, although it does include total polychlorinated biphenyls (PCBs) (see
240
Modified from: Birch, G. et al., The use of vintage surficial sediment data and sedimentary cores to determine past and future trends in estuarine metal contamination (Sydney estuary, Australia), Science of the Total Environment, 2013, Vol 454-455: 558
241 Ibid.
242 Lee, S. and Birch, G., Sydney Estuary, Australia: Geology, anthropogenic development and hydrodynamic processes/attributes, pp 17-30, In: Wolanski, E. (ed), Estuaries of Australia in 2050 and beyond, 2014, Springer, Dordrecht, 292p.

NSW Parliamentary Research Service
72
chapter 5 of this paper). Other toxic pollutants not included in this study that have been found in Sydney Harbour include other heavy metals (aluminium, arsenic, barium, boron, molybdenum, selenium, silver, tin and vanadium), monocyclic aromatic compounds (chlorinated benzenes and substituted phenols) and phthalates.243 Nor does the research include emerging contaminants, a globally recognised area of concern for ecosystem health. The environmental impact of new compounds and chemicals entering the environment is unknown, as are their possible interactions with other contaminants. New contaminants include microplastics (see chapter 7 of this paper), pharmacological cosmetic products and waste products from the emerging nanotechnology field.244
6.2.1 Stage 1: Sediment chemistry and potential health and ecological impacts
The research into sediment quality and toxicity was conducted in three stages. The first tested for the presence of pollutants including 9 heavy metals, chlorinated hydrocarbons (many of which are listed under the 2001 Stockholm Convention, such as DDT [dichlorodiphenyltrichloroethane]), 17 polycyclic aromatic hydrocarbons245 (PAHs) and total polychlorinated biphenyls (PCBs) (Table 18).
The chemicals tested for can all produce significant human health and ecological impacts at certain levels. For example, organochlorine pesticides (OCs), which were manufactured next to the Parramatta River during the 20th century, were deregistered by the Commonwealth Government in the 1990s due to their toxicity. Generally, OCs:
Resist degradation by chemical, physical or biological means. They are persistent and have half-lives (the time taken for half of the quantity of pesticide to be degraded) ranging from months to years and in some cases decades;
Are toxic to humans and other animals and are very highly toxic to most aquatic life. They can have serious short-term and long-term impacts at low concentrations. In addition, non-lethal effects such as immune system and reproductive damage of some of these pesticides may also be significant; and
Build up in the fatty tissues of humans, plants and animals. Most of them are attracted to fatty tissues and organs and are accumulated
243
Thiess Services and Parsons Brinckerhoff, Remediation of Lednez site, Rhodes and Homebush Bay: environmental impact statement: Technical Paper 3 – Extent of contamination in Homebush Bay, December 2002, Rhodes, NSW.
244 Hedge, L.H. et al., Sydney Harbour: a systematic review of the science, 2014. Sydney Institute of Marine Science, Sydney, Australia, 80p
245 16 of these have been identified as being of greatest concern with regard to potential exposure and adverse health effects on humans: SA Department of Health, Polycyclic Aromatic Hydrocarbons (PAHs): health effects, Public health fact sheet, February 2009, 4p.

Briefing Paper No 03/2015
73
significantly in animals such as fish. This means that animals high up the food chain such as birds of prey and humans can accumulate higher levels of the pesticides than animals lower down the food chain.246
Table 18: Sydney Harbour sediment chemical analysis247
Heavy metals Chlorinated hydrocarbons Polycyclic aromatic hydrocarbons (PAHs)
Cadmium
Chromium
Cobalt
Copper
Iron
Manganese
Nickel
Lead
Zinc
Organochlorine pesticides (OCs)
DDT
DDD
DDE
Chlordane
Aldrin
Heptachlor
Dieldrin
Heptachlor epoxide
Lindane
A fungicide
Hexachlorobenzene (HCB)
Total polychlorinated biphenyls (PCBs)
17 PAHs, including:
Benzo[b]fluoranthene
Fluoranthene
Pyrene
Polychlorinated biphenyls (PCBs), some of which are similar to dioxins in their toxicity:
… have been demonstrated to cause a variety of adverse health effects. PCBs have been shown to cause cancer in animals. PCBs have also been shown to cause a number of serious non-cancer health effects in animals, including effects on the immune system, reproductive system, nervous system, endocrine system and other health effects. Studies in humans provide supportive evidence for potential carcinogenic and non-carcinogenic effects of PCBs. The different health effects of PCBs may be interrelated, as alterations in one system may have significant implications for the other systems of the body.248
Polycyclic aromatic compounds (PAHs) are a group of compounds formed during the incomplete burning of coal, oil, gas, wood or other organic substances. They may also be used when making dyes, plastics, and pesticides,249 all of which have been manufactured by industries located next to Sydney Harbour. PAHs may be toxic, carcinogenic, mutagenic or teratogenic
246
Department of the Environment, Organochlorine pesticides (OCPs) – Trade or common use names, Scheduled Wastes Fact Sheet Number 5 (revised), April 1997 (online – accessed 15 January 2015)
247 Birch, G. et al., Contaminant chemistry and toxicity of sediments in Sydney Harbour, Australia: spatial extent and chemistry-toxicity relationships, Marine Ecology Progress Series, 2008, Vol 363, pp.71-87
248 US EPA, Health effects of PCBs, 14 June 2013 [online – accessed 15 January 2015]
249 Agency for Toxic Substances and Disease Registry, Toxicological profile for polycyclic aromatic hydrocarbons, U.S. Department of Health and Human Services, August 1995, 458p
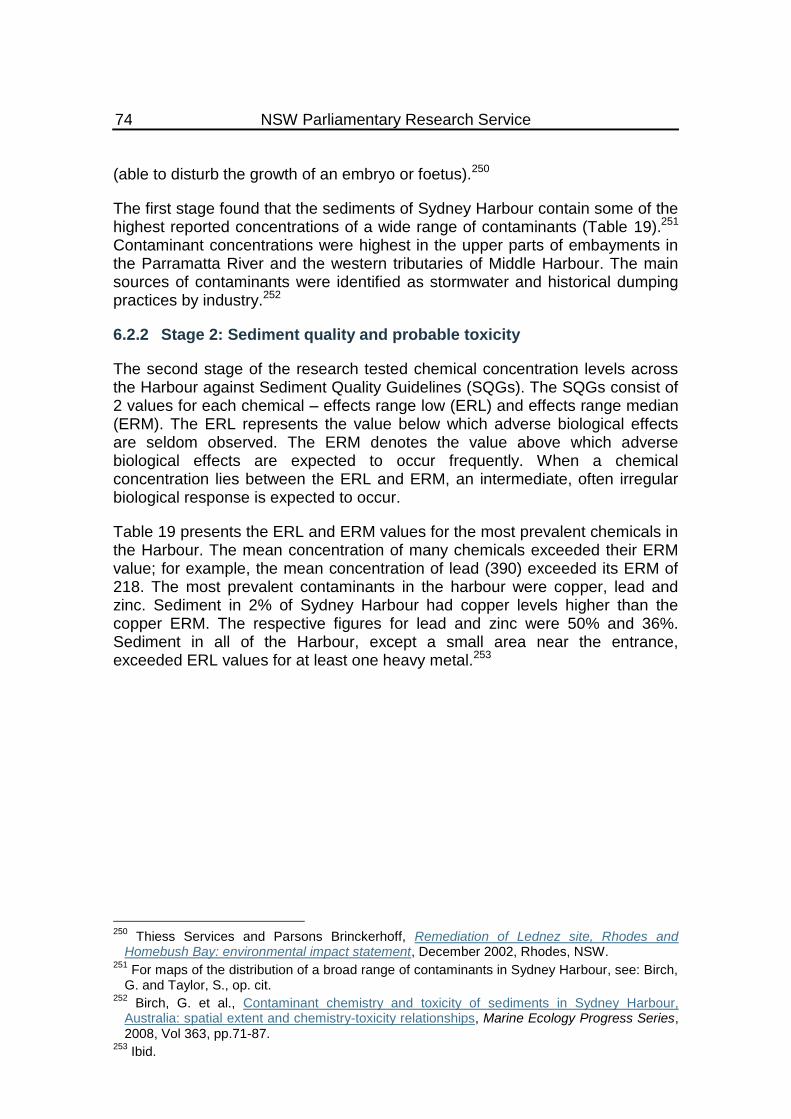
NSW Parliamentary Research Service
74
(able to disturb the growth of an embryo or foetus).250
The first stage found that the sediments of Sydney Harbour contain some of the highest reported concentrations of a wide range of contaminants (Table 19).251 Contaminant concentrations were highest in the upper parts of embayments in the Parramatta River and the western tributaries of Middle Harbour. The main sources of contaminants were identified as stormwater and historical dumping practices by industry.252
6.2.2 Stage 2: Sediment quality and probable toxicity
The second stage of the research tested chemical concentration levels across the Harbour against Sediment Quality Guidelines (SQGs). The SQGs consist of 2 values for each chemical – effects range low (ERL) and effects range median (ERM). The ERL represents the value below which adverse biological effects are seldom observed. The ERM denotes the value above which adverse biological effects are expected to occur frequently. When a chemical concentration lies between the ERL and ERM, an intermediate, often irregular biological response is expected to occur.
Table 19 presents the ERL and ERM values for the most prevalent chemicals in the Harbour. The mean concentration of many chemicals exceeded their ERM value; for example, the mean concentration of lead (390) exceeded its ERM of 218. The most prevalent contaminants in the harbour were copper, lead and zinc. Sediment in 2% of Sydney Harbour had copper levels higher than the copper ERM. The respective figures for lead and zinc were 50% and 36%. Sediment in all of the Harbour, except a small area near the entrance, exceeded ERL values for at least one heavy metal.253
250
Thiess Services and Parsons Brinckerhoff, Remediation of Lednez site, Rhodes and Homebush Bay: environmental impact statement, December 2002, Rhodes, NSW.
251 For maps of the distribution of a broad range of contaminants in Sydney Harbour, see: Birch, G. and Taylor, S., op. cit.
252 Birch, G. et al., Contaminant chemistry and toxicity of sediments in Sydney Harbour, Australia: spatial extent and chemistry-toxicity relationships, Marine Ecology Progress Series, 2008, Vol 363, pp.71-87.
253 Ibid.

Briefing Paper No 03/2015
75
Table 19: Summary of sediment chemical data for the most prevalent chemicals in four classes in Sydney Harbour254
Chemical
Concentration Sediment Quality
Guidelines
% samples amongst ranges of SQGs
Min. Max. Mean ERL ERM <ERL ERL-ERM
>ERM
Metals
(mg kg-1
)
Copper 20 701 210 34 270 2 75 23
Lead 78 1050 390 46.7 218 0 29 71
Zinc 75 820 900 150 410 3 18 78
PAHs
(µg kg-1
)
Fluoranthene 121 16,200 4,300 600 5,100 11 60 29
Pyrene 161 23,300 5,100 665 2,600 11 45 45
OCs
(µg kg-1
)
Total DDT <0.5 5,168 150 1.58 46.1 38 34 28
Total PCB
(µg kg-1
) <5 514 40 22.7 180 83 11 6
Concentrations are expressed as dry weight and mean values are rounded to 2 significant figures. SQGs: sediment quality guidelines, ERL: effects range low, ERM: effects range-median
Concentrations for at least one OC or PAH compound in sediments in almost all upper and middle parts of the Harbour, including Middle Harbour, exceeded ERM values. Sediments in only a small part of the Harbour had PCB concentrations above the ERM value.255
As contaminants rarely occur individually throughout the Harbour, the probability of sediment toxicity for mixtures of contaminants was calculated using the mean ERM quotient (MERMQ) approach.256 Sediments in the Harbour were divided into ‘priority areas’ according to their MERMQ value (categories 1 to 4 from low to high; Figure 27). Category 1, 2, 3 and 4 sediment corresponding to probable toxicities of approximately 10, 25, 50 and 75% comprised 19, 54, 25 and 2% of the Harbour respectively.257
254
Adapted from: Ibid. p.78 255
Ibid. 256
In this approach, contaminant concentrations at each site are normalised to (divided by) respective ERM values, the quotients are summed and then divided by the total number of contaminants.
257 Birch, G. et al., Contaminant chemistry and toxicity of sediments in Sydney Harbour, Australia: spatial extent and chemistry-toxicity relationships, Marine Ecology Progress Series, 2008, Vol 363, pp.71-87

NSW Parliamentary Research Service
76
Figure 27: Four priority categories for Sydney Harbour sediments according to the probability of sediment toxicity258
6.2.3 Stage 3: Sediment combined chemical and toxicity scores
Stage three of the research generally focused on those areas identified as being either high priority or medium-high priority in stage 2 of the research (Figure 27). The final stage involved three ecotoxicological tests of sediments in 16% of the Harbour (Figure 28). This data was combined with the chemical data to produce a sediment chemistry and toxicity score. All the sediment in the areas tested was found to be either highly toxic (highly degraded; 17%), moderately toxic (moderately degraded; 52%) or slightly toxic (slightly degraded; 31%).
258
Ibid. p.79

Briefing Paper No 03/2015
77
Figure 28: Combined chemistry and toxicity scores for Sydney Harbour sediments259
6.2.4 International comparison
The findings of the research set out above were compared with a US study, which took 1,068 estuarine samples along the 3 US coasts (Table 20). 46% of Sydney Harbour has at least one chemical which exceeds its ERM value (i.e. adverse biological effects are expected to occur frequently). In comparison, only 27% of US samples had at least one chemical which exceeded its ERM value. Further, 11% of Sydney Harbour has at least 6 chemicals which exceed their ERM value.
259
Ibid. p.84

NSW Parliamentary Research Service
78
Table 20: Comparing sediment toxicity in Sydney Harbour and US estuaries (% of estuary)260
No chemicals
exceeded an ERL value
At least one chemical exceeded an ERL value, but not an
ERM value
At least one chemical exceeded an ERM
value
Sydney Harbour 8% 45% 46%
US estuaries 31% 42% 27%
Only 8% of Sydney Harbour has sediment in which no chemical exceeds its ERL value (i.e. the value below which adverse biological effects are seldom observed). In comparison, this was true of 31% of samples in US estuaries.
260
Note values do not add to 100% for Sydney Harbour because of rounding. Sources: Birch, G and Taylor, S., Application of sediment quality guidelines in the assessment and management of contaminated surficial sediments in Port Jackson (Sydney Harbour), Australia, Environmental Management, 2002, Vol 29(6), pp. 860-870; Birch, G. et al., Contaminant chemistry and toxicity of sediments in Sydney Harbour, Australia: spatial extent and chemistry-toxicity relationships, Marine Ecology Progress Series, 2008, Vol 363, p.79

Briefing Paper No 03/2015
79
7. MICROPLASTICS
7.1 Plastic pollution
Plastic pollution in oceans is a global problem, negatively impacting wildlife, tourism and shipping. Research published in 2014 estimated that at least 5.25 trillion plastic particles weighing 268,940 tons are currently floating in the world’s oceans, equivalent to 0.1% of world annual plastic production.261 However, the amount of plastic floating in the oceans is only a fraction of the total, small particles of plastic having either been consumed by marine wildlife, frozen in sea ice or settled into sediments.262 It has been estimated that there are up to 150 million tonnes of plastic in the oceans; in comparison, there are an estimated 800 million tonnes of fish in the ocean.263 A February 2015 study quantified the amount of plastic entering the oceans on an annual basis at somewhere between 4.8 and 12.7 million tons.264
The term microplastics was first coined in 2004 as researchers attempted to account for all the plastic in the ocean.265 Microplastics are tiny plastic fragments, fibres and granules generally smaller than 5mm in diameter. Those which are manufactured have been defined as primary microplastics, and include air-blasting media (microplastic scrubbers which are blasted at machinery, engines and boat hulls to remove rust) and microbeads used in cosmetics, shampoos and facial-cleansers.266
Secondary microplastics generally result from the breakdown of large plastic debris and from washing clothes in washing machines. Physical, biological and chemical processes break large plastic debris down over time. Such degradation may result in additives, designed to enhance durability and corrosion resistance, leaching out of the plastics.267 A study of eighteen shores across six continents found that proportions of microplastics in marine sediments and sewage resembled those used for textiles (78% polyester, 9% polyamide, 7% polypropylene, 5% acrylic). The authors found that a garment can shed >1,900 fibres per wash, with garments releasing >100 fibres per litre of effluent on average. The study concluded that microplastic particles in the marine environment are mainly derived from sewage via washing clothes, rather
261
Eriksen, M. et al., Plastic pollution in the world’s oceans: more than 5 trillion plastic pieces weighing over 250,000 tons afloat at sea, PLoS ONE, 2014, Vol 9(12)
262 The Guardian, Drowning in plastic, 25 January 2015 [online – accessed 6 February 2015]
263 The Guardian, We could end up with ‘as much plastic in our oceans as fish’, 27 January 2015 [online – accessed 6 February 2015]. This story included an estimate of the amount of plastic entering the oceans on an annual basis at 20 million tonnes.
264 National Center for Ecological Analysis and Synthesis, New in science: first estimate to quantity plastics flowing into the ocean, 12 February 2015 [online – accessed 16 March 2015]
265 The Guardian, Drowning in plastic, 25 January 2015 [online – accessed 6 February 2015]
266 Cole, M. et al., Microplastics as contaminants in the marine environment: a review, Marine Pollution Bulletin, 2011, Vol 62(12): 2,588-2,597
267 Cole, M. et al., op. cit.; ECOS, The science is in: the solution to pollution is not dilution, 5 May 2014, Issue 195 [online – accessed 6 February 2015]
NSW Parliamentary Research Service
80
than fragmentation or cleaning products.268
Plastics consist of many different polymers and, depending on their composition, density and shape, can be buoyant, neutrally-buoyant or sink. Microplastics can therefore be found throughout the water column and in sediments. Over time, buoyant and neutrally-buoyant microplastics can sink due to the accumulation of microbial biofilms, which may permit the colonisation of algae and invertebrates on the plastics’ surface, or the adherence of particles.269
7.2 Environmental impacts
Coral has recently joined the list of marine wildlife that eats plastic floating in the ocean, other creatures including sea birds, turtles, worms, bacteria and marine plankton.270 Humans may be consuming microplastics indirectly, and in potentially substantial quantities, insofar as they eat marine wildlife such as mussels and oysters which, when commercially grown, have been found to contain an average of 0.36 microplastic particles per gram of tissue.271 Limited research on the health impacts of microplastics is currently available. It appears that there are three adverse impacts that may result from the ingestion of microplastics: the physical effects of ingestion; and toxic responses from (a) inherent contaminants leaching from the microplastics and (b) pollutants that have sorbed onto the microplastics. While very little research has been conducted into the physical effects of ingesting microplastics, two studies have found negative health impacts on blue mussels272 and Japanese medaka, a widely accepted model fish species.273
According to the UN Globally Harmonised System, >50% of plastics are associated with hazardous monomers, additives and chemical byproducts.274 These include polybrominated diphenyl ethers (which provide resistance to heat), nonylphenol (which reduces oxidative damage), triclosan (which reduces microbial degradation), phthalates (which soften plastic) and Bisphenol A (which is widely used in food and beverage containers). Such chemicals may interfere with biologically important processes, potentially resulting in endocrine disruption, which in turn can impact upon mobility, reproduction and
268
Browne, M. et al., Accumulation of microplastic on shorelines worldwide: sources and sinks, Environmental Science & Technology, 2011, Vol 45(21): 9,175-9,179. See also: The Guardian, Inside the lonely fight against the biggest environmental problem you’ve never heard of, 28 October 2014 [online –accessed 6 February 2015]
269 Cole, M. et al., op. cit.; Woodall, L. et al., The deep sea is a major sink for microplastic debris, Royal Society Open Science, December 2014, 1: 140317
270 ABC News, Coral found to be eating plastic waste in the ocean, 25 February 2015
271 Reed, C., Dawn of the plasticene, New Scientist, 31 January 2015, p.32
272 Cole, M. et al., op. cit.
273 Rochman, C. et al., Ingested plastic transfers hazardous chemicals to fish and induces hepatic stress, Scientific Reports, 2013, Vol 3:3263
274 Ibid.

Briefing Paper No 03/2015
81
development, and carcinogenesis.275 Some evidence has already been found that these chemicals may be released after ingestion by biota.276
Marine plastic debris, in particular microplastics with their large surface area to volume ratio, are susceptible to contamination by waterborne pollutants such as aqueous metals, endocrine disrupting chemicals and persistent organic pollutants (POPs), which include dioxins, polychlorinated biphenyls (PCBs) and organochlorine pesticides (e.g. DDT). Many POPs are toxic, inducing endocrine disruption, mutagenesis and/or carcinogenesis.277 Plastics have been found to accumulate concentrations of pollutants up to a hundred times greater than those in sediments.278 Recent research has confirmed that pollutants sorbed onto ingested microplastics are bioaccumulated by marine wildlife.279
7.3 Sydney Harbour
In 2014, researchers from the Sydney Institute of Marine Science found “alarming” levels of microplastic pollution in Sydney Harbour. Sediment samples were taken at 27 sites across the Harbour (Figure 29). Concentrations of microplastics ranged from 0-10 to a high of 61-100 particles per 100ml of sediment in Middle Harbour. 280 Thin plastic fibres from clothing were the most commonly found particles, outnumbering flakes or balls.281
Concentrations of up to 61-100 particles per 100ml of sediment are substantially higher than found elsewhere around the world (Table 21). Other studies have found concentrations of microplastics ranging from 1 to 24 particles per 100ml. The three other estuaries listed in Table 21 had concentrations of 24 (Sweden), 8 (UK, estuary) and 2 to 16 (Tamar estuary, UK) particles per 100ml of sediment.282
275
Cole, M. et al., op. cit. 276
Browne, M. et al., Microplastic moves pollutants and additives to worms, reducing functions linked to health and biodiversity, Current Biology, 2013, Vol 23(23): 2,388-2,392
277 Cole, M. et al., op. cit.
278 Browne, M. et al., Microplastic moves pollutants and additives to worms, reducing functions linked to health and biodiversity, Current Biology, 2013, Vol 23(23): 2,388-2,392
279 Cole, M. et al., op. cit.; Browne, M. et al., Microplastic moves pollutants and additives to worms, reducing functions linked to health and biodiversity, Current Biology, 2013, Vol 23(23): 2,388-2,392; Rochman, C. et al., op. cit.
280 The Guardian, Sydney harbour’s plastic pollution at ‘alarming’ levels, scientists find, 25 August 2014 [online – accessed 9 February 2015]
281 ABC News, Invisible threat: microplastic contamination discovered on bottom of Sydney Harbour, 22 August 2014 [online – accessed 9 February 2015]
282 Note: it is unclear from some of these studies whether the values given are averages or maximums, thereby potentially limiting the comparability of these figures.

NSW Parliamentary Research Service
82
Figure 29: The distribution of microplastics in Sydney Harbour283
In August 2014, at the time the Sydney Harbour research findings were announced, Rob Stokes, the NSW Minister for the Environment, announced that he had convened a working group to work towards phasing out microbeads by 2016 through voluntary means.284 He also called for a national ban on the sale and production of shampoos and other products containing microbeads.285
Overseas, in May 2014 the New York State Assembly passed a bill that proposes a phase-out deadline for microbeads of 2015.286 Illinois banned the sale of cosmetics containing plastic microbeads in June 2014, with a phase out period between 2017 and 2019,287 while a similar bill was defeated in California in August 2014.288 In December 2014, the Netherlands, Austria, Belgium and
283
SMH, Tiny threats beneath harbour, 25 August 2014 284
ABC News, NSW push to phase out use of ‘microplastics’ in personal care products, 29 August 2014 [online – accessed 9 February 2015]; NSW PD, 22 October 2014, p.1,681
285 SMH, NSW calls for national ban on shampoo additives that are choking the oceans, 28 August 2014 [online – accessed 9 February 2015]
286 Cosmetics design, New York Senator pushes legislation to ban microbeads, 3 November 2014 [online – accessed 9 February 2015]
287 Time, Know what’s in your face wash: why Illinois banned microbeads, 24 June 2014 [online – accessed 9 February 2015]
288 Planet Experts, California microbead ban fails to pass in State Senate, 27 August 2014

Briefing Paper No 03/2015
83
Sweden, with the support of Luxembourg, issued a joint call to ban the microplastics used in detergents and cosmetics.289
Table 21: International comparisons of microplastic contamination290
Location Particles per 100ml sediment
Sydney Harbour 0-10 to 61-100
Sweden (harbour) 24
UK, subtidal 12
UK, estuary 8
UK, beach 1
Tamar estuary, UK 2 to 16
Chagos Archipelago, Indian Ocean, beach 9
18 shores across 6 continents 0.8 to 12.4*
Western Australia 0.8*
Portugal 12.4*
UK 12.4*
Deep sea sediments (North Atlantic Ocean, Mediterranean Sea & SW Indian Ocean)
26.8
* Converted from Browne et al (2011) study which used particles per 250ml sediment
As of 2014, Unilever, which owns the Dove brand, has announced that it will start phasing out the use of microbeads in January 2015 and finish its phase out by the end of 2015. Other companies that have stated they will phase out microbeads include L’Oreal, Johnson & Johnson, The Body Shop and Beiersdorf, which owns the Nivea brand.291
[online – accessed 9 February 2015]
289 EurActiv, Dutch rally support for microplastic ban to safeguard their mussels, 17 December 2014 [online – accessed 9 February 2015]
290 Sources: Browne, M. et al., Spatial patterns of plastic debris along estuarine shorelines, Environmental Science & Technology, 2010, Vol 44(9): 3,404-3,409; Browne, M. et al., Accumulation of microplastic on shorelines worldwide: sources and sinks, Environmental Science & Technology, 2011, Vol 45(21): 9,175-9,179; The Guardian, Sydney harbour’s plastic pollution at ‘alarming’ levels, scientists find, 25 August 2014 [online – accessed 9 February 2015].
291 ABC News, NSW push to phase out use of ‘microplastics’ in personal care products, 29 August 2014 [online – accessed 9 February 2015]; SMH, Unilever says it will ban face scrub product polluting harbour in two months, 23 November 2014 [online – accessed 9 February 2015]

NSW Parliamentary Research Service
84
8. A SYDNEY HARBOUR REPORT CARD
Research completed at Sydney University in 2014 assessed the condition of Sydney Harbour and its sub-catchments and sub-estuaries (Figure 30).292 Each sub-catchment/sub-estuary was graded on three indicators – catchment pressures, water quality and sediment quality. These grades were combined into an overall grade. Management priorities were allocated to each sub-catchment/sub-estuary according to their condition. Note that some pollutants are not taken into account in the analysis e.g. dioxins. This research is therefore indicative of the state of the Harbour and its sub-catchments.
Figure 30: Sub-catchment/sub-estuary systems of Sydney Harbour293
8.1 Catchment pressures
The catchment pressure grade assigned to each sub-catchment/sub-estuary was calculated using the following indicators:
Percentage of the catchment area which is urbanised;
292
Gunns, T., op. cit. 293
Ibid., p.62

Briefing Paper No 03/2015
85
Population density;
Percentage of the original area that has been reclaimed;
Condition of riparian vegetation of creeks and rivers;
Enrichment of metals in catchment soils;
Metal yield from catchment; and
Nutrient yield from catchment.
Blackwattle/Rozelle Bay had the highest pressure grade (Figure 31), significantly greater than the next highest sub-catchment, Iron Cove. Upper Middle Harbour and North Harbour had the lowest pressure grades.
Figure 31: Pressure grades for Sydney Harbour294
While catchment pressures were significantly correlated with sedimentary indicators, there was no correlation with water quality. This suggests that other factors such as flushing rates and estuary morphodynamics may influence water quality.
8.2 Water quality
The water quality grade assigned to each sub-catchment/sub-estuary was calculated using the following indicators:
294
Ibid., p.81

NSW Parliamentary Research Service
86
Chlorophyll-a – a general indicator of plant biomass, increased levels of chlorophyll-a may denote eutrophication295 of the water body;
Dissolved oxygen – low levels can significantly affect aquatic organisms such as fish, and may increase the toxicity of pollutants such as copper, lead and zinc;
Turbidity – significant impacts of suspended particulate matter include a reduction in light availability; and
Nutrients (total nitrogen and total phosphorus) – excess nutrients may cause eutrophication.
The lowest water quality grades were found furthest from the Harbour mouth in the Duck River, Homebush Bay, Parramatta River and Lower Parramatta River (Figure 32). North Harbour, Lower Middle Harbour and Middle Estuary had the highest water quality.
Figure 32: Water quality grades for Sydney Harbour296
295
Eutrophication is the enrichment of a water body with chemical nutrients, leading to excessive plant growth. As a result, dissolved oxygen levels decrease causing the death of other organisms such as fish.
296 Gunns, T., op. cit., p.83

Briefing Paper No 03/2015
87
8.3 Sediment quality
Sediment quality was assessed using two indicators:
The Human Impact Index – a measure of the increased levels of pollutants since European settlement using copper, lead and zinc as indicative pollutants; and
The Benthic Health Index – a measure of the potential toxicity of the sediment using copper, lead and zinc as indicative pollutants.
The worst sediment quality grades were found in Blackwattle/Rozelle Bay, Iron Cove and Hen and Chicken Bay (Figure 33). Upper Middle Harbour and Lower Middle Harbour had the best sediment quality grades.
Figure 33: Sediment quality grades for Sydney Harbour297
8.4 Final assessment grade and management implications
The catchment pressure, water quality and sediment quality grades were combined to give a final assessment grade for each sub-catchment/sub-estuary (Figure 34). The western and southern parts of the Harbour all received lower grades than the northern parts, with Blackwattle/Rozelle Bay, Iron Cove and Homebush Bay having the lowest grades of all. North Harbour, Upper Middle Harbour and Lower Middle Harbour had the highest grades.
297
Ibid., p.84

NSW Parliamentary Research Service
88
Figure 34: Final assessment grade for Sydney Harbour298
The sub-catchments of the Harbour are listed in descending order from the highest priority to the lowest priority in Table 22. Management priorities were derived from the final assessment grades. According to the author, this assessment scheme:
… provides managers with a tool to assist in the identification of ‘priority’ sub-catchment/sub-estuary systems, as well as areas and issues of concern …
… [the] ability to prioritise estuarine management improves the efficiency of management actions and facilitates the development of effective, appropriate and targeted long-term management strategies. An understanding of the relationships between catchment pressures and estuarine condition may also be used to identify the source and pathways of contamination to an estuary,
allowing appropriate management actions to be developed.299
298
Ibid., p.80 299
Ibid., p.94

Briefing Paper No 03/2015
89
Table 22: Management priorities for Sydney Harbour300
Sub-catchment/
sub-estuary Overall priority
Sediment quality priority
Water quality priority
Blackwattle/Rozelle Bay High High Medium Low
Iron Cove High High Medium Low
Homebush Bay High Medium High High
Duck River High Medium High High
Hen and Chicken Bay Medium High High Medium Low
Upper Estuary Medium High Medium High Medium High
Lower Parramatta River Medium High Medium Low High
Parramatta River Medium High Low High
Lower Estuary Medium Low Low Low
Middle Estuary Medium Low Medium Low Low
Lane Cove River Medium Low Low Medium High
Central Middle Harbour Medium Low Medium High Low
Lower Middle Harbour Low Low Low
Upper Middle Harbour Low Low Medium Low
North Harbour Low Low Low
300
Adapted from: Ibid., p.94

NSW Parliamentary Research Service
90
9. CONCLUSION
While Sydney Harbour and its tributaries are visually cleaner today than they have been anytime in the past century, they are still some of the most polluted in the world when it comes to contaminants like dioxins and heavy metals. Many of these pollutants entered the Harbour as industrial effluent during a time when industrial practices were poorly regulated. While this no longer occurs, pollutants nevertheless continue to enter the Harbour, via stormwater, sewage overflows and through leachate from contaminated reclaimed land.
With regards to the pollution currently in the Harbour, it appears that remediation of polluted sediments is technically and financially impractical. It seems that the only way to address the problem is to wait until sediments cover the contaminated layer. The environmental impacts of these pollutants are expected to continue for decades, if not centuries.
On the other hand, much can be done to minimise further pollution entering the Harbour. Action is already being taken to eliminate microbeads in cosmetics, shampoos and facial-cleansers. Improved stormwater management can significantly reduce levels of heavy metals and other pollutants. Key initiatives include the soon to be released Greater Sydney Local Land Services’ Sydney Harbour Catchment Water Quality Improvement Plan. Coastal Zone Management Plans are also in place for the Lane Cove River and Parramatta River, and the Sydney Harbour (Middle Harbour/Port Jackson) plan is under development.
Significant knowledge gaps remain, not least of which is an understanding of the social and economic impacts of pollution. Other research topics of particular importance include emerging contaminants, stormwater impacts on ecosystem function and any safe and efficient means for restoring or remediating polluted sediments. These and other questions, key to the future of Sydney Harbour, are progressively being addressed by stakeholders such as the Sydney Institute of Marine Science.

Briefing Paper No 03/2015
91
APPENDIX 1
Timeline of regulatory and parliamentary events
Year Events
1832 Harbours Act 1832
1833 Sydney Police Act 1833
1849 Sydney Slaughter-houses Act 1849
1850 Sydney Abattoir Act 1850
1850 Sydney Sewerage Act 1850
1853 Sydney Sewerage Act 1853
1860 Abattoir Road Act of 1860
1861 Crown Lands Alienation Act of 1861
1864 Select Committee on Darling Harbour and Blackwattle Bay
1866 Commission appointed to inquire into the condition of the harbour of Port
Jackson
1873 Blackwattle Bay Land Reclamation Act 1873
1875 Inquiry into Sydney city and suburban sewerage and health board
1879 Board appointed to inquire into and report upon the condition and management
of the public abattoir, Glebe Island
1880 Nuisances Prevention Act 1875
1880 Royal Commission to inquire into and report upon the actual state and prospect
of the fisheries of this Colony
1882 Royal Commission to inquire into the nature and operations of, and to classify
noxious and offensive trades, within the city of Sydney and its suburbs, and to report generally on such trades
1887 Standing Committee of the Legislative Council on site for noxious trades
1892
Standing Committee on Public Works: Inquiry into the expediency of extending the railway to Darling Island, the construction of wharfage accommodation at that place, the reclamation of certain foreshores around Darling Island, and the resumption of land in connection therewith.
1901 Sydney Harbour Trust Act 1901
1918 Royal Commission of inquiry on the Homebush abattoirs and on the Meat
Industry Act, 1915
1927 Oil in Navigable Waters Act 1927
1930 Reclamation Act 1930
1935 Maritime Services Act 1935
1941 Pollution of Navigable Waters Regulations 1941, under the Navigation Act 1901
1953 Maritime Services (Amendment) Act 1953
1955 Navigable Waters (Anti-Pollution) Regulations 1955, under the Maritime
Services Act 1935. Provision for this type of regulation was introduced to the original Act by the Maritime Services (Amendment) Act 1953
1960 Prevention of Oil Pollution of Navigable Water Act 1960

NSW Parliamentary Research Service
92
1970 Water pollution in Australia [Senate Select Committee on Water Pollution]
1970 Clean Waters Act 1970
1970 State Pollution Control Commission Act 1970
June 1993 Joint Select Committee upon the Sydney Water Board: Issues Paper
April 1994 Joint Select Committee upon the Sydney Water Board
Dec 1997 Legislative Council Select Committee on the Proposed Duplication of North
Head Sewerage Tunnel
April 2000 Inquiry into Oil Spills in Sydney Harbour: Interim Report [Legislative Council
General Purpose Standing Committee No. 5]
May 2001 Inquiry into Oil Spills in Sydney Harbour: Final Report [Legislative Council
General Purpose Standing Committee No. 5]
June 2002 Redevelopment and remediation of the Rhodes Peninsula [Legislative Council
Standing Committee on State Development]
July 2003 Proposed remediation of the former Allied Feeds site, Rhodes [Commission of
Inquiry]
2005 Sydney Harbour Foreshores Area Development Control Plan 2005
2005 Sydney Regional Environmental Plan (Sydney Harbour Catchment) 2005
Sept 2008 The former uranium smelter site at Hunter’s Hill [Legislative Council General
Purpose Standing Committee No. 5]