Pollution in india
13
INDEX 1 Introduction 2 Poem on air pollution – A Choking Sky 3 Biggest contributors to pollution in India 4 Effect of air pollution 5 Level of vehicular pollutants in microgram per cubic metre 6 How to reduce vehicular pollution? 7 Graph showing fuel efficiency /mileage of different cars 8 Conclusion 9 Bibliography
Transcript of Pollution in india

INDEX1 Introduction
2 Poem on air pollution – A Choking Sky
3 Biggest contributors to pollution in India
4 Effect of air pollution
5 Level of vehicular pollutants in microgram per cubic metre
6 How to reduce vehicular pollution?
7 Graph showing fuel efficiency /mileage of different cars
8 Conclusion
9 Bibliography

INTRODUCTION
When Harmful Substances Contaminate the Environment it is Called Pollution.
Pollution refers to the very bad condition of environment in terms of quantity and quality .
There are Four types of Pollution• Air Pollution• Water Pollution• Noise Pollution• Land Pollution
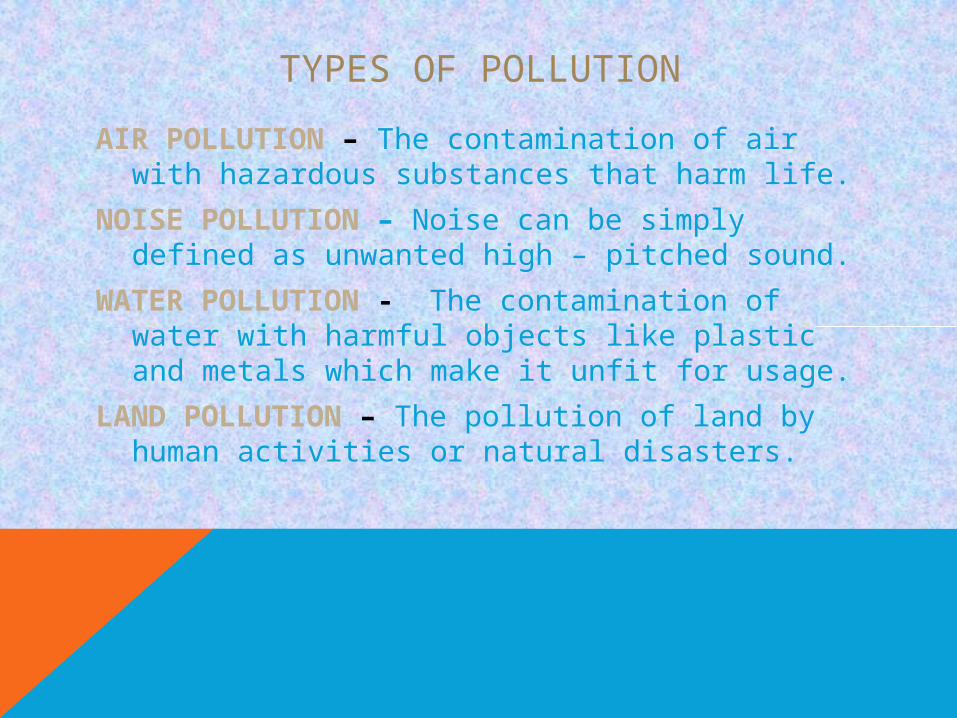
TYPES OF POLLUTION
AIR POLLUTION – The contamination of air with hazardous substances that harm life.
NOISE POLLUTION – Noise can be simply defined as unwanted high – pitched sound.
WATER POLLUTION - The contamination of water with harmful objects like plastic and metals which make it unfit for usage.
LAND POLLUTION – The pollution of land by human activities or natural disasters.

A Choking SkyWatching smoke stacks choke the
skyAlways makes me want to cry.I just can't help but wonder whyThe factories won't even tryTo find a safer, better wayTo put their poisonous waste away.
POEM ON AIR POLLUTION
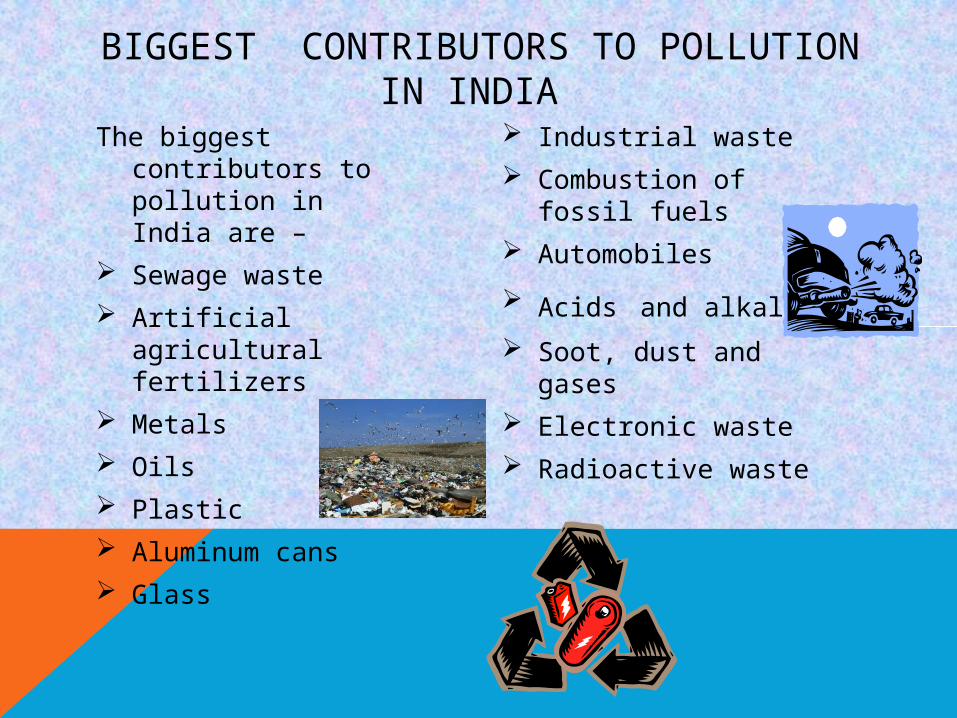
The biggest contributors to pollution in India are –
Sewage waste Artificial agricultural
fertilizers Metals Oils Plastic Aluminum cans Glass
Industrial waste Combustion of fossil fuels Automobiles
Acids and alkalis Soot, dust and gases Electronic waste Radioactive waste
BIGGEST CONTRIBUTORS TO POLLUTION IN INDIA
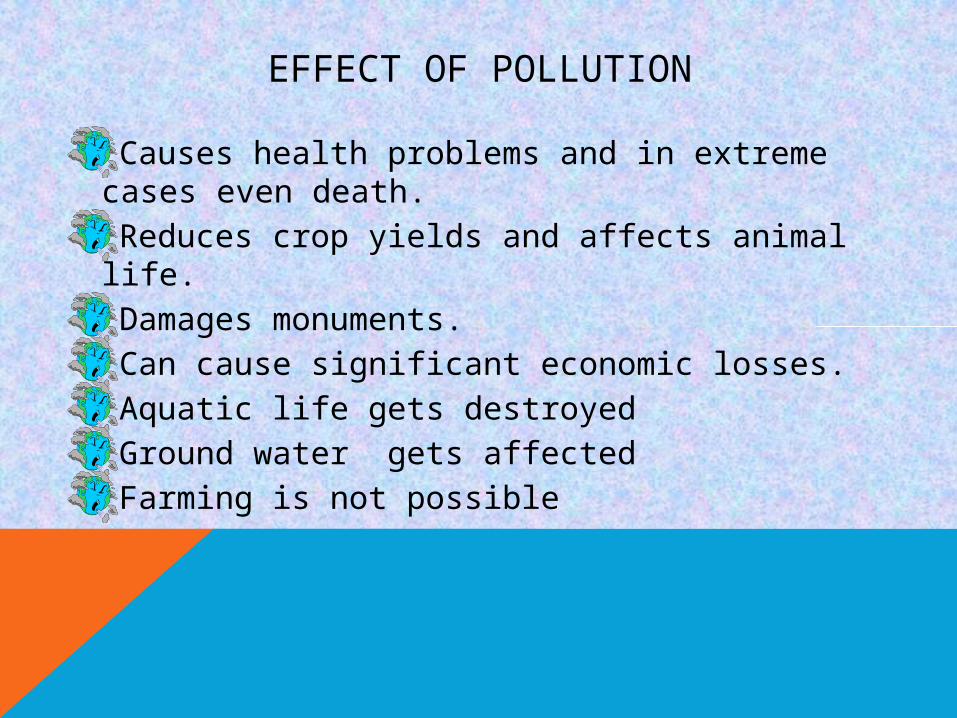
EFFECT OF POLLUTION
Causes health problems and in extreme cases even death.Reduces crop yields and affects animal life. Damages monuments. Can cause significant economic losses.Aquatic life gets destroyedGround water gets affectedFarming is not possible
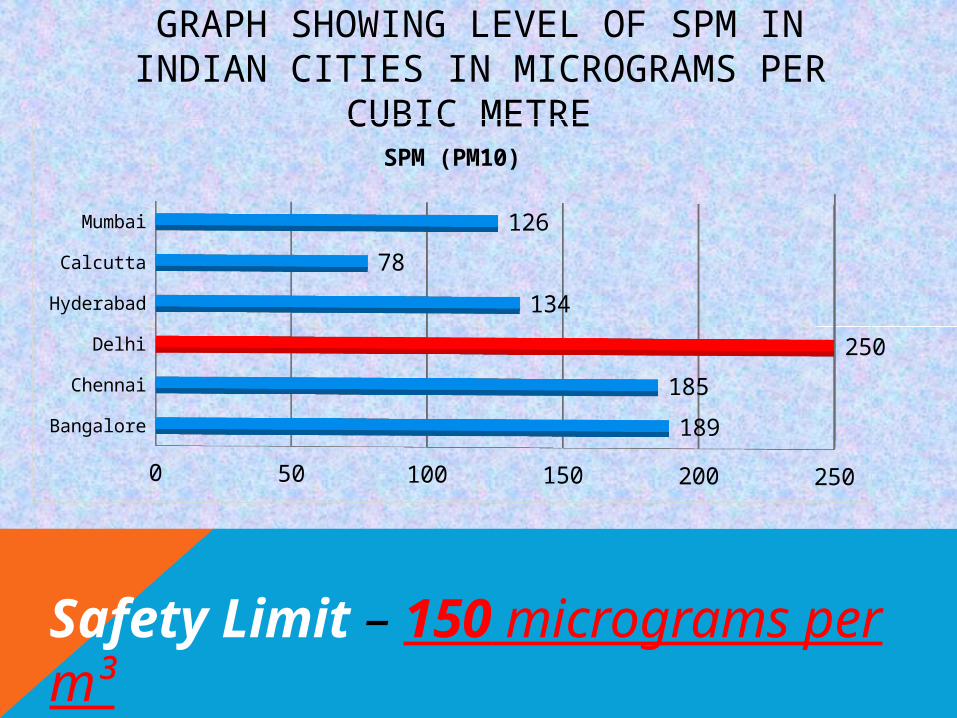
GRAPH SHOWING LEVEL OF SPM IN INDIAN CITIES IN MICROGRAMS PER CUBIC METRE
Bangalore
Chennai
Delhi
Hyderabad
Calcutta
Mumbai
0 50 100 150 200 250
189
185
250
134
78
126
SPM (PM10)
Safety Limit – 150 micrograms per m³
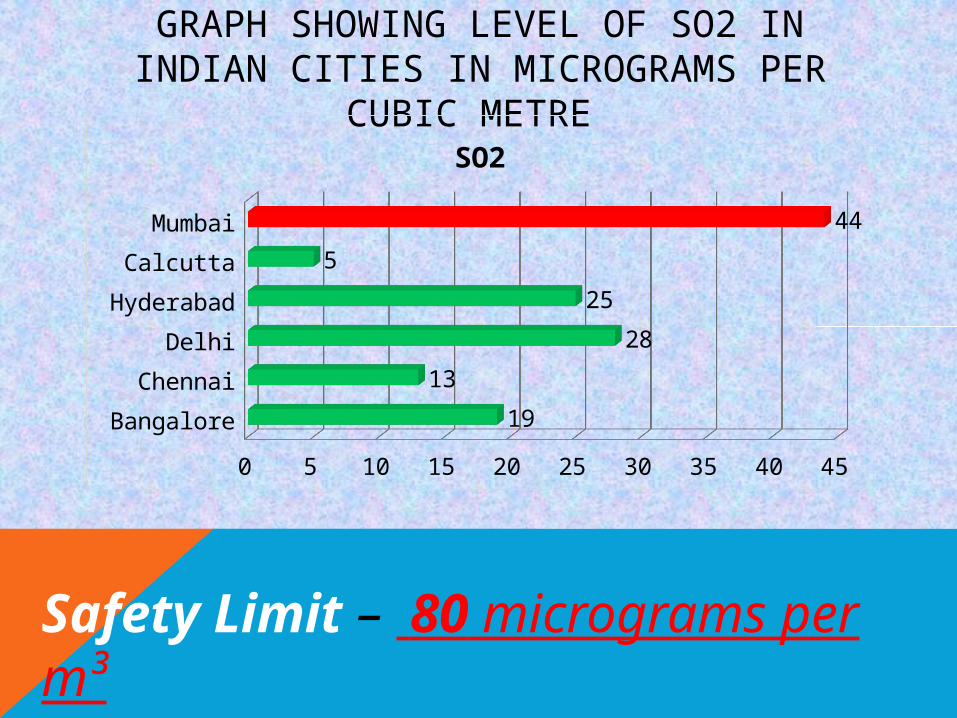
GRAPH SHOWING LEVEL OF SO2 IN INDIAN CITIES IN MICROGRAMS PER CUBIC METRE
Bangalore
Chennai
Delhi
Hyderabad
Calcutta
Mumbai
0 5 10 15 20 25 30 35 40 45
19
13
28
25
5
44
SO2
Safety Limit – 80 micrograms per m³
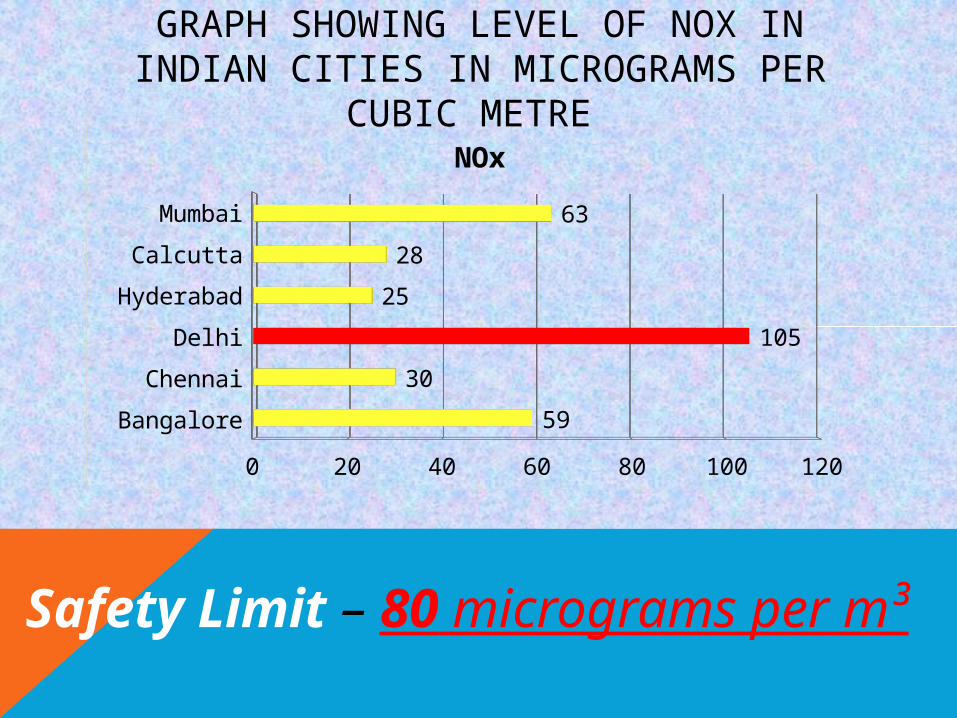
Bangalore
Chennai
Delhi
Hyderabad
Calcutta
Mumbai
0 20 40 60 80 100 120
59
30
105
25
28
63
NOx
Safety Limit – 80 micrograms per m³
GRAPH SHOWING LEVEL OF NOX IN INDIAN CITIES IN MICROGRAMS PER CUBIC METRE

HOW TO REDUCE VEHICULAR POLLUTION
Plant more trees along busy roads
Choose low-polluting models of vehicles
Use CNG
Use carpool and public transport or bicycles if it is a
short distance
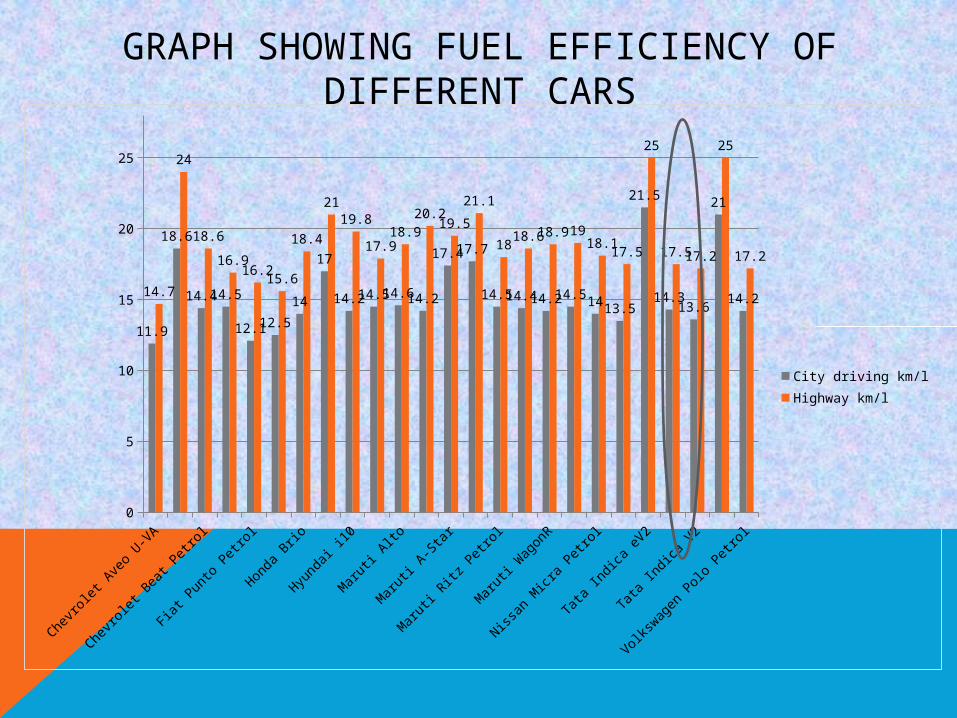
GRAPH SHOWING FUEL EFFICIENCY OF DIFFERENT CARS
Chevr
olet
Ave
o U-V
A
Chevr
olet
Bea
t Die
sel
Chevr
olet
Bea
t Pet
rol
Chevr
olet
Spa
rk
Fiat P
unto
Pet
rol
Ford
Figo
Pet
rol
Honda
Brio
Hyund
ai E
on
Hyund
ai i1
0
Hyund
ai S
antro
Xin
g
Marut
i Alto
Marut
i Alto
K10
Marut
i A-S
tar
Marut
i Ritz
Die
sel
Marut
i Ritz
Pet
rol
Marut
i Swift
Pet
rol
Marut
i Wag
onR
Marut
i Zen
Est
ilo
Nissan
Micr
a Pe
trol
Skod
a Fa
bia
Tata
Indi
ca e
V2
Tata
Indi
ca e
V2 XET
A
Tata
Indi
ca V
2
Tata
Nan
o 20
12
Volks
wagen
Pol
o Pe
trol
0
5
10
15
20
25
11.9
18.6
14.414.5
12.112.5
14
17
14.214.514.614.2
17.417.7
14.514.414.214.5 14 13.5
21.5
14.313.6
21
14.214.7
24
18.6
16.916.2
15.6
18.4
2119.8
17.918.9
20.219.5
21.1
1818.618.9 19
18.117.5
25
17.517.2
25
17.2
City driving km/lHighway km/l
CONCLUSION1. Pollution is caused mainly because of humans
and natural disasters.2. The main cause of air pollution are
vehicles(approximately 72% contribution.) 3. We should use public transport or low – polluting
vehicles to reduce air pollution. 4. The most fuel efficient car is Tata Indica eV2
followed closely by Tata Nano 2012.

BIBLIOGRAPHY
• eschooltoday.com/pollution/air-pollution/effects-of-air-pollution.html
• Pollution in India - http://www.gits4u.com/envo/envo4.htm
• Websites of the State Pollution boards in India
• http://www.ibtimes.co.in/articles/384409/20120914/top-ten-mileage-cars-india-fuel-efficeint.htm
• http://www.slideshare.net/samuelkrobinson/reduce-carbon-today-vehicle-pollution-prevention