Polluted Air Quality Component Analysis from Stack ... · Polluted Air Quality Component Analysis...
12
Pakistan Journal of Meteorology Vol. 12, Issue 23: Jul, 2015 13 Polluted Air Quality Component Analysis from Stack Emission and its Hazardous Consequences on Human Health. Khan, M. K. 1, 2 , S. R. Gilani 2 , K. P. Bhatti 2 Abstract The health impacts of air pollution have received more attention and have recently been subject to extensive study. Exposures to air pollutants have been linked to lung and cardiovascular disease and increases in both hospital admissions and mortality. The present research work was designed to monitor and estimate the Nitrogen Oxides (NOx) Sulphur oxides (SOx), CO and Particulate Matter that correlates with climate parameters and check its hazards effect on human health. The research work was executed at Department of Chemistry with the collaboration of Environmental Laboratories Sheikhupura by Dragger tube which is fast and reliable method, with some classical absorption method. Pollutant concentration at source emission was measured. The questionnaires about the health of employees were also asked to check the hazardous effect on human health. The obtained results were compared with the guidelines of Environment Protection Department which are known as National Environmental Quality Standard (NEQS). Out of twenty, fifteen were found exceeding the NEQS limits. Employees who are working in the highly polluted industries were mostly suffering from lungs diseases. Overall, only five industries emissions were found safe according to Punjab environment protection department guidelines. Key Words: Air pollution from industries, Air pollution control, Environment and Health Aspects. Introduction Air is the most vital component, without which the question of our survival does not exist beyond a few minutes. A human being of normal height and health respires 22,000 time a day and the air consume in course of such respiration is about 20 times more than the quantity of food consumed by human being. (Yadav 2008).Air pollution is composed of a complex mixture of substances that have well characterized adverse effects on human health. One of the well known examples of air pollution increasing morbidity and mortality is the 1952 London Smog (Laumbach., 2010).Weather conditions at that time caused a sharp increase in ambient air pollution levels and over the passing few days, greater than three times as many people died as would otherwise have been expected. A great deal has modified since that incident with guidelines and legislation restricting pollution levels in many regions of the world to well below the levels in the 1950's (WHO 2006).Despite that, major concerns over more long term effects of pollution remain. A number of health science studies have shown that air pollution can account for 1–2 years of life shortening in those exposed to higher concentrations (Brunekreef and Holgate 2002). Component of Air Pollutions When considering which component of Air pollution is responsible for these adverse health effects, it is important to recognize that this is a heterogeneous mixture of substances commonly composed of gases, volatile organic compounds (e.g., Benzene), and particulate matter (Vargas et al 2011 and Chen 2008).Particulate matter itself is a mixture of components and contains, among others, microbial particles (bacteria, spores), pollen, organic carbon, inorganic sulfates, nitrates, polycyclic aromatic hydrocarbons, and heavy metals particles (WHO., 2000). Effect on Air pollution in Human Human respiratory system has a number of mechanisms for protection from air pollution. Bigger particle (>10 μm) can be trapped by the hair and sticky mucus in the lining of nose. Smaller particle can reach traceobronchial system and there get reached in mucus. They are pulled back to throat by beating of hair like form of cilia from where they can be removed by spitting or swallowing. Sulphur 1 [email protected] 2 Department of Chemistry, University of Engineering and Technology, Lahore, Pakistan.
-
Upload
truongkhanh -
Category
Documents
-
view
221 -
download
0
Transcript of Polluted Air Quality Component Analysis from Stack ... · Polluted Air Quality Component Analysis...
Pakistan Journal of Meteorology Vol. 12, Issue 23: Jul, 2015
13
Polluted Air Quality Component Analysis from Stack Emission
and its Hazardous Consequences on Human Health.
Khan, M. K.1, 2, S. R. Gilani2, K. P. Bhatti2
Abstract
The health impacts of air pollution have received more attention and have recently been subject
to extensive study. Exposures to air pollutants have been linked to lung and cardiovascular
disease and increases in both hospital admissions and mortality.
The present research work was designed to monitor and estimate the Nitrogen Oxides (NOx)
Sulphur oxides (SOx), CO and Particulate Matter that correlates with climate parameters and
check its hazards effect on human health. The research work was executed at Department of
Chemistry with the collaboration of Environmental Laboratories Sheikhupura by Dragger tube
which is fast and reliable method, with some classical absorption method. Pollutant
concentration at source emission was measured. The questionnaires about the health of
employees were also asked to check the hazardous effect on human health. The obtained results
were compared with the guidelines of Environment Protection Department which are known as
National Environmental Quality Standard (NEQS). Out of twenty, fifteen were found exceeding
the NEQS limits. Employees who are working in the highly polluted industries were mostly
suffering from lungs diseases. Overall, only five industries emissions were found safe according
to Punjab environment protection department guidelines.
Key Words: Air pollution from industries, Air pollution control, Environment and
Health Aspects.
Introduction
Air is the most vital component, without which the question of our survival does not exist beyond a few
minutes. A human being of normal height and health respires 22,000 time a day and the air consume in
course of such respiration is about 20 times more than the quantity of food consumed by human being.
(Yadav 2008).Air pollution is composed of a complex mixture of substances that have well
characterized adverse effects on human health. One of the well known examples of air pollution
increasing morbidity and mortality is the 1952 London Smog (Laumbach., 2010).Weather conditions
at that time caused a sharp increase in ambient air pollution levels and over the passing few days, greater
than three times as many people died as would otherwise have been expected. A great deal has modified
since that incident with guidelines and legislation restricting pollution levels in many regions of the
world to well below the levels in the 1950's (WHO 2006).Despite that, major concerns over more long
term effects of pollution remain. A number of health science studies have shown that air pollution can
account for 1–2 years of life shortening in those exposed to higher concentrations (Brunekreef and
Holgate 2002).
Component of Air Pollutions
When considering which component of Air pollution is responsible for these adverse health effects,
it is important to recognize that this is a heterogeneous mixture of substances commonly composed
of gases, volatile organic compounds (e.g., Benzene), and particulate matter (Vargas et al 2011 and
Chen 2008).Particulate matter itself is a mixture of components and contains, among others,
microbial particles (bacteria, spores), pollen, organic carbon, inorganic sulfates, nitrates, polycyclic
aromatic hydrocarbons, and heavy metals particles (WHO., 2000).
Effect on Air pollution in Human
Human respiratory system has a number of mechanisms for protection from air pollution. Bigger
particle (>10 µm) can be trapped by the hair and sticky mucus in the lining of nose. Smaller particle
can reach traceobronchial system and there get reached in mucus. They are pulled back to throat by
beating of hair like form of cilia from where they can be removed by spitting or swallowing. Sulphur
1 [email protected] 2 Department of Chemistry, University of Engineering and Technology, Lahore, Pakistan.

Polluted Air Quality Component Analysis from Stack Emission ... Vol. 12
14
dioxide causes damage of respiratory passage and can cause bronchitis like conditions. In the
attachment of suspended particulates, SO2 can form acid sulphate particles which can go deep into
the lungs and affect them severely. Oxide of nitrogen especially NO2 can irritate the lungs and
cause condition like chronic bronchitis and emphysema. Carbon monoxide reaches the lungs and
combine with hemoglobin of blood to form carboxyhaemoglobin.CO has affinity for hemoglobin
210 times more than oxygen. Hemoglobin’s therefore, unable to transport oxygen to various part of
body and this cause suffocation. Long exposure to CO may cause wooziness, unconsciousness and
can cause to death. Suspended particulate can cause damage to lung tissue and can cause asthma,
bronchitis and cancer especially when they bring with them cancer causing or toxic pollutant
attached on their surface (Kaushik, 2008). A large fraction of pollutants that are inhaled will be
ingested and rapidly enter the intestine. Gaseous pollutants also relate with serious inflammation,
which may further impact on the intestine (Martinez et al 2007).
Pollution and Intestine Problems
This is the fact that the oral route accounts for much exposure to air pollutants as the pollutants
contaminate both the food and water supply in significant amounts (ECSC., 2002).Additionally,
human health studies have shown that all larger particles (N6 μm) are quickly cleared from the
lungs and transported to the intestinal tract by mucociliary clearance (Kreyling et al., 2004 & Moller
et al., 2004).In this way, a large amount of pollutants that are inhaled will be ingested and rapidly
enter the intestine. Gaseous pollutants also relate with serious inflammation, which may further
cause serious effect on the intestine (Vidgren et al., 1995). A small number of health studies have
found an association between air pollution and a number of different aspects of intestinal disease
for example, a few studies have linked exposure to air pollutants to digestive tract cancers.
(Gaeciduenas et al., 2007).The experts suggest an explanation for this association by referring to
the increase in tumor necrosis factor (TNF)-α caused by inhalation of diesel exhaust particles
(DEPs) and, because appendicitis is an serious inflammatory condition, this develop in pro-
inflammatory cytokines could trigger appendicitis. An Italian pediatric research study used a similar
case– crossover design to investigate an association between pollution and emergency room visits
for wheezing and episodes of diarrhea and vomiting in 6 centers. Carbon monoxide exposure and
its effects in the winter was modestly associated with enteric disease in approximately 25,000 cases
were reported (3.8% increase; 95% CI 1.0–6.8 per 1.1 μg/m3 increase in carbon monoxide) but
other pollutants did not reach significance; (Mills et al., 1995).Interestingly, no link was found
between intestinal disorders and a number of indices of air pollution in research study of adults
(Orazzo., 2009).The discovery of genes linked to susceptibility to IBD has been a major
breakthrough over the last decade, however, this only explains 20% of the hereditary variance and
suggests that environmental factors likely contribute more than genes to disease pathogenesis
(Lipset., 2004).
Affect of Pollutants Chemistry on Environment
NOx are transparent to most wavelengths of light (although NO2 has a brownish color and the rare
N2O3 is black), they allow the vast majority of photons to pass through and therefore, have a
lifetime of at least several days. Because NO2 is recycled from NO by the photo reaction of volatile
organic compound (VOC) to make more ozone, NO2 seems to have an even longer lifetime and is
capable of traveling considerable distances before creating ozone. Weather systems usually travel
over the earth’s surface and allow the atmospheric effects to move downwind for several hundred
miles. Differences in the distance estimates between the emission of NOx and the generation of
ozone may be related to differences in plume transport (wind) speeds as well as other
meteorological and air quality factors. At high temperature combustion can convert sulfur in fuel
to SO2 and SO3. While SO2 is toxic and forms sulfurous acid when dissolved in water, SO3 is both
toxic and hygroscopic (moisture absorbing) and forms sulfuric acid by combining with moisture in
the atmosphere. SO2 and SO3 form sulfites and sulfates when their acids are neutralized. Both of
these acids can form solid particles by reacting with ammonia in air. SO2 and SO3 also contribute
to pH (acidity) changes in water, which can adversely affect both land and aquatic life. Therefore,
both NOx and SOx from combustion can kill plants and animals (Hirano et al., 1999).
Issue 23 Khan, M. K., S. R. Gilani, K. P. Bhatti
15
Prohibition on Certain Discharges or Emissions
According to Punjab Environment Protection Act of Sc-11
No one is permission to emit or discharge emission of any waste material like air
pollution and liquid and solid effluents.
Parameters of effluents does not exceed the NEQS limit the standards established
under sub-clause (I) of clause (g) of sub-section (1) of section 6
Government can levy a pollution penalty to a person or company or industry who fails
to comply with the provision of this act. (PEPA 1997)
Disposal of Waste and Effluents
According to the Sc-14 of factories act:
(1) Effective arrangement shall be made in every factory for the disposal of wastes and
effluents due to the manufacturing process carried on there.
(2) The Provincial Government may make rules prescribing the arrangements to be
made under sub-section (1) or requiring that the arrangements made in accordance with
that sub-section shall be subject to the approval of such authority as may be prescribed
(Factory Act 1934).
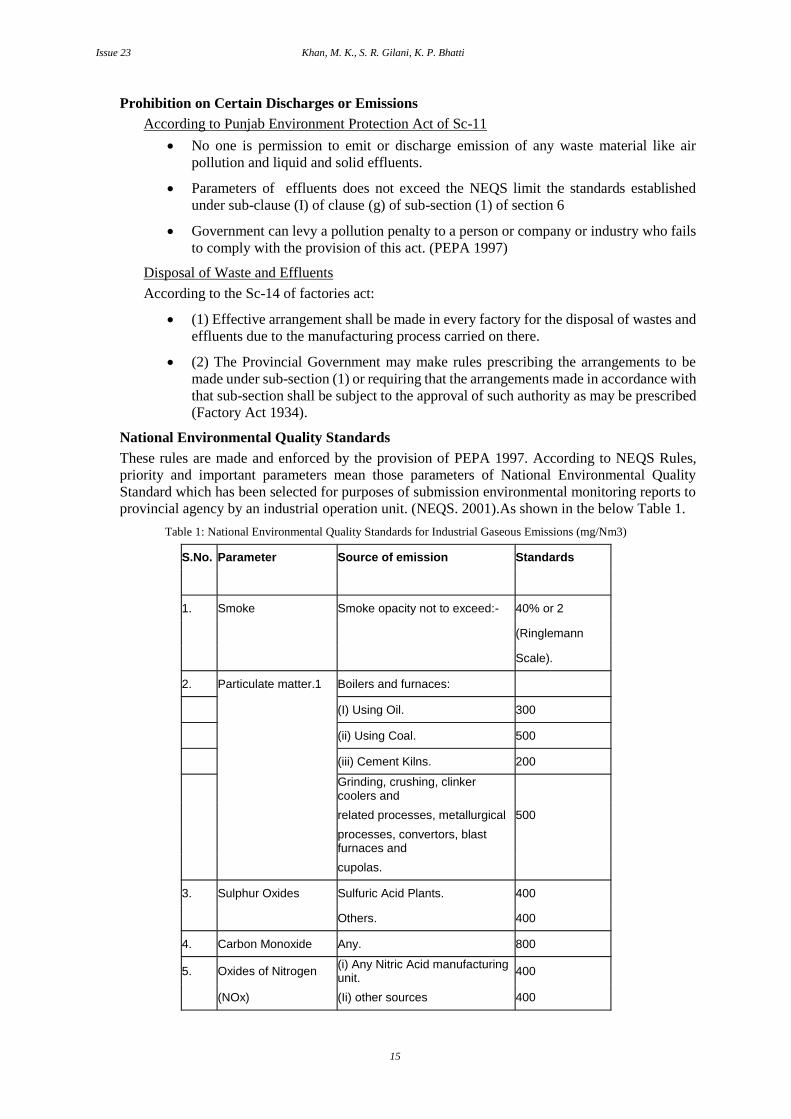
National Environmental Quality Standards
These rules are made and enforced by the provision of PEPA 1997. According to NEQS Rules,
priority and important parameters mean those parameters of National Environmental Quality
Standard which has been selected for purposes of submission environmental monitoring reports to
provincial agency by an industrial operation unit. (NEQS. 2001).As shown in the below Table 1.
Table 1: National Environmental Quality Standards for Industrial Gaseous Emissions (mg/Nm3)
S.No. Parameter Source of emission Standards
1. Smoke Smoke opacity not to exceed:- 40% or 2
(Ringlemann
Scale).
2. Particulate matter.1 Boilers and furnaces:
(I) Using Oil. 300
(ii) Using Coal. 500
(iii) Cement Kilns. 200
Grinding, crushing, clinker coolers and
related processes, metallurgical 500
processes, convertors, blast furnaces and
cupolas.
3. Sulphur Oxides Sulfuric Acid Plants. 400
Others. 400
4. Carbon Monoxide Any. 800
5. Oxides of Nitrogen (i) Any Nitric Acid manufacturing unit.
400
(NOx) (Ii) other sources 400

Polluted Air Quality Component Analysis from Stack Emission ... Vol. 12
16
Materials & Methods
Case Study Sampling Site
In order to study the magnitude of air pollution by different pollutant component, a site was selected
in the city of Lahore –Sheikhupura Road (31.71° North latitude, 73.98° East longitude) in Pakistan.
This site has access to maximum levels of pollution that an urban population can be exposed. The
selected site was located at the Lahore-sheikhupura industrial zone. The sampling was carried out
in each industry with the help of EPA. The major pollutant analyzed there and health issues were
also discussed with employees which were directly affected from their gaseous emission. For
determination of NOx, SOx and CO with its surrounding air was monitored with Different
concentration type of dragger tube with some classical absorption methods. Flue gas analyzer was
also used for some support to measure emission component from atmosphere of industry.
Method-1 for NOx Determination
Scale tube –reddish brown oxidation layer, and its Chemical reagents present in the tube are
Chromium (VI) compound (any NO which may be present in NOx is oxidize to NO2) white
indicating layer is N, N-diphenyle-benzidine. After the chemical reaction color change to reddish
brown.
NO+Cr (VI)compound →NO2
NO2+O-diansidine→Reddish brown reaction product
Measurement
ppm (NO + NO2) =𝑆𝑐𝑎𝑙𝑒 𝑣𝑎𝑙𝑢𝑒 𝑟𝑒𝑎𝑑 − 𝑜𝑓𝑓 × 5
𝑛𝑢𝑚𝑏𝑒𝑟 𝑜𝑓 𝑠𝑡𝑟𝑜𝑘𝑒
The number of stroke can be increase up to 200
Method-2 for NOx Determination
Setup apparatus as shown in Figure 1. Took 300~400ml absorbing solution (5 %- H2O2) in 500ml
bubbler. Passed adequate amount (50~100L) of gas sample through solution while keeping the flow
rate 1L/minute. Noted temperature and atmospheric pressure at the time of sample collection.
Transferred absorbed solution from bubbler in 500ml volumetric flask & make the volume to 500ml
with distilled water. Took 50ml sample from step above solution and neutralize it to pH 7~8 with
NaOH solution. Evaporate the sample to dryness then make volume& determine Nitrate (NO3).
Calculation
Method-1 for SOx Determination
Scale tube –brownish yellow in which iodine is used as a indicating layer reagent. After the
chemical reaction color change to white.
SOx Chemical Reaction
SO2+I2+H2O→ H2SO4+2HI (Color change to white)
Method-2 for SOx Determination
The sulphur dioxide present in gas is trapped in a washing bottle comprise a dilute solution of
H2O2. Sulfuric acid formed was titrated with standard NaOH solution.
Determination
Transferred about 75 mili litre absorbing solution in the gas washing bottle and added 3 pearls
of mixed indicator solution. Titrate absorbing solution against 0.002 N-NaOH solution till red
colour disappear & green fluorescence show up. Purged the sample line and connect the
washing bottle of gas in such a way that the gas passes through the washing bottle and then
NOx as NO3 (mg/Nm3) = ppm NO3 x 500 x 1000 x 2
1000 x Gas passed at NTP

Issue 23 Khan, M. K., S. R. Gilani, K. P. Bhatti
17
through the wet test gas meter. After passing known a volume of gas disconnect the washing
bottle and titrate the absorbing solution against 0.002N-NaOH solution until the appearance of
green fluorescence. Pass 15-20 liters of gas. Record the volume of gas and mls. of NaOH
solution used.
Calculation
Gram Moles of sulphur dioxide =𝑚𝑙 𝑜𝑓 𝑁𝑎𝑂𝐻 × 𝑁𝑜𝑟𝑚𝑎𝑙𝑖𝑡𝑦 × 0.332
32
Gram moles of sample =𝑉
22.4×
P − PW
𝑃×
273
273 + 𝑡×
𝑃
760
ppm Sulphur dioxide (mole − basis) =Gram − moles of SO2
Gram mole of sample× 106
Sulphur dioxide percent =Gram − moles of SO2
Gram mole of sample× 100
Method for Carbon Monoxide Determination
Description
Scale tube –orange precleanse layer, Chemical reagents present in the tube is Chromium (VI)
compound,while indicating layer reagent is Iodine pentoxide, selenium dioxide with fuming
sulphuric acid. After the chemical reaction color change to brownish green.
CO + I2O5 . SeO2 + H2S2O7 I2 + 5CO2 (Color change to brownish green)
Cross- sensitivity:
Acetylene react in the same way as carbon as carbon monoxide. Other interfering gases like
petroleum distillate, Benzene and Hydrogen Sulphide are retained in the precleanse layer. With
fairly high concentrations of hydrocarbon, the capacity of the precleanse layer may not be
sufficient for quantitative absorption of the hydrocarbon. In order to remove this error there
should be a pretube of activated charcoal which absorb the hydrocarbons.
Measurement:
ppm CO =10 × 𝑛𝑢𝑚𝑒𝑟𝑖𝑐𝑎𝑙 𝑣𝑎𝑙𝑢𝑒 (10 − 𝑠𝑡𝑟𝑜𝑘𝑒 𝑠𝑐𝑎𝑙𝑒)
𝑛𝑢𝑚𝑏𝑒𝑟 𝑜𝑓 𝑠𝑡𝑟𝑜𝑘𝑒
The number of stroke can also be increase to n= 200, if the moisture content of the air or gas
sample does not exceed 6 mg H2O per liter.
Method for PM determination
Kept filter paper in oven at 105 oC for 30 minutes. Cool it in desiccators. Weigh out the filter paper
Note weight of filter paper as “W” Fit the filter paper in assembly. Set the assembly where the dust
is to be monitored. Adjust flow rate as 600 to 700 liter per hour. After four hours stop flow and
detach assembly.
Calculation
PM mg/m3 =𝐶 × 1000 × 1000
𝑇𝑜𝑡𝑎𝑙 𝑔𝑎𝑠 𝑝𝑎𝑠𝑠𝑒𝑑

Polluted Air Quality Component Analysis from Stack Emission ... Vol. 12
18
Results and Discussion
Respiratory diseases are in the set of indicators for air quality (WHO, 1999).A long-term energy crisis
has resulted in increased combustion of biomass fuel in industrial and household sectors in Pakistan.
Pakistan produces about 19,500MW of electric power; WAPDA provides about 11,363MW, or 58% of
this. The remaining power is supplied by the KESC and IPPs. There is currently load shedding of up to
7000MW a day (Ali & Shah., 2012). About half of the overall Pakistan’s population has no access to
electricity and per capita consumption is one of the lowest in the world. The country is facing serious
energy crisis due to shortage of electricity and gas supply. About two-third of the total electricity is
generated from fossil fuels. Pakistan heavily depends on imported energy due to limited indigenous
reserves and production of oil. The persistent shortage of electricity in the country has adversely
affected the national economy. Industrial production has been severely hit; and also triggered social
unrest which sometimes turns violent thus, creating law and order problems in many urban centers in
the country. According to one estimate power shortages have resulted in an annual loss of about 2
percent of GDP (Abbasi, 2011). Another recent study reports total industrial output loss in the range of
12 percent to 37 percent due to power outages (Siddiqui, 2011).The production, transportation,
transformation and consumption of fossil fuels also adversely affect the quality of the environment due
to indiscriminate release of toxic substances. The key notion is that a healthy work environment and a
healthy work organization deliver the employees with chances for safety, social interface and the ability
to control and forecast features of their working situation, opportunities which in turn are thought to be
useful to employee health and well-being in the organizational background (Seeman, 2000). Many large
countries around the world harbor massive air pollutants, which demand steady monitoring of these
pollutants in order to make better policies for their control. These issues have turned to attention owing
to their adverse effects on human health and ecological systems. Occupation health diseases can be
defined as any disorder arising from work place contacts which compromises worker's physical, mental
and social welfare. Generally, the introduction of Occupational health in industries and other
occupations can advantage everybody especially the management, the employers and the employees.
When the employees are healthy physically, emotionally and mentally the atmosphere within the
occupational setting becomes inspiring, calm and attractive. The efficiency increases, the company
stands better chance of development (Achalu, 2000).Cardiovascular diseases (CVD) are major cause
contributors to mortality and morbidity in South Asia. Chronic exposure to air pollution is necessary
risk factor for cardiovascular diseases, although the majority of studies to date have been conducted in
developed countries. Many of these autoimmune diseases are associated with industrialization and
urban development, as reflected in the hygiene hypothesis (Bach, 2002). Industries which violate the
air pollution rules and regulation, can create serious health problems which are often ignored. Problems
from the noise comprise poor hearing, loss of attentiveness, frustration, fatigue, restlessness and in
serious cases loss of hearing. Noise is a stress that not only harms hearing but also raises heart rate and
disturbs other physiological limitations that decrease physical performance (Horino, 1977).
Environmentalists say that PM 2.5 is a complex mixture of extremely small particles and liquid droplets
and made up of a number of components, including acids (such as nitrates and sulfates), organic
chemicals, metals, and soil or dust particles. The size of particles is directly linked to their potential for
causing health problems. Once inhaled, these particles can affect heart and lungs (Raza, 2010). The
present research represent the atmosphere of industry and health of employees. It is also shown in Table
2.
Table 2: Data Analysis
Unit. Names NOx
mg/Nm3 SOx
mg/Nm3 CO
mg/Nm3 Particulate Matter
mg/Nm3
Unit#1 130 210 610 250
Unit#2 163 194 616 284
Unit#3 140 212 657 315
Unit#4 175 196 552 210
Unit#5 217 255 582 223

Issue 23 Khan, M. K., S. R. Gilani, K. P. Bhatti
19
Unit#6 250 380 778 322
Unit#7 228 448 813 357
Unit#8 190 416 540 189
Unit#9 182 392 668 252
Unit#10 160 377 772 328
Unit#11 350 422 824 354
Unit#12 255 455 866 419
Unit#13 420 513 924 375
Unit#14 435 450 814 523
Unit#15 487 394 807 445
Unit#16 512 352 793 362
Unit#17 430 543 886 438
Unit#18 392 432 773 390
Unit#19 540 448 856 554
Unit#20 460 592 762 413
Nitrogen Oxides:
In the twenty sample, it was checked that out of twenty only the eleven samples for Nitrogen
oxides (NOx) were under the limit of national environmental quality standards and remaining were
above the NEQS level and need treatment for reduction. The sample which has the high
concentration is 540 mg/Nm3 and lowest concentration sample is 130 mg/Nm3. NOx has been
shown graphically in Figure 1
Figure 1: NOx in gas emission samples
Sulphur-Oxides
In the twenty sample, it was found that out of twenty only the ten samples for sulphur oxides
(SOx) were under the limit of national environmental quality standards and remaining were above
the NEQS level and need treatment for reduction. The sample which has the highest concentration
is 592 mg/Nm3 and lowest concentration sample is 194 mg/Nm3. So the range of SOx is from 194-
592. It is shown in Figure 2.
0
100
200
300
400
500
600
Un
it #
1
Un
it #
2
Un
it #
3
Un
it #
4
Un
it #
5
Un
it #
6
Un
it #
7
Un
it #
8
Un
it #
9
Un
it #
10
Un
it #
11
Un
it #
12
Un
it #
13
Un
it #
14
Un
it #
15
Un
it #
16
Un
it #
17
Un
it #
18
Un
it #
19
Un
it #
20
NOx ( mg/Nm3)

Polluted Air Quality Component Analysis from Stack Emission ... Vol. 12
20
Figure 2: SOx in gas emission samples.
Carbon-Monoxides
In the twenty sample, it was checked that out of twenty only the nine samples for Carbon monoxides
(CO) were under the limit of national environmental quality standards and remaining were above
the NEQS level. The range of CO in the samples were from 610-886 mg/Nm3. The flue gases from
furnace oil contain more CO than gas bas boiler. The trend of CO emission is shown in Figure 3
Figure 3: CO in gas emission samples
Particulate Matter:
In the twenty sample, it was checked that out of twenty only the four samples for particulate matter
(PM) were under the limit of national environmental quality standards and remaining were above
the NEQS level and need treatment for reduction. The range of PM is from 189-554mg/Nm3.. It is
shown in Figure 4.
Figure 4: PM in gas emission sample
0200400600800
1000
Un
it #
1
Un
it #
2
Un
it #
3
Un
it #
4
Un
it #
5
Un
it #
6
Un
it #
7
Un
it #
8
Un
it #
9
Un
it #
10
Un
it #
11
Un
it #
12
Un
it #
13
Un
it #
14
Un
it #
15
Un
it #
16
Un
it #
17
Un
it #
18
Un
it #
19
Un
it #
20
CO( mg/Nm3)
0
200
400
600
800
Un
it #
1
Un
it #
2
Un
it #
3
Un
it #
4
Un
it #
5
Un
it #
6
Un
it #
7
Un
it #
8
Un
it #
9
Un
it #
10
Un
it #
11
Un
it #
12
Un
it #
13
Un
it #
14
Un
it #
15
Un
it #
16
Un
it #
17
Un
it #
18
Un
it #
19
Un
it #
20
SOX (mg/Nm3)
0
200
400
600
Un
it #
1
Un
it #
2
Un
it #
3
Un
it #
4
Un
it #
5
Un
it #
6
Un
it #
7
Un
it #
8
Un
it #
9
Un
it #
10
Un
it #
11
Un
it #
12
Un
it #
13
Un
it #
14
Un
it #
15
Un
it #
16
Un
it #
17
Un
it #
18
Un
it #
19
Un
it #
20
PM ( mg/Nm3)
Issue 23 Khan, M. K., S. R. Gilani, K. P. Bhatti
21
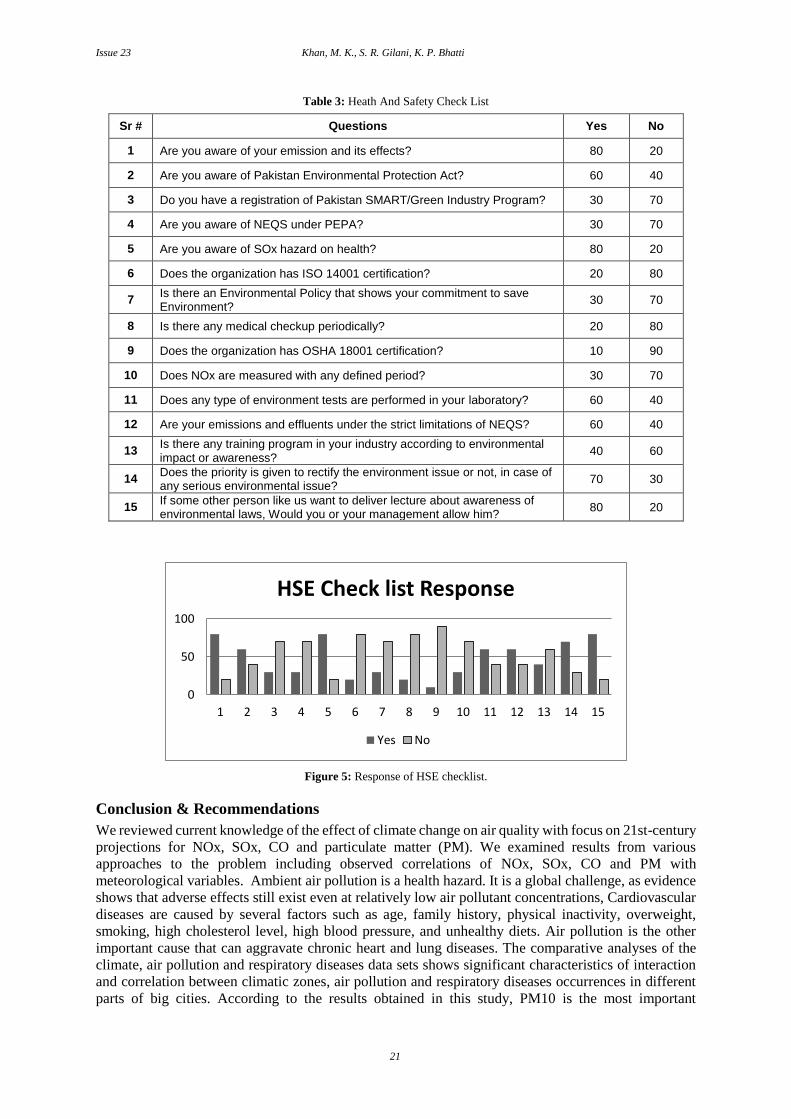
Table 3: Heath And Safety Check List
Sr # Questions Yes No
1 Are you aware of your emission and its effects? 80 20
2 Are you aware of Pakistan Environmental Protection Act? 60 40
3 Do you have a registration of Pakistan SMART/Green Industry Program? 30 70
4 Are you aware of NEQS under PEPA? 30 70
5 Are you aware of SOx hazard on health? 80 20
6 Does the organization has ISO 14001 certification? 20 80
7 Is there an Environmental Policy that shows your commitment to save Environment?
30 70
8 Is there any medical checkup periodically? 20 80
9 Does the organization has OSHA 18001 certification? 10 90
10 Does NOx are measured with any defined period? 30 70
11 Does any type of environment tests are performed in your laboratory? 60 40
12 Are your emissions and effluents under the strict limitations of NEQS? 60 40
13 Is there any training program in your industry according to environmental impact or awareness?
40 60
14 Does the priority is given to rectify the environment issue or not, in case of any serious environmental issue?
70 30
15 If some other person like us want to deliver lecture about awareness of environmental laws, Would you or your management allow him?
80 20
Figure 5: Response of HSE checklist.
Conclusion & Recommendations
We reviewed current knowledge of the effect of climate change on air quality with focus on 21st-century
projections for NOx, SOx, CO and particulate matter (PM). We examined results from various
approaches to the problem including observed correlations of NOx, SOx, CO and PM with
meteorological variables. Ambient air pollution is a health hazard. It is a global challenge, as evidence
shows that adverse effects still exist even at relatively low air pollutant concentrations, Cardiovascular
diseases are caused by several factors such as age, family history, physical inactivity, overweight,
smoking, high cholesterol level, high blood pressure, and unhealthy diets. Air pollution is the other
important cause that can aggravate chronic heart and lung diseases. The comparative analyses of the
climate, air pollution and respiratory diseases data sets shows significant characteristics of interaction
and correlation between climatic zones, air pollution and respiratory diseases occurrences in different
parts of big cities. According to the results obtained in this study, PM10 is the most important
0
50
100
1 2 3 4 5 6 7 8 9 10 11 12 13 14 15
HSE Check list Response
Yes No

Polluted Air Quality Component Analysis from Stack Emission ... Vol. 12
22
component of local air pollution. Prevention is possible by intervening the risk factors in cardiovascular
diseases such as identification of some elements in the environment and finding the place of their
distribution, avoiding the use of air pollutants or using them as little as possible, proper use of
technology, changing diets, behaviors, physical habits, reducing anxieties and mental stresses and other
environmental diseases. The research also concludes that physical environment of industry is badly
affecting the health of workers. Physical factors like chemical pollution, noise pollution, air pollution,
poor working condition, extreme heat, night shift work, extended working hours and physical work load
are associated with the health of workers and are main causes of diseases. Result shows that excessive
heat badly effect health of workers and become causes of diseases.
There should be training program for awareness of occupational work and safety and their data
should be continuous monitored and checked
There should be continuous monitoring system according to safety and environment
There should be availability of PPEs in every industry by regulatory requirement.
Concerned department should provide technical assistance to control air pollution and there
should be annual medical examination of all employees, mission to treat in case of any disease,
not to make them un-employed.
Acknowledgement
The author would like to acknowledge and thanks Dr. Syeda Rubina Gilani for her nice cooperation and
guidance. The author would also thank to the Mr. Qaiser Innayat Ali for his support to complete the
research work.
References
Abbasi, Z., 2011: Energy Crisis Costs 2 Percent of GDP Annually. Business Recorder, July 07-2011
Achalu, E. I., 2000: Occupational Health and Safety. Lagos: Simarch Nigeria Limited Splendid
Publishers.
Ali, S., and N. A. Shah, 2012: Electricity Crisis in Pakistan: Reception & Adoption of Energy Saving
Campaign Messages by PEPCO. Pakistan Journal of Social Sciences (PJSS). Vol. 32, No. 1, pp.185-
198.
Bach, J. F., 2002: The effect of infections on susceptibility to autoimmune and allergic diseases. N
Engl J; 347:911–20.
Brunekreef, B., and S. T. Holgate, 2002: Air pollution and health. Lancet; 360:1233–42.
Calderon, G. L., M. Franco-Lira, and R. Torres-Jardon, 2007: Pediatric respiratory and systemic
effects of chronic air pollution exposure: nose, lung, heart, and brain pathology. ToxicolPathol; 35:154–
62.
Calvert, G. M., E. Ward, T. M. Schnorr, and L. J. Fine, 1998: Cancer risks among workers exposed
to metalworking fluids: a systematic review. Am J Ind Med; 33:282–92.
Campbell, L. M., D. K. Stone, and G. S. Shareef, 1991: NOx Control Teschnology Data, EPA 600/2-
91-029.
Chen, H., M. S. Goldberg, and P. J. Villeneuve, 2008: A systematic review of the relation between
long-term exposure to ambient air pollution and chronic diseases. Rev Environ Health; 23:243–97.
Cho, J. H., 2008: The genetics and immune pathogenesis of inflammatory bowel disease. Nat Rev
Immunol; 8:458–66.
Czarnecki, J., C. Pereira, M. Uberoi, and K. Zak, 1994: Put a Lid on NOx Emissions, Pollution
Engineering.
ECSC-European Commission Scientific Committee on Food, 2002: Opinion on the scientific
committee on food on the risk to human health of polycyclic aromatic hydrocarbons in food. Brussels,
Belgium: European Commission.

Issue 23 Khan, M. K., S. R. Gilani, K. P. Bhatti
23
Garcia, P. J., M. F.Lopez-Cima, B. Perez-Gomez, 2010: Mortality due to tumors of the digestive
system in towns lying in the vicinity of metal production and processing installations. Sci Total Environ;
408:3102–12.
Hatwood, J., and C. Cooper, 1998: The Economic Feasibility of using Hydrogen Peroxide for the
Enhanced Oxidation and Removal of Nitrogen Oxides from Coal-Fired Power Plant Flue Gases,
,AWMA Journal, March 1998
Health Organization Regional Office for Environment, 2000: Air quality guidelines for Europe.
Copenhagen. WHO regional publications; .Report No.: 1358 3/0378-2255.
Hirano, S., S. Aoki, M. Izutsu, and Y. Yuki, 1999: Simultaneous SO2, SO3, and NOx Removal by
Commercial Application of the EBA Process, EPRI-DOE-EPA Combined Utility Air Pollution Control
Symposium: The MEGA Symposium, Atlanta.
Horino, S., 1977: Environmental factors and work performance of foundry workers. J Hum Ergol
(Tokyo), 6(2), 159-166.
Jacob, D. J., and D. A. Winner, 2009: Effect of climate change on air quality. Atmospheric
Environment; 43(1):51-63.
Jerrett, M., and R. T. Burnett, 2005: Spatial analysis of air pollution and mortality in Los Angeles.
Epidemiology; 16: 727–36.
Kaushik, A., and C. P. Kaushik, 2008: Perspectives in Environmental studies, 3rd Edition .New age
international limited, publisher.New Dehli.
Kreyling, W. G., J. D. Blanchard, and J. J. Godleski, 2006: Anatomic localization of 24- and 96-h
particle retention in canine airways. J Appl Physiol.:102: 1620-36.
Laumbach, R. J., 2010: Outdoor air pollutants and patient health. Am Fam Physician; 81:175–80.
Lipsett, M., S. Hurley, and B. Ostro, 2008: Air pollution and emergency room visits for asthma in
Santa Clara County, California. Environ. ; 43:182-205.
Martinez, R. R., R. P. Padilla, and G. Olaiz-Fernandez, 2007: Lung function growth in children with
long-term exposure to air pollutants in Mexico City. Am J Respir Crit Care Med; 176:377–84.
Mills, P. K., D. Abbey, W. L. Beeson, and F. Petersen, 1991: Ambient air pollution and cancer in
California Seventh-day Adventists. Arch Environ Health; 46:271–80.
Moller, W., K. Haussinger, and R. Winkler-Heil, 2004: Mucociliary and long-term particle clearance
in the airways of healthy nonsmoker subjects. J ApplPhysiol; 97:2200–6.
National Environmental Quality Standard Rules, 2001: under Pakistan Environment protection
Act.1997.
Orazzo, F., and L. Nespoli, 2009: Air pollution, aeroallergens, and emergency room visits for acute
respiratory diseases and gastroenteric disorders among young children in six Italian cities. Environ
Health Perspect; 117:1780–5.
Raza. A., 2010: Lahore air pollution worsens. International THE NEWS, Wednesday, June 30, 2010
Section -14, 1934: Factories act of Pakistan.
Section-11, 1997: Punjab environment protection act.
Seeman, T. E., 2000: Health promoting effects of friends and family on health outcomes in older adults.
American Journal of Health Promotion, 14(6), 362-370.
Siddiqui, R., 2011: The Cost of Un-served Energy: Evidence from Selected Industrial Cities of
Pakistan. Pakistan Institute of Development Economics, Islamabad.
Vargas, A. R. O., J. Serrano, and R. Bracho, 2011: In vitro biological effects of airborne PM (2.5)
and PM (10) from a semi-desert city on the Mexico–US border. Chemosphere; 83:618–26.
Polluted Air Quality Component Analysis from Stack Emission ... Vol. 12
24
Vidgren, M., J. C. Waldrep, and J. Arppe, 1995: A study of 99 m technetium-labelled beclo-
methasone dipropionate Dilauroyl phosphati-dylcholine liposome aerosol in normal volunteers. Int J
Pharm; 115:209–16.
World Health Organization, 1999: Air quality guidelines, Protection of the human environment,
www.who.int
World Health Organization, 2006: WHO air quality guidelines for particulate matter, ozone, nitrogen
dioxide and sulfur dioxide. World Health Organization.
Yadav, M. S., 2008: Text book of Environmental studies, Air pollution, Arise pub, New Delhi. P: 158-
161.