Polling on resident satisfaction with councils
29
1 Polling on resident satisfaction with councils Final report: October 2014
-
Upload
lga-publications -
Category
Documents
-
view
218 -
download
1
description
The ninth set of results in a series of quarterly Local Government Association (LGA) public polls on resident satisfaction with local councils.
Transcript of Polling on resident satisfaction with councils

1
Polling on resident satisfaction with councils
Final report: October 2014

2
Acknowledgements
The Local Government Association (LGA) Research and Information team would like to thank Populus Data Solutions for their input to this work. We would also like to thank all the participants who took part in the polling.
To view more research from the Local Government Association Research and Information team please visit: http://www.local.gov.uk/local-government-intelligence

3
Contents
Methodology ................................................................................................................ 4
Key findings ................................................................................................................. 6
Polling on resident satisfaction with councils ............................................................... 8
Overall satisfaction with local area ...................................................................... 8
Overall satisfaction with local council .................................................................. 8
Value for money .................................................................................................. 9
Council responsiveness ...................................................................................... 9
Informed about the council ................................................................................ 10
Trust .................................................................................................................. 10
Community safety ............................................................................................. 12
Service specific satisfaction .............................................................................. 13
Importance of services ...................................................................................... 16
The media ......................................................................................................... 17
The Scottish referendum and devolution ........................................................... 19
Annex A: Service specific satisfaction results ........................................................... 20
Annex B: Views on media coverage since September 2012 ..................................... 24
Annex C: Polling questions ....................................................................................... 25

4
Introduction
This note outlines the ninth set of results in a series of quarterly Local Government Association (LGA) public polls on resident satisfaction with local councils.
With the publication of Are You Being Served1 – a set of resident satisfaction questions that councils can choose to use in their local surveys and benchmark themselves against other authorities – the LGA has responded to demand from the sector for more intelligence in this area.
This polling complements councils’ local work with a regular look at the national picture. Tracking national changes in satisfaction with councils alongside questions on other related issues about residents’ local areas can provide valuable information on what is driving resident perceptions and therefore what councils can do to serve their local communities better.
Many additional factors will influence resident views of councils at a local level, including local demographics. It is important therefore that these polling results are seen as complementary to a wider approach to understanding and responding to communities at a local level.
Comparison against national polls provides context and trends, and helps to identify possible relationships with other variables, but councils could include additional questions in their local surveys and conduct other engagement activities and analysis that might help diagnose what other factors are driving satisfaction levels locally.
Methodology
Between 24 and 26 October 2014, a representative random sample of 1,002 British adults (aged 18 or over) was polled by telephone.2
Respondents were given the following preamble at the outset:
“I would like to ask you some questions about your local council. Local councils are responsible for a range of services such as refuse collection, street cleaning, planning, education, social care services and road maintenance.
If you live in an area with more than one council please think about the way in which they deliver services to you overall. This would include district and county councils. We are doing this to keep the survey simple as it is part of a national study.”
The full interview script is included in Annex C for information. Where the questions cover the same topics as the Are You Being Served1 question set, the same question ordering, wording, definitions and preamble have been used to allow comparability.3
1 http://lginform.local.gov.uk/about-lg-inform/resident-satisfaction
2 Quotas were set on age, gender and region and the data weighted to the known British profile of
age, gender, region, social grade, taken a foreign holiday in the last 3 years, tenure, number of cars in the household, working status, and mobile only households. The polling was conducted by Populus Data Solutions. 3 Note though that as the mode of data collection can have a marked impact on results, these results
are only truly comparable with surveys conducted via telephone.
5
Where tables and figures report the base, the description refers to the group of people who were asked the question. The number provided refers to the unweighted number of respondents who answered each question.
This is the ninth round of polling in this series, and the paper examines trends since the first round in September 2012.4 Differences between results are only highlighted within the report where this is statistically significant.5
Please note the following when reading the report:
Throughout the report percentages in figures and tables may add to more than 100 due to rounding.
The following conventions are used in tables: ‘*’ - less than 0.5 per cent; ‘0’ – no observations; ‘-’ – category not applicable/data not available.
4 The full papers outlining the results of previous polls can be found here:
http://www.local.gov.uk/research-performance-and-improvement 5 Statistical significance is tested at the 95% level.

6
Key findings
As Figure 1 shows, residents’ views of local councils remain fairly consistent. Overall satisfaction amongst the public with the way their local council runs things remains positive; in this round, the proportion who were very or fairly satisfied was 68 per cent. This is a similar level to the preceding rounds but lower than a peak of 72 per cent observed in January 2013.
Figure 1: Polling results for key indicators: September 2012 – October 2014
Base (all respondents): 1,006 British adults in September 2012, 1,004 in January 2013, 1,036 in April 2013, 1,002 in July 2013, 1,003 in October 2013, 1,008 in January 2014, 1,005 in April 2014, 1,001 in July 2014, 1,002 in October 2014
There have only been a small number of significant changes in the polling results since September 2012, and the notable changes are highlighted below:
In the first round of polling in September 2012, 56 per cent tended to or strongly agreed that their local council provided value for money. In January 2013 this fell to 51 per cent, and has remained at a similar level since. The proportion that tend to or strongly agree that their local council provides value for money currently stands at 51 per cent.
The proportion of respondents stating that they trust their local council more than the government to make decisions about how services are provided in their local area is 73 per cent. This is a similar level to many of the previous rounds, although lower than January and July 2014 when there were highs of 77 and 80 per cent respectively.
Levels of satisfaction with specific services remain fairly stable, with a small number of exceptions:
o Satisfaction with road maintenance has risen slightly to 42 per cent after a significant dip in the three last quarters.
o The level of satisfaction with pavement maintenance has remained relatively stable over most rounds of the polling, but with a peak of 59 per cent very or

7
fairly satisfied in July 2013, and a low of 51 per cent in January 2014 - at 56 per cent, satisfaction is currently higher than this low point.
o There have been two peaks in library satisfaction, once in April 2013, the other in the last quarter (July 2014) – both at 71 per cent. In this round there has been a decrease to 66 per cent, although this level is fairly consistent with all the other polling rounds.
o Overall satisfaction with services for children and young people has been stable over recent rounds, and currently stands at 51 per cent. It is worth noting that many respondents will not have direct experience of this service and the proportion answering ‘neither satisfied nor dissatisfied’ (21 per cent) or ‘don’t know’ (10 per cent) reflects this.
o For services and support for older people there was a dip in the previous quarter to 44 per cent of residents who were satisfied with services, but this has once more increased to 49 per cent. Similar to children’s services, the proportion answering ‘neither satisfied nor dissatisfied’ (25 per cent) or ‘don’t know’ (11 per cent) reflects the non-universal nature of this service.

8
Polling on resident satisfaction with councils
This section outlines the full set of polling results.
Overall satisfaction with local area
The vast majority of respondents were positive about their local area as a place to live – with 82 per cent very or fairly satisfied in October 2014. This is a statistically similar level to all previous rounds.
Table 1: Overall, how satisfied or dissatisfied are you with your local area as a place to live?6
Sept 2012
Jan
20137
Apr 2013
July 2013
Oct 2013
Jan 2014
Apr 2014
July 2014
Oct 2014
% % % % % % % % %
Very or fairly satisfied 84 84 82 85 84 83 82 80 82
Very satisfied 34 28 34 34 34 30 28 31 29
Fairly satisfied 50 57 48 51 50 53 54 50 53
Neither satisfied nor dissatisfied 9 9 9 8 9 7
10 9 8
Fairly dissatisfied 5 4 5 4 4 5 6 6 5
Very dissatisfied 2 2 3 3 3 5 2 5 4
Don’t know 0 * 1 * * 0 * 0 *
Base (all respondents): 1,006 British adults in September 2012, 1,004 in January 2013, 1,036 in April 2013, 1,002 in July 2013, 1,003 in October 2013, 1,008 in January 2014, 1,005 in April 2014, 1,001 in July 2014, 1,002 in October 2014
Overall satisfaction with local council
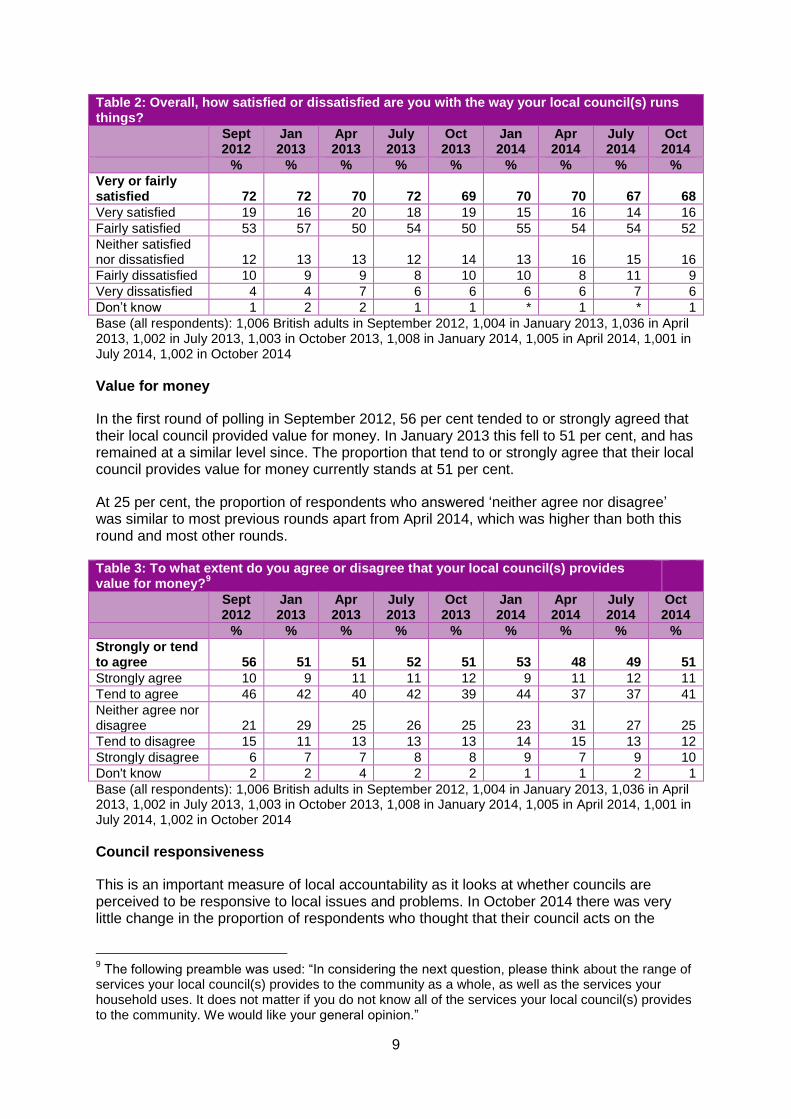
Satisfaction with the way the local council runs things has remained positive. In this round, 68 per cent of respondents were very or fairly satisfied. Again, this is a similar level to the preceding rounds but lower than a peak of 72 per cent observed in January 2013.8
6 Local area was defined as “the area within 15 – 20 minutes walking distance from your home”
7 Whilst the individual ‘very’ or ‘fairly’ answer options displayed in Table 1 for January 2013 appear to
sum to 85 per cent, this is due to the fact the figures in the table have been rounded to the nearest whole number. Please note that this may also occur in other parts of the report where answer categories are combined. 8 Only the January 2013 result is statistically significantly higher than the October 2014 result. Due to
rounding and sample size variation, the results of 72 per cent observed in both September 2012 and July 2013 are not significantly higher than the October 2014 result.
9
Table 2: Overall, how satisfied or dissatisfied are you with the way your local council(s) runs things?
Sept 2012
Jan 2013
Apr 2013
July 2013
Oct 2013
Jan 2014
Apr 2014
July 2014
Oct 2014
% % % % % % % % %
Very or fairly satisfied 72 72 70 72 69 70 70 67 68
Very satisfied 19 16 20 18 19 15 16 14 16
Fairly satisfied 53 57 50 54 50 55 54 54 52
Neither satisfied nor dissatisfied 12 13 13 12 14
13 16 15 16
Fairly dissatisfied 10 9 9 8 10 10 8 11 9
Very dissatisfied 4 4 7 6 6 6 6 7 6
Don’t know 1 2 2 1 1 * 1 * 1
Base (all respondents): 1,006 British adults in September 2012, 1,004 in January 2013, 1,036 in April 2013, 1,002 in July 2013, 1,003 in October 2013, 1,008 in January 2014, 1,005 in April 2014, 1,001 in July 2014, 1,002 in October 2014
Value for money
In the first round of polling in September 2012, 56 per cent tended to or strongly agreed that their local council provided value for money. In January 2013 this fell to 51 per cent, and has remained at a similar level since. The proportion that tend to or strongly agree that their local council provides value for money currently stands at 51 per cent.
At 25 per cent, the proportion of respondents who answered ‘neither agree nor disagree’ was similar to most previous rounds apart from April 2014, which was higher than both this round and most other rounds.
Table 3: To what extent do you agree or disagree that your local council(s) provides value for money?
9
Sept 2012
Jan 2013
Apr 2013
July 2013
Oct 2013
Jan 2014
Apr 2014
July 2014
Oct 2014
% % % % % % % % %
Strongly or tend to agree 56 51 51 52 51
53
48 49 51
Strongly agree 10 9 11 11 12 9 11 12 11
Tend to agree 46 42 40 42 39 44 37 37 41
Neither agree nor disagree 21 29 25 26 25 23 31 27 25
Tend to disagree 15 11 13 13 13 14 15 13 12
Strongly disagree 6 7 7 8 8 9 7 9 10
Don't know 2 2 4 2 2 1 1 2 1
Base (all respondents): 1,006 British adults in September 2012, 1,004 in January 2013, 1,036 in April 2013, 1,002 in July 2013, 1,003 in October 2013, 1,008 in January 2014, 1,005 in April 2014, 1,001 in July 2014, 1,002 in October 2014
Council responsiveness
This is an important measure of local accountability as it looks at whether councils are perceived to be responsive to local issues and problems. In October 2014 there was very little change in the proportion of respondents who thought that their council acts on the
9 The following preamble was used: “In considering the next question, please think about the range of
services your local council(s) provides to the community as a whole, as well as the services your household uses. It does not matter if you do not know all of the services your local council(s) provides to the community. We would like your general opinion.”

10
concerns of local residents with 61 per cent of respondents thinking that their council did this a fair amount or a great deal.
Table 4: To what extent do you think your local council(s) acts on the concerns of local residents?
Sept 2012
Jan 2013
Apr 2013
July 2013
Oct 2013
Jan 2014
Apr 2014
July 2014
Oct 2014
% % % % % % % % %
A great deal or fair amount 62 60 61 63 62
61
62 61 61
A great deal 8 9 10 8 10 8 9 9 9
A fair amount 54 52 51 54 52 53 53 52 52
Not very much 28 27 26 25 27 28 27 29 28
Not at all 5 6 7 7 7 7 8 9 7
Don’t know 5 7 6 5 5 3 3 1 3
Base (all respondents): 1,006 British adults in September 2012, 1,004 in January 2013, 1,036 in April 2013, 1,002 in July 2013, 1,003 in October 2013, 1,008 in January 2014, 1,005 in April 2014, 1,001 in July 2014, 1,002 in October 2014
Informed about the council
Two thirds of respondents (66 per cent) said that their council keeps residents very or fairly well informed about the services and benefits it provides. This is broadly consistent with the levels seen in previous rounds of polling.
Table 5: Overall, how well informed do you think your local council(s) keeps residents about the services and benefits it provides?
Sept 2012
Jan 2013
Apr 2013
July 2013
Oct 2013
Jan 2014
Apr 2014
July 2014
Oct 2014
% % % % % % % % %
Very or fairly well informed 66 69 65 66 66 66 65 64 66
Very well informed 17 17 17 15 17 14 14 15 15
Fairly well informed 49 52 48 51 49 51 51 49 51
Not very well informed 25 23 23 22 22 23 25 25 24
Not well informed at all 8 6 9 10 9 11 9 11 9
Don’t know 1 2 2 1 2 1 1 * 1
Base (all respondents): 1,006 British adults in September 2012, 1,004 in January 2013, 1,036 in April 2013, 1,002 in July 2013, 1,003 in October 2013, 1,008 in January 2014, 1,005 in April 2014, 1,001 in July 2014, 1,002 in October 2014
Trust
Levels of trust in councils have been stable since this polling started in September 2012. In the most recent round, 59 per cent of respondents stated that they trust their council a great deal or a fair amount; this is slightly lower than some previous rounds, but not significantly.

11
Table 6: How much do you trust your local council(s)?
Sept 2012
Jan 2013
Apr 2013
July 2013
Oct 2013
Jan 2014
Apr 2014
July 2014
Oct 2014
% % % % % % % % %
A great deal or fair amount 61 62 60 61 61 61 61 59 59
A great deal 10 7 9 9 10 8 8 8 9
A fair amount 51 55 51 53 51 52 53 51 50
Not very much 26 27 28 25 26 26 28 29 29
Not at all 10 8 10 11 12 12 10 11 11
Don’t know 2 3 2 2 1 1 1 1 1
Base (all respondents): 1,006 British adults in September 2012, 1,004 in January 2013, 1,036 in April 2013, 1,002 in July 2013, 1,003 in October 2013, 1,008 in January 2014, 1,005 in April 2014, 1,001 in July 2014, 1,002 in October 2014
A new question was introduced in the July 2013 round looking at public trust in local councils to make decisions about how services are provided in their local area, compared to their trust in the government.
Table 7 shows that the vast majority of respondents said, of the two, they trusted their local council most to make decisions about how services are provided in their local area. With 73 per cent selecting their local council, this is a similar level to many of the previous rounds, although lower than January and July 2014 when there were highs of 77 and 80 per cent respectively. The proportion that trust the government most is much lower and currently stands at 15 per cent.
Table 7: Who do you trust most to make decisions about how services are provided in your local area?
10
July 2013 Oct 2013 Jan 2014 Apr 2014 July 2014 Oct 2014
% % % % % %
Your local council(s) 70 71 77 72 80 73
The government 14 11 13 16 14 15
Neither 13 16 8 11 5 10
Don't know 3 2 2 2 1 1
Base (all respondents): 1,002 British adults in July 2013, 1,003 in October 2013, 1,008 in January 2014, 1,005 in April 2014, 1,001 in July 2014, 1,002 in October 2014
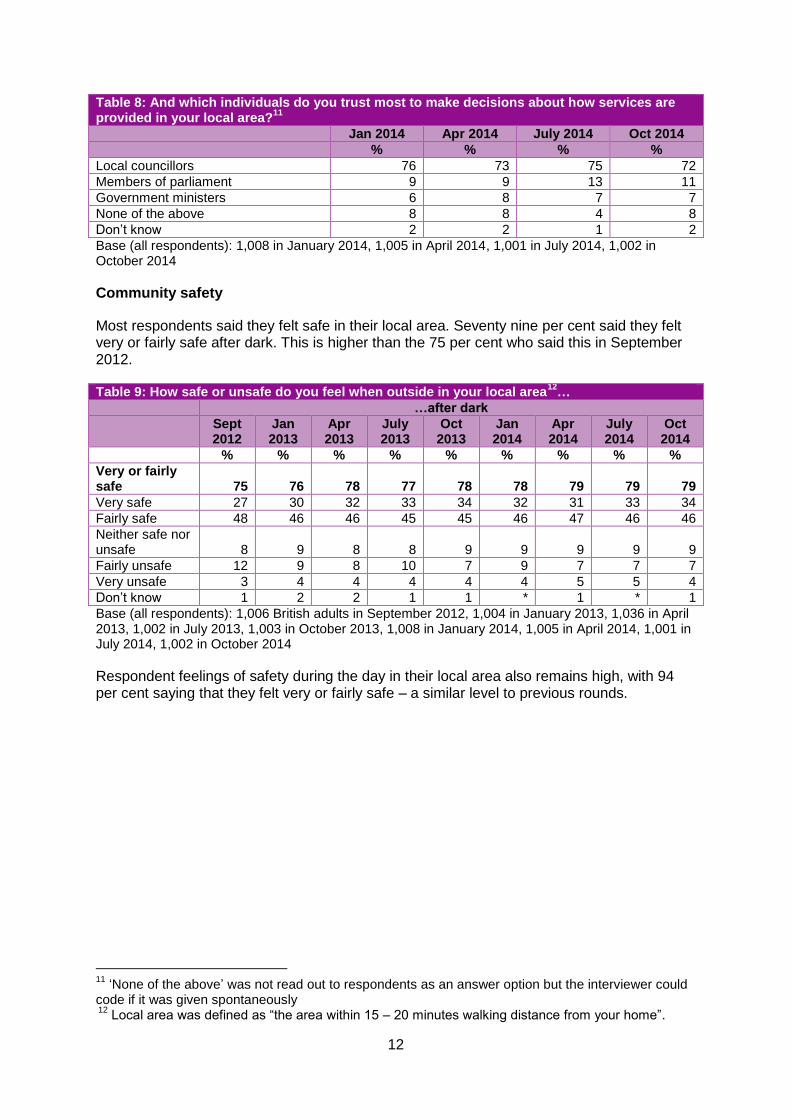
A new question was introduced in the January 2014 round asking which individuals respondents trusted most to make decisions about how services are provided in their local area. The vast majority of respondents (72 per cent) said that they most trusted local councillors to make these decisions. The next most trusted group were members of parliament at 11 per cent.
10
‘Neither’ was not read out to respondents as an answer option but the interviewer could code it if it was given spontaneously.
12
Table 8: And which individuals do you trust most to make decisions about how services are provided in your local area?
11
Jan 2014 Apr 2014 July 2014 Oct 2014
% % % %
Local councillors 76 73 75 72
Members of parliament 9 9 13 11
Government ministers 6 8 7 7
None of the above 8 8 4 8
Don’t know 2 2 1 2
Base (all respondents): 1,008 in January 2014, 1,005 in April 2014, 1,001 in July 2014, 1,002 in October 2014
Community safety
Most respondents said they felt safe in their local area. Seventy nine per cent said they felt very or fairly safe after dark. This is higher than the 75 per cent who said this in September 2012.
Table 9: How safe or unsafe do you feel when outside in your local area12
…
…after dark
Sept 2012
Jan 2013
Apr 2013
July 2013
Oct 2013
Jan 2014
Apr 2014
July 2014
Oct 2014
% % % % % % % % %
Very or fairly safe 75 76 78 77 78 78 79 79 79
Very safe 27 30 32 33 34 32 31 33 34
Fairly safe 48 46 46 45 45 46 47 46 46
Neither safe nor unsafe 8 9 8 8 9 9 9 9 9
Fairly unsafe 12 9 8 10 7 9 7 7 7
Very unsafe 3 4 4 4 4 4 5 5 4
Don’t know 1 2 2 1 1 * 1 * 1
Base (all respondents): 1,006 British adults in September 2012, 1,004 in January 2013, 1,036 in April 2013, 1,002 in July 2013, 1,003 in October 2013, 1,008 in January 2014, 1,005 in April 2014, 1,001 in July 2014, 1,002 in October 2014
Respondent feelings of safety during the day in their local area also remains high, with 94 per cent saying that they felt very or fairly safe – a similar level to previous rounds.
11
‘None of the above’ was not read out to respondents as an answer option but the interviewer could code if it was given spontaneously 12
Local area was defined as “the area within 15 – 20 minutes walking distance from your home”.

13
Table 10: How safe or unsafe do you feel when outside in your local area13
…
…during the day
Sept 2012
Jan 2013
Apr 2013
July 2013
Oct 2013
Jan 2014
Apr 2014
July 2014
Oct 2014
% % % % % % % % %
Very or fairly safe 95 95 96 95 95 94 94 95 94
Very safe 60 62 65 66 66 62 63 62 63
Fairly safe 35 33 31 29 29 32 32 33 31
Neither safe nor unsafe 3 3 2 2 3
3
3 3 3
Fairly unsafe 2 2 1 1 * 2 2 1 2
Very unsafe * * 1 1 1 1 1 1 1
Don’t know 0 * * * * * * * *
Base (all respondents): 1,006 British adults in September 2012, 1,004 in January 2013, 1,036 in April 2013, 1,002 in July 2013, 1,003 in October 2013, 1,008 in January 2014, 1,005 in April 2014, 1,001 in July 2014, 1,002 in October 2014
Service specific satisfaction
Respondents were invited to indicate how satisfied or dissatisfied they were with the following key services:
waste collection
street cleaning
road maintenance
pavement maintenance
library services
sport and leisure services
services and support for older people
services and support for children and young people
Respondents’ views remained positive for the majority of services in this round (see Figure 2). As in all previous rounds, levels of satisfaction with waste collection and street cleaning were higher than overall satisfaction with the council; 83 per cent were fairly or very satisfied with waste collection and 75 per cent with street cleaning, compared to 68 per cent for overall satisfaction.
As Figure 3 shows, levels of satisfaction with specific services have remained fairly stable since the polling began in September 2012, with only a small number of changes this quarter. Key findings are:
Satisfaction with waste collection services remains high – in this round 83 per cent were very or fairly satisfied. This is higher than last quarter, but not to a statistically significant extent.
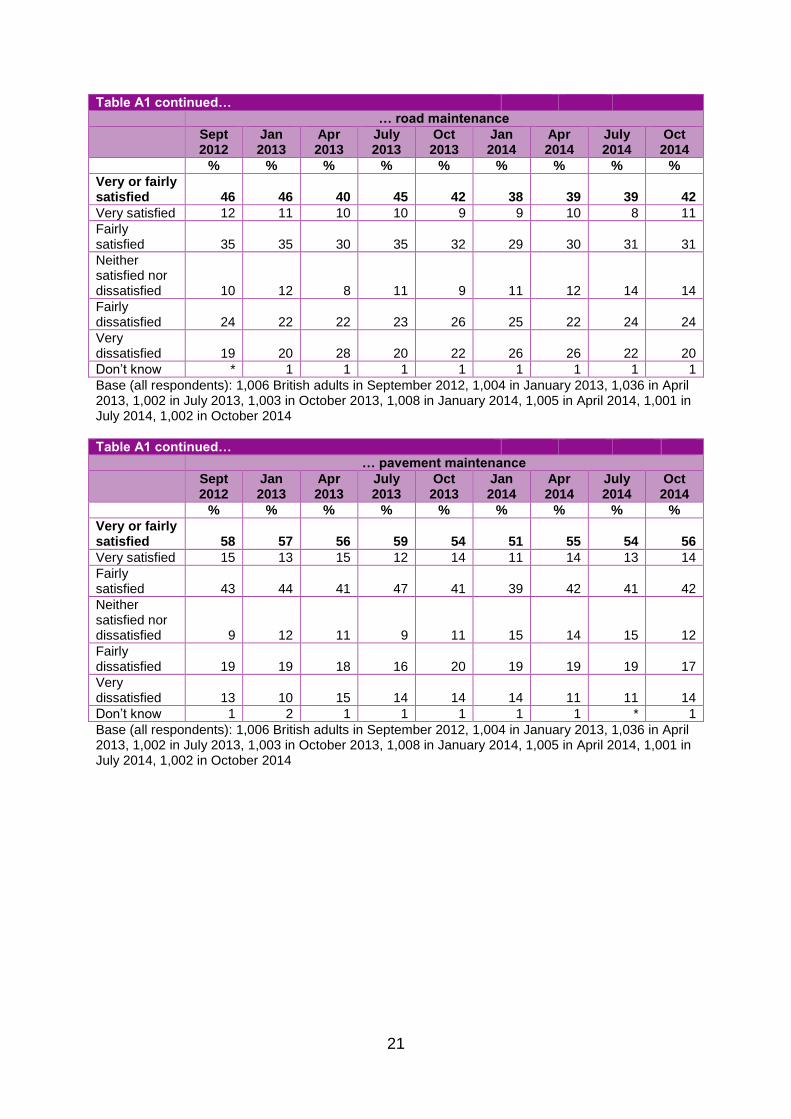
Satisfaction with road maintenance has risen back slightly to 42 per cent after a significant dip in the three last quarters.
The level of satisfaction with pavement maintenance has remained relatively stable over most rounds of the polling, but with a peak of 59 per cent very or fairly satisfied
13
Local area was defined as “the area within 15 – 20 minutes walking distance from your home”.

14
in July 2013 and a low of 51 per cent in January 2014 - at 56 per cent, satisfaction is currently higher than this low point.
There have been two peaks in library satisfaction, once in April 2013, the other in the last quarter (July 2014) – both at 71 per cent. In this round there has been a decrease to 66 per cent, although this level is fairly consistent with all the other polling rounds.
Overall satisfaction with services for children and young people has been stable over recent rounds, and currently stands at 51 per cent. It is worth noting that many respondents will not have direct experience of this service and the proportion answering ‘neither satisfied nor dissatisfied’ (21 per cent) or ‘don’t know’ (10 per cent) reflects this.
For services and support for older people there was a significant dip in the previous quarter to 44 per cent of residents who were satisfied with services, but this has once more increased significantly to 49 per cent. Similar to children’s services, the proportion answering ‘neither satisfied nor dissatisfied’ (25 per cent) or ‘don’t know’ (11 per cent) reflects the non-universal nature of this service.
Along with pavement maintenance, road maintenance continues to have the highest levels of dissatisfaction – in this round 44 per cent were very or fairly dissatisfied with road maintenance and 31 per cent with pavement maintenance.
Satisfaction with sports and leisure services remains strong amongst those with an opinion, with 65 per cent fairly or very satisfied.14 This is lower than for street cleaning and waste collection, primarily due to more people answering ‘neither satisfied nor dissatisfied’, which could be due to respondents not personally using the service.
Tables showing the full set of service specific satisfaction results can be found at Annex A.
Figure 2: Levels of satisfaction with key council services – October 2014
Base (all respondents): 1,002 British adults
14
Note that as this question was asked of all respondents, the base includes those that may not have used particular services.

15
Figure 3: Proportion very or fairly satisfied with each service: September 2012 – October 2014
Base (all respondents): 1,006 British adults in September 2012, 1,004 in January 2013, 1,036 in April 2013, 1,002 in July 2013, 1,003 in October 2013, 1,008 in January 2014, 1,005 in April 2014, 1,001 in July 2014, 1,002 in October 2014

16
Importance of services
Respondents were asked to pick from the following list, which three things they consider to be most important to them and their family:
Condition of roads/pavements
Consumer protection and environmental health (e.g. rouge traders, noise)
Facilities/services for children and young people (not including schools)
Housing
Job prospects
Levels of crime and anti-social behaviour
Library services
Local high street facilities
Public transport
Schools
Services and support for older people
Sport and leisure services
Street cleaning
Waste collection
At 42 per cent, the majority of respondents considered that in their local area, the level of crime and anti-social behaviour was among the top three most important things to them and their family. This was followed by the conditions of roads and pavements and schools at 31 and 29 per cent respectively. The least important to those surveyed were library services, with just 10 per cent placing this in their top three, and local high street facilities at nine percent.

17
Table 11: Thinking about your local area, which three things are most important to you and your family? October 2014
July 2014 Oct 2014
% %
Levels of crime and anti-social behaviour 45 42
Condition of roads/pavements 29 31
Schools 30 29
Facilities/services for children and young people (not including schools) 25 25
Services and support for older people 24 22
Public transport 22 22
Waste collection 21 22
Job prospects 23 19
Sport and leisure services 16 17
Housing 14 15
Street cleaning 13 13
Consumer protection and environmental health 13 11
Library services 9 10
Local high street facilities 9 9
Don’t know * 1
None of the above * 1
Base (all respondents): 1,001 British adults in July 2014, 1,002 in October 2014 Note that the figures in the table add up to more than 100% as respondents could select up to three answer options.
The media
Respondents were asked whether, overall, they thought that the media had viewed the following positively or negatively in the last few months:
the government
local councils across the country
their own local council
As with the previous rounds of polling, respondents reported hearing, on balance, positive or neutral rather than negative messages about local government from the media, with national government faring less well than councils on this measure.
For the government and local councils across the country, the proportion of respondents observing positive coverage has dropped back down following a peak in January 2014. In comparison respondent’s perceptions of positive coverage of their own local councils have, despite a slight dip this quarter, generally remained high over the last few quarters. Currently:
31 per cent observed generally positive coverage of their own local council
19 per cent observed generally positive coverage of local councils across the country
17 per cent observed generally positive coverage of the government.
Figure 4 shows the proportion of respondents who said that media coverage had been positive, since September 2012. Table 12 shows the results for all answer options since April 2013; the full set of figures can be found at Annex B.

18
Figure 4: Overall, do you think that the media has viewed the following positively in the last few months?
Base (all respondents): 1,006 British adults in September 2012, 1,004 in January 2013, 1,036 in April 2013, 1,002 in July 2013, 1,003 in October 2013, 1,008 in January 2014, 1,005 in April 2014, 1,001 in July 2014, 1,002 in October 2014
Table 12: Overall, do you think that the media has viewed the following positively or negatively in the last few months?
April 2013
Jul 2013
Oct 2013
Jan 2014
April 2014
July 2014
Oct 2014
% % % % % % %
The Government
Positively 18 22 20 24 19 19 17
Neither positively nor negatively 29 20 20 23 26 26 30
Negatively 46 52 54 49 54 54 49
Don’t know 7 6 5 4 2 2 4
Local councils across the country
Positively 22 25 24 26 21 21 19
Neither positively nor negatively 39 25 29 28 36 36 42
Negatively 27 34 34 37 36 36 32
Don’t know 12 16 13 9 7 7 7
Your local council
Positively 33 37 36 37 35 35 31
Neither positively nor negatively 41 27 30 32 36 36 43
Negatively 17 24 25 24 23 23 19
Don’t know 9 13 9 7 6 6 7
Base (all respondents): 1,036 in April 2013, 1,002 in July 2013, 1,003 in October 2013, 1,008 in January 2014, 1,005 in April 2014, 1,001 in July 2014, 1,002 in October 2014

19
The Scottish referendum and devolution
A new question was introduced in October 2014 round asking respondents whether a commitment to devolving more powers and funding to local areas in England by a party would affect their voting decision. Just over two fifths (42 per cent) said that they would be more likely to vote for a party that committed to devolution, compared to 11 per cent who would be less likely to vote for a party committed to devolution. Forty five per cent of respondents said that it would not affect their vote.
Table 13: Following the Scottish referendum result, would you be more or less likely to vote for a party in next year's General Election if it committed to devolving more powers and funding to local areas in England?
October 2014
%
More likely 42
Wouldn’t affect my vote 45
Less likely 11
Don’t know 2
Base (all respondents): 1,002 British adults

20
Annex A: Service specific satisfaction results Table A1: I am going to read out a number of different types of services that are provided by your council(s) in your area. I would like you to tell me how satisfied or dissatisfied you are overall with your council's...
… waste collection15
Sept 2012
Jan 2013
Apr 2013
July 2013
Oct 2013
Jan 2014
Apr 2014
July 2014
Oct 2014
% % % % % % % % %
Very or fairly satisfied 83 86 84 84 83
80
81 80 83
Very satisfied 45 45 48 43 44 41 41 39 41
Fairly satisfied 37 41 36 41 39 39 39 41 42
Neither satisfied nor dissatisfied 5 4 4 4 4 5 6 4 4
Fairly dissatisfied 7 5 7 8 7
10
8 8 6
Very dissatisfied 5 5 5 5 5
5
6 7 7
Don’t know 1 * * * 1 0 * 0 *
Base (all respondents): 1,006 British adults in September 2012, 1,004 in January 2013, 1,036 in April 2013, 1,002 in July 2013, 1,003 in October 2013, 1,008 in January 2014, 1,005 in April 2014, 1,001 in July 2014, 1,002 in October 2014
Table A1 continued…
… street cleaning
Sept 2012
Jan 2013
Apr 2013
July 2013
Oct 2013
Jan 2014
Apr 2014
July 2014
Oct 2014
% % % % % % % % %
Very or fairly satisfied 74 73 76 74 76
72
73 73 75
Very satisfied 27 26 30 27 26 24 24 25 25
Fairly satisfied 47 47 46 48 49 48 50 48 50
Neither satisfied nor dissatisfied 6 10 8 8 7
10
9 8 9
Fairly dissatisfied 12 10 9 10 10
10 11 12 9
Very dissatisfied 7 6 7 7 7
7 6 7 7
Don’t know 1 2 1 1 1 1 1 * 1
Base (all respondents): 1,006 British adults in September 2012, 1,004 in January 2013, 1,036 in April 2013, 1,002 in July 2013, 1,003 in October 2013, 1,008 in January 2014, 1,005 in April 2014, 1,001 in July 2014, 1,002 in October 2014
15
Note that in September 2012 respondents were asked about ‘refuse collection’.
21
Table A1 continued…
… road maintenance
Sept 2012
Jan 2013
Apr 2013
July 2013
Oct 2013
Jan 2014
Apr 2014
July 2014
Oct 2014
% % % % % % % % %
Very or fairly satisfied 46 46 40 45 42
38 39 39 42
Very satisfied 12 11 10 10 9 9 10 8 11
Fairly satisfied 35 35 30 35 32 29 30 31 31
Neither satisfied nor dissatisfied 10 12 8 11 9
11
12 14 14
Fairly dissatisfied 24 22 22 23 26
25 22 24 24
Very dissatisfied 19 20 28 20 22
26 26 22 20
Don’t know * 1 1 1 1 1 1 1 1
Base (all respondents): 1,006 British adults in September 2012, 1,004 in January 2013, 1,036 in April 2013, 1,002 in July 2013, 1,003 in October 2013, 1,008 in January 2014, 1,005 in April 2014, 1,001 in July 2014, 1,002 in October 2014
Table A1 continued…
… pavement maintenance
Sept 2012
Jan 2013
Apr 2013
July 2013
Oct 2013
Jan 2014
Apr 2014
July 2014
Oct 2014
% % % % % % % % %
Very or fairly satisfied 58 57 56 59 54 51 55 54 56
Very satisfied 15 13 15 12 14 11 14 13 14
Fairly satisfied 43 44 41 47 41 39 42 41 42
Neither satisfied nor dissatisfied 9 12 11 9 11 15
14 15 12
Fairly dissatisfied 19 19 18 16 20 19 19 19 17
Very dissatisfied 13 10 15 14 14 14 11 11 14
Don’t know 1 2 1 1 1 1 1 * 1
Base (all respondents): 1,006 British adults in September 2012, 1,004 in January 2013, 1,036 in April 2013, 1,002 in July 2013, 1,003 in October 2013, 1,008 in January 2014, 1,005 in April 2014, 1,001 in July 2014, 1,002 in October 2014

22
Table A1 continued…
… library services
Sept 2012
Jan 2013
Apr 2013
July 2013
Oct 2013
Jan 2014
Apr 2014
July 2014
Oct 2014
% % % % % % % % %
Very or fairly satisfied 67 69 71 67 70 66 67 71 66
Very satisfied 34 29 30 32 32 30 27 30 31
Fairly satisfied 34 40 41 35 38 36 40 41 35
Neither satisfied nor dissatisfied 10 12 11 13 10 17
14 15 17
Fairly dissatisfied 7 5 6 5 6 7 7 6 5
Very dissatisfied 3 3 3 3 3 5 4 5 6
Don’t know 12 11 10 11 10 5 7 3 7
Base (all respondents): 1,006 British adults in September 2012, 1,004 in January 2013, 1,036 in April 2013, 1,002 in July 2013, 1,003 in October 2013, 1,008 in January 2014, 1,005 in April 2014, 1,001 in July 2014, 1,002 in October 2014
Table A1 continued…
… sport and leisure services
Sept 2012
Jan 2013
Apr 2013
July 2013
Oct 2013
Jan 2014
Apr 2014
July 2014
Oct 2014
% % % % % % % % %
Very or fairly satisfied 63 63 65 63 63 62 61 64 65
Very satisfied 21 19 22 18 19 18 18 21 21
Fairly satisfied 42 43 43 45 44 44 43 42 44
Neither satisfied nor dissatisfied 13 16 14 13 14 17
18 17 16
Fairly dissatisfied 11 8 8 12 9 9 9 10 7
Very dissatisfied 5 5 5 5 5 6 6 6 7
Don’t know 8 9 9 8 9 6 6 3 5
Base (all respondents): 1,006 British adults in September 2012, 1,004 in January 2013, 1,036 in April 2013, 1,002 in July 2013, 1,003 in October 2013, 1,008 in January 2014, 1,005 in April 2014, 1,001 in July 2014, 1,002 in October 2014

23
Table A1 continued…
… services and support for older people
Sept 2012
Jan 2013
Apr 2013
July 2013
Oct 2013
Jan 2014
Apr 2014
July 2014
Oct 2014
% % % % % % % % %
Very or fairly satisfied 49 48 49 52 45 49 50 44 49
Very satisfied 10 13 15 12 10 11 10 13 13
Fairly satisfied 39 35 34 40 35 38 39 31 36
Neither satisfied nor dissatisfied 19 21 21 20 23 28
27 31 25
Fairly dissatisfied 9 8 9 8 10 9 8 11 9
Very dissatisfied 4 5 5 5 7 8 5 6 6
Don’t know 18 18 17 14 15 7 9 8 11
Base (all respondents): 1,006 British adults in September 2012, 1,004 in January 2013, 1,036 in April 2013, 1,002 in July 2013, 1,003 in October 2013, 1,008 in January 2014, 1,005 in April 2014, 1,001 in July 2014, 1,002 in October 2014
Table A1 continued…
… services and support for children and young people
Sept 2012
Jan 2013
Apr 2013
July 2013
Oct 2013
Jan 2014
Apr 2014
July 2014
Oct 2014
% % % % % % % % %
Very or fairly satisfied 53 51 53 50 53 48 49 49 51
Very satisfied 14 14 15 15 14 14 11 16 12
Fairly satisfied 39 38 38 35 39 34 38 33 40
Neither satisfied nor dissatisfied 15 19 16 17 18 24
23 26 21
Fairly dissatisfied 10 7 9 10 9 11 10 12 9
Very dissatisfied 6 7 6 8 5 7 6 7 8
Don’t know 16 16 15 15 15 10 12 6 10
Base (all respondents): 1,006 British adults in September 2012, 1,004 in January 2013, 1,036 in April 2013, 1,002 in July 2013, 1,003 in October 2013, 1,008 in January 2014, 1,005 in April 2014, 1,001 in July 2014, 1,002 in October 2014

24
Annex B: Views on media coverage since September 2012 Table B1: Overall, do you think that the media has viewed the following positively or negatively in the last few months?
The Government
Sep 2012
Jan 2013
Apr 2013
July 2013
Oct 2013
Jan 2014
Apr 2014
July 2014
Oct 2014
% % % % % % % % %
Positively 19 16 18 22 20 24 16 19 17
Neither positively nor negatively 23 28 29 20 20 23 29 26 30
Negatively 54 50 46 52 54 49 51 54 49
Don’t know 4 6 7 6 5 4 4 2 4
Base (all respondents): 1,006 British adults in September 2012, 1,004 in January 2013, 1,036 in April 2013, 1,002 in July 2013, 1,003 in October 2013, 1,008 in January 2014, 1,005 in April 2014, 1,001 in July 2014, 1,002 in October 2014
Table B2: Overall, do you think that the media has viewed the following positively or negatively in the last few months?
Local councils across the country
Sep 2012
Jan 2013
Apr 2013
July 2013
Oct 2013
Jan 2014
Apr 2014
July 2014
Oct 2014
% % % % % % % % %
Positively 23 19 22 25 24 26 22 21 19
Neither positively nor negatively 30 38 39 25 29 28 39 36 42
Negatively 34 31 27 34 34 37 30 36 32
Don’t know 13 12 12 16 13 9 9 7 7
Base (all respondents): 1,006 British adults in September 2012, 1,004 in January 2013, 1,036 in April 2013, 1,002 in July 2013, 1,003 in October 2013, 1,008 in January 2014, 1,005 in April 2014, 1,001 in July 2014, 1,002 in October 2014
Table B3: Overall, do you think that the media has viewed the following positively or negatively in the last few months?
Your local council
Sep 2012
Jan 2013
Apr 2013
July 2013
Oct 2013
Jan 2014
Apr 2014
July 2014
Oct 2014
% % % % % % % % %
Positively 33 28 33 37 36 37 32 35 31
Neither positively nor negatively 34 43 41 27 30 32 40 36 43
Negatively 21 18 17 24 25 24 21 23 19
Don’t know 12 11 9 13 9 7 7 6 7
Base (all respondents): 1,006 British adults in September 2012, 1,004 in January 2013, 1,036 in April 2013, 1,002 in July 2013, 1,003 in October 2013, 1,008 in January 2014, 1,005 in April 2014, 1,001 in July 2014, 1,002 in October 2014
25
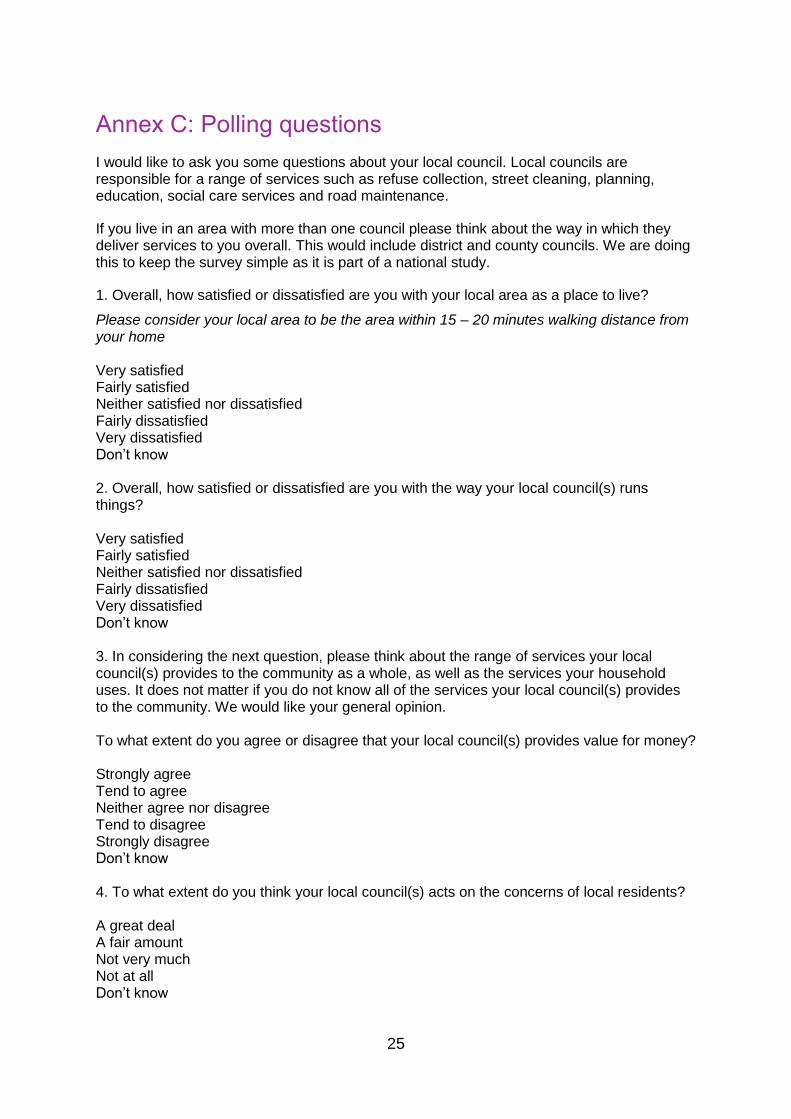
Annex C: Polling questions
I would like to ask you some questions about your local council. Local councils are responsible for a range of services such as refuse collection, street cleaning, planning, education, social care services and road maintenance.
If you live in an area with more than one council please think about the way in which they deliver services to you overall. This would include district and county councils. We are doing this to keep the survey simple as it is part of a national study.
1. Overall, how satisfied or dissatisfied are you with your local area as a place to live?
Please consider your local area to be the area within 15 – 20 minutes walking distance from your home Very satisfied Fairly satisfied Neither satisfied nor dissatisfied Fairly dissatisfied Very dissatisfied Don’t know 2. Overall, how satisfied or dissatisfied are you with the way your local council(s) runs things? Very satisfied Fairly satisfied Neither satisfied nor dissatisfied Fairly dissatisfied Very dissatisfied Don’t know 3. In considering the next question, please think about the range of services your local council(s) provides to the community as a whole, as well as the services your household uses. It does not matter if you do not know all of the services your local council(s) provides to the community. We would like your general opinion. To what extent do you agree or disagree that your local council(s) provides value for money? Strongly agree Tend to agree Neither agree nor disagree Tend to disagree Strongly disagree Don’t know 4. To what extent do you think your local council(s) acts on the concerns of local residents? A great deal A fair amount Not very much Not at all Don’t know
26
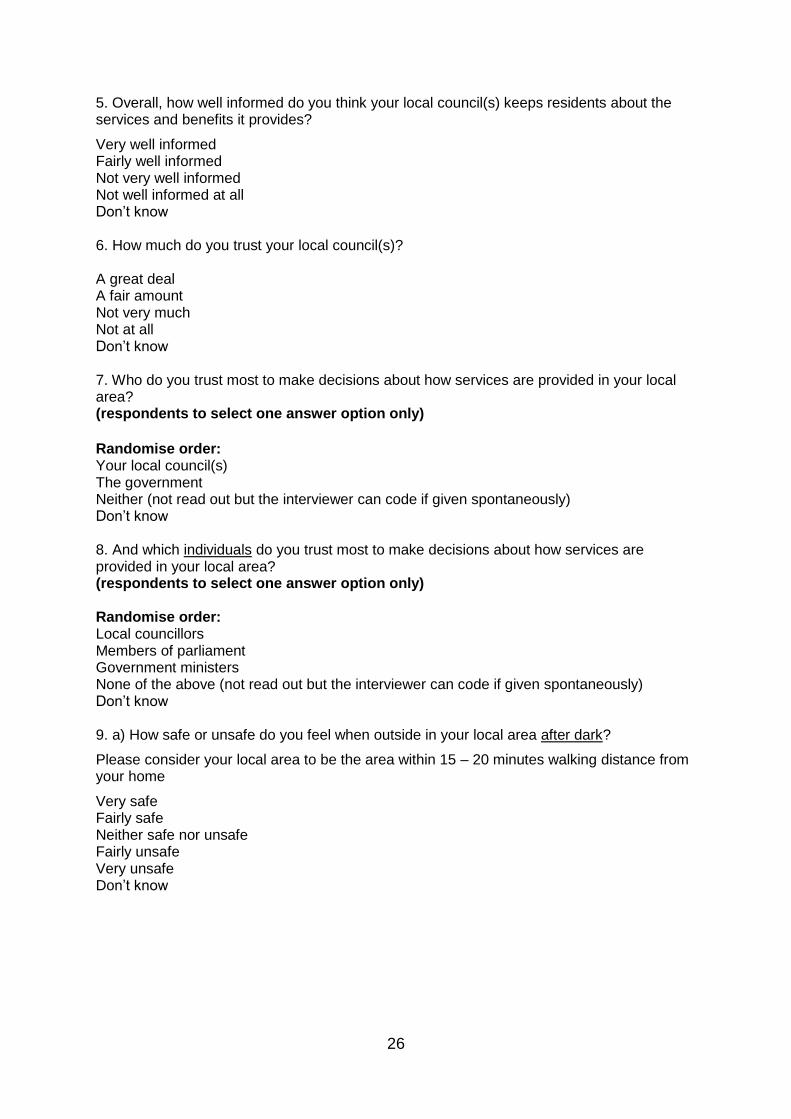
5. Overall, how well informed do you think your local council(s) keeps residents about the services and benefits it provides?
Very well informed Fairly well informed Not very well informed Not well informed at all Don’t know 6. How much do you trust your local council(s)? A great deal A fair amount Not very much Not at all Don’t know 7. Who do you trust most to make decisions about how services are provided in your local area? (respondents to select one answer option only)
Randomise order: Your local council(s) The government Neither (not read out but the interviewer can code if given spontaneously) Don’t know 8. And which individuals do you trust most to make decisions about how services are provided in your local area? (respondents to select one answer option only) Randomise order: Local councillors Members of parliament Government ministers None of the above (not read out but the interviewer can code if given spontaneously) Don’t know 9. a) How safe or unsafe do you feel when outside in your local area after dark?
Please consider your local area to be the area within 15 – 20 minutes walking distance from your home
Very safe Fairly safe Neither safe nor unsafe Fairly unsafe Very unsafe Don’t know
27
9. b) How safe or unsafe do you feel when outside in your local area during the day?
Please consider your local area to be the area within 15 – 20 minutes walking distance from your home
Very safe Fairly safe Neither safe nor unsafe Fairly unsafe Very unsafe Don’t know
10. I am going to read out a number of different types of services that are provided by your council(s) in your area. I would like you to tell me how satisfied or dissatisfied you are overall with your council’s… Randomise order: Waste collection Street cleaning Road maintenance Pavement maintenance Library services Sport and leisure services Services and support for older people Services and support for children and young people Very satisfied Fairly satisfied Neither satisfied nor dissatisfied Fairly dissatisfied Very dissatisfied Don’t know 11. Thinking about your local area, which three things are most important to you and your family? Respondents to pick up to three answers from the following list Randomise order Waste collection Street cleaning Condition of roads/pavements Library services Local high street facilities Job prospects Public transport Sport and leisure services Services and support for older people Facilities/services for children and young people (not including schools) Housing Schools Consumer protection and environmental health (e.g. rogue traders, noise) Levels of crime and anti-social behaviour

28
None of the above (not to be read out but coded if given spontaneously and no options selected above) Don’t know 12. Overall, do you think that the media has viewed the following positively or negatively in the last few months? Randomise order: The Government Local council(s) across the country Your local council Positively Negatively Neither positively nor negatively Don’t know Additional question for this round: 13. Following the Scottish referendum result, would you be more or less likely to vote for a party in next year’s General Election if it committed to devolving more powers and funding to local areas in England? More likely Less likely Wouldn’t affect my vote Don’t know

Local Government Association
Local Government House
Smith Square
London SW1P 3HZ
Telephone 020 7664 3000 Fax 020 7664 3030 Email [email protected] www.local.gov.uk
© Local Government Association, October 2014
For a copy in Braille, larger print or audio, please contact us on 020 7664 3000. We consider requests on an individual basis.