Political Risk, Reputation and the Resource...
44
Political Risk, Reputation and the Resource Curse Nathan M. Jensen Department of Political Science Washington University [email protected] Noel P. Johnston Department of Political Science Washington University [email protected] 17 March 2010 Abstract There is a growing literature on how natural resources affect both economic perfor- mance and political regimes. In this paper we add to this literature by focusing on how natural resource wealth affects the incentives of governments to uphold contracts with investors in and across sectors. We argue that while all states suffer reputation costs from reneging on contracts, governments in natural resource dependent economies are less sensitive to these costs, leading to a greater probability of expropriation and contract disputes. Specifically, leaders weigh the benefits of reneging on contracts with investors against the reputation costs of openly violating agreements with firms. Our theoretical model predicts a positive association between resource wealth and expropri- ation. Using a dataset from the political risk insurance industry we show that resource dependent economies have much higher levels of political risk. We also present pre- liminary secondary data analysis showing that natural resource economies partially compensate for the increased level of political risk by offering corporate tax incentives to firms. 1
-
Upload
nguyencong -
Category
Documents
-
view
222 -
download
1
Transcript of Political Risk, Reputation and the Resource...

Political Risk, Reputation and the Resource Curse
Nathan M. JensenDepartment of Political Science
Washington [email protected]
Noel P. JohnstonDepartment of Political Science
Washington [email protected]
17 March 2010
Abstract
There is a growing literature on how natural resources affect both economic perfor-mance and political regimes. In this paper we add to this literature by focusing onhow natural resource wealth affects the incentives of governments to uphold contractswith investors in and across sectors. We argue that while all states suffer reputationcosts from reneging on contracts, governments in natural resource dependent economiesare less sensitive to these costs, leading to a greater probability of expropriation andcontract disputes. Specifically, leaders weigh the benefits of reneging on contracts withinvestors against the reputation costs of openly violating agreements with firms. Ourtheoretical model predicts a positive association between resource wealth and expropri-ation. Using a dataset from the political risk insurance industry we show that resourcedependent economies have much higher levels of political risk. We also present pre-liminary secondary data analysis showing that natural resource economies partiallycompensate for the increased level of political risk by offering corporate tax incentivesto firms.
1

Social scientists have long lamented the detrimental effects of natural resources on host
countries. Natural resources can lead to a currency appreciation and thus deindustrialization,
support or entrench authoritarian leaders, affect the likelihood and intensity of civil conflict,
and have a negative impact on womens employment opportunities and political rights.1 As
highlighted by Robinson et al (2006), while many case studies of the natural resource curse
find government policy as the main culprit, much of the theoretical work has largely ignored
political factors.
While some of the recent theoretical literature linking elites and natural resources has
made important advances in understanding the natural resource curse, an important mech-
anism is largely unexplored. In this project we examine the theoretical link between natural
resource endowments and incentives of leaders to renege on contracts with private investors.
This increases political risk for firms in the natural resource sectors and all other sectors.
We argue that all leaders weigh the costs of reneging on contracts with investors against
the immediate benefits gained from these opportunistic activities. For example, Bolivias
rewriting of oil and gas contracts lead to major changes in the amount of revenues accruing
directly to the Bolivian government. Yet these actions have serious reputational costs leading
to downgrading of Bolivias risk ratings and a changing perception in the likelihood of Bolivia
upholding contracts. Countries with a reputation for not upholding contracts will receive
less investment in the future.2
While all leaders make this cost-benefit calculation, leaders in countries flush with rents
from natural resource extraction, such as Chavez in Venezuela, are less sensitive to how gov-
ernment actions affect the international reputation of the government. Thus while Venezuela
and Bolivia have been punished by international investors with lower levels of new invest-
1See Weinthal and Jones Luong (2006) for a recent review.2See Jensen (2006) for a review.
2

ment, the large natural resource rents from the oil and gas industry insulates the government
from this retaliation from private investors. More generally, government budgets, central for
providing public and private goods necessary for staying in power, are less dependent on
foreign investment in regimes with natural resources.3 Thus while nationalizing foreign
investors is a tempting option for all governments, the reputational costs borne by nation-
alizations are less damaging to leaders in regimes with natural resources. We predict that
natural resource endowments, by affecting the incentives of leaders to renege on contracts
with private investors, will increase political risks for firms.
This relationship between natural resources and political risk is not limited to reneging
on contracts or nationalizing firms in the natural resource extraction industries. Leaders
will have weaker incentives to uphold contracts with all types of firms. Thus investors in
manufacturing and services are exposed to higher political risks due to the lack of incentives
for the government to maintain a good reputation.
This theory provides an indirect mechanism through which natural resources can affect
host governments. Not only can natural resources lead to authoritarian leaders or civil
conflict, it also makes governments less sensitive to actions that will drive away foreign
investment. The lack of development in natural resource dependent economies may be
partially due to the lack of incentives for building the rule of law.
In our empirical analysis we explore a novel cross-sectional data set from the political
risk insurance industry that prices the costs of purchasing political risk insurance against the
threat of nationalization, expropriation, or reneging on contracts that threaten firms. This
data provides a number of advantages over existing data sources, specifically in allowing us
to directly measure the risks faced by multinational investors. Our results show that natural
resources are associated with dramatically increased political risks, even after controlling
3These large budgets in natural resource economies can also be translated into higher levels of employment.
3

for economic and institutional features. Our secondary data analysis explores a confidential
firm-level data set on the taxes paid by the foreign affiliates of U.S. multinationals. We
find that natural resource dependent countries partially compensate for the high levels of
political risk by offering generous tax incentives to firms.
1 Political Risk
Both scholars and politicians have begun to recognize the potential economic benefits of
attracting the investment of multinational corporations, foreign direct investment (FDI).4
Governments can help influence the benefits of foreign investment and harness private capital
for development (Moran 1999). Unfortunately, although neoclassical models of international
capital predict that international capital should flow from rich countries to poor countries,
most foreign investment is between wealthy countries.5
While a number of mechanisms can explain the lack of investment in the developing
world, one potential culprit is the lack of secure property rights.6 Property rights are es-
pecially important to multinational investors, where investments in production facilities or
extractive industries can not be easily disinvested in response to political change. As pointed
out by Vernon (1980), although multinationals may negotiate lucrative entry deals before
entry, firms can become hostages of the host government. While scholars have criticized the
simplistic application of Vernon’s obsolescing bargaining (Malesky 2007), the key point is
that when disinvestment is relatively illiquid, multinational investors are exposed to political
risks after investment.7
As highlighted in the introduction, governments that renege on contracts with multina-
4See Jensen (2006) for a review.5Lucas (1990) and Alfarno et al (2005).6Blonigen (2005) for a review.7Kobrin (1979, 1980, 1984).
4

tionals will be punished by multinational investors with lower levels of future foreign direct
investment. Yet, despite these costs, scholars have argued that governments still have incen-
tives to renege, renegotiate, or outright nationalize foreign direct investments. This has led to
a large literature on how political institutions can constrain political leaders behavior towards
foreign investors. Scholars have examined how political regimes (Harms and Ursprung 2002;
Jensen 2003, 2006, 2008; Kenyon and Naoi 2007; Li and Resnick 2003; Busse 2004; Busse
and Hefeker 2005), political constraints (Henisz 2002), electoral rules (Garland and Biglaiser
2009), security agreement (Biglaiser and DeRouen 2007) and partisanship (Weymouth and
Broz 2007) all affect the risk environment.8
Beyond these domestic factors, scholars have increasingly turned to how international law
can constrain nation-states. A number of projects have focused on how bilateral investment
treaties (BITs) increase investment by reducing political risks.9 These studies find conflicting
results on the impact of BITs on investment flows. Yet, none of these studies have directly
tested the impact of BITs on political risk.
The key point is that multinational corporations often avoid high risk countries, or engage
in strategies that limit exposure to country level political risk.10 Thus political risks can lead
to a misallocation of capital, and the structuring of activities for multinationals that limit
the positive spillovers of foreign direct investment.11 Our theory is that the resource curse
increases these risks for a firm operating in natural resource dependent countries.
8There is also a growing literature on the variations of authoritarian regimes, and how this variation affecteconomic performance. For example, see Gandhi (2008) and Wright (2008).
9UNCTAD (1998), Hallward-Driemeir (2003). Egger and Pfaffermayr (2004), Neumayer and Spess (2005),Salacuse and Sullivan (2005), Tobin and Rose-Ackerman (2005), Haftel (2007) and Yackee 2008)
10See Tomz (2007) for an extensive exploration of the role of reputation in international capital markets.11Desi, Foley, and Hines (forthcoming) find that multinationals in high risk countries finance their invest-
ments from domestic capital, rather than bring in capital from abroad.
5

2 The Natural Resource Curse
A second literature explores the negative effect of natural resources on economic and political
development. While an extensive review of this vast scholarly literature on the natural
resource curse is beyond the scope of this paper, we outline a number of important empirical
and theoretical relationships between natural resource wealth and political and economic
outcomes. These include the link between natural resources and: 1) low levels of economic
growth, 2) authoritarian regimes, and 3) political violence.12
The first of these points, the growing consensus linking natural resource endowments
to lower levels of economic development and economic growth, has resulted in numerous
academic publications and have permeated public policy debates.13 One mechanism for this
Dutch Disease, named after the deindustrialization associated with the Netherlands natural
gas boom, is that natural resources lead to a real exchange rate appreciation, driving ex-
porters out of business. Natural resources can have other economic consequences, such as
leading to a lack of economic diversification, decreasing the demand for skilled labor, and
having a negative impact on womens employment opportunities.14 Macro cross-national em-
pirical regressions generally find a negative association between natural resource endowments
and GDP growth rates (Sachs and Warner 1995, 1999).
A second literature has focused on the negative impact of natural resources on democ-
racy. Numerous recent empirical projects have identified natural resource endowments as
entrenching democratic leaders while cross-national empirical analysis has linked natural re-
source wealth to the persistence of authoritarian regimes and breakdown of democratic gov-
12See Ross (1999, 2001, 2006) and Rosser (2006) for reviews of the literature.13See Auty (2001) for an extensive treatment of this issue.14See Alexeev and Conrad (2008) for a review and a new analysis. For a study on how natural resource
endowments affect women, see Ross (2008).
6

ernments.15 These results are not without contestation, where Alexeev and Conard (2008)
argue scholarship has largely overstated the impact of natural resources on both economic
growth and political institutions. Dunning (2008) uses a mix of theoretical models, empirical
analysis, and case studies to examine the links between natural resources and authoritarian
regimes. Dunning finds a complex relationship where natural resources can threaten democ-
racy under some conditions, and support democratic consolidation and survival under other
conditions.
Finally, natural resources have also been linked to political violence. Resources can
cause the onset of a violent struggle because of their value, and they can allow violence to
continue because of their lootability. Most researchers have found a positive and significant
relationship between resource dependence and violence (Berdal and Malone 2000; Collier and
Hoeffler 2000, 2003; Fearon and Laitin 2003). Humphreys (2005) nuanced empirical findings
suggest that natural resources increase the likelihood of civil conflict, but can shorten the
duration of political violence, usually by leading to a complete military victory by one side.
Ross (2006) finds that resource rents influence both the onset and duration of civil conflict,
although with substantial differences across types of resources and their geographic location.
Utilizing a new data set on natural resource rents, de Soysa and Neumayer (2007) find little
support for mineral rents affecting civil conflict, while energy rents increase the probability
of civil war onset.
While this is far from an exhaustive summary of the natural resource curse literature, it
provides a representative overview of the existing theoretical and empirical debates. In the
next section we argue for an alternative theoretical mechanism linking natural resources and
lower levels of development.
15For example, see Ross (2001) and Jensen and Wantchekon (2004).
7

3 Natural Resources and Political Risk
The mentioned studies on the link between natural resources, economic growth, authoritarian
regimes and political violence most likely lead to indirect impacts of natural resources on
the investment environment.
One mechanism linking natural resources and political risk is the relationship between
high levels of natural resource dependence and authoritarian regimes. Scholars examining
political risk have examined how democratic institutions affect the investment environment.
For example, Democratic institutions have been associated with higher levels of foreign
direct investment flows (Jensen 2003, 2006) and less acts of expropriation (Li 2009). Recent
scholarship has gone beyond this democracy-dictatorship dichotomy. Henisz (2000, 2002)
constructs a new measure of political constraints which take into account both the number
of veto players and ideological distance between these actors. While democracy is highly
correlated with political constraints, it is possible to have unconstrained democracies and
highly constrained authoritarian regimes. Jensen (2008) argues that constraints on the
executive are the primary factor linking democratic institutions to lower levels of political
risk.
Democratic institutions can have a negative impact on the investment environment. Li
and Resnick (2003) find that after controlling for the rule of law, democratic institutions
reduce foreign direct investment inflows. Li and Resnick (2003) identify one of the main
mechanism is that stronger anti-trust protections in democracy regimes can disadvantage
monopolistic multinationals. Democratic regimes can lead to unstable policies since elec-
tions can lead to time-inconsistent preferences (Rodrik 1991; Pattillo 1996) or incumbents
may institute policies to lock in future governments (Persson and Svensson 1989, Alesina
and Tabellini 1990). Democratic regimes may also limit the ability to ability of firms to take
8

advantage of their monopoly position or extract tax concessions (Li 2006). Finally, author-
itarian regimes can also protect multinationals from popular pressures that go against the
interests of the firm (Huntington 1968, Bornschier and Chase-Dunn 1985, and Oneal 1994).
These studies suggest that democratic regime is not always preferred to authoritarian regimes
for investors.
Thus one mechanism linking natural resources and the risk environment is the how re-
sources affects democracy and how democracy affects the risk environment, although this
mechanism is still controversial and indirect. An alternative mechanism is that relationship
between natural resources and political violence. The political violence associated with nat-
ural resource wealth can also affect potential multinational investors. Nigh (1985), Enders
and Sander (1996), Li (2006b), Jakobsen and de Soysa (2006), Blomberg and Mody (2007),
and Jensen and Young (2008) find that political violence has a negative effect on investors,
although Loree and Guisiner (1995) and Globerman and Shapiro (2003) find mixed results
linking violence and FDI, and Fatehi-Sedeh and Safizadeh (1989), Li and Resnick (2003),
and Sethi, Guisinger, Phelan and Berg (2003) find no relationship.
In this paper we sketch out an alternative theory linking natural resources to political risk
that focuses on the incentives of political leaders. The weakness of the literature on political
regimes and foreign direct investment is that focus on how institutions can constrain political
leaders. This assumes that leaders always have the incentives to expropriate investment or
renege on contracts with multinationals.
Our paper focuses on the conditions under which governments have the incentive to
renege on the contracts with multinationals. The key insight of this paper is how resource
endowments affect the incentives of leaders to renege on contracts. The logic is as follows.
In the next section, we develop microfoundations for a political leader, who oversees the
investment climate of her country, and a potential foreign investor. We model then their
9

interaction as a strategic game in which the leader decides whether or not to expropriate and
the investor decides whether or not to invest. We discuss how natural resource wealth affects
the equilibrium outcome within this strategic environment. In section 5 we explore if there
are systematic differences in the risk environment in natural resource dependent countries.
4 A Model of Reputation, Risk and Natural Resources
In this model, we are interested in finding conditions that must be satisfied in order for a
leader, L, not to expropriate, and an multinational corporation, C, to invest in L’s country.
Once these conditions are expressed, we model the interaction using a strategic game and
analyze how the equilibrium behavior changes with respect to an increase in L’s natural
resource revenue.
4.1 Leader Incentives
For country A, let there exist an incumbment leader, L, who decides how much FDI to
expropriate, and, thereby, how attractive her country is to multinational corporations. A
group of foreign investors, upon seeing L’s decision, react by expanding or contracting their
current level of investment in country A.
Assume that L seeks to maximize the government’s revenue. In this paper, we make no
assumption about how they intend to use this revenue.16 They make their decision subject
to a cost-benefit analysis of expropriation versus facilitating FDI. Assume that investors also
seek to maximize their profits. They decide whether or not to increase investment in country
A by analyzing the risk adjusted returns of the investment. We assume that investors can
16We anticipate, however, that leaders will divide their revenue between public goods and private goods,depending on their electoral constraints, and embezzle the rest for personal gain (it is not necessary forleaders to embezzle).
10

observe all expropriations and assess the risk adjusted returns of their investment oppor-
tunities by observing various investment indicators in a country, including the level of free
resources, R0.
On the whole, we assume that investors regard an increase in free resources as creating
a more lucrative investment climate. There are several ways to justify this. Among them,
we consider two: the ability to offer lower corporate tax rates and the increase in demand
of investors with resource-intensive operations.Regarding the latter, it is likely that some
firms will view additional natural resources as bolstering the investment opportunity. Oil
and mining firms, for example, prefer not to mine in resource-barren countries. Other firms,
such as those in the manufacturing sector, may be indifferent. We also assume, however,
that C is a sophisticated actor: if an increase in natural resources leads to higher political
risk, we expect C to be aware of it. In other words, if investors believe that L perceives an
increase in investor demand, they will expect L to be less constrained by maintaining a safe
investment climate, and thus, will expect an increase in political risk. They balance this risk
against how natural resources affects the attractiveness of the host country, or more generally
their expected risk adjusted returns of their investment. For many firms, the increase may
be slight in comparison to the expected gain. For others, it may be significant. Going
forward, we assume that an increase in natural resources has a net positive effect on how
investors view the potential returns to their investment, although the risk adjusted returns
may decrease.
Let T be the total amount of government revenue, I0 be the cost of attracting and
maintaining FDI, and α be the rate of return on the FDI. I0 costs may vary from country
to country, including building infrastructure for investment, marketing costs for targeted
investment promotion activities, and fiscal incentives for investment. We envision α as a
composite of tax revenue from the international corporations and income tax revenue from
11

the public.17 If L decides to facilitate FDI, they receive:
T − I0 + αI0 (1)
Next, let Rexp and zexp be the amount of free resources and amount of targetable18 goods
they gain from expropriation, respectively. If L decides to expropriate, they receive:
T +Rexp + zexp (2)
By subtracting equation (2) from (1), we find the total cost of facilitating FDI (or, equivalent,
the gain from expropriation):
Rexp + zexp + I0(1− α) (3)
Here, Rexp + zexp represents the opportunity cost created by not expropriating FDI. Thus,
we see that expropriation will become profitable when equation (3) is less than or equal to
zero. Rearranging, and solving for α, we find that the rate of return, α, must obey the
following constraint:
α ≥ 1 +Rexp + zexp
I0(4)
The leader must also consider the future loss of investment that results from investors
observing expropriations. We assume leaders may not be able to recover by simply not ex-
propriating in the next period.19 Specifically, we say that the loss of investment will continue
17We allow for the possibility that FDI increases the domestic productivity of workers, raising incomes,thus generating more income tax revenue for a given tax rate.
18We denote a targetable good as any good whose primary value is in redistribution, directly after expro-priation, to a targeted set of the selectorate. These goods may have little value outside of the redistribution.
19See Tomz (2007) for work on the dynamics of reputation in relation to sovereign defaults.
12
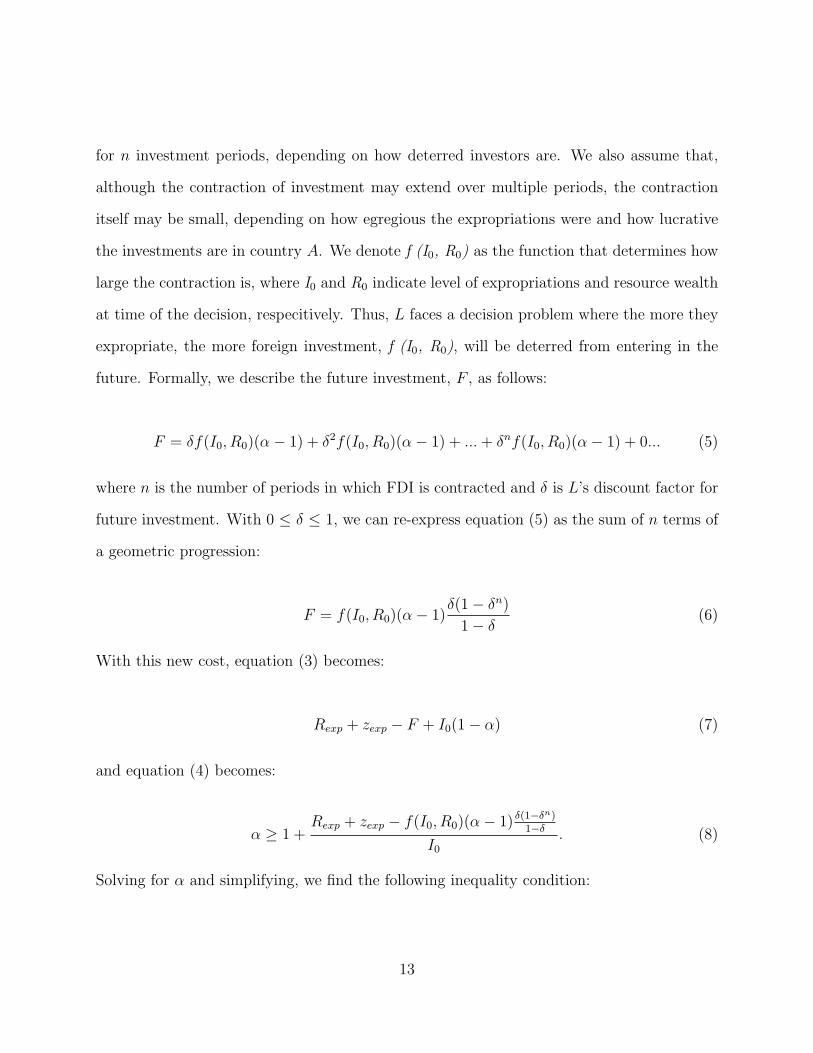
for n investment periods, depending on how deterred investors are. We also assume that,
although the contraction of investment may extend over multiple periods, the contraction
itself may be small, depending on how egregious the expropriations were and how lucrative
the investments are in country A. We denote f (I0, R0) as the function that determines how
large the contraction is, where I0 and R0 indicate level of expropriations and resource wealth
at time of the decision, respecitively. Thus, L faces a decision problem where the more they
expropriate, the more foreign investment, f (I0, R0), will be deterred from entering in the
future. Formally, we describe the future investment, F , as follows:
F = δf(I0, R0)(α− 1) + δ2f(I0, R0)(α− 1) + ...+ δnf(I0, R0)(α− 1) + 0... (5)
where n is the number of periods in which FDI is contracted and δ is L’s discount factor for
future investment. With 0 ≤ δ ≤ 1, we can re-express equation (5) as the sum of n terms of
a geometric progression:
F = f(I0, R0)(α− 1)δ(1− δn)
1− δ(6)
With this new cost, equation (3) becomes:
Rexp + zexp − F + I0(1− α) (7)
and equation (4) becomes:
α ≥ 1 +Rexp + zexp − f(I0, R0)(α− 1) δ(1−δ
n)1−δ
I0. (8)
Solving for α and simplifying, we find the following inequality condition:
13

α ≥ 1 +Rexp + zexp
I0 + f(I0, R0)δ(1−δn)
1−δ
(9)
Let sδ = δ(1−δn)1−δ . Notice that sδ is the sum of the geometric progression sδ =δ + δ2 + ... +
δn. Now, equation (9) becomes:
α ≥ 1 +Rexp + zexp
I0 + f(I0, R0)sδ(10)
In equation (10), we see that as Rexp + zexp increases, the minimum α for which the incumbent
to facilitate investment, at level I0, must be higher. As n increases, on the other hand, we
see that the inequality constraint decreases. We also notice that sδ is strictly monotonic with
δ, ∀δ s.t. 0 ≤ δ ≤ 1, which we assume by construction. Thus, as δ increases, the constraint
on α decreases. Lastly, because f (I0, R0) ∝ 1R0
, we see that as free resources increase, the
inequality constraint on α increases as well. In other words, for any level of investment, an
increase in natural resources provides a leader more incentive to expropriate. In subsection
(4.4), we discuss how the increase affects a leader’s behavior in equilibrium. Now we consider
the decision of the foreign corporate investor, C.
4.2 The Investor Decision
Thinking about the investor’s incentive compatibility, let us first assume that our investor
is the average investor over a range of large, small, manufacturing, and natural resource-
intensive corporations. Let V denote the amount C invests in L’s country and let γ denote
the rate of return on that investment (if not expropriated). We envision γ as a composite of
the attractiveness of the host country for the proposed investment project and the level of
14

corporate taxation. As with α, we assume that γ ≥ 1.20 Here, we focus on the attractiveness
of the host country and use R0 as a proxy. It is likely that some firms will view an increase
in natural resources as bolstering the investment opportunity. Other firms, such as those in
the manufacturing sector, may be indifferent. Going forward, we assume that an increase in
natural resources has a net positive effect on how investors view the opportunity. Later, we
discuss how our hypothesis relates to this assumption. Lastly, we use Vp to denote the part
of the original investment, V , that is left over after a partial expropriation. Notice that Vp
→ V when L expropriates close to nothing and 0 when almost full expropriation occurs.
Let R be the total amount of firm profits. If C decides to invest V , they receive:
R− V + γVp (11)
If C decides not to invest, they receive R. By subtracting equation (11) from this, we find
the total cost of investing in country A:
V − γVp (12)
As above, we set equation (12) ≤ 0 and solve for γ. Simplying, we find:
γ ≥ V
Vp. (13)
Thus, L and C will invest at level I0 and V , respectively, if the inequality constraints for
α and γ are satisfied. To underlie this logic, we simply assume that L and C will invest in
something if it is profitable.
In equation (13), we see that as V increases, the minimum γ for which C invests, at level
I0, must be higher: as the cost of investment goes up, so must the return on that investment,
20If not, no investment takes place.
15

if Vp stays the same. As Vp increases, on the other hand, we see that the inequality constraint
decreases: as the amount not expropriated increases, the return on the investment need not
be as high. Lastly, because γ ∝ R0, we see that as free resources increase, the inequality
constraint on α increases as well. In other words, for any level of investment, an increase in
natural resources provides an investor more incentive to invest: if amount invested increases
without a change in Vp or if the amount expropriated increases, C still may profit more with
the vaulted γ. In section (4.4), we discuss how the increase affects an investor’s behavior in
equilibrium.
Before we discuss the interaction between L and C, we briefly review the incentives that
will condition their behavior. In deciding whether or not to expropriate, L considers how
valuable the goods become upon expropriation (Rexp + zexp), how profitable they are as
investments (α), how expensive it is to court and maintain those investments (I0), the size
and duration of the contraction that follows an expropriation-provoked loss in reputation
(f(I0, R0) and n, respectively), and their discounting of future versus present profits (δ).
The foreign investor, on the other hand, does not face a reputational cost if they do not
invest. In deciding whether or not to invest, C considers the size of their investment (V ),
the amount of their investment which is expected to survive expropriation (Vp), and the rate
of return on that part (γ), which depends on corporate tax rates and on the attractiveness
of the host country for the investment (R0). With this summary in mind, we proceed to a
simple model of the interaction between L and C.
4.3 A Strategic Game with Risk, Reputation and Resource Wealth
Consider a strategic game with two players, L and C, in which L decides between expro-
priating fully (E), partially (Ep),21 or not at all (¬E), and C decides between investing (I)
210 < Ep < E. As such, fp ∈ (0, f), Ip ∈ (0, I0), and (Rexp + zexp)p ∈ (0, Rexp + zexp).
16

.
(L)
(C)
I ¬I
E Rexp + zexp − F − c,−V −c, 0
Ep (Rexp + zexp)p − Fp − Ip + αIp − c,−V + γVp −c, 0
¬E −I0 + αI0 − c,−V + γV −c, 0
Figure 1: A two player strategic game, in which a foreign investor (C) chooses whether ornot to invest and a political leader (L) choose at what level to expropriate that investment.
and not (¬I). We assume that L pays a cost, c, for courting investors to play the game in
the first place. Other than this cost, payoffs are determined by the equations (7) and (12)
above. The game is depicted in figure (1) and analyzed below.
Looking at figure (1), we analyze C first. If C does not invest, they receive nothing,
no matter what L decides. If they choose to invest, however, we see that their payoff
preferences are as follows: (¬E, I) � (Ep, I) � (E, I). Above we assume that γ ≥ 1. With
this assumption, we see that C always prefers to invest if L selects ¬E. If L selects E, on
the other hand, C will always prefer not to invest (V > 0, by construction). If L selects
Ep, C’s decision depends on how much of their investment is left after the expropriation, Vp.
Specifically, C will only invest when −V + γVp ≥ 0 or, equivalently, when γ ≥ VVp
, where
0 < Vp < V .
L’s incentives are more complex. If C chooses not to invest, L is indifferent: they receive
−c. If C chooses to invest, their preferences vary based on the rate of return from facilitating
FDI (−I0 + αI0), the value of the expropriation (Rexp + zexp), and the size/duration of
the cessation of investment that follows the expropriation (f(I0, R0) and n, respectively).
Specifically, L chooses:
17

E if 1 ≥ 2 , 3
Ep if 2 ≥ 1 , 3
¬E if 3 ≥ 1 , 2
(14)
where 1 = Rexp+zexp−F −c, 2 = (Rexp+zexp)p−F −Ip+αIp−c, and 3 = −I0 +αI0−c.
Searching for equilibria, we find four (in pure strategies). When we restrict our attention
to those in which C invests, only two remain: (Ep, I) and (¬E, I). Notice that no equilibrium
exists where C invests and L expropriates fully. Substituting 1 , 2 , and 3 with their
functional forms, and solving for fp(Ip, R0),22 we can re-express the necessary conditions for
L to select Ep and ¬E as:
Ep if fp(Ip, R0) ≥ βp+(Ip−I0)(α−1)
(α−1)sδ
¬E if fp(Ip, R0) ≤ βp+(Ip−I0)(α−1)
(α−1)sδ
(15)
where β = Rexp + zexp. With these conditions, the equilibrium assessment is described as
follows:
Equlibrium1 : (Ep, I) if γ ≥ V
Vp& fp(Ip, R0) ≥
βp + (Ip − I0)(α− 1)
(α− 1)sδ
Equilibrium2 : (¬E, I) if fp(Ip, R0) ≤βp + (Ip − I0)(α− 1)
(α− 1)sδ(16)
Equilibrium 1 and 2 provide the conditions necessary to speculate on, in this strategic game,
when we should expect expropriation to accompany investment.
At this point, we have demonstrated a logic for how expropriation can accompany in-
22Notice that fp → f , Ip → 0 and (Rexp + zexp)p → (Rexp + zexp).
18

vestment. We find two equilibria in which investment takes place; one in which the foreign
investor invests and the leader does not expropriate and the other in which the foreign in-
vestors invests despite the leader’s partial expropriation. As expected, no equilibrium exists
in which C invests and L expropriates their entire investment. In the next section, we proceed
to show how an increase in natural resources effects the outcome supported in equilibrium.
4.4 The Effect on Risk of an Increase in Natural Resources
We now analyze how an increase in natural resources effects the conditions for our two
equilibria.
We begin by assuming that L and C are in equilibrium 2, in which C invests and L does
not expropriate. Recall that as R0 increases, fp decreases. Thus, we see that as R0 increases,
L gets closer to the inequality’s lower bound. As R0 increases further, the inequality binds,
fp = (Rexp+zexp)p+(Ip−I)(α−1)
(α−1)sδ, and L becomes indifferent to Ep and ¬E. If the increase in R0
is any larger, the threshold is breached and L prefers Ep. Simultaneously, as L becomes
more likely to expropriate with an increase in R0, C becomes more willing to invest should
L choose Ep; if R0 increases, so does γ, and thus γ ≥ VVp
is more likely to be satisfied. For
C, too, there will be an increase in R0 which will be large enough to make them want to
invest, rather than not invest, when L selects Ep. Thus, if L and C belong to equilibrium 2,
an increase in natural resources can justify a switch to a new equilibrium, where C invests
despite L’s partial expropriation.
If L and C are equilibrium 1, we see a similar story. In the partial expropriation equi-
librium, we know that the fp and γ conditions are satisfied for L and C, respectively. Any
increase in R0 will push them both further away from these thresholds, increasing their in-
centives to occupy this equilibrium rather than (¬E, I). For L, this will continue until fp
becomes so low as to make a full expropriation preferable. Once this lower bound is reached,
19

however, there exists no equilibrium in which C invests: there is no such rate of return, γ,
that will entice C to invest upon full expropriation. Thus, in equilibrium 2, an increase in
natural resources can further root L and C in the partial expropriation equilibrium, but it
will never justify a switch to an equilibrium in which C invests despite L’s full expropriation.
Earlier, in sections 4.1 and 4.2, we showed that an increase in natural resources shifts
the incentives of both a country’s leader and it’s potential foreign investors. In section
4.3, we modeled their interaction and asserted several equilibria. In this section, we used
comparative statics to show that an increase in free resources can also change the behavior
of both foreign investor and leader, altering the outcome that is supported in equilibrium.
For countries, otherwise similar, with drastic differences in their stock of free resources, our
logic predicts a corresponding difference in the political risk that a foreign investor faces in
each country. Below, using a dataset from the political risk insurance industry, we test this
prediction. We show that resource dependent countries indeed have much higher levels of
political risk.
4.5 The Effect on Corporate Taxes
Before proceeding to the empirical analysis, we lay groundwork for an additional consequence
of the logic above. Specifically, if we assume that some investments are more valuable to
the government than other investments, and thus governments are willing to selectively use
policy to attract this type of investment, we expect to observe the seemingly odd pairing of
a demand driven increase in political risk and, simulatenously, targetted efforts to attract
investment, such as tax breaks.
As highlighted earlier, the existence of natural resources may increase the attractiveness
of the host country for some investors (specifically investment in natural resource extraction).
This leads, via the mechanism above, to an increase in political risk, which is borne by all
20

investors. Thus, some sectors receive the full benefit while paying only part of the cost. Up
to this point, we have stopped here. We assumed, for simplicity, that no sector is inherently
more important to a country’s leaders than any other. In reality, this is often not true,
and in this section we release that assumption, allowing some sectors to be more vital than
others. This fits with recent work, such as Pinto and Pinto (2008), that explores government
incentives to promote different types of investment.
Vital firms may come from any sector in the economy, but some sectors are more con-
ducive than others. For example, some sectors foster long-term investment, collaboration
on public-works projects, and greater employment opportunities for the national workforce.
Manufacturers, for example, often rely on national vendors for component parts, use local
transport routes daily, and offer employment to the local work-force. Although this may be
true of some firms in the natural resource sector, we assume that this is not generally the
case. On the contrary, firms that significantly base investment decisions on natural resource
wealth, are more likely to exit when resources deplete, to mine in isolated areas, and to rely
less on public-works projects and local employment. Unfortunately, for sectors that do not
directly benefit from R0, paying the cost of higher risk, they have less incentive to invest in
country A. Thus, to keep them investing at similar levels, L must offer additional incentives.
One such incentive is a tax break.
It is common knowledge that L elevates the importance of some sectors over others, but
L cannot credibly commit to expropriate the vital sectors less. On the contrary, such sectors
may be seductive to expropriate if they are of vital importance to the government.23 L must,
instead, incentivize investment by offering more concrete benefits. Tax breaks offer a way
to target particular firms, with concrete benefits, over time. Other types of assistance may
include a reduction in export tariffs or an increase in other types of subsidies. For simplicity,
23See Kobrin, 1984
21

we consider tax breaks as a proxy.
The impact of tax breaks on the equilibrium conditions may be complex, however. Tax
breaks lower L’s return on facilitating FDI, α, giving them more incentive to expropriate.
As political risk increases, further tax breaks are necessary, and the cycle continues until
the optimal level of tax breaks and expropriation is reached. Herein resides an additional
mechanism for how natural resource wealth affects political risk. We theorize lucrativeness as
a direct mechanism, creating an increase in demand that increases incentive to expropriate.
Tax breaks, on the other hand, provide an indirect mechanism, independent of natural
resource wealth, but co-dependent with levels of expropriation. Thus, when natural resources
increase, there is a direct as well as a multiplicative effect on the increase of political risk,
depending on how ’vital’ the sector and how much it is burdened by the increase in political
risk.24
Although this section provides only a sketch of the logic, it suggests that it may not
be surprising to observe, simultaneously, higher levels of political risk and lower tax rates.
It also offers an alternative mechanism by which political risk increases in countries with
natural resource wealth. Below, in section 6, we offer preliminary empirical support for this
hypothesis.
5 Empirical Analysis: Political Risk Insurance Data
In the previous sections we outline our theory of how natural resource endowments lead to
systematic increases in the levels of expropriation risk. Our key comparative static is that
increases in natural resource rents, ceteris paribus, will lead to overall increases in political
risk. This includes increased political risks for firms both in the natural resource sectors, and
24Notice that if either are zero, this indirect mechanism becomes irrelevant.
22

in other unrelated sectors. Our central point is that natural resource wealth dramatically
decreases the incentives of governments to uphold contracts with multinational firms.
To directly test the relationship between natural resource wealth and political risk re-
quires data that captures risk of expropriation. Currently there is a small number of datasets
that are utilized by scholars to measure the rule of law or level country risk. These include
risk ratings such as Euromoney, Institutional Investor, the Economist Intelligence Unit, In-
ternational Country Risk Guide, Moody’s, Political Risk Services, and Standard and Poor’s.
The majority of these ratings are either general risk ratings or ratings for sovereign bonds.
Only the International Country Risk Guide provides direct measures of risks of expropria-
tion, and this measure has been criticized for the subject and non-transparent generation of
these ratings.25 We propose an alternative measure of political risk that directly measures
expropriation risk. This data, political risk insurance ratings, directly measure perceptions
of the types of political risks facing firms.
Political risk insurers include major insurance companies such as Chubb and Lloyd’s of
London, companies that specialize in political risk such as Sovereign, and government owned
agencies such as the U.S. Government’s Overseas Private Investment Corporation (OPIC)
provide risk insurance products to multinational corporations investing abroad. While multi-
nationals can insure their businesses from natural disasters, theft, or even kidnapping, polit-
ical risk insurance is distinct from these other products. Political risk insurance is designed
to guard against political events that threaten the operations of multinational investors, in-
cluding: 1) government’s expropriating the assets of multinationals, canceling of contracts,
or other government activities that threaten the assets or income streams of multinationals
(called expropriation/breach of contract risk), 2) the threat of war or political violence af-
fecting (political violence) 3) or restrictions on the firm’s ability to expatriate funds (transfer
25See Hoti and McAleer (2005) for an analysis.
23

risk). Our theoretical model only makes predictions on the government activities that fall
under expropriation/breach of contract risk, and thus we only focus on this type of risk
insurance.26
As argued by Jensen (2008), using political risk insurance data has a number of distinct
advantages over previous risk measures. First, political risk insurance data allow us to
directly measure political risk and isolate expropriation risk from other types of risk. Another
advantage is that these measures are built by market actors attempting to maximize profits
by properly pricing and allocating resources based on the level of political risk. Although
these measures aren’t generated in a market the same way stock prices are determined
through trading since the pricing of political risk contracts are confidential, the political
risk insurance industry has a number of feedback mechanisms that allow for some degree
of price convergence across insurers. Political risk insurers (underwriters) develop political
risk contracts and utilize brokers to interface with clients. These brokers convey information
about competitors pricing to insurers.27
The political risk data we use to test our model comes from ONDD, the Belgian Export
Credit Agency. This agency provides traditional export credit insurance (insuring payment
for exports) and forms of investment insurance. We chose this data on ONDD pricing of
foreign direct investment insurance for five reasons. First, ONDD makes this data publicly
available via their website. Second, this data is disaggregated by type of political risk
insurance (expropriation/breach of contract risk, transfer risk, and war/political violence
risk). Third, after interviewing plant location consultants, I found that ONDD political risk
insurance data is utilized for evaluating risks (and protecting against risk). One of the largest
multinational investment location consultancies, IBM-Plant Location International, uses this
26Jensen and Young (2008) find that natural resources have little impact on political violence risk.27See Jensen (2008).
24

specific data to evaluate political risks. Even if a firm does not purchase ONDD political risk
insurance, major investment location consultants utilize their data for evaluating political
risk. Fourth, interviews with political risk insurance brokers reveal price convergence across
agencies, thus ONDD prices should be relatively similar to the prices charged by other
agencies. Finally, the head of the ONDD also serves as the head of the OECD’s country
rating service and is the price leader in export credit insurance.
ONDD categorizes countries into seven risk groups. Countries with the highest risks are
coded 7 and countries with the lowest risk are coded 1. Countries received separate scores
for expropriation risk, transfer risk, and war risk. For the remainder of this paper we focus
on expropriation risk/breach of contract risk.
ONDD produces these measures by utilizing a quantitative method that includes fixed
weights of a set of variables for expropriation risk. ONDD analysts meet four times a year to
update the country risk ratings. Each country is reviewed at least once a year in one of the
four quarterly meetings based on the country’s geographic region. Countries that are not in
the region under review can be added to the agenda in cases of political change that requires
a reevaluation. Countries are then assigned a rating on a 1-7 scale based on a quantitative
model and then are reevaluated based on qualitative evidence, making up to a one point
correction to the risk rating.
The key independent variable is a measure of country-level natural resource dependence.
There is a vibrant debate on how to properly measure natural resources endowments. In
political science and economics, numerous projects have utilized the data on natural resources
exports as a percentage of GDP (or merchandise exports). Ross (2006) is especially critical
of this operationalization, where measuring natural resources as a percentage of GDP has
a number of drawbacks. One obvious problem is that countries that resource dependence
is measured as a percentage of GDP, where poor countries are more likely to be coded as
25

resource dependent.
A second criticism is that focusing on natural resource exports can lead to misleading
conclusions. Numerous countries engage in the trading and transport of natural resources
(oil, gems, etc), thus export natural resources, yet their produce very few of these prod-
ucts. Countries that trade or process natural resources can be erroneously coded as natural
resource dependent.
Finally, most theoretical arguments, including our own, focus on how natural resource
rents affect economic or political development. Some natural resources may provide very few
rents to the government. For example the rents from oil production vary dramatically, not
just by the world price of oil, but also to the costs of extraction.
To measure natural resources we employ a number of different variables informed by this
debate. The main variable measuring natural resource endowments is energy and mineral
rents data from Hamilton and Clemons (1999). This variable measures the total amount
of natural resource rents per capita by calculating the prices of natural resources produced
minus the production costs.
There are two obvious limits to this data. First, this dataset doesn’t include information
on diamond rents, one of the commodities often associated with the natural resource curse.
Second, the Hamilton and Clemons data focus on existing natural resource rents, while there
are arguments that future natural resource rents can also influence government activity. For
example, Ross (2005) argues that ability of governments to borrow against natural resource
deposits, or ”booty futures,” is a mechanism through which natural resource endowments
can affect politics even in the absence of natural resource production.
To address these issues and examine the robustness of our results, we utilize a number of
alternative measures. The first measure, which comes from Lujala et al (2005), takes on a
26

value of 1 if the country is a major diamond producer and 0 otherwise.28 The second, from
Fearon and Laitin (2003), takes on a value of 1 if a country is a major oil exporter, and 0
otherwise. As a final robustness test of our results, we utilize Humphreys’ (2005) data on
oil reserves.
We use a relatively small number of control variables for the regression and note the ro-
bustness of the results to alternative measures. Although there are a number of studies that
explore the determinants of political risk ratings, few studies explicitly explore the determi-
nants of expropriation risk.29 Many of these studies focus on country credit ratings, such as
Euromoney or Institutional Investor Ratings. These ratings model the risk of sovereign de-
fault as function of financial, economic, and political risks. Although there may be common
factors associated with sovereign default and expropriation, the theoretical mechanisms are
distinct.
Thus, our empirical test only includes variables that are theoretically related to this
specific type of political risk. Control variables include the level of development (GDPPC )
and economic growth (Growth). Higher levels of economic development are associated with
lower levels of expropriation and contract disputes. Economic growth according to Jodice
(1980, 192), ”Expropriation is a reasonable response to economic discontent which is directly
linked to the operations of foreign firms in the national economy.” In periods of low economic
growth, politicians have the incentive to redistribute income from foreigners to domestic
citizens. We also include regional dummy variables for Western Europe, Latin America,
Sub-Saharan Africa, North Africa and the Middle East, Eastern Europe and the Former
Soviet Union, Asia, and Oceania.
To estimate the impact of democracy and political risk pricing categories we estimate
28This data provides dummies on different types of production and deposits. I focus my preliminary resultson this one measure for the sake of brevity.
29See Hoti and McAleer (2005) for an analysis.
27

the following ordered probit model:
Risk =α + β1Democracy + β2GDPPC + β3Growth+ β4Europe+ β5LatinAmerica
+ β6SSAfrica+ β7NAfrica+ β8EE/FSU + β9Asia+ β10Oceania+ εi (17)
The dependent variable is the ordinal measure of the disaggregated ONDD expropriation risk
price category for 2004. This measure ranges from 1-7 (lowest risk to highest risk). The key
independent variable is Democracy, utilizing the standard measure of political regimes from
the Polity IV dataset (Marshall and Jaggers 2000) where democracy is an ordinal variable
from 0 (low democracy) to 20 (highest democracy score). We also include controls for the
log of GDP per capita in 2003 and economic growth in 2003, both from the World Bank’s
World Development Indicators 2005. In all models we include regional dummy variables to
control for region specific determinants of political risk.
In Table 1 we present the results. In five of the six regression natural resources is a
robust predictor of political risk (expropriation/breach of contract). Only model 5 fails
to achieve statistical significance, where the value of diamond deposits is an insignificant
predictor of political risk. The results for the other five regressions are remarkably robust
to alternative specifications, including adding measures of political institutions, dropping
outliers and dropping OECD countries from the sample.30
Presenting the substantive impact of ordered probit results is best achieved by calculating
the probabilities that a country would be in a given risk category. Using the results from
model 6, we simulate the substantive impact using Clarify.31 These simulations give us
probabilities of countries falling into each of the seven categories. The substantive impact
of natural resource endowments on risk are enormous. Moving from the minimum level of
30Results available from author.31Tomz et al 2003.
28

Determinants of Expropriation Ratings
Model 1 Model 2 Model 3 Model 4 Model 5 Model 6
lGDPpc -0.859*** -0.798*** -0.809*** -0.750*** -0.882*** -0.860***(0.112) (0.114) (0.106) (0.112) (0.119) (0.115)
GDP -0.021 -0.025 -0.012 -0.022 -0.021 -0.038Growth (0.041) (0.054) (0.042) (-0.055) (0.041) (0.047)
Oil 0.886*** . . . 0.886*** .Dummy (0.276) . . . (0.276) .Log Oil . 0.044** . . . .Reserve . (0.017) . . . .
Diamonds . . 0.559** . 0.505** .Dummy . . (0.249) . (0.247) .
Log . . . -0.027 . .Diamonds . . . (0.028) . .
Log . . . . . 0.131***Rents . . . . . (0.046)
Regional Yes. Yes. Yes. Yes. Yes. Yes.Dummies . . . . . .
Cut 1 -7.296 -6.690 -6.585 -6.258 -7.296 -6.543(1.122) (1.047) (1.036) (1.041) (1.122) (1.000)
Cut 2 -6.527 -6.019 -5.819 -5.610 -6.527 -5.740(1.101) (1.035) (1.018) (1.041) (1.101) (0.987)
Cut 3 -5.718 -5.262 -5.077 -4.861 -5.718 -4.982(1.082) (1.015) (1.005) (1.031) (1.082) (0.967)
Cut 4 -4.338 -3.981 -3.811 -3.584 -4.338 -3.661(1.037) (0.981) (0.971) (0.999) (1.038) (0.932)
Cut 5 -3.317 -3.086 -2.801 -2.688 -3.317 -2.630(1.007) (0.943) (0.950) (0.965) (1.007) (0.903)
Cut 6 -2.282 -2.161 -1.733 -1.766 -2.282 -1.705(1.077) (1.006) (1.032) (1.017) (1.007) (0.966)
N 136. 124. 143. 124. 136. 133.χ2 195.02 181.83 202.72 187.25 195.02 204.03
PsuedoR2 0.32 0.31 0.31 0.30 0.32 0.31
Table 1: The dependent variable in all regressions is the ONDD political risk rating forexpropriation/breach of contract risks. Ordered probit with robust (Huber-White) standarderrors in parentheses. ***=p<0.01, **=p<0.05, *=p<0.10
29

natural resources (0) to the maximum (9.35) reduces the probability of being in one of the
three lowest risk categories by 43%. Numerous countries in the data set are at this minimum
and a number of countries are clustered close to the maximum. A less extreme example is a
movement from the mean level of resource dependence (0.31) to the maximum reduces the
probability of being in these three lowest risk categories by 31%. A final simulation examines
how Benin’s risk rating (resource dependence of 0.353) would decrease given natural resource
dependence equivalent to Nigeria (4.824) and Angola (5.349). Benin’s probability of being
in one of the three lowest risk categories would drop by 22% and 24% respectively.
These empirical results are consistent with our theory presented in this paper. Countries
with large endowments of natural resource wealth are associated with dramatically higher
levels of political risk. These results are consistent across a number of measures of natural
resource wealth.
6 Empirical Analysis: Corporate Taxation
Our second set of empirical tests explores the relationship between natural resource wealth
and the taxation of firms. Our theoretical model points to the potential co-existence of
foreign direct investment despite threats of expropriation. For firms in the natural resource
industry, resource endowments can draw in investments, increasing the attractiveness of the
country for extractive investment. For firms not affiliated with the natural resource sector,
government policy, specifically reductions in corporate taxation can partially compensate for
increased political risk. Thus our prediction is straightforward, firms that invest in countries
with large natural resource endowments are likely to receive generous tax concessions. To
test this hypothesis we utilize firm level data from the United State’s Bureau of Economic
Analysis.
30

The United States Bureau of Economic Analysis (BEA) collects data on the investment
activities and operations of U.S. foreign affiliates every year through a survey of firm level
activities for all firms above a minimum asset, sales, or income threshold.32 Every five years
the BEA conducts a more comprehensive survey including a larger number of questions and
a larger number of firms. This survey data is believed to be of high quality since all firm-level
data is confidential. The BEA aggregates this firm-level data by country and industry and
releases this data to the public through a number of publications. This data may be shared
with other agencies for the purpose of improving statistics, but this data is not shared with
government agencies to collect taxes, enforce regulations, or make policy. Firms are required
to report data to the BEA and there are monetary penalties for non-compliance. Thus the
BEA benchmark survey data collected every five years is the highest quality firm-level data
that covers essentially the complete universe of U.S. investments abroad.
The BEA has a program that allows a limited number of academic researchers access
to the firm-level data for research purposes. Access is granted (strictly at the Bureau’s
discretion) under a program that permits selected researchers to work on site as unpaid,
special sworn employees of the Bureau. To conduct this research project we were granted
access to the BEA firm level data as a sworn employee of the Bureau.
We utilize a number of variables from the 2004 BEA Benchmark survey (the most recent
Benchmark survey), but the key piece of information is the foreign affiliates’ reports on the
total dollar value of taxes paid to the host government. This data isn’t disaggregated by
the jurisdiction of the tax authority in the country (national, state/province, local, etc.)
although it does differentiate the types of taxes (corporate, indirect taxes, etc.) paid by the
firm.
32This reporting is mandatory under the International Investment and Trade in Services Survey Act. Thethreshold for the 2004 Benchmark survey is $10 million.
31

This universe of U.S. firms includes over 22,000 foreign affiliates, including 524 newly
established or acquired affiliates.33 While this data is considered one of the highest quality
data sources on multinational activities, scholars utilizing this data for research purposes have
been careful to organize and clean the data for comparability across firms. First, while annual
BEA surveys include both recorded and ”estimated” data for firms, the BEA benchmark
surveys have more extensive reporting requirements, minimizing the use of estimated data.
By using only the 2004 Benchmark we only utilize reported data.34 All U.S. foreign affiliates
with sales, assets, or net income of over $10 million are required to report to the BEA.
Second, BEA foreign affiliate data includes firms in all industries. While this diversity
of sectors and industries can be an asset for the empirical analysis, scholars using this data
have been careful to exclude firms operating in banking and finance due to non-comparable
nature of these firms. Specifically, the assets of firms in financial sector could include stocks
and bonds held by the bank that are from third countries. This isn’t comparable to the
assets of a multinational in the manufacturing industry that has invested in plant, property
and equipment. Following convention, we exclude the financial sector from my analysis.35
Finally, although compliance with all questions on the BEA survey are mandatory for all
foreign affiliates, there is the possibility of a foreign affiliate leaving a question blank, which
is recorded as a zero.36 Thus the BEA data makes no distinction between non-response and
33This descriptive data is from Mataloni and Yorgason (2006).34The benchmark survey has much more extensive reporting requirements, including a lower minimum
size threshold for reporting. In some cases data will be estimated in the benchmark data, including casesof when a firm fails to report an item or if the report is of dubious quality. The BEA also has slightlydifferent reporting requirements based on the size of the firm. In the 2004 benchmark survey, majority-owned affiliates with assets, sales, or net income greater than $150 million were required to file on the longform; majority-owned affiliates with assets, sales, or net income between $25 million and $100 million, andall minority-owned affiliates with assets, sales, or net income greater than $25 million, were required to fileon the short form; and affiliates with assets, sales, or net income between $10 million and $25 million wererequired to file on the mini form. I discuss the implications of these different forms when I outline mydependent and independent variables.
35For example, see Desai et al (2004c).36Also, strict security policies prohibit downloading software, such as imputation programs.
32

true zeros. As highlighted earlier, compliance with BEA benchmark surveys are mandatory
for firms, and the Department of Commerce follows up with parent companies that do not
respond or provide responses that are flagged as potentially inaccurate.37 This doesn’t negate
the possibility of non-response, but it should lead to some skepticism regarding the possibility
that non-responses are driving all of these zeros.
As a final check against non-response we randomly selected fifty foreign affiliates and
examined their paper forms, focusing on the reported foreign income taxes. In three cases I
found non-responses to the foreign income tax question, and in all three cases the firms also
left a number of other questions blank, including skipping the question on the ”cost of goods
sold.” Thus, for the empirical analysis, we assume that all foreign affiliates with values of zero
for costs of goods sold and zero values for foreign income taxes represent non-responses. In
most cases the firms represent holding companies that are not directly engaged in production
activities and should not be pooled with the other firms in the sample.38
We present a straightforward empirical test of the relationship between natural resource
wealth and levels of corporate taxation. For simplicity, we focus on instances of complete
exemption from corporate taxes, but we note our results are robust to testing using the log
of dollars in taxation as the dependent variable. In Models 7 and 8 we code instances of
complete exemptions from corporate taxation as a 1, and any taxes paid as zero, modeling
using a cross-sectional logit in Stata 11.
In Model 7 we include a limited set of country-level control variables, including the log
of GDP per capita and the highest statutory marginal tax rate, both from the World Bank
37The BEA has accounting staff that specialize in specific parent firms. The staff checks the quality of thedata by comparing the data of foreign affiliates from the same parent firm. A second level of quality checkingis done at the country level, where research staff compares the reporting of foreign affiliates activities bymultiple parents but in a single host country.
38Most of there firms reporting zero costs of goods sold are in the finance industry (holding companies).The data cleaning routine of excluding this industry excludes these holding companies.
33

Resource Rents and Corporate Tax Exemptions
Model 7 Model 8
Log Rents -0.021*** -0.022***(0.006) (0.006)
IGDPpc -0.051*** -0.043***(0.018) (0.020)
Tax Rate -0.007*** -0.006***(0.002) (0.002)
Zero Income 1.160*** 1.226***(0.028) (0.029)
Parent Assets . -0.009. (0.007)
Affiliate Assets . -0.057***. (0.010)
PPE/Assets . -0.037. (0.052)
Local Sales . -0.151***. (0.039)
Industry Dummies Yes. Yes.Constant -0.332 0.397
(0.340) (0.383)N 12,992. 12,005.
PsuedoR2 0.13 0.14
Table 2: Probit coefficients. Robust standard errors in parentheses. *=p<.1 **p<.05***=p<.01
World Development Indicators. Following Jensen (2008), we expect that countries with
higher levels of economic development and countries with higher marginal tax rates are less
likely to provide tax incentives. We also include a firm-level control for foreign affiliates that
are unprofitable. While firms may strategically manipulate profits to minimize their tax
burden, a large number of firms in the data set have reported profits, but zero tax payments.
We also include a set of sectoral dummy variables. Our control variable takes a value of 1
if the affiliate has pre-tax profits that are less than or equal to zero. Our key explanatory
variable is our measure of the log of natural resource rents from Hamilton and Clemons
34

(1999).
In the second regression, Model 8, we include robustness tests that include firm-level
control variables. We include measures of the size of the parent firm (log of parent assets),
the size of the foreign affiliate (log affiliate assets), and the liquidity of the investment project
defined as fixed assets as a percentage of total assets (PPE/Assets). Following Jensen (2008)
we also include a measure the percentage of sales that are exported, versus the percentage
of sales that are exported. This final measure explores how firms that don’t compete with
domestic firms are provided tax incentives. The empirical results are consistent with our
theoretical model. Countries with large levels of natural resource rents are much more likely
to provide tax incentives to firms.
7 Conclusion
In this paper we explore an alternative mechanism through which natural resources can affect
the political and economic environment. We argue that natural resource rents can distort
the incentives of incumbent politicians, leading to actions that may deter future foreign
investment. Specifically, we find that high levels of natural resource wealth decrease the
incentives for politicians to uphold contracts with private investors, leading to higher levels
of political risks.
We formalize this intuition through a strategic game between foreign investors and do-
mestic governments that relies and very few assumptions. This formalization provides for
a transparent theory and comparative statics that helps us understand the complex pat-
terns of investment and government expropriations across the world. This model illuminates
the changing incentives of governments after an increase in resource rents, and provides an
explanation for the continued investment in some countries despite increases in political risk.
35

Our empirical analysis tests two parts of our model. First, we show through the use of
political risk insurance ratings that countries with larger natural resource endowments have
substantially higher levels of political risk. Second, we show through the use of firm-level
data that host governments partially compensate for these higher levels of political risk by
offering generous tax incentives to firms.
Our theory and empirical analysis leaves open a number of important questions for future
research. First, we do not directly address the credibility of tax incentives offered by host
governments and how this relates to political risk. Ironically, by increasing the tax incentives
offered to foreign firms, this can also increase the incentives of the government to expropriate
investors. For example, a manufacturing firm that is offered 15 years of zero taxes on profits
may provide very few benefits to the host government. Thus, by offering compensation
for the high level of political risk, the government can also be increasing the political risk
for firms. We believe that this is a complex dynamic and may explain why many natural
resource dependent economies, despite the resources to offer generous tax incentives, can not
induce major increases in foreign direct investment.
Second, we ignore how political institutions both shape the incentives of political leaders
and constrain the behavior of incumbent actions. Our model provides broad insights on how
natural resource rents affect the incentives of political leaders. This model can serve as a
starting place to further examine the relationship between resource rents and politics.
Despite these open questions, we believe this project makes an important contribution
in furthering our understanding of the natural resource curse. Our project highlights how
natural resource rents distort the incentives of incumbent governments, leading to less incen-
tive to uphold contracts with private investors. This can help both explain the relationship
between natural resources and lower levels of economic growth, and the direct relationship
between resource rents, politics, and foreign direct investment.
36

A References
.
Alexeev, Michael and Robert Conrad. 2008. The Elusive Curse of Oil. Working Paper.
Alfaro, Laura, Sebnem Kalemli-Ozcan, and Vadym Volovych. 2005. Why doesn’t Capital
Flow from Rich to Poor Countries? An Empirical Investigation. NBER Working Paper
11901.
Auty, Richard A. 2001. Resource Abundance and Economic Development. Oxford:
Oxford University Press.
Beck, T., G. Clarke, A. Groff, P. Keefer, and P. Walsh. 2001. New Tools in Comparative
Political Economy: The Database of Political Institutions. The World Bank Economic
Review 15 (1): 165-176.
Benson, Michelle and Jacek Kugler. 1998. Power Parity, Democracy, and the Severity of
Internal Violence. Journal of Conflict Resolution 42 (2): 196-209.
Berdal, M. and Malone, D.M. (Eds.) 2000. Greed and Grievance. Lynne Rienner,
Boulder and London.
Biglaiser, Geln, Karl DeRouen Jr, and Candace C. Archer. 2007. Lead or Lag? Sovereign
Bond Ratings and Credit Markets in the Developing World. Presented at the Annual Meeting
of the ISA, Chicago, IL, February 27-March 2, 2007.
Blomberg, S. Brock and Ashoka Mody. 2007. How Severely Does Violence Deter Inter-
national Investment. Working Paper.
Bueno de Mesquita, Bruce, Alastair Smith, Randolph M. Siverson, and James D. Morrow.
2004. The Logic of Political Survival. Cambridge: MIT Press.
Collier, P. and A. Hoeffler. 2000. Greed and Grievance in Civil War. World Bank Policy
37

Research Paper 2355.
Collier, P. and A. Hoeffler. 2005. Resource Rents, Governance, and Conflict. Journal of
Conflict Resolution 49 (4): 625-633.
de Soysa Indra, and Eric Neumayer (2007). Resource Wealth and the Risk of Civil
War Onset: Results from a New Dataset on Natural Resource Rents, 1970-99. Conflict
Management and Peace Science 24 (3): 201-218.
Desai, Mihir A., Fritz C. Foley, and James R. Hines Jr. Forthcoming. Capital Structure
with Risky Foreign Investment. Journal of Financial Economics.
Dunning, Thad. 2005. Resource Dependence, Economic Performance, and Political
Stability. Journal of Conflict Resolution 49 (4): 451-482.
Elbadwi, I. and N. Sambanis. 2000. Why are there so many Civil Wars in Africa?
Understanding and Preventing Violent Conflict. Journal of African Economies 9 (3): 244-
269.
Enders, Walter and Todd Sandler. 1996. Terrorism and Foreign Direct Investment in
Spain and Greece. Kyklos 45: 531-554.
Fatehi-Sedeh, Kamal and Hossein M. Safizadeh. 1989. The Association between Political
Instability and Flows of Foreign Direct Investment. Management International Review 29:
4-13.
Fearon, James D. 2003. Ethnic and Cultural Diversity by Country. Journal of Economic
Growth 8 (2): 195-222.
Fearon, James D. 2005. Primary Commodity Exports and Civil War. Journal of Conflict
Resolution 49 (4): 483-507.
Fearon, James. D. and David D. Laitin. 1999. Weak States, Rough Terrain, and Large-
Scale Ethnic Violence Since 1945. Unpublished Manuscript, Stanford University, Stanford,
CA.
38

Fearon, James D. and David D. Laitin. 2003. Ethnicity, Insurgency, and Civil War.
American Political Science Review, 97 (1): 75-90.
Gandhi, Jennifer. Political Institutions under Dictatorship. Cambridge: Cambridge
University Press.
Globerman, Steven and Daniel Shapiro. 2003. Governance Infrastructure and U.S. For-
eign Direct Investment. Journal of International Business Studies 34 (1): 19- 40.
Hansen, Kenneth W. 2005. Tales from the Dark Side: Lessons Learned from Troubled
Investments. In Theodore Moran International Political Risk Management: Looking to the
Future. Washington D.C.: The World Bank 12-29.
Hegre, Hrvard and Nicholas Sambanis. 2006. Sensitivity Analysis of Empirical Results
on Civil War Onset. Journal of Conflict Resolution 50 (4): 508-535.
Heinsz, Witold J. 2002. Politics and International Investment. Cheltenham, UK: Edward
Elgar.
Hirschleifer, J. 1995. Theorizing about Conflict. in Hartley, K. and T. Sandler (eds.) ,
Handbook of Defense Economics, Vol. 1. Amsterdam: Elsevier. pp. 165-192.
Humphreys, Macartan. 2005. Natural Resources, Conflict, and Conflict Resolution:
Uncovering the Mechanisms. Journal of Conflict Resolution 49 (4): 508-537.
Jakobsen, Jo and Indra de Soysa (2006). Do Foreign Investors Punish Democracy?
Theory and Empirics, 1984-2001. Kyklos 59 (3): 383-410.
Jensen, Nathan M. 2003. Democratic Governance and Multinational Corporations: Po-
litical Regimes and Inflows of Foreign Direct Investment. International Organization 57 (3):
587-616.
Jensen, Nathan M. 2006. Nation-States and the Multinational Corporation: Political
Economy of Foreign Direct Investment. Princeton: Princeton University Press.
Jensen, Nathan M. 2008. Political Risk, Democratic Institutions, and Foreign Direct
39

Investment. Journal of Politics.
King, Gary, Michael Tomz, and Jason Wittenberg (2000). Making the Most of Statistical
Analyses: Improving Interpretation and Presentation. American Journal of Political Science
44 (2): 347-61.
Knack, Stephen and Philip Keefer. 1995. Institutions and Economic Peformance: Cross-
Country Tests Using Alternative Measures. Economics and Politics 7: 207-227.
Li, Quan. 2006a. Democracy, Autocracy, and Tax Incentives to Foreign Direct Investors:
A Cross-National Analysis, Journal of Politics 68(1): 62-74.
Li, Quan. 2006b. Political Violence and Foreign Direct Investment. in Research in
Global Strategic Management, Volume 12, Regional Economic Integration, pages 231-255,
edited by Michele Fratianni and Alan M. Rugman. Elsevier Ltd.
Li, Quan. Forthcoming. Democracy, Autocracy, and Expropriation of Foreign Direct
Investment. Comparative Political Studies.
Li, Quan and Adam Resnick. 2003. Reversal of Fortunes: Democratic Institutions and
Foreign Direct Investment Inflows to Developing Countries. International Organization 57
(1): 175-212.
Loree, David W., and Stephen Guisinger. 1995. Policy and Non-Policy Determinants
of U.S. Equity Foreign Direct Investment. Journal of Business Studies 26: 281-99. Lu-
cas, Robert E. 1990. Why Doesn’t Capital Flow from Rick to Poor Countries? American
Economic Review 80: 92-96.
Lujala, Pivi, Nils Petter Gleditsch and Elisabeth Gilmore. 2005. A Diamond Curse?:
Civil War and a Lootable Resource. Journal of Conflict Resolution 49 (4): 538-562.
Mahdavy, Hussein. 1970. The Patterns and Problems of Economic Development in
Rentier States: The Case of Iran. In M.A. Cook, ed, Studies in Economic History of the
Middle East (London: Oxford University Press, 1970), 428.
40

Marshall, Monty and Keith Jaggars. 2006. Polity IV Project. http://www.cidcm.umd.edu/polity/
Nigh, Douglas. 1985. The Effect of Political Events on United States Direct Foreign In-
vestment: A Pooled Time-Series-Cross-Sectional Analysis. Journal of International Business
Studies 16 (1): 1-17.
O’Sullivan, Robert C. 2005. Learning from OPIC’s Experience with Claims and Arbitra-
tion. In Theodore Moran International Political Risk Management: Looking to the Future.
Washington D.C.: The World Bank 30-74.
Overseas Private Investment Corporation. 2005. OPIC Annual Report. New York:
Overseas Privative Investment Corporation.
Reynal-Querrol, M. 2002. Ethnicity, Political Systems and Civil War. Journal of Con-
flictResolution 46 (1): 29-54.
Robinson, James A, Ragnar Torvik, and Thierry Verdier. 2006. Political Foundations of
the Resource Curse. Journal of Development Economics. 79: 447-468.
Ross, Michael. 1999. The Political Economy of the Resource Curse. World Politics 51
(2):
Ross, Michael. 2001. Does Oil Hinder Democracy? World Politics 53 (): .
Ross, Michael. 2006. A Closer Look at Oil, Diamonds, and Civil War. Annual Review
of Political Science 9: 265-300.
Rosser, Andrew. 2006. The Political Economy of the Resource Curse: A Literature
Survey. IDS Working Paper 268.
Sachs, Jeffrey D. and Andrew Warner. 1995. Natural Resource Abundance and Economic
Growth. Harvard Institute for International Development, Development Discussion Paper
No. 517.
Sachs, Jeffrey D. and Andrew Warner. 1999. The Big Push, Natural Resource Booms
and Growth. Journal of Development Economics 59, 43-76.
41

Sambanis, N. 2002. A Review of the Recent Advances and Future Directions in the
Quantitative Literature on Civil War. Defense and Peace Economics 13 (3): 215- 243.
Sethi, Deepack, S.E. Guisinger, S.E. Phelan, and D.M. Berg. 2003. Trends in foreign di-
rect investment flows: a theoretical and empirical analysis. Journal of International Business
Studies 34: 315-26.
Smith, Alastair. 2008. The Perils of Unearned Income. Journal of Politics 70 (3): 780-
793..
Snyder, Richard and Ravi Bhavnani. 2005. Diamonds, Blood, and Taxes: A Revenue-
Centered Framework for Explaining Political Order. Journal of Conflict Resolution 49 (4):
563-597.
Tomz, Michael. 2007. Reputation and International Cooperation: Sovereign Debt across
Three Centuries. Princeton: Princeton University Press.
Tomz, Michael, Jason Wittenberg, and Gary King. 2003. CLARIFY: Software for Inter-
preting and Presenting Statistical Results. Version 2.1. Stanford University, University of
Wisconsin, and Harvard University. January 5. Available at http://gking.harvard.edu/
UNCTAD. 2005. World Investment Report: Transnational Corporations and the Inter-
nationalization of R&D. United Nations.
Wantchekon, Leonard. 2004. The Paradox of ’Warlord’ Democracy: A Theoretical
Investigation. American Political Science Review 98:17-33
Weinstein, Jeremy M. 2005. Resources and the Information Problem in Rebel Recruit-
ment. Journal of Conflict Resolution 49 (4): 598-624.
West, Gerald T. and Kristofer Hamel. 2005. Whither the Political Risk Insurance Indus-
try? In Theodore Moran International Political Risk Management: Looking to the Future.
Washington D.C.: The World Bank 206-230.
Wright, Joseph. 2008. Do Authoritarian Political Institutions Constrain? How Legis-
42

latures Affect Economic Growth and Investment. American Journal of Political Science 52
(2).
43

A Appendix
Note.
Proofs of Section 4.1.
Proofs of Section 4.2.
Proofs of Section 4.3.
Proofs of Section 4.4.
44