Political Parties, Income Inequality and Public Policy – 1A
220
Political Parties, Income Inequality and Public Policy – 1A DON’T WRITE DOWN ANY OF THE MATERIAL OVER THE NEXT 220 SLIDES . ALL OF IT IS IN THE COURSEPACK. JUST LISTEN TO THE DISCUSSION!
-
Upload
cruz-young -
Category
Documents
-
view
21 -
download
1
description
Political Parties, Income Inequality and Public Policy – 1A. DON’T WRITE DOWN ANY OF THE MATERIAL OVER THE NEXT 220 SLIDES . ALL OF IT IS IN THE COURSEPACK. JUST LISTEN TO THE DISCUSSION!. Political Parties, Income Inequality and Public Policy – 1B. I. Policy Orientation of This Discussion - PowerPoint PPT Presentation
Transcript of Political Parties, Income Inequality and Public Policy – 1A

Political Parties, Income Inequality and Public Policy – 1A
DON’T WRITE DOWN ANY OF THE MATERIAL OVER THE NEXT 220 SLIDES. ALL OF IT IS IN THE COURSEPACK. JUST LISTEN TO THE DISCUSSION!

Political Parties, Income Inequality and Public Policy – 1B
I. Policy Orientation of This Discussion
A. Since the U.S. has the weakest social safety net and highest level of income inequality of any wealthy democracy the obvious comparison is to the other wealthy democracy that have stronger social safety nets and less income inequality than we do.

Political Parties, Income Inequality and Public Policy – 1C
B. I know that isn’t “comforting.” We naturally want to think of our nation as “best” on all criteria. Realistically, this is impossible. A nation that has the lowest taxes won’t have the least inequality. The United States ranks high on some social programs (e.g., higher education) but not on income security and reducing inequality.

Political Parties, Income Inequality and Public Policy – 1D
C. If I were teaching this class in a nation with a very strong social safety net and much less income inequality (e.g., Sweden), I would compare it to nations that have less strong social safety nets and greater income inequality (e.g., Canada and Great Britain with moderately strong social safety nets and the U.S. with a very social safety net).

Political Parties, Income Inequality and Public Policy – 1E
D. Therefore, while I will touch on proposals to weaken the U.S. safety net, the vast bulk of the discussion ahead will focus on what other wealthy democracies do to reduce income equality, how well these policies work and what the U.S. could do in this regard while still preserving our freedoms and improving our political system.

Political Parties, Income Inequality and Public Policy – 2
I. Incentives of the Two Major Political Parties
A. Unemployment has a large impact which disproportionately falls on low and middle-income voters.
1. Nonmonetary costs of unemployment
Political Parties, Income Inequality and Public Policy – 3
B. The poorest 80% of American households are relatively unaffected by inflation. However, inflation has a greater adverse impact on the richest 20% of American households.
Political Parties, Income Inequality and Public Policy – 4
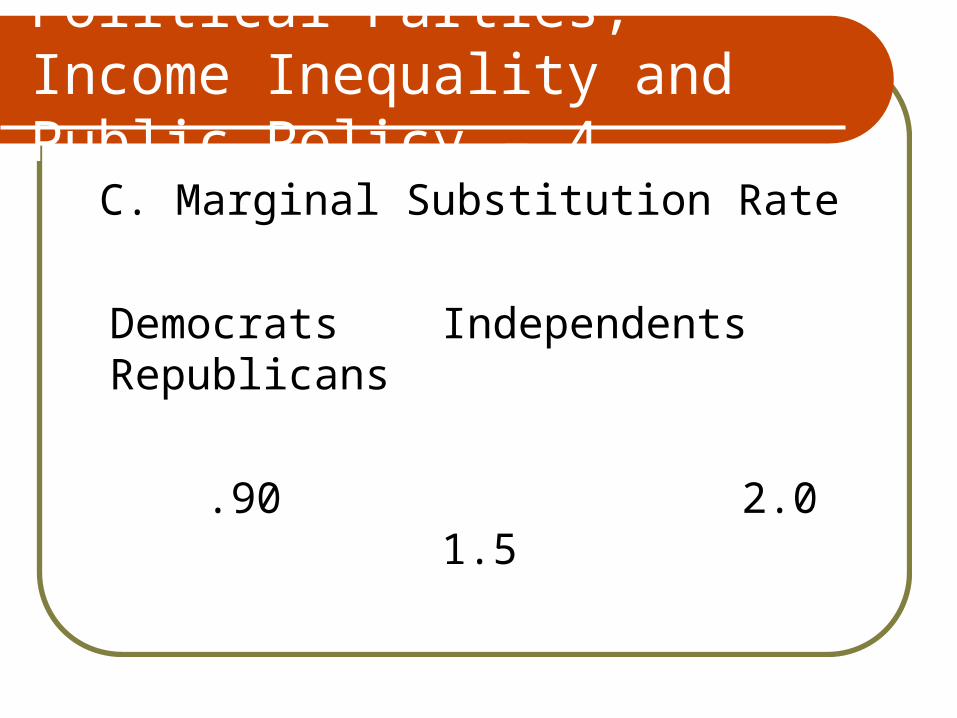
C. Marginal Substitution Rate
Democrats Independents Republicans
.90 2.0 1.5

Macroeconomic Theory - 1
I. Macroeconomic Theory
A. Neoclassical
1. The free market was assumed to yield full employment (i.e.,
no/low unemployment) and to grow without limitation and to correct any imbalances that might develop

Macroeconomic Theory - 2
2. Since the higher one’s income the greater the percentage of their income they save/invest and the smaller percentage of their income they spend, the greater the share of income the rich possessed the greater the investment, and hence, economic innovation/growth.

Macroeconomic Theory - 3
3. By this view, a major goal of macroeconomic policy was to keep the costs of production low (e.g., low wages – through the absence of labor unions, a low minimum wage, low taxes, little government regulation of business, etc.) in order to increase profits and investment.
4. Couldn’t explain the Great Depression

Macroeconomic Theory - 4
B. Keynesianism
1. If the non-rich lacked sufficient money to purchase goods, the economy would not reach its’
full potential because businessmen would not open new business,
or expand current ones, if they felt they could not sell the resulting products or services.
Macroeconomic Theory - 5
2. This meant that middle and lower-income groups, who spend a greater share of their income than upper income groups, need to have a significant share of the national income (through a minimum wage, labor unions, etc.).

Macroeconomic Theory - 6
3. If economic demand was insufficient, Keynes argued that the government should increase its’ spending and be willing to run large deficits (i.e., spend more money than it receives in taxes).
4. If both inflation and unemployment are high (late 1970s & early 1980s) –
trouble.

Macroeconomic Theory – 7A
C. The aforementioned difficulties of Keynesian economics, plus the renewed political strength of a Republican Party whose ideology was similar to neoclassical economics, resulted in a rebirth of neoclassical economics under several different names.

Macroeconomic Theory – 7B
D. Corporate profits were 25% to 30% higher at the official end of the Great Recession than they were before it started (2007). Meanwhile, wages as a share of national income fell to 58%. That’s the lowest wage share had been since it began to be recorded after World War II.

Macroeconomic Theory – 7C
If wages were at their postwar (World War II) average of 63%, U.S. workers would earn an extra $740 (billion) this year (2012) or about $5,000 per worker. That’s a lot of consuming power.”

Macroeconomic Theory - 8
D. Supply-Side Economics - Ronald Reagan 1981 & Newt Gingrich 2012
1. Like Neoclassical Economics – much more concerned with reducing impediments to supply (high labor costs, taxes and regulations) than in stimulating demand.

Macroeconomic Theory - 9
2. Tax Cuts DON’T pay for themselves.
3. Gregory Mankiw – supply-side
economics devised by “charlatans and cranks”
E. Relationship between the philosophy/self-interest of both major political parties and the economic theory they use.

Political Parties, Income Inequality and Public Policy – 5
D. Recent research by political scientists shows that all income groups up through the 95th percentile (i.e., all but the richest 5% of households – today those earning about $200,000, or less, per year) gain under the Democrats relative to the Republicans. However, the poor gain at a greater rate under the Democrats.

Political Parties, Income Inequality and Public Policy – 6
E. Our Current Situation
1. Tremendous loss of consumer demand due to the collapse of real estate
2. Government needs to replace this lost demand – i.e., NOT cutback
Political Parties, Income Inequality and Public Policy – 7
3. 300 billion dollars of stimulus will reduce the unemployment rate by 1%. The Obama Stimulus Plan was approximately 775
billion dollars spread over two years. Given the composition of the Obama Stimulus Plan (e.g., tax cuts – which have low stimulative value) it is equivalent to about 510 billion dollars of stimulus rather than 775 billion dollars.

Political Parties, Income Inequality and Public Policy – 8
This means that, due to the Obama Stimulus Plan, the unemployment rate, while high, is about 1.7 percentage points lower that it would have been without the plan (510/300 = 1.7).

Political Parties, Income Inequality and Public Policy – 9
4. Many economists think that the federal government needs to do two things to improve the economy: (1) provide a larger stimulus than the Obama Stimulus Plan; and (2) more strongly regulate the financial markets (to avoid the bad loans that precipitated our current problems). This is difficult for the Republican Party: their ideology conceives of government as “the problem,” not “the solution.”

Political Parties, Income Inequality and Public Policy – 10
Income Inequality in Wealthy Democracies
in the Mid-1980s – Percentage Distribution
Japan Sweden U.S.
Richest
20% 37.5% 41.7% 42.0%
Poorest
20% 8.7% 7.4% 5.0%
2009 >>> 3.9%

Political Parties, Income Inequality and Public Policy: 11A
Richest Richest Richest
Year 10% 1% ½ of 1%
1920 39.0% 14.8% 11.1%
1970 32.6% 9.0% 6.3%
2008 48.2% 21.0% 16.9%
SHARES FOR THE RICHEST 1% AND ½ OF 1% ARE ABOUT TWICE AS HIGH AS IN EUROPE

Political Parties, Income Inequality and Public Policy: 11B
U.C. Berkeley Economist Emmanuel Saez’s comments on the reasons for increase income inequality in the U.S.:
“…The changes in income concentration are just too abrupt and too closely correlated with policy developments for the standard story about pay equaling productivity to hold everywhere.

Political Parties, Income Inequality and Public Policy: 11C
Between 1971 and 2007, U.S. hourly wages, adjusted for inflation, rose by 4%. (That’s not 4% a year; it’s 4% over 36 years!) during those same decades, productivity increased by 99% - that is, it nearly doubled. In other words, the average worker’s productivity rose 25 times more than his pay. Los Angeles Times, May 14, 2013, page A11).
That is, if pay is equal to productivity, you would think that deep economic changes in skills would evolve slowly and make a gradual difference in the distribution—but what we see in the data are very abrupt changes. Basically all western countries had very high levels of income concentration up to the first decades of the 20th century
Political Parties, Income Inequality and Public Policy: 11D

Political Parties, Income Inequality and Public Policy: 11E
and then income concentration fell dramatically in most western countries following the historical narrative of each country. For example, in the United States the Great Depression followed by the New Deal and then World War II. And I could go on with other countries.

Political Parties, Income Inequality and Public Policy: 11F
Symmetrically, the reversal—that is, the surge in income concentration in some but not all countries—follows political developments closely. You see the highest increases in income concentration in countries such as the United States and the United Kingdom (Great Britain),

Political Parties, Income Inequality and Public Policy: 11G
following precisely what has been called the Reagan (Republican President from 1981-1988) and Thatcher (Conservative Party Prime Minister of Great Britain from 1979-1990) revolutions: deregulation, cuts in top tax rates, and policy changes that favored upper-income brackets.

Political Parties, Income Inequality and Public Policy: 11H
You don’t see nearly as much of an increase in income concentration in countries such as Japan, Germany, or France, which haven’t gone through such sharp, drastic policy changes.

Political Parties, Income Inequality and Public Policy: 11I
Apportioning the 12 percentage Increase in the Share of Income Going to the Top 1% - 1976-2008 (8.9% to 20.9%)
Tax Reductions – 45%
Political Polarization – 28%
Unexplained - 26%
Conservative tax changes and the increased conservatism of the Republican Party have had a large impact on inequality.
Political Parties, Income Inequality and Public Policy – 12
If you include government transfers and subtract taxes from 1979 to 2006, the richest 1% of households had a 256% increase income while middle-income households (40th-60th percentiles) had a 21% increase and low-income households (1st-20th percentiles) only an 11% increase. In the United States today, the richest 1% of households have over 1.5 times as much income as the entire poorest 40% of households combined.

Changes in California - 1
In California, between 1987 and 2009, more than 33% of the income gains went to the richest 1% of Californians, and almost 75% went to the richest 10% while the bottom 90% received just over 25% of the growth in incomes. During the last two decades, the average income of the richest 1% of Californians increased by more than 50%,

Changes in California - 2
after adjusting for inflation, while the average income of the middle fifth (i.e., the 40th – 60th percentiles) decreased by 15%. In 2009, the average income of the richest 1% of Californians was $1.2 million – more than 30 times that of Californians in the middle fifth. California’s income gap is wider than most other states.

Political Parties, Income Inequality and Public Policy – 13
Americans in the poorest 10% had a living standard 22% below low-income Finns, 24% below low- income Dutch and 15% below low-income Italians. However, the wealthiest 10% of Americans had incomes 50% higher than the wealthiest 10% in the other OECD nations (Great Britain, France, Canada, Japan, Australia and New Zealand).
Political Parties, Income Inequality and Public Policy -14
One fundamental reason the poor in the U.S. have a lower standard of living than in several other nations is that, after taxes, the U.S. transfers only about one-third the percentage of income to the poorest 20% of households (1.5%) as does the average (4.2%) of the world’s wealthy democracies.

Analysis from the World Bank Publication, “Social Safety Nets and Target Assistance: Lessons from the European Experience,” Chris de Neubourg, et. al.
While the average American has a higher living standard than the average resident in the other countries, this does not hold for the entire spectrum of the income distribution. Despite the higher aggregate and average standard of living in the United States, people in the lower deciles of the income distribution are far worse off in US than poorer persons or households in Europe, if compared to the median income of their own country. (p. 5)
Political Parties, Income Inequality and Public Policy – 15
The median Swedish family has a living standard roughly comparable with that of the median U.S. family: wages are, if anything, higher in Sweden, and a higher tax burden is offset by public provision of health care and generally better public services. As you move further down the income distribution, Swedish living standards are much higher than in the U.S.: at the 10th percentile (poorer than 90% of the population) the Swedish living standard is 60% higher than in the U.S.

Political Parties, Income Inequality and Public Policy – 16
In this light it is worth noting that approximately 38% of the benefits from the Bush Tax Cuts go to the richest 1% of the households (i.e., the same households who have been receiving a much higher share of personal income over the past 40 years). The richest 1% of U.S. households receive more money from the Bush Tax Cuts than the entire poorest 70% of U.S. households combined (roughly households with annual incomes of about $90,000 or less).
Political Parties, Income Inequality and Public Policy – 17
Wealth is a storehouse of assets: trusts, stocks, bonds, etc. whereas income is what you live on over a short period – say, a year. As the following statistics will make clear: Wealth is even more unequally distributed than income. In the United States the wealthiest 1% of households have over 33% of the national wealth while the poorest 50% of households have approximately 7% of the national wealth.

Political Parties, Income Inequality and Public Policy – 18
A rather large amount of research tells us the following: (1) Americans vastly overestimate their chances of becoming rich; (2) vastly underestimate the degree of income inequality (i.e., do not think the wealthy are as wealthy as the actually are); and (3) have a difficult time connecting public policy to economic outcomes (e.g., not that many see the Bush Tax Cuts as a tremendous redistribution to the wealthy).

Political Parties, Income Inequality and Public Policy – 19
Currently, wealth in America is distributed as follows: the richest 20% of households (percentiles 81-100) have approximately 84% of the wealth, the next richest 20% (i.e., percentiles 61-80) have approximately 11%, the middle quintile (i.e., percentiles 41-60) have approximately 4%, the next poorest 20% (i.e., percentiles 21-40) have approximately .2% (two tenths of 1%) and the poorest quintile (i.e., percentiles 1-20) have approximately .1% (one tenth of 1%).

Political Parties, Income Inequality and Public Policy – 20
Americans do desire a less unequal distribution of wealth. Recently, two scholars tried an interesting experiment.
Not being told what nations had what distribution of wealth, Americans were offered three choices: (1) the current American distribution of wealth;

Political Parties, Income Inequality and Public Policy – 21
(2) perfect equality (i.e., each quintile getting an equal – 20% - share of the wealth); or (3) the current Swedish distribution of wealth (the richest 20% of households approximately 36% of the wealth, the next richest 20% approximately 21% of the wealth, the middle quintile approximately 18% of the wealth, the next poorest 20% approximately 15% of the wealth and the poorest quintile approximately 11% of the wealth).

Political Parties, Income Inequality and Public Policy – 22
The results were as follows: 47% chose Sweden’s distribution, 43% chose perfect equality while only 10% chose the current American distribution. Additionally, American’s are less satisfied with their lives than citizens in a number of European countries that have less per capita income, but much stronger safety nets/less income inequality than the U.S.

Political Parties, Income Inequality and Public Policy–22A
I.How Should We Measure “Well-Being”?
A. If someone spends $1,000 on diabetes medicine it counts as part of GDP. However, wouldn’t the same person have a better life if they didn’t have diabetes but spent $750 on a computer? Since $1,000 is greater than $750, in this example GDP would be higher for diabetes oriented spending than for buying a computer.

Political Parties, Income Inequality and Public Policy–22B
B. GDP (Gross Domestic Product) only measures the monetary value of the economy. It tells nothing about how the money is used or any non-monetary value (national health, the functioning of the political system, job security and measures of community well-being).

Political Parties, Income Inequality and Public Policy–22C
C. Typically, on such indicators, the United States ranks lower than the high tax and strong welfare state countries of Northern Europe (e.g., Norway, Sweden, Denmark, Finland, and the Netherlands).

Political Parties, Income Inequality and Public Policy – 23
Mobility is NOT that high in the U.S.
If you compare the eventual income of two children from different families, on average, the child from the richer family receives an annual income that is higher than the child from the poorer family by approximately 30%-40% of the difference in the incomes of their parents.
Political Parties, Income Inequality and Public Policy – 24
A child from a family that made $100,000 per year would, on average, out earn a child from a family that made $25,000 by approximately $25,000 per year (the difference in their parents incomes was $75,000 – i.e., $100,000 - $25,000 = $75,000; 33% of $75,000 = $25,000). Thus, if later in life the child of the poorer family was earning $25,000 per year and the child of the richer family was earning $50,000 per year, you could say that the difference was entirely due to background.

Political Parties, Income Inequality and Public Policy – 25
Put another way: children born into the poorest 20% of households have approximately a 42% chance of ending up in the poorest 20% themselves, a 24% chance of ending up in the next poorest 20% and only a 6% chance of ending up in the richest 20%.

Political Parties, Income Inequality and Public Policy – 26
Father’s and Son’s incomes in the U.S. correlate at about .43 (correlation ranges from 0 to 1.0 so this is a moderate correlation), and is higher in the U.S.
(i.e., less mobility) than in Sweden, Norway, Finland, France, Spain, Germany, and Canada.
Political Parties, Income Inequality and Public Policy – 27
The Bush Tax Cuts reveal a very pertinent fact about economic policy: there is often a great difference between programs that help the non-wealthy acquire wealth versus policies that protect the wealth of those who already have it. What is good for one group is not necessarily good, and often harmful, for the other group. Approximately 75% of American household lose under the Bush Tax Cuts.

Political Parties, Income Inequality and Public Policy – 28
Consider how the Bush Tax Cuts affect mobility from low to high-income groups. First, by repealing the estate tax and reducing other taxes on high-income individuals, the Bush Tax Cuts give the wealthy more wealth to leave their heirs. Obviously, this makes it more difficult for most of you to try to amass more wealth than the heirs of the currently very wealthy due to the fact these heirs will be given such a tremendous head start on you.

Political Parties, Income Inequality and Public Policy – 29
Second, by reducing the revenue of the federal government, the Bush Tax Cuts will all but require reductions in programs that help low and middle-income people ascend the economic ladder (e.g., the Pell Grant Program for poor college students, health care for the poor, job training, public transportation, etc.).

Political Parties, Income Inequality and Public Policy – 30
The Bush Tax Cuts are one of the very least effective, and most costly, methods of stimulating the economy and, ultimately, reducing unemployment. As economic research indicates: lower-income households spend a higher percentage of each additional dollar they receive than higher-income households.

Political Parties, Income Inequality and Public Policy – 31
For example, a household with a $40,000 annual income will spend a higher percentage of each additional dollar it receives than a household with a $200,000 annual income. This is because lower-income households have greater unmet needs than higher-income households (e.g., replacing a worn out car).
Political Parties, Income Inequality and Public Policy – 32
By showering more money on the richest 1% of households (i.e., households with incomes above $370,000) than on the entire poorest 70% of households combined, the Bush Tax Cuts place the most money in the hands of those least likely to spend it. Contrast this with the items on the next slide – favored by Democrats.

Political Parties, Income Inequality and Public Policy – 33
The following indicates how much additional economic activity occurs per dollar spent: extending unemployment compensation - $1.60; payroll tax reduction - $1.09; and extending the Bush Tax Cuts - $.35 (i.e. for each dollar given to tax payers through the Bush Tax Cuts, we only receive 35 cents of additional economic activity – only a fourth as much per dollar spent as on unemployment compensation – i.e., $.35 is about ¼ of $1.60).

Political Parties, Income Inequality and Public Policy – 34
Since all income groups will save some percentage of the money they receive (i.e., lower-income households will save some money, just not as a great percentage as higher-income households), having the government directly spend money is more stimulative than tax cuts.
Political Parties, Income Inequality and Public Policy – 35
If the government both taxes and spends a large share of the economy won’t we end up with more equal slices of a smaller pie (or a pie that isn’t growing as fast as it otherwise would)? While this is an important point, the evidence in favor of it is NOT compelling.
Political Parties, Income Inequality and Public Policy – 36
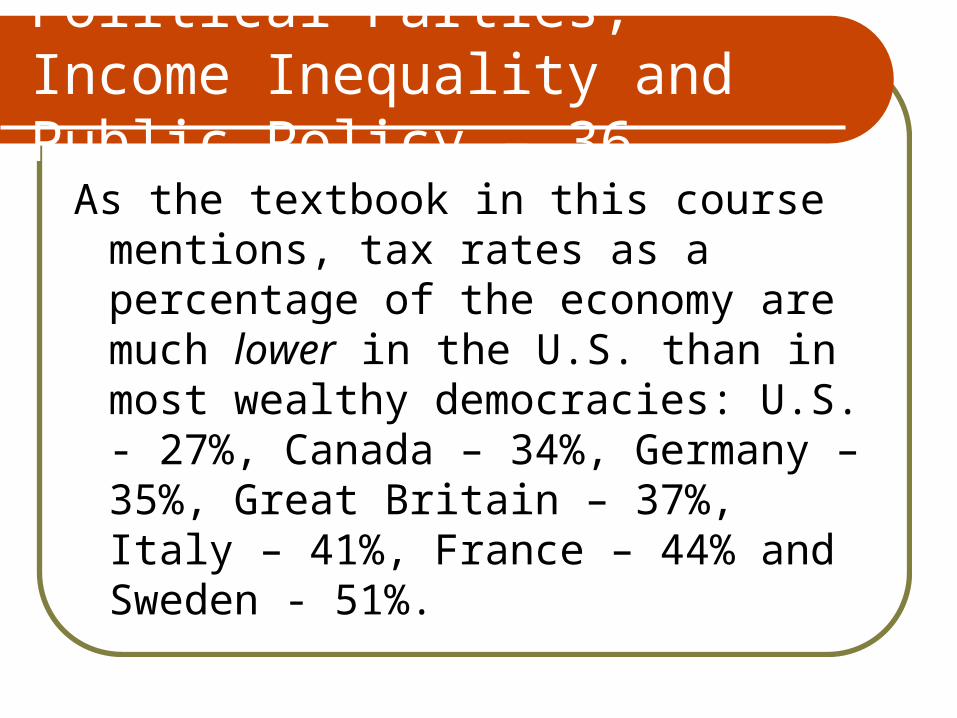
As the textbook in this course mentions, tax rates as a percentage of the economy are much lower in the U.S. than in most wealthy democracies: U.S. - 27%, Canada – 34%, Germany – 35%, Great Britain – 37%, Italy – 41%, France – 44% and Sweden - 51%.

Political Parties, Income Inequality and Public Policy – 37
From 1990-2005 per capita (i.e., per person - to adjust for differences in population size between nations) growth rates were as follows: U.S. - 85%, Netherlands – 86%, Norway – 134%, France – 60%, Australia – 91%, Canada – 69%, Denmark – 80%, United Kingdom – 111%. Since 1980, per capita real G.D.P. (Gross Domestic Product) – which is what matters most for living standards - has risen at about the same rate in America and in the E.U.(U.S. - 1.95%, E.U. - 1.83%).

Political Parties, Income Inequality and Public Policy – 38
As economist Peter Lindert of the University of California at Davis put it, “No matter how you torture the data, there is no negative relationship between a commitment to the welfare state and the growth rate in how well off we are.” While taxes may reduce the willingness of some to work as hard, many of the purposes for which tax dollars are spent (e.g., education, infrastructure, etc.) increase the growth rate. One of the reasons the Nordic countries (Norway, Sweden, Denmark and Finland) spend about TWICE the percentage of GDP (3%-4%) on research and development as the U.S.

Political Parties, Income Inequality and Public Policy – 39
In light of the Obama Health Care Plan, let me mention the following: EVERY nation in the world rations health care. For example, would you pay an additional $200 per month for health care in order to prolong the life of terminally ill patients an average of 3 months? If “yes,” how about $400 per month? Once you say “no” (i.e., refuse to pay), you are rationing health care.

Political Parties, Income Inequality and Public Policy – 40
Let me offer the following question: Would you prefer to have a government panel – typically headed by physicians – make the necessary rationing decisions or would you rather have a for-profit insurance company make them? That’s the choice we actually have.

Political Parties, Income Inequality and Public Policy – 41
Government policies do have important affects on the rationing decisions that all health care systems must make. For example, cigarette taxes reduce cigarette smoking. Economists have found that a 10% increase in the cost of cigarettes reduces smoking by about 3%-4%. Thus, cigarette taxes reduce the amount of smoking which, in turn, reduces the onset of a large number of adverse health consequences (e.g., cancer, heart attack, stroke, etc.).

Political Parties, Income Inequality and Public Policy – 42
Many of those who claim the Obama Health Care Plan will lead to government rationing of health care to the elderly are the same individuals/groups who oppose government regulations (e.g., soda taxes, meat taxes, restaurant menu labeling requiring disclosure of calories, fat, sodium, etc.) which would greatly reduce adverse health consequences (e.g., obesity) which, in turn, would leave more money for the health care needs of senior citizens.

Political Parties, Income Inequality and Public Policy – 43
Broad-based government programs, such as Medicare (a government health care program for senior citizens), have two big cost saving advantages over a completely free market social insurance system: (1) compulsion – i.e., requiring everyone to buy health insurance lowers the cost because the cost of the “expensive” individuals (e.g., those likely to be ill) is spread over a large group (e.g., the healthy) and;

Political Parties, Income Inequality and Public Policy – 44
(2) administrative cost (e.g., the typical private health insurer spends about 10% of its outlays on administrative costs, weeding out sick people, etc. whereas the government run Medicare program spends between 2%-3% of its budget on administrative costs).

Political Parties, Income Inequality and Public Policy – 45
The preceding are two of the major reasons why the #1 ranked (by the World Health Organization) French health care system spends only a little more than half as much money per person as the 37th ranked U.S. health care system (France - $4,690, U.S. - $8,895).

Political Parties, Income Inequality and Public Policy – 46
Government run programs such as Medicare aren’t the same as government ownership of productive assets. Medicare doesn’t own hospitals or employ doctors, it contracts with privately owned hospitals and private physicians.

Political Parties, Income Inequality and Public Policy – 47
I should also mention that government programs such as Medicare and Medicaid (a government run health care program for the poor) currently pay substantially more of our nation’s health care costs (approximately 47%) than private insurance (approximately 35%).
Thus, we can’t “get the government out of health care.”

Political Parties, Income Inequality and Public Policy – 48
It should also be mentioned that the democracies of Western Europe are, in the main, NOT socialist nations. Socialism means that the government owns the modes of production and distribution. For example, socialism in the U.S. would mean that the government would own the major fast food outlets (e.g., McDonalds, Wendy’s etc.).

Political Parties, Income Inequality and Public Policy – 49
Considerations about the size of government on personal freedom are complicated. Equating the size of government with personal freedom often involves equating private property with personal freedom. This is difficult.

Political Parties, Income Inequality and Public Policy – 50
For example, would most Californians have more freedom if the beaches were sold to private individuals or if the State of California operates them? Additionally, if state taxes were reduced taxpayers would have a greater freedom of choice in spending their money.

Political Parties, Income Inequality and Public Policy – 51
However, if these state tax cuts resulted in higher fees for U.C. and CSU students fewer students would attend college. Not attending college would reduce both the future incomes and occupational choices of the individuals who did not attend college due to the budget reductions resulting from the state tax cuts. In short, it would reduce their future freedom. So, would such a state tax cut result in a “net” gain or loss in freedom?

Political Parties, Income Inequality and Public Policy – 52
A relatively small loss in freedom for a large group of people (requiring each person to purchase health insurance) will provide a much larger amount of freedom (to make all the decisions living people can make) for a smaller group of people (the unhealthy). If so, has the amount of freedom either increased or decreased? It’s not so easy to answer! You would have to balance the loss of many small amounts of freedom against a fewer large gains in freedom.

Political Parties, Income Inequality and Public Policy – 53
People in the democracies of Western Europe are typically as “free” as Americans. For example, free speech in Great Britain is as great as it is in the United States. Additionally, some Western European nations actually have higher scores on some measures of democracy than the United States. Typically, this occurs because of lower voter turnout and fewer major political parties in the United States.
Political Parties, Income Inequality and Public Policy – 54
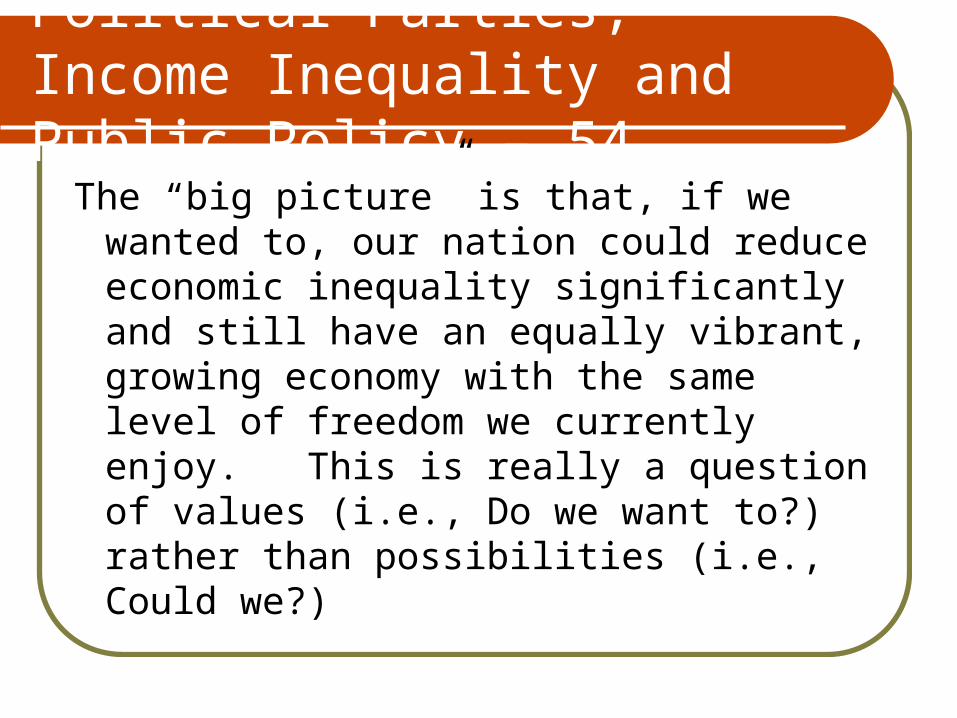
The “big picture” is that, if we wanted to, our nation could reduce economic inequality significantly and still have an equally vibrant, growing economy with the same level of freedom we currently enjoy. This is really a question of values (i.e., Do we want to?) rather than possibilities (i.e., Could we?)
Political Parties, Income Inequality and Public Policy–55A
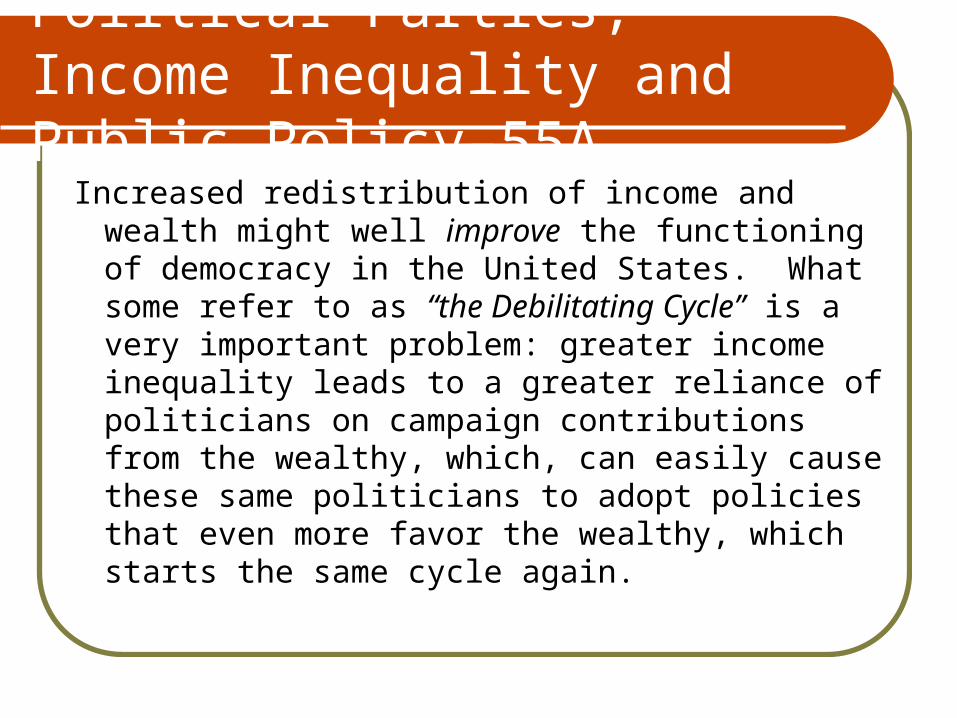
Increased redistribution of income and wealth might well improve the functioning of democracy in the United States. What some refer to as “the Debilitating Cycle” is a very important problem: greater income inequality leads to a greater reliance of politicians on campaign contributions from the wealthy, which, can easily cause these same politicians to adopt policies that even more favor the wealthy, which starts the same cycle again.
Political Parties, Income Inequality and Public Policy–55B
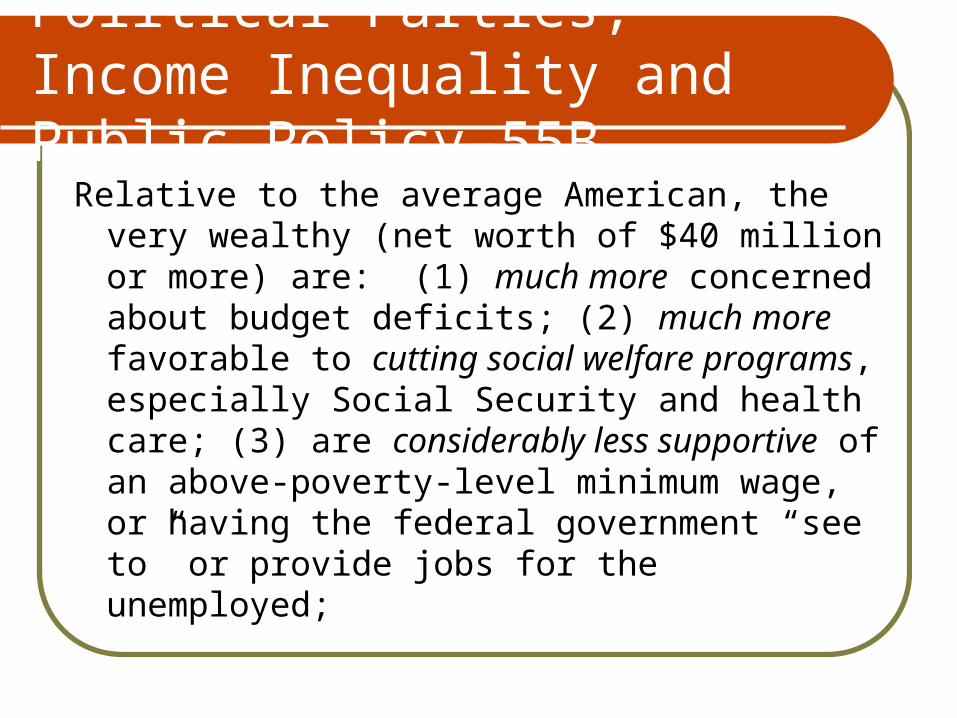
Relative to the average American, the very wealthy (net worth of $40 million or more) are: (1) much more concerned about budget deficits; (2) much more favorable to cutting social welfare programs, especially Social Security and health care; (3) are considerably less supportive of an above-poverty-level minimum wage, or having the federal government “see to” or provide jobs for the unemployed;
Political Parties, Income Inequality and Public Policy–55C
(4) much less supportive of providing broad educational opportunities; (5) much less willing to redistributive income to those poorer than themselves; (6) less willing to raise taxes on high income groups (e.g., less supportive of having an estate tax); and (7) are less willing to regulate either the stock market or businesses.

Political Parties, Income Inequality and Public Policy – 56
Proposals of the Political PartiesPresident George W. Bush proposed a series of
policies to deal with our nation’s economic future that were collectively referred to as “The Ownership Society.” The idea is that each individual citizen would “own” items that had previously been provided by the government. For example, if each individual citizen can choose how to invest their money in a personal Social Security Account you could say that person “owned” their retirement.

Political Parties, Income Inequality and Public Policy – 57
Let’s see how “The Ownership Society” would have changed American health care policy and the degree of health care security American’s have. Former President George W. Bush did not favor requiring all Americans to purchase health insurance. He did favor
(and at his urging Congress did pass) legislation setting up Health Savings Accounts in 2003.

Political Parties, Income Inequality and Public Policy – 58
In 2008, an individual could contribute up to $2,400 per year to such an account ($5,800 for a family). The gains from this investment are not taxed and the money could be withdrawn to pay the deductable under a health insurance policy. This is a tax free method of investing for those fortunate enough to have the money to participate. Not surprisingly, those most likely to contribute to Health Savings Accounts are much richer than average.

Political Parties, Income Inequality and Public Policy – 59
Look at the relationships between wealth/education and health: (1) more well-educated and higher-income individuals are more likely to value delayed gratification – i.e., foregoing something today for a greater future gain - in this case eating healthier food, maintaining a healthier weight, not smoking, etc. than less well-educated and lower-income individuals; thus,

Political Parties, Income Inequality and Public Policy – 60
(2) more well-educated and higher-income individuals are less likely to need medical attention than less well-educated and lower-income individuals; and (3) more well-educated and higher-income individuals are more likely to contribute to Health Savings Accounts than less well-educated and lower-income individuals.

Political Parties, Income Inequality and Public Policy – 61
By not requiring people to buy insurance and by allowing people to put money into Health Savings Accounts, higher-income people, who are typically more healthy, are able to remove money that would’ve gone into an insurance pool from which the unhealthy could benefit. Thus, the practical effect of Health Savings Accounts is to reduce the ability to spread medical costs over a larger, healthier, population.
Political Parties, Income Inequality and Public Policy – 62
Withdrawing money that a healthier population would have put into an insurance pool and, instead, placing it in the hands of higher-income households means that the costs of health insurance to the less healthy population, disproportionately drawn from middle and low-income households, will increase. All of this works to the advantage of higher- income individuals.
Political Parties, Income Inequality and Public Policy – 63
The Ownership Society proposal for education (another tax-free savings plan) has a similar effect to the Health Savings Accounts. Here’s why: (1) higher-income individuals are much more likely to have the necessary money to put into such an account; (2) citizens are more likely to vote in favor of increased taxes for education when they have children in the public education system; and

Political Parties, Income Inequality and Public Policy – 64
(3) the money from an Educational Savings Account will either allow more students to afford a private college and/or reduce their need for more funding for state run colleges. For example, the money from the account means they are less likely to need financial aid than other students. Points 1-3 mean that the educational “gap” between students from lower and higher-income households will increase.

Political Parties, Income Inequality and Public Policy – 65
Republican Congressman Paul Ryan calls his plan, “The Roadmap for America’s Future.” His plan would: (1) cut federal taxes of the richest 1% of households by 50% (i.e., in half – this is in addition to the tax cuts this group would receive by making the Bush Tax Cuts permanent);
Political Parties, Income Inequality and Public Policy – 66
(2) replace some of the lost revenue from the tax cuts for the richest 1% of households with a much more regressive consumption tax on most goods and services (i.e., paid much more by middle and low-income households – families with incomes between $50,000 and $75,000 would face a tax increase of around $900 per year);

Political Parties, Income Inequality and Public Policy – 67
(3) freeze discretionary domestic spending (keep in mind that, that after adjusting for inflation and population growth, this would mean a 25% reduction over 10 years in such items as public transportation, etc.); (4) privatize Social Security (i.e., individual accounts) and;

Political Parties, Income Inequality and Public Policy – 68
(5) replace Medicare for senior citizens with a voucher (i.e., an amount of money to buy health insurance). Since the Ryan plan doesn’t require all citizens to buy health insurance and includes Health Savings Accounts, health care costs will increase (see previous discussion). These increases would occur at the same time that Ryan wants to reduce Medicare spending. Thus, senior citizens would have much poorer health care under the Ryan plan than currently.

Political Parties, Income Inequality and Public Policy – 69
The Ryan plan proposes large cuts in Social Security benefits — roughly 16 percent for the average new retiree in 2050 and 28 percent in 2080 from price indexing alone — and initially diverts most of these savings to help fund private accounts rather than to restore Social Security solvency.”

Political Parties, Income Inequality and Public Policy – 70
This is very similar to former President George W. Bush’s proposal for Social Security. Unlike Bush’s Social Security Proposal, the Ryan Plan protects those whose investments result in less income than under the traditional Social Security program. Ryan’s guarantee would encourage seniors to make more risky investments.

Political Parties, Income Inequality and Public Policy – 71
Why not gamble on an investment with large possible gain (but also large possible loss) when the federal government insures you against loss?

Political Parties, Income Inequality and Public Policy – 72
While the Ryan Plan does include a protection for senior citizen’s whose investments yielded a return lower than what they would have received under traditional Social Security, it is extremely unlikely that this guarantee would be paid in full. Here’s why: Ryan would use government revenues to replace the lost income to senior citizens whose investments performed poorly.

Political Parties, Income Inequality and Public Policy–73A
The cost of this guarantee would be very high. Given the reductions in other programs that would be required to fully fund this guarantee (e.g., in defense, education, environmental protection, etc.) it would be extremely unlikely to be fully realized. The “big picture” is that the current Republican plans, including Mitt Romney’s, are very similar to former President Bush’s plans.

Political Parties, Income Inequality and Public Policy–73B
Regardless of whether one agrees or disagrees with the philosophy of the Republican party, the following conclusion is inescapable: the Republican proposals would make what is already, by far, the weakest social safety net of any wealthy democracy in the world much weaker still while simultaneously increasing the degree of after-tax income inequality in what is already the most economically unequal wealthy democracy in the world.

Political Parties, Income Inequality and Public Policy – 74
Which of the following seems more appropriate: (1) As personal economic risk increases, you need the government less? (2) As personal economic risk increases, you need the government more?
Political Parties, Income Inequality and Public Policy – 75
The two parties differ widely. The Republican Party approach (i.e., “The Ownership Society” and “The Roadmap for America’s Future”) is to load increased personal economic risk back on the individual (i.e., less governmental guarantees – privatization of Social Security rather than guaranteed benefit levels, giving senior citizens a voucher rather guaranteed Medicare – same with health care for the poor;

Political Parties, Income Inequality and Public Policy – 76
reducing taxes on high income earners that can be applied to public services for middle and low-income earners) while the Democratic Party approach is more in favor of using the government to offset increased personal financial risk (e.g., the Obama Health Care Plan – making health care more affordable for middle and low-income earners, increasing the Pell Grant program for low-income college students,

Political Parties, Income Inequality and Public Policy – 77
reducing the Bush Tax Cuts, increasing government deficit spending and increasing regulation of financial markets).

Political Parties, Income Inequality and Public Policy – 78
Tax rates are NOT highly progressive in the United States. The rich pay a higher percentage of their income in taxes than the poor, but not greatly so. All federal taxes together (i.e., income taxes, Social Security taxes, etc.) take approximately 9.4% of the income of households making $16,000 per year, approximately 20.5% of the income of households making $52,000,

Political Parties, Income Inequality and Public Policy – 79
approximately 27.2% of the income of households making $200,000 per year and approximately 34% of households making $18,000,000 per year.

Political Parties, Income Inequality and Public Policy – 80
It is very important to mention that federal taxes have been made much LESS progressive over time. To demonstrate the impact of reduced federal tax progressivity consider the following: “In 2000, the richest 1 household in 1,000 (i.e., .1 of 1%) had about 7.3% of total national after-tax income. If the effect of taxes on their income had remained what it was in 1970, they would have had about 4.5% of after-tax national income.

Political Parties, Income Inequality and Public Policy – 81
This would be a reduction of approximately 38% in their after-tax income (7.3% - 4.5% = 2.8 and 2.8 is approximately 38% of 7.3). This decrease in federal tax progressivity was prior to the Bush Tax Cuts (which, as previously discussed, overwhelmingly benefit households with very high incomes).

Tax Rates Over Time

Political Parties, Income Inequality and Public Policy – 82
State and local taxes are even LESS progressive than federal taxes. Thus, if you add state and local taxes to federal taxes (i.e., to obtain “total taxes”) the tax burden is less favorable to the poor (i.e., less progressive) than for federal taxes alone. State and Local Taxes are a greater percentage of personal income for the poorest 20% of a state’s households than for the wealthiest 1% of a state’s households in virtually every state (all but one).

Political Parties, Income Inequality and Public Policy – 83
In California state and local taxes take approximately 11.3% of the income of the poorest 20% of households while taking only 7.2% of the income of the richest 1% of households.

Political Parties, Income Inequality and Public Policy – 84
For example, in California, the wealthiest 10% of the taxpayers pay approximately 75% of the state income tax. While true, this argument is misleading for two reasons: (1) the most important consideration is taxes as a percentage of income and not the percentage of a tax borne by a particular income group – thus, if California’s state income tax was only to raise $1 and Steven Spielberg paid that $1 he would have borne 100% of the state income tax burden –

Political Parties, Income Inequality and Public Policy – 85
however, $1 would be virtually 0% of his income – thus it’s the percentage of income paid in a tax and not the percentage of a tax that a particular income group pays that is the important consideration; (2) this calculation excludes all taxes except the income tax (e.g., state sales taxes, property taxes, etc.) – when we include all state and local taxes and fees, state and local taxes are a higher percentage of income for the very poor than the very rich.

Political Parties, Income Inequality and Public Policy – 86
As a share of personal income, California typically ranks about 18th (out of 50 states) in state and local tax burden with state and local revenues equal to approximately 17% of personal income.

Political Parties, Income Inequality and Public Policy – 87
One often hears candidates for state office talking about “runaway” state spending. Adjusting for population growth and inflation, to maintain the same level of service in 2009 that the state of California provided in 1999 state spending would have had to increase by 53%. Over the 1999-2009 period spending by the State of California only increased by 29% (i.e., a 24% REDUCTION in real per capita spending).
Political Parties, Income Inequality and Public Policy – 88
Another way of looking at the question of state spending is to take account of both need (i.e., what type of population we have) and state wealth (i.e., our “ability to pay”). By such a measure, California ranked 37th out of the 50 states.

Political Parties, Income Inequality and Public Policy – 89
Some state tax increase would IMPROVE the functioning of California’s economy:
(1) tax internet purchases – not taxing them discriminates against bricks and mortar stores;
(2) change business property taxes annually (i.e., not only when the property is sold) - current practice favors those who hold a property longer – harms new businesses;

Political Parties, Income Inequality and Public Policy – 90
(3) tax carbon, pollution and oil - from an economic standpoint, the cost of pollution should be taxed to provide the appropriate disincentives to reduce pollution. Currently, California is the only oil producing state that does not have a severance tax on oil.

Political Parties, Income Inequality and Public Policy – 91
One factor that would greatly help California’s business climate is a more highly educated workforce. To meet employment needs, the percentage of California’s workforce with at least a bachelor’s degree needs to roughly double over the next 15 years (from approximately 21% to approximately 41%). Tax cuts that result in reduced funding for higher education will not help us meet this critical need.

Political Parties, Income Inequality and Public Policy–92A
A final point, California does NOT have a “big bureaucracy.” State and local employees constitute a SMALLER share of California’s population than in approximately 45 of the 50 states.

Political Parties, Income Inequality and Public Policy–92B
HOMELESSNESS:In 2005, Utah calculated the annual cost of E.R.
visits and jail stays for an average homeless person was $16,670, while the cost of providing an apartment and social worker would be $11,000. Each participant works with a caseworker to become self-sufficient, but if they fail, they still get to keep their apartment.”
Due to drug and alcohol use shelters are much
less beneficial than individual apartments.

Political Parties, Income Inequality and Public Policy–92C
Will poor people make better decisions if they have greater economic security (e.g., guaranteed housing, food, medical care, etc.) or less economic security? The evidence we have is lopsidedly on the side that says poor people will make better decisions (e.g., decisions concerning employment, health, etc. that involve current sacrifice but have greater

Political Parties, Income Inequality and Public Policy–92D
long-term benefits) under conditions of greater rather than lesser security. In reviewing a recent study by an economist and psychologist, Tina Rosenberg notes, “Worrying about money when it is tight captures our brains. It reduces our cognitive capacity — especially our abstract intelligence,
Political Parties, Income Inequality and Public Policy–92E
which we use for problem-solving. It also reduces our executive control, which governs planning, impulses and willpower. The bad decisions of the poor, say the authors, are not a product of bad character or low native intelligence. They are a product of poverty itself. Your natural capability doesn’t decrease when you experience scarcity.
Political Parties, Income Inequality and Public Policy–92F
But less of that capacity is available for use. If you put a middle-class person into a situation of scarcity, she will behave like a poor person.”

Political Parties, Income Inequality and Public Policy – 93
Why Not Policies that Would More Help Middle and Low-Income Households?
While both our strong commitment to absolutist individualism and the framework of our political system (e.g., the separation of powers), make it difficult for the government to pass laws, there are important changes in the balance of domestic political power that have taken place over the past 40 years that make it even more difficult for the federal government to act on

Political Parties, Income Inequality and Public Policy – 94
behalf of the interests of middle and low-income citizens.
In a “nutshell,” here’s what happened: (1) after suffering a large number of political defeats through the 1960s under both political parties, during the mid-1970s business groups (the U.S. Chamber of Commerce, the National of Manufacturers, the National Federation of Independent Business, etc.)

Political Parties, Income Inequality and Public Policy – 95
decided to invest tremendous amounts of money both in lobbying members of Congress and contributing to political campaigns; (2) the relative strength of the counter-weight to business, labor unions, declined precipitously (in 1954 – 32% of the workforce was unionized - today only 13%), and with it a tremendous loss in both political information supplied to middle and low- income households and political participation by these citizens

Political Parties, Income Inequality and Public Policy – 96
(i.e., unions contacting their membership with information on political issues, the membership then contacting elected officials); (3) the interest groups that have formed on the political left have dealt more with the concerns/interests of well-educated higher income voters rather than the working class (i.e., environmentalism, women’s rights and gay rights do not deal with the distribution of the tax burden,

Political Parties, Income Inequality and Public Policy – 97
subsidies for low-wage workers or extending governmental provided health care); (4) due to the increased share of income going to the rich and greatly increased campaign costs – Democrats have had to turn more to business and upper-income groups for campaign contributions; and (5) due to factors 1-4, the political position of business has become much more advantaged relative to labor.

Political Parties, Income Inequality and Public Policy – 98
Think of the political consequences of policy philosophies such as The Bush Tax Cuts, The Ownership Society and The Roadmap for America’s Future. All of these policies accomplish three goals of many (but not all) conservative leaders: (1) they shift the distribution of the tax burden away from taxing investments (i.e., money made with money – income sources primarily of very high-income households)

Political Parties, Income Inequality and Public Policy – 99
toward higher taxes on labor (i.e., taxes more paid by income from wages and salaries – the principle sources of income for the poorest 90%, or more, of households - by relying on consumption taxes); (2) reduce the amount of money redistributed to middle and low-income groups through public programs (e.g., mass transit, job retraining, guarantees for Social Security, Medicare, etc.); and

Political Parties, Income Inequality and Public Policy –100
(3) increase the size of the federal deficit to the point that future Democratic Administrations will have difficulty in undertaking programs primarily benefitting middle and low-income households. For example, notice how difficult it is for Obama to get the necessary funding to implement his health care plan due to the size of the federal deficit (greatly swelled by the Bush Tax Cuts).

Political Parties, Income Inequality and Public Policy –101
The political consequences of the above mentioned policies significantly reduce the incentive for low and middle-income people to participate in the political process (e.g., vote) because they will perceive that government is not that helpful to them (i.e., their taxes will increase and the value of their government benefits will decrease). So, why invest time and effort in politics?

Political Parties, Income Inequality and Public Policy –102
This protects high-income households from future adverse political events. Thus, if increasing income inequality might cause low and middle-income people to desire income redistribution, make it difficult for the government to accomplish this and reduce the incentives for low and middle-income people to get involved in the political process.

Political Parties, Income Inequality and Public Policy –103
What could we do? The basic answer is to undo the changes of the past 40 years. While any proposed “reforms” would spark opposition from those who do well under the current system, I’ll mention two possible changes that would greatly alter the political landscape in a direction much more favorable to middle and low-income groups. First, make it easier for workers to unionize.

Political Parties, Income Inequality and Public Policy –104
Canada offers a compelling lesson. According to the survey evidence, American workers are as favorable to unionization as Canadian workers. However, over the past 40 years, the gap between the percentage of the Canadian workforce that is unionized and the percentage of the U.S. workforce that is unionized has steadily increased (Canada: 1960 - 32%, 2000 – 32%| U.S.: 1960 - 31%, 2000 – 13%).
Political Parties, Income Inequality and Public Policy –105
Without a lengthy discussion, the differences over time are mostly attributable to differences in public policies governing the unionization process. Not surprisingly, this was one of the earliest results of increased business political strength: make it more difficult for workers to unionize.

Political Parties, Income Inequality and Public Policy –106
The second change would be to enact Yale Law Professor Bruce Ackerman’s “Patriot Dollars” proposal for campaign financing: have the federal government give each voter an ATM valued at $50 for each federal election cycle (i.e., every two years). This money could only be used for campaign contributions (i.e., all unused money would be returned to the federal government – “yes” it could be done – i.e., the technology to ensure this does exist).

Political Parties, Income Inequality and Public Policy –107
A voter could give their contribution to one, or a series, of candidates. By not limiting how much individuals, businesses or unions contribute, this policy would not be invalidated by the Supreme Court. The Supreme Court has ruled that restricting how much an individual, or group, can contribute violates their free speech (i.e., money equals speech). Since Professor Ackerman’s proposal does not limit speech, it is constitutional.

Political Parties, Income Inequality and Public Policy –108
By greatly increasing the amount of campaign money available, Professor Ackerman’s proposed policy would reduce the tremendous monetary advantage of both business and the wealthy.

Lessons from Canada - 1
Currently, the federal deficit (i.e., the difference between what the federal government receives in taxes and what it spends) is approximately 10% of GDP. Rather than the painful cuts to the poor (food programs, medical care, job training, etc.) and education, we could eliminate the ENTIRE deficit by

Lessons from Canada - 2
having U.S. taxes as a percentage of GDP equal Canadian taxes as a percentage of GDP (U.S. taxes would increase from 27% of GDP to 37%). Next to the United States, Canada has one the VERY WEAKEST social safety nets of the wealthy democracies. Thus, Canada is NOT a “high tax, big welfare state” nation. However, Canadian taxes represent 10% more of GDP than in the United States. We are a very LOW tax nation.

Rationale for Budget Austerity
In voting in favor the Ryan Budget, Representative Tim Walberg (R-Michigan) said, “They understand in my district: We’re broke. If we don’t deal with this, we lose the social safety net.” One could ask, “Why can’t the wealthiest democracy in the world guarantee to it’s citizens the same social welfare protections (universal health care, greater income support, etc.) that all other wealthy democracies guarantee their citizens”?

U.S. & Canada – Taxes and Spending as a Percent of GDP
U.S. Canada
Taxes 27% 37%
Health Care 16% 10%
W. Health Org. Rank 37th 30th
Defense 4.7% 1.1%
It’s not that we “can’t afford” to provide a better social safety net but rather we tax much less and spend much more on health care and defense. Defense spending in Great Britain and France is approx. 2.5% of GDP.

Areas to Reduce Spending
If you’re thinking of areas to reduce federal spending consider defense. U.S. military spending is about 4.7% of GDP. U.S. military spending is approximately 46.5% of the military expenditures of the ENTIRE WORLD. To put this in perspective the second highest spending nation, China, spends about 6.6% of the military expenditures of the entire world. The next largest spenders are France (4.2%), Great Britain (3.8%) and Russia (3.5%).
The Social Safety Net - 1
Even the comparatively weak U.S. safety net still helps. In the current recession, the U.S. Census Bureau estimates that the combination of unemployment insurance, food stamps and tax credits for the working poor lifted the incomes of between 3 to 5 MILLION U.S. households above the poverty line. Now think of the human cost of reducing the funding for these programs.
The Social Safety Net - 2
The most important fundamental change is to realize that a more activist government will be necessary. If present economic trends continue (e.g., small increases in hourly wages for most middle and low-income workers, reduced employer provided health care and less generous and secure private sector retirement benefits),
The Social Safety Net - 3
the obvious “solution” is to have the federal government provide the benefits that the private sector use to provide. This means having the federal government supplement wages (i.e., to provide cash payments to those who work but earn little), provide a health care benefits package to all citizens similar to Canada and Western Europe, provide child care/day care to working mothers and increase the amount of money Social Security provides to retirees.

The Social Safety Net - 4
Concerning Social Security remember:
1.It Is LESS GENEROUS than similar programs in other wealthy democracies;
2. For TWO-THIRDS of the retired population it provides OVER HALF of their income and for ONE-THIRD of the retired population over 90% of their income;

The Social Safety Net - 5
3. Is an “INSURANCE” against poverty for the elderly and income loss due to
disability – to do this it MUST have
GUARANTEED benefits;
4. As “INSURANCE” against poverty and disability it is NOT comparable to a risk-laden 401k plan;

The Social Safety Net - 6
5. Future shortfalls in necessary revenues can EASILY be accomplished by having ALL income subject to the Social Security tax;
6. Future support for Social Security would be GREATLY weakened if ALL
elderly did NOT receive benefits.

The Social Safety Net - 7
One of the primary difficulties the United States faces in confronting growing inequality and poverty “head on” is the following core set of beliefs about poverty: (1) poverty is the fault of the victim; (2) economic growth will greatly reduce poverty; (3) government intervention will increase poverty. Each of these beliefs, at best, is “suspect. ”

The Social Safety Net - 8
Greater economic growth does reduce the poverty rate in the U.S. However, what this means is that the U.S. poverty rate (typically around 17% of households - Great Britain and Canada around 12%, and the Scandinavian countries – Norway, Sweden and Denmark – around 6.5%) fluctuates around a much higher average than in other wealthy democracies and even at it’s lowest level, is much higher than most all other wealthy democracies.

The Social Safety Net - 9
The “big picture”: the main reason that the U.S. has a much higher poverty rate than the vast bulk of wealthy democracies is that we don’t spend nearly as much of our economy in the following programs as do other wealthy democracies on income transfers (i.e., direct cash payments to either the unemployed or the working poor and the elderly) and do not providing comprehensive health insurance and childcare to all.
The Social Safety Net - 10
Wage Subsidy: Assuming a minimum wage of $8 per hour, here’s how such a plan might operate: a worker earning the minimum wage of $8 per hour would receive a $4 per hour subsidy from the federal government (i.e., their “total wage” would be $12 per hour - $8 per hour from their employer plus $4 per hour from the federal government = $12 per hour) with the subsidy decreasing by 10% for each additional dollar per hour they earned.

The Social Safety Net - 11
This plan does NOT increase unemployment because employers are NOT required to pay their employees more. Far from discouraging work and rewording laziness, the wage subsidy plan encourages work by making work pay more (i.e., the normal wage plus the value of the wage subsidy). The more work “pays”, the more leisure “costs” (i.e., each hour you don’t work costs you more when income per hour is higher than when it is lower). Since you have to work, this isn’t “welfare.”

The Social Safety Net - 12
Furthermore, by making work pay more, and increasing the cost of not working in a legitimate occupation (e.g., selling drugs), the wage subsidy plan will reduce government expenditures by reducing the occurrence of two circumstances which increase government costs: (1) crime (by offering more money for being employed in non-criminal employment) and; (2) teen pregnancy (by increasing the cost of not working – having children typically reduces the hours a mother can or will work).
Reaction to the Wage Subsidy Plan
When a senior economic advisor to former President George W. Bush was asked about the wage plan he replied, “that’s the type of thing we’d do if we were serious.”
Value of Education
It is very important to mention the tremendous impact education has on earnings. In 1975 those with a bachelor’s degree out earned those with a high school diploma by approximately 60%. By 2008 this differential rose to approximately 100%. Unfortunately, the United States ranks 12th in the percentage of 25 to 34 year olds with at least an associate’s degree.

The Social Safety Net - 11
In addition to the wage subsidy, other programs that would greatly benefit low and middle-income earners are: universal childcare, fully funding the Obama Health Care plan and the “Patriot Dollars” campaign finance plan.
The Social Safety Net - 12
In all high-income countries, the parents’ socioeconomic status shapes a child’s educational and earnings prospects, but much less so in Sweden than elsewhere and much more so in the United States. In Sweden, even a child growing up in relative poverty has almost the same education and earnings prospects as a child growing up at the top on the income curve.
The Social Safety Net - 13
Sweden’s distinction lies not in its support for public education, which is roughly matched by other countries, but in its public support for families and their children from the earliest age, even before formal schooling. All of Sweden’s families have access to affordable high-quality day care, which is publicly provided.
The Social Safety Net - 14
This enables mothers to work without leaving their children behind in an unsafe environment. Female heads of household, a group marked by a high rate of poverty in the United States, are not poor in Sweden. Remarkable, their poverty in Sweden, is only 4 percent, compared with the United States, where the Census Bureau recorded a 30 percent poverty rate in 2009. Similarly, all of Sweden’s children are afforded high-quality preschooling.

The Social Safety Net - 15
The annual costs of these programs are:
1. wage subsidy ($150 billion)
2. universal childcare ($150 billion)
3. Obama Health Care Plan ($96 billion)
4. Patriot Dollars ($4 billion)_______
Total Annual Cost: $400 billionNote: wage subsidy costs over time are
likely to be much lower than listed above
The Social Safety Net - 16
Paying for the these programs:
1. Allowing the Bush Tax Cuts to expire
will bring in approximately $363 billion
per year.
2. Ackerman and Alstott’s Wealth Tax - a 2% annual wealth tax on households owning more than $7.2 million in assets (the richest ½ of 1% of households) would bring in at least $70 billion dollars per year – France, Norway and Switzerland have this

The Social Safety Net - 17
If repealing the Bush Tax Cuts and instituting Ackerman and Alstott’s wealth tax seems “too hard” on the wealthy, consider the following: (1) the wealthy did very well, as did the economy as a whole, under the tax rates that would be in effect if the Bush Tax Cuts were allowed to expire (i.e., economic growth was greater under the higher tax rates of the Clinton Administration than during the Bush Administration);
The Social Safety Net - 18
(2) over the 1980-2008 period 98% of the income gains went to the richest 10% of American households (i.e., exactly those that gained, by far, the most under the Bush Tax Cuts); (3) the share of income going to the richest 1% of American income earners more than doubled between 1970 and 2010 (from about 7% to over 18% of personal income);

The Social Safety Net - 19
(4) reducing the concentration of income and wealth at the top of the income distribution would likely improve the performance of our democracy by reducing the previously discussed “debilitating cycle” (i.e., where the increasingly concentration of income and wealth among the very rich increases the reliance of politicians on campaign contributions from the very rich which, in turn, leads politicians to enact policies which further advantage the very rich);

The Social Safety Net - 20
(5) many of the very rich inherited their wealth which rewards “luck” (you can’t pick your parents/grandparents) not “merit”; and
The Social Safety Net - 21
(6) much of the income of very wealthy citizens was made possible by taxpayers. For example, while Henry Ford made a fortune from developing the Ford automobile, he wouldn’t have been successful unless taxpayers and/or government provided roads/highways, street lights, a public education system to provide an educated workforce to design, build and sell Ford cars, and a highway patrol to keep the highways safe.

The Social Safety Net - 22
Similarly, would Bill Gates and Steve Jobs have been able to amass vast fortunes without the research and development provided by the National Science Foundation (an agency of the federal government which provided many of the protocols used for the internet) and the public school system to train the designers and builders of computers?

The Social Safety Net - 23
In all of these cases, it is misleading to say that these individuals achieved their success “alone”, or without government help. Since taxpayers provided much of the requirements for their success, doesn’t it seem reasonable to suggest that taxpayers were investors in these projects and, as such, should reap the rewards of their investment (through tax payments)?

The Social Safety Net - 24
Even if all of the preceding policy and tax changes were adopted, by comparison to the other wealthy democracies of the world the U.S. Social Safety net would still be “weak” and taxes would still be “very low.” It’s not “big government.”
The Social Safety Net - 25
We could more than save the annual $400 billion cost of these programs by switching to a Canadian or European style health care system.

The Social Safety Net – 26
If we adopted a European Health Care system taxes would increase, but this would be more than offset by the savings. For example, if your taxes increase by $100 per month, but your take-home pay increases by $200 per month (due to either less money deducted by your employer for health insurance) or your medical expenses decrease by $200 per month (by reducing the amount you have to pay out of your own pocket for health expenses), your standard of living would increase by $100 per month.
Size of Government - 1
There are good reasons to think that the government budget is too small in a democracy. First, consider the power of advertising. Isn’t the purpose of the tremendous amount of advertising private companies buy to get you to spend money on their product rather on an alternative use of the same money (e.g., higher taxes to provide government benefits)?

Size of Government - 2
Second, there is ample evidence that the public does not have a good sense of not only the benefits other citizens derive from government programs, but of the value they themselves derive from government programs. The percentage of people who (a) benefit from various government programs, and
Size of Government - 3
(b) claim in response to a government survey that they 'have not used a government social program’ are as follows: Home Mortgage Interest Deduction (a huge benefit for home owners) – 60%, Student Loans – 53.3%, Child and Dependent Tax Credit – 51.7%, Earned Income Tax Credit – 47.1%, Pell Grants – 43.1%, Medicare – 39.8% and Food Stamps – 25.4%.
Size of Government - 4
Third, many of those who most benefit from government programs vote the least frequently. As discussed in both class and the readings, lower income citizens disproportionately benefit from government social welfare programs. Additionally, lower income citizens vote less frequently than middle and upper income citizens.

Size of Government - 5
Fourth, many upper income individuals might prefer a greater government effort to help the poor if they thought they might be poor in the future. It doesn’t take much “courage” to favor low taxes and oppose government spending to help the poor when the person in question, either by their current economic position (upper income) or a realistic assessment of their future economic position (e.g., being born into a wealthy family, being close to completing medical school, etc.)

Size of Government - 6
strongly suggests that they aren’t likely to become poor. Would this same individual be as likely to oppose government programs for the poor if they did NOT know (or have a pretty good idea) of their future economic position?

Size of Government - 7
So, wouldn’t the obvious political incentive be for politicians to provide lower government benefits to the poor than would be provided if the poor voted in proportion to their strength in the population?

Size of Government - 8
A person’s political philosophy is likely to their willingness to spend money to reduce income inequality. If you are political liberal, you probably viewed the programs I mentioned previously (the wage subsidy, universal child care, the Obama Health Care Plan and the Patriot Dollars campaign finance reform) favorably.

Size of Government - 9
However, if you are liberal you have to face the question of how far you would go (i.e., how much of your money would you spend) to reduce income inequality?

Size of Government - 10
If you are politically conservative, a reasonable question to ask is: What are you trying to “conserve”? On the one hand you could answer that you were trying to conserve freedom and since taxes reduce a person’s freedom to spend their money as they please, then the government should be very small and taxes very low and, hence, you would probably not support the programs I mentioned previously.

Size of Government - 11
That’s certainly a philosophically defensible position. It could be useful, however, to consider the following two questions: (1) Is freedom the only value that matters? (i.e., inequality, poverty, the performance of democracy – think back to the discussion of the “debilitating cycle” - don’t matter much);

Size of Government - 12
(2) Does a small government actually deliver the most freedom? For example, would increase if: (1) the State of California sold off public beaches to private citizens and; (2) if taxes were reduced but fewer students could go to college and hence suffer a reduction in career choices later in life?

Size of Government - 13
A second answer to the question of what you are trying to conserve might be as follows: an America where the benefits of economic growth and technological change are widely shared, such as occurred between the end of World War II (1945) and the early 1970s (i.e., where economic growth was high and the share of income going to very high income groups decreased substantially). If this is what you are trying to conserve, then the programs previously mentioned could be quite beneficial to your goal.

Thiessen’s Comments - 1
Mitt Romney, the 2012 Republican Presidential nominee, said the following: “We have a very ample safety net, and we can talk about whether it needs to be strengthened or whether there are holes in it. But we have food stamps, we have Medicaid, we have housing vouchers, we have programs to help the poor.”

Thiessen’s Comments - 2
Now the reaction to Romney’s comments from Washington Post editorial writer Marc Thiessen. “So Romney is fine with an entire class of Americans being permanently on food stamps, Medicaid, housing vouchers and other government welfare programs? His solution for our fellow citizens trapped in poverty and dependency is to find holes in the safety net and repair them? That is not conservatism.

Thiessen’s Comments - 3
That is liberalism. The left judges compassion by how much money we spend, which is why the liberal project is to strengthen the safety net and grow the nanny state. The conservative project is to help people escape the safety net. Conservatives seek to create an opportunity society where we can lift people out of lives of dependency.

Thiessen’s Comments - 4
That is liberalism. The left judges compassion by how much money we spend, which is why the liberal project is to strengthen the safety net and grow the nanny state. The conservative project is to help people escape the safety net. Conservatives seek to create an opportunity society where we can lift people out of lives of dependency.

Thiessen’s Comments - 5
We are not okay with having millions of Americans trapped in poverty and living on the dole. We are not okay with multiple generations trapped in government welfare. We believe in a society where the poor have opportunities for advancement.

Thiessen’s Comments - 6
We want them to have the education and skills they need to find good jobs, get off public assistance and to move up to the middle class and beyond-as far as their ambition and ability will take them.”
Thiessen’s Comments - 7
First, our economy does not, and will not, generate sufficient jobs to employ all of the poor who want to work. The Great Recession, which began in late 2007, caused the economy to lose 8 million jobs. According to the nonpartisan Congressional Budget Office, the unemployment rate is NOT expected to get as low as even 5% by 2016.

Thiessen’s Comments - 8
Put another way, for the nine year period from 2007 through 2016, the unemployment rate would be high enough to leave several million job seekers without employment. How could these people be expected to work over this period when the jobs simply aren’t available?

Thiessen’s Comments - 9
Furthermore, as explained very early in this writing, Republican/Conservative Administrations and politics weight reducing inflation more highly than Democratic/Liberal Administrations. Think back to the Obama Stimulus plan’s effect: unemployment was 1.7% lower than it otherwise would have been.

Thiessen’s Comments - 10
As much research by political scientists and economists has found, more liberal administrations typically produce lower unemployment and higher inflation than conservative administrations (see earlier discussion and sources cited therein). So, the policies of the very philosophy Thiessen favors actually produces less employment, and hence, less opportunity for the poor than more liberal administrations/politicians.

Thiessen’s Comments - 11
If the growth rate in the economy appeared to be high enough to actually employ all those who wanted to work, the inflation rate would move into, as policymakers see it, a danger zone. What would happen is that as economic growth exceed about 4% per year the federal reserve would raise interest rates, making borrowing more costly and, thus, ultimately reducing the economic growth rate and employment.

Thiessen’s Comments - 12
Since the Great Recession started, millions of Americans cannot find work and the economy will not likely grow sufficiently to employ them for many years, if ever.

Thiessen’s Comments - 13
Second, many jobs simply do not provide the level of compensation necessary to provide workers with a standard of living that Americans would consider “decent.” Working 40 hours per week, 50 weeks per year, at $9 per hour translates into an income of $18,000 per year. Most such jobs do not come with either health care or retirement benefits.

Thiessen’s Comments - 14
Think of your family living on such an income. Is this how you want low wage workers to live? The very government programs Thiessen refers to are the only bulwark such low workers have against living on an income that does not adequately provide even the “essentials” of life. Think back to the discussion of the wage subsidy program.

Thiessen’s Comments - 15
Take the food stamp program. Food stamps only provide approximately 70% of the money necessary to provide what the U.S. Department of Agriculture says is a nutritionally adequate diet Over three times as many households that receive food stamps had at least one worker than relied solely on government assistance.

Thiessen’s Comments - 16
Finally, each $1 spent on the food stamp program generates $1.72 in economic activity. Think back to the previous discussion of how much economic activity per dollar spent was generated by other programs that benefit the poor (e.g., extending unemployment compensation - $1.60; payroll tax reduction - $1.09 or the wage subsidy program) versus
Thiessen’s Comments - 17
the economic stimulation per dollar of the Bush Tax Cuts ($.35). Thus, the food stamp program helps generate the very economic activity that helps reduce the unemployment rate.

Thiessen’s Comments - 18
Generations of the same family could not be on cash welfare for entire lifetimes because each person is restricted to 5 years. Second, Mitt Romney supports the previously discussed Ryan Budget, which will require large reductions in what is, by far, the weakest social safety net of any wealthy democracy in the world.

Thiessen’s Comments - 19
No other wealthy democracy has pursued the type of system Thiessen desires. Third, the Ryan Budget, will require large spending reductions in exactly the types of programs (e.g., education) that would make the poor/unemployed more competitive in today’s labor market.
Thiessen’s Comments - 20
Fourth, the previously discussed wage subsidy plan increases the incentive for people to work because it “makes work pay more” for low-income workers than it current does. Thus, if we adopted such a plan, it would use government programs to increase, not decrease, work effort.

Wage Subsidy: Assuming a minimum wage of $8 per hour, here’s how such a plan might operate: a worker earning the minimum wage of $8 per hour would receive a $4 per hour subsidy from the federal government (i.e., their “total wage” would be $12 per hour - $8 per hour from their employer plus $4 per hour from the federal government = $12 per hour) with the subsidy decreasing by 10% for each additional dollar per hour they earned.
Thiessen’s Comments - 21

Conclusions - 1
Budget Waste/Fraud: One of the most important findings from the study of citizen attitudes toward government programs is this: people typically think that unpopular spending programs (e.g., welfare and foreign aid) makeup a much larger share of the budget than they actually do. In studies I read many Americans think that welfare and foreign aid each account for 10%, or more, of federal spending. Actually, welfare and foreign aid each account for less than 1% of federal spending.
Conclusions - 2
The error rate in the food stamp program is 2% (92% of the money goes to the beneficiaries). Since one-third of those eligible for food stamps do not receive them, we spend much less on food stamps than we would if fraud were completely eliminated and everyone who was eligible for foods stamps participated.

Conclusions - 3
Eliminating politicians “pet projects” (e.g., “earmarks” – the famous “bridge to nowhere”) are .1% of GDP (i.e., one tenth of one percent). The “big picture” is that we will not meaningfully reduce the budget deficit by eliminating “waste, fraud and abuse.” Waste, fraud and abuse simply aren’t large enough to have a discernible impact on budgets.

Conclusions - 4
The ingenuity of capitalism’s “creative destruction” means that business CANNOT pursue social goals/values over profitability. Thus, the very strength of capitalism is a prime reason why it can be argued that a strong social safety net is absolutely necessary.

Conclusions - 5
None of this is to say that our current policies are “wrong” or that the conservative vision of low taxes, high levels of inequality and a low degree of economic security are “wrong.” However, if we want to provide greater economic security and reduce income inequality in America, there are very viable options to both our current policies and conservative proposals.