Political Economy and Life Course Patterns: The ... Economy and Life Course Patterns: ... and the...
56
Max-Planck-Institut für demografische Forschung Max Planck Institute for Demographic Research Doberaner Strasse 114 · D-18057 Rostock · GERMANY Tel +49 (0) 3 81 20 81 - 0; Fax +49 (0) 3 81 20 81 - 202; http://www.demogr.mpg.de MPIDR WORKING PAPER WP 2001-037 DECEMBER 2001 Political Economy and Life Course Patterns: The Heterogeneity of Occupational, Family and Household Trajectories of Young Spaniards Pau Baizán ([email protected]) Francesca Michielin ([email protected]) Francesco C. Billari ([email protected]) © Copyright is held by the authors. Working papers of the Max Planck Institute for Demographic Research receive only limited review. Views or opinions expressed in working papers are attributable to the authors and do not necessarily reflect those of the Institute.
Transcript of Political Economy and Life Course Patterns: The ... Economy and Life Course Patterns: ... and the...

Max-Planck-Institut für demografische ForschungMax Planck Institute for Demographic ResearchDoberaner Strasse 114 · D-18057 Rostock · GERMANYTel +49 (0) 3 81 20 81 - 0; Fax +49 (0) 3 81 20 81 - 202; http://www.demogr.mpg.de
MPIDR WORKING PAPER WP 2001-037DECEMBER 2001
Political Economy and Life CoursePatterns: The Heterogeneity ofOccupational, Family and HouseholdTrajectories of Young Spaniards
Pau Baizán ([email protected])Francesca Michielin ([email protected])Francesco C. Billari ([email protected])
© Copyright is held by the authors.
Working papers of the Max Planck Institute for Demographic Research receive only limited review. Views oropinions expressed in working papers are attributable to the authors and do not necessarily reflect those of theInstitute.
1
Political Economy and Life Course Patterns:
The Heterogeneity of Occupational, Family and Household Trajectories of
Young Spaniards
Pau Baizán1, Francesca Michielin2 and Francesco C. Billari3
Abstract
We explore the strong linkages between macro changes and the dynamics ofeducational, occupational, family, and residential careers of young Spanish adultsborn between 1945 and 1974. We review theory and evidence on macro factors:changes in the welfare system, centrality of the family as a service provider, and thechanging role of women. We outline some hypotheses of how life course trajectories,and their heterogeneity, change across cohorts. We build data on sequences of statesusing FFS. In our analysis, we find an increase in the discontinuity of careers and ofthe heterogeneity among cohort members, especially for employment. Women’scareers are becoming more similar to those of men. Family and household formationis postponed, with a limited spread of post-nuclear family forms.
1Max Planck Institute for Demographic Research, Doberaner Str. 114, D-18057Rostock, Germany. E-mail: [email protected]
2Department of Statistical Sciences, University of Padova, via Cesare Battisti241/243, I-35121 Padova, Italy. E-mail: [email protected]
3Max Planck Institute for Demographic Research, Doberaner Str. 114, D-18057Rostock, Germany. E-mail: [email protected]
2
1. Introduction
Two ideal-typical models have often been used to depict the post-war changes in the
life course in western societies. The first is characterized by highly standardized and
linear biographies, as a result of stable, well-paid jobs for males, stable and quasi
universal marriage with childbearing soon after, and women foregoing their working
careers after marriage to become housewives. This model has been termed fordist
(Myles, 1990) or bourgeois-family (Roussel, 1989). The second model, sometimes
called post-industrial or post-modern, implies a shift to a situation marked by
discontinuity in life patterns and by greater heterogeneous experiences among
individuals. A tentative list of the second model’s features would include:
precariousness of employment and income, couples earning two incomes, increasing
individualization, and late and unstable families and households. These two "regimes"
(Buchmann, 1989; Esping-Andersen, 1990; Mayer, 1997) of biographies can be used
as benchmarks when analyzing the life courses of the Spanish cohorts born between
the 1940s and the 1970s.
Here we are particularly interested in the way institutional arrangements shape
individual life courses. Although global processes, such as de-industrialization and
globalization, exert roughly similar pressures and challenges for all advanced
societies, historically-rooted specific institutional set-ups will lead to very different
and nationally varying responses (Mayer, 2001). Moreover, institutional
configurations tend to be historically stable and difficult to change. "Path
dependencies" tend to lock societies into given tracks, and changes to the existing
order are associated with costs and mal-adaptations of individuals and institutions
(Arthur, 1994). Demographic responses to global processes such as individualization
and post-modernism (Giddens, 1991; van de Kaa, 1996) may be very sensitive to
specific contexts, and accordingly show different forms in each country.
We restrict our analysis to the transition to adulthood of young Spanish adults. This
stage of the life course can be considered a strategic node at which to investigate shifts
in the social structuring and the individual organization of the life course (Rindfuss,
1991). We study cohorts born between 1945 and 1974, as the institutional setting in

3
which such cohorts have grown up has been subject to peculiar historical
transformations. Such transformations include the late modernization of the economy
and society, the democratization of politics and the related development of the welfare
state, and the democratization of the family system. We will summarize some of these
changes, highlighting the challenges and the paths followed. We will focus on
developments in the labor market and in the education system, on changes in family
and household formation, and on new gender roles, in an attempt to link them with
changes in life courses.
The second part of the paper is devoted to an examination of changes in the
biographies in Spain. Since we mainly adopt an explorative perspective, our data and
methods follow this approach. We study five-year birth-cohorts, from 1945 to 1974, in
order to follow in detail the evolutions in the biographies. Our purpose is to detect
inter-cohort trends in the degree of diversity and stability in the work, educational,
household and family careers. In the Spanish context, one cannot speak of a “fordist-
parsonian” regime until we reach the cohorts born from the mid 1940s and the 1950s,
and even for such cohorts only to a limited extent. In a similar way, only the cohorts
born from the 1960s start showing traits of a post-industrial regime. This means that
there is a time lag in the cohorts involved in the respective regimes, compared to most
other west European countries. However, more interesting than this "laggard" status
are the peculiarities or the divergences of the Spanish transformation (Esping-
Andersen, 1999).
2. Changes in the institutional context and research hypotheses
Our reasoning is based on the framework of several recent contributions that explore
the interrelationship between the macro context and life course transitions. Such link
is generally difficult to grasp (Mayer, 1997), and lacks operational definitions. Pfau-
Effinger (1999) emphasized that institutions are embedded in the cultural system, and
that they result from actors’ interests and ideologies. Given that they are, at least
partially, the result of struggle and unintended events, inconsistencies between
institutions are to be expected. Esping-Andersen (1990; 1999) points to the
importance of the household economy and its link to specific welfare regimes. It is
4
crucial to detect both, changes in the family system that affect the welfare capability
of the family and changes affecting the role and status of women (Wall, 1995; Orloff,
1996).
2.1. Institutional regulations in the labor market and education
The end of the dictatorship period and the transition to democracy mark a clear divide
in the Spanish political economy. The watershed can be taken to occur in 1978, the
year of the new constitution. The period between 1960 and 1975 was a period of rapid
economic growth (6.8 percent on average), and by the early 1970s Spain had clearly
passed the threshold commonly associated with the development of advanced social
welfare states. This late modernization of the economy was accompanied by a deep
agricultural crisis, and by a regionally uneven industrial expansion. Some of the
characteristics of the ‘Fordist’ mode of regulation developed only partially, due to the
presence of many small sized firms and only a few big industrial enterprises.
However, a significant proportion of the stable, well paid jobs, with social security
rights (old-age pensions, health insurance), were not provided by the private sector,
but were public sector jobs. The public sector not only included jobs in administration
and social services (which both developed very slowly before the transition to
democracy), but also in the numerous state-owned enterprises (e.g. the automobile and
steel industries, in communications and energy sectors).
A strict labor market regulation developed during the late 1960s and the 1970s,
partially as a result of a corporativistic representation and coordination, that in a
modified way (for instance the Pactos de la Moncloa in 1977) survived into the
democratic period (Martínez Alier and Roca Jusmet, 1988). Job protection was (and
still is) focused on people already having permanent-contract jobs. Basically, this
implies a high cost of redundancy for enterprises, and the fact that unemployment
benefits and high salaries are mainly secured to employees with long-term contracts.
In this context, a divide has developed between “insiders” and “outsiders” in the
employment market since the economic crises of the mid-seventies (Bentolila and
Dolado, 1994; Saint-Paul, 2000). Newcomers to the labor market, especially young

5
people and women, experience strong barriers to getting core jobs. Before 1974, levels
of unemployment were below 4 percent. This coexisted with emigration to Northern
Europe (and during the 1950s to Latin America), which alleviated labor surplus. Since
then, unemployment has soared, reaching the highest levels among OECD countries
and consistently fluctuating around 20 percent. Unemployment among young people
reached 40 percent1 (Instituto Nacional de Estadística, 2001). Such an exceptionally
high unemployment rate has been the subject of much debate, of course, and several
causes have been suggested for it. We can mention the partial time overlap between
the reallocation of the labor force from agriculture to industry and the transition from
industry to services (Marimon and Zilibotti, 1996), a rigid labor market, growing labor
costs due to the increased power of trade unions (they were illegal during
dictatorship), cohort-size (e.g. the number of births between 1960-64 was 16 percent
higher than those born between 1950-54), and the orthodox structural adjustment
policy strategy that was followed to joint the European Community and later to
comply with the European Monetary Union rules (Boix, 1996; Navarro, 2000).
Parallel supply-side structural reforms have tried to open up the economy, transform
non-competitive sectors of the economy and deregulate markets.
Labor market reform was introduced from 1984 onwards and resulted in a
liberalization and promotion of temporary work contracts. Only more recently (1993
and 1999 reforms) part-time jobs have stopped being penalized. It is significant that in
these and subsequent reforms “acquired” rights for “insiders” have not been
undermined. An unlimited deregulation of the labor market, even if it were to
1 Unemployment trends (as percentages of labor force in each category):
Years total unemployed < 25 years old unemployed women unemployed
1977 4.8 11.3 5.01982 15.5 37.8 18.01985 21.7 47.6 24.81990 16.3 31.8 24.21994 24.3 45.1 31.41999 15.6 29.3 22.9Source: Instituto Nacional de Estadística, Encuesta de Población Activa, annual series(second quarter), www.ine.es.

6
facilitate the employment of women and first-job seekers, would erode at least
temporarily the basic job and wage security, and the welfare entitlements, of the adult
male worker. This would jeopardize the security and welfare of many families with a
single wage earner. Therefore, the whole system of rights for those holding a
permanent contract was respected. As work-experience and job-training contracts
were subsidized, it was mainly through these that young people and women (re-
)entering the labor market gained access to jobs since then. The proportion of the
active population on fixed-term contracts rapidly jumped from 15 percent in 1987 to
30 percent in 1990, and it has remained around that last level until now (Jimeno and
Toharia, 1994; Instituto Nacional de Estadística, 2001). Massive unemployment and
flexibilization of the labor market have affected mainly young people and women, not
only because they are the new entrants in the labor market, but also because of their
weaker bargaining power and because of normative expectations concerning the
functioning of households (see section 2.2). Although unions strongly opposed a
deregulated labor market, electoral support for successive governments endorsing
these measures has been relatively unaffected. By contrast, there was much more
government support for the public funding and provision of benefits following the
significant growth in early retirement at the beginning of the 1980s, connected with
industrial restructuring. This support was justified on the grounds that often the laid-
off individuals were household heads and the only income providers for their
households (Maravall and Fraile, 1998).
A striking feature of the dictatorship was the chronic underdevelopment of social
welfare. The tax system was extremely regressive and underdeveloped (tax revenue
amounted in 1975 to 19.5 percent of Gross Domestic Product, compared to an OECD
average of 32.7). Public expenditure on social protection was mainly associated with
job related benefits, and it was through this that other dependent household members
had access to social welfare. Moreover, government expenditure mostly benefited
higher income groups in absolute terms, a feature that has notably diminished though
not disappeared in the later period (Gimeno, 1993).
The new democracy radically changed the scene. One powerful force for change has
been the increased sense of government responsibility for policy making that results
from electoral accountability (Gunther, 1996). Social Security expenditure grew
7
rapidly in the late 1970s, as new needs and demands derived from unemployment and
pensions rose sharply. During the 1980s, several steps were taken towards a universal
provision of some welfare services. A notable example of policy innovation was the
enactment in 1986 of a law that established the principle of universal coverage by the
national health system. This led to an expansion of coverage from 85.7 percent of the
population in 1982 to 99.9 percent in 1992 (Rodrígeuz Cabrero, 1994; Sarasa and
Moreno, 1995; Rico, 1997). This expansion specifically benefited very low-income
groups, who were not covered by private insurance. Another example is the extension,
in 1991, of old-age pension rights, albeit at a very low level, to individuals with an
insufficient record of contributions and no other sources of income. This extension
reduced somewhat the need of assistance and co-residence with close family members
of the elderly. Other measures of a much more timid scope were also taken in the
direction of de-commodifying welfare provision. These included a guaranteed income
for extremely poor individuals, child benefits for very low-income families and
unemployment subsidies (Guillén, 1992 and 1996; Laparra and Aguilar, 1997).
The extreme underdevelopment of social welfare in Spain during the dictatorship had
a very clear manifestation in the educational enrolment and in the educational
attainment of the population. Educational reforms came late and have suffered chronic
under-funding, compromising their results. It was only in 1970 that compulsory
education up to the age of 14 was introduced and only raised to 16 in the mid-1990s.
Systems of professional education and training remained extremely underdeveloped.
The expansion of the educational system took place during the late 1970s and
particularly during the 1980s, with an important increase in government spending (the
budget for education increased from 2.8 to 4.5 of gross domestic product between
1981 and 1991). Starting from a very low base, especially among women, there was a
rapid increase in enrolment in secondary schools and universities. However, only the
cohorts born from 1960 onwards could benefit from such increase. We expect such
changes to lead to more years spent during young adulthood in an institutionalized
setting, and to a drastic improvement in human capital acquisition, in comparison to
previous birth-cohorts. Longer periods in the educational system also mean a
8
postponement of labor market integration and family formation events (Hoem, 1986;
Blossfeld, 1995; Billari et al., 2001b; Baizán, 2001; Billari et al., forthcoming)2.
Given the trends mentioned above, we expected the following dynamics for the life
courses of post-industrial birth-cohorts.
Hypothesis 1: The increasingly flexible labor market should lead to a growth in
heterogeneity of experiences (in the timing of transitions and in the states
experienced) and to an increased discontinuity in the work careers (mobility
between unemployment/work and between different jobs).
Hypothesis 2: The increased difficulties of economic integration (insiders/outsiders
divide) have the effect of postponed access to employment. Longer and increased
periods of precariousness for an ever-larger part of the population should increase
the heterogeneity among individuals.
Hypothesis 3: More time spent in the educational system should have the effect of
postponing labor market integration. This will mean more homogeneous
(standardized) experiences for early teenagers, but heterogeneity should increase
later, as increasing proportions of individuals enter higher, secondary and
university education.
2.2. The family system and the welfare capability of households
In this section we briefly indicate some ways in which national policies shape
household formation and intergenerational relationships in Spain. Although the
normative3 aspect is extremely important in directing and legitimizing family models
(Fahey, 1995), we mainly focus on the economic elements of state action. The state
sets up the legal and policy frameworks that (implicitly) support particular family
models.
2 In this paper we do not focus on the relationship between individual careers, but on the effects of theinstitutional changes on each career. Instability of employment and unemployment have been shown tostrongly reduce the probability of family and household formation events in Spain (Ahn and Mira,1999; Billari et al. 2000; Simó et al. 2000; Baizán, 2001).3 Relatively little quantitative data exists on the social norms existing in Spain for the decades underinvestigation, in particular referring to differentials according to regional or social class contexts. On

9
Let us first remind the conservative legislation under dictatorship, with its explicit
patriarchal and gender inequality features (Valiente, 1993). This legislation was not
changed until the late 1970s, in spite of the significant individualization and
democratization of family values and behavior experienced by a growing proportion
of the population (Alberdi, 1999). Catholic “social doctrine” has also had a major
bearing on successive governments and their policies. It is based on the principle of
“subsidiarity”, i.e. limiting public interference to situations where the primary social
network -the family- fails. As a result, active family policies were (and still are)
extraordinarily underdeveloped (Guerrero and Naldini, 1996). Therefore, a paramount
characteristic of Spanish social policy was its ‘familialism’, consisting in the family
internalization of welfare responsibilities (Orloff, 1996; Saraceno, 1996; Esping-
Andersen, 1999).
The new Constitution and the later legislative developments substantially changed the
normative system. The Catholic Church lost much of its power on family-related
legislation, in 1981 for instance, civil marriage became an option for citizens and
divorce was (re-)legalized (divorce had been possible during the 1930s). Rules
regarding finance in marriage, infidelity, paternity and children born out-of-wedlock
were also changed (Alberdi, 1999). However, welfare state development under
democracy kept some elements of the previous period. Continuity was kept in
particular in the “familialistic” model, with its characteristic male and middle age (or
mature age) bias, common with other Southern European societies such as Italy. Apart
from the important exceptions of the health care and educational system, the welfare
state is largely an income-transfer system and is only marginally dedicated to family
servicing. It basically assumes that married women are housewives and that children,
including adult children, should rely on their parents as primary providers until they
receive an independent income and should only turn to the state in times of need.
In this respect, it is important to emphasize the welfare capability of the household.
This refers to the unpaid production of goods and services (Duran, 1997) as well as
income pooling and redistribution among household members, including welfare state
social protection. This last feature has expanded in the last two decades due to the
the other hand, legislative change mainly took place under the constitution of 1978 and its laterdevelopment.
10
development of the welfare state. One can also note that the relative absence of
welfare services can only be partially replaced by purchasing these services in the
market in the Spanish context, since the relative prices of services incorporate the high
protection and ‘family wage’ for insiders in the labor market (Esping-Andersen,
1999).
In fact, Spanish family policy has been classified as “indolent” among the OECD
countries because of its low profile in economic (i.e. transfers and tax) and ecological
(i.e. community services) intervention (Künzler et al., 1999). Below are several
examples of these policies:
• Unemployment benefits for individuals seeking their first job are non-existent, as the unemployed
are supposed to be supported by their families.
• Active labor market policies are relatively underdeveloped, as well as public mediation between
employers and job seekers. This situation reinforces the role of the family and other private
connections. As many as 61 percent of young Spaniards have got their jobs thanks to their families.
By comparison, the percentage in Italy was 65, in Germany 21, and in the Netherlands 18
(Commission of the European Communities, 1994).
• Housing policies have consistently provoked the erosion and quasi disappearance of the rental
housing market. In 1988, Spain had (with Ireland and Luxembourg) the highest proportion of home
ownership in the European Union: 74 percent (Eurostat, 1996). Symptomatically, deregulation of
the rental housing market in the early 1980s was limited to new contracts, thus disproportionately
affecting young people. The preference given to ownership by government policies implies a heavy
economic burden on household formation. Such policies include a relative inhibition to promote
social housing and a focus on tax allowances for mortgage payments (Leal Maldonado, 1992;
Serrano Secanella, 1997).
• The tax system favors joint taxation of married couples, which constitutes a disincentive to
women’s labor force participation (Alvarez García and Carrascal Arranz, 2000). There is tax relief
on the income of parents with young adults living in the parental home and not having their own
income.
• The low level of student grants means that the formation of independent households by students is
unlikely. Furthermore, before the mid-1980s, only a small fraction of students was entitled to grants
(Bricall, 2000).
• In 1992-93 around eight per cent of children aged two were enrolled in a preschool, and nearly 100
per cent of children at the age of five (Eurydice, 1996). The proportion of children under two cared
for in 1991-92 in public centers was 0.1 per cent for those under one year, 0.5 per cent for one year
olds and 1.4 per cent for two years olds (Ministerio de Educación y Ciencia, 1994). Therefore,
parents often choose informal solutions as an alternative to or supplement to formal (public or

11
private) childcare, including extended family members and private child minders. By the same
token, the extension of public education from the age of three that occurred during the 1980s has
greatly favored women’s integration in the labor market.
• The amount of child benefit is extremely low. It was universal until 1990, when it became means
tested.
• The maternity leave period is currently 16 weeks, with right to full earnings.
The Spanish welfare model, then, blends strong job-rights, job-related income
guarantees (including unemployment benefits, pension rights) and an unusually
powerful “familialism”, including income pooling, the absorption of social risks and
the provision of social care by private households. It is therefore assumed that the
family can internalize such obligations. However, social class is an important
determinant of the ability to provide the basis of independence for young adults, in
particular when investments in education are concerned (Baizán, 2001). Moreover,
such an organization implies in fact the economic dependence of young people on
their parental household, and of women with children on their husbands. Hence, the
capacity of young adults and women to form independent households is severely
curtailed. Newly formed households are exposed to economic precariousness, unless
supported by a household member with a stable job. One-parent households headed by
women and one-person households are at high risk of social deprivation (Layte et al.
2000, table 2). One can hypothesize that given the high economic cost involved in the
formation of new households and the considerable investment associated with it, the
support of the parental family is usually needed, increasing the dependency on
intergenerational relationships.
In this context, remaining in the parental home and postponing family formation may
be seen as a strategy compatible with a post industrial life course4, where the
development of independence takes place within the family of origin. One has to take
into account that staying in the parental home has changed its meaning, from
subordination to a more democratic and autonomous living arrangement (Marí-Klose
and Nos Colom, 1999). Family forms and family formation apparently have changed
4 Which in terms of family life can be characterized by flexibility, little family engagement, and few, ifany, children.
12
little, although the actual relationship of people and their social situation has been
transformed.
Furthermore, the powerful internalization of welfare within the family implies that it
would be much more difficult for young Spaniards to cultivate unorthodox living
arrangements. Instead, they have positive incentives to count on family solidarity.
New living arrangements such as living alone or in a consensual union, as well as
divorces, and lone parenthood are penalized for powerful reasons. As shown above,
the welfare state and its social policies do not support these “individualistic” living
arrangements.
Economic theories of the family that have centered on the growing autonomy of
women (Becker, 1981), relative economic deprivation (Easterlin, 1980) or labor
market conditions of both genders (Oppenheimer, 1988) do not provide a complete
account of these realities, especially as far as Southern European countries are
concerned. On the other hand, theories emphasizing long-term trends and global
processes implying a rise in individualism, in the individual’s resources
(psychological or educational), in the enhanced value of both the family and personal
privacy and the weakening of external forms of imposition, have not been articulated
sufficiently with welfare state changes.
This relative lack of research into the dynamic relationship between institutions can be
exemplified by the inconsistencies shown by data on values and behavior. Several
surveys on values consistently show that the ‘Parsonian’ family model is no longer
supported by the Spanish population. Younger cohorts in particular exhibit a high
degree of gender equality values, tolerance for individualistic forms of household, as
well as highly favorable attitudes to family life (Centro de Investigaciones
Sociológicas, 1994, 2000). These studies show much more similarity and convergence
with other developed countries than could be expected from demographic indicators.
They rather seem to support the cultural globalization thesis, that is, that peoples of
the world are increasingly interrelated in terms of their cultural understandings and
self-identity (Knudsen and Waernes, 1999). Moreover, they provide only mixed
support to the hypothesis that public opinion conforms to state welfare type (Treas and
Widmer, 2000). Institutional constraints should be taken into account in the

13
explanation of such inconsistencies, in particular the lack of adaptation of welfare
state and labor market institutions to the increasingly prevalent family models and
values.
The latter argument does not pretend to deny the existence of a mutual reinforcement
of social policies and long-standing family norms and values (Reher, 1998; Micheli,
2000; Dalla Zuanna, 2001; Billari et al., 2001a). On the contrary, some kind of
feedback mechanism can be postulated to explain the fact that the increasing
difficulties encountered by young people in their integration into adult life have not
been dealt with by public mobilization, but seemingly have lead to the reinforcement
of family solidarity. First, there are limitations in the functioning of democratic and
market mechanisms5, where corporativistic and networking (including clientelistic)
practices are widespread (Martínez Alier and Roca Jusmet, 1988; Martínez Veiga,
1999), as well as informal economy (Lobo, 1990). This situation curtails to some
extent the capacity of an effective public response. It contributes to the perception of
the public domain as both external and handed down to individuals, and it emphasizes
the need for private responses. Furthermore, people may stress the importance of the
family because family-centered strategies are more successful and reliable than public
provision and the market6. And perhaps more importantly, the weak and dependent
position of young people and women inside and outside the households in itself
contributes to the explanation of the relative stability of the power relationships
existent in the society, since their weakness impinges upon their capacity to influence
institutional arrangements.
Thus, it can be argued that the familialistic ideology is explained by public policies
and is itself an explanation for them. There is, however, a risk of over-emphasizing
the mechanisms leading to stability, and of ad hoc tautological theorizing. It is easy to
interpret an institutional arrangement as being valuable if it has found its established
5 Public policies may be seen as being the result of numerous competing interest groups (economic andother), that compete with public opinion, in attempting to influence government decision making. Inthis respect it is worth noting that many institutional arrangements and power relationships have onlychanged gradually since the end of the dictatorship.6 Some authors have suggested that the market and other economic institutions do more than allocategoods and services: they also influence the evolution of values, tastes and preferences in a dynamic way(Bowles, 1998; Jakee and Sun, 2001).
14
place in some situation, but conceivably a different arrangement may have served the
situation as well or possibly even better.
Finally, we can formulate the following expectations for individual biographies of
post-industrial birth-cohorts, to be discussed in our empirical analyses:
Hypothesis 4: The expansion of education and unfavorable labor market trends
induce the postponement of family transitions. Deregulation of the labor market
should also have some impact on the instability and diversity of family forms.
Hypothesis 5: Economic and normative constraints continue to constitute an
effective check to the diversification of family forms. Consequently we expect a
limited growth of heterogeneity across cohorts.
2.3. New role of women
As noted above, educational enrolment and educational levels attained by women
have completely filled the gender gap existing in older birth-cohorts. However, the
type of education and its market value still strongly differ among genders, and this has
had a translation in the vertical and horizontal segregation of occupations (Garrido,
1992). The increasing participation in the labor market by women has been a
consistent trend, that has nevertheless coexisted with much higher unemployment
rates among women. Gender discrimination and segregation in the labor market has
also taken the form of higher proportion of women in non-formal jobs and short-term
contracts. This may help explain their low presence in unions, and the relative low
presence of family issues in public discussions concerning labor market regulation.
These factors imply a lower earnings potential for women7, and it must have had some
influence on the generally subordinate position of their employment career, vis-à-vis
that of their partners8 or other household members. This often leads to a retreat from
the labor market. The interest of the household or the larger family can then be
invoked by the individuals involved as a justification for men specializing in the labor
market and women in household services and care provision.
7 Marriage market practices, favouring a marriage upwards in terms of education for women, alsocontribute to the differential economic capacities of partners (González, 2001).

15
The prevalence of the breadwinner model among older cohorts implies the absence of
participation in the labor force or the retreat from labor force participation at the start
of family formation, for a large part of the female population. This model is
progressively replaced, in the post-industrial model, by a search for job stability
before marriage and childbearing (González et al 2000; Luxán et al. 2000). The need
for career consolidation (i.e. the work experience and the human capital accumulation
associated with it) and the importance of women’s contribution in setting-up a
household may be important factors in the delay in household and family formation.
In addition, the lack of social care services, discussed above, impose high opportunity
costs on household and family formation.
Public sector development has played, as in several other countries, an important role
in the increase in women’s employment participation rates. Jobs in the public sector
provide preferential opportunities for women. Women have more equal access to
these jobs, since they are based more on educational qualifications and less on work
experience. More importantly, these jobs are more compatible with household
obligations, as far as the number of hours worked and flextime availability and the
provision of easier access to maternity leave are concerned. The relatively late and
uneven development of the welfare state implies less participation of women
belonging to the older birth-cohorts analyzed, especially in higher professional
positions.
Based on the discussion above, one can expect the following inter cohort trends:
Hypothesis 6: The gender gap in education and in employment dynamics to
become narrower. However the trade-off between household obligations and work
career, has the consequence of more heterogeneity among women, since some still
follow the breadwinner pattern, some have a partial or precarious participation in
the labor market, and some others are able to get ‘core’ jobs.
Hypothesis 7: More equal roles and the democratization of power relationships
between genders may lead to more family instability and the emergence of diversity
(heterogeneity) in family/household forms.
8 This concerns for instance, the migration history and the choice of the place of residence, that may
16
3. Data
The data for our analysis comes from the Spanish Fertility and Family Survey (FFS),
which was conducted between November 1994 and February 1995 for the men’s
sample, and between June and October 1995 for the women’s sample. This survey
collected retrospective histories of partnership, births, employment and education for
4021 women and 1991 men aged between 18 and 49. The response rate was 84 per
cent for women and 77 per cent for men (Delgado and Castro Martin, 1999).
The data allowed us to construct occupational status histories for five-year birth-
cohorts, born between 1945 and 1974. We have based these histories on the socio-
structural class schema of Erikson and Goldthorpe (1993), that combines the positions
of individuals within the labor market and the employment relations they entail. Our
simplified application of the classification is based on two questions from the FFS.
The first concerns the profession of the individual in each job. This was an open
question that was coded by the institution that collected the data into only 29
categories. Since the content of each category was not specified, our reclassification is
somehow discretionary. A second question concerned the employment relations, and
comprised the categories: employer, self-employed, employee, family help,
cooperative, other. Individuals holding a job are then classified in five categories, that
can be identified by the most representative situation in their class: “unskilled
workers”, “skilled workers”, “small proprietors”, “non-manual employees”,
“professionals” [see Annex]. Our classification includes the situation of individuals
not holding a job at a given moment. However, the data do not distinguish between
the unemployed and individuals not in the labor force. In addition, we considered full-
time education enrolment. If an individual is simultaneously in full-time education
and in a job we considered him/her as employed. The criteria used to distinguish
between the categories “in education” and “having returned to education” is the
following: individuals that interrupted enrolment in education for a period longer than
8 months and then returned to education are classified as “returned to education”.
lead to a loss of work and other personal networks for women (Baizán, 1999).
17
The FFS survey provides more detailed information on the family status of
individuals. In our classification we consider the marital status, distinguishing
cohabitants, and we cross-tabulate these categories with those either having children
or not having children. After the separation of a consensual union, the individual is
included in the category “separated, divorced, widowed”. This last category mainly
includes individuals whose consensual union has been dissolved.
We considered the family dimension separately from the household dimension.
Residential status histories were thus constructed according to the following
categories: living “in the parental home”’, living “alone or with others” (not in the
parental home), “in own family” (as a parent), and “disrupted family”
(separated/divorced/widowed, living without children). The category of people living
with parents may include individuals who have already formed their own family. Our
data would allow us to create an additional category “living in own family in the
parental home” of the observed individual; however, it does not allow us to take into
account individuals living with in-laws. The category “living in own family” only
comprises people not living in the parental home. FFS does not allow us to distinguish
between individuals living alone and those living with others (related or unrelated).
These groups were put into one. We do not have direct information on the living
arrangements of people included in this category; so we compute it as a residual
category. An additional category was created for separated or divorced people who
were not living with children. Finally, it may be useful to state our definition of a
family, which is either a member of a couple, a parent with child(ren), or a couple
with child(ren). E.g. if after a divorce a father, classified as living in his own family,
keeps the custody of the children, he is still considered as “living in own family”, but
the partner is classified as “divorced without children” if she does not live with any of
their children.
The data were arranged as monthly sequences of states (Abbott, 1995; Rohwer and
Trappe, 1999). This approach provides a useful starting point to study the transition to
adulthood (Billari, forthcoming a). In particular, using a sequence representation
allows to easily measure heterogeneity of life courses and mobility within life courses

18
(Billari and Piccarreta, 2001; Billari, forthcoming b). For each individual we built
three vectors describing occupational, family and residential status, with each element
of the vector representing the status in a specific month. We started from the age of 15
and we ended at the exact age of 30 (a length of 180 months). Individuals belonging to
younger five-year cohorts were censored at the age at the interview of the youngest
individuals in that cohort.
4. Measures
To throw light on the hypotheses outlined in Section 2, we use sequence-type data to
compute some measures from the data. These measures aim to give a picture of how
the three trajectories are “packaged” within a cohort and how such packaging changes
across cohorts. Part of our analyses will consider the sequences at a given age (same
element of the vector across all cohorts), while other parts will consider the whole
vector (see also Billari, forthcoming a). Our analyses are based on the following
measures:
a) State distribution at a given age. In order to give a basic description for each month
(from 15 to 30 years of age), we calculate the distribution of individuals by state as a
function of age.
b) Entropy. This measures the heterogeneity of state distributions for each month, that
is, the heterogeneity within a population at a given age (Rohwer and Pötter, 1999).
Let tN denote the total number of individuals at time t, and tjp the proportion of tN
being in state j. Then, assuming states j = 1, …, q, the entropy is defined by
( )tj
q
jtjt ppE log
1∑
=
−=
with the convention that 0 log(0) = 0. It follows that 0 = tE = log(q). The entropy is
zero if all individuals are in the same state (minimum heterogeneity). It takes its
maximum value if the individuals are equally spread over the different states. We
calculated the entropy indicator for each time unit separately and then plotted this
indicator as a function of age.
19
c) Number of transitions. We compute the mean and standard error of the number of
state changes (events) in individual sequences.
d) Duration in a state. We compute the mean and the standard error of the number of
months spent by the individual in different states.
e) Number of episodes in each state. We compute the mean and the standard error of
the number of episodes of stay in each state.
5. Occupational trajectories
In figures 1 and 2, we show the educational/employment status distribution for the
birth cohorts 1945-49 to 1970-74. We immediately notice the extraordinary increase
in educational enrolment across cohorts, especially for women, and the negligible
numerical importance of people returning to education. The period spent in education,
which is clearly delimited by institutional constraints, has been prolonged
substantially. Nevertheless, the end of full-time education has remained an essentially
irreversible event, with very few individuals enrolled after the age of 25. The
impression of little coordination between education and employment is reinforced by
the high proportion (between 15 and 40 percent, according to age) of men in their
teens and early twenties unemployed or out of the labor force, even in older cohorts.
The impact of military service on men’s lives is visible around the age of 20.
For men, the most remarkable trend is the growth across cohorts in periods out of the
labor force or unemployed. These spells, reflect the difficulties in accessing a first job
and the gaps between jobs, and may also be a sign of more long-lasting exclusion
from the labor market. However, it is interesting to note that after the age of 25
approximately, the proportion out of the labor force or unemployed declines
substantially in all cohorts, suggesting that a large majority of individuals will have
found stable employment by that age. As a consequence of such inter-cohort trends,
work has a continuously diminishing centrality during early adult years. We may also
notice that the distribution by occupational class has changed, with a marked
reduction in the number of person-years spent in the formerly typical industrial and
agricultural manual occupations. There has also been a reduction in the progression

20
across age from apprenticeships (unskilled workers) to skilled jobs. Already from the
1955-59 birth cohort, non-manual occupations and self-employment have increased
their share of person-months.
Women’s occupational evolution is dominated by their rapid accession to the labor
market, and by the feedback of the family situation on their labor market careers.
Nevertheless, the proportion of women who are out of the labor force or unemployed
is always considerably higher than that of men, which indicates a much more difficult
integration into the job market. Unfortunately, it is not possible to distinguish between
the unemployed and housewives with FFS data. Nevertheless, we notice an important
decrease in paid work after the age of 22-23 for older birth-cohorts, connected with
their involvement as housewives and family formation. For birth-cohorts born since
the early 1960s, that retreat from paid work is no longer visible. There is a clear
increase with age in the proportion of women in work, suggesting that in younger
cohorts, Spanish women are more likely to consolidate their position in the labor
market before forming a family. That is, they increasingly try to get a certain degree of
independence and security before forming their own family (as for men). An
additional feature of labor force patterns is the strong gender segregation of
occupations, which seems to be reinforced across cohorts. On the one hand, women
are concentrated in service jobs (categories I-II and especially III), some of which
relate to expansion of welfare-state occupations (administration, education, health,
etc). On the other hand, the trend can also be related to the crises in some industries
(for instance, textiles) and agriculture. Educational expansion has meant more
“career” jobs, from which women were previously excluded. These are often more
stable and better paid (class I-II).
Entropy, a measure of heterogeneity within cohorts, provides a different perspective
on the trends in our education/occupational classification (figures 3 to 6). As expected
from our hypotheses, this measure shows that younger cohorts are increasingly more
heterogeneous (Hypotheses 1 and 2). A noticeable exception applies to the younger
years, where the increasingly universal enrolment in education has the effect of more
homogeneous behavior for young cohorts (Hypothesis 3). Longer periods out of the
labor force or unemployed and more time spent in education or in returns to education
seem to account for the increase in heterogeneity. This trend becomes clearer if the
21
distinction between the occupational categories is not taken into account, as in graphs
4 and 6. These last graphs also show important differences between men and women.
For the men, there is a sharp decline in heterogeneity after age 23 approximately, due
to the declining numbers in education and out of the labor force. While for women,
the levels of heterogeneity are kept high (and growing across birth-cohorts, from 1.0
to 1.4), as a decreasing but still important proportion of women do not enter the labor
market or abandon it to form a family. This is in accordance with our hypothesis 6,
that states that the trade-off between household obligations and the work career
becomes more acute through birth-cohorts, leading to an increase in heterogeneity
among women.
The description provided by the preceding results may give a false impression of
stability in the careers of young adults, since it does not give an account of the
changes made by the individuals between each of the categories across their life
course. To do so, we use measures that consider the whole sequence of states. This
type of analysis yields a considerable amount of data. After inspection of all the
results in these analyses (including previous sections), we have selected, for the
purpose of presentation, two birth-cohorts, 1950-54 and 1960-64. These cohorts can
be considered as the closest representatives in Spain of, respectively, a “Fordist” life
course, and the first post-industrial cohort with comparable results. For both cohorts,
we have survey data up to the age of 30.
As expected in our hypothesis 1, the results show a significant increase in the mean
number of states and in the number of transitions experienced by individuals across
cohorts, implying more discontinuity in their educational and occupational careers
(Table 1). For instance, the average number of transitions jumps from 2.8 to 3.8 for
men and from 2.4 to 3.1 for women. The increase in the standard deviations also
indicates that heterogeneity within a cohort has increased with respect to the number
of states and transitions experienced. These results give support to our hypothesis 1
which stated that the increased flexibility of the labor market should lead to a growth
in the heterogeneity of experiences and to an increase in discontinuity of work careers.
[ TABLE 1 ABOUT HERE ]
22
The most remarkable feature of the work careers of men is the increase across cohorts
of the length of time spent out of the labor force or unemployed, from 22 months in
1950-54 cohort to 32 months on average in the 1960-64 cohort (Table 2). This is
consistent with our expectations of a more difficult integration into the labor market
(Hypothesis 2). This probably also implies more episodes of unemployment and
shorter periods of employment, since the mean number of episodes of unemployment
or not in the labor market jumps from 1.22 to 1.74 (Table 4). This last trend can also
be observed for women, although to a lesser extent (1.64 to 1.82) (Table 5).
There is also some variation across cohorts in the duration spent in each type of job by
men. Manual occupations, especially skilled manual occupations (class V-VII) have
declined rapidly, whereas lower service jobs (class III) show an increase. There also
appear to be longer periods of self-employment, as can be expected in a post-
industrial economy. Nevertheless, this increase seems a little surprising, taking into
account that there probably still existed a certain proportion of farmers in the older
cohort.
The mean number of episodes experienced in each job category does not increase
evenly for all classes. It increases in non-manual occupations and for the self-
employed, but it decreases for manual jobs (Tables 4 and 5). This suggests that
precariousness has increased to a greater extent in the former professions. Again,
standard deviations generally increase substantially, suggesting a greater degree of
heterogeneity of individual experiences. Time spent in education has sharply
increased for both genders, although this increase is more remarkable for women.
Inter-cohort changes in duration of time spent in unemployment or not in the labor
force for women indicate a reduction for the younger cohort, consistent with the
increased participation in the labor market (Table 3). Given the importance of this
trend, it is not possible to distinguish any growth in periods of unemployment from
periods of withdrawal from the labor force.
On the whole, our findings are consistent with the hypothesized growth of instability
in working careers and with the increased difficulties of access to a stable job. Our

23
hypotheses emphasized that this situation would lead to an increasing growth of
heterogeneity of individual experiences through birth-cohorts, and to a postponement
of economic integration. These comments also apply to women, for whom the change
in their patterns of labor force participation has been simultaneous with the above
mentioned difficulties in accessing their economic autonomy.
[TABLES 2-5 ABOUT HERE]
6. Family trajectories
From state distributions (Figures 7 and 8), we can see that in all birth-cohorts few
people live in “unstable” or “post-nuclear” states (separated, divorced, consensual
unions, unmarried with children). However, there is a clear increase in periods spent
in such states across cohorts, in particular for those born in the 1960s. In older birth
cohorts, virtually all individuals followed the typical nuclear path, which includes a
relatively short period as married without children. From the mid-1950s birth cohorts,
there is a diversification of situations (Baizán et al. 2001). In particular, a growth in
cohabitation can be observed, a state presumably short-lived for most people.
Unexpectedly, more men than women are found in the states of cohabitant and
separated/divorced without children. This may be due to different perceptions and
willingness to disclose periods of cohabitation, according to gender, a result that in
itself indicates the still marginal status of such unions. This situation also has some
consequences for the categories “divorced/separated/widowed” with and without
children, that include separation after cohabitation.
On the whole, the results are in line with our hypothesis 5, in which only a limited
growth of heterogeneity of family forms was expected, due to normative and
economic constraints. However, in hypothesis 7 an increase in the instability and
diversity of household forms was expected, as a result of more equal roles between
genders and a change in their relationships. Such inconsistency suggests that the
constraints experienced by individuals seem to prevail over the forces driving the
diversification of family forms.
24
The graphs show the visible postponement of family formation for cohorts born in the
1960s and 1970s, which is consistent with hypothesis 4. Most individuals do not form
families in ways different from earlier cohorts, they essentially postpone family
formation, something that for an increasing minority may suppose to forego the
formation of a family of their own. Our interpretation of these trends has emphasized
the effect of structural constraints: the “familialistic” welfare state, the difficulties of
integration and the flexibilization of the labor market, and a normative context
(including family law) not favoring individual autonomy. Moreover, our paper has
also mentioned the changes in family relationships, in the sense of an increasing
democratization (which is not possible to visualize with our data). Therefore, the
continuity and adaptation of “traditional” family forms seem to prevail. The increasing
demands by younger generations for autonomy and security as pre-requisites for the
formation of their own families, clash with a context of ever-rising difficulties in
attaining them.
Our measures of the degree of heterogeneity (entropy) in family status according to
age show a picture consistent with previous comments: limited thought increasing
heterogeneity of life course across cohorts (Figures 9 and 10). The only exception is
teenagers, who all increasingly remain unmarried without children (in the parental
home), thus resulting in a virtually non-existent heterogeneity.
Let us now turn to the whole sequences. We can see that the total number of states and
transitions experienced by individuals remains quite stable across cohorts. For
instance, the number of transitions for the male birth-cohort 1950-54 was 1.59 and for
those born in 1960-64 was 1.40, while for women there was virtually no difference in
the number of transitions: 1.76 and 1.77, respectively for each cohort. One has to take
into account that these measures are affected by the postponement of family formation
transitions, and that we limit our measures to the ages between 15 and 30. That
postponement offsets the small growth in “unstable” or “post-nuclear” family forms,
as hypothesized above (Hypotheses 4 and 5). However, it is worthwhile noting that
the standard deviations of our measures do show the expected rise in diversity of
experiences, in practically all the categories examined (Tables 6 to 10).
25
[ TABLE 6 ABOUT HERE ]
The postponement of family formation is clearer for men, as shown by the increase in
the duration of the states “unmarried, no child” (from 128 months in the early 1950s
to 131 months in 1960-64) and the state “married without children” (13.7 and 14.4
respectively). Correspondingly, there was a decline in the time spent in marriage with
children, with an average duration of 32 months in the 1950-54 birth-cohort and 21
months in the 1960-64 birth-cohort. “Cohabitation” (3.6 and 6.2 months),
“divorce/separated/widowed” (1.1 and 3.1), and “unmarried with child” (0.3 and 0.9),
all show an increase across cohorts in their (short) duration. Women show similar
trends. However, the time spent as unmarried without children is rather stable between
birth-cohorts, reflecting the fact that a higher proportion of the 1960-64 cohort formed
a union early in their life course than in the 1950-54 birth cohort, thus spending a
longer duration in that state, and compensating for the postponement of that transition
by the other members of the cohort. The important relative increase in the duration of
time spent as divorced, separated or widowed with children (from 0.8 to 1.6 months)
for women, reflects the widespread norm according to which women receive custody
of children after the disruption of a union.
Finally, the average number of episodes in each state captures only in part the
instability of family life courses, since it heavily depends on the definition of the
states (for some, certain states cannot be revisited).
[ TABLES 7-10 ABOUT HERE ]
7. Residential trajectories
Very similar trends to those reflected by the family trajectories can be observed for the
residential career. They are also dominated by the impression of little diversification
and by the postponement of transitions. This is shown by the status distribution
figures (11 and 12), by the entropy measure (figures 13 and 14) and by the number of
transitions and states experienced by individuals (tables 11 to 15). The heterogeneity
is reduced across cohorts due to the fact that more and more young people stay at the
26
parental home for longer periods, with the corresponding reduction in the duration
spent in other states, especially for men.
In fact, the main reason for making a distinction between the family and the
residential trajectories is to show that the postponement of family formation has been
accompanied by a similar delay in leaving the parental home. As discussed in the
previous sections, this late departure from the parental home can be related to an array
of factors, including the high unemployment rate (for the younger birth-cohorts), the
structure of the labor market, the low support for independence provided by the state,
the family values stressing intergenerational solidarity and the gender system. Some of
these factors present some degree of continuity across birth-cohorts. This helps
explain the relatively high proportion of individuals in their twenties living with their
parents in all the birth-cohorts studied. Other factors have only appeared or reinforced
the late departure of younger birth-cohorts. Moreover, no increases in the status “alone
or with others”, as expected by the second demographic transition, can be found. In
fact the reversal is true, as the decrease in the period spent in this last household status
attest: from 14 months for men and 9 months for women in the 1950-54 cohort to 13
and 8 months respectively for the 1960-64 birth-cohort (Tables 12 and 13). This trend
is partially due to the importance, for older birth-cohorts, of long distance migration in
connection with job search, which means that a sizeable proportion of young people,
men in particular, left the parental home and formed their own households before
union formation (Baizán, 1999). The support found at the parental home for the
integration into adult life, and the corresponding long stay there, may be considered
essentially as a constant for the cohorts studied. However, the long period of
intergenerational co-residence can also be related to the important increases in the
time spent in the educational system and the growing need to accumulate resources
before forming an own household. As explained above, this can be done under the
most favorable conditions only by staying in the parental home. Finally, the state
“disrupted family” (divorced, separated or widowed individuals without children) is
still marginal, in spite of small increases through cohorts. The overall picture reflects
the limited diversification of household forms. Individuals may be confronted by
different challenges in each birth-cohort, but they respond by adopting the same living
arrangements. As expected in our hypotheses 4 and 5, economic and normative
27
constraints seem to constitute an effective check on the growth of heterogeneity across
cohorts.
[ TABLES 11-15 ABOUT HERE ]
8. Conclusions
In this paper, we have focused on the specific consequences of changes at the macro
level on the dynamics of young Spaniards’ life courses. We focused on the interplay
between global processes, such as markets liberalization and individualization, and on
the historically changing national system of actors and forces. Such interplay has
triggered peculiar responses, that bear some commonalities with other Southern
European countries.
As we have discussed, there are no fully “Fordist” birth-cohorts in the Spanish
context, given the late development of the economy and the welfare state. Here we
propose the 1950-54 cohort as the most representative, having enjoyed relatively
protected jobs and showing a highly “Parsonian” behavior. Cohorts born at the
beginning of the 1960s show some signs of a “post-industrial” life course. They
entered a highly flexible labor market, albeit still much regulated and dualistic, that
impinged on their capacity for economic integration. A majority of their members
could still count on intact and highly solidaristic parental families while waiting for
better chances for independent family life. The rearrangement of family and work
obligations between men and women they initiated could only be achieved very
partially and at a great personal and societal cost.
We have argued that state policies have strongly shaped the educational and work
trajectories, and have been directed towards the promotion of a specific type of family
- the patriarchal and nuclear family. While staying at the parental home may have
prevented poverty situations during young adulthood, it also goes hand in hand with
exclusion from employment and forming their own family. Support for the
breadwinning family head has meant a dependent younger generation with less
28
capacity to form any kind of household, especially individualistic types. Normative
and welfare arrangements partially contribute to preventing not only the
diversification of household forms, but of household formation ‘tout court.
Paradoxically, the very same nuclear family that is supposed to be protected becomes
attainable only much later for a large proportion of the new generations.
It may seem as if, at its origins, the Spanish welfare state was conceived for a world
where unemployment was only sporadic, where families had stable male providers,
and where the vulnerable were mainly the aged. Instead, the actual expansion of the
welfare state took place while the growing needs correspond to young people and
women who try to find hard-to-get and precarious jobs, the long-term unemployed and
dual-income households. The increasing risks of unemployment and flexibilization are
concentrated on young people and women, not only because they are the new entrants
in the labor market, but mainly because of their weaker position in the household
organization/social policy link. As we have seen, this has the consequence of delaying
the transition to adulthood.
Here we have seen that some of the developments sustaining current trends in life
course are in fact quite recent, and not part of a traditional past. Prolonged education,
especially for women, labor force insecurity, increased female participation in the
labor market and ‘latest late’ household formation by young adults. All have
developed during the last two or three decades, and can be considered as a response to
the specific circumstances and challenges encountered on the way to the
modernization of Spanish society. We can wonder what are the chances that the forces
sustaining these developments will continue in the future. Women’s attachment to the
labor market will probably continue, undermining power relationships in households
and in society. Concerns about labor market insecurity are present in the general
public demands as well as in the political agenda, although it is yet unclear if they can
lead to any reversal of the situation. Finally, the normative context and the values of
the public are changing rapidly, becoming an important force for change, especially
towards increased gender equality and the acceptance of diversity in family forms.
29
Annex
Equivalence between the class schema of Erikson and Goldthorpe and the professions
given by the FFS survey:
• Professionals, administrators, officials, higher grade technicians, managers and
supervisors (classes I + II): “Legislators and senior officials”, “Corporate managers”,
“General managers”, “Physicists/mathematicians/engineering professionals”, “Life
science professionals”, “Teaching professions”, “Other professionals”,
“Physicists/mathematicians/engineering associates”, “Life science associates”,
“Teaching associates”, “Other associates”.
• Routine non-manual employees (class III): “Office clerks”, “Customer
services”, “Personal services”, “Models, salespersons”, “Sales and services”; if the
individual is not “employer” or “self-employed”.
• Small proprietors, farmers and other self-employed workers (class IV):
“Market-oriented agriculture”, “Subsistence agriculture”, “Office clerks”, “Customer
services”, “Personal services”, “Models, salespersons”, “Sales and services”; and if
the individual is “employer” or “self-employed”.
• Lower grade technicians and skilled manual workers (class V+ VI):
“Extraction/building”, “Metal machinery”, “Precision/handicraft”, “Other crafts”; if
the individual is not “employer” or “self-employed”.
• Semi-skilled and unskilled manual workers, and agricultural workers (class
VII): “Stationary-plant operators”, “Machine operators”, ”Mobile-plant operators”,
“Agricultural laborers”, “Mining/construction”, “Basic sales and services
occupations”, “Armed forces”; if the individual is not “employer” or “self-employed”.
Acknowledgments
This paper was prepared within the framework of the POLIS (Political Economies and
Life Courses in Advanced Societies) network. We thank all the members of this
network, and especially Steffen Hilmert, Karl-Ulrich Mayer, and Gøsta Esping-
Andersen, for useful comments and advice. We also thank Arnstein Aassve for his
comments on a previous version of this paper, and Joe Vaughan and Susann Backer
for language editing. A presentation based on a preliminary analysis was given at the
Instituto Juan March, Madrid, in March 2000.

30
The authors wish to thank the Advisory Group of the Fertility and Family Surveys
(FFS) programme of comparative research for its permission granted under project
identification number 75to use the FFS data on which this paper is based. The views
expressed in this paper are attributable to the authors and do not necessarily reflect
those of the Max Planck Institute for Demographic Research.
References
Abbott, A, (1995). "Sequence analysis: New methods for old ideas". Annual Review of
Sociology, 21: 93-113.
Ahn, N. and Mira, P. (1999). "Job bust, baby bust: The Spanish case". Documento de
Trabajo 99-06, Madrid: FEDEA. www.fedea.es.
Alberdi, I. (1999). La nueva familia española. Madrid: Taurus.
Alvarez García, S. and Carrascal Arranz, U. (2000). "La reforma del IRPF y el
tratamiento de la familia: El coste de los hijos y su compensación mediante el
mínimo familiar". Estudios sobre la Economía Española, Madrid: FEDEA.
Arthur, B. W. (1994). Increasing returns and path dependency in the economy. Ann
Arbor, MI: University of Michigan Press.
Baizán, P. (1999). Changements dans les déterminants de la migration au long de la
trajectoire domestique des individus: application à l’Espagne. In: Tabutin, D.,
Gourbin, C., Masuy-Stroobant, G., and Schoumaker, B., editors. Théories,
paradigmes et courants explicatifs en démographie. Chaire Quetelet 1997, pp.
227-250. Louvain-la-Neuve: Academia-Bruylant/L’Harmattan.
Baizán, P. (2001). Transitions to adulthood in Spain. In: Corijn, M. and Klijzing, E.,
editors. Transitions to adulthood in Europe. European Studies of Population
series no. 10, pp. 279-312. Dordrecht: Kluwer Academic Publishers.
Baizán P., Aassve A. and Billari F.C. (2001). "Cohabitation, marriage, first birth: The
Interrelationship of Family Formation Events in Spain". Max-Planck Institute
for Demographic Research, Working Paper-2001-36.
31
Becker, G. (1981). A treatise on the family. Cambridge, Mass: Harvard University
Press.
Bentolila, S. and Dolado, J. (1994). "Spanish labor markets". Economic policy (Apr.).
55-99.
Billari, F.C. (forthcoming a). " The analysis of early life courses: complex descriptions
of the transition to adulthood ". Journal of Population Research.
Billari, F.C. (forthcoming b). "Sequence analysis in demographic research and
applications". Canadian Studies in Population.
Billari, F. C. and Piccarreta, R. (2001). "Studying demographic life courses as
sequences". mimeo.
Billari, F.C., Philipov, D., Baizán, P. (2001a). "Leaving Home in Europe: The
Experience of Cohorts Born Around 1960". International Journal of
Population Geography, 7.
Billari, F.C., Castiglioni, M., Castro Martín T. and Michielin, F. (2001b). "Transitions
to adulthood in a period of deep societal changes: A study of Spanish post-war
cohorts". mimeo.
Billari, F.C., Castiglioni, M., Castro Martín T. Michielin, F. and Ongaro, F.
(forthcoming). Household and union formation in a Mediterranean fashion:
Italy and Spain. In: Corijn M. and Klijzing, E., editors. Comparative research
on fertility and the family in contemporary Europe: findings and lessons. New
York/Geneva: United Nations.
Blossfeld, H.P. (1995). The new role of women: Family formation in modern
societies. Boulder, CO: Westview Press.
Boix, C. (1996). Partidos Políticos, Crecimiento e Igualdad. Madrid: Alianza
Editorial.
32
Bowles, S. (1998). "Endogenous preferences: The cultural consequences of markets
and other Economic institutions". Journal of Economic Literature, 36(1): 75-
111.
Bricall, J.M. (2000). Informe Universidad 2000. Conferencia de Rectores de las
Universidades Españolas. http://www.crue.upm.es/
Buchmann, M. (1989). The script of life in modern society. Entry into adulthood in a
changing world. Chicago: The University of Chicago Press.
Centro de Investigaciones Sociológicas (2000). Informe sobre la Juventud Española
2000. Madrid: Instituto de la Juventud. www.cis.es
Centro de Investigaciones Sociológicas (1994). "Dinámica intergeneracional en los
sistemas de valores de los españoles". Opiniones y Actitudes CIS, No. 9,
Madrid: CIS. www.cis.es.Commission of the European Communities (1994).
The major issues of European demography. Joint Report by Independent
Experts. Brussels: CEC.
Dalla Zuanna, G. (2001). "The banquet of Aeolus: A familialistic interpretation of
Italy’s lowest low fertility". Demographic Research, 4 (5). www.demographic-
research.org
Delgado, M. and Castro Martín T. (1999). Fertility and family surveys in the countries
of the ECE Region. Standard Country Report. Spain. New York and Geneva:
United Nations.
Durán, M.A. (1997). "El papel de las mujeres y hombres en la economía española".
Información Comercial Española, 760: 9-29.
Easterlin, R. (1980). Birth and fortune. New York: Basic Books.
Eriksson, R. and Goldthorpe, J.H. (1993). The constant flux: A study of class mobility
in industrial societies. Oxford: Clarendon Press.
Esping-Andersen, G. (1999). Social foundations of postindustrial economies. Oxford:
Oxford University Press.

33
Esping-Andersen, G. (1990). The three worlds of welfare capitalism. Cambridge:
Polity Press.
Eurostat (1996). Social portrait of Europe. Luxemburg: Office of the Official
Publications of the European Communities.
Eurydice (1996). Key data on education in the European Union. Luxembourg:
Commission of the European Communities.
Fahey, T. (1995). Full citizenship for the next generation. In: Healy, S. and Reynolds,
B., editors. Pp. 106-131. New frontiers for full citizenship. Dublin: CMRS.
Garrido, L.J. (1992). Las dos biografías de la mujer en España. Madrid: Ministerio de
Asuntos Sociales, Instituto de la Mujer.
Giddens, A. (1991). Modernity and self-identity: Self and society in the late modern
age. Cambridge: Polity Press.
Gimeno, J.A. (1993). Incidencia del Gasto Público por Niveles de Renta. In: Sector
Público y Redistribución, I Symposium sobre Igualdad y Distribución de la
Renta y la Riqueza. Madrid: Fundación Argentaria.
González, M.J., Jurado, T. and Naldini, M. (2000). Introduction: Interpreting the
transformation of gender inequalities in Southern Europe. In: González, M.J.,
Jurado, T. and Naldini, M., editors. Pp. 4-34. Gender inequalities in Southern
Europe. Women, work and welfare in the 1990s. London: Frank Cass.
Guerrero and Naldini (1996). "Is the South so different? Italian and Spanish families
in comparative perspective". Working paper AB I/no. 12. Mannheim:
Mannheimer Zentrum für Europäische Sozialforschung.
Gunther, R. (1996). "Spanish public policy: From dictatorship to democracy".
Estudio/Working Paper 1996/84. Madrid: Instituto Juan March.
Guillén, A. (1992). "Social policy in Spain: From dictatorship to democracy (1939-
1982)". In: Ferge Z. and Kolberg, J.E., editors. Social policy in a changing
Europe. Boulder, Co: Campus/Westview.

34
Hoem, J. (1986). "The impact of education in on modern family-union initiation".
European Journal of Population, 2:113-133.
Instituto Nacional de Estadística, 2001, Encuesta de población activa. Annual series:
Tempus. www.ine.es.
Jakee, K. and Guang-Zhen Sun (2001). "Adaptive preferences and welfare state
dynamics: A simple model". Max-Planck-Institute for Research into Economic
Systems (Jena, Germany). Papers on Economics and Evolution, 2.
Jimeno, J.F. and Toharia, L. (1994). Unemployment and Labor Market Flexibility:
Spain. Geneva: International Labor Organization.
Knudsen, K. and Waerness, K. (1999). "Reactions to global processes of change:
Attitudes toward gender roles and marriage in modern nations". Comparative
Social Research, 18: 161-195.
Künzler, J., Schulze, H-J. and van Hekken, S. (1999). "Welfare States and Normative
Orientations Toward Women’s Employment". Comparative Social Research,
18: 197-225.
Laparra, M. and Aguilar, M. (1997). Social exclusion and minimum income
programmes in Spain. In: Rhodes, M., editor. Southern European welfare
states. Between crises and reform. Pp. 87-114. London: Frank Cass.
Layte, R., Maitre, B., Nolan, B. and Whelan, C. (2000). "Explaining levels of
Deprivation In the European Union", European Panel Analysis Group
Working Paper 12, Institute of Social and Economic Research, University of
Essex.
Leal Maldonado, J. (1992). Informe para una nueva política de vivienda, Madrid:
Ministerio de Obras Públicas y Transporte.
Lobo, F. (1990). Irregular work in Spain. In: Underground economy and irregular
forms of employment. Final synthesis report, Brussels: Commission of the
European Communities.
35
Luxán, M., Miret, P. and Treviño, R. (2000). Is the male-provider model still in place?
Partnership formation in contemporary Spain. In: González, M.J., Jurado, T.
and Naldini, T., editors. Gender inequalities in Southern Europe, women, work
and welfare in the 1990s. Pp. 171-194. London: Frank Cass.
Maravall, J.M. and Fraile, M. (1998). "The politics of unemployment. The Spanish
experience in comparative perspective". Estudio/WorkingPaper 1998/124,
Madrid: Instituto Juan March.
Marí-Klose, M. and Nos Colom, A. (1999). Itinerarios vitales: educación, trabajo y
fecundidad de las mujeres. Opiniones y Actitudes no. 27, Madrid: Centro de
Investigaciones Sociológicas.
Marimon, R. and Zilibotti, F. (1996). "Actual versus virtual employment in Europe: Is
Spain different?". European University Institute Working Paper, ECO no.
96/21.
Martínez Alier, J. and Roca Jusmet, J. (1988). "Economía política del corporativismo
en el Estado español: Del franquismo al posfranquismo". Revista Española de
Investigaciones Sociológicas, 41: 25-62.
Martínez Veiga, U. (1999). Immigrants in the Spanish labor market. In: Baldwin-
Edwards, M., and Arango, J., editors. Immigrants and the informal economy in
Southern Europe. Pp. 105-128. London: Frank Cass.
Mayer, K. U. (2001). The paradox of global social change and national path
dependencies. Life course patterns in advanced societies. In: Woodward, A.
and Kohli, M., editors. Inclusions and exclusions in European societies. Pp.
89-110. New York: Routledge.
Mayer, K.U. (1997). Notes on a comparative political economy of life courses.
Comparative Social Research, 16: 203-226.
Micheli, G. (2000). "Kinship, family and social network: the anthropological
enbedement of fertility change in southern Europe". Demographic Research, 3
(13). www.demographic-research.org
36
Ministerio de Educación y Ciencia (1994). Estadísticas de la enseñanza en España,
niveles de preescolar, infantil, general básica y enseñanzas medias. Madrid:
MEC.
Myles, J. (1990). States, labour markets and life cycles. In: Friedland, R., and
Robertson, S., editors. Beyond the marketplace: Rethinking economy and
society. Pp. 271-298. New York: Aldine de Grueyter.
Navarro, V. (2000). Neoliberalismo y Estado del bienestar. Barcelona: Ariel Sociedad
Económica.
Oppenheimer, V.K. (1988). "A theory of marriage timing". American Journal of
Sociology, 94: 563-61.
Orloff, A.S. (1996). "Gender and the welfare state". Estudio/Working Paper 1996/79,
Madrid: Instituto Juan March.
Pfau-Effinger, B. (1999). "Change of family policies in the socio-cultural context of
European societies. Comparative Social Research, 18: 135-159.
Reher, D. S. (1998). "Family ties in Western Europe: persistent contrasts". Population
and Development Review, 24 (2): 203-234.
Rico, A. (1997). Regional decentralization and health care reform in Spain (1976-
1996). In: Rhodes, M., editor. Southern European Welfare States. Between
crises and reform. Pp. 115-134. London: Frank Cass.
Rindfuss, R. R. (1991). "The young adult years: diversity, structural change and
fertility". Demography, 28(4): 493-512.
Rodriguez Cabrero, G. (1994). La protección social a la familia. In: V Informe
sociológico sobre la situación de la familia en España. Madrid: Fundación
FOESSA.
Roussel, L. (1989). La famille incertaine. Paris: Odile Jacob.
37
Rohwer, G. and Pötter, U. (1999). TDA user’s manual. Ruhr-Universität Bochum,
Bochum. http://www.stat.ruhr-uni-bochum.de/.
Rohwer, G. and Trappe H. (1999). Possibilities and difficulties in life course
description. In: W. Voges, editor. Dynamic approaches to comparative social
research. Recent developments and applications. Pp. 146-167. Aldershot:
Avebury Publishers.
Saint-Paul, G. (2000). "Flexibility vs. Rigidity: Does Spain have the worst of both
Worlds?" IZA (Institute for the Study of Labor, Bonn). Discussion Paper no.
144.
Sarasa, S. and Moreno, L. (1995). El estado del bienestar en la Europa del sur.
Madrid: Consejo Superior de Investigaciones Científicas.
Saraceno, C. (1996). "Family change, family policies and the restructuration of
welfare". Paper presented to the OECD conference "Beyond 2000: The New
Social Policy Agenda". Paris: OECD.
Serrano Secanella, P. (1997). La vivienda como determinante de la emancipación
juvenil. In: Vergés Escuín, R., editor. La edad de emancipación de los
jóvenes. Pp. 91-98. Barcelona: Centre de cultura contemporània de Barcelona.
Simó, C., Golsch, K. and Steinhage, N. (2000). "Entry into first parenthood in Spain
and the process of globalization". Globalife Project Working Paper, Faculty of
Sociology, University of Bielefeld.
Treas, J. and Widmer, E.D. (2000). "Married women’s Employment over the life
course: Attitudes in cross-national perspective". Social Forces, 78 (4): 1409-
1436.
Valiente, C. (1993). Políticas públicas para la mujer trabajadora en Italia y España.
1900-1991. PhD thesis, Programa de Doctorado de Ciencia Política,
Sociología y Antropología Social de la Universidad Autónoma de Madrid.
Van de Kaa, D. J. (1987). "Options and sequences Europe’s demographic patterns".
Nethur-Demography Paper No. 39. Amsterdam: Universiteit van Amsterdam.
38
Wall, R. (1995). Historical development of the household in Europe. In: van Imhoff,
E., Kuijsten, A. and van Wissen, L., editors. Household demography and
household modeling. Pp. 19-52. New York and London: Plenum Press.
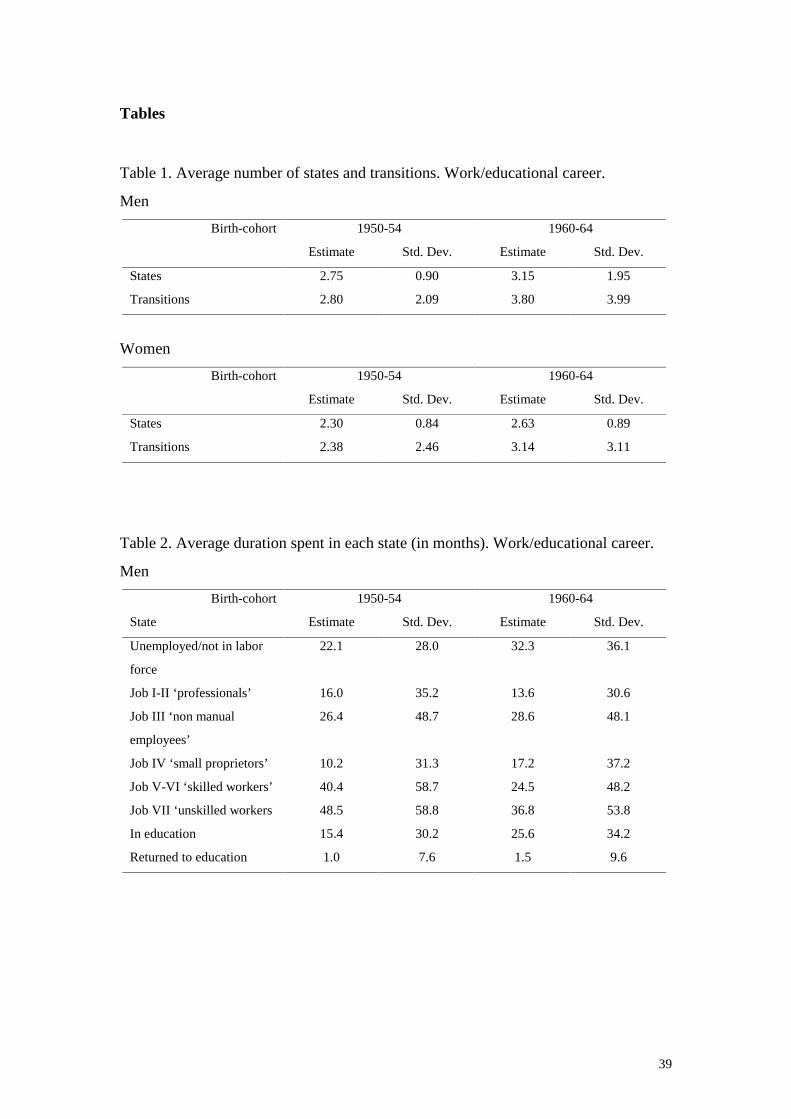
39
Tables
Table 1. Average number of states and transitions. Work/educational career.
Men
1950-54 1960-64Birth-cohort
Estimate Std. Dev. Estimate Std. Dev.
States 2.75 0.90 3.15 1.95
Transitions 2.80 2.09 3.80 3.99
Women
1950-54 1960-64Birth-cohort
Estimate Std. Dev. Estimate Std. Dev.
States 2.30 0.84 2.63 0.89
Transitions 2.38 2.46 3.14 3.11
Table 2. Average duration spent in each state (in months). Work/educational career.
Men
1950-54 1960-64Birth-cohort
State Estimate Std. Dev. Estimate Std. Dev.
Unemployed/not in labor
force
22.1 28.0 32.3 36.1
Job I-II ‘professionals’ 16.0 35.2 13.6 30.6
Job III ‘non manual
employees’
26.4 48.7 28.6 48.1
Job IV ‘small proprietors’ 10.2 31.3 17.2 37.2
Job V-VI ‘skilled workers’ 40.4 58.7 24.5 48.2
Job VII ‘unskilled workers 48.5 58.8 36.8 53.8
In education 15.4 30.2 25.6 34.2
Returned to education 1.0 7.6 1.5 9.6
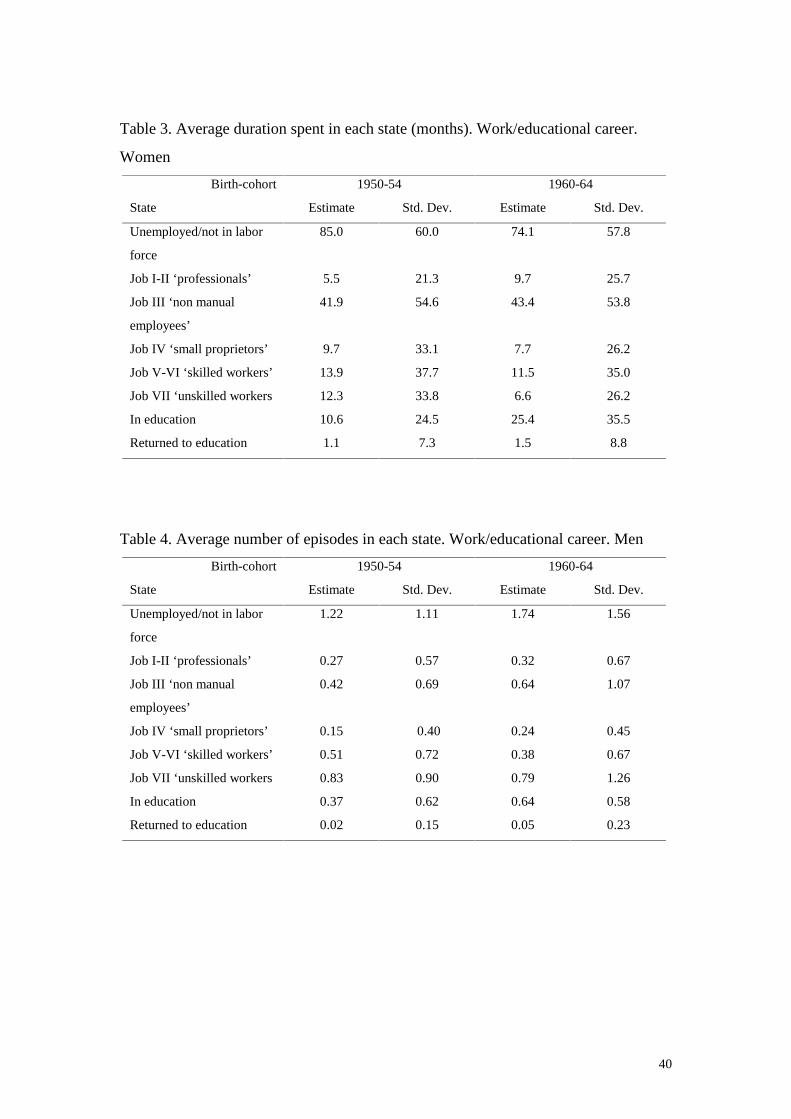
40
Table 3. Average duration spent in each state (months). Work/educational career.
Women
1950-54 1960-64Birth-cohort
State Estimate Std. Dev. Estimate Std. Dev.
Unemployed/not in labor
force
85.0 60.0 74.1 57.8
Job I-II ‘professionals’ 5.5 21.3 9.7 25.7
Job III ‘non manual
employees’
41.9 54.6 43.4 53.8
Job IV ‘small proprietors’ 9.7 33.1 7.7 26.2
Job V-VI ‘skilled workers’ 13.9 37.7 11.5 35.0
Job VII ‘unskilled workers 12.3 33.8 6.6 26.2
In education 10.6 24.5 25.4 35.5
Returned to education 1.1 7.3 1.5 8.8
Table 4. Average number of episodes in each state. Work/educational career. Men
1950-54 1960-64Birth-cohort
State Estimate Std. Dev. Estimate Std. Dev.
Unemployed/not in labor
force
1.22 1.11 1.74 1.56
Job I-II ‘professionals’ 0.27 0.57 0.32 0.67
Job III ‘non manual
employees’
0.42 0.69 0.64 1.07
Job IV ‘small proprietors’ 0.15 0.40 0.24 0.45
Job V-VI ‘skilled workers’ 0.51 0.72 0.38 0.67
Job VII ‘unskilled workers 0.83 0.90 0.79 1.26
In education 0.37 0.62 0.64 0.58
Returned to education 0.02 0.15 0.05 0.23
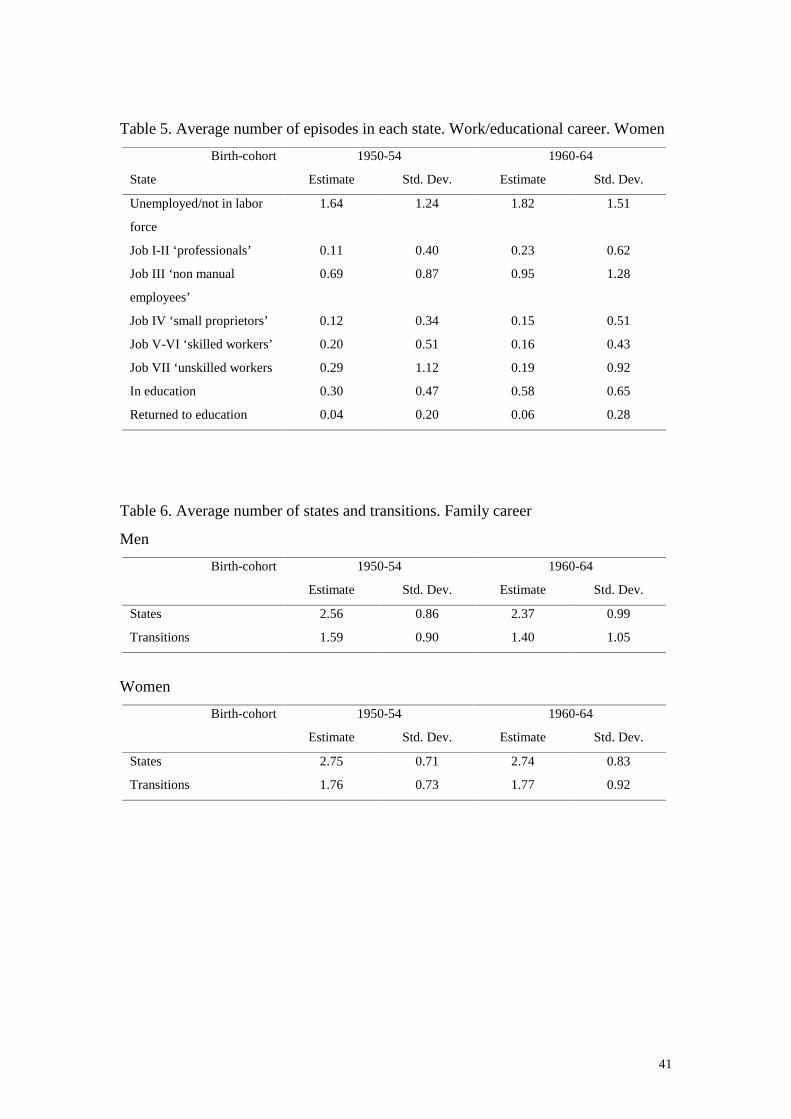
41
Table 5. Average number of episodes in each state. Work/educational career. Women
1950-54 1960-64Birth-cohort
State Estimate Std. Dev. Estimate Std. Dev.
Unemployed/not in labor
force
1.64 1.24 1.82 1.51
Job I-II ‘professionals’ 0.11 0.40 0.23 0.62
Job III ‘non manual
employees’
0.69 0.87 0.95 1.28
Job IV ‘small proprietors’ 0.12 0.34 0.15 0.51
Job V-VI ‘skilled workers’ 0.20 0.51 0.16 0.43
Job VII ‘unskilled workers 0.29 1.12 0.19 0.92
In education 0.30 0.47 0.58 0.65
Returned to education 0.04 0.20 0.06 0.28
Table 6. Average number of states and transitions. Family career
Men
1950-54 1960-64Birth-cohort
Estimate Std. Dev. Estimate Std. Dev.
States 2.56 0.86 2.37 0.99
Transitions 1.59 0.90 1.40 1.05
Women
1950-54 1960-64Birth-cohort
Estimate Std. Dev. Estimate Std. Dev.
States 2.75 0.71 2.74 0.83
Transitions 1.76 0.73 1.77 0.92

42
Table 7. Average duration spent in each state (months). Family career. Men
1950-54 1960-64Birth-cohort
State Estimate Std. Dev. Estimate Std. Dev.
Unmarried no children 127.6 37.2 131.3 43.4
Married no children 13.7 16.5 14.4 19.4
Cohabiting no ch. 3.6 14.9 6.2 17.9
Div./sep./wid. no ch. 1.1 7.9 3.1 14.1
Unmarried with ch. 0.3 3.7 0.9 8.1
Married with children 32.0 31.2 21.1 33.1
Cohabiting with ch. 1.0 7.4 2.3 13.4
Div./sep./wid. with ch. 0.6 4.6 0.7 7.2
Table 8. Average duration spent in each state (in months). Family career. Women
1950-54 1960-64Birth-cohort
State Estimate Std. Dev. Estimate Std. Dev.
Unmarried no children 105.9 39.8 103.1 47.3
Married no children 17.2 18.6 20.4 22.1
Cohabiting no ch. 1.4 9.4 3.5 14.1
Div./sep./wid. no ch. 0.5 5.7 0.8 6.5
Unmarried with ch. 0.6 6.3 1.3 10.1
Married with children 52.7 39.1 47.9 46.5
Cohabiting with ch. 1.0 9.1 1.4 8.8
Div./sep./wid. with ch. 0.8 7.0 1.6 9.9

43
Table 9. Average number of episodes in each state. Family career. Men
1950-54 1960-64Birth-cohort
State Estimate Std. Dev. Estimate Std. Dev.
Unmarried no children 1.00 0.00 0.99 0.07
Married no children 0.74 0.44 0.59 0.49
Cohabiting no ch. 0.10 0.34 0.21 0.48
Div./sep./wid. no ch. 0.04 0.23 0.08 0.30
Unmarried with ch. 0.02 0.15 0.02 0.15
Married with children 0.65 0.48 0.43 0.50
Cohabiting with ch. 0.02 0.14 0.04 0.20
Div./sep./wid. with ch. 0.02 0.15 0.02 0.14
Table 10. Average number of episodes in each state. Family career. Women
1950-54 1960-64Birth-cohort
State Estimate Std. Dev. Estimate Std. Dev.
Unmarried no children 1.00 0.00 0.99 0.07
Married no children 0.85 0.36 0.81 0.40
Cohabiting no ch. 0.04 0.21 0.12 0.36
Div./sep./wid. no ch. 0.02 0.14 0.03 0.19
Unmarried with ch. 0.01 0.12 0.03 0.18
Married with children 0.79 0.41 0.70 0.46
Cohabiting with ch. 0.02 0.16 0.04 0.22
Div./sep./wid. with ch. 0.02 0.16 0.05 0.24

44
Table 11. Average number of states and transitions. Household career
Men
1950-54 1960-64Birth-cohort
Estimate Std. Dev. Estimate Std. Dev.
States 1.95 0.64 1.92 0.72
Transitions 0.97 0.68 0.96 1.81
Women
1950-54 1960-64Birth-cohort
Estimate Std. Dev. Estimate Std. Dev.
States 1.98 0.52 1.98 0.54
Transitions 0.99 0.57 1.00 0.61
Table 12. Average duration spent in each state (months). Household career. Men
1950-54 1960-64Birth-cohort
State Estimate Std. Dev. Estimate Std. Dev.
Parental home 118.3 49.3 125.0 50.9
Alone/others 14.0 34.3 12.6 32.8
Own family 46.6 36.3 40.2 39.1
Disrupted family 1.0 6.0 2.2 11.1
Table 13. Average duration spent in each state (months). Household career. Women
1950-54 1960-64Birth-cohort
State Estimate Std. Dev. Estimate Std. Dev.
Parental home 100.7 47.2 101.4 50.8
Alone/others 9.1 26.7 7.8 24.2
Own family 69.6 42.1 70.1 47.1
Disrupted family 0.6 6.8 0.7 5.9
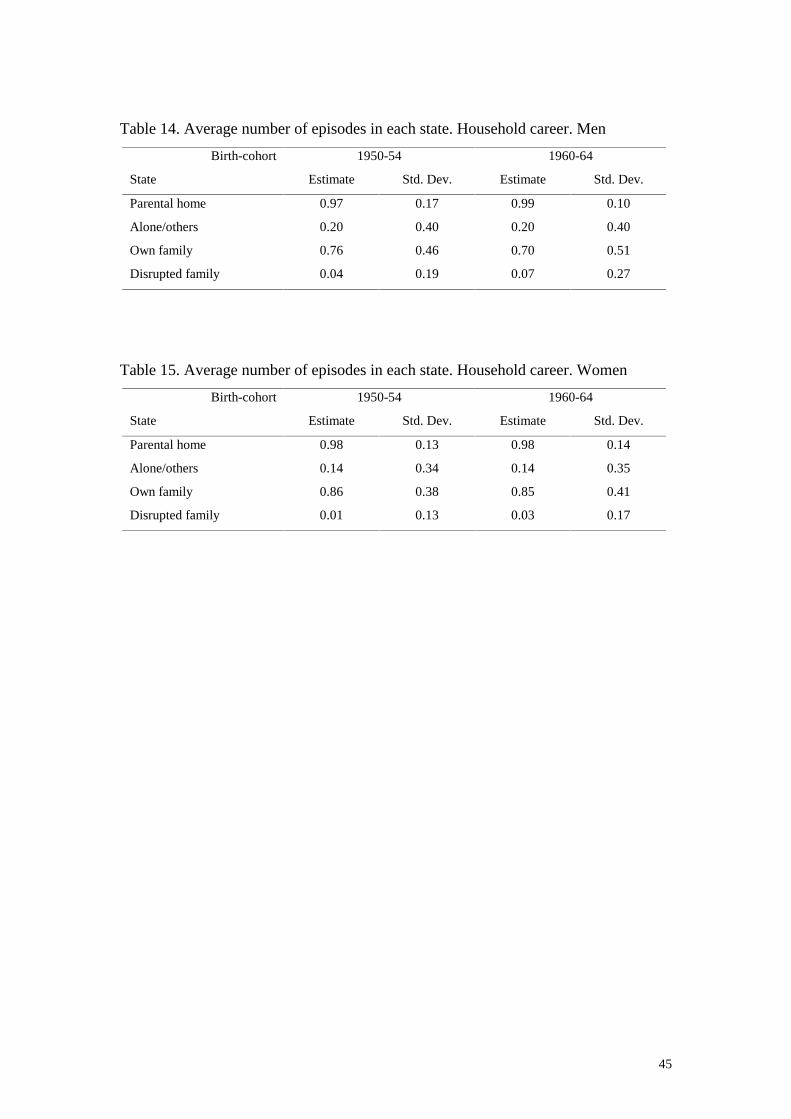
45
Table 14. Average number of episodes in each state. Household career. Men
1950-54 1960-64Birth-cohort
State Estimate Std. Dev. Estimate Std. Dev.
Parental home 0.97 0.17 0.99 0.10
Alone/others 0.20 0.40 0.20 0.40
Own family 0.76 0.46 0.70 0.51
Disrupted family 0.04 0.19 0.07 0.27
Table 15. Average number of episodes in each state. Household career. Women
1950-54 1960-64Birth-cohort
State Estimate Std. Dev. Estimate Std. Dev.
Parental home 0.98 0.13 0.98 0.14
Alone/others 0.14 0.34 0.14 0.35
Own family 0.86 0.38 0.85 0.41
Disrupted family 0.01 0.13 0.03 0.17
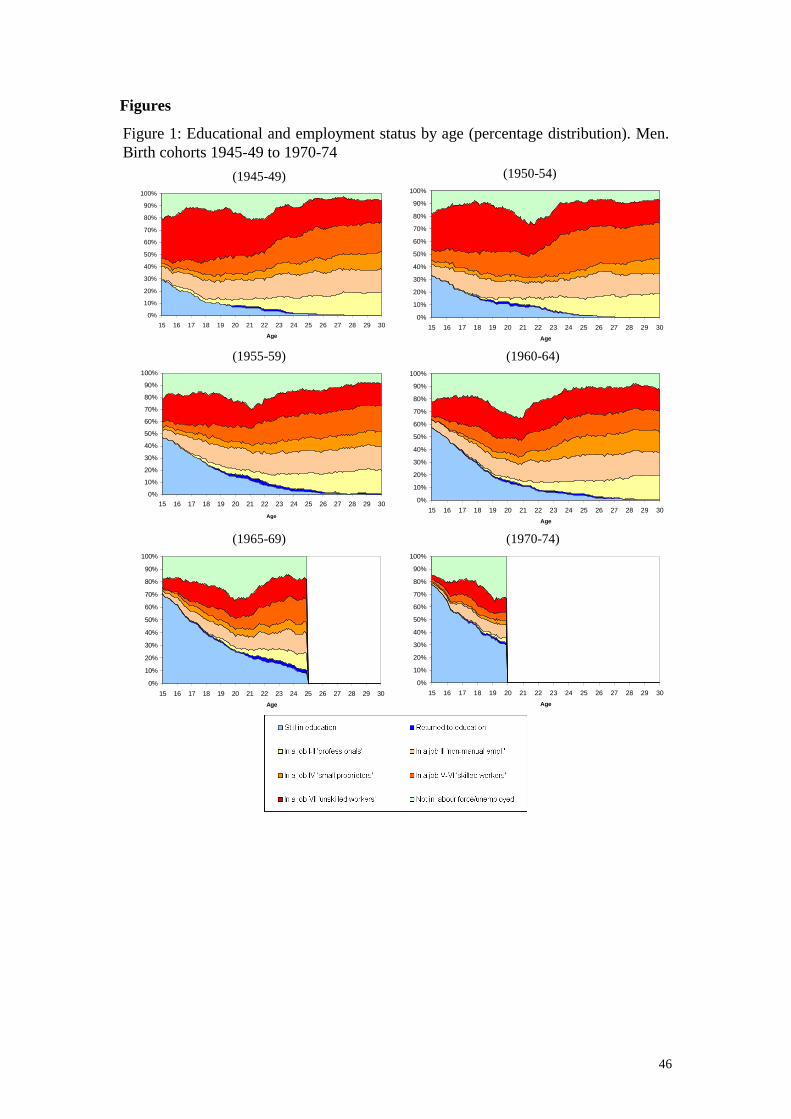
46
Figures
Figure 1: Educational and employment status by age (percentage distribution). Men.Birth cohorts 1945-49 to 1970-74
(1945-49)
0%
10%
20%
30%
40%
50%
60%
70%
80%
90%
100%
15 16 17 18 19 20 21 22 23 24 25 26 27 28 29 30
Age
(1950-54)
0%
10%
20%
30%
40%
50%
60%
70%
80%
90%
100%
15 16 17 18 19 20 21 22 23 24 25 26 27 28 29 30
Age
(1955-59)
0%
10%
20%
30%
40%
50%
60%
70%
80%
90%
100%
15 16 17 18 19 20 21 22 23 24 25 26 27 28 29 30
Age
(1960-64)
0%
10%
20%
30%
40%
50%
60%
70%
80%
90%
100%
15 16 17 18 19 20 21 22 23 24 25 26 27 28 29 30
Age
(1965-69)
0%
10%
20%
30%
40%
50%
60%
70%
80%
90%
100%
15 16 17 18 19 20 21 22 23 24 25 26 27 28 29 30
Age
(1970-74)
0%
10%
20%
30%
40%
50%
60%
70%
80%
90%
100%
15 16 17 18 19 20 21 22 23 24 25 26 27 28 29 30
Age
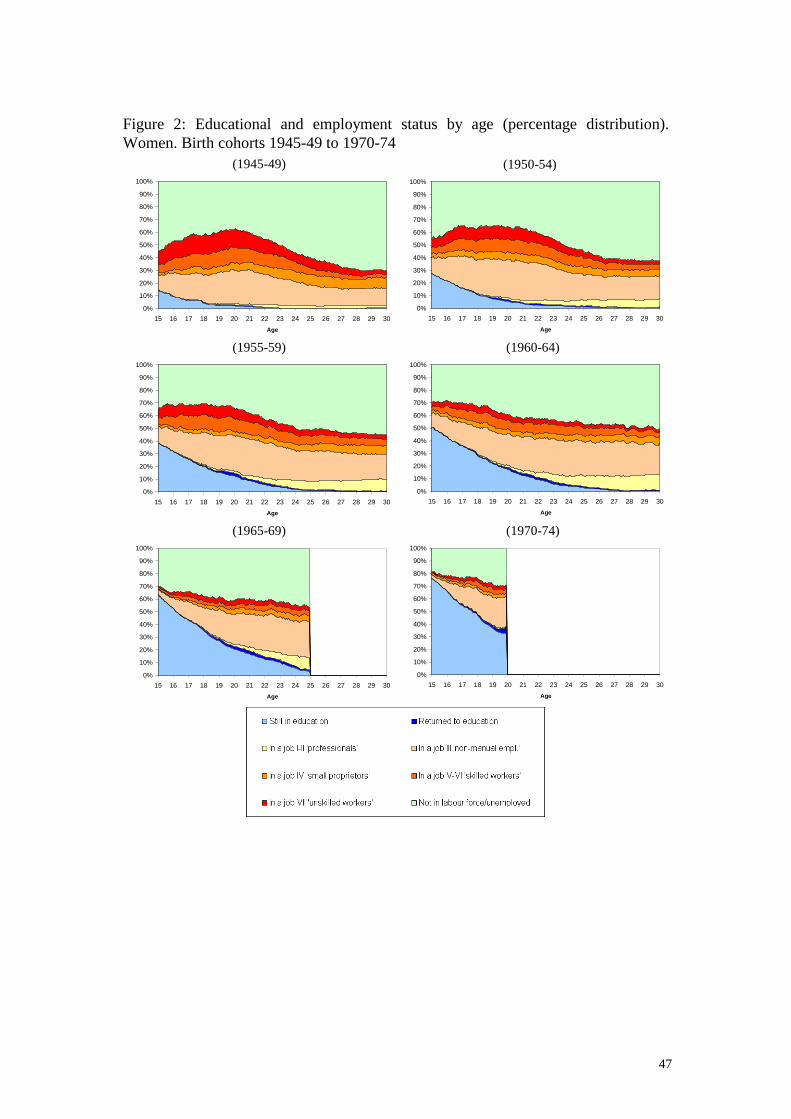
47
Figure 2: Educational and employment status by age (percentage distribution).Women. Birth cohorts 1945-49 to 1970-74
(1945-49)
0%
10%
20%
30%
40%
50%
60%
70%
80%
90%
100%
15 16 17 18 19 20 21 22 23 24 25 26 27 28 29 30
Age
(1950-54)
0%
10%
20%
30%
40%
50%
60%
70%
80%
90%
100%
15 16 17 18 19 20 21 22 23 24 25 26 27 28 29 30
Age
(1955-59)
0%
10%
20%
30%
40%
50%
60%
70%
80%
90%
100%
15 16 17 18 19 20 21 22 23 24 25 26 27 28 29 30
Age
(1960-64)
0%
10%
20%
30%
40%
50%
60%
70%
80%
90%
100%
15 16 17 18 19 20 21 22 23 24 25 26 27 28 29 30
Age
(1965-69)
0%
10%
20%
30%
40%
50%
60%
70%
80%
90%
100%
15 16 17 18 19 20 21 22 23 24 25 26 27 28 29 30
Age
(1970-74)
0%
10%
20%
30%
40%
50%
60%
70%
80%
90%
100%
15 16 17 18 19 20 21 22 23 24 25 26 27 28 29 30
Age

48
Figure 3: Entropy measure for educational/employment status. Men.
0.0
0.2
0.4
0.6
0.8
1.0
1.2
1.4
1.6
1.8
2.0
2.2
15 16 17 18 19 20 21 22 23 24 25 26 27 28 29
Cohort 45-49Cohort 50-54Cohort 55-59Cohort 60-64Cohort 65-69Cohort 70-74
Figure 4: Entropy measure for educational/employment status (without distinguishing
occupational categories). Men.
0.0
0.2
0.4
0.6
0.8
1.0
1.2
1.4
15 16 17 18 19 20 21 22 23 24 25 26 27 28 29
Cohort 45-49Cohort 50-54Cohort 55-59Cohort 60-64Cohort 65-69Cohort 70-74
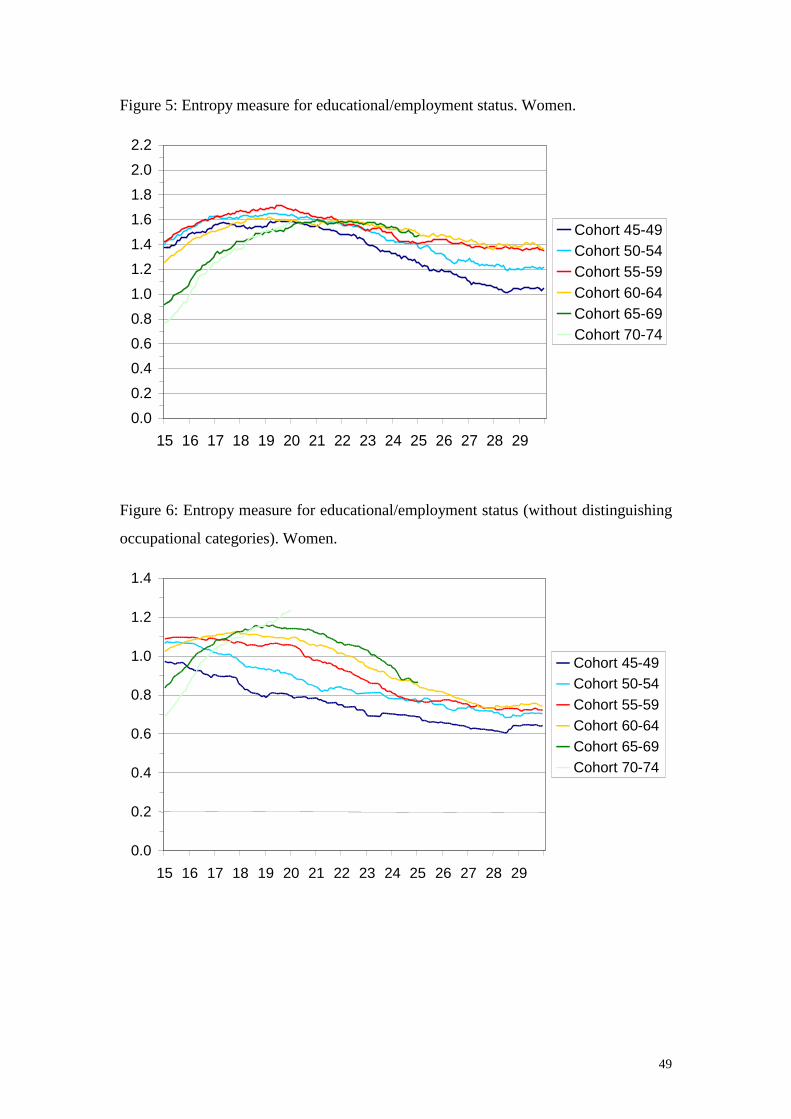
49
Figure 5: Entropy measure for educational/employment status. Women.
0.0
0.2
0.4
0.6
0.8
1.0
1.2
1.4
1.6
1.8
2.0
2.2
15 16 17 18 19 20 21 22 23 24 25 26 27 28 29
Cohort 45-49Cohort 50-54Cohort 55-59Cohort 60-64Cohort 65-69Cohort 70-74
Figure 6: Entropy measure for educational/employment status (without distinguishing
occupational categories). Women.
0.0
0.2
0.4
0.6
0.8
1.0
1.2
1.4
15 16 17 18 19 20 21 22 23 24 25 26 27 28 29
Cohort 45-49Cohort 50-54Cohort 55-59Cohort 60-64Cohort 65-69Cohort 70-74
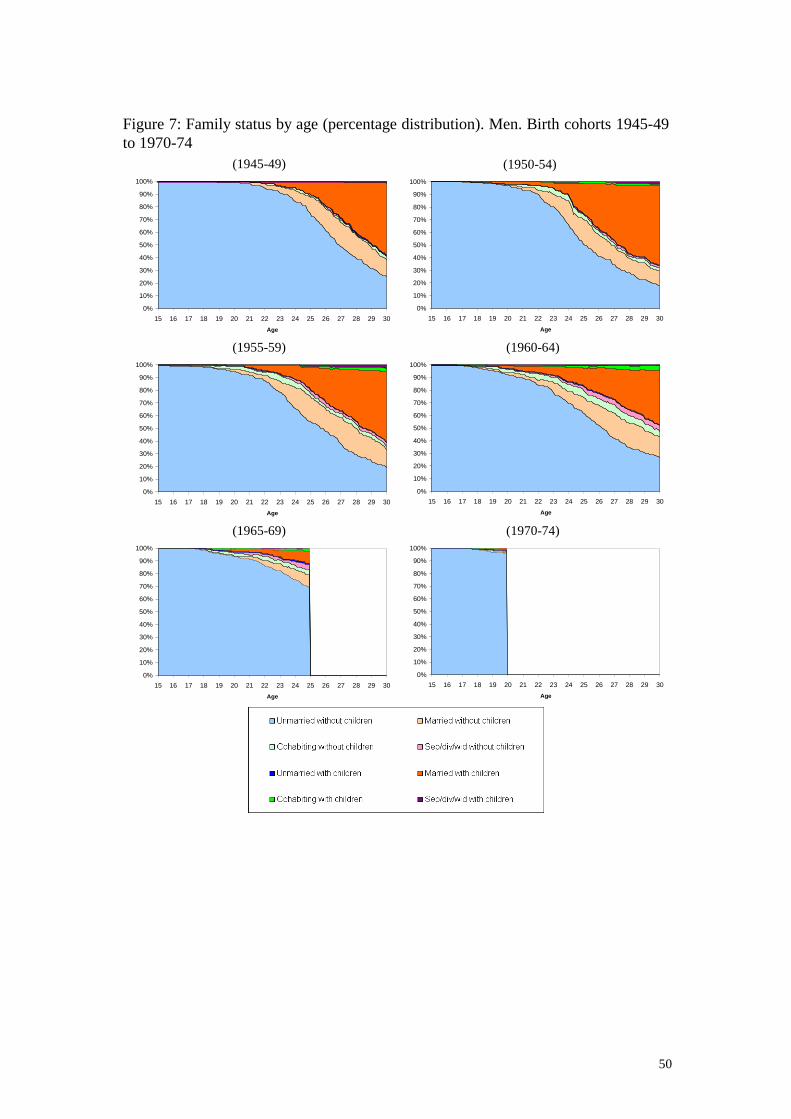
50
Figure 7: Family status by age (percentage distribution). Men. Birth cohorts 1945-49to 1970-74
(1945-49)
0%
10%
20%
30%
40%
50%
60%
70%
80%
90%
100%
15 16 17 18 19 20 21 22 23 24 25 26 27 28 29 30
Age
(1950-54)
0%
10%
20%
30%
40%
50%
60%
70%
80%
90%
100%
15 16 17 18 19 20 21 22 23 24 25 26 27 28 29 30
Age
(1955-59)
0%
10%
20%
30%
40%
50%
60%
70%
80%
90%
100%
15 16 17 18 19 20 21 22 23 24 25 26 27 28 29 30
Age
(1960-64)
0%
10%
20%
30%
40%
50%
60%
70%
80%
90%
100%
15 16 17 18 19 20 21 22 23 24 25 26 27 28 29 30
Age
(1965-69)
0%
10%
20%
30%
40%
50%
60%
70%
80%
90%
100%
15 16 17 18 19 20 21 22 23 24 25 26 27 28 29 30
Age
(1970-74)
0%
10%
20%
30%
40%
50%
60%
70%
80%
90%
100%
15 16 17 18 19 20 21 22 23 24 25 26 27 28 29 30
Age

51
Figure 8: Family status by age (percentage distribution). Women. Birth cohorts 1945-49 to 1970-74
(1945-49)
0%
10%
20%
30%
40%
50%
60%
70%
80%
90%
100%
15 16 17 18 19 20 21 22 23 24 25 26 27 28 29 30
Age
(1950-54)
0%
10%
20%
30%
40%
50%
60%
70%
80%
90%
100%
15 16 17 18 19 20 21 22 23 24 25 26 27 28 29 30
Age
(1955-59)
0%
10%
20%
30%
40%
50%
60%
70%
80%
90%
100%
15 16 17 18 19 20 21 22 23 24 25 26 27 28 29 30
Age
(1960-64)
0%
10%
20%
30%
40%
50%
60%
70%
80%
90%
100%
15 16 17 18 19 20 21 22 23 24 25 26 27 28 29 30
Age
(1965-69)
0%
10%
20%
30%
40%
50%
60%
70%
80%
90%
100%
15 16 17 18 19 20 21 22 23 24 25 26 27 28 29 30
Age
(1970-74)
0%
10%
20%
30%
40%
50%
60%
70%
80%
90%
100%
15 16 17 18 19 20 21 22 23 24 25 26 27 28 29 30
Age
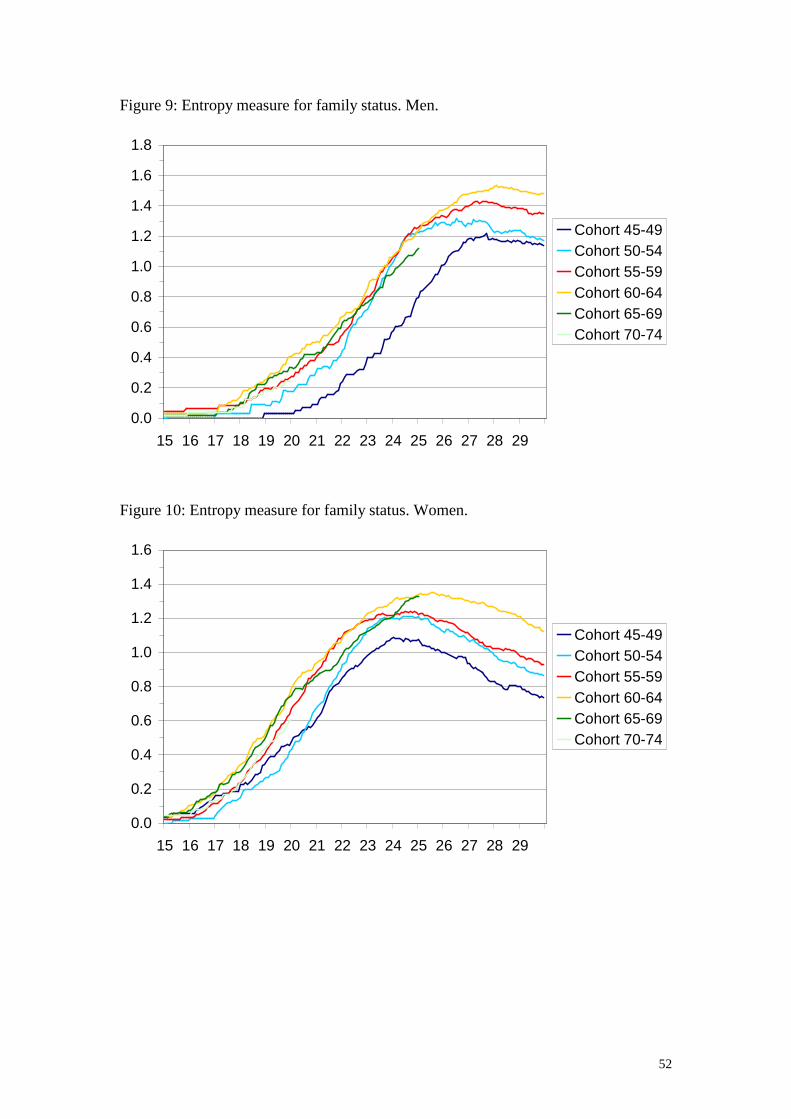
52
Figure 9: Entropy measure for family status. Men.
0.0
0.2
0.4
0.6
0.8
1.0
1.2
1.4
1.6
1.8
15 16 17 18 19 20 21 22 23 24 25 26 27 28 29
Cohort 45-49Cohort 50-54Cohort 55-59Cohort 60-64Cohort 65-69Cohort 70-74
Figure 10: Entropy measure for family status. Women.
0.0
0.2
0.4
0.6
0.8
1.0
1.2
1.4
1.6
15 16 17 18 19 20 21 22 23 24 25 26 27 28 29
Cohort 45-49Cohort 50-54Cohort 55-59Cohort 60-64Cohort 65-69Cohort 70-74
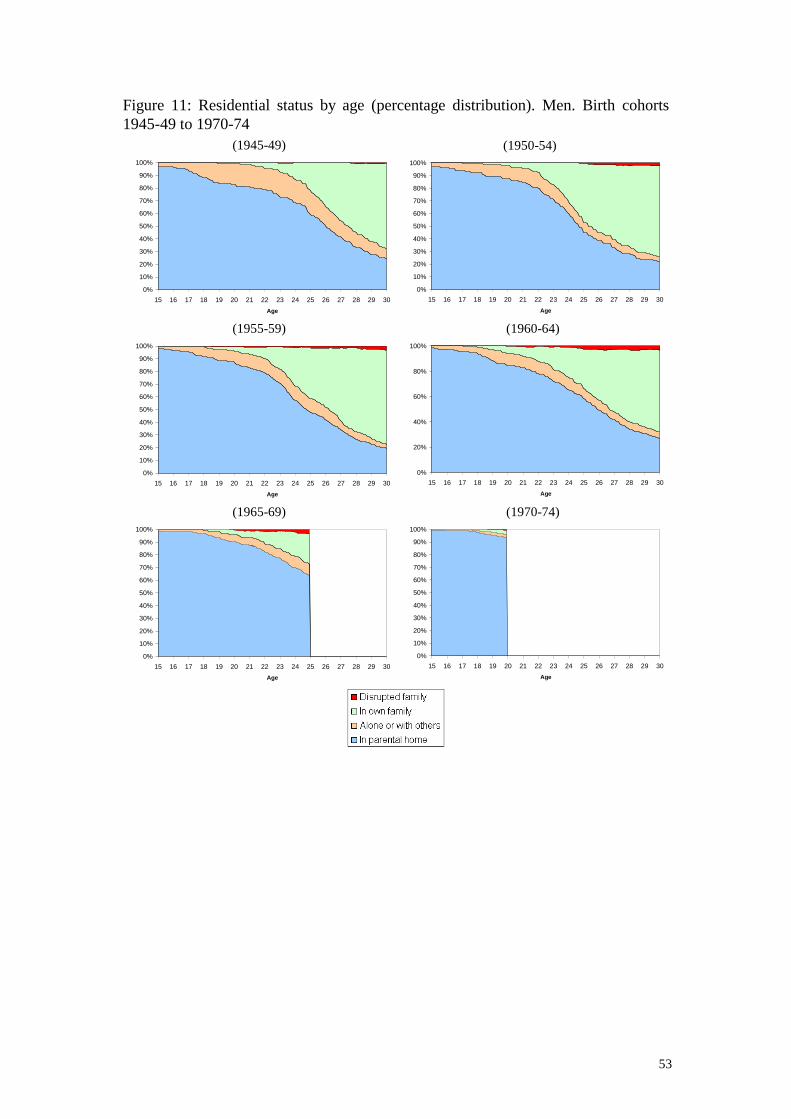
53
Figure 11: Residential status by age (percentage distribution). Men. Birth cohorts1945-49 to 1970-74
(1945-49)
0%
10%
20%
30%
40%
50%
60%
70%
80%
90%
100%
15 16 17 18 19 20 21 22 23 24 25 26 27 28 29 30
Age
(1950-54)
0%
10%
20%
30%
40%
50%
60%
70%
80%
90%
100%
15 16 17 18 19 20 21 22 23 24 25 26 27 28 29 30
Age
(1955-59)
0%
10%
20%
30%
40%
50%
60%
70%
80%
90%
100%
15 16 17 18 19 20 21 22 23 24 25 26 27 28 29 30
Age
(1960-64)
0%
20%
40%
60%
80%
100%
15 16 17 18 19 20 21 22 23 24 25 26 27 28 29 30
Age
(1965-69)
0%
10%
20%
30%
40%
50%
60%
70%
80%
90%
100%
15 16 17 18 19 20 21 22 23 24 25 26 27 28 29 30
Age
(1970-74)
0%
10%
20%
30%
40%
50%
60%
70%
80%
90%
100%
15 16 17 18 19 20 21 22 23 24 25 26 27 28 29 30
Age
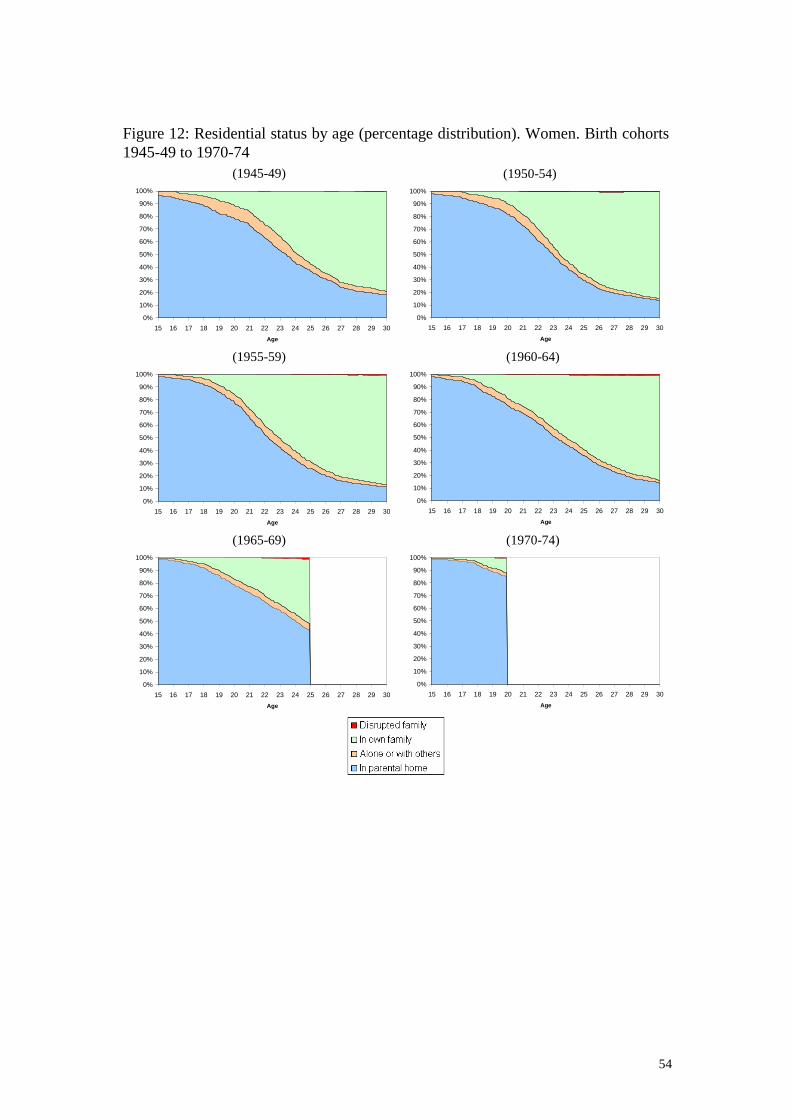
54
Figure 12: Residential status by age (percentage distribution). Women. Birth cohorts1945-49 to 1970-74
(1945-49)
0%
10%
20%
30%
40%
50%
60%
70%
80%
90%
100%
15 16 17 18 19 20 21 22 23 24 25 26 27 28 29 30
Age
(1950-54)
0%
10%
20%
30%
40%
50%
60%
70%
80%
90%
100%
15 16 17 18 19 20 21 22 23 24 25 26 27 28 29 30
Age
(1955-59)
0%
10%
20%
30%
40%
50%
60%
70%
80%
90%
100%
15 16 17 18 19 20 21 22 23 24 25 26 27 28 29 30
Age
(1960-64)
0%
10%
20%
30%
40%
50%
60%
70%
80%
90%
100%
15 16 17 18 19 20 21 22 23 24 25 26 27 28 29 30
Age
(1965-69)
0%
10%
20%
30%
40%
50%
60%
70%
80%
90%
100%
15 16 17 18 19 20 21 22 23 24 25 26 27 28 29 30
Age
(1970-74)
0%
10%
20%
30%
40%
50%
60%
70%
80%
90%
100%
15 16 17 18 19 20 21 22 23 24 25 26 27 28 29 30
Age

55
Figure 13: Entropy measure for residential status. Men.
0.0
0.2
0.4
0.6
0.8
1.0
1.2
15 16 17 18 19 20 21 22 23 24 25 26 27 28 29
Cohort 45-49Cohort 50-54Cohort 55-59Cohort 60-64Cohort 65-69Cohort 70-74
Figure 14: Entropy measure for residential status. Women.
0.0
0.2
0.4
0.6
0.8
1.0
15 16 17 18 19 20 21 22 23 24 25 26 27 28 29
Cohort 45-49Cohort 50-54Cohort 55-59Cohort 60-64Cohort 65-69Cohort 70-74