Political Cycles in Public Expenditure - University of Sheffield
27
Political Cycles in Public Expenditure: Butter vs. Guns Vincenzo Bove Georgios Efthyvoulou ISSN 1749-8368 SERP no. 2013016 October 2013
Transcript of Political Cycles in Public Expenditure - University of Sheffield

Political Cycles in Public Expenditure: Butter vs. Guns Vincenzo Bove Georgios Efthyvoulou ISSN 1749-8368 SERP no. 2013016 October 2013

Political Cycles in Public Expenditure:
Butter vs Guns
Vincenzo Bove∗
University of Essex
Georgios Efthyvoulou†
University of Sheffield
This version: 22 October 2013
Abstract
This paper investigates how the timing of elections and government ideological moti-
vations influence the dynamics of social and military expenditure in a panel of 22 OECD
countries over the period 1988-2008. Three basic results emerge. First, governments tend
to bias outlays towards social expenditure and away from military expenditure at election
times. Second, membership in the NATO alliance affects the timing of election-driven
military spending manipulations. Third, partisan distinctions are clearly discernible but
differ between the two types of expenditure: while certain categories of social expendi-
ture are higher during left administrations, military expenditure are higher during right
administrations.
JEL classification: C33; D72; H53; H56; P16
Keywords: elections; partisanship; social expenditure; military expenditure
∗Address: Department of Government, University of Essex, Wivenhoe Park, Colchester CO4 3SQ, UnitedKingdom; Tel.: +44 (0) 120 687 2760; Email: [email protected]
†Corresponding Author. Address: Department of Economics, University of Sheffield, 9 Mappin Street,Sheffield, S1 4DT, United Kingdom; Tel: +44 (0) 114 222 3412; Email: [email protected]
1

Political Cycles in Public Expenditure: Butter vs Guns 2
1 Introduction
In classical political economy models of electoral competition, politicians are depicted as
opportunistic actors who manipulate the economy around elections to increase their popularity
and maximise their re-election prospects. The theoretical idea of these electoral manipulations,
known as “political business cycles”, dates back to the seminal papers of Nordhaus (1975)
and Lindbeck (1976). Politicians embrace stimulatory policies to improve real outcomes in
pre-electoral periods and shift to contractionary policies after the elections to combat the
resulting inflation. The Nordhaus-Lindbeck approach was later refined by a number of scholars
to incorporate rational expectations and emphasise the presence of uncertainty regarding the
electoral outcome and the competence level of policymakers (see Cukierman & Meltzer, 1986;
Rogoff & Sibert, 1988; Rogoff, 1990; Persson & Tabellini, 1990; Carlsen, 1999). According to
these studies, governments’ opportunistic behaviour will result in small and short-lived cycles
in policy instruments, but will not necessarily have an impact on employment or growth
(Alesina & Roubini, 1992).
Another important strand of the literature on the domestic political sources of macroeco-
nomic policy emphasises politicians’ ideological motivations. The so-called “partisan models”
assume that left-wing and right-wing governments choose different policies and produce dif-
ferent outcomes that reflect the preferences of their class-defined core political constituencies
(labour base and capital owners, respectively). In particular, parties of the right choose poli-
cies that maximise price stability, even at the cost of employment and growth, whereas parties
of the left are more willing to bear the costs of inflation to fight unemployment and achieve
faster growth rates (Hibbs, 1977). While the rationality assumption may impose constraints
on the ability of policymakers to influence real economic outcomes (Alesina, 1987), both tradi-
tional and rational approaches of the partisan theory share the same predictions with respect
to economic policies: left-wing governments will engage in more income re-distribution and
more expansionary policies than right-wing governments.
Generally speaking, there is considerably more evidence of electoral and partisan shifts
in fiscal and monetary policies than in real economic outcomes.1 In addition, explanations
based on fiscal policy (compared to those on monetary policy) seem to form a stronger basis
for a convincing theoretical model (Drazen, 2000) and to conform much better to the data,
especially when a more sophisticated analysis is undertaken (Imbeau et al., 2001; Milani, 2010).
The latter suggests that electoral and partisan cycles follow a Ramsey Rule: most policy tools
are used to meet political aims, although certain tools are preferred, and the extent and the
mix of usage of policy tools exhibit strong context dependence (Franzese, 2002; Franzese &
Jusko, 2006). Research into context-conditional political cycles offers the ground for resolving
empirical anomalies and an ideal venue for understanding their variability across countries and
over time. For example, there is evidence in the literature that the magnitude and composition
of electoral cycles depends on the country’s level of economic development (Shi & Svensson,
2006), the country’s democratic age (Brender & Drazen, 2005), and the nature of the political
1For extensive reviews of the literature see Alesina et al. (1997), Drazen (2000) and Franzese (2002).

Political Cycles in Public Expenditure: Butter vs Guns 3
system (Persson & Tabellini, 2002, 2003; Albalate et al., 2012). Likewise, a number of scholars
show that the incentives for electioneering vary with features of strategic context, such as the
expected closeness of elections (Frey & Schneider, 1979; Schultz, 1995) and the relative impact
that non-economic issues have on voter choice (Efthyvoulou, 2012). On the other hand, the
capacity for partisaneering appears to be conditioned by the level of globalization (Goodman
& Pauly, 1993; Andrews, 1994) and the process of European integration (von Hagen, 2006;
Efthyvoulou, 2011).
This paper contributes to the literature in two main aspects. First, we provide new
and more comprehensive evidence of how the political process influences the dynamics of
welfare expenditure in advanced industrialised countries. In the existing literature on the
political determinants of social expenditure, the impact of election timing and government
ideology have been explored separately, and little attention has been paid to whether the
effects vary across different social expenditure categories. For instance, in a recent empirical
study covering the years 1980 to 2003, Potrafke (2009) finds partisan cycle regularities in
welfare expenditure in a panel of 20 OECD countries. However, his analysis does not explore
the combined possibility of election-motivated manipulations, and focuses on the detection
of effects in total social expenditure. To address these issues, this paper employs a similar
(but larger) data set and explores the existence of politically-induced cycles in aggregate
and disaggregate measures of social expenditure that track both incumbent partisanship in
character and the electoral calendar in timing.
Second, we present the first multi-country panel study that looks at the influence of elec-
toral and partisan politics on the dynamics of military expenditure and compares the findings
with those on social expenditure. While examining political motivations on transfer pay-
ments and taxation has enjoyed tremendous popularity in the recent empirical literature, the
presence of political cycles in military spending has been relatively neglected. Indeed, the ex-
isting studies on the politics of military spending are mostly based on single-country evidence
(especially from the United States, whose military is hardly comparable to other developed
democracies) and largely overlook the interactive, and potentially negative, relationship with
social spending in serving electoral and partisan goals.
Why should we expect political cycles to differ in timing and direction across these two
types of expenditure? A strong motivation can be found in a line of research arguing that
the government faces a tradeoff between “butter” and “guns”: if it devotes more resources
to military activities without increasing total product, civilian sectors of the economy must
pay by foregoing benefits they would otherwise receive, and vice versa (Russett, 1982). Since
expenses for social programs have a more direct and more immediate political influence on
voters during peace time than do military expenditure, increased allocations to “butter” in
election years can partly occur at the expense of “guns” (Mintz, 1988). This view is consistent
with arguments that voters are “fiscal conservatives”, and hence, electoral manipulation takes
the form of shifting spending towards the goods voters prefer, rather than changing overall
spending or revenues (Drazen & Eslava, 2010). Central to “butter-vs-guns” thesis is also the
role of government ideology in shaping budget priorities. Following the partisan theory claims

Political Cycles in Public Expenditure: Butter vs Guns 4
discussed above, we would expect that left-wing governments will spend more than right-wing
governments. However, given that right-wing parties tend to be pro-military and in favour of a
strong national defence while left-wing parties tend to be pro-peace (Klingemann et al., 1994;
Whitten & Williams, 2011), we should also expect ideology to have the opposite effect on
military spending. Our paper contributes to the literature by testing these hypotheses, using
the most recent data on social and military expenditure, the best available politico-economic
indicators, and the most recently developed econometric techniques.
By way of preview, the main findings can be listed as follows. First, governments tend
to bias outlays towards social expenditure and away from military expenditure at election
times, lending support to a “butter-vs-guns” tradeoff within an electoral competition set-
ting. Second, membership in the NATO alliance affects the timing of election-driven military
spending manipulations: politicians in NATO countries engage in defence cutbacks during
pre-election years, whereas politicians in non-NATO countries decrease allocations to “guns”
during election years. These effects become more pronounced when we exclude the countries
with increased conflict involvement, where political leadership’s concern for national security
can play an important role on voter choice. Third, partisan distinctions are clearly discernible
but differ between the two types of expenditure: while certain categories of social expenditure
are higher during left administrations, military expenditure are higher during right adminis-
trations. The latter suggests that left-wing governments use social spending to promote their
welfare enhancing preferences, but spend relatively less on military spending, possibly because
of their more dovish positions on international relations.
The paper proceeds as follows. Section 2 discusses in more detail how our contribution is
related to previous studies of political cycles and develops the main hypotheses to be tested;
Section 3 describes the data on social and military expenditure; Section 4 outlines the empirical
model specification; Section 5 reports the empirical results and investigates their robustness;
Section 6 concludes.
2 Background and Hypotheses Development
2.1 Electoral Cycles in Social and Military Expenditure
According to the literature on electoral cycles, re-election motives create incentives for incum-
bent politicians to generate a fiscal expansion at election times. Rogoff (1990) was the first
to predict that these cycles may take the form of changes in the composition (rather than the
level) of government spending; that is, policymakers shifting government outlays towards the
more “visible” public goods. A number of subsequent studies lent empirical support to this
prediction using either multi-county panel data (Schuknecht, 2000; Block, 2002; Vergne, 2009;
Katsimi & Sarantides, 2012) or data for local government elections (Blais & Nadeau, 1992;
Schneider, 2010; Veiga & Veiga, 2007; Drazen & Eslava, 2010). However, whether elections
give rise to a substitution of capital for current expenditure or the opposite is still debatable.
Katsimi & Sarantides (2012) point out that this can be in part attributed to different samples
of elections employed (at the local or at the central level, in developing or in developed coun-

Political Cycles in Public Expenditure: Butter vs Guns 5
tries), and hence, to different perceptions of which categories of public spending are actually
“more visible”. A common feature of the aforementioned studies is that they focus on specific
categories of non-defence spending and fail to appreciate that military expenditure may also
be “sacrificed” around elections as one way to enable increases in civilian expenditure. Even
though military spending cannot be characterised by “low visibility”, voters may consider it
to be wasteful and with no positive externalities in periods of peace.2 The political economy
tradeoff between “butter” and “guns” is very well established in the literature on civil conflict
causes (Caruso, 2010), but has rarely been analysed within an electoral competition setting.3
As stated in Section 1, the capacity and the effects of electioneering may vary predictably
across policies depending on the strategic context. For instance, in a recent study, Efthyvoulou
(2012) shows that the size of electoral fiscal cycles is negatively correlated with non-economic
voting: the higher the level of non-economic voting, the weaker are politicians’ incentives to
manipulate fiscal policy as fewer voters can be influenced by an electoral boom in “targeted”
welfare expenditures. This may also imply that in countries where non-economic matters are
high on the public’s political agenda, politicians may choose to pursue an appropriate set of
non-economic policies to signal that their concerns are close to those of voters; such as, taking
security-related measures to counter organised crime and terrorism. While most categories
of government spending are directly linked to redistributive policies, such as unemployment
and old age benefits, defence spending is highly associated with non-economic priorities.4
This suggests that the extent to which politicians make “butter-vs-guns” tradeoffs may vary
across countries and that the magnitude of the resulting effects may be determined by election
politics and external security concerns. The following crucial questions thus arise: do increased
allocations to “butter” during election times come partly at the expense of “guns”, and if
they do, is this relationship consistent across different country groups? The present paper
will attempt to answer these questions.
2.2 Partisan Cycles in Social and Military Expenditure
According to the partisan explanation of economic policy, left-wing and right-wing govern-
ments choose policies that reflect the preferences of their partisans. Typically, parties of the
left are assumed to be more sensitive to unemployment than parties of the right, and hence,
more willing to increase government spending to achieve policy objectives. The empirical
evidence strongly supports partisan effects on the size of the government, and moderately
2Wlezien (1996) shows that public responds rather quickly to defence appropriations decisions and thatpolicymakers respond directly to public preferences for defence spending and adjust its appropriations accord-ingly.
3The available empirical studies on electoral defence spending cycles are solely based on single-countryevidence and do not reach conclusive results: Nincic & Cusack (1979) show that the US military spending risesduring the two years preceding the elections; Dalen & Swank (1996) show that the Dutch defence spendingincreases in election years; Mintz (1988) find that the Israeli defence spending grows in smaller than proportionalproportions a year prior to an election; and, Zuk & Woodbury (1986) and Karagol & Turhan (2008) fail tofind any trace of electoral cycles in military expenditure in the United States and Turkey, respectively.
4The literature on the demand for military spending suggests that a number of external variables, suchas international threats, military interventions, the presence of an arms race, conflicts and regional foreignpolicies, affect a country’s military burden (Goldsmith, 2003; Nikolaidou, 2008; Dunne et al., 2008, 2009).

Political Cycles in Public Expenditure: Butter vs Guns 6
supports partisan effects in some specific policy areas; such as, social and welfare spending
(see Franzese, 2002).5 In many cases, however, the evidence seems to suggest that partisan
governments’ resource to these policies depends heavily on their international and domestic
politico-economic context. For instance, several studies investigate the interaction between
government ideology, economic policy and the degree of globalization. Goodman & Pauly
(1993) and Andrews (1994) provide support for the hypothesis that capital liberalisation
reduces the ability of governments to influence the domestic economy and leads to policy
convergence, whereas Garrett (1995) and Potrafke (2009) show that globalization does not
restrict, but rather encourages partisan politics.6 On the other hand, von Hagen (2006) and
Efthyvoulou (2011) argue that globalization is by no means the only possible constraint on
autonomous policy-making, and that the process of European integration (in the immediate
form of EU-induced reforms and the fulfillment of the Maastricht criteria) may also lead to
structural changes in the influence of political factors on the economy.
While various categories of public spending have been widely explored by the burgeoning
literature on partisan cycles, very few studies attempt to explain how partisan politics affect
patterns of defence spending.7 This is partly because most studies of military spending have
focused on the United States where the two-party/single-government context offers little vari-
ation, and partly because the predictions regarding the direction of effects are not clear-cut.
On one hand, left-wing governments may favour increases in military spending because of
their welfare policy preferences, but, on the other hand, they may favour decreases in military
spending because of their dovish positions on international relations (Whitten & Williams,
2011). The existing single-country evidence is also contradictory, providing support for both
competing hypotheses: while Kollias & Paleologou (2003) find that the Greek defence spend-
ing is higher during left administrations8, Dalen & Swank (1996) and Karagol & Turhan (2008)
find the opposite effects for the Netherlands and Turkey, respectively. In a multi-country study
covering the pre-1998 period, Whitten & Williams (2011) show that government ideology in-
teracts with the international security environment to affect defence spending and conclude
that a one-dimensional conceptualisation of left-right politics may sometimes produce mis-
leading results. Drawing upon the latter conclusion, this paper presents new multi-country
evidence on partisan cycles in defence spending by using a more complex partisanship variable
that captures coalition governments and a range of party ideologies, and by employing a rich
set of control variables that capture conflicts and external security threats.
5Hicks & Swank (1992) analyse a panel of 18 OECD countries over the period 1960-1982 and show thatleft-wing governments generate higher welfare effort than their right-wing counterparts.
6This finding is consistent with the “compensation hypothesis”, according to which globalization increasesmarket dislocations and competition between nation states, and thus, causes a greater demand for interven-tionist policies which leftish governments are happy to supply (Potrafke, 2009).
7Most of the existing literature on the political determinants of defence spending focuses on differencesbetween democracies and autocracies (see, for example, Hewitt, 1992; Goldsmith, 2003).
8See also Eichenberg & Stroll (2003) who use data from the United States and four European countries andfind that some leaders from the left increased military spending over the period 1960-1998.

Political Cycles in Public Expenditure: Butter vs Guns 7
3 Data on Social and Military Expenditure
We consider yearly data on social and military expenditure (as a share of GDP) for 22 OECD
countries: Australia, Austria, Belgium, Canada, Denmark, Finland, France, Germany, Greece,
Ireland, Italy, Japan, Luxembourg, the Netherlands, New Zealand, Norway, Portugal, Spain,
Sweden, Switzerland, the United Kingdom and the United States.
Data on social expenditure are obtained from the OECD Social Expenditure Database
(SOCX)9 for the period 1981-2008. SOCX includes social spending flows controlled by the
general government that can be attributed to an individual beneficiary; hence excludes pure
public goods like national defence. Specifically, it involves “benefits to, and financial contribu-
tions targeted at, households and individuals in order to provide support during circumstances
which adversely affect their welfare, provided that the provision of the benefits and financial
contributions constitutes neither a direct payment for a particular good or service nor an
individual contract or transfer” (Adema & Ladaique, 2009). The database groups social ex-
penditure into nine policy areas depending on their social purpose,10 with old age, health and
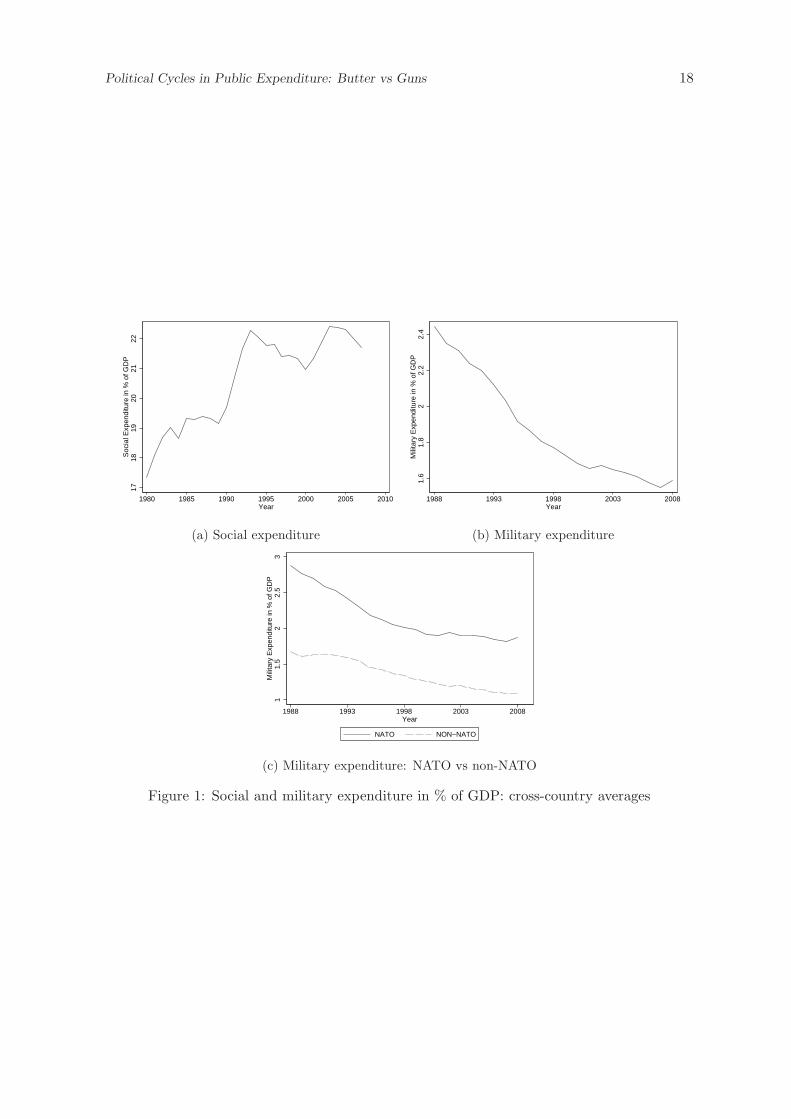
family expenditure being the largest spending items. Panel (a) of Figure 1 illustrates that, on
average, public social spending-to-GDP ratios increased most significantly in the early 1980s,
early 1990s and, again at the beginning of this millennium. In between these decennial turn-
ing points spending-to-GDP ratios changed little; during the 1980s the average public social
spending-to-GDP ratio oscillated around 19%, while after the economic downturn in the early
1990s it oscillated around 22% (see also Adema et al., 2012).
Data on military expenditure are taken from the Stockholm International Peace Research
Institute (SIPRI), which is considered to be the most reliable data source on aggregated mili-
tary expenditure from 1988 onwards. We do not explore military spending prior to 1988 since
the alternative source which covers the pre-2002 period and a longer time span - the Correlates
of War (COW) National Material Capabilities Database - is notoriously less accurate. More-
over, combining the two sources is problematic in terms of comparability because the exact
definition of what comprises military spending (equipment, salaries, paramilitary spending,
pensions, spending on R&D, etc) varies over time and across countries, and these variations
are not captured in the same way by the two sources.11 Panel (b) of Figure 1 shows that,
since the end of the Cold War, the average military spending-to-GDP ratio has been steadily
declining: from 2.4% in 1988 to 1.6% in 2008. This is primarily a consequence of the demise of
9As pointed out by Potrafke (2009), using the SOCX is the best available procedure for analysing socialexpenditure in a cross-country study.
10These areas are: old-age (pensions, early retirement pensions, home-help and residential services for theelderly); survivors (pensions and funeral payments); incapacity-related benefits (care services, disability bene-fits, benefits accruing from occupational injury and accident legislation, employee sickness payments); health(spending on in- and out-patient care, medical goods, prevention); family (child allowances and credits, child-care support, income support during leave, sole parent payments); active labour market policies (employmentservices, training, employment incentives, integration of the disabled, direct job creation, and start-up in-centives); unemployment (unemployment compensation, early retirement for labour market reasons); housing(housing allowances and rent subsidies); and, other social policy areas (non-categorical cash benefits to low-income households and other social services).
11In a recent paper on military spending and regime types, Bove & Brauner (2011) find major inconsistenciesbetween SIPRI and COW and emphasise the difficulties in extending the SIPRI data backwards in time.

Political Cycles in Public Expenditure: Butter vs Guns 8
the Soviet threat. In the last decade in Europe, especially Western and Central Europe, most
countries have been imposing austerity measures to reduce their budget deficits, with heavy
cuts in military expenditure, although the rates of cuts have varied considerably. It must be
stressed that 14 out of the 22 sampled OECD countries are members of the NATO military
alliance, and thus, contribute to NATO’s commonly funded budgets, including the civil and
military budgets and the budget for funding infrastructure improvements.12 In addition, they
support NATO by maintaining forces and assets that they pledge to NATO through a defence
planning process (Johnson & Thomas, 1999). As shown in panel (c) of Figure 1, the average
military spending-to-GDP ratio in NATO countries is between 0.7 and 1.2 percentage points
higher than in non-NATO countries.
< Insert Figure 1 here >
4 Empirical Model Specification
In order to test the hypotheses described in Sections 1 and 2, we employ an empirical specifi-
cation that builds on the work of Potrafke (2009), Efthyvoulou (2012) and Klomp & de Haan
(2013), and takes the following form:
∆ lnYit =α∆ lnYit−1 + βXit + γZit + δ‘Election’it + ϑ‘Ideology’it + µi + λt + εit (M.1)
where ∆ lnYit is the growth rate of public expenditure (social or military) in country i and
year t, Xit is a vector of expenditure-specific control variables, Zit is a vector of variables
capturing economic and politico-institutional constraints; ‘Election’it and ‘Ideology’it are in-
dicators coding the timing of elections and the government’s political orientation, respectively;
µi and λt represent country-specific effects and year-specific effects, respectively; εit is an i.i.d.
error term.
Vector Xit in the social expenditure equation contains control variables suggested by pre-
vious related studies. In particular, it includes: the growth rate of real GDP per capita
(∆ ln ‘GDP per capita’) to capture changes in economic development; the growth rate of the
unemployment rate (∆ ln ‘Unemployment’) to capture the influence of the domestic business
cycle; and, the growth rate of the dependency ratio (∆ ln ‘Dependency Ratio’) - measured by
the percentage of the citizens aged below 14 and above 64 - to capture social support require-
ments resulting from changes in population age structures. On the other hand, vector Xit in
the military expenditure equation encompasses control variables commonly used in the de-
fence economics literature, namely changes in economic development and measures of conflict
involvement and security threats. For the latter we use the following variables: the growth rate
12NATO alliance members are asked to spend on their militaries a minimum of 2% of GDP; yet, very oftenmembers do not meet this target. All too frequently, US Defence Secretaries lament the existence of a gapbetween members willing to pay the price and bear the burden of commitments, and those who enjoy the benefitsof NATO membership but free-ride on the costs, as Robert M. Gates warned in a recent speech (InternationalHerald Tribune, 11 June 2011). The European allies often counter these charges of under-contributions bystressing that much of US defence spending is on non-European concerns and by emphasising that they assumedisproportionate burdens for UN peacekeeping and for other activities (Sandler & Murdoch, 2000).
Political Cycles in Public Expenditure: Butter vs Guns 9
of the size of armed forces as a percentage of the labour force (∆ ln ‘Armed Forces’); the growth
rate of potential and actual enemies’ military expenditure (∆ ln ‘Rivals’); a 0-1 dummy vari-
able capturing the abolition of the draft and the shift to an all-volunteer force13 (‘Volunteers’);
a 0-1 dummy variable capturing external military operations and wars14 (‘Wars’); and, a 0-1
dummy variable coding NATO membership and allowing for the effects of alliance spill-ins
(‘NATO’).
As pointed out in Section 2, globalization may force politicians to relinquish their ability to
generate political cycles and cause a convergence around market-friendly policies. In addition,
separation of powers can work as a commitment device and moderate politically-driven fiscal
policy manipulations (Saporiti & Streb, 2008). To control for such constraints, we include
in vector Zit two variables: the growth rate of the KOF index of economic globalization
(∆ ln ‘Globalization’) and the POLCON index of political constraints (‘Political Constraints’).
The KOF index of economic globalization embraces the economic dimension of globalization
and is constructed using data on actual flows (such as trade, foreign direct investment and
income payments to foreign nationals) and restrictions (such as capital restrictions, taxes on
international trade and hidden import barriers). On the other hand, the POLCON index of
political constraints includes information on veto players (such as two legislative chambers),
and thus, measures the degree of institutional constraints on the executive branch of the
government.
The electoral variable ‘Election’it codes the year the executive is elected. In other words,
it equals 1 in the years of legislative elections in parliamentary countries and in the years of
presidential elections in presidential countries, and 0 in all other years. The partisan variable
‘Ideology’it is the Potrafke (2009)’s government ideology index, which places the cabinet on a
left-right scale with values between 1 and 5. Specifically, it takes the following values: 1 if the
share of governing right-wing parties in terms of the seats in the cabinet and in parliament is
larger than 2/3; 2 if it is between 1/3 and 2/3; and, 3 if the share of centrist parties is 50%
or if the left-wing and right-wing parties form a coalition government that is not dominated
by one side or the other. The index is symmetric and takes the values 4 and 5 if left-wing
parties dominate. Following Potrafke (2009, 2012), we normalise this variable (mean zero,
variance one) so that we can directly interpret the coefficients and marginal effects across the
specifications. Table A.1 in the Appendix reports descriptive statistics and data sources for
all the aforementioned variables.
Equation (M.1) is a standard panel data specification, in which all continuous variables
are in growth rates. Taking growth rates offers two advantages: first, it avoids problems of
13This variable equals 0 in the years when conscription was in force and 1 in the years following the suspensionof the compulsory military service. Since ending conscription tends to have two effects that go in oppositedirections (fewer soldiers getting paid higher wages), the net effect on aggregated defence spending is notclear-cut.
14This variable takes value 1 during year t and year t+1 of external military operations (for example, ISAFin Afghanistan, UN missions) and/or intra-state and inter-state wars. The Correlates of War data set defineswar as sustained combat, involving organised armed forces, resulting in a minimum of 1,000 battle-relateddeaths. Intra-state (civil) wars refer to those that predominantly take place within the recognised territory ofa state, whereas inter-state wars to those that take place between states.

Political Cycles in Public Expenditure: Butter vs Guns 10
spurious inference when the time-series are non-stationary in levels;15 second, it eliminates
time-invariant, country-specific effects in levels. On the other hand, using growth rates does
not control for potential country-specific time trends in levels, and thus, it is sensible to
estimate equation (M.1) using either the fixed-effects or the random-effects estimator. A
Hausman test indicates that the model with random effects is preferable to fixed effects for
both social and military expenditure equations, which is consistent with the fact that our
sampled countries are drawn from a larger population of OECD countries. Hence, we adopt
the random-effects (RE) estimator and use heteroscedasticity and autocorrelation consistent
standard errors to calculate the corresponding test statistics. In addition, in order to account
for the possibility of contemporaneous correlation across countries, we present the results of
regressions with panel-corrected standard errors (PCSE), assuming a panel-specific first-order
autocorrelation structure. An econometric problem that arises here is that the growth rates
of public expenditure may exhibit persistence over time, and thus static model estimates will
suffer from misspecification (omitted variable) bias. Tests of statistical significance (using
both t-test and F -test methods) reveal that, while the estimate of parameter α fails to reach
statistical significance in the military expenditure equation, it is highly significant in the social
expenditure equation. This suggests that social expenditure should preferably be modelled
with a dynamic structure and appropriate econometric techniques should be employed. In
accordance with the large sample properties of the GMM methods, the well-known first-
differencing and system-GMM estimators are biased in our case (given that we only have 22
countries) and small-sample bias-corrected estimators are more appropriate. Consequently,
for the social expenditure equation, we also consider the bias-corrected least-squares dummy
variable (LSDV) estimator developed by Bruno (2005) and designed for dynamic panel data
models with small N .16
5 Empirical Findings
5.1 Results on Social Expenditure
We start by estimating the total social expenditure (‘TSE’) equation for the period 1981-2008
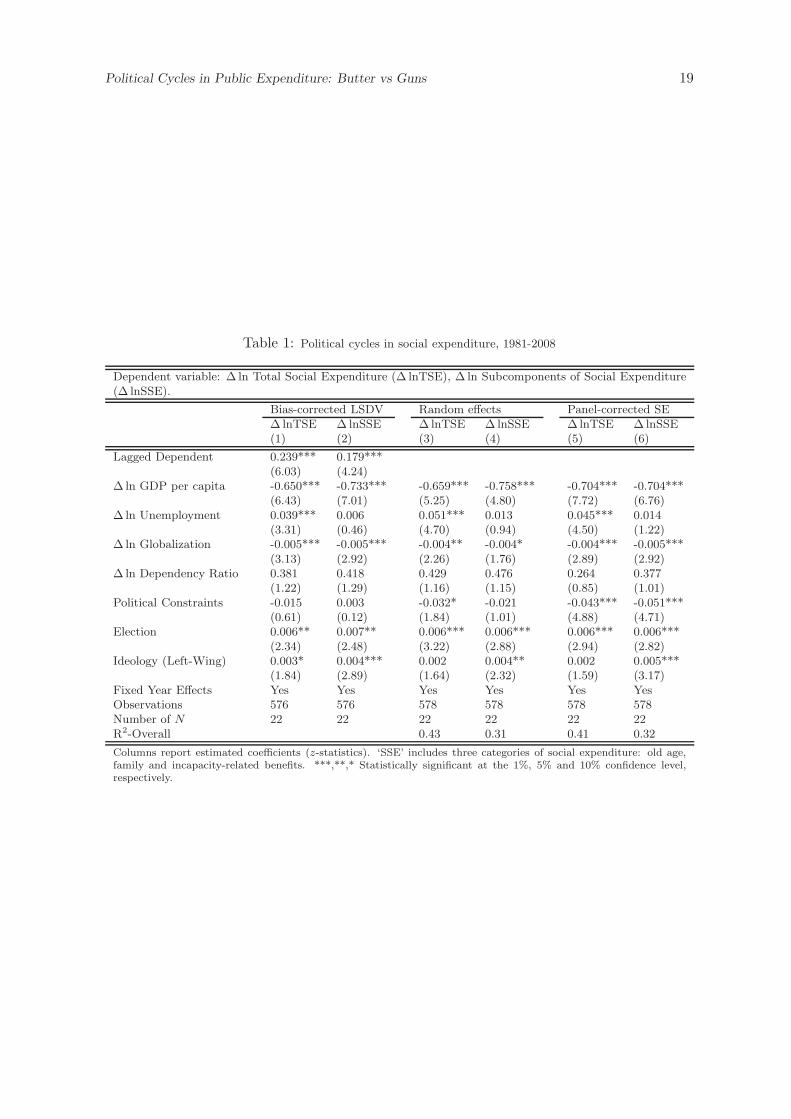
using a dynamic framework (see column (1) of Table 1). As a first point, we can notice that
our proxies for economic development and business cycle fluctuations display the expected sign
and are statistically significant at the 1% significance level. Specifically, the results suggest
that a 1 percentage point fall in the growth rate of GDP per capita and a 1 percentage point
rise in the growth rate of the unemployment rate translate into a 0.65 and 0.04 percentage
15Indeed, panel unit root tests indicate that some of our variables are non-stationary in levels, but becomestationary when transformed into first difference form.
16We choose the Blundell & Bond (1998) estimator as the initial estimator in which the growth rates of GDPper capita and unemployment rates are treated as endogenous variables and the instruments are collapsed assuggested by Roodman (2006). Since the analytical variance estimator performs poorly for large coefficientsof the lagged dependent variable (Bruno, 2005), we undertake 200 replications of the procedure to bootstrapthe estimated standard errors. The results remain qualitatively the same when the Arellano & Bond (1991)and the Anderson & Hsiao (1982) are chosen as initial estimators or when we undertake different number ofbootstrap replications, such as 50, 100 or 500. The preference of the RE estimator, the PCSE estimator andthe bias-corrected LSDV in this context is also discussed in Potrafke (2009).

Political Cycles in Public Expenditure: Butter vs Guns 11
point increase in the growth of social expenditure (as a share of GDP), respectively. These
estimates are in line with those found in Potrafke (2009) for a similar data set but a shorter
time span. Furthermore, our results indicate that a higher degree of economic globalization
is associated with a retrenchment in social spending: the coefficient on ‘∆ ln Globalization’
is negative and highly statistically significant.17 Turning now to our variables of interest, we
find evidence in favour of both opportunistic and partisan theory claims: the coefficients on
‘Election’ and ‘Ideology’ have the expected positive sign and are statistically significant at
conventional levels of significance. Qualitatively, the findings imply that the growth rate of
social expenditure (as a share of GDP) increases by about 0.6 percentage points in election
years18, and by about 0.3 percentage points when the ideology variable increases by one
standard deviation (that is, when there is a shift towards more leftist governments).19 The
reported effects largely persist when we consider a static framework (see columns (3) and
(5) of Table 1). However, the coefficient on ‘Ideology’ becomes now marginally statistically
insignificant.
The failure to find systematic evidence of a pronounced partisan cycle in social expendi-
ture does not necessarily mean that partisan politics do not affect the welfare state. Left-wing
governments may generate higher welfare effort than their right-wing counterparts, but this
effort may only be targeted at certain, more vulnerable social groups. To test this hypoth-
esis we implement the same analysis for all possible combinations of the nine social policy
areas, and we find that the impact of partisanship becomes stronger and statistically more
robust when we focus on three categories of social expenditure, namely old age, family and
incapacity-related benefits (‘SSE’). As shown in columns (2), (4) and (6) of Table 1, allow-
ing the dependent variable to include only these programs produces more stark results: the
coefficient on ‘Ideology’ retains its positive sign, becomes larger in absolute value and is now
statistically significant at the 5% confidence level or better. On the other hand, the results
on the electoral variable remain essentially the same as those obtained for the aggregate mea-
sure. These findings provide further evidence that the discipline and compensation effects
of globalization do not contradict each other and can actually co-exist.20 Welfare-enhancing
preferences create incentives for leftist governments to increase social expenditure and com-
pensate citizens for the risks of globalization. However, the discipline effect of globalization
may restrict their capacity to produce partisan cycles in all social welfare programs and direct
their effort towards certain categories. In addition, it may drive governments of all stripes to
behave in an opportunistic manner and satisfy citizens’ demand for higher social welfare in
17Using the overall KOF index (instead of its economic subindex) results in a statistically insignificantcoefficient, as in Potrafke (2009). This suggests that the social and political dimensions of globalization donot play an important role in explaining the dynamics of social spending in our sampled countries. It must bestressed, however, that the inferences on the political variables are the same regardless of which globalizationindex is employed.
18We have also controlled for governments’ behaviour in the year prior to elections. The pre-election variableappears to be statistically insignificant when added to the model, implying that politicians engage in socialspending manipulation only in election years.
19The average growth rate of social expenditure (as a share of GDP) in our sample is 1%.20For a detailed discussion of the two hypotheses related to the globalization-welfare state nexus, see Dreher
et al. (2008) and Meinhard & Potrafke (2012).
Political Cycles in Public Expenditure: Butter vs Guns 12
periods of election. The latter is in line with Efthyvoulou (2011) who argues that constraints
imposed on the ability of politicians to ingratiate themselves with partisans and preserve
their supporters’ loyalty, may strengthen their incentives to engage in fiscal electioneering and
target the median voter.
< Insert Table 1 here >
Table 2 reports the results when we estimate the same regression package for the shorter
time period 1988-2008. This allows us to compare the findings on social expenditure with those
on military expenditure - which are only available for the post-1987 period - and to investigate
the persistence of the reported effects in a period characterised by deepened globalization.
Overall, the results confirm what was obtained for the full sample period: a large election-
year increase in the growth of both aggregate and disaggregate measures of social expenditure
(‘TSE’ and ‘SSE’, respectively), and strong partisan shifts only in the latter. However, the
effects in the post-1987 period appear to be relatively more pronounced (especially when
consider a dynamic framework), lending support to the conjecture of the previous paragraph.
Besides globalization, the fiscal rules of the European Monetary Union (EMU) may also
affect government behaviour. As pointed out by von Hagen (2006), in the immediate run to
the EMU, voters put a high priority on fiscal discipline, as this could increase the chances
of getting into the monetary union. Governments, therefore, embarked on fiscal contractions
during the mid-1990s to look tough, but, once EMU membership was secured, the old patterns
of politically-motivated fiscal actions re-emerged. To test for the validity of this argument,
we re-estimate all regressions assuming absence of political cycles in the EMU member states
after the Maastricht Treaty and before the start of the monetary union. To do that, we set
both the electoral variable and the (normalised) partisan variable equal to zero during the
years 1993 to 1998 for the sampled EU countries that entered the Eurozone in 1999.21 Table 3
presents the corresponding results. Despite the fact that we now control for a significantly
lower number of elections and allow smaller variation in partisanship levels, the estimates
obtained are remarkably the same as the estimates reported in Table 2, providing support for
the “consolidation fatigue” observation (von Hagen, 2006). In other words, political cycles in
social spending were particularly weak in the prospective euro countries during the mid-1990s,
but became stronger after the start of EMU in 1999.
< Insert Table 2 and Table 3 here >
5.2 Results on Military Expenditure
We continue by estimating the total22 military expenditure (‘TME’) equation for the period
1988-2008 using RE. Looking at column (1) in Table 4, we can notice that economic devel-
opment plays an important role in explaining the dynamics of military spending (as in the
21For Austria and Finland (which became members of the EU in 1995) we set the political variables equalto zero during the years 1995 to 1998.
22Data on components of military expenditure are not currently available for all sampled countries/years toundertake a similar econometric analysis at the disaggregated level.

Political Cycles in Public Expenditure: Butter vs Guns 13
case of social benefits): the coefficient on ∆ ln ‘GDP per capita’ has the expected negative
sign and is statistically significant at the 1% confidence level. Furthermore, a country’s in-
vestment in defence appears to be highly responsive to the proxies of conflict involvement and
security threats. Specifically, we find positive and significant growth effects arising from the
proportion of the labour force in armed forces and the level of rivals’ military spending, con-
sistent with the traditional external action-reaction explanation of military expenditure. The
variable ‘Wars’ (which mostly represents external military deployments, like in Kosovo, Iraq
and Afghanistan) also exerts a positive influence on the dependent variable, suggesting that
countries involved in operations abroad increase their investment in defence to meet overseas
deployment demands. Concerning our variables of interest, we can see that the coefficient
on ‘Ideology’ is negative and statistically significant, indicating that the more to the left a
government is, the less will spend on the military. Specifically, the estimate suggests that the
growth rate of military expenditure (as a share of GDP) decreases by about 0.4 percentage
points when the ideology variable increases by one standard deviation. This finding sup-
ports the view that left governments do not use military spending as one of the policy tools
to achieve their welfare goals; but, on the contrary, they tend to favour decreased military
spending because of their less hawkish positions on international relations. Finally, the re-
sults in column (1) provide no evidence of electoral impacts in military spending: the variable
‘Election’ enters the regression with small coefficient estimate and z-statistic.
As noted in Section 3, nearly two-third of our sampled countries are members of the
NATO military alliance, and as such, they need to provide sufficient funds for modernising
and restructuring their defence forces to meet NATO’s requirements. This may suggest that
politicians’ abilities to manipulate military spending for electoral gains are, to some extent,
conditioned by NATO membership. To test this hypothesis, we replace the electoral variable
by the interaction terms ‘Election ∗ NATO1’ and ‘Election ∗ NATO0’ (coding elections in
NATO and non-NATO members, respectively) and run the same regression as before. As
shown in column (2) of Table 4, the absence of an electoral cycle in military spending (as
observed in column (1)) is due predominantly to NATO countries: while the coefficient on
‘Election ∗ NATO1’ fails to reach statistical significance, the coefficient on ‘Election ∗ NATO0’
is statistically significant at the 5% confidence level. The negative sign on the latter variable
provides evidence of a “butter-vs-guns” tradeoff in non-NATO countries: increased allocations
to “butter” during elections come partly at the expense of “guns”. As already mentioned, one
interpretation for the failure to find electoral shifts in NATO countries is that the NATO’s
defence burden may be sufficient to curb the temptation of politicians to manipulate military
expenditure for opportunistic purposes. Another possible explanation is that the necessary
defence cutbacks in NATO members are actually made in the year preceding the election.
Why do we expect the timing of effects to differ between the two country groups? First,
NATO members are less reliant on soldiers and more on capital (Bove & Cavatorta, 2012),
and spending on physical inputs is more rigid and takes longer to adjust for electoral purposes
compared to spending on military personnel, whose timing is easier to fine tune. Second, voters
in NATO countries (which have, on average, larger population size and greater military power)

Political Cycles in Public Expenditure: Butter vs Guns 14
may assign relatively higher weight to issues of national security when casting their votes.
Thus, politicians in these countries may be inclined to “sacrifice” spending on the military
in the year prior to election, in order to avoid the political cost involved in reducing the
defence budget during the election year. Following this discussion, we experiment with both
pre-election and on-election year cycles and find evidence in line with the above prediction:
defence spending grows in smaller than normal proportions during the election year or the year
prior to an election depending on whether the country is a member of the NATO alliance or
not23 (see column (3)). Qualitatively, the findings suggest that the election-induced decrease
in the growth rate of military spending (as a share of GDP) is 1.1 percentage points in
NATO countries and 1.5 percentage points in non-NATO countries.24 The reported results are
invariant to tests of robustness, such as, including among the explanatory variables the growth
rates of the unemployment rate and the dependency ratio (see column (4)), and excluding
from the model the variables ∆ ln ‘Armed Forces’ and ∆ ln ‘Rivals’ which may be endogenous
relative to the dependent variable (see column (5)). Using lagged values as instruments for
the latter variables also yields the same conclusions.
One would expect the timing of elections to play a different role in shaping military
spending during low-stakes conflicts, like those that have involved democratic nations during
the post-Cold War era. While in periods of peace governments have the capacity to engage
in election-driven tradeoffs between “butter” and “guns”, in periods of conflicts they face
tremendous pressures to increase allocations to both the civilian and the military sectors. In
addition, during conflict times non-economic voting is at high levels, and hence, opportunistic
policymakers have strong incentives to boost their popularity through electoral increases in
military spending and signal that their concerns are close to those of voters. If this argument
is true, then the electoral cycles observed in columns (1) through (5) should be weaker or
even have the opposite direction for some nations and time periods. We thus continue our
analysis by excluding the 6 countries with the highest frequency of external military opera-
tions and conflicts (as indicated by the variable ‘Wars’), namely Canada, France, Italy, Spain,
the United Kingdom and the United States. The results presented in column (6) support the
aforementioned assertion. Specifically, when we focus on the remaining 16 countries, the coef-
ficient on ‘Pre-Election ∗ NATO1’ becomes larger in absolute value and retains its statistical
significance, suggesting that the electoral-induced military cutbacks in the 6 excluded NATO
countries are, on average, smaller. The results presented and discussed in this section seem
to persist when we estimate the same regression package using PCSE (see Table 5). Even
though controlling for contemporaneous correlation across countries eliminates the statistical
significance of the war dummy and produces a significant relationship between political con-
straints and military spending growth, the inferences on the electoral and partisan variables
do not change.
< Insert Table 4 and Table 5 here >
23We have also augmented the regression model with dummy variables coding both electoral and pre-electoralyears for the two country groups, and performed equality tests on the estimated parameters. The results ofthese tests confirm the reported findings.
24The average growth rate of military expenditure (as a share of GDP) in our sample is -2.2%.

Political Cycles in Public Expenditure: Butter vs Guns 15
5.3 Further Robustness Checks
Rogoff (1990) stresses that incumbent governments may strategically choose the timing of
elections depending on economic outcomes and call early elections when the economy is doing
well. To test whether the reported electoral effects are driven by strategically timed elections,
we look at an alternative indicator that captures only the elections whose timing is predeter-
mined.25 The results are not much influenced by this exercise, suggesting that treating all
elections as exogenous does not bias our estimates nor lead to misleading inferences. Following
Persson & Tabellini (2002, 2003) and Albalate et al. (2012), we also test whether the nature
of political system may shape the dynamics of social and military spending. To do that, we
augment the regression model with indicators capturing different forms of government (presi-
dential, assembly-elected presidential or parliamentary) and different electoral rules (propor-
tional representation versus plurality rule). The added indicators turn out to be statistically
insignificant in all specifications and the key findings presented in the previous sections re-
main essentially intact. This is not so surprising if we take into account that political system
variables exhibit little time-series variation and that any time-invariant, country-specific ef-
fects in levels are removed by taking first differences. Finally, we test whether our results are
sensitive to the exclusion of France from the group of NATO countries.26 Treating France as
a non-NATO country produces very similar results and does not change the inferences on the
political variables, as discussed in Section 5.2 (results available upon request).
6 Conclusions
The “butter-vs-guns” dilemma is an important challenge faced by governments as they try
to maximise public good provision. Military spending can restrict politicians’ ability to meet
important domestic welfare goals, and failure to satisfy the demand for welfare programs at
some minimal level can generate social discontent and undermine political support for the
incumbent. Our results lend support to Mintz (1988)’s argument that the tradeoff between
“butter” and “guns” can serve as a political-electoral tool: incumbent politicians seem to
sacrifice military spending at elections times as a way to enable increases in social spending,
which have a more direct and more immediate political impact on voter choice. Furthermore,
our results indicate that the timing of election-driven defence manipulations is conditioned by
NATOmembership: governments in NATO countries decrease spending on the military during
pre-election years, while governments in non-NATO countries reduce the military burden
during election years. This can partly be attributed to different levels of non-economic voting
and capital intensity of military forces between the two country groups, which can influence
25We classify an election as predetermined if it is held either at the constitutionally determined electioninterval or within the expected year of the constitutionally fixed term. Among the 180 elections in our sample,158 are classified as predetermined.
26France withdrew from the integrated military command in 1966 and returned to full participation in 2009.However, since 1989, France has regularly contributed troops to NATO’s military operations and is consideredto be the fourth-biggest contributor to the NATO’s military budget. From the early 1990s onwards, Francedistanced itself from the 1966 withdrawal decision with its participation at the meetings of defence ministersand the presence of French officers in Allied Command Operations (http://www.nato.int).

Political Cycles in Public Expenditure: Butter vs Guns 16
politicians’ incentives and abilities to engineer electoral shifts in certain periods. Finally, our
results provide evidence of persistent partisan differences in public expenditure: parties of the
left tend to favour increased allocations to “butter”, such as old age, family and incapacity-
related benefits, whereas parties of the right tend to favour increased allocations to “guns”.
The latter suggests that both dimensions of political ideology (determined by welfare policy
preferences and foreign policy preferences) are influential in shaping government spending.
To sum up, our findings offer further insights on how incumbents manipulate public expen-
diture for political purposes and highlight two aspects of contextual variation in the emerging
cycles. First, patterns of electioneering and partisaneering are not symmetric across different
types of expenditure: while the political effects on social spending sign as the opportunistic
and partisan theories predict, those on military spending indicate shifts of the opposite direc-
tion. Second, politicians’ incentives and capacity to enact welfare and foreign policies that will
buy votes or curry partisan favour seem to be influenced by external economic constraints,
the conflict environment and strategic opportunities. These observations can explain why
studies that focus on aggregate measures of public expenditure, employ the same empirical
specification across different expenditure categories, and ignore the context conditionality of
political cycles, may find weak empirical support for such cycles. As Franzese (2002, 2003)
points out, reports of the empirical demise of political cycle theories may have been greatly
exaggerated and researchers should rekindle their attention to this field. While competitive
elections and partisan distinctions are ubiquitous features of all modern democracies, sys-
tematic manipulation of fiscal policies for political gains can have important consequences on
economic performances. For instance, the existence of national political cycles can account
for the considerable cross-country differences in policy instrument interdependencies and be
seen as one of the factors that prevents complete economic integration across the EU member
states (Efthyvoulou, 2011). Furthermore, there is suggestion in the literature that different
types of public expenditure can exert different impacts on economic growth (Kalaitzidakis
& Tzouvelekas, 2011), and that military spending diverts resources from productive uses
(Smith, 1980; Knight et al., 1996) and degrades growth in countries facing low levels of threat
(Aizenman & Glick, 2006). Therefore, understanding how the political process gives rise to
a substitution of military for social expenditure (or the opposite) is of utmost importance,
especially in the light of the recent economic crisis which has modified the role of partisan
politics (Galasso, 2012).
Acknowledgments
The authors wish to thank David Cuberes, Vassilis Sarantides and Ron Smith for helpful
comments and suggestions. The authors are also indebted to the participants of the 12th
Jan Tinbergen European Peace Science Conference in Berlin and seminar participants at the
University of Amsterdam, the University of Edinburgh and the University of Sheffield. The
usual disclaimer applies.

Political Cycles in Public Expenditure: Butter vs Guns 17
A Appendix
See Table A.1
Table A.1: Descriptive statistics and data sources (1988-2008)
Variable Obs Mean Std Dev Min Max Source
Total Social Expenditure 460 21.5 4.9 10.7 35.7 SOCX(% of GDP)Subcomponents of Social 460 11.6 3.4 5.0 20.4 SOCXExpenditure (% of GDP)GDP per capita 462 23690.6 8883.2 7930.4 56389.2 WDIUnemployment Rate 462 7.1 3.6 0.5 23.9 WDIGlobalization 462 78.2 11.0 48.0 98.7 Dreher (2006)(KOF economic subindex)Dependency Ratio 462 33.2 1.5 30.1 39.5 WDIPolitical Constraints 462 0.49 0.09 0.23 0.72 Henisz (2000)(POLCON index)Total Military Expenditure 462 1.9 0.9 0.5 5.8 SIPRI(% of GDP)Armed Forces (% of Labour) 462 1.2 0.8 0.1 5.2 SDMRivals 462 3101.5 17283.4 0 218402 Dunne et al. (2009)Volunteers 462 0.24 0.43 0 1 Bove & Cavatorta (2012)Wars 462 0.15 0.35 0 1 COWElection 462 0.27 0.45 0 1 Various SourcesIdeology (Left-Wing) 462 2.9 0.9 1 4 Potrafke (2009)
SOCX: OECD Social Expenditure Database; WDI: World Bank’s World Development Indicators; SIPRI: Stock-holm International Peace Research Institute; COW: Correlates of War Project; SDM: Swedish Defence Ministry
Political Cycles in Public Expenditure: Butter vs Guns 18
1718
1920
2122
Soc
ial E
xpen
ditu
re in
% o
f GD
P
1980 1985 1990 1995 2000 2005 2010Year
(a) Social expenditure
1.6
1.8
22.
22.
4M
ilita
ry E
xpen
ditu
re in
% o
f GD
P
1988 1993 1998 2003 2008Year
(b) Military expenditure
11.
52
2.5
3M
ilita
ry E
xpen
ditu
re in
% o
f GD
P
1988 1993 1998 2003 2008Year
NATO NON−NATO
(c) Military expenditure: NATO vs non-NATO
Figure 1: Social and military expenditure in % of GDP: cross-country averages
Political Cycles in Public Expenditure: Butter vs Guns 19
Table 1: Political cycles in social expenditure, 1981-2008
Dependent variable: ∆ ln Total Social Expenditure (∆ lnTSE), ∆ ln Subcomponents of Social Expenditure(∆ lnSSE).
Bias-corrected LSDV Random effects Panel-corrected SE∆ lnTSE ∆ lnSSE ∆ lnTSE ∆ lnSSE ∆ lnTSE ∆ lnSSE(1) (2) (3) (4) (5) (6)
Lagged Dependent 0.239*** 0.179***(6.03) (4.24)
∆ ln GDP per capita -0.650*** -0.733*** -0.659*** -0.758*** -0.704*** -0.704***(6.43) (7.01) (5.25) (4.80) (7.72) (6.76)
∆ ln Unemployment 0.039*** 0.006 0.051*** 0.013 0.045*** 0.014(3.31) (0.46) (4.70) (0.94) (4.50) (1.22)
∆ ln Globalization -0.005*** -0.005*** -0.004** -0.004* -0.004*** -0.005***(3.13) (2.92) (2.26) (1.76) (2.89) (2.92)
∆ ln Dependency Ratio 0.381 0.418 0.429 0.476 0.264 0.377(1.22) (1.29) (1.16) (1.15) (0.85) (1.01)
Political Constraints -0.015 0.003 -0.032* -0.021 -0.043*** -0.051***(0.61) (0.12) (1.84) (1.01) (4.88) (4.71)
Election 0.006** 0.007** 0.006*** 0.006*** 0.006*** 0.006***(2.34) (2.48) (3.22) (2.88) (2.94) (2.82)
Ideology (Left-Wing) 0.003* 0.004*** 0.002 0.004** 0.002 0.005***(1.84) (2.89) (1.64) (2.32) (1.59) (3.17)
Fixed Year Effects Yes Yes Yes Yes Yes YesObservations 576 576 578 578 578 578Number of N 22 22 22 22 22 22R2-Overall 0.43 0.31 0.41 0.32
Columns report estimated coefficients (z-statistics). ‘SSE’ includes three categories of social expenditure: old age,family and incapacity-related benefits. ***,**,* Statistically significant at the 1%, 5% and 10% confidence level,respectively.

Political Cycles in Public Expenditure: Butter vs Guns 20
Table 2: Political cycles in social expenditure, 1988-2008
Dependent variable: ∆ ln Total Social Expenditure (∆ lnTSE), ∆ ln Subcomponents of Social Expenditure(∆ lnSSE).
Bias-corrected LSDV Random effects Panel-corrected SE∆ lnTSE ∆ lnSSE ∆ lnTSE ∆ lnSSE ∆ lnTSE ∆ lnSSE(1) (2) (3) (4) (5) (6)
Lagged Dependent 0.300*** 0.319***(6.96) (6.89)
∆ ln GDP per capita -0.734*** -0.797*** -0.770*** -0.836*** -0.731*** -0.673***(6.18) (5.57) (5.45) (4.35) (6.81) (5.66)
∆ ln Unemployment 0.030** 0.009 0.050*** 0.024 0.049*** 0.032**(2.12) (0.54) (4.11) (1.57) (4.10) (2.40)
∆ ln Globalization -0.005*** -0.005*** -0.003* -0.004* -0.003* -0.004**(3.01) (2.93) (1.82) (1.72) (1.66) (2.17)
∆ ln Dependency Ratio 0.188 0.513 0.091 0.433 -0.051 0.665(0.53) (1.18) (0.22) (0.68) (0.13) (1.43)
Political Constraints -0.013 0.001 -0.033 -0.031 -0.048*** -0.058***(0.41) (0.02) (1.31) (1.20) (4.44) (4.93)
Election 0.008*** 0.007** 0.007*** 0.006** 0.007*** 0.005*(2.74) (1.98) (4.49) (2.20) (2.97) (1.90)
Ideology (Left-Wing) 0.002 0.006*** 0.001 0.005** 0.001 0.004**(1.59) (3.16) (0.58) (2.16) (0.36) (2.43)
Fixed Year Effects Yes Yes Yes Yes Yes YesObservations 436 436 438 438 438 438Number of N 22 22 22 22 22 22R2-Overall 0.46 0.32 0.43 0.34
See notes for Table 1.
Table 3: Political cycles in social expenditure, 1988-2008: with no political effects in the run-up to EMU
Dependent variable: ∆ ln Total Social Expenditure (∆ lnTSE), ∆ ln Subcomponents of Social Expenditure(∆ lnSSE).
Bias-corrected LSDV Random effects Panel-corrected SE∆ lnTSE ∆ lnSSE ∆ lnTSE ∆ lnSSE ∆ lnTSE ∆ lnSSE(1) (2) (3) (4) (5) (6)
Lagged Dependent 0.296*** 0.320***(6.87) (6.92)
∆ ln GDP per capita -0.732*** -0.794*** -0.767*** -0.829*** -0.726*** -0.669***(6.16) (5.54) (5.41) (4.33) (6.74) (5.63)
∆ ln Unemployment 0.032** 0.010 0.051*** 0.024 0.050*** 0.032**(2.21) (0.58) (4.22) (1.59) (4.21) (2.43)
∆ ln Globalization -0.005*** -0.005*** -0.003* -0.004* -0.003* -0.004**(3.02) (2.92) (1.83) (1.71) (1.69) (2.14)
∆ ln Dependency Ratio 0.181 0.530 0.083 0.439 -0.066 0.684(0.50) (1.21) (0.20) (0.69) (0.17) (1.46)
Political Constraints -0.014 0.002 -0.033 -0.030 -0.048*** -0.057***(0.46) (0.04) (1.30) (1.17) (4.46) (4.84)
Election 0.008** 0.007* 0.008*** 0.006** 0.007*** 0.005*(2.57) (1.77) (4.08) (2.46) (2.86) (1.89)
Ideology (Left-Wing) 0.003* 0.006*** 0.001 0.005** 0.001 0.004**(1.65) (3.18) (0.55) (1.98) (0.25) (2.21)
Fixed Year Effects Yes Yes Yes Yes Yes YesObservations 436 436 438 438 438 438Number of N 22 22 22 22 22 22R2-Overall 0.46 0.32 0.43 0.34
See notes for Table 1.

Political Cycles in Public Expenditure: Butter vs Guns 21
Table 4: Political cycles in military expenditure, 1988-2008: random-effects
Dependent variable: ∆ ln Total Military Expenditure (∆ lnTME).
(1) (2) (3) (4) (5) (6)
∆ ln GDP per capita -0.627*** -0.612*** -0.616*** -0.526*** -0.642*** -0.706***(4.12) (4.07) (4.05) (3.28) (3.96) (4.56)
∆ ln Globalization 0.001 0.001 0.001 0.001 0.001 0.001(0.01) (0.33) (0.31) (0.41) (0.42) (0.04)
∆ ln Armed Forces 0.019*** 0.019** 0.019** 0.019** 0.016**(2.65) (2.49) (2.50) (2.49) (2.46)
∆ ln Rivals 0.123*** 0.117*** 0.128*** 0.131*** 0.106**(2.89) (2.79) (2.74) (2.86) (2.21)
Volunteers 0.004 0.004 0.004 0.003 0.003 0.019**(0.48) (0.52) (0.50) (0.42) (0.35) (2.00)
Wars 0.015** 0.015** 0.015** 0.016** 0.013** 0.010(2.42) (2.48) (2.35) (2.49) (1.99) (0.97)
Political Constraints -0.022 -0.022 -0.023 -0.020 -0.019 -0.070(0.77) (0.76) (0.78) (0.70) (0.62) (1.63)
NATO -0.005 -0.011 -0.006 -0.005 -0.008 -0.008(0.80) (1.48) (0.91) (0.76) (1.08) (0.87)
Election -0.001(0.26)
Election ∗ NATO1 0.007(0.85)
Pre-Election ∗ NATO1 -0.011** -0.011** -0.009** -0.014**(2.33) (2.41) (2.06) (2.09)
Election ∗ NATO0 -0.015** -0.015** -0.015** -0.016*** -0.015**(2.55) (2.53) (2.51) (2.73) (2.30)
Ideology (Left-Wing) -0.004* -0.004* -0.004* -0.004* -0.005* -0.005**(1.83) (1.83) (1.82) (1.82) (1.94) (1.88)
∆ ln Unemployment 0.024(1.50)
∆ ln Dependency Ratio -0.149(0.40)
Fixed Year Effects Yes Yes Yes Yes Yes YesObservations 440 440 440 440 440 320Number of N 22 22 22 22 22 16R2 0.16 0.17 0.17 0.18 0.16 0.18
Columns report estimated coefficients (z-statistics). Column (6) excludes the following countries: Canada,France, Italy, Spain, the United Kingdom and the United States. ***,**,* Statistically significant at the 1%,5% and 10% confidence level, respectively.

Political Cycles in Public Expenditure: Butter vs Guns 22
Table 5: Political cycles in military expenditure, 1988-2008: panel-corrected SE
Dependent variable: ∆ ln Total Military Expenditure (∆ lnTME).
(1) (2) (3) (4) (5) (6)
∆ ln GDP per capita -0.684*** -0.657*** -0.658*** -0.540*** -0.674*** -0.751***(3.87) (3.65) (3.71) (2.32) (3.78) (3.88)
∆ ln Globalization 0.001 0.001 0.001 0.001 0.001 0.001(0.09) (0.20) (0.19) (0.28) (0.34) (0.05)
∆ ln Armed Forces 0.016* 0.016* 0.016* 0.016* 0.015(1.71) (1.71) (1.76) (1.72) (1.60)
∆ ln Rivals 0.113* 0.110 0.126* 0.130* 0.10(1.71) (1.62) (1.87) (1.93) (1.09)
Volunteers 0.009 0.009 0.009 0.007 0.008 0.020**(1.29) (1.27) (1.24) (0.99) (1.11) (2.11)
Wars 0.010 0.011 0.010 0.012 0.008 0.007(1.24) (1.37) (1.28) (1.49) (1.07) (0.50)
Political Constraints -0.055** -0.052** -0.051* -0.052* -0.054** -0.100**(2.12) (2.05) (1.95) (1.99) (2.12) (2.41)
NATO -0.006 -0.012 -0.007 -0.006 -0.007 -0.006(0.84) (1.59) (0.89) (0.81) (0.85) (0.64)
Election -0.001(0.29)
Election ∗ NATO1 0.008(1.30)
Pre-Election ∗ NATO1 -0.011* -0.011* -0.010* -0.017*(1.86) (1.93) (1.66) (1.81)
Election ∗ NATO0 -0.013* -0.013* -0.014* -0.013* -0.013*(1.88) (1.85) (1.96) (1.90) (1.72)
Ideology (Left-Wing) -0.005** -0.005* -0.005* -0.005* -0.005* -0.007**(1.99) (1.95) (1.89) (1.87) (1.86) (2.04)
∆ ln Unemployment 0.017(0.69)
∆ ln Dependency Ratio 0.397(0.55)
Fixed Year Effects Yes Yes Yes Yes Yes YesObservations 440 440 440 440 440 320Number of N 22 22 22 22 22 16R2 0.19 0.20 0.20 0.20 0.18 0.22
See notes for Table 4.

Political Cycles in Public Expenditure: Butter vs Guns 23
References
Adema, W., & Ladaique, M. 2009. How expensive is the welfare state? Gross and net indicators in the OECD
Social Expenditure Database (SOCX). OECD Social, Employment and Migration Working Papers, No. 92.
Adema, W., Fron, P., & Ladaique, M. 2012. Is the European welfare state really more expensive? Indicators
on social spending, 1980-2012; and a manual to the OECD Social Expenditure Database (SOCX). OECD
Social, Employment and Migration Working Papers, No. 124.
Aizenman, J., & Glick, R. 2006. Military expenditure, threats, and growth. Journal of International Trade &
Economic Development, 15(2), 129–155.
Albalate, D., Bel, G., & Elias, F. 2012. Institutional determinants of military spending. Journal of Comparative
Economics, 40(2), 279–290.
Alesina, A. 1987. Macroeconomic policy in a two-party system as a repeated game. The Quarterly Journal of
Economics, 102(3), 651–678.
Alesina, A., & Roubini, N. 1992. Political cycles in OECD economies. Review of Economic Studies, 59(4),
663–688.
Alesina, A., Roubini, N., & Cohen, G.D. 1997. Political cycles and the macroeconomy. Cambridge, MA: The
MIT Press.
Anderson, T.W., & Hsiao, C. 1982. Formulation and estimation of dynamic models using panel data. Journal
of Econometrics, 18(1), 570–606.
Andrews, D.M. 1994. Capital mobility and monetary adjustment in Western Europe 1973-1991. Policy Sciences,
27(4), 425–455.
Arellano, M., & Bond, S. 1991. Some tests of specification for panel data: Monte Carlo evidence and an
application to employment equations. Review of Economic Studies, 58(2), 277–297.
Blais, A., & Nadeau, R. 1992. The electoral budget cycle. Public Choice, 74(4), 389–403.
Block, S. 2002. Elections, electoral competitiveness, and political budget cycles in developing countries. Harvard
University CID Working Papers, No. 78.
Blundell, R., & Bond, S. 1998. Initial conditions and moment restrictions in dynamic panel data models.
Journal of Econometrics, 87(1), 115–143.
Bove, V., & Brauner, J. 2011. The demand for military expenditure in authoritarian regimes. Birkbeck Working
Papers in Economics and Finance, No. 1106.
Bove, V., & Cavatorta, E. 2012. From conscription to volunteers: budget shares in NATO defence spending.
Defence and Peace Economics, 23(3), 273–288.
Brender, A., & Drazen, A. 2005. Political budget cycles in new versus established democracies. Journal of
Monetary Economics, 52(7), 1271–1295.
Bruno, G.S.F. 2005. XTLSDVC: Stata module to estimate bias corrected LSDV dynamic panel data models.
Statistical Software Components, Boston College Department of Economics.
Carlsen, F. 1999. Inflation and elections: Theory and evidence from six OECD economies. Economic Inquiry,
37(1), 120–135.
Caruso, R. 2010. Butter, guns and ice-cream theory and evidence from Sub-Saharan Africa. Defence and Peace
Economics, 21(3), 269–283.
Political Cycles in Public Expenditure: Butter vs Guns 24
Cukierman, A., & Meltzer, A. H. 1986. A positive theory of discretionary policy, the cost of democratic
government and the benefits of a constitution. Economic Inquiry, 24(3), 367–388.
Dalen, H.P., & Swank, O.H. 1996. Government spending cycles: ideological or opportunistic? Public Choice,
89(1), 183–200.
Drazen, A. 2000. The political business cycle after 25 years. In: Bernanske, B.S., & Rogoff, K.S. (eds), NBER
Macroeconomic Annual. Cambridge, MA: The MIT Press.
Drazen, A., & Eslava, M. 2010. Electoral manipulation via voter-friendly spending: theory and evidence.
Journal of Development Economics, 92(1), 39–52.
Dreher, A. 2006. Does globalization affect growth? Evidence from a new index of globalization. Applied
Economics, 38(10), 1091–1110.
Dreher, A., Sturm, J.E., & Ursprung, H.W. 2008. The impact of globalization on the composition of government
expenditures: evidence from panel data. Public Choice, 134(3), 263–292.
Dunne, J.P., Perlo-Freeman, S., & Smith, R.P. 2008. The demand for military expenditure in developing
countries: hostility versus capability. Defence and Peace Economics, 19(4), 293–302.
Dunne, J.P., Perlo-Freeman, S., & Smith, R.P. 2009. Determining military expenditures: arms races and spill-
over effects in cross-section and panel data. University of the West of England, Department of Economics
Discussion Papers, No. 901.
Efthyvoulou, G. 2011. Political cycles under external economic constraints: evidence from Cyprus. Journal of
Economics and Business, 63(6), 638–662.
Efthyvoulou, G. 2012. Political budget cycles in the European Union and the impact of political pressures.
Public Choice, 153(3), 295–327.
Eichenberg, R.C., & Stroll, R. 2003. Representing defense: democratic control of the defense budget in the
United States and Western Europe. The Journal of Conflict Resolution, 47(4), 399–422.
Franzese, R. 2003. Macroeconomic policies of developed democracies. Cambridge: Cambridge University Press.
Franzese, R., & Jusko, K.L. 2006. Political-economic cycles. In: Witten, D. & Weingast, B. (eds.), Oxford
Handbook of Political Economy. New York: Oxford University Press.
Franzese, R.J. 2002. Electoral and partisan cycles in economic policy and outcomes. Annual Review of Political
Science, 5, 369–421.
Frey, B.S., & Schneider, F. 1979. An econometric model with an endogenous government sector. Public Choice,
34(1), 29–43.
Galasso, V. 2012. The role of political partisanship during economic crises. Public Choice, doi:10.1007/s11127–
012–9956–6, forthcoming.
Garrett, G. 1995. Capital mobility, trade and the domestic politics of economic policy. International Organi-
zation, 49(4), 657–687.
Goldsmith, B.E. 2003. Bearing the defense burden, 1886-1989: why spend more? Journal of Conflict Resolution,
47(5), 551–573.
Goodman, J.B., & Pauly, L.W. 1993. The obsolescence of capital controls? Economic management in an age
of global markets. World Politics, 46(1), 50–82.
Henisz, W.J. 2000. The institutional environment for economic growth. Economics & Politics, 12(1), 1–31.

Political Cycles in Public Expenditure: Butter vs Guns 25
Hewitt, D. 1992. Military expenditures worldwide: determinants and trends, 1972–1988. Journal of Public
Policy, 12(2), 105–152.
Hibbs, D.A. 1977. Political parties and macroeconomic policy. The American Political Science Review, 71.
Hicks, A.M., & Swank, D.H. 1992. Politics, institutions, and welfare spending in industrialized democracies,
1960-82. The American Political Science Review, 86.
Imbeau, L.M., Petry, F., & Lamari, M. 2001. Left-right party ideology and government policies: a meta-
analysis. European Journal of Political Research, 40(1), 1–29.
Johnson, H.J, & Thomas, C. 1999. NATO: Implications of European integration for allies defense spending.
Diane Publishing Co.
Kalaitzidakis, P., & Tzouvelekas, V. 2011. Military spending and the growth-maximizing allocation of public
capital: A cross-country empirical analysis. Economic Inquiry, 49(4), 1029–1041.
Karagol, E.T., & Turhan, A. 2008. External debt, defence expenditures and political business cycles in Turkey.
Defence and Peace Economics, 19(3), 217–224.
Katsimi, M., & Sarantides, V. 2012. Do elections affect the composition of fiscal policy in developed, established
democracies? Public Choice, 151(1), 325–362.
Klingemann, H-D., Hofferbert, R., & Budge, I. 1994. Parties, policies and democracy. Boulder, CO: Westview
Press.
Klomp, J., & de Haan, J. 2013. Political budget cycles and election outcomes. Public Choice, 157(1), 245–267.
Knight, M., Loayza, N., & Villanueva, D. 1996. The peace dividend: military spending cuts and economic
growth. Staff Papers-International Monetary Fund, 43(1), 1–37.
Kollias, C., & Paleologou, S.M. 2003. Domestic political and external security determinants of the demand for
Greek military expenditure. Defence and Peace Economics, 14(6), 437–445.
Lindbeck, A. 1976. Stabilization policy in open economies with endogenous politicians. American Economic
Review, 66(2), 1–19.
Meinhard, S., & Potrafke, N. 2012. The globalization-welfare state nexus reconsidered. Review of Intenational
Economics, 20(2), 271–287.
Milani, F. 2010. Political business cycles in the new Keynesian model. Economic Inquiry, 48(4), 896–915.
Mintz, A. 1988. Electoral cycles and defense spending. Comparative Political Studies, 21(3), 368–381.
Nikolaidou, E. 2008. The demand for military expenditure: evidence from the EU15 (1961–2005). Defence and
Peace Economics, 19(4), 273–292.
Nincic, M., & Cusack, T.R. 1979. The political economy of US military spending. Journal of Peace Research,
16(2), 101–115.
Nordhaus, W.D. 1975. The political business cycle. The Review of Economic Studies, 42(2), 169–190.
Persson, T., & Tabellini, G. 1990. Macroeconomic policy, credibility and politics. Chur: Harwood Academic
Publishers.
Persson, T., & Tabellini, G. 2002. Do electoral cycles differ across political systems? Bocconi University,
Innocenzo Gasparini Institute for Economic Research Working Papers, No. 232.
Political Cycles in Public Expenditure: Butter vs Guns 26
Persson, T., & Tabellini, G. 2003. The economic effects of constitutions. Cambridge, MA: The MIT Press.
Potrafke, N. 2009. Did globalization restrict partisan politics? An empirical evaluation of social expenditures
in a panel of OECD countries. Public Choice, 140(1), 105–124.
Potrafke, N. 2012. Political cycles and economic performance in OECD countries: empirical evidence from
1951-2006. Public Choice, 150(1), 155–179.
Rogoff, K., & Sibert, A. 1988. Elections and macroeconomic policy cycles. The Review of Economic Studies,
55(1), 1–16.
Rogoff, K.S. 1990. Equilibrium political budget cycles. American Economic Review, 80(1), 21–36.
Roodman, D. 2006. How to do xtabond2: An introduction to difference and system GMM in Stata. Center for
Global Development Working Papers, No. 103.
Russett, B. 1982. Defense expenditures and national well-being. Americal Political Science Review, 76(4),
767–777.
Sandler, T., & Murdoch, J.C. 2000. On sharing NATO defence burdens in the 1990s and beyond. Fiscal
Studies, 21(3), 297–327.
Saporiti, A., & Streb, J. 2008. Separation of powers and the political business cycles. Public Choice, 137(1),
329–345.
Schneider, C.J. 2010. Fighting with one hand tied behind the back: political budget cycles in the West German
states. Public Choice, 142(1), 125–150.
Schuknecht, L. 2000. Fiscal policy cycles and public expenditure in developing countries. Public Choice, 102(1),
115–130.
Schultz, K.A. 1995. The politics of the political business cycle. British Journal of Political Science, 25(1),
79–99.
Shi, M., & Svensson, J. 2006. Political budget cycles: do they differ across countries and why? Journal of
Public Economics, 90(8), 1367–1389.
Smith, R.P. 1980. Military expenditure and investment in OECD countries, 1954-1973. Journal of Comparative
Economics, 4(1), 19–32.
Veiga, L, & Veiga, F. 2007. Political business cycles at the municipal level. Public Choice, 131(1), 45–64.
Vergne, C. 2009. Democracy, elections and allocation of public expenditures in developing countries. European
Journal of Political Economy, 25(1), 63–77.
von Hagen, J. 2006. Fiscal rules and fiscal performance in the European Union and Japan. Monetary and
Economic Studies, 24(1), 25–60.
Whitten, G.D., & Williams, L.K. 2011. Buttery guns and welfare hawks: the politics of defense spending in
advanced industrial democracies. Americal Journal of Political Science, 55(1), 117–134.
Wlezien, C. 1996. Dynamics of representation: the case of US spending on defence. British Journal of Political
Science, 26(1), 81–103.
Zuk, G., &Woodbury, N.R. 1986. US defense spending, electoral cycles, and Soviet-American relations. Journal
of Conflict Resolution, 30(3), 445–468.