Political Connection and Business Transformation in...
31
1 Political Connection and Business Transformation in Family Firms: Evidence from China ABSTRACT: We investigate the impact of family ownership on core business transformation and the moderating role of political connections in this relation through a Probit model, conditional Logit model, and Heckman selection model with instrumental variable using data from Chinese listed companies covering 2001 to 2010. The results demonstrate that, compared with non-family firms, family firms are more likely to transform their core business, enter strongly correlative industries and non-regulated industries, and adopt a mergers and acquisitions (M&A) mode. Furthermore, compared with politically non-connected family firms, family firms with political connections are more likely to conduct business transformation and adopt M&A rather than an internal cultivation mode to realize transformation. In addition, political connections make family firms more likely to enter weakly correlative industries and increase their chances of entering government-regulated industries. Keywords: business transformation; transformation mode; family firm; political connection; ownership 1. Introduction Enterprises are increasingly conducting business transformation actively or passively amid the acceleration of economic globalization, the discontinuous progress of technology, the relaxation of government regulations, and ever-changing consumer preferences (Zook & Allen, 2010; Aspara et al., 2013). In North America, Zook and Allen (2010) found that nearly 20% of the continuously growing companies had experienced at least one fundamental change to their core business. In China, more than 46% of listed companies completed business transformation from 2001 to 2011. Unlike a diversification strategy, which is just an enterprise’s expansion of business scope (Nayyar, 1992), business transformation is about making fundamental changes in an enterprise’s core business when the organisation's products or services are out of date, funding or income streams are changed, new regulations come into force, or market competition becomes more intense (Kotter, 1995; Chairman & Bossidy, 2008). Business transformation is the breakthrough point that can allow an enterprise to surpass its growth limit and ensure sustained growth capacity (Porter, 1991). The two key issues when conducting business transformation are direction and modes of transformation. The direction of a firm’s transformation will have either a weak or a strong correlation, depending on whether its original business is related to the transformed business (Wang, 2012). For example, IBM’s transformation from IT hardware manufacturing to IT software production had strong correlations, while Galanz’s transformation from feather down production to microwave oven manufacturing illustrates weak correlation. Mode of transformation refers to the means by which the enterprise enters a new industry: this can occur
Transcript of Political Connection and Business Transformation in...
1
Political Connection and Business Transformation in Family Firms: Evidence from China
ABSTRACT: We investigate the impact of family ownership on core business transformation and the
moderating role of political connections in this relation through a Probit model, conditional Logit model, and
Heckman selection model with instrumental variable using data from Chinese listed companies covering 2001
to 2010. The results demonstrate that, compared with non-family firms, family firms are more likely to
transform their core business, enter strongly correlative industries and non-regulated industries, and adopt a
mergers and acquisitions (M&A) mode. Furthermore, compared with politically non-connected family firms,
family firms with political connections are more likely to conduct business transformation and adopt M&A
rather than an internal cultivation mode to realize transformation. In addition, political connections make family
firms more likely to enter weakly correlative industries and increase their chances of entering
government-regulated industries.
Keywords: business transformation; transformation mode; family firm; political connection; ownership
1. Introduction
Enterprises are increasingly conducting business transformation actively or passively amid the acceleration
of economic globalization, the discontinuous progress of technology, the relaxation of government regulations,
and ever-changing consumer preferences (Zook & Allen, 2010; Aspara et al., 2013). In North America, Zook
and Allen (2010) found that nearly 20% of the continuously growing companies had experienced at least one
fundamental change to their core business. In China, more than 46% of listed companies completed business
transformation from 2001 to 2011. Unlike a diversification strategy, which is just an enterprise’s expansion of
business scope (Nayyar, 1992), business transformation is about making fundamental changes in an enterprise’s
core business when the organisation's products or services are out of date, funding or income streams are
changed, new regulations come into force, or market competition becomes more intense (Kotter, 1995;
Chairman & Bossidy, 2008). Business transformation is the breakthrough point that can allow an enterprise to
surpass its growth limit and ensure sustained growth capacity (Porter, 1991).
The two key issues when conducting business transformation are direction and modes of transformation.
The direction of a firm’s transformation will have either a weak or a strong correlation, depending on whether
its original business is related to the transformed business (Wang, 2012). For example, IBM’s transformation
from IT hardware manufacturing to IT software production had strong correlations, while Galanz’s
transformation from feather down production to microwave oven manufacturing illustrates weak correlation.
Mode of transformation refers to the means by which the enterprise enters a new industry: this can occur
2
through either internal cultivation or mergers and acquisitions (M&A). In internal cultivation, the enterprise
fosters a new business from the seed stage to the incubation and growth stages entirely through its own
resources and capabilities; in M&A, corporations gain ownership of or controlling power over target enterprises
by merging with or acquiring them. For example, Galanz, the world’s largest producer of microwave ovens,
transformed its core business from down products to microwave ovens by internal cultivation from 1993 to
1995; IBM accomplished business transformation through about 30 M&A from 1984 to 2005.
Given the important impact of a transformation strategy on firm performance, many challenge-seeking
researchers among both academics and industry practitioners have spent a great deal of effort examining the
influence factors in transformation strategy choice. The literature has assumed that the decline in industry and
corporate performance is the main driving factor for firms’ business transformation (Gordon et al., 2000;
Delmar et al., 2003; Zook & Allen, 2010) and has attempted to reveal the determining factors in transformation
strategy from the angle of financial condition (Amihud & Lev, 1999; Wang, 2012). However, not all firms are in
declining industries or fail drastically before engaging in transformation, and many blue-chip companies are
keen on business transformation as well. In addition, many companies have chosen different modes of business
transformation despite being in similar financial situations.
We argue that corporate ownership is an important factor influencing decision making in business
transformation and that choices of transformation mode differ between family and non-family firms.
Furthermore, from the institutional angle, political connections also play an important role in business
transformation and may have a greater impact on family firms than on non-family firms. For example,
compared with non-family companies, family firms have obvious inheriting characteristics due to the
particularity of their ownership (Carter & Ram, 2004) and have a strong motivation to create wealth across
generations and build a legacy (Zahra et al., 2004; Carney, 2005; Habbershon, 2006). Therefore, they may be
more likely than other types of public companies to conduct business transformation. At the same time, family
firms may be more likely to enter new industries related to their original businesses because of their aversion to
risk (Patel & Chrisman, 2014). In addition, Chinese family firms suffered political and social discrimination
because of China’s socialist ideology (Xu et al., 2013; Su et al., 2013) and therefore find it more difficult to
enter government-regulated industries than do non-family firms. However, some family firms expand their areas
of investment by fostering connections with the government. There is much evidence that political
connectedness can help family firms enter regulated industries (Faccio et al., 2006; Li et al., 2008; Ding et al.,
2014; Xu et al., 2015), as the political connections may help family firms obtain more business transformation
options.
3
This paper investigates the impact of family ownership on business transformation and the moderating
role of political connections in such a relation using data from Chinese listed companies. The results contribute
to the existing literature in two ways. First, most of the literature emphasizes the impact of an enterprise’s
financial situation on business transformation motivation and modes, whereas this paper highlights the
relationship between ownership and business transformation. Specifically, we contrast family firms with
non-family firms and reveal the significant differences between them in their choices of transformation mode.
Second, the extant literature on the effects of political connections focus on firm performance (Wu et al., 2012;
Xu et al., 2015; Muttakin et al., 2015), investment behaviour (Xu et al., 2013; Zhou, 2013), market capabilities
(Jia, 2015), and control structure (Chen et al., 2011). We examine a new and important dependent variable:
business transformation. The results show that political connections have a significant moderating effect on the
relationship between family ownership and business transformation.
2. Development of hypotheses
Due to their unique inheriting characteristics (Carter & Ram, 2004), family firms have strong strategic
demands for developing and creating wealth across generations (Habbershon & Pistrui, 2002). Wealth across
generations is a continuous wealth stream that needs to avoid the influence of market changes and the erosion of
asset values. Following an entrepreneurship-oriented rather than management-oriented strategy becomes the
basic condition for family firms’ creation of wealth across generations and realization of intergenerational
succession (Habbershon & Pistrui, 2002; Riviezzo et al., 2015). Entrepreneurship is not just a phasic strategy in
the lifecycle of family firms but runs through the whole process of their growth (Ucbasaran et al., 2001). As a
particular form of continuous entrepreneurship, business transformation plays an important role in family firms’
long-term survival and success, especially when their core business is facing adverse market conditions (Plate et
al., 2010). Therefore, the concept of wealth across generations means that family firms have a stronger
motivation than do other types of public company to conduct business transformation, as has been demonstrated
in numerous studies (Zahra, 2003; Carney, 2005; Zahra, 2005; Habbershon, 2006).
Business transformation is inevitably associated with large capital expenditures and has very high
requirements for resource reserves and financing capacity from the companies. However, Chinese family firms
face severe financing constraints because of their non-state status and China’s socialist ideology; thus, their
investments depend heavily on internally generated funds. China’s family firms emerged at the beginning of the
economic reform of the 1980s; however, their development was hindered by communist ideology before 1990.
After Deng Xiaoping’s seminal comment on his tour to South China in 1992, family firms were finally set on
4
the right development track. Despite the speed with which family firms developed after 1978, they not only
suffered political and social discrimination but also had to deal with an unfavourable economic environment.
The government still controls most resources, and SOEs still enjoy preferential status in obtaining bank loans
and other key inputs (Allen et al., 2005; Detomasi, 2008; Li et al., 2008; Jackowicz, 2014). Moreover, most of
China’s family firms are smaller and younger than are their state-owned counterparts and are thus a higher risk
in the eyes of financial institutions. The information asymmetry between family entrepreneurs and financial
institutions makes it difficult for family firms to obtain external financing.
Political connections have been found to help firms obtain preferential treatment from government-owned
enterprises such as banks (Faccio et al., 2006; Li et al., 2008). The cultivation of political connections is very
important for family firms in China. In the nation’s relationship-based economy, building connections with the
government or even engaging in politics can facilitate family firms’ private communications with the state and
hence mitigate the severe information asymmetry and social discrimination. Moreover, the state treats
politically connected firms preferentially in their lending of money (Fan et al., 2006; Faccio, 2006; Wu &
Cheng, 2011; Houston et al., 2014). Political networks can also facilitate relationship-based contracts. As a
result, friction in external financing for family firms as well as the premium of external over internal capital
would be reduced, making family firms’ business transformations less dependent on internally generated funds.
Following the above arguments, we propose the following hypotheses:
Hypothesis 1a. Family firms are more likely than are non-family firms to conduct business transformation.
Hypothesis 1b. Politically connected family firms are more likely than are politically non-connected family
firms to conduct business transformation.
Most private companies in China are in competitive industries and seldom set foot in natural monopoly or
administrative monopoly industries (Garnaut et al., 2012). Chinese private firms were born in the early stage of
the transition from a planned economy to a market economy. Due to the lack of accumulated core resources
such as capital, technology, or management, they usually pursue profit by a simple combination of production
factors and a low level of technical management under a scenario of labour-intensive and price competition (Li
et al., 2015; Li et al., 2015). The main characteristic of this business model is low entry barriers, which has
helped many new private firms enter related industries. However, because too many companies entered the
market, the competition among them was limited to competition via low prices, which led to a vicious price and
promotion war (Li et al., 2015). Hence, private firms have a strong incentive to seek out new development
opportunities by entering a new industry.
5
However, in countries with emerging market economies, and especially in China, some industries face
regional regulatory, employment, and protectionist policies that block firms’ business transformation (Hu and
Shi, 2008). Therefore, government administrative licensing is an essential prerequisite of private firms’ entry
into an industry. Researchers have shown that, compared to family firms, the ownership of non-family firms is
more diffuse (Jiang & Peng, 2011; Chu, 2011; San Martin-Reyna & Duran-Encalada, 2012; Li et al., 2015), and
the distribution of their shareholders is wider. Accordingly, non-family firms’ social capital is higher than is that
in family firms. Firms’ social capital refers to the resources embedded in the social networks that the enterprises
and their members are involved in; this can be obtained and mobilized purposefully by an enterprise’s internal
and external social solidarity (Burt, 1992). The greater its corporate social capital, the more investment
opportunities a firm has (Fukuyama, 1995) and the more likely it is to enter regulated industries (Zhao, 1992).
Consequently, we assume that non-family firms are more likely than are family firms to enter regulated
industries.
A family firm’s political connections will affect its chance of obtaining permission to enter regulated
industries. The wider the firm’s political network, the greater the political status and social influence of its
members. The stronger its centrality in its network, the stronger its political influence and the better its chance
of obtaining permission to enter a regulated industry (Sun et al., 2010; Zhou, 2013). Thus, we can describe the
influence of a firm’s political resources on its business transformation direction this way: the greater the degree
of a firm’s political connectedness, the higher the possibility that the firm will enter an industry that requires
permission from the government. A large number of typical cases also show that politically connected family
firms are more likely than are politically non-connected ones to enter strictly regulated industries. For example,
the Shenzhen Tencent Computer Systems Co., Ltd., one of China’s largest Internet service providers, has a great
deal of political capital relative to other family Internet companies. Its founder, Mr. Ma, was elected a
representative at the Guangdong Province People’s Congress and the representative at the twelfth National
People’s Congress in 2013. In 2014, accordingly, Tencent obtained permission to enter the financial industry,
which is strictly regulated by the government, and became one of the first three privately owned banks to obtain
permission from the government and the first Internet company to be awarded a banking license. As the largest
Internet company and an e-commerce giant in China, Alibaba Group not only outperforms Tencent in terms of
company size, operating income, and profitability but also set up Alipay Network Technology Co., Ltd., China’s
largest third-party payment platform and a world leader in the industry. However, Alibaba finally lost to Tencent
in the banking licence competition. Some economic commentators claimed that a lack of the necessary political
6
background was an important cause of Alibaba’s failure.1 Thus, we propose the following hypotheses:
Hypothesis 2a. Non-family firms are more likely than are family firms to enter strictly regulated industries.
Hypothesis 2b. Family firms with political connections are more likely than are family firms without political
connection to enter strictly regulated industries.
Much of the empirical research indicates that the relation between the original business and the
transformed business is significantly positively correlated to the transformation performance of the enterprise
(Pehrsson, 2006) because the greater the link between the original business and the transformed business, the
greater is the value of the knowledge and capacity amassed in their original industry and reused in the
transformed business. Thus, while it is difficult for firms without political connections to obtain permission to
enter strictly regulated industries, they must risk efficiency loss when entering uncorrelated industries (Almeida
& Wolfenzon, 2006). From the behavioural agency perspective, compared to other types of public company, the
family looks to socio-emotional wealth and will thus be risk-averse to business opportunities since they are
risking their personal wealth, reputation, and recognition (Patel & Chrisman, 2014). Maug (1998), Shleifer and
Vishny (1997), and Anderson and Reeb (2003) argue that family business owners are always trying to minimize
the risk to the company, so that family businesses do not focus on investments with high levels of risk.
Therefore, from the perspective of risk preference, it can be reasonably assumed that family firms are more
likely than are non-family firms to enter industries correlated to their original business through an extension of
their industrial chain, allowing them to fully utilize the technology, experience, and know-how accumulated in
their original industries.
By contrast, the establishment of political connections can allow family firms to learn the policy
orientation and control rules of the government, help them obtain key business information, and provide
guarantees for the amount, quality, and diversity of the information (Koka & Prescott, 2002). All of these
information advantages help family firms reduce the uncertainty and risk involved in investments in weakly
correlated industries. Meanwhile, as mentioned, family firms with political connections are more likely to
achieve business transformation by entering government-regulated industries, which usually have a weak
correlation, being uncorrelated to the enterprise’s original core business. Thus, we propose the following
hypotheses:
Hypothesis 3a. Non-family firms are more likely than are family firms to enter weakly correlated industries to
achieve business transformation.
1 http://yanglinhua.baijia.baidu.com/article/24043, http://www.guifabu.com/archives/11933?utm_source=tuicool.
7
Hypothesis 3b. Politically connected family firms are more likely than are politically non-connected family
firms to enter weakly correlated industries to achieve business transformation.
A business transformation strategy occurs through either internal cultivation or M&A. It takes seven to
eight years to realize a positive return on investment for new businesses cultivated internally, but new
businesses established through M&A can earn a profit immediately (Biggadike, 1979). Furthermore, an
important differentiation between family firms and non-family firms is their effectiveness in absorption.
Effectiveness in absorbing new resource stocks is encouraged by both patient and survivability capital. Both of
these resources allow and even encourage long-term, creative strategies (Kang, 2000). During integration,
family firms are more likely to use both creativity and long-term time horizons to develop the best fit of
resources than are non-family firms. Therefore, family firms are likely to absorb new resource stocks more
effectively than are non-family firms due to their higher levels of patient and survivability capital (Sirmon &
Hitt, 2003). Thus, M&A would be more appealing to family firms than to non-family firms. In addition,
companies implementing business transformation by M&A must pay not only huge funds for the M&A
in the short term but also many costs for business and culture integration in the long run. The high requirements
for resource reserves in M&A often force non-family private firms to give up this transformation model.
However, for family private firms, family resources can be gathered adequately based on kinship to provide
various forms of support such as financial, physical, and human capital for enterprise development (Anderson &
Reeb, 2003; Dyer, 2006; Li et al., 2015). Based on the abovementioned analysis, it can be reasonably assumed
that family firms are more likely than are non-family firms to adopt M&A for business transformation.
We argue that M&A is even more significant for politically connected family firms than for politically
non-connected family businesses due to China’s strict M&A regulations. First, political connections can help
family firms acquire more M&A resources. Because of China’s relatively low marketization levels and
imperfect system, its M&A market is several regulated; as M&A between corporations are not entirely
marketization actions, local governments play a critical role in the M&A market (Liu et al., 2013; Su et al.,
2013). Some local governments exert control over M&A between local firms in terms of taxes, employment,
and political promotion. Given this institutional context, some enterprises wishing to conduct M&A may seek
rent from government to obtain their support. Enterprises with close connections to local government will
obtain more M&A opportunities and more support from the government after the M&A. Moreover, local
governments are likely to lower the industry threshold, provide funds and land, lower the tax rate, or provide
preferential policies, thus helping enterprises with political connections achieve their business transformation
8
target. Second, enterprises with political connections have a stronger motivation to conduct business
transformation through M&A. As politically connected firms obtain expansion funds and resources through
government more easily, they obviously have a stronger motivation to conduct large-scale M&A using the
advantage that non-politically connected enterprises lack, improving their profitability. Meanwhile, the current
and former government officials who established a firm’s political connections have a strong motivation to use
their own political resources to assist in the firm’s business transformation through M&A. They will also try to
benefit from the new core business as soon as possible and then construct a ‘position moat’ in order to
strengthen their position and status. Thus, we propose the following:
Hypothesis 4a. Family firms are more likely than are non-family firms to conduct business transformation
through M&A.
Hypothesis 4b. Politically connected family firms are more likely than are politically non-connected family
firms to conduct business transformation through M&A.
3. Research design
3.1. Samples and data
3.1.1. Samples
Following Wang and Song (2010), we first provide a specific definition of ‘enterprise transformation’
according to the industry classification guidance of listed companies formulated by the China Securities
Regulatory Commission (CSRC). If the four-digit industry code of the enterprise’s main business has changed,
we define the enterprise as a transformation enterprise; when the new main business revenue accounts for more
than 30% of total revenue, we conclude that the company has completed its transformation.2
Several definitions of ‘family firm’ are current, suggesting the relatively undeveloped state of the research
on this issue (Xu et al., 2013; Miralles-Marcelo et al., 2014). To Barontini and Caprio (2006), a firm is a family
firm when the largest shareholder owns at least 10% of the ownership rights and either the family or the largest
shareholder controls more than 51% of direct voting rights. For Fahlenbrach (2009), a family firm is one where
the CEO is the founder or co-founder. However, Miralles-Marcelo et al. (2014) did not establish a minimum
2 According to the industry classification guidelines of China’s listed companies released by the CSRC, we selected the
enterprises whose new main business revenue accounts for more than 30% of the total as a criterion. According to this guideline, if
a business revenue accounts for more than or equal to 50% of the total, we classified this business into the corresponding industry;
if no one business has revenue accounting for more than 50% of the total but one business’ revenue is the highest among all the
rest and accounts for more than 30% of the total, we classified this business into the corresponding industry.
9
threshold for family involvement in ownership, as some researchers have done. Taking into account the
situation in China and following Miralles-Marcelo et al. (2014), we define a family firm as a company owned
and controlled by a family. This paper uses the following standards for listed family firms. First, the ultimate
controller can be traced back to a natural person or a family linked by blood and affinity. Second, the ultimate
controller is the largest shareholder of the listed company directly or indirectly and has ultimate control.
Following Claessens (2000), ultimate control is considered to have been obtained if 20% or more of the voting
rights are held via shares of the listed company directly or indirectly or if a family member was recruited to be
the chairman or general manager and holds 10% or more shares. If these two conditions are not met, the family
should be the largest shareholder at a 10% cut-off level, and no second-largest shareholder should hold 10% or
more of shares. Private enterprises include family firms, but not all private enterprises are family firms. Thus,
companies controlled by a union or employee stock ownership plan (ESOP) association composed of natural
persons and management buy-out (MBO) companies are excluded.
To test the research hypotheses empirically, we selected sample firms from companies listed on the
Shanghai and Shenzhen Stock Exchange covering 2001 to 2010.3 After we removed observations with missing
key explanatory variables, the final family firm sample contained 3,082 observations (including 202
transformation and 2,880 non-transformation family firms). Meanwhile, to test whether family businesses differ
significantly from non-family businesses with respect to political connections and transformation strategies
according to the principle that the firms are similar in size and transformation timing, we collected a non-family
firm sample consisting of 3,153 observations (including 218 transformation companies and 2,935
non-transformation ones) as a matched sample.
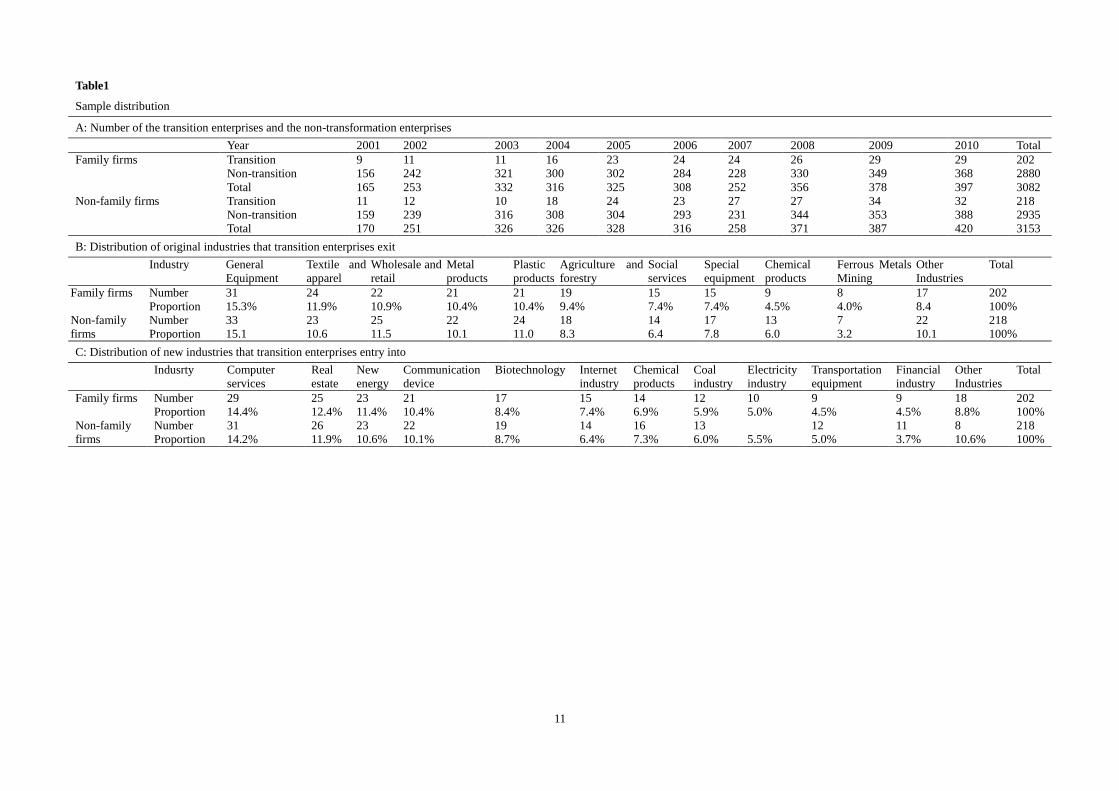
Table 1 reports the sample distributions of years, original industries the transition enterprises exited, and
new industries the transition enterprises entered. The data in part A show that business transformations are
becoming more common and are increasing yearly for both family and non-family firms. The data in parts B
and C indicate that most enterprises withdraw from their original industries, which range from declining
industries to growing industries, and then enter high-profitability industries (such as real estate, new energy, and
communication devices). This may demonstrate that, with the exception of industry recessions, the
profit-seeking nature of firms may be the fundamental motive for business transformation.
3.1.2. Data
Data on the transformation mode, transformation direction, and start and end time of the transformation
3 We limit our sample to non-state controlled firms to ensure that political connections are sought by the company rather than
imposed by the government, as in state-owned enterprises.

10
were collected by the authors from the companies’ quarterly and annual reports, provided by the information
disclosure website Huge Tide Network (www.cninfo.com.cn). The M&A data come from the Chinese Listing
Companies M&A Database of China Security Market Accounting Research (CSMAR). Detailed background
information about chairmen and CEOs is retrieved from the WIND financial database, which provides detailed
biographical information on most chairmen and CEOs. Data on political connections were manually sorted
according to the information provided in company announcements. Financial data and other control variables
were all collected from the China stock database of the China Center for Economic Research (CCER).
11
Table1
Sample distribution
A: Number of the transition enterprises and the non-transformation enterprises
Year 2001 2002 2003 2004 2005 2006 2007 2008 2009 2010 Total
Family firms Transition 9 11 11 16 23 24 24 26 29 29 202
Non-transition 156 242 321 300 302 284 228 330 349 368 2880
Total 165 253 332 316 325 308 252 356 378 397 3082
Non-family firms Transition 11 12 10 18 24 23 27 27 34 32 218
Non-transition 159 239 316 308 304 293 231 344 353 388 2935
Total 170 251 326 326 328 316 258 371 387 420 3153
B: Distribution of original industries that transition enterprises exit
Industry General
Equipment
Textile and
apparel
Wholesale and
retail
Metal
products
Plastic
products
Agriculture and
forestry
Social
services
Special
equipment
Chemical
products
Ferrous Metals
Mining
Other
Industries
Total
Family firms Number 31 24 22 21 21 19 15 15 9 8 17 202
Proportion 15.3% 11.9% 10.9% 10.4% 10.4% 9.4% 7.4% 7.4% 4.5% 4.0% 8.4 100%
Non-family
firms
Number 33 23 25 22 24 18 14 17 13 7 22 218
Proportion 15.1 10.6 11.5 10.1 11.0 8.3 6.4 7.8 6.0 3.2 10.1 100%
C: Distribution of new industries that transition enterprises entry into
Indusrty Computer
services
Real
estate
New
energy
Communication
device
Biotechnology Internet
industry
Chemical
products
Coal
industry
Electricity
industry
Transportation
equipment
Financial
industry
Other
Industries
Total
Family firms Number 29 25 23 21 17 15 14 12 10 9 9 18 202
Proportion 14.4% 12.4% 11.4% 10.4% 8.4% 7.4% 6.9% 5.9% 5.0% 4.5% 4.5% 8.8% 100%
Non-family
firms
Number 31 26 23 22 19 14 16 13 12 11 8 218
Proportion 14.2% 11.9% 10.6% 10.1% 8.7% 6.4% 7.3% 6.0% 5.5% 5.0% 3.7% 10.6% 100%
12
3.2. Variable definition and measurement
3.2.1. Political connection
Political connection is an informal tacit contact relationship between an enterprise and government
officials or government departments, which is manifested in various ways. To measure it, Faccio (2006)
examines whether the manager is a government official or member of parliament. Given China’s special
systemic background, Li et al. (2008) argue that the core channels by which family firms establish political
relations with the government are members of the National People’s Congress or the CPPCC (known as the
‘member’s channel’), which has an informal reporting relationship with the government, and former
government officials with a recessive reporting relationship with the government. Political relationships
established through a member’s channel are stable, long-term, and authoritative; they can help the enterprise
access key resources easily and obtain a high level of political influence. Political relationships established by
other channels are often short-term, unstable, and ill-defined. It is easy for managers with a public political
identity to participate in the interaction between their enterprise and government, as they belong to a more
highly embedded degree of political connection. At the same time, although managers have some influence, the
actual controller of the enterprise is the board chairman or general manager. In this study, a dummy variable is
used as a measurement of political connection: if the chairman of the board or general manager is a
representative of the National People’s Congress, a CPPCC member, Chinese communist party member, or a
former government official or member of the military, the assignment is 1 and 0 otherwise.
The political connection dummy variable does not reflect the strength of the manager’s political
connection, which weakens the effectiveness of the empirical conclusions. Therefore, we also used a continuous
variable, the proportion of the directors with political connections on the board of directors, as a substitution
variable for political connection (Boubakri et al., 2008; Chen et al., 2011). Using these two methods of
measuring political connection refines the political connection metric to meet the requirements of the empirical
test and enables the two sets of empirical results to support each other, improving the reliability and robustness
of the study results.
3.2.2. Transformation strategy
Following the definition of ‘business transformation’ outlined above, a dummy variable (taking a value of
1) is used as a measurement of whether the family firm’s main business changes (0 otherwise). Internal
cultivation and M&A are the two basic business transformation methods. We used two variables, M&A amount
(MA) and presence of M&A (MA–DUM), as substitution variables for the M&A mode and employed internal
13
investment (INInvest) as a substitution variable for internal cultivation. Accordingly, the total enterprise
investment (Invest) is equal to the amount of internal investment and the M&A amount, and the index reflects
the strength of the enterprise’s transformation motive and the speed of its business transformation. In addition,
to study the relationship between the two kinds of transformation mode (M&A and internal cultivation), we
used a dummy variable (MA–INInvest) to measure whether the M&A amount is greater than the internal
investment.
We assess the choice of business transformation direction in two ways (Richardson, 2006; Wang, 2012).
First, we determine whether the transformation is a weak correlation (Weak relation). If the industry the family
firm entered is upstream or downstream of the original industry or if its new products are similar, then the
transformation is a strong correlation transformation and is assigned a value of 0; otherwise, the transformation
is a weak correlation transformation and is assigned a value of 1.4 Second, we determine whether the industry
the company entered is under government control (Regulation). If the enterprise enters into a
government-regulated industry, it is assigned a value of 0; if the new industry features no administrative
regulation or licensing, it is assigned a value of 0. Given China’s national conditions and the findings in Hu and
Shi (2008), we regard China’s utility, pharmaceutical, telecommunication, financial, petroleum, and mining
industries as regulated industries.
3.2.3. Control variables
Business transformation and transformation performance are affected by other factors. Following the
literature (Amihud & Lev, 1999; Gordon et al., 2000; Wang, 2012; Xu et al., 2013; Xu et al., 2015;
Miralles-Marcelo et al., 2014), we select three categories of control variable: corporate governance variables,
financial characteristic variables, and dummy variables (i.e. year of transformation and industry classification).
The literature indicates that the corporate governance variables influence family firms’ expansion and
investment and that enterprises that are older, larger, and with greater cash flow are more likely to conduct
business transformation, and their investment scale is larger.
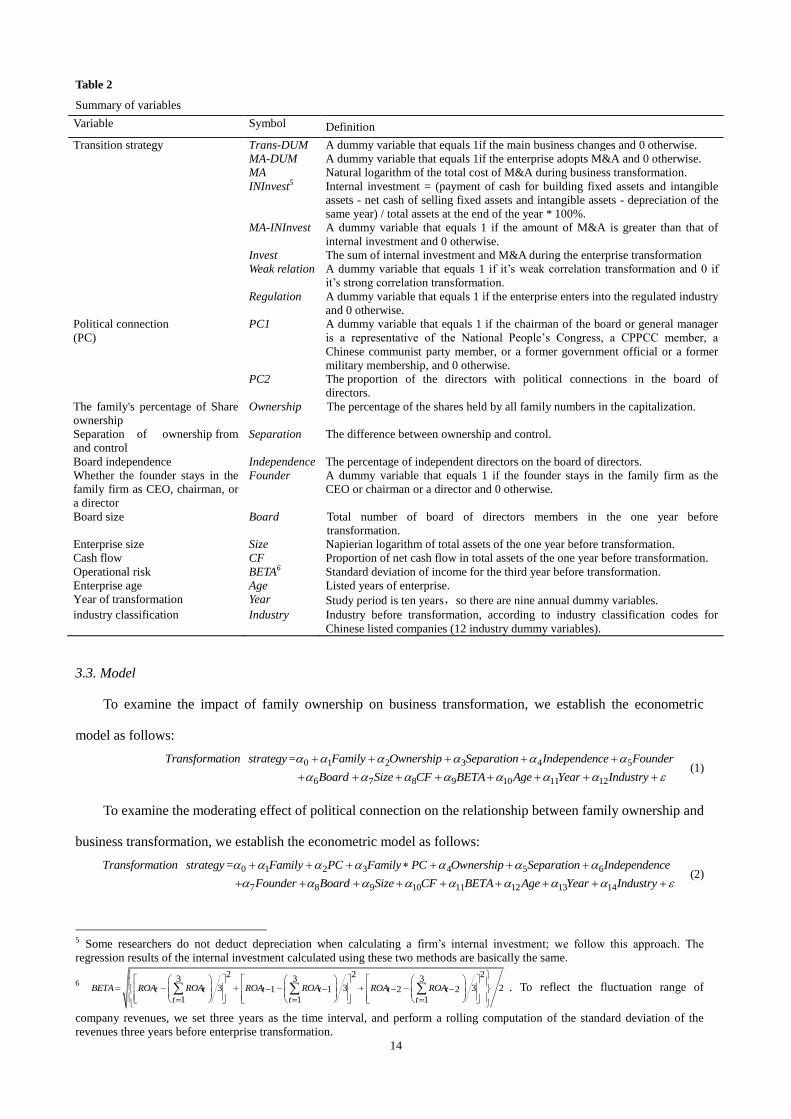
Table 2 provides definitions and measurement methods for the relevant variables selected in this paper.
4 The upstream industry refers to the industry at the beginning of the industrial chain, which provides raw materials, components
manufacturing, and technology. The downstream industry is the industry at the end of the industrial chain, which processes the raw
materials and components, manufactures the finished goods, or provides services. According to the industry classification
guidelines for China’s listed companies released by the CSRC, this paper considers the transformation as a strong correlation
transformation if the first two industrial codes of the enterprise are the same before and after the transformation; otherwise, it is a
weak correlation transformation.
14
Table 2
Summary of variables
Variable Symbol Definition
Transition strategy Trans-DUM A dummy variable that equals 1if the main business changes and 0 otherwise.
MA-DUM A dummy variable that equals 1if the enterprise adopts M&A and 0 otherwise.
MA Natural logarithm of the total cost of M&A during business transformation.
INInvest5 Internal investment = (payment of cash for building fixed assets and intangible
assets - net cash of selling fixed assets and intangible assets - depreciation of the
same year) / total assets at the end of the year * 100%.
MA-INInvest A dummy variable that equals 1 if the amount of M&A is greater than that of
internal investment and 0 otherwise.
Invest The sum of internal investment and M&A during the enterprise transformation
Weak relation A dummy variable that equals 1 if it’s weak correlation transformation and 0 if
it’s strong correlation transformation.
Regulation A dummy variable that equals 1 if the enterprise enters into the regulated industry
and 0 otherwise.
Political connection
(PC)
PC1 A dummy variable that equals 1 if the chairman of the board or general manager
is a representative of the National People’s Congress, a CPPCC member, a
Chinese communist party member, or a former government official or a former
military membership, and 0 otherwise.
PC2 The proportion of the directors with political connections in the board of
directors.
The family's percentage of Share
ownership
Ownership The percentage of the shares held by all family numbers in the capitalization.
Separation of ownership from
and control
Separation The difference between ownership and control.
Board independence Independence The percentage of independent directors on the board of directors.
Whether the founder stays in the
family firm as CEO, chairman, or
a director
Founder A dummy variable that equals 1 if the founder stays in the family firm as the
CEO or chairman or a director and 0 otherwise.
Board size Board Total number of board of directors members in the one year before
transformation.
Enterprise size Size Napierian logarithm of total assets of the one year before transformation.
Cash flow CF Proportion of net cash flow in total assets of the one year before transformation.
Operational risk BETA6 Standard deviation of income for the third year before transformation.
Enterprise age Age Listed years of enterprise.
Year of transformation Year Study period is ten years,so there are nine annual dummy variables.
industry classification Industry Industry before transformation, according to industry classification codes for
Chinese listed companies (12 industry dummy variables).
3.3. Model
To examine the impact of family ownership on business transformation, we establish the econometric
model as follows:
0 1 2 3 4 5
6 7 8 9 10 11 12
=Transformation strategy Family Ownership Separation Independence Founder
Board Size CF BETA Age Year Industry
(1)
To examine the moderating effect of political connection on the relationship between family ownership and
business transformation, we establish the econometric model as follows:
0 1 2 3 4 5 6
7 8 9 10 11 12 13 14
=Transformation strategy Family PC Family PC Ownership Separation Independence
Founder Board Size CF BETA Age Year Industry
(2)
5 Some researchers do not deduct depreciation when calculating a firm’s internal investment; we follow this approach. The
regression results of the internal investment calculated using these two methods are basically the same.
6
2 2 23 3 3
3 3 3 21 1 2 21 1 1
BETA ROA ROA ROA ROA ROA ROAt t t t t tt t t
. To reflect the fluctuation range of
company revenues, we set three years as the time interval, and perform a rolling computation of the standard deviation of the
revenues three years before enterprise transformation.
15
We use the following variables: whether the enterprise implements business transformation (Trans–DUM);
whether it enters a government-regulated industry (Regulation); whether it enters a weakly related industry
(Weak relation); whether it implements M&A (MA–DUM) or internal investment (INInvest); whether the
amount of its M&A is greater than that of its internal investment (MA–INIvest); and its total investment (Invest).
We use the political connection and other control variables as explanatory variables in the regression. In the
same model, we use PC1 and PC2 as substitution variables of political connection. Thus, we have 16 regression
models. When the explained variable is Trans-DUM, the probit estimates with endogenous explanatory
variables are adopted (Greene, 2011). Given that the choices of transformation strategy are contingent on the
family firm’s decision to diversify, a conditional logit model is employed (McFadden, 1974) when the explained
variables are Regulation, Weak relation, MA-DUM, MA-INIvest, or other variables,.
4. Empirical analysis
4.1. Descriptive statistics
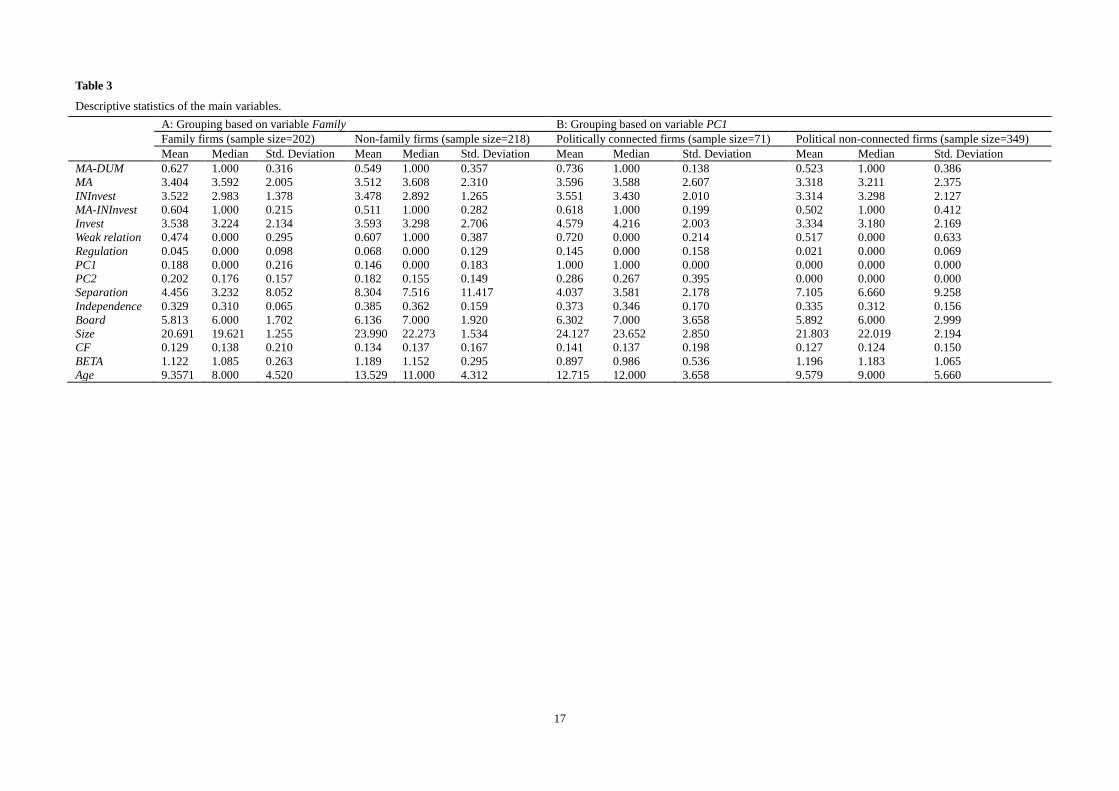
Table 3 reports the variables’ descriptive statistics based on the transforming enterprise sample. The sample
firms are divided into two groups according to the variables Family and PC1.
According to the data in part A, when using PC1 to measure political connection, 18.8% of the family
firms have political connections; using PC2 to measure political connection, 20.2% of the directors of family
firms have political connections, suggesting that China’s family listed companies are generally keen on being
associated with the government. In terms of business transformation mode, 62.7% of the family companies used
M&A, and 60.4% of the firms’ M&A amounts are greater than are those of their internal investment. In terms of
business transformation direction, 47.4% of the family firms entered an industry unrelated to their original main
business, and 4.5% entered government-regulated industries. In addition, the standard deviations of the size, age,
cash flow, and debt ratio variables of the sample enterprises are large, indicating significant differences in the
transforming enterprises’ internal characteristics. Furthermore, a comparison of family and non-family firms
shows that the means of PC1 and PC2 in the non-family group are lower than are those in the family group; the
means of MA-DUM and MA-INInvest in the family group are higher than are those in the non-family group; and
the means of Weak relation and Regulation in the family group are lower than are those in those in the
non-family group. According to the data in part B, 73.6% of the politically connected firms used M&A, and
61.8% of firms’ M&A amounts are higher than are those of their internal investment. In terms of business
transformation direction, 72.0% of politically connected firms entered weakly corrective industries, and 14.5%
entered government-regulated industries. Comparing politically connected with non-connected firms, the means
16
of MA-DUM, MA-INInvest, Weak relation, and Regulation in the politically connected group are higher than are
those in the politically non-connected group.
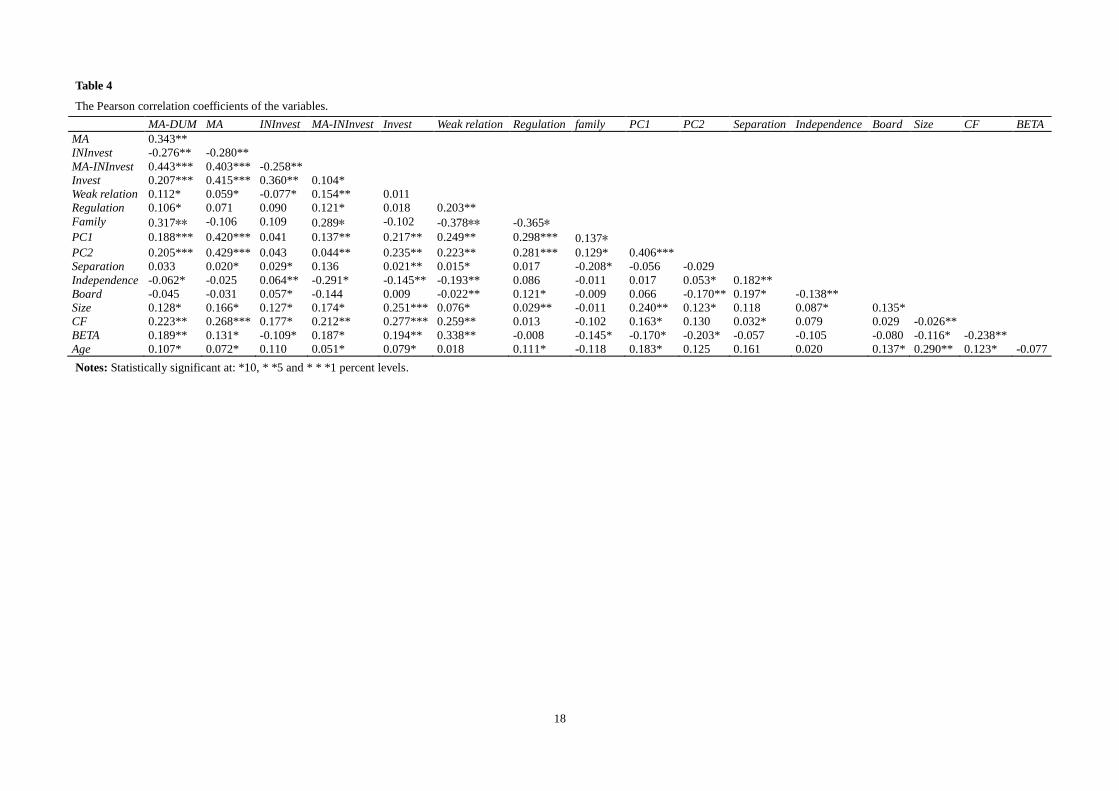
Table 4 reports the Pearson correlation coefficients of the main variables with the transformation family
firms as samples. According to the correlation coefficients, PC1 and PC2 are all significantly positively
correlated with MA-DUM, MA, MA-INInvest, Invest, Regulation, and Weak relation, indicating that firms with
political connections are more likely to adopt M&A than internal cultivation to conduct business transformation,
enter new industries unrelated to their original businesses, and enter government-regulated industries. In
addition, the absolute value of the explanatory variables’ correlation coefficient is less than 0.3. Following the
view in Lind (2006) that the collinear problem does not exist unless the threshold value is over 0.3, we believe
that, despite a certain degree of correlation between explanatory variables, the collinearity problem does not
exist.
17
Table 3
Descriptive statistics of the main variables.
A: Grouping based on variable Family B: Grouping based on variable PC1
Family firms (sample size=202) Non-family firms (sample size=218) Politically connected firms (sample size=71) Political non-connected firms (sample size=349)
Mean Median Std. Deviation Mean Median Std. Deviation Mean Median Std. Deviation Mean Median Std. Deviation
MA-DUM 0.627 1.000 0.316 0.549 1.000 0.357 0.736 1.000 0.138 0.523 1.000 0.386
MA 3.404 3.592 2.005 3.512 3.608 2.310 3.596 3.588 2.607 3.318 3.211 2.375
INInvest 3.522 2.983 1.378 3.478 2.892 1.265 3.551 3.430 2.010 3.314 3.298 2.127
MA-INInvest 0.604 1.000 0.215 0.511 1.000 0.282 0.618 1.000 0.199 0.502 1.000 0.412
Invest 3.538 3.224 2.134 3.593 3.298 2.706 4.579 4.216 2.003 3.334 3.180 2.169
Weak relation 0.474 0.000 0.295 0.607 1.000 0.387 0.720 0.000 0.214 0.517 0.000 0.633
Regulation 0.045 0.000 0.098 0.068 0.000 0.129 0.145 0.000 0.158 0.021 0.000 0.069
PC1 0.188 0.000 0.216 0.146 0.000 0.183 1.000 1.000 0.000 0.000 0.000 0.000
PC2 0.202 0.176 0.157 0.182 0.155 0.149 0.286 0.267 0.395 0.000 0.000 0.000
Separation 4.456 3.232 8.052 8.304 7.516 11.417 4.037 3.581 2.178 7.105 6.660 9.258
Independence 0.329 0.310 0.065 0.385 0.362 0.159 0.373 0.346 0.170 0.335 0.312 0.156
Board 5.813 6.000 1.702 6.136 7.000 1.920 6.302 7.000 3.658 5.892 6.000 2.999
Size 20.691 19.621 1.255 23.990 22.273 1.534 24.127 23.652 2.850 21.803 22.019 2.194
CF 0.129 0.138 0.210 0.134 0.137 0.167 0.141 0.137 0.198 0.127 0.124 0.150
BETA 1.122 1.085 0.263 1.189 1.152 0.295 0.897 0.986 0.536 1.196 1.183 1.065
Age 9.3571 8.000 4.520 13.529 11.000 4.312 12.715 12.000 3.658 9.579 9.000 5.660
18
Table 4
The Pearson correlation coefficients of the variables.
MA-DUM MA INInvest MA-INInvest Invest Weak relation Regulation family PC1 PC2 Separation Independence Board Size CF BETA
MA 0.343**
INInvest -0.276** -0.280**
MA-INInvest 0.443*** 0.403*** -0.258**
Invest 0.207*** 0.415*** 0.360** 0.104*
Weak relation 0.112* 0.059* -0.077* 0.154** 0.011
Regulation 0.106* 0.071 0.090 0.121* 0.018 0.203**
Family 0.317** -0.106 0.109 0.289* -0.102 -0.378** -0.365*
PC1 0.188*** 0.420*** 0.041 0.137** 0.217** 0.249** 0.298*** 0.137*
PC2 0.205*** 0.429*** 0.043 0.044** 0.235** 0.223** 0.281*** 0.129* 0.406***
Separation 0.033 0.020* 0.029* 0.136 0.021** 0.015* 0.017 -0.208* -0.056 -0.029
Independence -0.062* -0.025 0.064** -0.291* -0.145** -0.193** 0.086 -0.011 0.017 0.053* 0.182**
Board -0.045 -0.031 0.057* -0.144 0.009 -0.022** 0.121* -0.009 0.066 -0.170** 0.197* -0.138**
Size 0.128* 0.166* 0.127* 0.174* 0.251*** 0.076* 0.029** -0.011 0.240** 0.123* 0.118 0.087* 0.135*
CF 0.223** 0.268*** 0.177* 0.212** 0.277*** 0.259** 0.013 -0.102 0.163* 0.130 0.032* 0.079 0.029 -0.026**
BETA 0.189** 0.131* -0.109* 0.187* 0.194** 0.338** -0.008 -0.145* -0.170* -0.203* -0.057 -0.105 -0.080 -0.116* -0.238**
Age 0.107* 0.072* 0.110 0.051* 0.079* 0.018 0.111* -0.118 0.183* 0.125 0.161 0.020 0.137* 0.290** 0.123* -0.077
Notes: Statistically significant at: *10, * *5 and * * *1 percent levels.
19
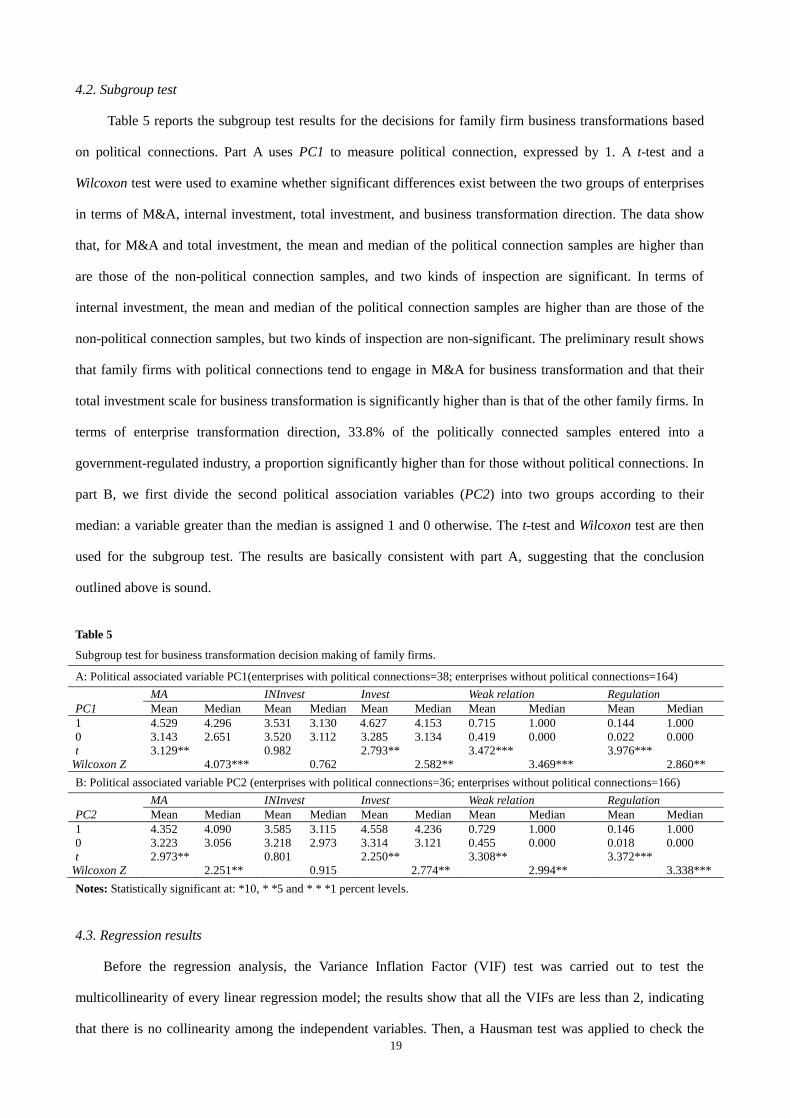
4.2. Subgroup test
Table 5 reports the subgroup test results for the decisions for family firm business transformations based
on political connections. Part A uses PC1 to measure political connection, expressed by 1. A t-test and a
Wilcoxon test were used to examine whether significant differences exist between the two groups of enterprises
in terms of M&A, internal investment, total investment, and business transformation direction. The data show
that, for M&A and total investment, the mean and median of the political connection samples are higher than
are those of the non-political connection samples, and two kinds of inspection are significant. In terms of
internal investment, the mean and median of the political connection samples are higher than are those of the
non-political connection samples, but two kinds of inspection are non-significant. The preliminary result shows
that family firms with political connections tend to engage in M&A for business transformation and that their
total investment scale for business transformation is significantly higher than is that of the other family firms. In
terms of enterprise transformation direction, 33.8% of the politically connected samples entered into a
government-regulated industry, a proportion significantly higher than for those without political connections. In
part B, we first divide the second political association variables (PC2) into two groups according to their
median: a variable greater than the median is assigned 1 and 0 otherwise. The t-test and Wilcoxon test are then
used for the subgroup test. The results are basically consistent with part A, suggesting that the conclusion
outlined above is sound.
Table 5
Subgroup test for business transformation decision making of family firms.
A: Political associated variable PC1(enterprises with political connections=38; enterprises without political connections=164)
MA INInvest Invest Weak relation Regulation
PC1 Mean Median Mean Median Mean Median Mean Median Mean Median
1 4.529 4.296 3.531 3.130 4.627 4.153 0.715 1.000 0.144 1.000
0 3.143 2.651 3.520 3.112 3.285 3.134 0.419 0.000 0.022 0.000
t 3.129** 0.982 2.793** 3.472*** 3.976***
Wilcoxon Z 4.073*** 0.762 2.582** 3.469*** 2.860**
B: Political associated variable PC2 (enterprises with political connections=36; enterprises without political connections=166)
MA INInvest Invest Weak relation Regulation
PC2 Mean Median Mean Median Mean Median Mean Median Mean Median
1 4.352 4.090 3.585 3.115 4.558 4.236 0.729 1.000 0.146 1.000
0 3.223 3.056 3.218 2.973 3.314 3.121 0.455 0.000 0.018 0.000
t 2.973** 0.801 2.250** 3.308** 3.372***
Wilcoxon Z 2.251** 0.915 2.774** 2.994** 3.338***
Notes: Statistically significant at: *10, * *5 and * * *1 percent levels.
4.3. Regression results
Before the regression analysis, the Variance Inflation Factor (VIF) test was carried out to test the
multicollinearity of every linear regression model; the results show that all the VIFs are less than 2, indicating
that there is no collinearity among the independent variables. Then, a Hausman test was applied to check the
20
regression models; the result shows that our panel data reject the hypothesis that the random effect model is
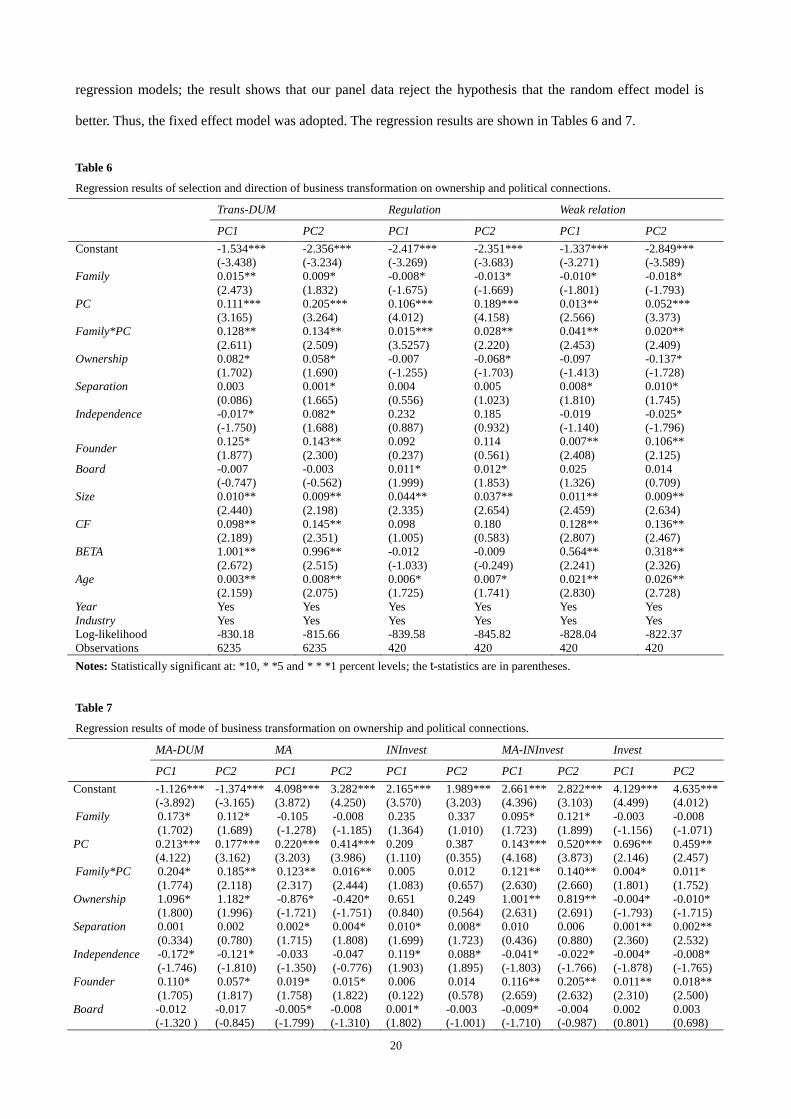
better. Thus, the fixed effect model was adopted. The regression results are shown in Tables 6 and 7.
Table 6
Regression results of selection and direction of business transformation on ownership and political connections.
Trans-DUM Regulation Weak relation
PC1 PC2 PC1 PC2 PC1 PC2
Constant -1.534***
(-3.438)
-2.356***
(-3.234)
-2.417***
(-3.269)
-2.351***
(-3.683)
-1.337***
(-3.271)
-2.849***
(-3.589)
Family 0.015**
(2.473)
0.009*
(1.832)
-0.008*
(-1.675)
-0.013*
(-1.669)
-0.010*
(-1.801)
-0.018*
(-1.793)
PC 0.111***
(3.165)
0.205***
(3.264)
0.106***
(4.012)
0.189***
(4.158)
0.013**
(2.566)
0.052***
(3.373)
Family*PC 0.128**
(2.611)
0.134**
(2.509)
0.015***
(3.5257)
0.028**
(2.220)
0.041**
(2.453)
0.020**
(2.409)
Ownership 0.082*
(1.702)
0.058*
(1.690)
-0.007
(-1.255)
-0.068*
(-1.703)
-0.097
(-1.413)
-0.137*
(-1.728)
Separation 0.003
(0.086)
0.001*
(1.665)
0.004
(0.556)
0.005
(1.023)
0.008*
(1.810)
0.010*
(1.745)
Independence -0.017*
(-1.750)
0.082*
(1.688)
0.232
(0.887)
0.185
(0.932)
-0.019
(-1.140)
-0.025*
(-1.796)
Founder 0.125*
(1.877)
0.143**
(2.300)
0.092
(0.237)
0.114
(0.561)
0.007**
(2.408)
0.106**
(2.125)
Board -0.007
(-0.747)
-0.003
(-0.562)
0.011*
(1.999)
0.012*
(1.853)
0.025
(1.326)
0.014
(0.709)
Size 0.010**
(2.440)
0.009**
(2.198)
0.044**
(2.335)
0.037**
(2.654)
0.011**
(2.459)
0.009**
(2.634)
CF 0.098**
(2.189)
0.145**
(2.351)
0.098
(1.005)
0.180
(0.583)
0.128**
(2.807)
0.136**
(2.467)
BETA 1.001**
(2.672)
0.996**
(2.515)
-0.012
(-1.033)
-0.009
(-0.249)
0.564**
(2.241)
0.318**
(2.326)
Age 0.003**
(2.159)
0.008**
(2.075)
0.006*
(1.725)
0.007*
(1.741)
0.021**
(2.830)
0.026**
(2.728)
Year Yes Yes Yes Yes Yes Yes
Industry Yes Yes Yes Yes Yes Yes
Log-likelihood -830.18 -815.66 -839.58 -845.82 -828.04 -822.37
Observations 6235 6235 420 420 420 420
Notes: Statistically significant at: *10, * *5 and * * *1 percent levels; the t-statistics are in parentheses.
Table 7
Regression results of mode of business transformation on ownership and political connections.
MA-DUM MA INInvest MA-INInvest Invest
PC1 PC2 PC1 PC2 PC1 PC2 PC1 PC2 PC1 PC2
Constant -1.126***
(-3.892)
-1.374***
(-3.165)
4.098***
(3.872)
3.282***
(4.250)
2.165***
(3.570)
1.989***
(3.203)
2.661***
(4.396)
2.822***
(3.103)
4.129***
(4.499)
4.635***
(4.012)
Family 0.173*
(1.702)
0.112*
(1.689)
-0.105
(-1.278)
-0.008
(-1.185)
0.235
(1.364)
0.337
(1.010)
0.095*
(1.723)
0.121*
(1.899)
-0.003
(-1.156)
-0.008
(-1.071)
PC 0.213***
(4.122)
0.177***
(3.162)
0.220***
(3.203)
0.414***
(3.986)
0.209
(1.110)
0.387
(0.355)
0.143***
(4.168)
0.520***
(3.873)
0.696**
(2.146)
0.459**
(2.457)
Family*PC 0.204*
(1.774)
0.185**
(2.118)
0.123**
(2.317)
0.016**
(2.444)
0.005
(1.083)
0.012
(0.657)
0.121**
(2.630)
0.140**
(2.660)
0.004*
(1.801)
0.011*
(1.752)
Ownership 1.096*
(1.800)
1.182*
(1.996)
-0.876*
(-1.721)
-0.420*
(-1.751)
0.651
(0.840)
0.249
(0.564)
1.001**
(2.631)
0.819**
(2.691)
-0.004*
(-1.793)
-0.010*
(-1.715)
Separation 0.001
(0.334)
0.002
(0.780)
0.002*
(1.715)
0.004*
(1.808)
0.010*
(1.699)
0.008*
(1.723)
0.010
(0.436)
0.006
(0.880)
0.001**
(2.360)
0.002**
(2.532)
Independence -0.172*
(-1.746)
-0.121*
(-1.810)
-0.033
(-1.350)
-0.047
(-0.776)
0.119*
(1.903)
0.088*
(1.895)
-0.041*
(-1.803)
-0.022*
(-1.766)
-0.004*
(-1.878)
-0.008*
(-1.765)
Founder 0.110*
(1.705)
0.057*
(1.817)
0.019*
(1.758)
0.015*
(1.822)
0.006
(0.122)
0.014
(0.578)
0.116**
(2.659)
0.205**
(2.632)
0.011**
(2.310)
0.018**
(2.500)
Board -0.012
(-1.320 )
-0.017
(-0.845)
-0.005*
(-1.799)
-0.008
(-1.310)
0.001*
(1.802)
-0.003
(-1.001)
-0.009*
(-1.710)
-0.004
(-0.987)
0.002
(0.801)
0.003
(0.698)
21
Size 0.009*
(1.778)
0.005*
(1.802)
0.022**
(2.337)
0.038**
(2.019)
0.004**
(2.416)
0.007**
(2.765)
0.002*
(1.702)
0.002*
(1.860)
0.099**
(2.333)
0.062**
(2.915)
CF 0.221
(0.551)
0.358
(0.838)
0.114*
(1.901)
0.073
(0.734)
0.099*
(1.710)
0.198
(1.082)
0.003
(0.732)
0.002
(1.355)
0.153**
(2.875)
0.207*
(1.890)
BETA 0.315*
(1.766)
1.076*
(1.930)
0.108*
(1.822)
0.083*
(1.698)
0.010
(0.901)
0.014
(0.625)
0.103*
(1.916)
0.211*
(1.942)
0.696**
(2.380)
0.887**
(2.813)
Age 0.087*
(1.771)
0.065*
(1.759)
0.035**
(2.556)
0.027*
(1.835)
0.010**
(2.769)
0.009**
(2.180)
0.008
(0.552)
0.006
(1.410)
0.012**
(2.538)
0.027**
(2.191)
Year Yes Yes Yes Yes Yes Yes Yes Yes Yes Yes
Industry Yes Yes Yes Yes Yes Yes Yes Yes Yes Yes
Log-likelihood -536.85 -529.66 -529.93 -525.12 -524.46 -515.37 -547.65 -522.85 -537.08 -530.28
Observations 420 420 420 420 420 420 420 420 420 420
Notes: Statistically significant at: *10, * *5 and * * *1 percent levels; the t-statistics are in parentheses.
Table 6 reports the regression results for ownership, political connections, and choice of business
transformation direction. The results show that, when the model uses Trans-DUM as the dependent variable, the
regression coefficient of Family is significantly positive at the 10% level. This means that, for enterprises
without political connections, family firms are more likely than are non-family ones to transform their core
business, which supports Hypothesis 1a. Additionally, according to the regression coefficient of Ownership,
which is significantly positive at the 10% level, the greater the family’s share ownership, the more likely the
firm is to transform its core business. The regression coefficients of PC (including PC1 and PC2) and
Family*PC are significantly positive at the 1% or 5% level, indicating that political connections make family
firms more likely to conduct business transformation, supporting Hypothesis 1b.
The results in Table 6 also show that, whether the dependent variable is Regulation or Weak relation, the
regression coefficient of Family is significantly negative at the 10% level. This indicates that, among politically
non-connected companies, family firms are more likely than are non-family firms to enter strong related
industries, while non-family firms are more likely than are family firms to enter regulated industries. Hence,
Hypotheses 2a and 3a are fully supported. Furthermore, the regression coefficient of Family*PC is significantly
positive at the 5% or 10% level, and its sum with that of Family is also positive, indicating that, compared with
the politically non-connected family firms, politically connected family firms are more likely to enter
government-regulated industries and weakly correlated industries. Thus, political connections increase family
firms’ chances of entering government-regulated industries. These results are consistent with the results of the
previous subgroup test, which support Hypotheses 2b and 3b.
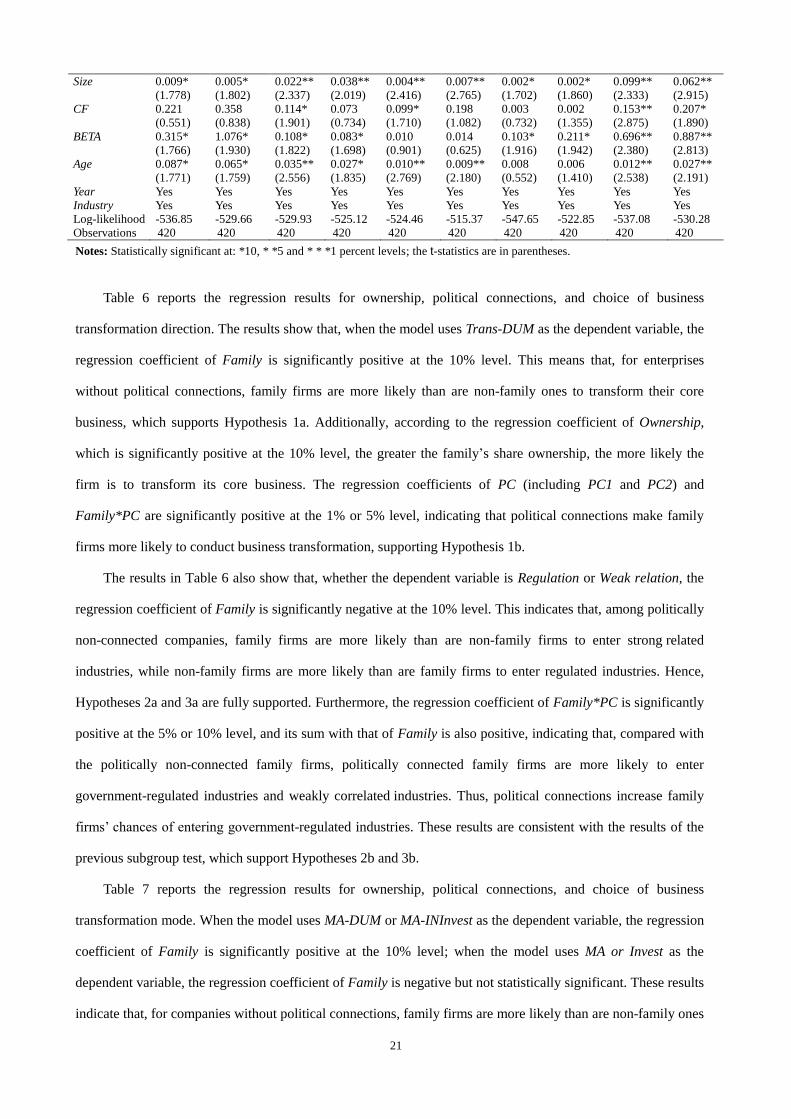
Table 7 reports the regression results for ownership, political connections, and choice of business
transformation mode. When the model uses MA-DUM or MA-INInvest as the dependent variable, the regression
coefficient of Family is significantly positive at the 10% level; when the model uses MA or Invest as the
dependent variable, the regression coefficient of Family is negative but not statistically significant. These results
indicate that, for companies without political connections, family firms are more likely than are non-family ones
22
to employ M&A to implement business transformation. Therefore, Hypothesis 4a is supported.
As Table 7 also shows, whether the dependent variable is MA-DUM, MA, MA-INInves, or Invest, the
regression coefficient of Family*PC is significantly positive at the 10% or 5% level, and its sum with that of
Family is also significantly positive. These results demonstrate that, compared with politically non-connected
family firms or politically connected non-family ones, politically connected family firms are more likely to
adopt M&A rather than internal cultivation to implement core business transformation; thus, hypothesis 4b is
fully supported.
Prior studies’ explanations of the factors in enterprise transformation strategy are drawn mainly from
company and environmental characteristics: performance and industrial decline are viewed as the fundamental
factors driving enterprise transformation. However, these studies ignore the influence of managers, especially
top managers, on enterprise behaviour. The literature is unable to convincingly explain several real-world
phenomena, such as why many companies with good performance and growth are also in favour of business
transformation and why many enterprises with the same operating conditions and industry backgrounds exhibit
significant differences in their transformation strategies. This paper’s research results show that ownership is
also an important factor in firms’ business transformation and that political connections have a significant
moderating effect on the relationship between family ownership and strategy choice for business transformation.
This not only provides a reasonable explanation for the above problems but also helps us understand the growth
strategies of family firms in transition economies.
4.4. Robustness test
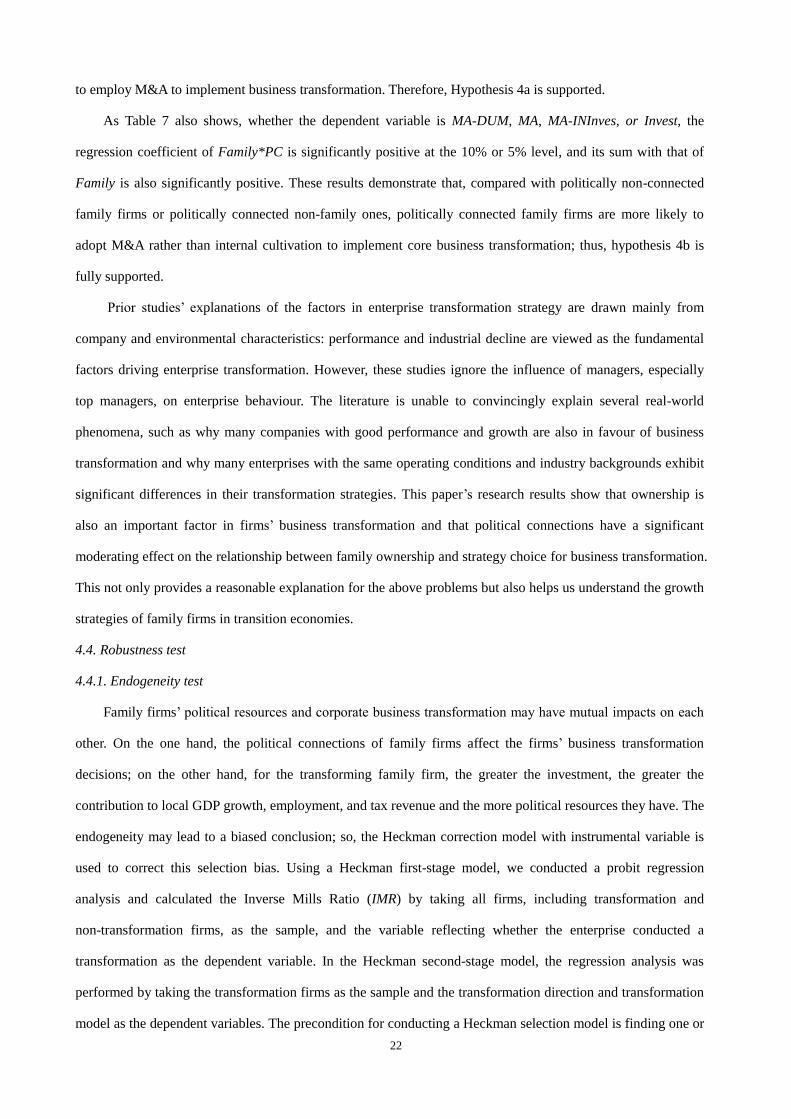
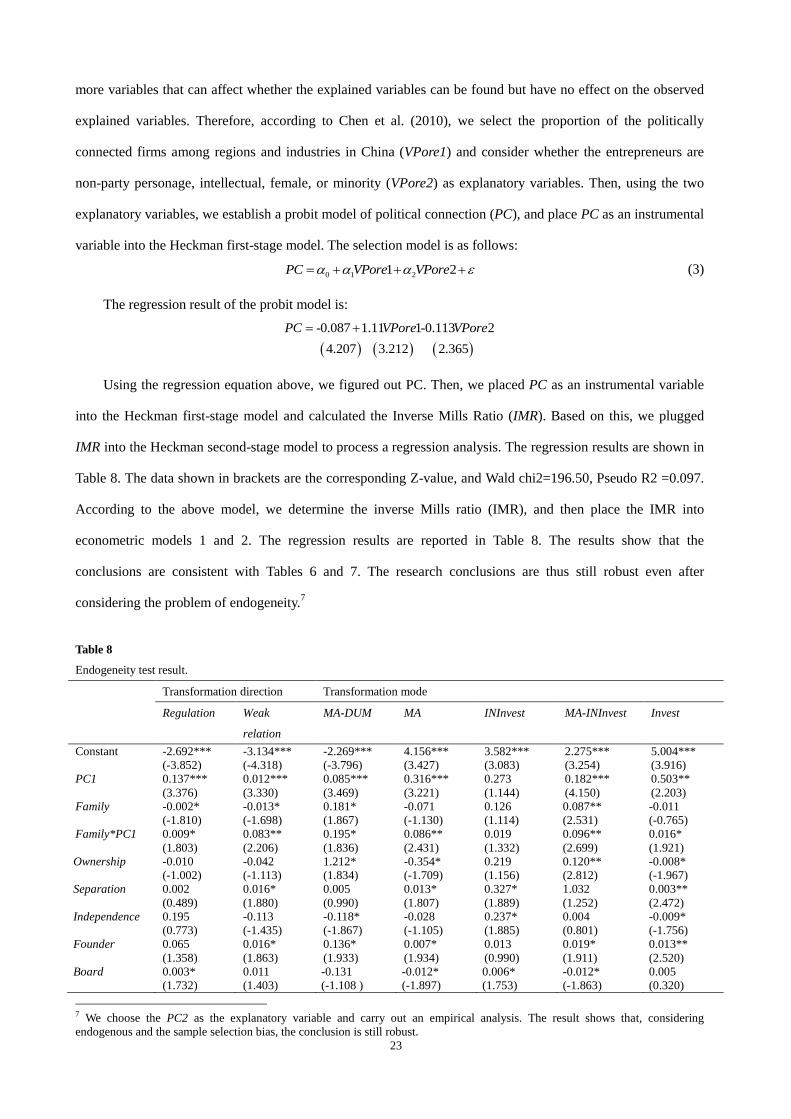
4.4.1. Endogeneity test
Family firms’ political resources and corporate business transformation may have mutual impacts on each
other. On the one hand, the political connections of family firms affect the firms’ business transformation
decisions; on the other hand, for the transforming family firm, the greater the investment, the greater the
contribution to local GDP growth, employment, and tax revenue and the more political resources they have. The
endogeneity may lead to a biased conclusion; so, the Heckman correction model with instrumental variable is
used to correct this selection bias. Using a Heckman first-stage model, we conducted a probit regression
analysis and calculated the Inverse Mills Ratio (IMR) by taking all firms, including transformation and
non-transformation firms, as the sample, and the variable reflecting whether the enterprise conducted a
transformation as the dependent variable. In the Heckman second-stage model, the regression analysis was
performed by taking the transformation firms as the sample and the transformation direction and transformation
model as the dependent variables. The precondition for conducting a Heckman selection model is finding one or
23
more variables that can affect whether the explained variables can be found but have no effect on the observed
explained variables. Therefore, according to Chen et al. (2010), we select the proportion of the politically
connected firms among regions and industries in China (VPore1) and consider whether the entrepreneurs are
non-party personage, intellectual, female, or minority (VPore2) as explanatory variables. Then, using the two
explanatory variables, we establish a probit model of political connection (PC), and place PC as an instrumental
variable into the Heckman first-stage model. The selection model is as follows:
0 1 21 2PC VPore VPore (3)
The regression result of the probit model is:
-0.087 1.11 1-0.113 2
4.207 3.212 2.365
PC VPore VPore
Using the regression equation above, we figured out PC. Then, we placed PC as an instrumental variable
into the Heckman first-stage model and calculated the Inverse Mills Ratio (IMR). Based on this, we plugged
IMR into the Heckman second-stage model to process a regression analysis. The regression results are shown in
Table 8. The data shown in brackets are the corresponding Z-value, and Wald chi2=196.50, Pseudo R2 =0.097.
According to the above model, we determine the inverse Mills ratio (IMR), and then place the IMR into
econometric models 1 and 2. The regression results are reported in Table 8. The results show that the
conclusions are consistent with Tables 6 and 7. The research conclusions are thus still robust even after
considering the problem of endogeneity.7
Table 8
Endogeneity test result.
Transformation direction Transformation mode
Regulation Weak
relation
MA-DUM MA INInvest MA-INInvest Invest
Constant -2.692***
(-3.852)
-3.134***
(-4.318)
-2.269***
(-3.796)
4.156***
(3.427)
3.582***
(3.083)
2.275***
(3.254)
5.004***
(3.916)
PC1 0.137***
(3.376)
0.012***
(3.330)
0.085***
(3.469)
0.316***
(3.221)
0.273
(1.144)
0.182***
(4.150)
0.503**
(2.203)
Family -0.002*
(-1.810)
-0.013*
(-1.698)
0.181*
(1.867)
-0.071
(-1.130)
0.126
(1.114)
0.087**
(2.531)
-0.011
(-0.765)
Family*PC1 0.009*
(1.803)
0.083**
(2.206)
0.195*
(1.836)
0.086**
(2.431)
0.019
(1.332)
0.096**
(2.699)
0.016*
(1.921)
Ownership -0.010
(-1.002)
-0.042
(-1.113)
1.212*
(1.834)
-0.354*
(-1.709)
0.219
(1.156)
0.120**
(2.812)
-0.008*
(-1.967)
Separation 0.002
(0.489)
0.016*
(1.880)
0.005
(0.990)
0.013*
(1.807)
0.327*
(1.889)
1.032
(1.252)
0.003**
(2.472)
Independence 0.195
(0.773)
-0.113
(-1.435)
-0.118*
(-1.867)
-0.028
(-1.105)
0.237*
(1.885)
0.004
(0.801)
-0.009*
(-1.756)
Founder 0.065
(1.358)
0.016*
(1.863)
0.136*
(1.933)
0.007*
(1.934)
0.013
(0.990)
0.019*
(1.911)
0.013**
(2.520)
Board 0.003*
(1.732)
0.011
(1.403)
-0.131
(-1.108 )
-0.012*
(-1.897)
0.006*
(1.753)
-0.012*
(-1.863)
0.005
(0.320)
7 We choose the PC2 as the explanatory variable and carry out an empirical analysis. The result shows that, considering
endogenous and the sample selection bias, the conclusion is still robust.
24
Size 0.001**
(2.685)
0.008**
(2.210)
0.003*
(1.839)
0.009**
(2.664)
0.011**
(2.856)
0.007*
(1.821)
0.035**
(2.853)
CF 0.021
(0.733)
0.098**
(2.377)
0.427
(0.968)
0.138*
(1.870)
0.034*
(1.991)
0.012
(1.206)
0.098**
(2.235)
BETA -0.038
(-1.296)
0.395**
(2.741)
0.296*
(1.930)
0.311*
(1.777)
0.043
(1.335)
0.088*
(1.772)
0.464**
(2.968)
Age 0.002*
(1.808)
0.004**
(2.599)
0.072*
(1.666)
0.020**
(2.996)
0.008**
(2.319)
0.002
(1.379)
0.005***
(3.037)
IMR -0.006
(-0.783)
-0.007
(-0.691)
-0.004
(-0.942)
-0.005
(-1.205)
-0.004
(-0.991)
-0.005
(-1.010)
-0.003
(-0.436)
Year Yes Yes Yes Yes Yes Yes Yes
Industry Yes Yes Yes Yes Yes Yes Yes
Adj-R2 0.132 0.108 0.118 0.104 0.105 0.098 0.092
Observations 420 420 420 420 420 420 420
Notes: Statistically significant at: *10, * *5 and * * *1 percent levels; the t-statistics are in parentheses.
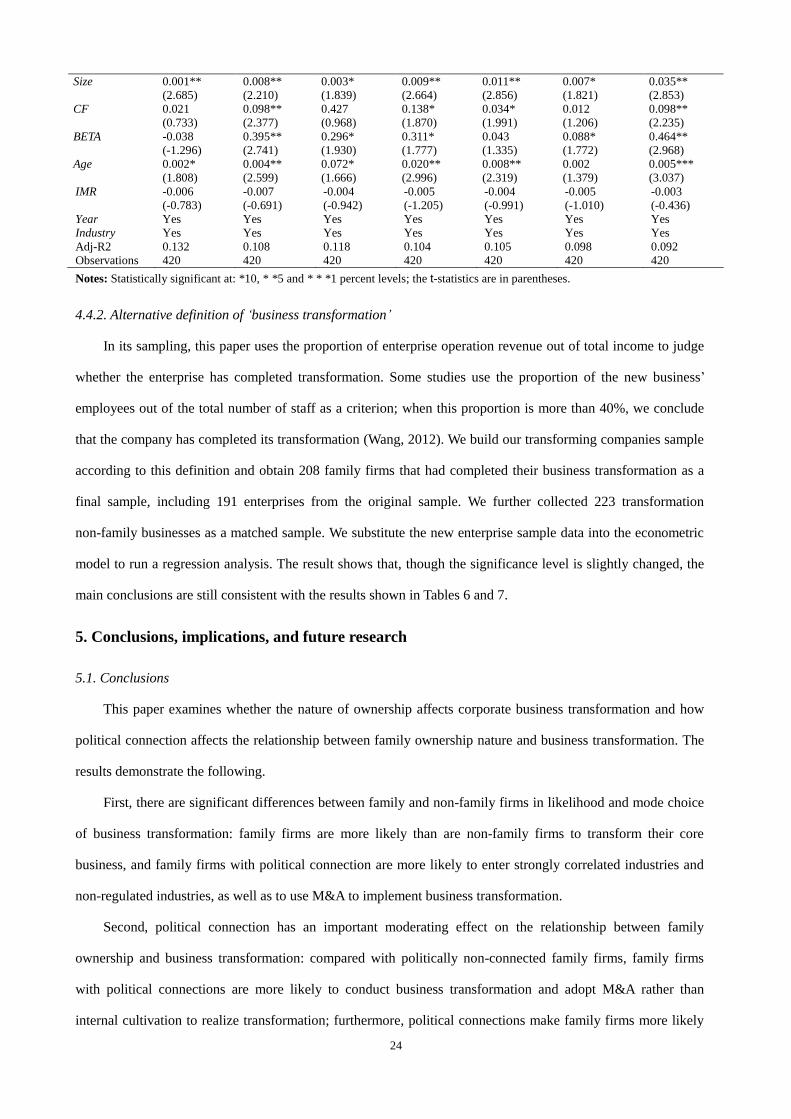
4.4.2. Alternative definition of ‘business transformation’
In its sampling, this paper uses the proportion of enterprise operation revenue out of total income to judge
whether the enterprise has completed transformation. Some studies use the proportion of the new business’
employees out of the total number of staff as a criterion; when this proportion is more than 40%, we conclude
that the company has completed its transformation (Wang, 2012). We build our transforming companies sample
according to this definition and obtain 208 family firms that had completed their business transformation as a
final sample, including 191 enterprises from the original sample. We further collected 223 transformation
non-family businesses as a matched sample. We substitute the new enterprise sample data into the econometric
model to run a regression analysis. The result shows that, though the significance level is slightly changed, the
main conclusions are still consistent with the results shown in Tables 6 and 7.
5. Conclusions, implications, and future research
5.1. Conclusions
This paper examines whether the nature of ownership affects corporate business transformation and how
political connection affects the relationship between family ownership nature and business transformation. The
results demonstrate the following.
First, there are significant differences between family and non-family firms in likelihood and mode choice
of business transformation: family firms are more likely than are non-family firms to transform their core
business, and family firms with political connection are more likely to enter strongly correlated industries and
non-regulated industries, as well as to use M&A to implement business transformation.
Second, political connection has an important moderating effect on the relationship between family
ownership and business transformation: compared with politically non-connected family firms, family firms
with political connections are more likely to conduct business transformation and adopt M&A rather than
internal cultivation to realize transformation; furthermore, political connections make family firms more likely
25
to enter new industries weakly related to their original core businesses and to increase their chances of entering
government-regulated industries.
Our results not only provide new perspectives on the determinants of the direction and mode of corporate
business transformation but also reveal the impact of political connections on the business transformation
strategies of family firms. Research on ways to improve family firms’ business transformation decisions should
thus take the institutional environment, and especially the political connection, into consideration.
5.2. Implications
Several managerial implications follow from these findings.
Our results indicate that the willingness of family firms to transform their core business is much greater
than that of non-family firms, especially when they have political connections. In theory, business
transformation should be a kind of self-adaption behaviour conducted when firms face huge environmental
changes and aim to realize sustainable growth. Some forced, blind, or even frequent business transformations
are the expression of a lack of a long-term strategic perspective. Family firms should fully recognize the
complexity of business transformation and avoid blind business transformations by improving internal corporate
governance mechanisms. In addition, due to the quick returns, family firms are likely to use M&A rather than
internal cultivation to conduct business transformation, especially when they have political connections.
Inadequate internal investment may have negative impacts on its international competitive capacity, which is
not beneficial for family firms’ long-run development. Thus, family firms should consider the relationship
between internal cultivation and M&A during business transformation.
Second, our conclusions show that family firms’ political connections eliminate imperfect market
mechanisms’ negative effects on firm development and conduce to increased investment opportunities,
especially in regulated industries. The government should promote political and economic institutional reform
and perfect China’s market system. Doing so will guarantee that enterprises’ instincts will be carried out on a
transparent, fair, and open platform, which will reduce family firms’ business transformation costs. Further,
given the current global economic downturn, only if family firms transform and upgrade (aside from the
constant expansion of their scale) will the Chinese economy develop in a sustainable and healthy way. The
production and operations of China’s family firms are currently located at the low end of the value chain. As
China’s demographic dividend is tapering off and as the RMB has continued to appreciate, family firms are
encountering severe challenges to their extensive mode of production and management. Permitting private
capital into some regulated industries, such as infrastructure construction, telecom, or financial sector, may not
only promote family firms’ business transformation and upgrading but also improve production efficiency in
26
those industries.
5.3. Limitations and future research
As with any empirical research, this study has limitations. First, our sample comes from Chinese family
corporations; small and non-listed family companies, the major component of China’s market, were not taken
into consideration. Thus, future research should study how political connections impact the transformation of
small and medium-sized family firms and its economic consequences. Second, we use second-hand data instead
of primary data to verify our conclusions, which may lead to some subjectivity concerning variable values. For
example, we measure family corporations’ political connections based on whether the firms’ senior executive is
a deputy in the NPC, member of the CPPC, a party representative, or a former public official. However, this
approach covers only those cases in which the family firm has contacted the government or an official implicitly
or informally, thus revealing only the tip of the iceberg of political connectedness.8 Future research should
describe political connections in a more detailed and realistic way in order to reveal their dynamic features and
their influence on family firms. Finally, a corporation’s business transformation includes two aspects—entering
a new industry and exiting the primary core business. This study examined political connections’ influence on
firms’ choice of entry mode; their influence on the way firms quit their primary core business needs further
investigation.
References
Allen, F., Qian, J., & Qian, M. (2005). Law, finance, and economic growth in China. Journal of financial
economics. 77 (1), 57-116.
Almeida, H., & Wolfenzon, D. (2006). Should business groups be dismantled? The equilibrium costs of efficient
internal capital markets. Journal of Financial Economics. 79 (1), 99-144.
Amihud,Y., & Lev,B. (1999). Does corporate ownership structure affect it’s strategy towards diversification?.
Strategic Management Journal. 20, 1063-1069.
Anderson, R. C., & Reeb, D. M. (2003). Founding‐family ownership and firm performance: evidence from the
S&P 500. The Journal of Finance, 58(3), 1301-1328.
Aspara, J., Lamberg, J. A., Laukia, A., & Tikkanen, H. (2013). Corporate business model transformation and
8 Some researchers (Kang, 2002, Kang, 2003; Ip, 2008) consider that most Asian countries, including China, are significantly
characterised by crony capitalism, in which power colludes with capital to occupy and monopolize social wealth, preventing less
powerful players from acquiring wealth through their diligence and wisdom. The enterprise business transformation case study
also finds that relatives and close friends of many government officials occupy senior positions in private firm management,
indicating that those corporations have strong political connections. Due to the low visibility of those connections and the
non-listed property of the enterprises, it is too difficult to collect the relevant data. Those kinds of corporations will be investigated
in future studies.
27
inter-organizational cognition: The Case of Nokia. Long Range Planning. 46 (6), 459-474.
Barontini, R., & Caprio, L. (2006). The effect of family control on firm value and performance: Evidence from
continental Europe. European Financial Management, 12(5), 689-723.
Biggadike, R. (1979). The risky business of diversification. Harvard Business Review. 57 (3), 103-111.
Boubakri, N., Cosset, J. C., & Saffar, W. (2008). Political connections of newly privatized firms. Journal of
Corporate Finance. 14 (5), 654-673.
Burt, R. S. (1992). Structural holes: The structure of social capital competition. MA: Harvard University Press,
Cambridge.
Carney, M. (2005). Corporate governance and competitive advantage in family-controlled firms.
Entrepreneurship Theory and Practice, 29(3), 249-265.
Carter, S., Ram, M., & Dimitratos, P. (2004). Portfolio entrepreneurship: a description and its link to
international entrepreneurship. Emerging Paradigms in International Entrepreneurship, 89.
Chen, C. J., Li, Z., Su, X., & Sun, Z. (2011). Rent-seeking incentives, corporate political connections, and the
control structure of private firms: Chinese evidence. Journal of Corporate Finance, 17 (2), 229-243.
Chen, S. Y., Jing, R. T., Long, X. N., & Shao, Y. F. (2010). An empirical study on the impact of the social
relationship capital of private entrepreneur on R&D investment decisions. Management World, (1), 88-97.
Chu, W. (2011). Family ownership and firm performance: Influence of family management, family control, and
firm size. Asia Pacific Journal of Management, 28(4), 833-851.
Claessens, S., Djankov, S., & Lang, L. H. (2000). The separation of ownership and control in East Asian
corporations. Journal of financial Economics, 58(1), 81-112.
Delmar, F., Davidsson, P., & Gartner, W. B. (2003). Arriving at the high-growth firm. Journal of Business
Venturing. 18 (2), 189-216.
Detomasi, D. A. (2008). The political roots of corporate social responsibility. Journal of Business Ethics. 82 (4),
807-819.
Ding, S., Jia, C., Wu, Z., & Zhang, X. (2014). Executive political connections and firm performance:
Comparative evidence from privately-controlled and state-owned enterprises. International Review of
Financial Analysis. 36, 153-167
Dyer, W. G. (2006). Examining the “family effect” on firm performance. Family business review, 19(4),
253-273.
Faccio, M. (2006). Politically connected firms. The American Economic Review, 96(1), 369-386.
Fahlenbrach, R. (2009). Founder-CEOs, investment decisions, and stock market performance. Journal of
28
financial and Quantitative Analysis, 44(2), 439-466.
Fan, J., Rui, O., & Zhao, M. (2006). Rent seeking and corporate finance: Evidence from corruption cases.
Corporate Finance and Intermediation, 3, 253-303.
Fukuyama, F. (1995). Trust: The social virtues and the creation of prosperity. New York: Free press.
Garnaut, R., Song, L., Yao, Y., & Wang, X. (2012). Private enterprise in China. CAN: ANU E Press.
Gordon, S. S., Stewart, W. H., Sweo, R., & Luker, W. A. (2000). Convergence versus strategic reorientation:
The antecedents of fast-paced organizational change. Journal of Management. 26 (5), 911-945.
Greene, W. H. (2011), Econometric Analysis (7th Edition).NJ: Prentice Hall Press.
Habbershon, T. G., & Pistrui, J. (2002). Enterprising families domain: Family-influenced ownership groups in
pursuit of transgenerational wealth. Family Business Review, 15(3), 223-237.
Habbershon, T. G. (2006). Commentary: A framework for managing the familiness and agency advantages in
family firms. Entrepreneurship theory and practice, 30(6), 879-886.
Habbershon, T. G., & Williams, M. L. (1999). A resource-based framework for assessing the strategic
advantages of family firms. Family Business Review,12(1), 1-25.
Hu, X. Y., & Shi, J. C. (2008). Political resource and diversification of Chinese private enterprises: Evidence
from the largest 500 private enterprises. China Industrial Economics, 4, 4-14.
Houston, J. F., Jiang, L., Lin, C., & Ma, Y. (2014). Political connections and the cost of bank loans. Journal of
Accounting Research. 52 (1), 193-243.
Jia, N. (2015). Political strategy and market capabilities: Evidence from the Chinese private sector. Management
and Organization Review, 1-28.
Jiang, Y., & Peng, M. W. (2011). Are family ownership and control in large firms good, bad, or irrelevant?. Asia
Pacific Journal of Management, 28(1), 15-39.
Jackowicz, K., Kozłowski, Ł., & Mielcarz, P. (2014). Political connections and operational performance of
non-financial firms: New evidence from Poland. Emerging Markets Review. 20, 109-135.
Kang, D. (2000). The impact of family ownership on performance in public organizations: A study of the US
Fortune 500, 1982-1994. Academy of Management Meetings, Toronto, Canada.
Kang, D. C. (2002), Crony capitalism: Corruption and development in South Korea and the Philippines.
Cambridge University Press.
Kang, D. C. (2003). Transaction costs and crony capitalism in East Asia. Comparative Politics. 35 (4), 439-458.
Koka, B. R., & Prescott, J. E. (2002). Strategic alliances as social capital: A multidimensional view. Strategic
management journal, 23(9), 795-816.
29
Kotter, J. P. (1995). Leading change: Why transformation efforts fail. Harvard business review, 73(2), 59-67.
Li, H., Meng, L., Wang, Q., & Zhou, L. A. (2008). Political connections, financing and firm performance:
Evidence from Chinese private firms. Journal of development economics. 87 (2), 283-299.
Li, W., Au, K. Y. F., He, A., & Song, L. (2015). Why do family-controlled firms donate to charity? The role of
intrafamily succession intention, social status, and religiosity. Management and Organization Review,
11(04), 621-644.
Li, X. C., Chen, L., Chua, J. H., Kirkman, B. L., Rynes-Weller, S., & Gomez-Mejia, L. (2015). Research on
Chinese family businesses: Perspectives. Management and Organization Review, 11(04), 579-597.
Liu, N., Wang, L., & Zhang, M. (2013). Corporate ownership, political connections and M&A: Empirical
evidence from China. Asian Economic Papers. 12 (3), 41-57.
Lind, D. A., Marchal, W. G., & Wathen, S. A. 2006. Basic Statistics for Business and Economics. Boston:
McGraw-Hill/Irwin.
Maug, E. (1998). Large shareholders as monitors: is there a trade-off between liquidity and control?. The
Journal of Finance, 53(1), 65-98.
McFadden D.(1974). Conditional Logit analysis of qualitative choice behavior//Zarembka P. Frontiers in
Econometrics. New York: Academic Press, 102-142.
Miralles-Marcelo, J. L., del Mar Miralles-Quirós, M., & Lisboa, I. (2014). The impact of family control on firm
performance: Evidence from Portugal and Spain. Journal of Family Business Strategy, 5(2), 156-168.
Muttakin, M. B., Monem, R. M., Khan, A., & Subramaniam, N. (2015). Family firms, firm performance and
political connections: Evidence from Bangladesh. Journal of Contemporary Accounting & Economics, 11(3),
215-230.
Patel, P. C., & Chrisman, J. J. (2014). Risk abatement as a strategy for R&D investments in family firms.
Strategic Management Journal, 35(4), 617-627.
Pehrsson, A. (2006). Business relatedness and performance: A study of managerial perceptions. Strategic
Management Journal. 27 (3), 265-282.
Plate, M., Schiede, C., & Von Schlippe, A. (2010). Portfolio entrepreneurship in the context of family owned
businesses. Transgenerational entrepreneurship, Edward Elgar Publishing, 96-123.
Porter, M. E. (1991). Towards a dynamic theory of strategy. Strategic Management Journal. 12 (S2), 95-117.
Richardson, S. (2006). Over-investment of free cash flow. Review of accounting studies. 11 (2-3), 159-189.
Riviezzo, A., Garofano, A., Napolitano, M. R., & Marino, V. (2015). Moving forward or running to standstill?
Exploring the nature and the role of family firms’ strategic orientation. Journal of Family Business
30
Strategy, 6(3), 190-205.
San Martin-Reyna, J. M., & Duran-Encalada, J. A. (2012). The relationship among family business, corporate
governance and firm performance: Evidence from the Mexican stock exchange. Journal of Family Business
Strategy, 3(2), 106-117.
Shleifer, A., & Vishny, R. W. (1997). A survey of corporate governance. The Journal of Finance, 52(2),
737-783.
Sirmon, D. G., & Hitt, M. A. (2003). Managing resources: Linking unique resources, management, and wealth
creation in family firms. Entrepreneurship theory and practice, 27(4), 339-358.
Su, Z. Q., Fung, H. G., & Yau, J. (2013). Political connections and corporate overinvestment: evidence from
China. International Journal of Accounting and Information Management. 21 (4), 285-296.
Su, J., Zhang, M., & Zhang, W. (2013). The effect of political connections on acquisition-evidence from
Chinese nonSOEs. Applied Financial Economics. 23 (24), 1871-1890.
Sun, P., Mellahi, K., & Thun, E. (2010). The dynamic value of MNE political embeddedness: The case of the
Chinese automobile industry. Journal of International Business Studies. 41 (7), 1161-1182.
Ucbasaran, D., Westhead, P., & Wright, M. (2001). The focus of entrepreneurial research: contextual and
process issues. Entrepreneurship theory and practice, 25(4), 57-80.
Wang, D. L. (2012), Industry Positioning Transformation and Management of Enterprise, Beijing: China
Economic Publishing House.
Wu, J., & Cheng, M. L. (2011). The impact of managerial political connections and quality on government
subsidies: Evidence from Chinese listed firms. Chinese Management Studies. 5 (2), 207-226.
Wu, W., Wu, C., Zhou, C., & Wu, J. (2012). Political connections, tax benefits and firm performance: Evidence
from China. Journal of Accounting and Public Policy, 31(3), 277-300.
Xu, N., Xu, X., & Yuan, Q. (2013). Political connections, financing friction, and corporate investment:
Evidence from Chinese listed family firms. European Financial Management, 19(4), 675-702.
Xu, N., Yuan, Q., Jiang, X., & Chan, K. C. (2015). Founder's political connections, second generation
involvement, and family firm performance: Evidence from China. Journal of Corporate Finance, 33,
243-259.
Zahra, S. A. (2003). International expansion of US manufacturing family businesses: The effect of ownership
and involvement. Journal of business venturing, 18(4), 495-512.
Zahra, S. A., Hayton, J. C., & Salvato, C. (2004). Entrepreneurship in family vs. Non-Family firms: A
Resource-Based analysis of the effect of organizational culture. Entrepreneurship theory and Practice, 28(4),

31
363-381.
Zahra, S. A. (2005). Entrepreneurial risk taking in family firms. Family Business Review, 18(1), 23-40.
Zhao, R. (2013). Social capital, investment opportunity and investment efficiency of listed companies.
Macroeconomics, (1), 65-72.
Zhou, W. (2013). Political connections and entrepreneurial investment: Evidence from China's transition
economy. Journal of Business Venturing. 28 (2), 299-315.
Zook, C., & Allen, J. (2010), Profit from the core: A return to growth in turbulent times. Boston
Massachusetts: Harvard Business school.