POLITECNICO DI TORINO filePOLITECNICO DI TORINO Chemical and Materials Engineering College Degree of...
49
POLITECNICO DI TORINO Chemical and Materials Engineering College Degree of Chemical and Sustainable Processes Engineering Master of Science Thesis Functionalized polyethersulfone-based membranes for pervaporation Supervisors Student
-
Upload
trinhkhuong -
Category
Documents
-
view
214 -
download
0
Transcript of POLITECNICO DI TORINO filePOLITECNICO DI TORINO Chemical and Materials Engineering College Degree of...

POLITECNICO DI TORINO
Chemical and Materials Engineering College
Degree of Chemical and Sustainable Processes Engineering
Master of Science Thesis
Functionalized polyethersulfone-based
membranes for pervaporation
Supervisors Student

2
Table of contents List of figures .......................................................................................................................................... 4
List of tables ............................................................................................................................................ 5
Abstract ................................................................................................................................................... 6
Introduction ........................................................................................................................................... 18
1 Literature Review ................................................................................................................................. 5
1.1 Pervaporation ................................................................................................................................. 5
1.1.1 Generality and background history ........................................................................................ 5
1.1.2 Theoretical Background ......................................................................................................... 5
1.2 Membrane materials ...................................................................................................................... 7
1.3 Dehydration of ethanol .................................................................................................................. 7
1.3.1 Membranes for dehydration of ethanol .................................................................................. 8
1.4 UV photoirradiation method .......................................................................................................... 9
2 Materials and Methods ....................................................................................................................... 11
2.1 Preparation of the membrane ....................................................................................................... 11
2.1.1 Materials ............................................................................................................................... 11
2.1.2 Modification procedure ........................................................................................................ 11
2.2 Characterization of the membrane ............................................................................................... 13
2.2.1 Scanning electron microscopy (SEM) .................................................................................. 13
2.2.2 FTIR ..................................................................................................................................... 13
2.2.3 X-ray Photoelectron Spectroscopy (XPS) ............................................................................ 14
2.2.4 Thermogravimetric Analysis (TGA) .................................................................................... 14
2.3 Pervaporation experiment ............................................................................................................ 15
2.3.1 Set-up ................................................................................................................................... 15
3 Results and Discussion ....................................................................................................................... 20
3.1 Scanning electron microscopy (SEM) results ............................................................................. 20
3.2 FTIR results ................................................................................................................................. 20
3.3 X-ray Photoelectron Spectroscopy (XPS) results ........................................................................ 21
3.4 Thermogravimetric Analysis (TGA) results ................................................................................ 23
3.5 Pervaporation experiments results ............................................................................................... 26
3.5.1 Effect of water content in feed ............................................................................................. 27
3.5.2 Effect of feed temperature .................................................................................................... 27
3.5.3 Effect of permeate pressure .................................................................................................. 28
3.6 Conclusions ................................................................................................................................. 28
3
4 Conclusions ........................................................................................................................................ 29
References ............................................................................................................................................. 30

4
List of figures Fig-1.1 Simplified scheme of pervaporation process [2] ........................................................... 6 Fig-1.2 Solution-diffusion model [11] ....................................................................................... 6 Fig-2.1 Holder .......................................................................................................................... 12 Fig-2.2 UV system .................................................................................................................. 12 Fig-2.3 ATR-FTIR Spectometer .............................................................................................. 14 Fig-2.4 Experimental apparatus for pervaporation scheme ..................................................... 15 Fig-2.5 Experimental apparatus for pervaporation .................................................................. 16 Fig-2.6 Feed tank ..................................................................................................................... 17 Fig-2.7 Membrane cell ............................................................................................................. 17 Fig-2.8Vacuum pump .............................................................................................................. 18 Fig-2.9 Cold trap ..................................................................................................................... 19 Fig-3.1 SEM images. ............................................................................................................... 20 Fig-3.2 ATR-FTIR spectrum of the pristine and modified membranes. Grafting
polymerization conditions were 25% VSA, 2.5% MBAA, 5% VTES, 10% TEOSt = 10 min, ....................................................................................................................................... 21
Fig-3.3 TGA for a modified membrane. Grafting polymerization conditions were 25% VSA 5% MBAA, t = 10 min,I= 65 mW/cm2 ................................................................................ 24
Fig-3.4 TGA for a modified membrane. Grafting polymerization conditions were 25% VSA 5% MBAA 2,5% VTES 5% TEOS, t = 10 min,I= 65 mW/cm2 .......................................... 25
Fig-3.5 TGA for a modified membrane. Grafting polymerization conditions were 25% VSA 5% MBAA 2,5% VTES 15% TEOS, t = 10 min,I= 65 mW/cm2 ........................................ 26

5
List of tables Tab-3.1 Peak Binding Energy (eV) for modified membranes ................................................. 22 Tab-3.2 Atomic concentration and atomic ratio of C/Si, O/Si and N/Si for modified
membranes ........................................................................................................................... 22 Tab-3.3 Temperatures and weight loss registered during thermal degradation ...................... 23 Tab-3.4 Pervaporation experiments results ............................................................................. 27

6
Riassunto in italiano
I. Introduzione e letteratura La pervaporazione è un processo a membrana usato per la separazione di miscele di liquidi. Questo processo rispettoso dell’ambiente e efficiente in termini di costi, permette di separare
le miscele anche quando i due liquidi in esame hanno punti di ebollizione simili o formano miscele azeotropiche [1]. È una delle più attraenti tecnologie usate per la separazione dei liquidi grazie ad una serie di vantaggi: opera in condizioni di temperatura e pressione blande, ha un basso consumo energetico, non richiede l’impiego di additivi e si integra facilmente in altri processi di separazione o reazione. È tra le più valide alternative ai comuni metodi di distillazione [5]. La pervaporazione viene applicata in tre differenti applicazioni: disidratazione di un solvente, separazione di due solventi o rimozione di un solvente da soluzioni acquose. Tra esse, la rimozione di acqua da soluzioni organiche, in particolare la disidratazione dell’etanolo, è l’applicazione maggiormente studiata e utilizzata su scala
industriale.
La parola "pervaporazione" fu coniata nel 1917 da Kober [6]. Durante gli anni '50, Binning e colleghi di American Oil [7] iniziarono a studiare il processo in modo sistematico e poi negli anni '70 Eli Perry e altri a Monsanto [8]. Il primo sistema a membrana su scala commerciale fu installato nel 1982 da GFT (Gesell-schaftfűrTrenntechnik, Amburgo, Germania) per separare miscele di etanolo e acqua attraverso la pervaporazione [5]. In questo sistema venne utilizzata una membrana composita con alcool polivinilico come strato attivo per separare le miscele azeotropiche di etanolo/acqua [9]. Da allora, la pervaporazione si è sviluppata rapidamente in applicazioni su larga scala e diverse aziende hanno iniziato a produrre membrane commerciali per la pervaporazione. Oggi sono installati in tutto il mondo centinaia di sistemi di pervaporazione, mentre la ricerca sull’argomento continua a crescere.
Una membrana è l'interfase tra due fasi adiacenti e agisce come una barriera selettiva e regola il trasporto di sostanze tra i due compartimenti [5]. Per consentire il flusso di sostanze è necessaria una forza spingente attraverso la membrana. La pervaporazione è una tecnologia di separazione a membrana che combina la permeazione e l'evaporazione attraverso la membrana per la separazione selettiva delle miscele liquide. Un processo generale di pervaporazione è suddiviso in quattro fasi principali:
• una miscela liquida scorre attraverso il lato a monte della membrana; • a causa di una differenza di potenziale chimico, alcuni componenti dell’alimentazione
passano attraverso la membrana; • questi componenti vengono rimossi dal lato del permeato come vapore; • il permeato è raffreddato e condensato per essere recuperato come liquido (Fig-1.1).
7
La relazione tra la struttura e le prestazioni della membrana è strettamente legata ai principi alla base dei fenomeni di trasporto. Poiché le membrane utilizzate per la pervaporazione sono dense, non porose, il meccanismo di trasporto di massa si basa sul modello di diffusione-diffusione-soluzione [10]. Secondo questo modello, il processo di trasporto può essere suddiviso in tre fasi:
• le molecole di alimentazione diffondono attraverso lo strato limite liquido e vengono assorbite nella superficie della membrana;
• il liquido diffonde attraverso la sezione trasversale sotto un gradiente di coefficiente di attività;
• il liquido si desorbe sul lato a valle (Fig-1.2).
Pertanto, per una membrana ideale, i requisiti sono: forte affinità tra il soluto e lo strato attivo per ottenere un'alta solubilità del liquido penentrante, una struttura che garantisce un'elevata diffusività selettiva dei penetranti attraverso il volume libero frazionato (FFV) attraverso la membrana e un sottile strato attivo per consentire un'alta permeabilità. Un altro aspetto da considerare è il grado di rigonfiamento della membrana che non dovrebbe essere elevato, al fine di preservare la selettività [11].
La membrana rappresenta il cuore del processo di separazione, pertanto la ricerca sui materiali e sui metodi di fabbricazione gioca un ruolo importante nello sforzo di far progredire il processo di pervaporazione.
Nel caso della pervaporazione, membrane polimeriche, inorganiche e ibride sono state ampiamente utilizzate. Negli ultimi decenni, è cresciuto l’interesse verso l’impiego di materiali compositi in quanto la combinazione di materiali diversi offre la possibilità di sfruttare diverse caratteristiche per ottenere prestazioni ottimali e soddisfare tutti i requisiti [12]. Le membrane polimeriche hanno alcuni vantaggi interessanti rispetto a quelle inorganiche: sono a basso costo, di facile lavorazione, hanno una buona stabilità meccanica e le proprietà di trasporto regolabili. D'altra parte, per queste membrane è difficile contemporaneamente avere una buona selettività e buona permeabilità e hanno bassa stabilità chimica e termica. Le membrane inorganiche, fabbricate da zeoliti o ceramiche, offrono una serie di vantaggi rispetto alle membrane polimeriche come la resistenza ai solventi e la capacità di operare a temperature più elevate. Tuttavia sono più costose, più difficili da preparare su larga scala e sono fragili. Una terza classe di membrane, utilizzate per pervaporazione, è rappresentata da membrane composite in cui particelle inorganiche sono disperse in una struttura polimerica organica. Queste membrane ereditano le qualità sia dalle membrane inorganiche che da quelle organiche, pertanto sono state investigate intensamente negli ultimi anni [3].
Una tipica miscela industriale è costituita dal sistema etanolo/acqua, azeotropica per il 4% in peso di acqua [13]. Il primo metodo utilizzato per disidratare l'etanolo era una distillazione estrattiva. Questa operazione unitaria offre la possibilità di rompere l'azeotropo e di ottenere etanolo completamente disidratato, ma richiede additivi per alterare
8
la volatilità relativa del componente chiave [1]. L'uso di un altro componente, tuttavia, aggiunge impurità all'alcol, rendendolo non idoneo per le applicazioni in cui è richiesta un'elevata purezza e porta inoltre alla presenza di scarichi, a volte pericolosi o inquinanti. La pervaporazione è un modo efficace per rompere gli azeotropi: la separazione non è basata sul processo di equilibrio, quindi, in base alla membrana scelta, il componente più permeabile può essere quello meno volatile e non sono richiesti additivi. Per questo motivo, c'è stato un crescente interesse per la disidratazione dell'alcol attraverso la pervaporazione e diversi tipi di membrane sono stati studiati.
La maggior parte delle membrane di pervaporazione sono organiche o inorganiche, ma recentemente l'attenzione si è spostata sulle membrane ibride, al fine di combinare i vantaggi di entrambi.
Le prime membrane di pervaporazione per la disidratazione dei solventi organici erano fatte principalmente da polimeri idrofili. Le proprietà polimeriche sono state modificate in vari modi allo scopo di aumentare le prestazioni di separazione delle membrane, in particolare per ottenere un flusso e un fattore di separazione adeguati. Inizialmente le membrane utilizzate per la pervaporazione erano membrane omogenee con struttura asimmetrica. Successivamente, sono state sviluppate membrane composite a film sottile (TFC), in genere con polimero a maglie trasversali come strato attivo. Nelle TFC lo strato selettivo sottile è fabbricato mediante polimerizzazione interfacciale su supporti asimmetrici porosi. Queste membrane possono ottenere buone prestazioni di separazione in termini di fattore di flusso e separazione [11].
I materiali inorganici mostrano una maggiore stabilità chimica, termica e meccanica rispetto alla maggior parte dei materiali polimerici. Per questo motivo sono adatti alle alte temperature, possono essere usati in presenza di solventi e garantiscono prestazioni costanti a diverse concentrazioni (non subiscono rigonfiamento).
Le membrane ibride, composte da matrice polimerica e nanoparticelle inorganiche, presentano le tipiche caratteristiche 4M: interazioni multiple, struttura multiscala, funzionalità multiple e multifase [3]. Queste caratteristiche offrono maggiore libertà per la progettazione e la manipolazione della struttura, offrono la possibilità di trovare un buon compromesso tra selettività e permeabilità e migliorare la stabilità operativa a lungo termine [3].
Tra tutti questi materiali, i polielettroliti sono i più promettenti. Sono materiali polimerici multicomponenti con interessanti funzionalità. Le unità ripetitive di questi polimeri recano gruppi carichi (negativamente o positivamente) dissociati, il che porta ad avere un'elevata idrofilia. Altre proprietà fisiche uniche dei polielettroliti, interessanti per le applicazioni di pervaporazione, sono la non solubilità nei comuni solventi organici, la non transizione vetrosa, l'elevata carica superficiale e l’alta stabilità strutturale [12]. Un inconveniente legato ai polielettroliti è il rigonfiamento relativamente alto che si verifica dopo alcune ore di utilizzo e porta ad una diminuzione della loro selettività [22]. Fortunatamente è possibile bilanciare tra idrofilia e grado di rigonfiamento fabbricando un polielettrolita reticolato, membrane polielettrolitiche multistrato o membrane polielettrolitiche complesse. Inoltre, l'assorbimento di acqua è influenzato dalla natura chimica del gruppo carico e del contro ione

9
[1] ed è stato studiato che le membrane contenenti forti gruppi acidi, come i gruppi solfonati, mostrano prestazioni migliori a causa della sua maggiore idrofilia [55].
Tra le nanoparticelle inorganiche prese in considerazione per la preparazione della membrana ibrida, è stato scoperto che le nanoparticelle di silice agiscono sia come distanziatori tra le catene polimeriche aumentando il volume libero frazionato (FFV) sia come cross-linker limitando il rigonfiamento eccessivo e assicurano una buona selettività e stabilità a lungo termine [12], [56]. Pertanto, le membrane ibride a base di polietersulfone, con un forte strato attivo polielettrolitico adeguatamente reticolato e funzionalizzato con nanoparticelle di silice, hanno teoricamente caratteristiche interessanti per la pervaporazione, sebbene siano ancora inesplorate.
La permeabilità della membrana è controllata dalla chimica dello strato attivo, pertanto la fabbricazione deve essere eseguita con precisione al fine di introdurre le giuste funzionalità e migliorare le proprietà richieste. Nel corso degli anni sono state sviluppate diverse tecnologie per la funzionalizzazione di polimeri, tra le quali le polimerizzazioni con innesto superficiale indotte dall'irradiazione UV si sono distinte per alcuni vantaggi quali alta velocità di reazione, costi di processo bassi, attrezzature semplici, industrializzazione facile e forse il più importante , la distribuzione delle catene innestate è limitata ad una regione stretta adiacente alla superficie di supporto della base quando viene fabbricata una membrana TFC. Grazie a quest'ultima capacità, la polimerizzazione con irradiazione superficiale non danneggia il materiale del bulk e non porta alla formazione di omopolimeri (polimeri polimerizzati nella soluzione e non innestati) [57]. Un possibile metodo di fabbricazione per una membrana TFC-ibrida per pervaporazione è quindi la copolimerizzazione indotta da irradiazione UV, di un idrogel di polielettrolita con nanoparticelle di Si su una supporto da ultrafiltrazione in PES.
Gli idrogel sono catene polimeriche reticolate, ottenute dalla reazione di uno o più monomeri, con la capacità di rigonfiare e trattenere una significativa frazione di acqua all'interno della loro struttura, senza dissolversi in acqua. La tecnica di copolimerizzazione con innesto superficiale indotto dalla foto-irradiazione è già stato impiegato per la fabbricazione di membrane TFC idrogel di polielettroliti per PV, con risultati soddisfacenti [58]. Un modo per produrre nanoparticelle di silice è mediante idrolisi e copolimerizzazione di silani, reazioni che richiedono iniziazione termica. Un aumento della temperatura durante la copolimerizzazione con innesto con foto-irradiazione UV potrebbe indurre idrolisi e copolimerizzazione dei silani. Pertanto, in una sola fase, è possibile ottenere un idrogel ibrido da una soluzione specifica precedentemente preparata.
In questo studio, una membrana ibrida per la disidratazione di etanolo è stata fabbricata utilizzando il metodo di copolimerizzazione con innesto superficiale con foto-irradiazione UV. Lo scopo del lavoro è stato quello di produrre uno strato idrogel stabile attivo, mediante polimerizzazione di un polielettrolita e contenente nanoparticelle di silice su un supporto commerciale. Uno studio precedente ha dimostrato che una membrana in PE può ottenere prestazioni molto elevate, ma che la stabilità a lungo termine dovrebbe essere migliorata [4].

10
Pertanto, si prevede che l'integrazione di NPSi nell'idrogel PE migliorerà la sua stabilità. Pertanto gli obiettivi specifici della ricerca sono stati:
1) produzione di una membrana diversa rispetto al lavoro precedente, ma con le stesse caratteristiche in termini di selettività;
2) migliorare la stabilità a lungo termine incorporando nanoparticelle di Si nell'idrogel.
La prima parte del lavoro è stata incentrata sulla fabbricazione della membrana e sulla sua caratterizzazione. Alcune membrane sono state quindi testate in un apparato da pervorazione da laboratorio. Tuttavia, i risultati delle prestazioni in termini di selettività sono stati molto bassi. La ragione di tali risultati è stata legata a problemi tecnici dell’apparato: la pompa da
vuoto non funzionava correttamente e la pressione del flusso verso valle era molto più alta di quanto voluto. Purtroppo ci si è resi conto dell’inconveniente durante la fine dello studio, perciò non è stato possibile correggere la rotta in tempo.
II. Materiali e metodi Le membrane da ultrafiltrazione PES commerciali (50 kDa, come riportato dal produttore) sono state fornite da Microdyn-Nadir, Germania. Prima della modifica, le membrane sono state lavate in una soluzione di etanolo/acqua al 50% per almeno 12 h per pulirle da eventuali additivi, quindi sono state lavate a fondo con acqua Milli-Q (Millipore, USA) e lasciate in acqua bidistillata (DDW) fino al momento dell’utilizzo. Il monomero usato è stata una soluzione di sale di sodio acido vinilsulfonico (VSA, 25%, Sigma-Aldrich, Israele) mentre come cross-linker è stato usato N,N'-metilenbisacrilammide (MBAA, Sigma-Aldrich, Israele). L'etanolo è stato acquistato da Bio-Lab Ltd. (Gerusalemme, Israele). Come precursori della silice sono stati usati tetraetil ortosilicato (TEOS Sigma-Aldrich, Israele) e trietossivinilsilano (VTES Sigma-Aldrich, Israele). Tutti i reagenti erano di grado analitico e sono stati utilizzati come ricevuti. Tutti gli esperimenti sono stati condotti usando acqua purificata da un sistema Milli-Q.
Per preparare la soluzione di polimerizzazione, una certa quantità di cross-linker (MBAA) è stata disciolta in una soluzione di etanolo/acqua al 50% e un piccolo volume di questa soluzione è stato aggiunto alla soluzione di VSA al fine di ottenere il 5% di mole di MBAA rispetto alla concentrazione molare di VSA. Diverse quantità di VTES e TEOS (0,5-1% mole di VTES e 5-15% mole di TEOS, relative alla concentrazione di VSA) sono state aggiunte a questa soluzione, che è stata poi energicamente agitata per emulsionare le gocce di silano.
Una membrana bagnata da acqua è stata collocata in un supporto (9 × 4 cm) (Fig-2.1), lasciando solo la superficie esterna della membrana a contatto con la soluzione. L'acqua è stata poi asciugata con un tovagliolo e la superficie della membrana è stata coperta con 12 mL della soluzione di innesto (precedentemente degassata con azoto per 1 minuto per rimuovere CO2). Il campione è stato immediatamente collocato all'interno di un sistema UV (Intelli-Ray 400, UvitronInternational Inc., USA) (Fig-2.2) e irradiato ad un'intensità di I = 65 mW / cm2 (misurato con un radiometro UV powerpuck II, EIT, Sterling , VA), per 7,5 o 10 minuti a 30-

11
35°C. La lunghezza d’onda dei raggi UV era circa pari a λ> 300 nm ed è stato utilizzato un vetro filtrante per evitare la degradazione della membrana [58].
Al termine del processo di copolimerizzazione, la membrana è stata lavata con una soluzione di etanolo/acqua al 50% per almeno 12 ore per rimuovere eventuali polimeri non stampati e lasciata in DDW fino a che non è stata testata.
Le membrane sono state sottoposte ad una serie di test per poter essere caratterizzate e alcune di esse sono state testate in un apparato da laboratorio per misurarne la performance in termini di pervaporazione. I test effettuati per la caratterizzazione sono stati i seguenti:
• Microscopia elettronica a scansione ad emissione di campo (FESEM): fornisce informazioni topografiche e relative agli elementi presenti sui materiali. Durante questa operazione, gli elettroni vengono liberati da una sorgente di emissione di campo e accelerati in un gradiente di un elevato campo elettrico. In una colonna di vuoto spinto, questi elettroni detti primari sono focalizzati e deviati da lenti elettroniche per produrre uno stretto raggio di scansione che bombarda l'oggetto. Di seguito, gli elettroni secondari vengono emessi da ciascun punto sull'oggetto. L'angolo e la velocità di questi elettroni secondari forniscono informazioni relative alla struttura superficiale dell'oggetto. Un rilevatore cattura gli elettroni secondari e produce un segnale elettronico. Questo segnale viene amplificato e trasformato in un'immagine che può essere vista su un monitor o su un'immagine digitale che può essere salvata ed elaborata ulteriormente. In questo lavoro, le immagini della superficie delle membrane sono state osservate con FESEM (JSM-7400F, JEOL). Prima di questa caratterizzazione, tutti i campioni sono stati fratturati in azoto liquido e poi spruzzati con oro.
• Riflettanza totale attenuata (ATR-FTIR): la spettroscopia infrarossa a trasformata di Fourier è un tipo di spettroscopia in cui la luce infrarossa viene introdotta in un prisma con un angolo superiore all'angolo critico per la riflessione interna. Ciò produce un'onda evanescente sulla superficie riflettente (una superficie trasparente agli infrarossi come il bromuro di tallio) su cui è supportato il campione. La distorsione dell'onda evanescente da parte del campione viene misurata producendo uno spettro che è quindi soggetto a una trasformata di Fourier. Gli spettri ATR-FTIR delle membrane non modificate e modificate sono stati raccolti da membrane asciugate utilizzando uno spettrometro FTIR 70 Bruker Vertex con un cristallo ATR rivestito in diamante. 40 scansioni sono state raccolte ad una risoluzione di 4 cm-1 (Fig-2.3) Per ogni membrana sono state misurate almeno tre diverse posizioni per identificare i picchi relativi alla vibrazione di stretching dei gruppi chimici e conferma l'innesto riuscito.
• Spettroscopia fotoelettronica a raggi X (XPS): questa analisi, nota anche come spettroscopia elettronica per analisi chimiche (ESCA), è una tecnica spettroscopica quantitativa sensibile alla superficie utilizzata per analizzare la chimica superficiale di

12
un materiale. L'XPS può misurare la composizione elementare, la formula empirica, lo stato chimico e lo stato elettronico degli elementi all'interno di un materiale. Gli spettri XPS si ottengono irradiando una superficie solida con un raggio di raggi X e contemporaneamente misurando l'energia cinetica e gli elettroni che vengono emessi dai primi 1-10 nm del materiale analizzato. Uno spettro di fotoelettroni viene registrato contando gli elettroni espulsi su un intervallo di energie cinetiche elettroniche. I picchi appaiono nello spettro dagli atomi che emettono elettroni di una particolare energia caratteristica. Le energie e le intensità dei picchi del fotoelettrone consentono l'identificazione e la quantificazione di tutti gli elementi di superficie (eccetto l'idrogeno). Poiché XPS fornisce informazioni sugli strati superficiali o sulle strutture a film sottile, è un tipo di analisi molto utile per la caratterizzazione delle membrane. Gli spettri XPS sono stati registrati utilizzando ESCALAB 250 (Thermo Fisher Scientific Inc., Waltham, Regno Unito) con sorgente di raggi X Al e monocromatore. Le energie vincolanti per gli elementi sondati sono state corrette per l'effetto di carica con riferimento al picco di 285 eV C1.
• Analisi termogravimetrica (TGA): è una tecnica in cui la massa di una sostanza viene monitorata in funzione della temperatura o del tempo mentre il campione viene sottoposto a un programma di temperatura controllata in un'atmosfera controllata. Lo strumento utilizzato per TGA è costituito da un piatto atto a supportato un campione, fornito di una bilancia di precisione. Questo supporto si trova in una fornace e viene riscaldato o raffreddato durante l'esperimento. La massa del campione viene monitorata durante l'esperimento. Un gas di spurgo del campione controlla l'ambiente del campione. Questo gas può essere inerte o reattivo e dopo essere passato sul campione esce attraverso uno scarico. Con la TGA è possibile quantificare la perdita di acqua, la perdita di solvente, la perdita di plastificante, la decarbossilazione, la pirolisi, l'ossidazione, la decomposizione, la quantità di residuo catalitico metallico rimanente su nanotubi di carbonio e il peso percentuale di ceneri. Pertanto, una tipica curva TGA per un polimero mostra diverse fasi correlate alla perdita di peso di diverse sostanze. Inoltre, è possibile tracciare la prima derivata della curva TGA (la curva DTG), utile per evidenziare piccole variazioni di peso. In questo lavoro, TGA ha permesso di quantificare la perdita di acqua e materiale organico e di conseguenza la quantità di materiale inorganico sulle membrane.
Per testare le prestazioni di pervaporazione delle membrane è stato utilizzato un apparecchio realizzato in laboratorio (Fig-2.4). Per proteggere la pompa da potenziali infiltrazioni, è stata interposta una seconda trappola fredda dopo quella utilizzata per raccogliere il permeato (Fig-2.5.). Gli esperimenti sono stati effettuati utilizzando miscele di etanolo / acqua a 90:10 (g/g) come carica caricata nel serbatoio di alimentazione (Fig-2.6) e riscaldata a 50 ° C.
Le dimensioni della cella di membrana (Fig-2.7) erano 8 × 3 × 0,5 cm (L × P × H), con 24 cm2 come area efficace per la membrana.

13
L'alimentazione è stata fatta circolare a 80 L/h e la temperatura è stata controllata da un termometro di controllo elettronico. Il vuoto alla pressione a valle è stato mantenuto utilizzando una pompa a vuoto (Cps VP4DE) (Fig-2.8).
Per ogni membrana testata, la procedura è stata la stessa: all'inizio il sistema è stato tenuto in funzione per una durata di 1 ora per il raggiungimento dell'equilibrio. Quindi, il liquido è stato raccolto, usando una trappola di azoto liquido (Fig-2.9), per circa 2 ore.
III. Risultati e discussioni
Durante questo studio è stata fabbricata una membrana ibrida per la disidratazione di etanolo, utilizzando il metodo di copolimerizzazione con innesto superficiale con foto-irradiazione UV. Lo scopo del lavoro è stato quello di produrre uno strato idrogel stabile attivo, mediante polimerizzazione di un polielettrolita e contenente nanoparticelle di silice su un supporto commerciale. Dopo l’analisi di uno studio precedente, il quale aveva dimostrato che una membrana in PE può ottenere prestazioni molto elevate, ma che la stabilità a lungo termine dovrebbe essere migliorata [4], si è supposto che l'integrazione di NPSi nell'idrogel PE potesse migliorare la sua stabilità.
Per fare un confronto corretto relativamente all’analisi FESEM, le membrane modificate con e senza silani sono state caratterizzate (Fig-3.1) Dalla Fig-3.1 si vede chiaramente che la superficie della membrana che è stata modificata con silano (b), è coperta da nanoparticelle che si ritiene siano Si.
Gli spettri ATR-FTIR delle membrane non modificate, di quella modificata con il 25% in peso di VSA come monomero e il 5% di MBAA come cross-linker e della membrana modificata con il 25% in peso di VSA come monomero e con il 5% di MBAA come cross-linker e diverse percentuali di TEOS e VTES come precursori di silice sono mostrate in Fig-3.2. Un nuovo picco è emerso per le membrane modificate a 1040 cm-1, corrispondente alla vibrazione del gruppo acido del solfone e conferma il successo dell'innesto del VSA [58]. Gli altri due nuovi picchi mostrati in Fig-3.2 sono il picco di assorbimento dell'ammide I (C = O) e dell'ammide II (NH), rispettivamente a 1662 cm-1 e a 1543 cm-1, e possono essere attribuiti al cross-linker.
Le composizioni chimiche superficiali dei campioni analizzati da XPS sono misurate in un intervallo di energie leganti di 0-1500 eV.
In Tab-3.1, vengono mostrati i valori per i picchi relativi all'energia di legame. L'ultimo campione aveva valori significativamente diversi per Si 2p e O 1s. L'energia di legame del picco di Si 2p cambia da 101,56-101,99 eV a 102,47 eV. Questo secondo valore è caratteristico della silice organica. L'energia di legame del picco di O 1s varia da 531,52-531,61 eV a 532,03 eV. Questo secondo valore è generalmente attribuito al legame tra ossigeno e silice.
14
Il campione modificato con VSA al 25%, MBAA al 5%, VTES al 10% e TEOS al 10% è l'unico a mostrare un forte aumento sia del segnale di silice (da 1,39-3,76% a 9,85%) sia del segnale dell'ossigeno (dal 19,98-24,44% al 27,09%) e una corrispondente diminuzione del carbonio (dal 60,22-67,66% al 56,36%) e dell'azoto (da 3,87-5, Dal 69% al 2,18%). Tutti i rapporti atomici considerati per questo campione diminuisce fortemente.
La TGA è stata condotta su membrane modificate con il 25% in peso di VSA come monomero e con il 5% di MBAA come cross-linker e sulle membrane modificate con il 25% in peso di VSA come monomero e con il 5% di MBAA come cross-linker e 5-15 % TEOS, 2,5% VTES come precursori di silice. Le curve TGA sono mostrate in Fig-3.3-5. Gli step in ciascuna curva sono stati attribuiti alla disidratazione, desolforazione e decomposizione dei polimeri innestati.
I parametri caratteristici della TGA sono: la temperatura alla quale inizia la degradazione termica (T onset), la temperatura alla quale la degradazione termica è massima (T di picco), la temperatura alla quale il processo è completo (T offset) e la percentuale di perdita di peso durante ogni fase (W%). I dati comparativi riguardanti la degradazione termica dello stadio con la maggiore perdita di peso sono mostrati in Tab-3.3. Le membrane funzionalizzate solo con VSA e MBAA hanno mostrato una stabilità termica leggermente ridotta sulle stesse membrane con VTES e TEOS, nell'intervallo di temperature dello stadio considerato come si può dedurre dalla T di onset più bassa.
La membrana modificata senza silani, alla fine del test, presentava il 5.215% in peso di residuo, il che significa che questa è la quantità di materia inorganica (relativa al gruppo solfone) originariamente presente sulla membrana. Invece, le altre due membrane avevano una quantità raddoppiata di residuo, confermando la presenza di silice in aggiunta al gruppo solfone. La differenza tra il residuo nel caso del 5% e del 15% di TEOS non è significativa.
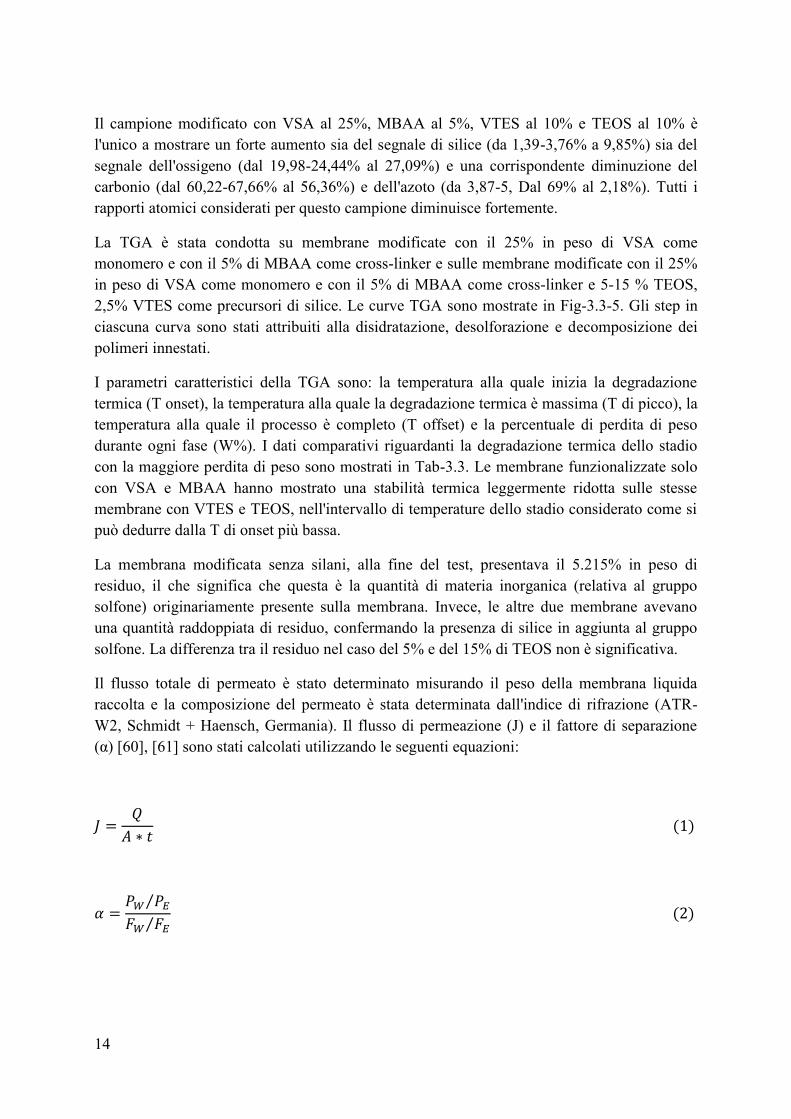
Il flusso totale di permeato è stato determinato misurando il peso della membrana liquida raccolta e la composizione del permeato è stata determinata dall'indice di rifrazione (ATR-W2, Schmidt + Haensch, Germania). Il flusso di permeazione (J) e il fattore di separazione (α) [60], [61] sono stati calcolati utilizzando le seguenti equazioni:
𝐽 =𝑄
𝐴 ∗ 𝑡 (1)
𝛼 =𝑃𝑊 𝑃𝐸⁄
𝐹𝑊 𝐹𝐸⁄ (2)

15
dove Q (kg) è il peso del permeato nella durata dell'operazione t (h), A (m2) è l'area della membrana effettiva, e P e F rappresentano le frazioni di massa di acqua (W) ed etanolo (E) nel permeato soluzione di soluzione e di alimentazione, rispettivamente.
Il flusso di permeazione e il fattore di separazione delle membrane fabbricate usando VSA al 25%, MBAA al 5%, quantità diverse di VTES e TEOS e irradiati con un'intensità di I = 65 mW / cm2 per 10 minuti sono riportati in Tab-3.4.
Diversi fattori influenzano la performance delle membrane in termini di pervaporazione:
• La temperatura dell’alimentazione influisce sul trasporto dei componenti attraverso la
membrana. Sia il coefficiente di trasferimento di massa dei componenti nel liquido che l'assorbimento dei componenti nella membrana aumentano con la temperatura, ma l'effetto è maggiore sul trasporto di etanolo [21]. Inoltre, temperature più elevate rendono le catene polimeriche più flessibili e causano un maggiore volume disponibile di matrice polimerica per la diffusione. Per queste ragioni è stata utilizzata una temperatura ottimale stimata di 50 ° C [22].
• Da Tab-3.4 risulta che un aumento del contenuto di acqua nell’alimentazione ha comportato una diminuzione del fattore di separazione. Questo fenomeno può essere attribuito all’assorbimento preferenziale (rispetto all’etanolo) delle molecole di acqua per via della natura idrofilia della membrana e delle cariche presenti sulla sua superficie. Questo assorbimento preferenziale dell’acqua dalla membrana potrebbe aver causato il rigonfiamento delle membrane [56].
• La pressione del permeato, insieme alla temperatura operativa, determina la forza spingente del processo. L'influenza della pressione a valle sulle prestazioni della membrana è stata studiata da diversi ricercatori [10], [21], [62], [63] i quali hanno stabilito che sia il flusso che il fattore di separazione diminuiscono all'aumentare della pressione del permeato poiché vi è una riduzione della forza motrice per il trasporto di componenti. Sfortunatamente si è scoperto che la pressione a valle era molto più alta di quanto non fosse rispetto alla ricerca precedente [4] a causa di problemi con la pompa utilizzata. Ciò è stato confermato da esperimenti di controllo - la selettività delle membrane TFC-PE senza Si-NP era molto inferiore rispetto allo studio precedente. Questo inconveniente è stato molto probabilmente il motivo per cui il fattore di separazione della membrana era basso [10], [63].
In conclusione le analisi effettuata per caratterizzare le membrane hanno confermato la presenza di una fase inorganica nello strato attivo. L'analisi termogravimetrica ha determinato l'aumento in termini di materia inorganica nella struttura della membrana modificata usando silani e attraverso questa analisi si è dedotto un miglioramento della stabilità termica delle membrane. Gli stessi risultati sono stati confermati dalla spettroscopia fotoelettronica a raggi X _________ E 'stato possibile vedere alcune particelle uniformi, sferoidali sulla superficie, dalle immagini di FESEM, che hanno confermato la buona riuscita della formazione e

16
dell'innesto di nanoparticelle di silice. Alla luce di questi risultati è possibile affermare che una membrana ibrida è stata fabbricata con nanoparticelle di silice disperse in un forte strato attivo di idrogel polielettrolita. Il risultato interessante è soprattutto la possibilità di fabbricare membrane ibride con il semplice metodo di copolimerizzazione con innesto di foto-irradiazione UV. I test eseguiti per studiare le prestazioni di pervaporazione della membrana non hanno dato risultati soddisfacenti. Durante questi test sono stati controllati parametri come il contenuto in acqua e la temperatura dell’alimentazione al fine di garantire condizioni ottimali. Sfortunatamente, non è stato possibile controllare rigorosamente la pressione del permeato e questo probabilmente ha compromesso i risultati dell'intero processo.
17
Abstract Pervaporation is a membrane process used for the separation of mixture of liquids. This method is a valid alternative when the mixture have characteristics for which distillation would be too harsh. Furthermore, this technique is green and energy saving.
In this study, a hybrid membrane was producedfor the dehydration of ethanol. It was fabricatedon a polyethersulfone ultrafiltration support. The organic part of the membrane was represented by a strong polyelectrolyte (PE) hydrogelas active layer, graft polymerized using vinyl sulfonic acid (VSA) as the polymer monomer and N, N′-methylenbisacrylamide (MBAA) as the cross linker monomer. Instead, nanoparticles of silica obtained by triethoxyvinylsilane/tetraethoxysilane (VTES/TEOS), were the inorganic part.
The manufacturing method was based on UV-photo initiation.
The membranes physicochemical and morphological properties were analyzed by attenuated total reflection-Fourier transform infrared spectroscopy (ATR-FTIR), thermogravimetric analysis (TGA), scanning electron microscopy (SEM) and with energy dispersive X-ray spectroscopy (XPS).
The pervaporation performance was tested with a pilot plant fed with 90% ethanol solution at 50 °C. The ethanol-water selectivity was really low probably because the downstream pressure was not enough low.
The interesting result of this work is the possibility to produce hybrid membranes, including silica nanoparticles, with the UV-photo initiation method.

Introduction ___________________________________________________________________________
18
Introduction Pervaporation is a membrane process used for the separation of mixture of liquids. This environment-friendly and cost effective process allows mixture to be separated even if the two liquids have close boiling point or they create azeotropic mixture [1].Pervaporation is applied for three different applications: solvent dehydration, separation of two solvents and removal of solvent from aqueous solutions.
The most studied application of pervaporation, also on industrial scale, is the removal of water from organic solvent solutions, especially for ethanol dehydration [2].
The membrane material is a key factor in any membrane process, each with its unique requirements based on the transport mechanism and the process environment (e.g., temperature, pressure, etc.). In the last decade the research on hybrid membranes, in which the membrane’s active layer is a hybrid organic-inorganic composite, grown [3] in order to combine material that guarantee both high separation performance and long-term stability. Several kinds of fabrication methods have been widely used or recently emerged.
Objectives and work plan
In this study, a hybrid membrane for dehydration of ethanol was fabricated using UV-photo initiation method. The purposes of the work were to produce a stable hydrogel active layer, by polymerization polyelectrolyte with silica nanoparticles on a commercial support. A previous study showed that a PE membrane can obtain very high performance, but that the long term stability should be improved [4]. Thus, it is expected that incorporating Si NPs into the PE hydrogel will improve its stability.
Therefore the specific objectives of the research were:
1) produce a different membrane in comparison with the previous work but maintain good results in term of selectivity;
2) improve long term stability incorporating Si nanoparticles into the hydrogel.
The first part of the work was focused on the fabrication of the membrane and its characterization. Some of the membranes were then tested in a lab scale PV system.
However, the performance results in term of selectivity were very low. This was related to technical problems that were discovered on the PV system – the vacuum pump did not work properly and the down stream pressure was much higher than anticipates. Unfortunately this was found during the end of the study, thus could not be corrected for this research.
Introduction ___________________________________________________________________________
19
Thesis organization
In Chapter 1, a literature review is presented to provide an overview of the current knowledge about membrane used for hydration of ethanol by pervaporation.
Chapter 2 contains a definition of methods and materials used during work.
In Chapter 3, the results of the first study are presented and discussed.
Finally, chapter 4 provides key conclusions of this overall research.
Chapter 3 Results and Discussion ___________________________________________________________________________
5
1 Literature Review
1.1 Pervaporation 1.1.1 Background Pervaporation is one of the most attractive technologies for separation of mixture of liquids. This process presents several advantages: operates under mild condition, enables the separation of solvent mixture with close boiling point or azeotropic mixture[1]. Moreover, the process does not require any additives (e.g. entrainers or extractants), have low energy consumption, and it is ease integrated into other separation or reaction processes [5]. Therefore, it is considered more environmental friendly and energy saving, compared to the common distillation method.
The three applications of pervaporation are:solvent dehydration, organic–organic solvent separation, and removal of solvents from aqueous solutions. Solvent dehydration, in particular ethanol and isopropanol, is the most developed on industrial scale [2].
The word “pervaporation” was coined in 1917 by Kober [6]. During 1950s, Binning and coworkers at American Oil [7] started to study the process in a systematic way and then in 1970s Eli Perry and others at Monsanto [8].The first commercial-scale membrane system was installed in 1982 by GFT (Gesell-schaftfűr Trenntechnik, Hamburg, Germany) to separate ethanol-water mixtures through pervaporation [5]. In this system a composite membrane with polyvinyl alcohol as the active layer was used to separate ethanol/water azeotropic mixtures[9]. Since then, pervaporation developed rapidly in large scale applications and several companies started to produce commercial pervaporation membranes. Today, hundred pervaporation systems are installed worldwide the research on PV still grows.
1.1.2 Theoretical Background
A membrane is the interphase between two adjacent phases acting as a selective barrier, which regulates the transport of substances between the two compartments [5]. A driving force, across the membrane is required to enable the flow of substances. Pervaporation is a membrane separation technology which combines membrane permeation and evaporation for selective separation of liquid mixtures. A general process of pervaporation is divided in four main steps: (i) a liquid mixture flows through the upstream side of the membrane; (ii) due to a chemical potential difference, some components of the feed pass through the membrane; (iii) these components are removed from the permeate side as vapor; (iv) permeate is cooled and condensed to be recover as liquid (Fig-1.1).

Chapter 3 Results and Discussion ___________________________________________________________________________
6
Fig-1.1 Simplified scheme of pervaporation process [2]
The chemical potential difference governs the process and it can be obtained by vacuum or gas sweeping.
The relationship between the structure and performance of the membrane is closely linked to the principles behind the transport phenomena. Since membranes used for pervaporation are dense, non-porous, the mass transport mechanism is based on the solution-diffusing-evaporation model [10].According to this model, the transport process can be divided into three steps: (i) feed molecules diffuse through the liquid boundary layer and they are absorbed into the membrane surface; (ii) the liquid diffuses across the cross-section under a gradient of activity coefficient; (iii)the liquid desorbs at the downstream side (Fig-1.2).
Fig-1.2 Solution-diffusion model [11]

Chapter 3 Results and Discussion ___________________________________________________________________________
7
Therefore, for an ideal membrane, the requirements are: strong affinity between the solute to the active layer to achieve high solubility of the penetrants liquid, a structure which ensure high selectivity diffusivity of the penetrants through the fractional free volume (FFV) across the membrane and a thin active layer to allow high permeability. Another aspect to be considered is the swelling degree of the membrane which should not be high, in order to maintain selectivity [11].
The membrane is the key component of the separation process, therefore research about materials and fabrication methods plays an important role in an effort to advancing pervaporation process.
1.2 Membrane materials In any membrane-based technology, selection of the membrane materials is a key issue. In the case of pervaporation, polymeric, inorganic and hybrid membranes have been widely used. In the past decades, a successful way to produce membranes with high performance has been the idea of multicomponent of composite membrane materials. Combination of materials give the possibility to exploit different characteristics to achieve optimum performances and fulfill all of the requirements [12].
Polymeric membranes, have some interesting advantages over inorganic ones: they are low cost, easy processing, they have good mechanical stability, and tunable transport properties. On the other hand, for these membranes it is difficult to have good selectivity and good permeability at the same time and they have low chemical and thermal stability.
Inorganic membranes, fabricated from zeolites or ceramics, offer a number of advantages over polymeric membranes such as solvent resistance and the ability to operate at higher temperatures. However they are more expensive, more difficult to be prepared in large scale and they are brittle.
A third class of membranes, used for pervaporation, is represented by composite membranes which are made up of inorganic particles dispersed throughout an organic polymeric structure. These membranes inherit qualities from both inorganic and organic membranes, thus they have been intensely investigate in recent years [3].
1.3 Dehydration of ethanol
The ethanol and water system is a typical industrial mixture, azeotropic at approximately 4 wt% water [13]. The first method used to dehydrate ethanol was an extractive distillation. This unit operation give the possibility to break the azeotrope and to obtain ethanol completely dehydrated, but requires additives to alter the relative volatility of the key component [1]. The use of another component, however, adds impurity to the alcohol, which

Chapter 3 Results and Discussion ___________________________________________________________________________
8
becomes not suitable for some applications, wherein high purity is required and leads to the presence of discharges, sometimes hazardous or pollutant, to be managed.
Pervaporation is an efficient way to resolute azeotropes: the separation is not based on equilibrium process so the more permeable component may be the less-volatile component, according to the membrane chosen and no additives are required. For this reason, there has been increasing interest in dehydration of alcohol via pervaporation and several kinds of membranes have been investigated.
1.3.1 Membranes for dehydration of ethanol
Since the first application in 1982, different materials have been employed to fabricate an efficient membrane for the process. Most of the pervaporation membranes are organic or inorganic based, but recently the focus has shifted to hybrid, membranes in order to combine advantages of both of them.
Polymeric membranes: early development of pervaporation membranes for dehydration of organic solvents was mainly using hydrophilic polymers such as poly(vinyl alcohol) [14]–[16]; cellulose; chitosan [17], [18]; alginate [19], [20]; etc, that would enhance the solubility selectivity of water towards the membrane through hydrogen bonding interactions.
Polymeric properties have been modified in various ways with the aim to increase the separation performance of the membranes, namely to obtain proper flux and separation factor. Initially the membranes that were used for PV were homogeneous membranes with asymmetric structure. Later, thin-film composite membranes (TFC) were developed, typically with across links polymer as the active layer. TFC membranes are one of the most representatives under the category multilayered membranes. The thin selective layer is fabricated by interfacial polymerization on top of porous asymmetric supports. These membranes can achieve good separation performance in terms of both flux and separation factor [11]. Few examples of polymers that were used for fabrication of membranes for PV are: chitosan-hydroxyethyl cellulose [21], [22]; chitosan-polysulfone [23]; chitosan-poly(tetrafluoroethylene) [24]; alginate-poly(vinylpyrrolidone) [25];polisulfone-poly(ethyleneglycol) [26]; polyimides [27]; polyamides [28]–[30]; polyelectolytes [31]–[34]; polyaniline [35], [36].
Inorganic membranes: inorganic materials show higher chemical, thermal and mechanical stability than most polymeric materials. For this reason, they are suitable for high temperatures, in the presence of solvents and they ensure constant performance at different concentrations (they do not swell). Materials most used for pervaporation membranes are: ceramics [37]–[41] or zeolites [42]–[44].
Hybrid membrane: hybrid membranes, composed of polymer matrix and inorganic nanoparticles, have the typical 4M features: multiple interactions, multiscale structures,

Chapter 3 Results and Discussion ___________________________________________________________________________
9
multiphase and multiple functionalities [3]. These characteristics give more freedom for structure design and manipulation, offer the possibility to get through the trade-off effect and improve the long-term operation stability [3]. The inorganic nanoparticles generally introduced into the polymer matrix are: SiO2, Al2O3, Fe3O4, ZnO, ZrO2, CdS and TiO2 [45]–[54].
Among all these materials, one of the most promising type is polyelectrolytes. They are multi-component polymeric materials with attractive functionalities. This type of polymers has the characteristic that their repeating units bear dissociated (negatively or positively) charged groups, which leads to a high hydrophilicity. Other unique physical properties of polyelectrolytes, interesting for pervaporation applications, are non-solubility in common organic solvents, no glass transitions, high, tunable surface charge, and stable structures [12]. One drawback related to polyelectrolytes is the relatively high swelling which occurs after some hours of use and leads to a decrease in its selectivity [22]. Fortunately it is possible to balance between hydrophilicity and swelling degree by fabricating a cross-linked polyelectrolyte, multilayer polyelectrolyte membranes, or complex polyelectrolyte membranes. Moreover, the water sorption is influenced by the chemical nature of the charged group and the counter ion [1] and it was studied that membranes containing strong acid groups, such as sulfonate groups, show better performances due to its higher hydrophilicity [55].
With regard to the inorganic nanoparticles taken into account for the preparation of hybrid membrane, it was found that silica nanoparticles acted both as spacers between polymer chains increasing the fractional free volume (FFV) and as cross-linkers that restricted excessive swelling and assure good selectivity and long-term stability [12], [56]. Therefore, hybrid polyethersulfone-based membranes, with a strong polyelectrolyte active layer properly cross-linked and functionalized with silica nanoparticles, theoretically have attractive features for pervaporation, although they are still unexplored.
1.4 UV photo-irradiation method
Membrane permeability is controlled by the active layer chemistry, therefore the properties of the active layer polymer has to be done accurately in order to introduce the right functionalities and enhance required properties. Over the years, several technologies have been developed to functionalize polymers, among them, surface graft polymerizations induced by UV irradiation has distinguished itself for some advantages such as fast reaction rate, lowcost of processing, simple equipment, easy industrialization, and maybe the most important, the distribution of grafted chains is limited to a narrow region adjacent the base support surface when a TFC membrane is fabricated. Thanks to this last ability, surface photografting polymerization does not damage the bulk material and no homopolymers (polymers which polymerized in the solution and not grafted) are formed [57].
Chapter 3 Results and Discussion ___________________________________________________________________________
10
A possible fabrication method for a TFC-hybrid membrane for pervaporation is thus grafting copolymerization of a polyelectrolyte hydrogel whit Si nanoparticles on a PES ultrafiltration as a support. Hydrogels are cross-linked polymeric networks of chains, obtained by the reaction of one or more monomers, with the ability to swell and retain a significant fraction of water within its structure, without dissolve in water. The photoirradiation-induced radical graft copolymerization technique has been already employed for fabrication of TFC membrane using polyelectrolyte hydrogel (but not hybrid one) for PV, with satisfactory results [58].
One way to produce silica nanoparticles is by hydrolysis and copolymerization of silanes, reactions which requires to be thermally initiated. An increase of the temperature during the UV photoirradiation graft copolymerization could induce hydrolysis and copolymerization of silanes. Thus, in only one step, it is possible to obtain a hybrid hydrogel from a specific modification solution previously prepared.

Chapter 3 Results and Discussion ___________________________________________________________________________
11
2 Materials and Methods
2.1 Preparation of the membrane 2.1.1 Materials
Commercial UF PES membranes (50 kDa, as reported by the manufacturer) were supplied byMicrodyn-Nadir, Germany. Prior to the modification, the membranes were washed in a50% ethanol/water solution for at least 12 hto clean them from any additives, then thoroughly washed again with Milli-Q water (Millipore, USA) and left in double distilled water (DDW) until used. Vinylsulfonic acid sodium salt solution (VSA; 25%, Sigma-Aldrich, Israel) was used as the polymer monomer and N,N′-methylenbisacrylamide (MBAA, Sigma-Aldrich, Israel) was used as the cross-linker monomer. Ethanol was purchased from Bio-Lab Ltd. (Jerusalem, Israel). Tetraethyl orthosilicate (TEOS Sigma-Aldrich, Israel) and Triethoxyvinylsilane (VTES Sigma-Aldrich, Israel) were used as silica precursors. All reagents were of analytical grade and were used as received. All experiments were conducted using purified water from a Milli-Q system.
2.1.2 Modification procedure
To prepare the grafting polymerization solution, a certain amount of cross-linker (MBAA) was dissolved in 50% ethanol/water solution and then a small volume was added to the VSA solution in order to obtain 5% mole of MBAA relative to the VSA concentration. Different amounts of VTES and TEOS (0.5-1% mole of VTES and 5-15% mole of TEOS, relative to the VSA concentration) were added to this, which was vigorously stirred to emulsify drops of silane.
A water-wet membrane (9×4 cm) was placed in a holder (Fig-2.1), leaving only the outer surface of the membrane in contact with the solution. The water was wiped off with a tissue paper and the surface of the membrane was covered with 12 mL of the grafting solution (which was first degassed with nitrogen for 1 min to remove CO2). The sample was immediately placed inside a UV system (Intelli-Ray 400, UvitronInternational Inc., USA) (Fig-2.2) and irradiated at an intensity of I = 65 mW/cm2 (measured with a UV powerpuck II radiometer, EIT, Sterling, VA), for 7.5 or 10 minutes at 30-35 °C. The UV wavelength was narrowed to λ > 300 nm by using a filter glass to avoid membrane degradation [58].
At the end of the modification process, the membrane was washed with a 50% ethanol/water solution for at least 12 h to remove any ungrafted polymers, and left in DDW until tested.

Chapter 3 Results and Discussion ___________________________________________________________________________
12
Fig-2.1 Holder
Fig-2.2 UV system

Chapter 3 Results and Discussion ___________________________________________________________________________
13
2.2 Characterization of the membrane 2.2.1 Scanning electron microscopy (SEM)
Field emission scanning electron microscopy (FESEM) provides topographical and elemental information of materials. During this operation, electrons are liberated from a field emission source and accelerated in a high electrical field gradient. Within the high vacuum column these so-called primary electrons are focused and deflected by electronic lenses to produce a narrow scan beam that bombards the object. As a result, secondary electrons are emitted from each spot on the object. The angle and velocity of these secondary electrons relates to the surface structure of the object. A detector catches the secondary electrons and produces an electronic signal. This signal is amplified and transformed to a video scan-image that can be seen on a monitor or to a digital image that can be saved and processed further.
In this work, images of the membranes surface were observed with FESEM (JSM-7400F, JEOL). Prior to photographing, all samples were fractured in liquid nitrogen and then sputtered with gold.
2.2.2 FTIR
Attenuated total reflectance Fourier transform infrared spectroscopy (ATR-FTIR) is a type of spectroscopy wherein infrared light is introduced into a prism at an angle exceeding the critical angle for internal reflection. This produces an evanescent wave at the reflecting surface (a surface which is transparent to infrared such as thallium bromide) on which the sample is supported. The distortion of the evanescent wave by the sample is measured producing a spectrum which is then subject to a Fourier transform.
The ATR-FTIR spectra of the pristine and modified membranes were collected from dried membranes using a Bruker Vertex 70 FTIR spectrometer with a diamond coated ATR crystal. 40 scans were collected at a resolution of 4 cm−1(Fig-2.3). For every membrane at least three different positions were measured to identify peaks related to the stretching vibration of chemical groups and confirms the successful grafting.

Chapter 3 Results and Discussion ___________________________________________________________________________
14
Fig-2.3 ATR-FTIR Spectometer
2.2.3 X-ray Photoelectron Spectroscopy (XPS)
This analysis, also known as electron spectroscopy for chemical analysis (ESCA), is a surface-sensitive quantitative spectroscopic technique used to analyze the surface chemistry of a material. XPS can measure the elemental composition, empirical formula, chemical state and electronic state of the elements within a material. XPS spectra are obtained by irradiating a solid surface with a beam of X-rays while simultaneously measuring the kinetic energy and electrons that are emitted from the top 1-10 nm of the material being analyzed. A photoelectron spectrum is recorded by counting ejected electrons over a range of electron kinetic energies. Peaks appear in the spectrum from atoms emitting electrons of a particular characteristic energy. The energies and intensities of the photoelectron peaks enable identification and quantification of all surface elements (except hydrogen).
Since XPS provides information about surface layers or thin film structures, it is a very useful kind of analysis for membranes characterization. XPS spectra were recorded using ESCALAB 250 (Thermo Fisher Scientific Inc., Waltham, UK) with Al X-ray source and monochromator. Binding-energies for probed elements were corrected for the charging effect with reference to the 285 eV C1s peak.
2.2.4 ThermogravimetricAnalysis (TGA)
Thermogravimetric analysis is a technique in which the mass of a substance is monitored as a function of temperature or time as the sample specimen is subjected to a controlled temperature program in a controlled atmosphere.
The instrument used for TGA consists of a sample pan that is supported by a precision balance. That pan resides in a furnace and is heated or cooled during the experiment. The

Chapter 3 Results and Discussion ___________________________________________________________________________
15
mass of the sample is monitored during the experiment. A sample purge gas controls the sample environment. This gas may be inert or a reactive gas that flows over the sample and exits through an exhaust. With TGA is possible to quantify loss of water, loss of solvent, loss of plasticizer, decarboxylation, pyrolysis, oxidation, decomposition, weight % filler, amount of metallic catalytic residue remaining on carbon nanotubes, and weight % ash. Thus, a typical TGA curve for a polymer shows different steps related to the loss of weight of different substances.
In addition, it is possible to plot the first derivative of the TGA curve (the DTG curve), useful to highlight little variations in weight.
In this work, TGA has allowed to quantify the loss of water and organic material and consequently the amount of inorganic material on the membranes.
2.3 Pervaporation experiment 2.3.1 Set-up
A lab-made apparatus was used to test pervaporation performance of the membranes (Fig-2.4).
Fig-2.4 Experimental apparatus for pervaporation scheme
To protect the pump from potential infiltration, a second cold trap was interposed after the one used to collect the permeate (Fig-2.5.)

Chapter 3 Results and Discussion ___________________________________________________________________________
16
Fig-2.5 Experimental apparatus for pervaporation
Experiments were carried out using 90:10 (g/g) ethanol/water mixtures as feed loaded in the feed tank (Fig-2.6) and heated to 50°C.

Chapter 3 Results and Discussion ___________________________________________________________________________
17
Fig-2.6 Feed tank
The membrane cell (Fig-2.7) dimensions were 8×3×0.5 cm (L×W×H), with 24 cm2 as the membrane effective area.
Fig-2.7 Membrane cell
The feed was circulated at 80 L/h and the temperature was controlled by an electronic control thermometer. The vacuum at the downstream pressure was maintained using a vacuum pump (Cps VP4DE) (Fig-2.8).

Chapter 3 Results and Discussion ___________________________________________________________________________
18
Fig-2.8Vacuum pump
For every membrane tested, the procedure was the same: at the beginning, the system was operated for a duration of 1 h for equilibration. Then, the liquid was collected, using a liquid nitrogen trap (Fig-2.9), for approximately 2 h.

Chapter 3 Results and Discussion ___________________________________________________________________________
19
Fig-2.9Cold trap

Chapter 3 Results and Discussion ___________________________________________________________________________
20
3 Results and Discussion
3.1 Characterization
3.1.1Scanning electron microscopy (SEM) results The surface of the samples was investigated by FESEM. In order to make a proper comparison, membranes modified with and without silane were characterized (Fig-3.1)
From Fig-3.1 is clearly seen that the surface of the membrane that was modified with silane (b), is covered with nanoparticles which is believed to be Si.
Fig-3.1 SEM images. Grafting polymerization conditions were: (a) 25% VSA 5% MBAA, t = 10 min,I= 65 mW/cm2, (b) 25% VSA 5% MBAA 2,5% VTES 5% TEOS, t = 10 min,I= 65 mW/cm2
3.1.2 ATR-FTIR results
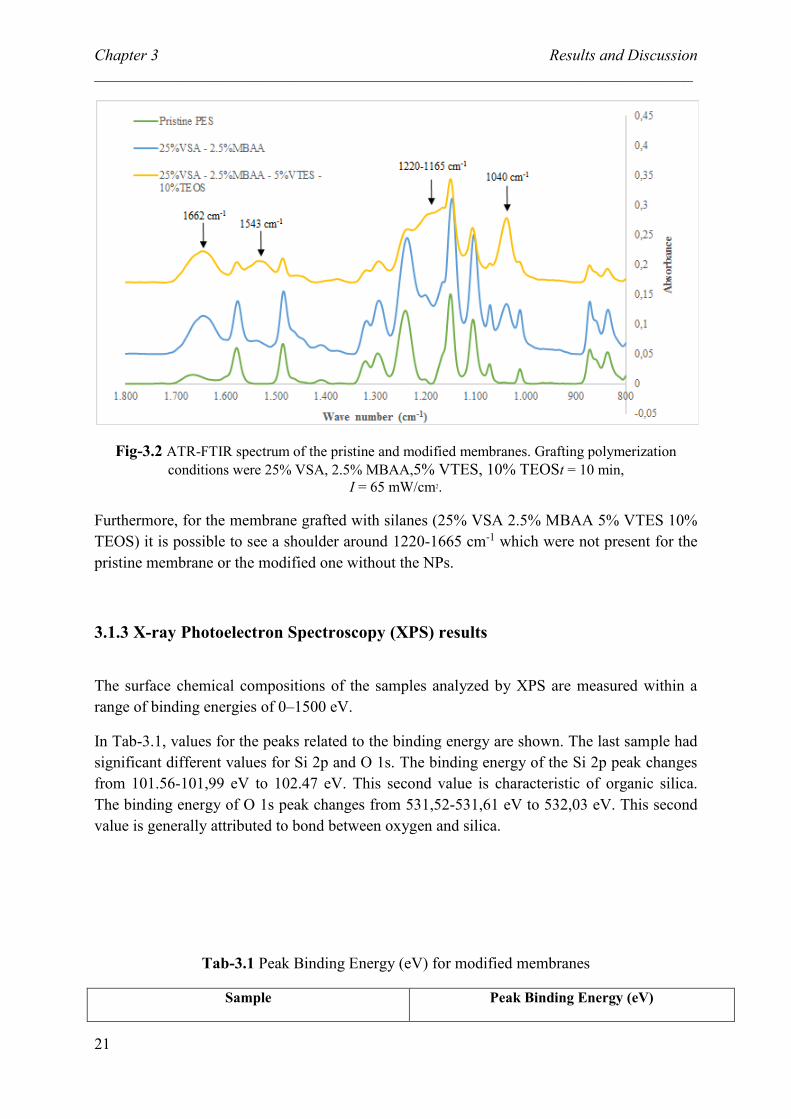
The ATR-FTIR spectra of the pristine, the modified membrane with 25 wt% VSA as the monomer and with 5 % MBAA as the cross-linker and the modified membrane with 25 wt% VSA as the monomer and with 5 % MBAA as the cross-linker and different percentage of TEOS and VTES as silica precursors are shown in Fig-3.2. A new peak emerged for the modified membranes at 1040 cm-1, corresponding to the stretching vibration of the sulfone acid group and confirms the successful grafting of the VSA[58]. The other two new peaks shown in Fig-3.2 are the absorption peak of the amide I (C=O) and the amide II (N-H), at 1662 cm-1 and at 1543 cm-1, respectively, and can be attributed to the crosslinker.
a b
Chapter 3 Results and Discussion ___________________________________________________________________________
21
Fig-3.2 ATR-FTIR spectrum of the pristine and modified membranes. Grafting polymerization conditions were 25% VSA, 2.5% MBAA,5% VTES, 10% TEOSt = 10 min,
I = 65 mW/cm2.
Furthermore, for the membrane grafted with silanes (25% VSA 2.5% MBAA 5% VTES 10% TEOS) it is possible to see a shoulder around 1220-1665 cm-1 which were not present for the pristine membrane or the modified one without the NPs.
3.1.3 X-ray Photoelectron Spectroscopy (XPS) results
The surface chemical compositions of the samples analyzed by XPS are measured within a range of binding energies of 0–1500 eV.
In Tab-3.1, values for the peaks related to the binding energy are shown. The last sample had significant different values for Si 2p and O 1s. The binding energy of the Si 2p peak changes from 101.56-101,99 eV to 102.47 eV. This second value is characteristic of organic silica. The binding energy of O 1s peak changes from 531,52-531,61 eV to 532,03 eV. This second value is generally attributed to bond between oxygen and silica.
Tab-3.1 Peak Binding Energy (eV) for modified membranes
Sample Peak Binding Energy (eV)

Chapter 3 Results and Discussion ___________________________________________________________________________
22
C 1s N 1s O 1s Si 2p S 2p
25% VSA–5% MBAA 284,78 399,60 531,61 101,56 167,69
25% VSA–5% MBAA–2,5% VTES–5% TEOS 284,82 399,66 531,59 101,90 167,83
25% VSA–5% MBAA–2,5% VTES–10% TEOS 284,78 399,65 531,52 101,64 167,81
25% VSA–5% MBAA–2,5% VTES–15% TEOS 284,74 399,61 531,61 101,99 167,75
25% VSA–5% MBAA–5% VTES–10% TEOS 284,77 399,66 531,57 101,85 167,74
25% VSA–5% MBAA–10% VTES–10% TEOS 284,83 399,87 532,03 102,47 168,14
C 1s, O 1s, N 1s, Si 2p and S 2p spectra are measured and shown in Tab-3.2 in which the atomic concentration and the atomic ratio of C/Si, O/Si and N/Si are listed.
Tab-3.2 Atomic concentration and atomic ratio of C/Si, O/Si and N/Si for modified membranes
Sample XAT (%) Atomic ratio
C 1s N 1s O 1s Si 2p S 2p C/Si O/Si N/Si
25% VSA–5% MBAA 67,66 4,47 19,98 1,82 6,07 37,18 10,98 2,46
25% VSA–5% MBAA–
2,5% VTES–5% TEOS 62,22 4,51 23,95 3,18 6,13 19,57 7,53 1,42
25% VSA–5% MBAA–
2,5% VTES–10% TEOS 61,94 5,69 23,94 1,39 7,04 44,56 17,22 4,09
25% VSA–5% MBAA–
2,5% VTES–15% TEOS 64,79 3,87 22,44 3,02 5,89 21,45 7,43 1,28
25% VSA–5% MBAA–
5% VTES–10% TEOS 60,22 4,52 24,44 3,76 7,06 16,02 6,50 1,20
25% VSA–5% MBAA–
10% VTES–10% TEOS 56,36 2,18 27,09 9,85 4,52 5,72 2,75 0,22
The sample grafted with 25% VSA, 5% MBAA, 10% VTES and10% TEOS is the only one wich shown a strong increase of both the silica signal (from 1,39-3,76 % to 9,85%) and the oxygen signal (from 19,98-24,44 % to 27,09%) and a corresponding decrease in carbon (from

Chapter 3 Results and Discussion ___________________________________________________________________________
23
60,22-67,66 % to 56,36%) and nitrogen (from 3,87-5,69 % to 2,18%). All the atomic ratio considered for this sample decrease strongly.
3.1.4 Thermogravimetric analysis (TGA) results
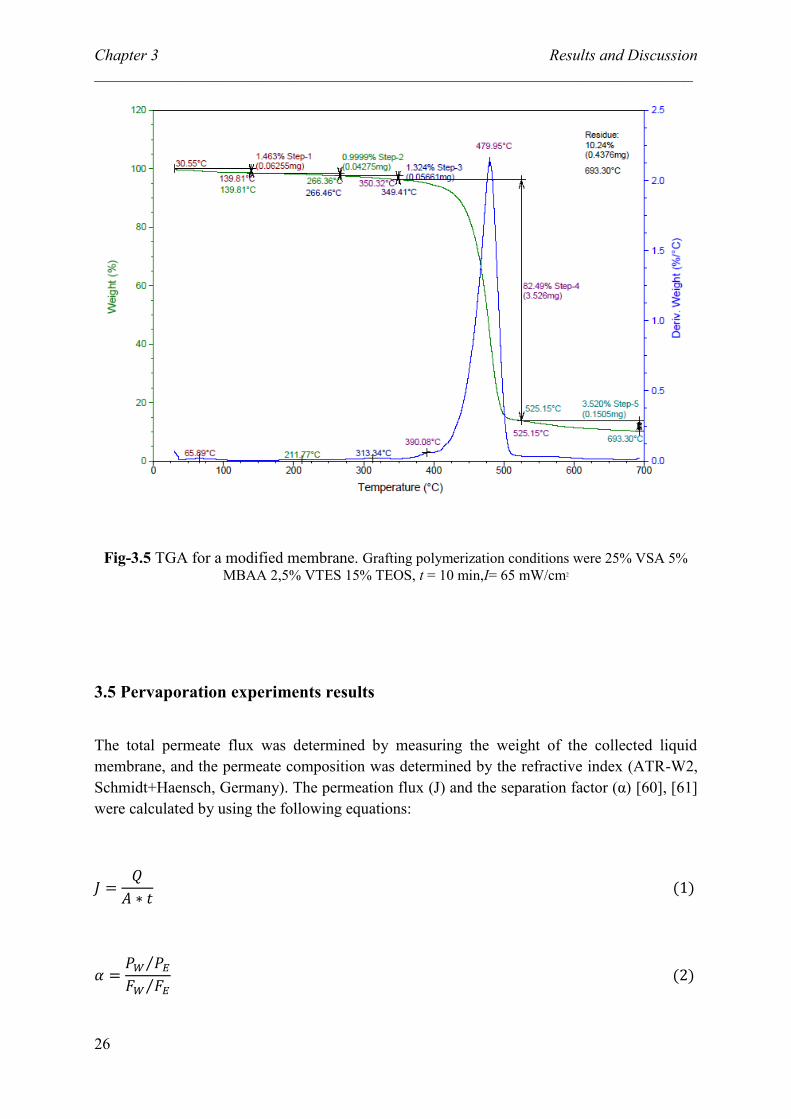
TGA was conducted on membranes modified with 25 wt% VSA as the monomer and with 5 % MBAA as the cross-linker and the modified membrane with 25 wt% VSA as the monomer and with 5 % MBAA as the cross-linker and 5-15% TEOS, 2,5% VTES as silica precursors. TGA curves are shown in Fig-3.3-5. The steps in each curve were attributed to the dehydration, de-sulphonation and decomposition of the grafted polymers.
TGA characteristic parameters are: the temperature at which thermal degradation begins (T onset), the temperature at which thermal degradation is maximum (T peak), the temperature at which the process is complete (T end set) and the percentage of weight loss during each stage (W%). The first comparative data regarding thermal degradation of the stage with the higher loss of weight are shown in Tab-3.3. Membranes functionalized only with VSA and MBAA showed slightly reduced thermal stability over the same membranes with VTES and TEOS, in the range of temperatures of the stage considered as can been deduced from the lower T onset.
Tab-3.3 Temperatures and weight loss registered during thermal degradation
Membranes Stage T onset (°C)
T end set (°C)
T peak (°C)
W(%)
25% VSA–5% MBAA - III 299,89 693,25 469,95 90,24
25% VSA–5% MBAA–2,5% VTES–5% TEOS III 356,63 693,28 483,54 83,55
25% VSA–5% MBAA–2,5% VTES–15% TEOS IV 349,41 693,30 479,95 82,49
The membrane modified without silane, at the end of the test, presented 5,215 wt% of residue, which means that this is the amount of inorganic matter (relative to the sulfone group) originally present on the membrane. Instead, the other two membranes had a doubled amount of residue, confirming the presence of silica in addition to the sulfone group. The difference between the residue in the case of 5% and 15% of TEOS is not significant.

Chapter 3 Results and Discussion ___________________________________________________________________________
24
Fig-3.3 TGA for a modified membrane. Grafting polymerization conditions were 25% VSA 5% MBAA, t = 10 min,I= 65 mW/cm2

Chapter 3 Results and Discussion ___________________________________________________________________________
25
Fig-3.4 TGA for a modified membrane. Grafting polymerization conditions were 25% VSA 5% MBAA 2,5% VTES 5% TEOS, t = 10 min,I= 65 mW/cm2
Chapter 3 Results and Discussion ___________________________________________________________________________
26
Fig-3.5 TGA for a modified membrane. Grafting polymerization conditions were 25% VSA 5% MBAA 2,5% VTES 15% TEOS, t = 10 min,I= 65 mW/cm2
3.5 Pervaporation experiments results
The total permeate flux was determined by measuring the weight of the collected liquid membrane, and the permeate composition was determined by the refractive index (ATR-W2, Schmidt+Haensch, Germany). The permeation flux (J) and the separation factor (α) [60], [61] were calculated by using the following equations:
𝐽 =𝑄
𝐴 ∗ 𝑡 (1)
𝛼 =𝑃𝑊 𝑃𝐸⁄
𝐹𝑊 𝐹𝐸⁄ (2)

Chapter 3 Results and Discussion ___________________________________________________________________________
27
where Q (kg) is the weight of permeate in the operation duration t (h), A (m2) is the effective membrane area, and P and F represent the mass fractions of water (W) and ethanol (E) in the permeate solution and feed solution, respectively.
The permeation flux and the separation factor of membranes fabricated by using 25% VSA, 5% MBAA, different amount of VTES and TEOS and irradiated at an intensity of I = 65 mW/cm2 for 10 minutes are shown in Tab-3.4.
Tab-3.4 Pervaporation experiments results
Modification solution (%mol)
Feed mass ratio (EtOH/H
2O)
Separation factor
Permeation flux (kg/m
2h)
Water in permeate (%
wt) VSA MBAA VTES TEOS
25 5 - - 87/13 5,27 4,17 47
25 5 0,5 0,5 89/11 5,72 3,125 48
25 5 2,5 10 90/10 7,48 3,125 76
25 5 5 15 85/15 1,89 2,917 46,9
3.5.1 Effect of water content in feed
From Tab-3 it looks that an increase of water content in feed resulted in a decrease of separation factor. This may be attributed to the preferential sorption of water molecule because of hydrophilic and charged nature of the membrane surfaces. The charged nature of the membrane is important in the selective sorption of water, which is quite high in comparison with ethanol. Preferential affinity of membranes towards water might have caused membrane swelling and rapid permeation of feed water through the membrane [56].
3.5.2 Effect of feed temperature
The temperature of the feed also affected the transport of components in the liquid feed and in the membrane. Both mass transfer coefficient of components in the liquid and sorption of components into the membrane increase with temperature but the effect is stronger on the ethanol transport [21]. In addition, higher temperature make the polymer chains more flexible

Chapter 3 Results and Discussion ___________________________________________________________________________
28
and cause larger available free volume of polymer matrix for diffusion. From these reasons, an estimated optimal temperature of50 °C was used to carry out tests [22].
3.5.3 Effect of permeate pressure
The permeate pressure, together with the operating temperature, determines the driving force of the process. The influence of downstream pressure on membrane performances has been studied from several researcher [10], [21], [62], [63] and they established that both flux and separation factor decreased with increasing permeate pressure since there is a reduction of driving force for transport of components.
Unfortunately In this work, we did control the permeate pressure and it turned out that the downstream pressure was much higher than it was to our previous research [4] because of problems with the pump that was used. This was confirmed by control experiments – the selectivity of TFC-PE membranes without Si-NPs was much lower than in our previous study. This limitation, the relatively high downstream pressure, was most likely the reason why the separation factor of the membrane was low [10], [63].
3.6 Conclusions
The analysis carried out to characterize the membranes confirmed the presence of an inorganic phase in the active layer. The thermogravimetric analysis determined the increase in terms of inorganic matter in the structure of the membrane when it was modified using silanes and through this analysis was inferred an improvement of the thermal stability of the membranes. The same results were confirmed by the X-ray Photoelectron Spectroscopy. It was possible to see some uniform, spheroidal particles on the surface, from FESEM images, which confirmed the successful formation and grafting of silica nanoparticles. In the light of these results it is possible to say that a hybrid membrane has been fabricated with nanoparticles of silica dispersed in a strong polyelectrolyte hydrogel active layer. The interesting result is especially the possibility to fabricate hybrid membrane by the simple way of UV photoirradiation graft copolymerization.
Tests performed to investigate pervaporation performance of the membrane gave not satisfactory results. During these tests parameters such as feed content in water and feed temperature were controlled in order to ensure optimal conditions. Unfortunately, it was not possible to control strictly the permeate pressure and this probably compromised the results of the whole process.

Chapter 4 Conclusions ___________________________________________________________________________
29
4 Conclusions
In this research, a hybrid TFC membrane for dehydration of ethanol was produced. The membrane was fabricated by using the UV grafting polymerization method on a polyethersulfone ultrafiltration support. The active layer consisted of a strong polyelectrolyte (PE) hydrogel, graft polymerized using vinyl sulfonic acid (VSA) as the polymer monomer and N, N′-methylenbisacrylamide (MBAA) as the cross-linker monomer, and with nanoparticles of silica dispersed in the polymeric layer which were obtained in situ by triethoxyvinylsilane/tetraethoxysilane (VTES/TEOS).
The structure of the membrane was investigated through different analysis. Images obtained by FESEM shown the presence of nanoparticles on the membrane surfaces. The ATR-FTIR confirmed the successful grafting of the VSA hydrogel. Other peaks were detected as possible stretching vibration of silica groups suggested that the NPs were formed inside the hydrogel. XPS confirmed the same result.
Thermogravimetric analysis showed the increase of inorganic matter in the membranes after modification. Furthermore, during this analysis, hybrid membranes showed slightly increased thermal stability over membrane modified only with VSA and MBAA.
The pervaporation tests were carried out to investigate the performance of the novel TFC membrane. The composition and the temperature of the feed were kept at an estimated optimal value. However, it was not possible to control the downstream pressure which was higher than expected resulting in a selectivity factor which was not satisfactory.
In conclusion, the achievements obtained in this study in terms of hybrid material production demonstrate the reliability and feasibility of the UV grafting polymerization as an optimal and simple method for membranes modification. Membranes produced did not have good performances for pervaporation application, probably because it was not possible to have strictly control on all the parameters influencing the process.
References ___________________________________________________________________________
30
References [1] P. D. Chapman, T. Oliveira, A. G. Livingston, and K. Li, “Membranes for
the dehydration of solvents by pervaporation,” J. Memb. Sci., vol. 318, no. 1–2, pp. 5–37, 2008.
[2] R. W. BAKER, Membrane Technology. 2000. [3] X. Cheng et al., “Hybrid membranes for pervaporation separations,”
Journal of Membrane Science, vol. 541. pp. 329–346, 2017. [4] J. Liu and R. Bernstein, “High-flux thin-film composite polyelectrolyte
hydrogel membranes for ethanol dehydration by pervaporation,” J. Memb. Sci., vol. 534, pp. 83–91, 2017.
[5] K. Nagai, “Comprehensive Membrane Science and Engineering (Second
Edition),” Elsevier, vol. 2, pp. 191–225, 2010. [6] P. A. Kober, “Pervaporation, perstillation and percrystallization,” J. Am.
Chem. Soc., vol. 39, no. 5, pp. 944–948, 1917. [7] J. M. Binning, R.C. and Stuckey, “Method of separating hydrocarbons
using ethyl cellulose selective membrane.,” US Pat. 2,958,657, 1960. [8] E. Strazik, W.F. and Perry, “Process for removing water from organic
chemicals,” US Pat. 3,776,970, Also US Patents 4,067,805 4,218,312 many others, 1962.
[9] P. Shao and R. Y. M. Huang, “Polymeric membrane pervaporation,” J. Memb. Sci., vol. 287, no. 2, pp. 162–179, 2007.
[10] J. Olsson and G. Trägårdh, “Pervaporation of volatile organic compounds
from waterI Influence of permeate pressure on selectivity,” J. Memb. Sci., vol. 187, no. 1–2, pp. 23–37, 2001.
[11] Y. K. Ong et al., “Recent membrane development for pervaporation
processes,” Prog. Polym. Sci., vol. 57, pp. 1–31, 2016. [12] Q. Zhao, Q. F. An, Y. Ji, J. Qian, and C. Gao, “Polyelectrolyte complex
membranes for pervaporation, nanofiltration and fuel cell applications,” J. Memb. Sci., vol. 379, no. 1–2, pp. 19–45, 2011.
[13] D. W. Green and R. H. Perry, Perry’s chemical engineers’ handbook, 8th ed. 2007.
[14] W. Y. Chiang and Y. H. Lin, “Properties of modified poly(vinyl alcohol)
membranes prepared by the grafting of new polyelectrolyte copolymers for water-ethanol mixture separation,” J. Appl. Polym. Sci., vol. 86, no. 11, pp. 2854–2859, 2002.
[15] Y. Sun and T. Huang, “Pervaporation of ethanol-water mixtures through temperature- sensitive poly ( vinyl alcohol-g-N-isopropyacrylamide ) membranes,” Science (80-. )., vol. 110, no. 95, pp. 211–218, 1996.
[16] M. Rafik, A. Mas, M.-F. Guimon, C. Guimon, A. Elharfi, and F. Schué, “Plasma-modified poly(vinyl alcohol) membranes for the dehydrationof ethanol,” Polym. Int., vol. 52, no. 7, pp. 1222–1229, 2003.
References ___________________________________________________________________________
31
[17] J. Ge, Y. Cui, Y. Yan, and W. Jiang, “The effect of structure on
pervaporation of chitosan membrane,” J. Memb. Sci., vol. 165, no. 1, pp. 75–81, 2000.
[18] W. Zhang, G. Li, Y. Fang, and X. Wang, “Maleic anhydride surface-modification of crosslinked chitosan membrane and its pervaporation performance,” J. Memb. Sci., vol. 295, no. 1–2, pp. 130–138, 2007.
[19] M. D. Kurkuri, U. S. Toti, and T. M. Aminabhavi, “Syntheses and
characterization of blend membranes of sodium alginate and poly(vinyl alcohol) for the pervaporation separation of water + isopropanol mixtures,” J. Appl. Polym. Sci., vol. 86, no. 14, pp. 3642–3651, 2002.
[20] C. K. Yeom, J. G. Jegal, and K. H. Lee, “Characterization of relaxation
phenomena and permeation behaviors in sodium alginate membrane during pervaporation separation of ethanol-water mixture,” J. Appl. Polym. Sci., vol. 62, no. 10, pp. 1561–1576, 1996.
[21] R. Jiraratananon, a Chanachai, R. Y. M. Huang, and D. Uttapap, “Pervaporation dehydration of ethanol – water mixtures with chitosan / hydroxyethylcellulose ( CS / HEC ) composite membranes I . Effect of operating conditions,” vol. 195, pp. 143–151, 2002.
[22] A. Chanachai, R. Jiraratananon, D. Uttapap, G. Y. Moon, W. A. Anderson, and R. Y. M. Huang, “Pervaporation with chitosan/hydroxyethylcellulose
(CS/HEC) blended membranes,” J. Memb. Sci., vol. 166, no. 2, pp. 271–
280, 2000. [23] R. Y. M. Huang, R. Pal, and G. Y. Moon, “Crosslinked chitosan composite
membrane for the pervaporation dehydration of alcohol mixtures and enhancement of structural stability of chitosan/polysulfone composite membranes,” J. Memb. Sci., vol. 160, no. 1, pp. 17–30, 1999.
[24] Y. L. Liu, C. H. Yu, K. R. Lee, and J. Y. Lai, “Chitosan/poly(tetrafluoroethylene) composite membranes using in
pervaporation dehydration processes,” J. Memb. Sci., vol. 287, no. 2, pp. 230–236, 2007.
[25] S. Kalyani, B. Smitha, S. Sridhar, and A. Krishnaiah, “Separation of
ethanol-water mixtures by pervaporation using sodium alginate/poly(vinyl pyrrolidone) blend membrane crosslinked with phosphoric acid,” Ind. Eng. Chem. Res., vol. 45, no. 26, pp. 9088–9095, 2006.
[26] C. Hsu, R. M. Liou, S. Chen, M. Hung, H. Tsia, and J. Lai, “Pervaporation
Separation of a Water – Ethanol Mixture by PSF – PEG Membrane,” J. Memb. Sci., vol. 183, pp. 29–36, 2002.
[27] J. H. Kim, K. H. Lee, and S. Y. Kim, “Pervaporation separation of water
from ethanol through polyimide composite membranes,” J. Memb. Sci., vol. 169, no. 1, pp. 81–93, 2000.
[28] K. R. Lee, R. Y. Chen, and J. Y. Lai, “Plasma deposition of vinyl acetate
onto Nylon-4 membrane for pervaporation and evapomeation separation of aqueous alcohol mixtures,” J. Memb. Sci., vol. 75, no. 1–2, pp. 171–180,

References ___________________________________________________________________________
32
1992. [29] J. J. Shieh and R. Y. M. Huang, “Chitosan/N-methylol nylon 6 blend
membranes for the pervaporation separation of ethanol-water mixtures,” J. Memb. Sci., vol. 148, no. 2, pp. 243–255, 1998.
[30] W. Chan, C. Ng, and X. He, “Water ± alcohol separation by pervaporation
through chemically modi ® ed poly ( amidesulfonamide ) s,” vol. 160, no.
April, pp. 1113–1119, 1999. [31] C. Do Ihm and S. K. Ihm, “Pervaporation of water-ethanol mixtures
through sulfonated polystyrene membranes prepared by plasma graft-polymerization,” J. Memb. Sci., vol. 98, no. 1–2, pp. 89–96, 1995.
[32] J. W. Rhim, S. W. Lee, and Y. K. Kim, “Pervaporation separation of
water-ethanol mixtures using metal-ion-exchanged poly(vinyl alcohol) (PVA)/sulfosuccinic acid (SSA) membranes,” J. Appl. Polym. Sci., vol. 85, no. 9, pp. 1867–1873, 2002.
[33] Z. Zhu, X. Feng, and A. Penlidis, “Layer-by-layer self-assembled polyelectrolyte membranes for solvent dehydration by pervaporation,”
Mater. Sci. Eng. C, vol. 27, no. 4, pp. 612–619, 2007. [34] G. Zhang, H. Yan, S. Ji, and Z. Liu, “Self-assembly of polyelectrolyte
multilayer pervaporation membranes by a dynamic layer-by-layer technique on a hydrolyzed polyacrylonitrile ultrafiltration membrane,” J. Memb. Sci., vol. 292, no. 1–2, pp. 1–8, 2007.
[35] Y. Moo Lee, S. Yong Nam, and S. Yong Ha, “Pervaporation of
water/isopropanol mixtures through polyaniline membranes doped with poly(acrylic acid),” J. Memb. Sci., vol. 159, no. 1–2, pp. 41–46, 1999.
[36] B. V. K. Naidu, M. Sairam, K. V. S. N. Raju, and T. M. Aminabhavi, “Pervaporation separation of water + isopropanol mixtures using novel nanocomposite membranes of poly(vinyl alcohol) and polyaniline,” J. Memb. Sci., vol. 260, no. 1–2, pp. 142–155, 2005.
[37] K. M. Song and W. H. Hong, “Dehydration of ethanol and isopropanol
using tubular type cellulose acetate membrane with ceramic support in pervaporation process,” J. Memb. Sci., vol. 123, no. 1, pp. 27–33, 1997.
[38] F. P. Cuperus and R. W. Van Gemert, “Dehydration using ceramic silica
pervaporation membranes-the influence of hydrodynamic conditions,” Sep. Purif. Technol., vol. 27, no. 3, pp. 225–229, 2002.
[39] J. Sekuli, M. W. J. Luiten, J. E. Ten Elshof, N. E. Benes, and K. Keizer, “Microporous silica and doped silica membrane for alcohol dehydration by
pervaporation,” Desalination, vol. 148, no. 1–3, pp. 19–23, 2002. [40] T. A. Peters et al., “Hollow fibre microporous silica membranes for gas
separation and pervaporation: Synthesis, performance and stability,” J. Memb. Sci., vol. 248, no. 1–2, pp. 73–80, 2005.
[41] T. Peters, N. Benes, H. Buijs, F. Vercauteren, and J. Keurentjes, “Thin
high flux ceramic-supported PVA membranes,” Desalination, vol. 200, no. 1–3, pp. 37–39, 2006.

References ___________________________________________________________________________
33
[42] A. W. C. Van Den Berg, L. Gora, J. C. Jansen, M. Makkee, and T. Maschmeyer, “Zeolite A membranes synthesized on a UV-irradiated TiO2coated metal support: The high pervaporation performance,” J. Memb. Sci., vol. 224, no. 1–2, pp. 29–37, 2003.
[43] Y. Morigami, M. Kondo, J. Abe, H. Kita, and K. Okamoto, “The first
large-scale pervaporation plant using tubular-type module with zeolite NaA membrane,” Sep. Purif. Technol., vol. 25, no. 1–3, pp. 251–260, 2001.
[44] K. Okamoto, H. Kita, and K. Horii, “Zeolite NaA Membrane: Preparation, Single-Gas Permeation, and Pervaporation and Vapor Permeation of Water/Organic Liquid Mixtures,” Ind. Eng. Chem. Res., vol. 40, no. 1, pp. 163–175, 2001.
[45] J. Shen, J. Xi, W. Zhu, L. Chen, and X. Qiu, “A nanocomposite proton
exchange membrane based on PVDF, poly(2-acrylamido-2-methyl propylene sulfonic acid), and nano-Al2O3 for direct methanol fuel cells,”
J. Power Sources, vol. 159, no. 2, pp. 894–899, 2006. [46] C. E. L. Trigo, A. O. Porto, and G. M. De Lima, “Characterization of CdS
nanoparticles in solutions of P(TFE-co-PVDF-co- Prop)/N,N-dimethylformamide,” Eur. Polym. J., vol. 40, no. 11, pp. 2465–2469, 2004.
[47] D. Yang, J. Li, Z. Jiang, L. Lu, and X. Chen, “Chitosan/TiO2
nanocomposite pervaporation membranes for ethanol dehydration,” Chem. Eng. Sci., vol. 64, no. 13, pp. 3130–3137, 2009.
[48] Y. Liu, C. Hsu, Y. Su, and J. Lai, “Chitosan - Silica Complex Membranes from Sulfonic Acid Functionalized Silica Nanoparticles for Pervaporation Dehydration of Ethanol - Water Solutions,” Biomacromolecules, vol. 6, pp. 368–373, 2005.
[49] M. Khayet, J. P. G. Villaluenga, J. L. Valentin, M. A. López-Manchado, J. I. Mengual, and B. Seoane, “Filled poly(2,6-dimethyl-1,4-phenylene oxide) dense membranes by silica and silane modified silica nanoparticles: Characterization and application in pervaporation,” Polymer (Guildf)., vol. 46, no. 23, pp. 9881–9891, 2005.
[50] M. Sairam, M. B. Patil, R. S. Veerapur, S. A. Patil, and T. M. Aminabhavi, “Novel dense poly(vinyl alcohol)-TiO2 mixed matrix membranes for pervaporation separation of water-isopropanol mixtures at 30 ??C,” J. Memb. Sci., vol. 281, no. 1–2, pp. 95–102, 2006.
[51] A. Bottino, G. Capannelli, and A. Comite, “Preparation and
characterization of novel porous PVDF-ZrO2 composite membranes,”
Desalination, vol. 146, no. 1–3, pp. 35–40, 2002. [52] F. Ahmed et al., “Preparation and characterizations of polyaniline
(PANI)/ZnO nanocomposites film using solution casting method,” Thin Solid Films, vol. 519, no. 23, pp. 8375–8378, 2011.
[53] P. Jian, H. Yahui, W. Yang, and L. Linlin, “Preparation of polysulfone-

References ___________________________________________________________________________
34
Fe3O4 composite ultrafiltration membrane and its behavior in magnetic field,” J. Memb. Sci., vol. 284, no. 1–2, pp. 9–16, 2006.
[54] C. C. Yang, “Synthesis and characterization of the cross-linked PVA/TiO2 composite polymer membrane for alkaline DMFC,” J. Memb. Sci., vol. 288, no. 1–2, pp. 51–60, 2007.
[55] P. Y. Zheng et al., “Poly(sodium vinylsulfonate)/chitosan membranes with
sulfonate ionic cross-linking and free sulfate groups: Preparation and application in alcohol dehydration,” J. Memb. Sci., vol. 510, pp. 220–228, 2016.
[56] R. P. Pandey and V. K. Shahi, “Functionalized silica-chitosan hybrid membrane for dehydration of ethanol/water azeotrope: Effect of cross-linking on structure and performance,” J. Memb. Sci., vol. 444, pp. 116–
126, 2013. [57] J. Deng, L. Wang, L. Liu, and W. Yang, “Developments and new
applications of UV-induced surface graft polymerizations,” Prog. Polym. Sci., vol. 34, no. 2, pp. 156–193, 2009.
[58] R. Bernstein, E. Antón, and M. Ulbricht, “UV-photo graft functionalization of polyethersulfone membrane with strong polyelectrolyte hydrogel and its application for nanofiltration,” ACS Appl. Mater. Interfaces, vol. 4, no. 7, pp. 3438–3446, 2012.
[59] Y. Tai, J. Miao, J. Qian, R. Xia, and Y. Zhang, “An effective way to
stabilize silicon nitride nanoparticles dispersed in rubber matrix by a one-step process,” Mater. Chem. Phys., vol. 112, no. 2, pp. 659–667, 2008.
[60] P. Luis, J. Degrève, and B. Van der Bruggen, “Separation of methanol-n-butyl acetate mixtures by pervaporation: Potential of 10 commercial membranes,” J. Memb. Sci., vol. 429, pp. 1–12, 2013.
[61] R. W. Baker, J. G. Wijmans, and Y. Huang, “Permeability, permeance and
selectivity: A preferred way of reporting pervaporation performance data,”
J. Memb. Sci., vol. 348, no. 1–2, pp. 346–352, 2010. [62] A. Kujawska, K. Knozowska, J. Kujawa, and W. Kujawski, “Influence of
downstream pressure on pervaporation properties of PDMS and POMS based membranes,” Sep. Purif. Technol., vol. 159, pp. 68–80, 2016.
[63] R. W. Baker, J. G. Wijmans, A. L. Athayde, R. Daniels, J. H. Ly, and M. Le, “The effect of concentration polarization on the separation of volatile
organic compounds from water by pervaporation,” J. Membr. Sci. Sci., vol. 137, pp. 159–172, 1997.
. However, these](https://static.fdocuments.in/doc/165x107/5a78840e7f8b9a77438e240b/chapter-11-benchmarking-coreacuk-di-milano-milano-italy-e-mail-paolocremonesipolimiit.jpg)


![HOME []...TORINO TORINO - TORINO - TORINO - TORINO - 22/09/1973 17/01/1963 26/03/1961 04/12/1976 21/05/1975 IL PRESIDENTE della Commissione Elettorale LA DIRIGENTE SCOLASTICA Prof.ssa](https://static.fdocuments.in/doc/165x107/5f2d1d51d15f88246835f084/home-torino-torino-torino-torino-torino-22091973-17011963-26031961.jpg)