Politecnico di Milanodinitto.faculty.polimi.it/wp-content/uploads/SimoneStefanoFinal.pdfche...
163
Politecnico di Milano Scuola di Ingegneria dell’Informazione Corso di Laurea in Ingegneria Informatica Dipartimento di Elettronica, Informazione e Bioingegneria Adding Awareness to a Software Forge: Development of the TITANS Approach and Lessons Learnt in Participating in an Apache Open Source Development Process Relatore: Prof. Elisabetta Di Nitto Correlatori: Dr. Roberto Galoppini Dr. Damian Andrew Tamburri Tesi di Laurea di: Simone Gatti matr. 770756 Stefano Invernizzi matr. 765873 Anno Accademico 2012-2013
Transcript of Politecnico di Milanodinitto.faculty.polimi.it/wp-content/uploads/SimoneStefanoFinal.pdfche...

Politecnico di MilanoScuola di Ingegneria dell’Informazione
Corso di Laurea in Ingegneria InformaticaDipartimento di Elettronica, Informazione e
Bioingegneria
Adding Awareness to a Software Forge:Development of the TITANS Approach and
Lessons Learnt in Participating in an ApacheOpen Source Development Process
Relatore: Prof. Elisabetta Di Nitto
Correlatori: Dr. Roberto Galoppini
Dr. Damian Andrew Tamburri
Tesi di Laurea di: Simone Gatti matr. 770756
Stefano Invernizzi matr. 765873
Anno Accademico 2012-2013


Alle nostre famiglie e a tutte le persone a noi care,
che ci hanno sostenuti e incoraggiati
per tutta la durata del nostro percorso di studi
e che hanno reso possibile il raggiungimento
di questo importante traguardo.


Desideriamo innanzitutto ringraziare la professoressa Elisabetta Di Nitto,
che in questi mesi ci ha supportati nell’elaborare la nostra tesi e che ci ha
guidati con i suoi preziosi insegnamenti.
Un ringraziamento speciale al dottor Roberto Galoppini, per averci in-
trodotti al mondo dell’open source e per aver condiviso con noi la sua es-
perienza, grazie alla quale abbiamo potuto relazionarci efficacemente con la
comunita di Allura.
Ringraziamo inoltre il dottor Damian Andrew Tamburri, per averci in-
trodotto le sue brillanti idee e per averci consentito di partecipare allo sviluppo
di quella che riteniamo un’importante ricerca.
Un ringraziamento a tutta la comunita di Allura, che ci ha sempre di-
mostrato una grande disponibilita e che ha accolto, stimolato e fatto crescere
il nostro lavoro.
Infine, grazie a tutti coloro che hanno condiviso con noi questo percorso,
tra le gioie e le fatiche dello studio e dei tanti progetti universitari, rendendo
indimenticabili questi anni trascorsi tra le aule e la segreteria.
Milano, 22 Aprile 2013
Stefano e Simone


Contents
1 Introduction 1
1.1 Original Contributions . . . . . . . . . . . . . . . . . . . . . . . 3
1.2 Outline of the Thesis . . . . . . . . . . . . . . . . . . . . . . . . 4
2 State of the Art 7
2.1 Global Software Engineering . . . . . . . . . . . . . . . . . . . . 7
2.2 Open Source Software . . . . . . . . . . . . . . . . . . . . . . . 12
2.3 Coordination within an OSS community . . . . . . . . . . . . . 16
2.4 Awareness in a distributed context . . . . . . . . . . . . . . . . 20
2.5 Discussion . . . . . . . . . . . . . . . . . . . . . . . . . . . . . . 24
3 Problem Analysis 27
3.1 Identification of needs from the state of the art analysis . . . . . 27
3.2 Survey . . . . . . . . . . . . . . . . . . . . . . . . . . . . . . . . 30
3.2.1 The questionnaire . . . . . . . . . . . . . . . . . . . . . . 31
3.2.2 Background of the respondents . . . . . . . . . . . . . . 32
3.2.3 Results concerning management of collaborations and
partnerships . . . . . . . . . . . . . . . . . . . . . . . . . 37
3.2.4 Results about organizations and developers’ profile details 39
3.3 Conclusions of the analysis . . . . . . . . . . . . . . . . . . . . . 43
4 Allura Apache Podling 45
4.1 The Architecture of Allura . . . . . . . . . . . . . . . . . . . . . 45
4.2 Contribution Policies . . . . . . . . . . . . . . . . . . . . . . . . 51
4.3 The Development Process . . . . . . . . . . . . . . . . . . . . . 52
5 Our Extension: Allura TITANS 55
5.1 User profiles . . . . . . . . . . . . . . . . . . . . . . . . . . . . . 56

CONTENTS
5.2 Organizations . . . . . . . . . . . . . . . . . . . . . . . . . . . . 61
5.3 User statistics . . . . . . . . . . . . . . . . . . . . . . . . . . . . 69
5.4 Organization statistics . . . . . . . . . . . . . . . . . . . . . . . 80
5.5 Development and Discussion Process in the Allura community . 85
6 Evaluation 89
6.1 Evaluation by the community . . . . . . . . . . . . . . . . . . . 89
6.2 Using collected metrics to uncover social structures . . . . . . . 91
6.2.1 Introduction to the study on social structures . . . . . . 92
6.2.2 Classification of social structures based on our data . . . 93
6.2.3 Formal Networks . . . . . . . . . . . . . . . . . . . . . . 94
6.2.4 Informal Networks . . . . . . . . . . . . . . . . . . . . . 96
6.2.5 Networks of Practice . . . . . . . . . . . . . . . . . . . . 98
6.2.6 Informal Communities . . . . . . . . . . . . . . . . . . . 103
6.2.7 Results . . . . . . . . . . . . . . . . . . . . . . . . . . . . 105
7 Conclusions and future work 107
A Survey 111
A.1 The questionnaire . . . . . . . . . . . . . . . . . . . . . . . . . . 111
A.2 Detailed results . . . . . . . . . . . . . . . . . . . . . . . . . . . 121
B Sample metrics gathered from OSS projects 131
B.1 Distributions of projects contribution . . . . . . . . . . . . . . . 131
B.2 Metrics of projects . . . . . . . . . . . . . . . . . . . . . . . . . 137
List of Figures 139
List of Tables 143
Bibliography 145
viii

Sommario
Negli ultimi anni, lo sviluppo di software per mezzo di team operanti in un con-
testo geografico distribuito ha ricevuto un crescente interesse. Tale fenomeno
e legato soprattutto alla competizione che caratterizza il mercato odierno e
che genera nelle aziende produttrici di software la necessita di sviluppare i loro
prodotti in tempi brevi e con budget ridotti, senza pero rinunciare a elevati
standard qualitativi. Questo approccio nello sviluppo del software e conosciuto
con il nome di Global Software Engineering (GSE), ma viene anche indicato
per mezzo di termini simili, quali Distributed Software Development (DSD) e
Global Software Development (GSD).
Oltre a promettere il raggiungimento di obiettivi ambiziosi come la pro-
duzione di software di qualita a basso costo e in tempi rapidi, lo sviluppo
distribuito del software comporta anche diversi problemi organizzativi e di
comunicazione, legati sia alla separazione territoriale, sia alle differenze sociali
e culturali tra le persone coinvolte.
La barriera piu importante tra i membri di un team distribuito e la mancan-
za di conoscenza personale, alla quale consegue una scarsa fiducia reciproca.
Inoltre, la separazione geografica tra i luoghi di lavoro e la distanza temporale
tra gli istanti nei quali le attivita vengono svolte rendono difficile il controllo
dello stato di avanzamento del progetto. Incrementare la consapevolezza delle
competenze e degli interessi dei collaboratori, cosı come della loro posizione
geografica, puo ridurre l’impatto dei problemi sopra menzionati.
L’obiettivo principale di questa tesi e di investigare le tecniche e gli approcci
che permettono di aumentare la consapevolezza di cio che caratterizza il team
distribuito, con lo scopo di rafforzare la fiducia e favorire la collaborazione tra
i membri del team stesso.
Questa tesi si focalizza in modo particolare su uno dei tanti scenari inclusi
nel concetto di Global Software Engineering, l’Open Source Software (OSS).

CONTENTS
Il concetto di software open source e definito esclusivamente sulla base della
liberta di esecuzione, analisi, modifica e distribuzione del software stesso, sia
nella sua versione originale, sia dopo avervi apportato modifiche.
Allo scopo di sviluppare e migliorare un prodotto open source, sono nec-
essarie delle competenze specifiche. Per questa ragione, i programmatori han-
no iniziato a riunirsi in comunita finalizzate a condividere codice e capacita.
Questo fenomeno ha avuto inizio agli albori dell’informatica, quando anche
l’uso di un computer richiedeva delle competenze nella programmazione. I
programmatori iniziarono cosı a condividere informazioni e software, dando
vita ad una base di conoscenza comune. Con la crescita della rete Internet,
un numero sempre piu elevato di sviluppatori ha abbracciato questa filosofia,
e le comunita open source si sono evolute, assumendo differenti strutture or-
ganizzative: dai piccoli team di programmatori amatoriali alle grandi e ben
organizzate comunita no-profit, dai gruppi di sviluppatori sponsorizzati da
aziende, fino alle comunita che coinvolgono uno o piu produttori di software,
le cui strategie di business sono influenzate dalla scelta di adottare e sviluppare
applicazioni open source.
Molte di queste comunita coinvolgono sviluppatori che non hanno una
conoscenza personale reciproca e che, pur provenendo da paesi e culture pro-
fondamente diversi tra loro, cooperano a distanza in virtu del loro comune
interesse verso uno stesso progetto software. E percio possibile affermare che
il concetto di Global Software Engineering, pur non essendo intrinsecamente
legato a quello di OSS, viene spesso applicato nello sviluppo di applicazioni
open source.
L’apertura che in genere caratterizza le comunita open source fa sı che
le problematiche ad esse relative assumano connotazioni solo in parte sovrap-
ponibili a quelle relative ai progetti sviluppati secondo il modello GSE da parte
di compagnie che sviluppano software proprietario impiegando programmatori
localizzati in diversi paesi.
Ovviamente, la fiducia assume un ruolo diverso nei progetti GSE di tipo
proprietario e nei progetti open source. Mentre una software house tradizionale
con team distribuiti affronta solitamente problemi di fiducia tra i membri lo-
calizzati in diversi paesi, oppure quando utilizza subcontractors e modelli di
outsourcing, il problema piu rilevante all’interno delle comunita open source
riguarda il rapporto con gli utenti esterni che sono interessati a entrare nella co-
x

CONTENTS
munita. Di conseguenza, alcuni elementi chiave che incoraggiano lo sviluppo di
prodotti open source sono rappresentati dal supporto fornito agli sviluppatori
che esprimono la volonta di contribuire al progetto e dall’incoraggiamento della
collaborazione tra comunita diverse, che possono beneficiare delle conoscenze
e capacita reciproche.
Molti progetti di software open source sono ospitati su piattaforme,
conosciute come software forge, le quali utilizzano Internet per offrire degli
strumenti che supportano lo sviluppo del codice e la comunicazione all’interno
della comunita. Lo scopo del nostro lavoro e quello di comprendere il proces-
so adottato dalle comunita che sviluppano progetti ospitati in una di queste
piattaforme, Allura, e di fornire alcuni tool per rafforzare la consapevolezza
all’interno della comunita stessa. Allura e a sua volta un progetto open source,
attualmente inserito nell’incubatore dell’Apache Software Foundation, e viene
utilizzato da SourceForge.net, uno dei piu popolari project hosting providers,
il quale ospita 324.000 progetti, con una comunita di 3,4 milioni di utenti.
Precisamente, per comprendere le necessita della comunita e stato neces-
sario uno studio approfondito dei meccanismi di comunicazione e delle regole
che gli utenti adottano per poter contribuire ad un progetto. Inoltre e stato
realizzato un sondaggio rivolto a persone direttamente coinvolte nello svilup-
po di applicazioni open source, con l’obiettivo di individuare quali fossero le
informazioni rilevanti ai fini prefissati, definendo quindi le tipologie di dati
che i nuovi tool avrebbero dovuto raccogliere e rendere disponibili agli utenti
finali. Infine, e stata implementata un’estensione di Allura, chiamata TITANS,
costituita da un insieme di strumenti per permettere agli utenti della forge di
conoscere alcuni dati relativi alle comunita che sviluppano i progetti ospitati
dalla forge stessa e di accedere ad informazioni riguaranti le competenze, i
precedenti contributi e l’esperienza degli altri utenti che vi operano. La pro-
gettazione e implementazione di tali estensioni sono avvenute tramite la parte-
cipazione in prima persona alla comunita di sviluppatori che sostiene Allura,
consentendo cosı di comprendere ulteriormente i processi e le dinamiche che
caratterizzano il mondo open source. Tali tool sono oggi incorporati in Allura.
xi
CONTENTS
Contributi
Questo lavoro include i seguenti contributi originali:
• Uno studio delle necessita di una comunita che sviluppa software open
source, riguardante i dati aggiuntivi di cui essa necessita per aumentare
la consapevolezza sul contributo e sull’esperienza degli utenti che vi
appartengono.
• Uno studio dei processi comunicativi e di gestione dei contributi forniti
dagli utenti che vengono adottati da comunita create con lo scopo di
produrre software open source.
• L’implementazione di quattro differenti tool che permettono di fornire
agli utenti di una forge alcuni dettagli sui progetti ospitati dalla forge
stessa e sugli altri utenti che vi operano, inclusi il coinvolgimento di
organizzazioni come aziende o universita e le statistiche sul lavoro svolto
da un singolo utente o da una organizzazione.
• Una valutazione dell’impatto che i dati forniti dai tool implementati
hanno sulla consapevolezza all’interno di una comunita open source,
basata sull’analisi delle strutture latenti all’interno di organizzazioni che
sviluppano software.
• Alcune lezioni imparate attraverso la diretta partecipazione, prima come
sviluppatori e in seguito come committer, alla comunita di Allura
Apache.
Organizzazione
La tesi e cosı organizzata:
• Nel capitolo 1 introduciamo lo scopo e gli obiettivi della tesi.
• Il capitolo 2 include un’analisi dello stato dell’arte relativamente ai con-
cetti di Global Software Engineering e di Open Source Software. Vengono
inoltre discussi gli strumenti e le tecniche che supportano attualmente la
consapevolezza in questi contesti e i meccanismi di coordinamento che
caratterizzano alcune tipologie di comunita open source.
xii

CONTENTS
• Nel capitolo 3 viene presentata l’analisi del problema, inclusa la raccolta
dei requisiti realizzata per mezzo di un sondaggio rivolto a persone che
partecipano a progetti open source. Inoltre viene esposto l’approccio al
problema descritto, soffermandosi sulle caratteristiche dei tool sviluppati
per rafforzare la consapevolezza in una forge open source.
• Nel capitolo 4 sono descritti nel dettaglio la struttura di Allura, ovvero
la forge all’interno della quale gli strumenti proposti sono stati realizzati,
e i processi di sviluppo solitamente addottati dalla comunita.
• Nel capitolo 5 viene spiegata la struttura dell’estensione implementata.
Questo capitolo include anche una descrizione delle procedure seguite
per introdurre le nuove funzionalita del software prodotto.
• Nel capitolo 6 vengono esposti i risultati delle valutazioni dei tool creati.
Tali valutazioni includono sia i giudizi raccolti dalla comunita che si
dedica allo sviluppo di Allura, sia un’analisi teorica relativa all’impat-
to dei dati raccolti nella determinazione delle tipologie di strutture
organizzative latenti che caratterizzano le comunita open source stesse.
• Infine, nel capitolo 7, sono riassunti i risultati raggiunti dal nostro lavoro
e vengono presentati gli sviluppi futuri dei tool implementati.
xiii


Chapter 1
Introduction
The development of software in a distributed context is receiving increasing
interest in recent years. This is mainly a consequence of the competitiveness
of today’s market, which results in the need for software companies to rapidly
develop their products, nevertheless maintaining high-quality standards and
reduced budgets. This approach in software development is known as Global
Software Engineering (GSE), although different terms with similar meanings
are also used for this purpose, like Distributed Software Development (DSD)
and Global Software Development (GSD).
Despite promising a rapid and cheap development of good-quality software,
this approach also generates several problems, related to organizational issues
and communication barriers, as well as to social and cultural differences among
the people involved [21].
One of the most important barriers among the members of a distributed
team is the lack of personal knowledge, which often results in a low level
of trust. Moreover, working in separated locations at different times makes it
difficult to monitor the global advancement of the project. Generally speaking,
increasing awareness of the abilities and interests of co-workers and of their
geographical location can reduce the impact of the two problems mentioned
above.
The main goal of this thesis is to investigate the approaches and techniques
that allow to increase the awareness within the members of distributed teams,
in order to enforce trust and foster better collaboration.
In particular, this thesis is focused on one of the many scenarios related to
Global Software Engineering, the Open Source Software (OSS). The concept

Introduction
of Open Source Software is based on the freedom to execute, study, modify
and redistribute the software itself and its derived versions.
In order to develop and improve a piece of software, specific capabilities
are needed. Therefore, communities of programmers collaborating to open
source projects have been created with the purpose of sharing skills and code.
This phenomenon started in the dawn of computer science, when program-
ming skills were required to use a computer. Programmers shared informa-
tion and software, contributing to the creation of a common knowledge base.
With the growth of the Internet, a higher number of developers embraced this
philosophy, and open source communities evolved, adopting multiple organi-
zational structures: from small teams of amateur programmers to big and
well-organized non-profit communities, from groups of developers sponsored
by other companies, to communities directly involving one or more for-profit
companies. The latter usually adapt their business strategies to take advantage
of the adoption and the development of open source software.
Many of these communities involve developers without any personal knowl-
edge, who live in different countries and whose cultures are deeply different.
These developers start working together as a consequence of their common
interest in a software project. Therefore, even if a piece of code is not required
to be developed in a global environment to be considered open source, it is
correct to state that a GSE approach is often adopted while developing open
source products.
Such communities, opened to any contribution, face problems which are
similar, but not the same, to those of a company that develops proprietary soft-
ware employing programmers located in different countries around the world.
Of course, trust plays a different role in open source and proprietary GSE.
While a closed company with distributed teams usually faces trust-related
issues among collaborating members located in different countries or when
dealing with subcontractors and outsourcing targets, for open source commu-
nities the most relevant problem concerns relationships with external users
who are interested in joining the community itself. Therefore, the key-element
which fosters the development of open source products consists of supporting
those developers and candidate developers who express the desire to contribute
in the project, as well as encouraging the reciprocal exchange among different
communities, which could benefit from each other’s knowledge and capabilities.
2

1.1 Original Contributions
Many OSS projects are hosted on platforms, known as software forges,
using the Internet to offer tools to support the code development and the
communication within the community. Another aim of our work is to study
the processes adopted by the communities developing projects hosted on one
of these platforms, Allura, and to provide some tools in support of the aware-
ness within these same communities. Allura is an open source project itself,
currently incubated at the Apache Software Foundation. It is adopted by one
of the most popular projects hosting providers, SourceForge.net, which hosts
324,000 projects, with a community of 3.4 million users.
More in details, an analysis of OSS communities has been deemed as nec-
essary to understand the needs of open source developers. This analysis was
focused on the rules and mechanisms adopted to manage internal communica-
tion and code contributions.
A study was also conducted on people directly involved in open source
projects, with the goal to elicit the most relevant data to be provided by the
new tools.
Finally, a set of additional tools for Allura, named TITANS, was imple-
mented, allowing the users of the forge to have a better understanding of each
other’s skills, background and contributions, and providing people interested
in projects hosted on the forge with data describing the community which is
developing the projects themselves. These tools were designed and developed
as part of the community which supports Allura and are now incorporated in
Allura itself. The interaction with the community was an additional opportu-
nity to study the processes adopted to develop an open source product.
1.1 Original Contributions
This work include the following original contributions:
• A study of the needs of a community developing open source software,
concerning the additional data they would need to increase their aware-
ness of the other users’ work, contribution and experience.
• A study of the processes adopted by open source software communities
to manage internal communication and users’ contributions.
3

Introduction
• The implementation of four different tools that provide the users of a
software forge with additional details about projects and users them-
selves. These details include statistics about each other’s work, devel-
opers’ personal data and explicit relationships between projects or users
and real-life organizations, such as companies or universities.
• An evaluation of the impact of data collected and provided by the imple-
mented tools on awareness in open source software development, based
on the analysis of latent organizational social structures.
• Some lessons learnt from the direct involvement, as developers and then
committers, in the Allura Apache community.
1.2 Outline of the Thesis
This thesis is organized as follows:
• Chapter 2 discusses the state of the art of Global Software Engineering
and Open Source Software, with particular attention to current tools and
techniques supporting awareness in these contexts. Coordination and
governance mechanisms adopted within particular kinds of open source
communities are also presented.
• Chapter 3 includes the analysis of the problem and describes the ap-
proach adopted to solve it. In particular, it introduces the tools designed
and developed to support awareness within an open source forge, and it
explains the process adopted to collect specific requirements for the fea-
tures to be provided by these tools. The analysis was based on a survey
conducted among people directly contributing to open source projects.
• Chapter 4 provides details about the original structure of the modified
software forge, Allura, together with an explanation of the usual devel-
opment process adopted within the community.
• Chapter 5 focuses on the implemented tools, describing their software
architecture and including details about provided functionalities. This
chapter also includes a description of the contribution process adopted
to introduce the new features of Allura.
4

1.2 Outline of the Thesis
• Chapter 6 includes an evaluation of the new tools. The evaluation was
obtained by gathering comments expressed by the community of devel-
opers contributing to Allura and by conducting a theoretical analysis of
the impact of provided data on the study of latent organizational social
structures within communities developing software.
• Finally, Chapter 7 summarizes the results of this work and describes
future work related to the presented tools and analysis.
5


Chapter 2
State of the Art
This chapter contains background information and the state of the art of Global
Software Engineering, Open Source Software and awareness support in these
development models. Moreover, it discusses the tools and the techniques that
actually support the awareness within these development models and the co-
ordination methods that some of the open source communities adopt.
Section 2.1 defines the concept of Global Software Engineering, describing
the context in which it is currently adopted and highlighting related benefits
and problems. Section 2.2 focuses on a specific GSE case of study, consisting
of the open source software development, introducing the most relevant ele-
ments characterizing this scenario. Coordination and governance mechanisms
adopted by open source software communities are presented in Section 2.3.
Finally, Section 2.4 describes existing awareness-related tools and work in the
contexts of Global Software Engineering and open source software develop-
ment.
2.1 Global Software Engineering
The term Global Software Development (GSD) can be defined as “software
work undertaken at geographically separated locations across national bound-
aries in a coordinated fashion involving real time and asynchronous interac-
tion” [35]. Global Software Engineering (GSE) is the business tactic that
consists of adopting a distributed development to take some advantages in
producing a software [40]. Despite this slight conceptual difference, the terms

State of the Art
Global Software Development and Globals Software Engineering are generally
used as interchangeable synonyms.
Companies started experimenting with remote collaboration among soft-
ware developers in the early 1990s, when they understood they needed to
reduce costs and to exploit skilled resources, even if located far from each other
[20]. The first Web-based system to support remote testing and validation of
software was developed in 1995 at Fujitsu Network Communication Systems
[12].
Since then, interest in Global Software Engineering has strongly increased,
especially in recent years. Better network technologies and the increasing speed
of globalization-related phenomena were enabling factors, but the most impor-
tant elements encouraging the adoption of a similar approach are economic,
political, organizational and strategic factors. Software companies need to
adopt fast development processes, in order to put their products on the mar-
ket earlier than their competitors, therefore they try to take advantage of the
round-the-clock development by having teams working in different timezones.
With a global approach, they are also able to hire programmers at a lower
expense, thanks to differences between labor cost across the world, and they
can easily look for the most skilled developers, regardless of their localiza-
tion. Moreover, companies developing products for a global audience may be
interested in enrolling developers culturally and geographically close to the
different targets of intended clients, therefore they may take advantage from
having teams in different countries. Finally, the structure of multinational
corporations can strongly encourage this choice, since adopting a distributed
development looks natural for a highly distributed company [7].
Despite these advantages, the adoption of a global approach still has several
side-effects which produced unsatisfactory results in many case studies. Addi-
tional costs due to communication, synchronization and travel needs are often
underestimated [43]. Empirical studies demonstrated that the development of
GSE projects is often slower than the development of co-located ones, and that
GSE projects are more likely to fail than traditional ones.
These issues have been also identified by Lori Kiel in her analysis of a
distributed development case of study, which resutled in a failure [25]. The
study involved an organization with four offices around the world, which de-
cided to distribute a single product development group in their Canadian and
8

2.1 Global Software Engineering
their German divisions. The study tried to identify the causes of the project
failure by interviewing developers and managers. The emerged failure factors
included:
• Time issues, related to the high difference in the time zones of the two
offices;
• Language, because of the choice of English as the adopted business lan-
guage;
• Culture, because people perceive, say and make things differently ac-
cording to their specific background;
• Power, because only one office was involved in decision making;
• Trust, since one of the offices was resistant to follow standards or to use
tools developed by the others.
Moreover, the team members used teleconference as the main means of com-
munication. Teleconference is usually powerful and effective, but in this case
the adoption of English as the common business language caused tensions for
almost all members. Furthermore, during the meetings, oriented to solve prob-
lems or to resolve disputes, people often raised their voices and spoke rapidly,
making it impossible for participants to follow or to fully participate in the
discussion. As a result of these issues, teleconference was replaced by asyn-
chronous communication, like e-mail messages. This choice was also fostered
by the lack of time, due to the time zones separation which allowed to have
only a few minutes a day in which both divisions were at work at the same
time. However, using e-mails to solve issues obviously increases resolution
time, and introduces misunderstanding problems.
Similar results were collected during the Distributed and Outsourced Soft-
ware Engineering project (DOSE) in 2010 [28]. In this project, teams of stu-
dents distributed in Europe, Asia and South America were required to develop
software through remote collaboration. Various means of communication were
adopted by team members. At the end of the project, a study on how geo-
graphical distribution affected the development process was conducted. The
analysis highlighted that chats and e-mails were the most adopted means of
9

State of the Art
communication. Due to language problems, calls were considered less effec-
tive, since some students were not fluent in English, which was used as the
common language, and different accents limited comprehension among partic-
ipants. Moreover, a relationship between geographic location and communica-
tion overhead emerged from the analysis, since higher volumes of e-mails were
registered in teams involving members with a higher geographic separation.
As shown in Figure 2.1, although the lack of a shared development infras-
tructure is one of the barriers in global development, failures in GSE are usually
unrelated or weakly related to technical issues. The most important problems
arising in this context are a consequence of social issues, which produce barriers
and misunderstandings among the members of the project.
In particular, significant obstacles in a global environment are often repre-
sented by cultural differences and physical distance. Having people with differ-
ent cultures working together means managing different patterns of thinking,
feeling and acting [21]. This results in different styles of communication, dif-
ferent organizational schemes and a different sense of time, producing relevant
issues in coordination and making it hard to share ideas within the team or to
build a shared vision among its members [19].
Figure 2.1: Most relevant issues in Global Software Development.
Time zone differences, language barriers and the impossibility of having
face-to-face meetings also result in the lack of communication. According to
a study conducted by Sangwan, Mullick and Bass to identify the key factors
for the success of Global Software Engineering, the absence of informal com-
munication between distributed teams is often underestimated [36]. Despite
of this, reduced communication results in a lack of trust among developers,
producing additional collaboration issues. Reducing ambiguity allows to solve
issues related to the lack of communication by avoiding different teams to base
10

2.1 Global Software Engineering
their work on different assumptions, and was therefore identified by Sangwan
et. al. as one of the critical success factors for GSE.
Other known barriers in GSE result from process and organizational issues,
which are more frequent when the development involves different organizations,
such as in projects based on the outsourcing paradigm. In order to overcome
these issues, Sangwan et al. identified the emphasization of requirement anal-
ysis as another critical success factor, which could be a valuable strategy to
obtain a stable development process and a deep understanding of dependen-
cies between the involved teams. The adopted process could benefit from the
emphasization of requirement analysis, facilitiating coordination and being
flexible enough to accommodate cultural differences, but also rigid enough to
allow progress monitoring [36].
Herbsleb also pointed out that most of the traditional tools adopted to
enforce the cooperation within a team can be applied to co-located teams only
[18]. In his work, he highlighted that, despite sharing contextual information
is a key-factor for the project coordination, in global teams there is often
little awareness of what’s happening somewhere else. Finally, according to
him, the differences between used tools, practices and habits could result in
incompatibilities between some of the involved locations.
Figure 2.2: Complexity and barriers in a GSE project [31].
Figure 2.2 summarizes the previously introduced problems: geographical,
linguistic and cultural distance, as well as timezone differences, introduces bar-
riers among the developers of a GSE project and produces a higher complexity
in the project management. Increasing communication, cooperation, visibility
and coordination within the global team lowers barriers and complexity in the
11

State of the Art
project. However, distance reduces the effectiveness of communication and co-
operation between remote teams, and has a negative impact on coordination
and visibility [31].
The previously mentioned studies led to the implementation of several
tools trying to reduce the communication barriers in a global context, allowing
to talk with remote colleagues in an easier and informal way. For example,
the Jazz project, sponsored by IBM, added instant messaging features to the
Eclipse Platform, together with other awareness tools allowing to see which
files are currently edited by other users [8]. Other tools focused on supporting
activities such as problem analysis, requirements elicitation and activity plan-
ning. Among those, the tool MasePlanner is an Eclipse plug-in with features
to simplify agile planning in a distributed context, allowing users to create
story cards shown in a common virtual workspace, which can be organized
and modified by project members to plan their activities [29].
2.2 Open Source Software
In 1986, Richard Stallman coined the first formal definition of Free Software,
according to which the key element for a piece of code for being “free” is
preserving four fundamental freedoms [5]:
1. The freedom to execute the code;
2. The freedom to study how the code works;
3. The freedom to redistribute the program to someone else;
4. The freedom to distribute modified versions of the original software.
Therefore, the term free wasn’t used by Stallman with the meaning of “free of
charge”. Instead, the term refers to the freedoms granted to the final users of
the software [15].
The expression Open Source Software (OSS) was later introduced to de-
scribe a very similar concept. Its official definition, provided by the Open
Source Initiative, states that a software is open source if it is compliant with
ten criteria [2]:
1. It should be possible to freely redistribute the software.
12

2.2 Open Source Software
2. The program must include its source code, which can be distributed as
it is or as a compiled form.
3. Everyone must be allowed to create modified versions of the software and
derived work, distributing it under the same terms.
4. In order to preserve the integrity of the author’s source code, derived
works may optionally be required to adopt a different name from the
original software.
5. The license must not discriminate against any person or group of persons.
6. The license must not discriminate against any field of endeavor.
7. The license must be redistributable to anyone without the need to obtain
an additional license by the original authors.
8. The license must not be restricted to a single product within which the
software can be used.
9. The license must not restrict other software to be used together with the
program.
10. The license must not restrict to the adoption of any particular technology.
The basic difference between these definitions is philosophical and ethical.
While the free software emphasizes freedom, the open source software high-
lights technical aspects such as the availability of the program’s source code
and the higher quality resulting from these approach.
According to Stallman, the concept of Open Source Software is slightly
weaker than the concept of free software [37]. Despite of this, the two terms
are often used as interchangeable and some authors consider them as synonyms
[15]. The similiarity of these two concepts also results from the comparison
of the licenses approved by the Open Source Initiative (OSI) and by the Free
Software Fundation (FSF): aside a very limited number of exceptions, the
licences falling under the terms prescribed by the OSI are also approved by
the FSF, and vice versa [13].
Many other similar terms have been later introduced. Among them, Free
Open Source Software (FOSS) and Free Libre Open Source Software (FLOSS)
13

State of the Art
aim at avoiding to take a stand in the debate on whether it is better to use the
term Free Software or Open Source Software. Moreover, Libre Software was
proposed as an alternative term for Free Software. This term has the same
meaning of Free Software, but it tries to avoid misunderstandings based on
the double meaning of the English-language word free by using the equivalent
word in French and Spanish. From now on, the term Open Source Software
will be used according to the definition provided by the Open Source Initiative.
The definitions of open source software and free software both identify a
very wide concept, which includes several different scenarios. Even if amateur
programmers play a relevant role in OSS, the stereotype of open source software
only consisting of programs developed by small groups of programmers in their
spare time is far from reality. Some open source projects are developed by a
single company, which later releases the source code allowing users to modify
and redistribute it. Many others are backed by large communities, directly or
indirectly supported by for-business companies. Moreover, there are several
cases of large and successful projects managed by non-profit organizations such
as the Apache Software Foundation [15].
The success of open source software has increased over time. Many govern-
ments also introduced policies to adopt open source software within the public
administration [44]. Products such as Mozilla Firefox, Linux and the Apache
HTTP Server demonstrate that open source software can reach a significant
market share, ensuring reliability, performances, scalability and security with
a lower total cost of ownership than their proprietary competitors [45, 27].
Aside quality-related advantages, which may vary from project to project,
some of the most important benefits deriving from the adoption of OSS are
related to the possibility to access the original code of the software itself. In
fact, this makes it possible to assess the security level of the application, as well
as to directly verify its quality. Moreover, by reading the program’s original
code, users are allowed to further test it with a white-box approach.
Another advantage comes from the freedom to distribute modified versions
of the original code. This allows to derive new products from an open source
application, by adding new features or by customizing it for a specific environ-
ment.
Additionally, several companies adapted their business strategies in order
to accumulate revenues from the development, the adoption and the redis-
14

2.2 Open Source Software
tribution of open source software, for example by selling related services or
products [15].
Besides the previously listed advantages, there are several problems related
to OSS, affecting both final users and developers. First of all, trust plays a
key role while selecting the software to be used for a certain purpose, and
people usually tend to consider it safer to adopt proprietary software. This
results from a different perception of the provided support. In a traditional
firm selling closed source products, it is often very easy to identify someone to
which complain about the problems related to the software, while open source
communities may be unable to quickly respond to the needs of the users, unless
their business strategies include a support service with fee. Recently, thanks
to the rising attention about open source, the most active OSS communities
started giving more attention to final users’ requests using tools like forums.
Moreover, bug fixing is now a trasparent activity, since the community ex-
hibits the lists of reported and solved bugs. In order to achieve transparency,
communities also publish their mailing list discussions related to the issues
discovered within the software they develop; the discussions are often open to
final users’ remarks.
Other issues often related to OSS are represented by partial documenta-
tion and by the lack of marketing campaigns. These problems mainly affect
projects developed by volunteers only, since their interest is usually focused
on technical aspects. To solve these problems, many communities decided to
develop their software using code forges, which attract more attention thanks
to the successful projects they host. Therefore, developers take advantage
of this fame to publicize their own product. Moreover, forges provide tools
like wikis, by means of which developers can present the description and the
features of their software.
The lack of documentation may also be related to tests. Usually, OSS prod-
ucts are very frequently tested by companies adopting the products themselves,
also as a consequence of the previously discussed lack of trust. Obviously, this
activity represents an expensive and time-consuming overhead, that is avoided
by the communities sharing the results of their previous tests through easily
accesible tools.
From the developers’ perspective, issues related to OSS mainly involve
communication, culture and awareness. While the definitions of Open Source
15

State of the Art
Software and Free Software do not force development to be global, the openness
of the OSS approach often results in communities involving several people,
companies and institutions located in different countries around the world.
Therefore, even if several counterexamples exist, OSS is often developed ac-
cording to the GSE model. As a consequence, most of the problems discussed
in Section 2.1 also affect OSS development.
2.3 Coordination within an OSS community
Another important aspect to be considered in OSS development concerns the
coordination and governance mechanisms adopted within the community itself.
Obviously, the policies adopted to manage a community have a strong impact
on the produced software, and they can mitigate or worsen the previously
listed problems. For example, specific rules defining the entrance process for
new community members are sometimes introduced to increase awareness of
each other’s goals and skills, resulting in better tasks assignment.
As briefly mentioned in Section 2.2, the wide range of existing communities
does not allow to identify a unique model representing the coordination process
adopted in the OSS development. Therefore, understanding the specific coor-
dination and governance model adopted in an open source project constitues
a critical element for developers, to asses whether to contribute or not to the
project, as well as for final users of the resulting application, since their trust
in the community may strongly vary according to the governance mechanism
underlying the software development.
The first studies about the governance in OSS communities were conducted
in the early 2000s. In 2003, Galoppini and Garzarelli identified three main
organizational categories [13]:
• Corporate projects, entirely developed within a single company and then
released as open source software.
• Voluntary projects, which are supported by volunteers only, offering their
efforts and resources without being remunerated for that.
• Hybrid projects, jointly developed by volunteers and employers working
for the company which runs the project itself.
16

2.3 Coordination within an OSS community
Figure 2.3: Power distribution among centers of power [30].
The coordination mechanisms adopted to manage a corporate project can be
described by the traditional software engineering approach, also applied to
develop proprietary software [9]. Hybrid projects, even if they also exploit
volunteer programmers, are based on similar mechanisms, since they rely on a
group of remunerated developers who take on the responsibility of those tasks
which are not completed by volunteers [13]. According to German, remuner-
ated programmers usually perform tasks including coordination activities, bug
fixing and testing, they produce documentation and they are responsible for
the software design, since volunteers usually prefer to be involved in writing
code instead of dealing with this kind of related tasks [14].
Even considering similar communities, it is still possible to identify differ-
ences in the governance practices they follow. Prattico considered six commu-
nities supported by active open source foundations: Apache, Eclipse, GNOME,
Plone, Python and SPI [30]. Using computer-aided text analysis of each foun-
dation’s bylaws, he noted that, although each foundation adopted different
terms, it was possible to identify three common main power centers: the
members of the community, the board of directors and the chairman of the
community. For example, the chairman of the community can be named by
the board of directors, as in the Eclipse foundation, or elected by the members,
as in the Debian project. The board of directors is composed by people elected
by the members and that take decisions about the piece of software they are
in charge of. The communities showed a different distribution of power. For
example, in the Eclipse Software Foundation power is mostly managed by the
17

State of the Art
chairman, while in the Apache Software Foundation the board of directors and
the members exert the most power, with an inclination towards the board of
directors.
The diagram in Figure 2.3 represents the results of the study conducted
by Prattico. The closer the names of a foundation and a power center are,
the stronger the power of the center itself is within projects supported by the
considered foundation.
The approach adopted to develop voluntary projects is completely different
from the development of proprietary software. The whole development of a
voluntary projects is based on community efforts resulting from factors like self-
motivation, mainly fostered by learning purposes, desire to share knowledge
and willing to cooperate with others in a different way [15]. In that case, de-
velopment is really global, and developers do not have any formal commitment
with the other members of the community [9].
An example of voluntary project is represented by Debian,1 a completely
free operating system launched in 1993 by Ian Murdock. One of the most
relevant characteristics of the organization model adopted by the Debian com-
munity consists in the adoption of the Debian Social Contract, a document
listing the moral rules and the values at the basis of the project itself. The
Debian Social Contract also includes the Debian Free Software Guidelines,
allowing to distinguish between free software and non-free software [34].
Non-developers are allowed to contribute to the project in several ways,
such as by translating or improving documentation or by submitting code
patches. In order to directly contribute as a developer, an applicant, namely
someone who aspires to be a Debian developer, needs to follow a formal pro-
cedure, supervised by an Application Manager. The New Members Procedure
includes seven steps: application, identification, philosophy and procedures,
tasks and skills, recommendation, Front Desk check, Debian Account Man-
ager check, and account creation. The first steps aim at checking the applicant
identity, knowledge, goals and skills. In particular, the applicant’s knowledge
and acceptance of the project’s rules, procedures and philosophy, including
the Debian Social Contract, are tested. Moreover, the applicant should work
out the tasks to be performed as a Debian developer, and the Application
1http://www.debian.org/
18

2.3 Coordination within an OSS community
Manager should test the required skills. In the last steps, the Application
Manager writes a report including the results of the tests conducted on the
applicant’s skills and knowledge. Finally, required documents are submitted
and, after checking them, the new member’s account is created [4].
The coordination mechanisms within the Debian Project are defined within
another formal document, the Debian Constitution. The governance structure
is hierarchical and includes different roles, such as the Project Leader, annually
elected by developers, the Technical Committee, mainly responsible for tech-
nical issues or problems related to overlapping responsibilities, and developers,
managing the packages they are in charge of [3, 13, 34].
Moreover, the organization of the Debian Project can be defined as mod-
ular. Software development has became a complex activity and has now to
cope with works of big dimensions. Applications are now often organized in
modules, each of which can be modified and updated independently to the
others, provided that the interfaces between different modules are kept intact.
Modularity offers re-usable and compatible software, that can be extended and
developed in an easier way. For this reason, the Debian Project exploits mod-
ularity, fostering software innovation and allowing all the developers, including
external ones, to converge in the application’s production process. Despite the
fact that modularity allows to divide the work, it is in fact essential to coordi-
nate all developers’ activities. Consequently, big size projects, as the Debian
Project itself, adopt hierarchy as a mean to manage innovation ensuring at
the same time product integrity and modular compatibility. According to
Galoppini and Garzarelli, hierarchy in OSS communities has been introduced
because of the need to balance the number of contributors and the number of
software contributions accepted [13].
The high rate of software transformation leads to systematic innovations,
requiring simultaneous changes in the production process. The significant un-
certainty arising by these innovations favor the so-called hierarchy of authority.
This kind of hierarchy, based on the concept of charismatic authority, coexists
with the ones defined by the bylaws: the leader’s power is recognized by others
on the basis of his or her outstanding personal qualities or ideas and intuition,
that allow him or her to achieve extraordinary results. These charismatic pro-
grammers, whose reputation inspires devotion, trust and obedience, can guide
the production process in such situations of uncommon flux, since when it is
19

State of the Art
necessary to rapidly take a complex decision they can go beyond the complex
set of rules, being followed by the other programmers and allowing to proceed
with smoothened decisional conflicts and reduced coordination costs [13].
2.4 Awareness in a distributed context
Generally speaking, situation awareness simply means “knowing what is going
on” [11]. Others defined the concept of awareness as “an understanding of the
activities of others, which provides a context for your own activity” [10]. In
particular, in the field of software engineering, awareness is knowing who is
working on the project, which tasks have been assigned to each member of the
project, what they’ve done so far, what they’re doing now, and being able to
identify who has the expertise best matching a particular need [6].
As mentioned in Sections 2.1 and 2.2, awareness meets several additional
barriers in a distributed context, due to the distance and the lack of com-
munication between the involved programmers. People don’t share the same
physical workspace, so it is easy to ignore their observations and devalue their
contributions and abilities given their absence. Moreover, the possible exclu-
sion of part of them from the context in which decisions are taken and the
consequent lack in knowledge of the detailed reasoning underlying a decision,
lead to dismiss apparently bad choices even if everyone recognizes the ability
of their colleagues. Furthermore, the programmers don’t have any personal
contact or knowledge, therefore they do not have informal communication
with each other, preventing a trustful, respectful and cooperative atmosphere.
Besides, due to different time zones, the communication can happen mainly in
an asynchronous way, since the different teams or programmers work in differ-
ent moments in time. The lack of informal and synchronous communication
has proved to constitute a serious problem for the success of some projects
developed in distributed contexts. By the way, awareness is a key factor for
the success also of co-located projects, since it has a strong impact on the
coordination and the communication between the involved members. A lack
of awareness could result in wrong assumptions on someone else’s work, leading
to misunderstandings, delays in the software development or even to the failure
of the whole project. So, how is it possible to ensure a deep understanding of
what’s going on, especially in a different location?
20

2.4 Awareness in a distributed context
Besides the work presented in Section 2.1, mainly focused on communica-
tion, several other studies, more focused on awareness in projects developed in
a global environment, have been conducted in recent years.
For example, Kobylinski et al. proposed an awareness system based on
issues and artifacts monitoring, which gathers information about developers’
activities and allows each user to filter awareness information by rating the
importance of single artifacts. In particular, the tools adopted to support the
software development generate events which are later sent as notifications to
interested users only [26].
Another proposed tool, known as Social Network Analysis, has the goal to
show social relationships within a group, which are usually implicit, especially
in a distributed context. In order to do so, the tool gathers data about social
relationships through a survey and represents them by means of simple graphs
[6].
A frequently used tool to support Global Software Development is the agile
and incremental framework Scrum, originally designed for collocated teams.
Scrum is a project management approach, which is based on increments, lasting
for 2-4 weeks each, known as Sprints. Each sprint starts with a planning
meeting, which lasts up to 4 hours and aims at developing a detailed plan for
the whole increment. During the sprint, the team has daily meetings, lasting
up to 15 minutes, during which each member explains what he or she did
during the previous day, the planned activity of the day, and lists possible
impediments against it. The sprint ends with a review meeting, a 4 hour
long meeting attended by all the stakeholders of the project, during which the
status of the business, the market and technology is checked [23].
In 2009, after some successful experiments, this approach was formalized as
a tool to support Global Software Development, later becoming very popular
in this context [23, 40]. According to some reports, experience suggests that
Scrum practices help to overcome time and spacial barriers in a distributed
context, increasing collaboration and trust within the team and helping the
understanding of hidden problems [16]. In particular, Scrum practices are
adapted to a global context, for example by implementing both a local Scrum
and a global Scrum. Meetings among different teams are shorter and less
frequent, in order to reduce problems due to the lack of overlapped working
time. Moreover, they only involve Scrum Masters, namely the technical lead
21

State of the Art
or the design architect from each local team [23]. Therefore, this mechanism,
based on a hierarchical structure, allows to effectively propagate awareness
within a distributed context [40].
An Agile Service Networks-based model has been recently proposed as an
alternative to Scrum. An Agile Service Network (ASN) is a network of ser-
vice oriented applications involving several industrial parties and collaborat-
ing through agile transactions to achieve a common goal [39]. According to
Tamburri, ASNs can be used to model distributed teams. This model results
in a pro-active network, automatically delivering relevant information to local
teams. More in details, each local team is represented by a node of the network,
while links connecting nodes represent affinities like tasks sharing or depen-
dencies between nodes. According to the proposed model, messages propagate
from one node to its neighbors until they reach their destination. That way,
status information propagates to all the involved participants. Simulations
have been used to demonstrate that this model could theoretically be adopted
to support awareness within a global environment [40].
A different perspective has been adopted by other studies, which focused
on open source software projects developed in a global context. As discussed
in Section 2.2, most of the GSE-related issues also affect this kind of Open
Source projects, which are developed by communities involving people located
in several different countries and time zones.
Usually, communication within a team developing an open source applica-
tion is supported by mailing lists and Web-based tools like forums and wikis.
Contributions are shared by means of Concurrent Versions Systems (CVSs) or
Distributed Version Control Systems (DVCSs), like Subversion or Git, which
provide versioning features, allowing to easily check or revert someone else’s
contributions. Moreover, tracking systems are used by the community itself
and by external users to report bugs or other problems and to ask for the
development of new features.
In order to try to overcome some of the communication problems, both
within the community and with external users, some projects have been devel-
oped to extract information from these tools. For example, the SeCold portal
adopts mining techniques to build a shared knowledge base about several open
source projects, including explicit facts like code content and statements, as
well as implicit data, such as the adopted license and the number of clones
22

2.4 Awareness in a distributed context
Figure 2.4: Conceptual architecture of the tool ALERT.
produced from a project [24]. In other studies, mining techniques are used to
extract patterns to represent and improve the decision process adopted in soft-
ware development [17]. Obviously, mining techniques can be applied both to
open source projects and to closed source projects, but they have been mainly
used in the open source context, where the original code is freely available to
everyone.
Mining techniques have been also adopted by the research group Libresoft
at the University Rey Juan Carlos. In that case, some tools were developed,
with the purpose to increase awareness within the community developing a
certain project. More in details, the tools proposed by Libresoft mine data
extracted from code repositories, maling-list discussions and tracking systems
[33].
The project ALERT,2 which is currently under development, has the goal
to improve coordination in an open source community by implementing an
interaction highway, which increases awareness by gathering and linking re-
lated information obtained from the different tools adopted by the community,
including structured and unstructured sources.
Ontologies have also been defined to represent dependencies between com-
munity members and their interactions. The software tool is therefore intended
to use this information to build personalized, real-time and context-aware no-
2http://www.alert-project.eu/
23

State of the Art
tifications, to detect duplicate bug reports and to automatically assign bugs
to developers [38, 1]. As shown in Figure 2.4, users are also allowed to send
complex subscriptions, receiving the appropriate answers from the system.
2.5 Discussion
The analysis of the state of the art on open source software and global software
engineering highlights that the ambitious promises of similar approaches have
not been totally achieved yet. Studies conducted on awareness in distributed
contexts allow to positively address some of the issues related to global devel-
opment. Effective approaches such as Scrum have been introduced to manage
GSE projects, and other approaches to spread awareness, such as ASNs-based
models, have been proposed. Notification systems based on artifacts collection
and mining techniques have been designed or are under construction to sup-
port awareness within a certain project by sending customized messages and
by filtering relevant events only.
However, provided tools and conducted studies still provide little support to
the awareness of the composition of a community working on a certain project.
Social Networks Analysis only focuses on relationships among developers and
is based on questionnaires to be answered by users, which are often reluctant
to fill them. Despite this, our analysis makes it clear that social issues are very
relevant in a distributed context and that having a basic knowledge about
the culture, habits, experience and skills of teammates is a relevant element
to increase communication effectiveness and to introduce good coordination
mechanisms.
As discussed in Sections 2.1 and 2.2, this holds both for GSE projects
developed in a closed context and for OSS projects involving developers from
different locations. In particular, members of OSS communities may have even
less common elements, since they differ not only with respect to their origins,
cultures, backgrounds, experiences and skills, but they may also belong to
different organizations. In other words, they simply happen to contribute to
the same project for a certain amount of time, and they don’t have any formal
commitment binding them to the project itself.
Members of the community usually don’t know anything about each other.
We believe that making this data explicit would be useful to foster collabora-
24

2.5 Discussion
tion within a project, allowing to effectively assign tasks, to understand when
each other is going to work on a certain project and to elicit potential commu-
nication barriers resulting from different cultures or languages. Nonetheless,
an explicit representation of skills and experience would enable to pro-actively
involve potentially interested developers.
Moreover, in Section 2.2 the key-role of trust within open source software
projects has been discussed, highlighting its relevance in the relationship be-
tween community members and the external world. Despite of this, existing
tools and studies do not focus on this aspect. Therefore, our work aims at
fostering trust by enhancing transparency of who is working on each single
project, by providing external users with information about the involved orga-
nizations, as well as by giving them details about the real skills, capabilities and
experience of the members of the community. That way, external communities
and developers can better evaluate whether to join a project or not, based on
a detailed knowledge of the community which is developing it.
25


Chapter 3
Problem Analysis
This chapter shows our analysis of the issues exposed in Chapter 2 and the
approach we decided to adopt in order to support open source software de-
velopers to overcome some of them. Section 3.1 focuses on the analysis of
the problem, introducing the approach adopted to solve it and explaining the
underlying motivations. A survey was also conducted with the aim of verifying
and refining the requirements produced by the previous analysis. The structure
of the survey, its intended audience and purposes are discussed in Section 3.2,
also including an analysis of collected results and introducing its impact on
the proposed approach.
3.1 Identification of needs from the state of
the art analysis
While analyzing the problem of awareness in Global Software Engineering,
we decided to focus on the open source context, studying, designing and im-
plementing some tools in support of communities including developers from
different locations around the world.
The proposed approach to the solution is based on the idea of allowing
people to overcome their respective knowledge barrier when they start partic-
ipating to the development of open source software. As previously discussed,
open source communities often include members with a different culture, ex-
perience and background. Not knowing these details about a user results in
a low understanding of how each member can contribute to the project. On
Problem Analysis
the other side, being aware of similar details could represent a key-factor in
allowing the creation of teams including people with the right skills and expe-
rience to develop a high-quality project. These user data allow to create links
between team members, decreasing their personal distance perception, and it
positive affects the cohesion of the development team.
In particular, in order to enable developers to easily access awareness-
related information, our approach consists of including details about the com-
munity working on open source projects within the same platforms adopted to
develop them, known as software forges.
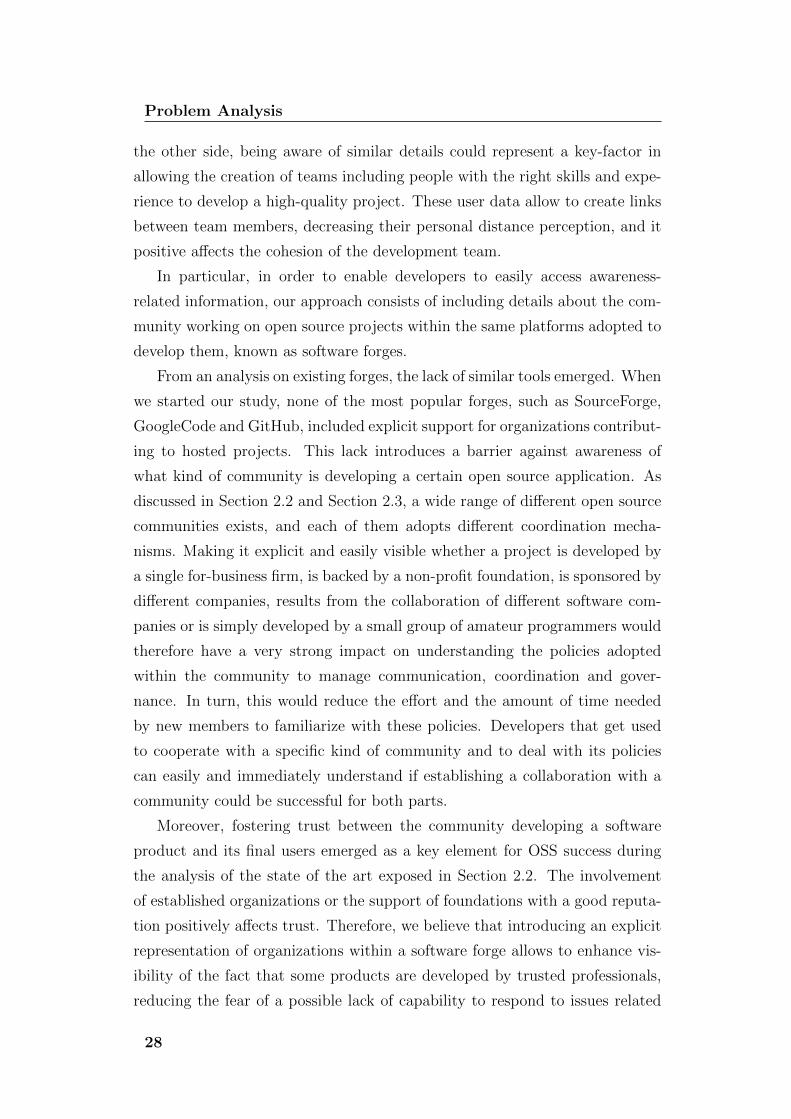
From an analysis on existing forges, the lack of similar tools emerged. When
we started our study, none of the most popular forges, such as SourceForge,
GoogleCode and GitHub, included explicit support for organizations contribut-
ing to hosted projects. This lack introduces a barrier against awareness of
what kind of community is developing a certain open source application. As
discussed in Section 2.2 and Section 2.3, a wide range of different open source
communities exists, and each of them adopts different coordination mecha-
nisms. Making it explicit and easily visible whether a project is developed by
a single for-business firm, is backed by a non-profit foundation, is sponsored by
different companies, results from the collaboration of different software com-
panies or is simply developed by a small group of amateur programmers would
therefore have a very strong impact on understanding the policies adopted
within the community to manage communication, coordination and gover-
nance. In turn, this would reduce the effort and the amount of time needed
by new members to familiarize with these policies. Developers that get used
to cooperate with a specific kind of community and to deal with its policies
can easily and immediately understand if establishing a collaboration with a
community could be successful for both parts.
Moreover, fostering trust between the community developing a software
product and its final users emerged as a key element for OSS success during
the analysis of the state of the art exposed in Section 2.2. The involvement
of established organizations or the support of foundations with a good reputa-
tion positively affects trust. Therefore, we believe that introducing an explicit
representation of organizations within a software forge allows to enhance vis-
ibility of the fact that some products are developed by trusted professionals,
reducing the fear of a possible lack of capability to respond to issues related
28

3.1 Identification of needs from the state of the art analysis
to the software itself.
On the other hand, small or emerging organizations working on good-
quality projects would increase their visibility on the forge, and this would
result in a stronger interest about the software developed by these organiza-
tions.
The analysis of the existing forges also highlighted the availability of a
reduced set of information about developers. Personal profiles usually don’t
include information such as the time zone in which users live and their usual
working time on the forge. In most of the cases, it is not possible to add
personal contacts or to list the skills of each developer. Allowing to optionally
include personal details and contacts would further increase transparency on
the forge and would give additional tools to interact with the community,
reducing once again the issues of fear against real availability of developers.
Introducing a mechanism to self-assess skills would also represent a starting
point for enabling a matching system between the needs of projects and the
interests of developers.
During the analysis of the state of the art, the need to demonstrate that an
open source community is very active also emerged. Therefore, we considered
gathering data about users’ and organizations’ contributions as another way to
increase awareness of each actor’s experience, as well as to foster trust in their
commitment. In particular, statistics about users’ and organizations’ contribu-
tions allow to quantitatively assess their efforts. Splitting contributions with
respect to the field characterizing each single project would also result in an
implicit and automatic tool to elicit an actor’s interest in certain topics and
the actor’s accumulated experience in each of them.
This data, together with the already mentioned self-assessment of users’
skills, could also be useful in reducing the complexity of entrance mechanisms
within an open source community. In fact, this would allow to reduce the efforts
to evaluate the technical skills of those users who have a strong experience on
similar projects, therefore fostering collaboration among the actors working on
the forge.
Finally, our approach aims at increasing transparency by allowing to as-
sociate each user of the forge with the organizations he or she is working
for. Despite some developers may prefer not to show their association with a
specific organization, we believe that providing users of the forge with similar
29

Problem Analysis
data would allow to better know a developer’s background, resulting in a better
understanding of the community.
In particular, some users may reject this mechanism, as a consequence of
their belief that a similar information could have an impact on the relationship
with other members of the community, leading to pressures related to the
organization which a developer is working for. Despite of such resistance, we
assert that the members of the community would benefit from this, because
they would be able to better coordinate themselves, while external users of the
software would be aware of who is really producing the applications they are
using or they plan to adopt.
In conclusion, the most relevant requirements gathered from this analysis
can be summarized as follows:
• Increasing the number of available personal details about developers,
making them visible to anyone else.
• Making explicit which organizations are involved within the community
and which users are part of them.
• Providing a quantitative estimation of users’ and organizations’ contri-
butions to open source projects.
More in details, we decided to implement this features on one of the existing
forges, Allura, the software on which the popular Web-based system Source-
Forge is based. This forge, which is described in details in Chapter 4, is an
open source project with a worldwide audience, providing a complete set of
development tools. This decision was also a consequence of the strong inter-
est demonstrated by the Allura development team, which was very open to
our proposal to introduce tools aimed at increasing awareness within hosted
projects.
3.2 Survey
In order to develop a better understanding of the scope of our work and to
elicit the requirements of open source software communities, a survey was
conducted among open source programmers. The main goal of the survey
was to understand whether the proposed approach was well-received or not by
30

3.2 Survey
communities, and to better define the relevant data to be collected and shown
within a software forge.
3.2.1 The questionnaire
The questionnaire adopted to conduct our survey was composed of 24 ques-
tions. The questionnaire was divided into four different sections:
• The first section of the questionnaire included 8 questions aimed at pro-
viding some information about the background of the interviewee. In
particular, we asked about how long the interviewee had been working
in open source, when was the last time he or she had contributed to an
open source project, what kind of organization he was working for and,
if any, what was his or her role within the organization and how long
he or she had been working for it. Finally, this section included some
additional questions about the organization itself, focused on its size,
the developed software categories and the geographic areas in which its
teams were located.
• The second section of the questionnaire, composed of 7 questions, was
only applicable to those interviewee which declared to operate as a mem-
ber of an organization. This section was related to the management of
collaborations and partnerships aimed at developing software projects.
After asking whether the interviewee’s organization was collaborating
with any other company, foundation, institution, community or free-
lance programmer, we asked, in case of positive answer, additional details
about the relevant factors in building such collaborations. In particular,
we asked to evaluate which elements were considered to be more rele-
vant to select the organization’s partners, which ones were the goals of
the collaboration itself, whether the collaboration was managed as an
outsourcing relationship or a peer-to-peer cooperation, and whether de-
velopment teams included members from different organizations or not.
Finally, the last two questions of this section were aimed at identifying
the reasons leading the interviewee’s company to operate in the open
source software field and at understanding if particular policies were
adopted in the selection of open source products.
31

Problem Analysis
• The third section of the questionnaire, including 8 questions, had the
goal to understand the most relevant data about users of a forge to
be collected and displayed to other members of the community, and to
evaluate the acceptance of showing such data to other people working on
the same forge. In particular, we asked the interviewee to evaluate the
importance of several elements:
– the explicit association of developers with the organizations they
belong to;
– some potential details to be included in the profile of an organiza-
tion;
– some potential indicators about skills and previous experiences of
users and organizations;
– some potential metrics to be collected in order to evaluate expe-
rience and skills of single users and organizations working on the
forge.
Moreover, we asked whether the interviewee would trust a mechanism
collecting statistics on previous work developed by users and organiza-
tions, and if he or she would like this data about himself or herself to be
available to anyone else on the forge.
• Finally, the fourth section of the questionnaire included one question
only, allowing the interviewee to add open comments as free text.
The complete list of questions composing the questionnaire is provided in Ap-
pendix A, together with detailed results of the survey.
3.2.2 Background of the respondents
Starting from July 2012, we distributed the link to our questionnaire through
different means of communication.
We posted it in the mailing list of an open source community, we sent it to
people participating as lecturer or students to a summer school on the topic
of open source software, and we linked it within an online group of Computer
Engineering students, asking those of them who had previously participated
32

3.2 Survey
Figure 3.1: Survey results. Background of survey respondents.
in open source projects to answer our questions. This allowed us to collect
50 answers among open source developers and members of companies directly
dealing with open source products.
The techniques adopted to distribute the survey resulted in a set of re-
spondents biased on certain groups of developers. As shown in Figure 3.1,
46% of the interviewees were operating in open source as students, teachers or
researchers from a university or another education institution. Employees of
for-profit businesses represented 26% of the survey respondents, while freelance
programmers and members of non-profit organizations were 22% and 4% of the
interviewees, respectively.
From these data, we can conlude that the strong propensity of developers
from the academic-world to answer our questions could influence the results of
our survey, since they represent a significant portion of the considered sample.
However, the dataset also includes many respondents belonging to companies,
33

Problem Analysis
which allow us to understand their point of view about organizations’ profiles.
A significant fraction of respondents is composed of independent developers.
Therefore, it seems that the sample is sufficiently heterogeneous, thus mixing
different perspectives and providing valuable information about the considered
aspects.
Almost two-thirds of participants (62%) had been participating in open
source projects for less than 3 years. This figure was influenced by the fact
that participants from education institutions, which represented the majority
of the sample, had recently began being involved in this field. However, more
than one third of the subjects answering the questionnaire (38%) had been
participating in open source projects for more than three years. This sample
then collected ideas both of people who had seen the evolution of the needs
of the forge and of the open source world and those of people who had just
started working in this context.
Figure 3.2: Survey results. Roles of survey respondents within their organiza-tions.
We also asked when the last development experience dated back to, in order
to understand if the answers were referred to current experiences. As it can
34

3.2 Survey
be observed, one third of participants had contributed for the last time to the
development of an open source project less than a month ago, and a half of
them less than six months ago. It can be concluded that the results of the
questionnaire are not affected by experiences too apart in time.
Figure 3.2 highlights roles covered by interviewees within their organiza-
tions. As shown by the diagrams, most of the members of software firms or
foundations who answered our questionnaire were developers, while 61% of
the respondents from education institutions were students who contributed to
open source projects for their individual interests or during their studies.
The resulting sample is focused on a profile of participants chacarterized by
technical knowledge and capability. In fact, almost the totality of interviewees
is composed of developers, professors and students. This profile corresponds
to that of people interested in the tools we have introduced.
The survey involved people from organizations of different sizes, and most
of the interviewees had been working for their employers for less than three
years when they answered our questions.
These results confirm the sample heterogeneity. Members working in orga-
nizations of different sizes allow us to collect various points of view about the
many aspects we considered.
Figure 3.3: Survey results. Size of the organizations of interviewees and dura-tion of respondent’s involvement within them.
Details about the fields in which interviewees’ organizations were focused
when they received our questionnaire are provided by the first diagram in Fig-
35

Problem Analysis
Figure 3.4: Survey results. Background of organizations in which intervieweesoperate.
ure 3.4. Although our work was not related to the type of software produced,
but to the development process, regardless of its purpose, we notice the wide
range of represented product categories.
Figure 3.4 also highlights that the means of distribution of the survey
led to the establishment of a sample mostly composed of people working in
Europe and North America. This geographical concentration could influence
the results of the analysis. However, many interviewees also collaborated with
others in different continents, thus making their answers valuable sources to
gather data about developers’ experience in GSE projects.
Through our survey, we also wanted to investigate the kind of partnerships
that are implemented by organizations. Among respondents who were not
36
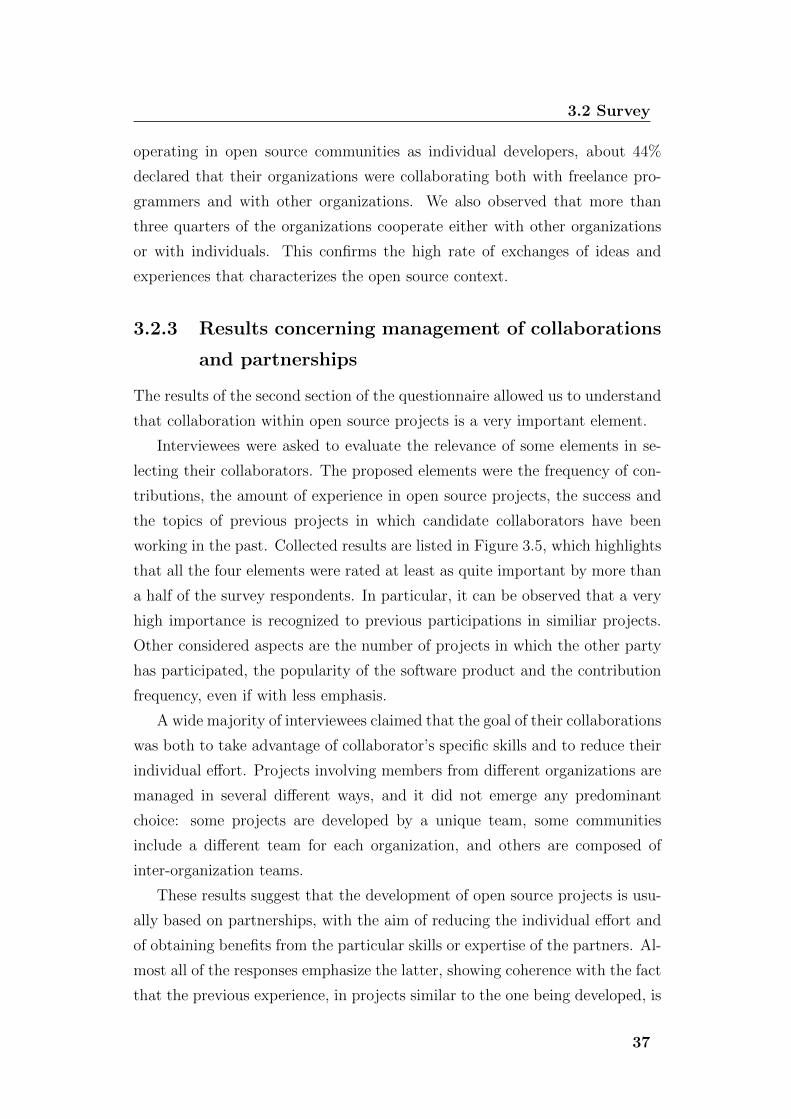
3.2 Survey
operating in open source communities as individual developers, about 44%
declared that their organizations were collaborating both with freelance pro-
grammers and with other organizations. We also observed that more than
three quarters of the organizations cooperate either with other organizations
or with individuals. This confirms the high rate of exchanges of ideas and
experiences that characterizes the open source context.
3.2.3 Results concerning management of collaborations
and partnerships
The results of the second section of the questionnaire allowed us to understand
that collaboration within open source projects is a very important element.
Interviewees were asked to evaluate the relevance of some elements in se-
lecting their collaborators. The proposed elements were the frequency of con-
tributions, the amount of experience in open source projects, the success and
the topics of previous projects in which candidate collaborators have been
working in the past. Collected results are listed in Figure 3.5, which highlights
that all the four elements were rated at least as quite important by more than
a half of the survey respondents. In particular, it can be observed that a very
high importance is recognized to previous participations in similiar projects.
Other considered aspects are the number of projects in which the other party
has participated, the popularity of the software product and the contribution
frequency, even if with less emphasis.
A wide majority of interviewees claimed that the goal of their collaborations
was both to take advantage of collaborator’s specific skills and to reduce their
individual effort. Projects involving members from different organizations are
managed in several different ways, and it did not emerge any predominant
choice: some projects are developed by a unique team, some communities
include a different team for each organization, and others are composed of
inter-organization teams.
These results suggest that the development of open source projects is usu-
ally based on partnerships, with the aim of reducing the individual effort and
of obtaining benefits from the particular skills or expertise of the partners. Al-
most all of the responses emphasize the latter, showing coherence with the fact
that the previous experience, in projects similar to the one being developed, is
37

Problem Analysis
Figure 3.5: Survey results. Elements considered while selecting collaborators.
considered of great importance. This also confirms the fact that open source
projects are the perfect platform to exchange ideas related to technological
standards.
With regard to the kind of established cooperation, it is clear that the rela-
tionship between the partners is usually equal. In fact, 64% of the participants
to the survey claimed that their collaborations are based on a peer-to-peer ba-
sis, but outsourcing-based collaborations are sometimes adopted. Instead, for
what concerns the establishment of the team, it has been shown that any choice
can be adopted: all the proposed anwers have almost the same percentage of
responses.
We also asked what are the reasons behind the use of open source software
38
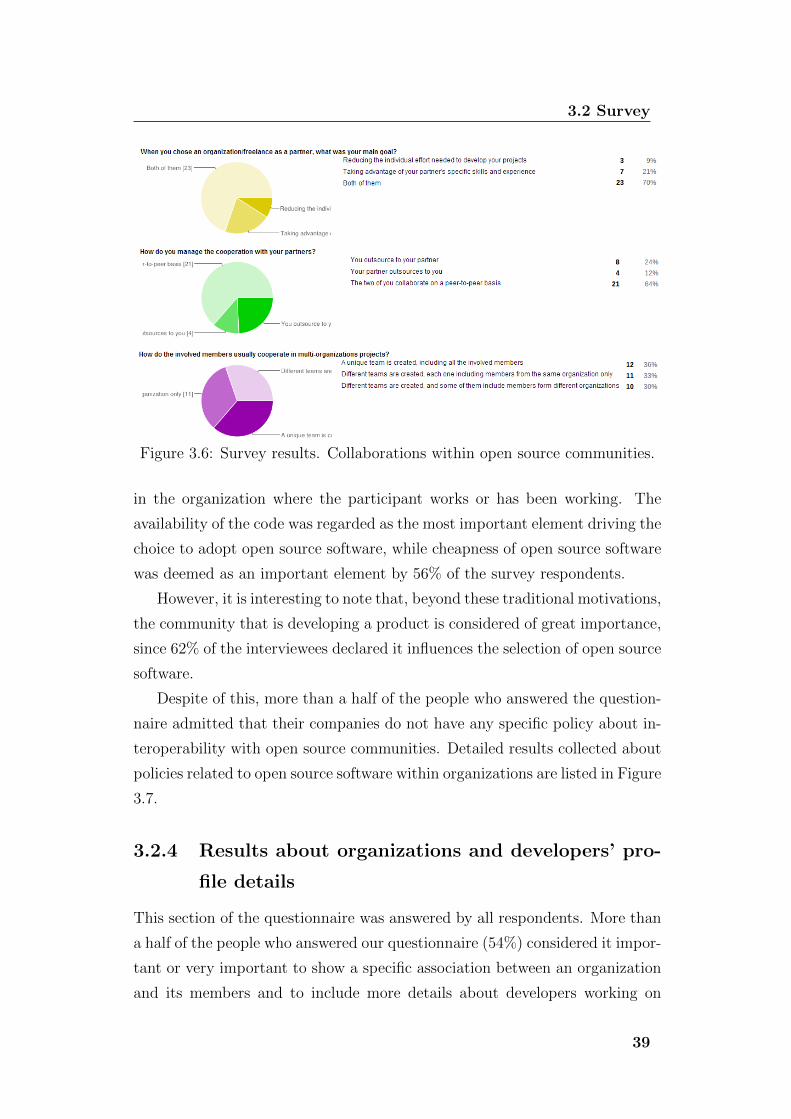
3.2 Survey
Figure 3.6: Survey results. Collaborations within open source communities.
in the organization where the participant works or has been working. The
availability of the code was regarded as the most important element driving the
choice to adopt open source software, while cheapness of open source software
was deemed as an important element by 56% of the survey respondents.
However, it is interesting to note that, beyond these traditional motivations,
the community that is developing a product is considered of great importance,
since 62% of the interviewees declared it influences the selection of open source
software.
Despite of this, more than a half of the people who answered the question-
naire admitted that their companies do not have any specific policy about in-
teroperability with open source communities. Detailed results collected about
policies related to open source software within organizations are listed in Figure
3.7.
3.2.4 Results about organizations and developers’ pro-
file details
This section of the questionnaire was answered by all respondents. More than
a half of the people who answered our questionnaire (54%) considered it impor-
tant or very important to show a specific association between an organization
and its members and to include more details about developers working on
39

Problem Analysis
Figure 3.7: Survey results. Open source-related policies.
an open source software forge, while only 24% of the respondents think it is
unnecessary to include information related to organizations.
People who considered it useful to include additional details about users
and organizations were also asked to provide more details about the kind of
data they would like to receive. Collected results indicate a certain interest
with respect to several kinds of information about organizations. All the pro-
posed aspects were rated as important. About a half of respondents stated that
it would be useful to show the list of projects in which a single organization is
involved. Other details about an organization which were deemed as important
included its contact information, a description of its activity and the working
areas in which the organization operates. Developers show less interest in the
size of the organization, probably because it does not affect the development
process and the relationship with other developers, since it is often unrelated
to the size of a single team. Detailed results are represented in Figure 3.8.
Respondents were also asked whether they would be interested in details
about skills and experience of single individuals and organizations developing
open source products, and a wide majority of them regarded this data as
important or very important, as shown in Figure 3.9. More than 60% of them
also claimed they would consider automatically collected statistics as a reliable
or quite reliable measurement. These results highlight the strong demand for
tools that collect and publish data about the skills and the experience gained in
the forge, with regard to users and organizations, and the trust the developers
would put in them.
40

3.2 Survey
Figure 3.8: Survey results. Relevance of single details about organizationsdeveloping open source software.
Figure 3.9: Survey results. Relevance of indicators about skills and experienceof organizations and developers.
41

Problem Analysis
About two thirds of interviewees would make it public statistics about their
past contributions. Among the metrics they deemed as most relevant to be
collected about a single developer, the most rated ones were the contributions
frequency, the number of assigned and solved bugs and the number of reported
bugs.
Finally, the details which emerged as the most important ones to evaluate
the reputation of an organization were the quality and success of its past
projects, the list of projects coordinated by the organization itself and a set of
aggregated figures of data acquired for its members. Detailed results listed in
Figure 3.10 suggest that all the metrics we proposed for users and organizations
were judged useful in order to represent their reputation.
Figure 3.10: Survey results. Relevance of single indicators about users andorganizations developing open source software.
42

3.3 Conclusions of the analysis
3.3 Conclusions of the analysis
Although the questionnaire was biased on certain kinds of developers, it al-
lowed us to gather important information about the needs of open source
communities. The survey highlighted that most open source projects involve
the collaboration of different organizations and programmers, and that differ-
ent kinds of relationships among collaborating actors can be adopted. The
usefulness of tools allowing to explicitly include information about involved
organizations also emerged from the survey.
Moreover, the survey confirmed that many people involved in open source
software are interested in receiving more details about developers, communities
and organizations contributing to OSS projects. Several proposed metrics were
well-received by survey respondents, confirming that software forges do not
allow people to have enough information about developers and communities.
Automatically collected statistics would be trusted by most developers, and a
wide majority of them would not fear making them available to anyone else.
In conclusion, the survey encouraged our approach, leading us to develop
tools to provide users of a software forge with data proposed within the pre-
viously exposed questions. In particular, the requirements gathered by means
of the survey are summarized in Table 3.1.
43

Problem Analysis
Area Requirements Priority
User profile
Including personal details about users High
Including the association between users and
existing organizationsHigh
Allowing users to self-assess their skills High
Including data about user’s contribution in
terms of submitted code to projects on the
forge
High
Including data about user’s contribution in
solving bugs within projects on the forgeHigh
User statistics
Including data about user’s contribution to
the communication within the forge
(reported bugs, posted messages, ...)
Medium
Including split data for each category of
projects or programming languageMedium
Including preferences of each user for specific
categories of projectsMedium
Including the concept of organization within
the forgeHigh
Including general details about registered
organizations (description, contacts, working
areas, ...)
High
Organization
profile
Including the list of projects developed by the
organization or to which it has contributedHigh
Including the list of users of the forge
working for the organization, including their
roles
Medium
Including the list of the organization’s
previous partnersLow
Including details about the success of
developed projectsHigh
Organization
statistics
Including statistics obtained by aggregating
data for each organization memberMedium
Table 3.1: Functional requirements gathered by means of the survey.
44

Chapter 4
Allura Apache Podling
This chapter describes Allura Apache Podling, the open source project devel-
oping the software within which the proposed tools have been implemented.
In Section 4.1, the functionalities offered by the software are described and
the original structure of the code is explained, outlining its main components
and specifying the most relevant concepts of the overall organization of the
code. In Section 4.2, the procedures and the rules concerning the introduction
of new users within the community are explaned. Finally, in Section 4.3 the
process adopted within the community to develop the product and to discuss
features, bugs or changes is described, providing an example of the interaction
procedures of an open source community.
4.1 The Architecture of Allura
Allura1 is a software forge developed by an open source community. The
project is hosted on SourceForge, a Web-based system supporting the devel-
opment and distribution of open source applications, and the core software of
SourceForge consists of Allura itself.
The application was initially developed by GeekNet for the launch of
SourceForge, which started in 1999. In 2012, Allura was released for the first
time as an open source application, under the Apache License. The decision of
the company to release the code of a product they adopt for their commercial
purposes is mainly related to the attempt to take advantage of external innova-
1http://sourceforge.net/p/allura

Allura Apache Podling
tion. In fact, this allows external developers to build a community around the
product and to contribute to its growth by providing the code they develop,
for example, pursuing their personal interests or following academic purposes.
Therefore, the company can potentially benefit from both the contributions
and the ideas of the community, by receiving innovative pieces of code to be
adopted by the company itself, as well as useful hints driving the evolution of
the product.
The Allura project was submitted to be considered for entering the Apache
Software Foundation Incubator on 18 June 2012. The Incubator is a project
created in October 2002 which has the goal to allow an external project to
become an Apache Project. On 25 June 2012, Allura was officially incubated,
therefore becoming a podling, a term used to refer to the code and to the
community developing it while the project is under incubation.
As any other software forge, Allura allows programmers to create their
projects and it provides them with Source Code Management systems, a track-
ing system to manage bug fixing, and some tools supporting discussion within
the community developing the project itself. In particular, Allura supports the
revision control system SVN and the distributed revision control systems Git
and Mercurial. The administrator of each project can also select one or more
additional tools, including forums, wikis, blogs and discussions related to the
project itself. Another available extension allows to include links to external
websites about the project.
Figure 4.1: The external tools in Allura.
46

4.1 The Architecture of Allura
The application is therefore designed as a combination of tools, which can
be plugged into the core modules of the forge. The core modules of the forge
include basic functionalities like projects creation and users registration or
login. Each one of the additional tools provides an additional functionality for
a specific project, and it can be easily added to the project itself or removed
from it, according to the needs of the community which is developing it.
As shown in Figure 4.1, the forge also allows to create a group of projects
which are strongly related with each other. These groups are known as neigh-
borhoods on the forge.
Each project can be categorized by its administrators using the Trove sys-
tem.2 Trove is an open source project, released under the Creative Commons
Attribution 3.0 license, which attempts to establish a model to classify projects.
This model was defined as part of the Asset Description Metadata Schema for
Software (ADMS.SW), a project developed under the European Union’s ISA
Programme and aimed at defining a metadata vocabulary to describe software.
The ADMS.SW project started in January 2012, and version 1.0 was released in
June 2012. The defined taxonomies were later translated in several languages.
In particular, the Trove system covers several aspects, including:
• The topic of the developed project;
• The intended audience of the program;
• The license under which the application is released;
• The supported operating systems;
• The chosen user interface (or interfaces);
• The programming languages in which the original code is written;
• The natural languages in which the interface of the program is available;
• The development status.
Projects also include a mechanism allowing to manage permissions by means
of groups: the administrators of a project are allowed to add users to a specific
group, or to remove them from the group itself. Moreover, each group can be
2http://www.catb.org/˜esr/trove/
47

Allura Apache Podling
assigned a different set of permissions, thus allowing to easily and intuitively
control the actions that registered users are allowed to perform within the
project itself. By default, some groups are created, including a group for
anonymous users and one for registered users of the forge which have not
joined the considered project yet.
Particular projects are also used to host the user profile of registered con-
tributors. Therefore, every time a user registers to the forge, a new user project
is created, hosting his personal information. The user is also allowed to install
on his project any of the additional tools available within the forge.
All the artifacts available within the forge, like wiki pages or blog posts,
are managed through a versioning system, which allows to check the history
of the artifact itself.
The forge is written in Python, with some code fragments written in
JavaScript for client-side execution. The overall architecture is based on the
Model-View-Controller pattern. The view component is implemented using the
Jinja23 templating language, which allows to write dynamic Web-pages using
a Django-like syntax. The model component is represented by classes mapped
to a MongoDB database through the ming library. MongoDB4 is a document-
oriented DBMS. During the original design of Allura, MongoDB was chosen
instead of a relational database because of its flexibility and performance.
Thanks to the MongoDB Object Relational Mapping layer (ORM), which is
used within Allura, the DBMS also supports relations between collections.
Figure 4.2: The architecture of the Allura event-based system.
3http://jinja.pocoo.org/docs/4http://www.mongodb.org/
48

4.1 The Architecture of Allura
As shown in Figure 4.2, the architecture of the platform also includes an
event system. Complex and time-consuming operations, like computing the
new tree of the repository after a commit event, are therefore performed as
asynchronous tasks by a daemon process.
The organization of the code is based on different Python packages, each of
them including a different tool of the forge itself. When we started contributing
to the project, the forge was composed of 14 main packages, including more
than 5,000 files and almost 80,000 lines of code within more than 800 classes.
The project is developed by a community including about 15 programmers
which contributed by providing code within the last six months, either as
committers or as external developers.
In particular, the packages of Allura include:
• The package Allura includes the core functionalities of the forge;
• ForgeBlog includes the code of a tool allowing to setup a blog within a
project. Each blog post also has a related discussion, in which each user
is allowed to add any comment or discuss the content of the post itself.
• ForgeChat is a package implementing an Internet Relay Chat, allowing
real-time communication within members of the community.
• The package ForgeDiscussion implements the tool allowing to add a dis-
cussion related to another artifact or to a project. Each discussion is
structured as a simple sequence of posts, which can be created and later
modified by its author.
• ForgeGit is a set of modules implementing the tool which is needed to
include a Git repository within a project.
• ForgeSVN is a package which allows to create a SVN repository within
a project.
• ForgeHg provides support to create a Mercurial repository including the
code of a project. The code was recently moved to an external repository
and included as an external dependency of the forge.
• ForgeLink is a tool to add an external link to a Web-page related to a
certain project.
49

Allura Apache Podling
• ForgeTracker implements all the functionalities of a traditional tracking
system, allowing users to raise new issues to signal a discovered bug or
to request a new feature. The tool also allows to discuss about the issue,
assigning it to a certain user, and to change its status, in order to check
the solving process. Moreover, each ticket can be assigned to a specific
milestone and tagged with one or more labels.
• ForgeShortUrl is an additional tool which, if installed within a project,
allows to shorten the URL of the project itself.
• The package ForgeWiki contains the code implementing a tool to be
installed within a project to create a wiki, which can be used, for example,
to include a description of the project, to describe its architecture or to
provide a guide to its users.
• ForgeActivity implements the functionalities needed to allow each user
to check the feeds of the activities conducted by watched people or within
followed projects. It also allows to check a list of the activities related
to a single project.
• The package AlluraTesting includes a set of classes and functions sup-
porting the definition of tests within Allura. In particular, it defines the
class TestController, which can be extended to define new tests for Al-
lura, some functions to setup functional and unit tests, as well as some
additional classes which can be extended to create tests for additional
tools, also providing methods to check their installation.
• NoWarnings is a package which includes a nose plug-in to suppress warn-
ings during tests, with the purpose to reduce noise. Nose is an extension
to the Python library Unittest, which allows to simplify the creation and
the execution of unit tests.5
5https://nose.readthedocs.org/en/latest/
50

4.2 Contribution Policies
Each package is further composed of different sub-packages. In particular,
each of them includes:
• An extension to the model, including the set of classes representing the
additional entities to be managed by the tool itself. This package is
simply omitted in those tools which don’t need to extend the model
representing data within the forge;
• The set of templates representing the view component;
• The controllers to implement the business logic;
• A set of tests to verify the code functionalities.
4.2 Contribution Policies
The community developing Allura includes a set of contributors working full-
time on the forge, which are professionally involved in the Website Source-
Forge.net or its owning company, GeekNet Media, owned by Dice Holdings
Inc. However, the community is also open to other contributions. These
consist of both committers and other volunteers.
A volunteer occasionally contributes as an external developer, by providing
patches, taking part to discussions, discovering bugs or proposing new features.
These contributors are also allowed to submit relevant portions of code by
creating a forked version of the main repository and later asking to merge it
with the original one.
According to the Apache policies, when the developer’s involvement within
the project becomes significant, and the submitted code is considered a qual-
itatively and quantitatively significant contribution, he or she can become a
committer of the project. Being a committer of the project literally means be-
ing granted commit access on its code repository. Therefore, a committer is a
developer who is allowed to directly write on the repository, making changes to
it without the need of someone else’s intervention. A committer is also granted
several other rights and responsibilities. In particular, committers can vote for
new releases of the software, and they can review and apply patches submitted
by external volunteers. Moreover, they are required to contribute supporting
51

Allura Apache Podling
users by answering their questions, to monitor messages about commits, to
check bug reports, and to contribute updating the project’s website.
The process adopted by the community to elect new commtters is based on
proposals made by other committers. In Allura, this process is faster than in
other projects, since the community is still young and includes a small number
of developers. At the moment, less than ten committers work on the forge,
and four addittional developers are also mentors during the Apache Incubation
process. Mentors are members of the Incubator Project Management Commit-
tee (IPMC) with responsibilities toward both the community and the IPMC
itself.
In particular, each proposed committer is voted by the Podling Project
Management Committee (PPMC). The PPMC is a set of people, acting on
behalf of the Apache Software Foundation, supervising the whole project. In
order to be successful, the vote, which takes place through the PPMC members
private mailing list, requires that at least three PPMC members, including a
podling mentor, vote with a “+1”, and that nobody votes with a “-1”.
After being voted as a committer, the developer is asked to sign an Individ-
ual Contributor License Agreement (ICLA), in which the contributor accepts
the terms concerning intellectual property of following submissions. In case the
contributor is working on the project as an employee of an external company or
organization, the company is also asked to fill a Corporate Contributor License
Agreement (CCLA).
After receiving the needed documents, the ASF Secretary records it, and
the developer’s account is created, therefore allowing him or her to contribute
as a committer.
4.3 The Development Process
The process adopted by the community to develop the project Allura, as well as
that of most other open source projects, is open to contributions from everyone
and is mainly based on discussion.
The core contributors are granted write permission on the repository host-
ing the code of the forge. Other users are allowed to access it in read-only
mode. These users can indirectly contribute to the forge, by reporting bugs or
by suggesting new features through the tracking system related to the project
52
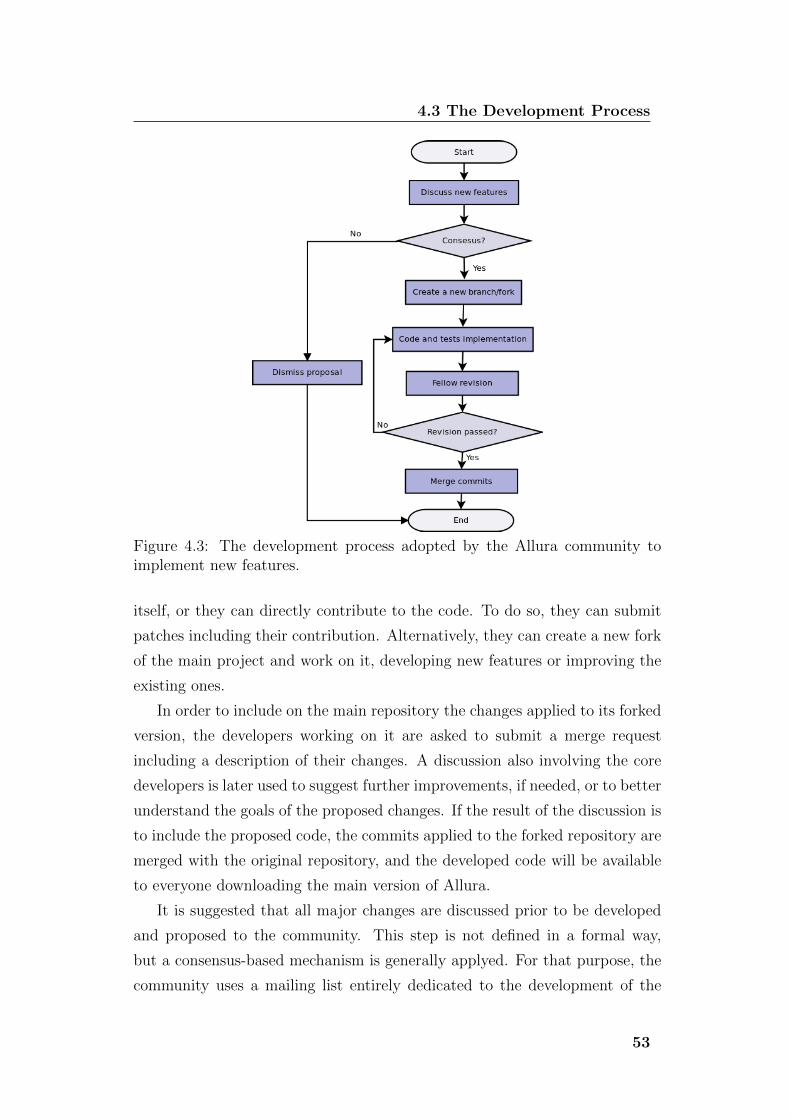
4.3 The Development Process
Figure 4.3: The development process adopted by the Allura community toimplement new features.
itself, or they can directly contribute to the code. To do so, they can submit
patches including their contribution. Alternatively, they can create a new fork
of the main project and work on it, developing new features or improving the
existing ones.
In order to include on the main repository the changes applied to its forked
version, the developers working on it are asked to submit a merge request
including a description of their changes. A discussion also involving the core
developers is later used to suggest further improvements, if needed, or to better
understand the goals of the proposed changes. If the result of the discussion is
to include the proposed code, the commits applied to the forked repository are
merged with the original repository, and the developed code will be available
to everyone downloading the main version of Allura.
It is suggested that all major changes are discussed prior to be developed
and proposed to the community. This step is not defined in a formal way,
but a consensus-based mechanism is generally applyed. For that purpose, the
community uses a mailing list entirely dedicated to the development of the
53
Allura Apache Podling
forge.
Major changes can also be proposed by core members of the Allura project.
To do so, they don’t need to create a forked version of the repository, but they
can simply create a new branch on the main one. Each branch is supposed to
be preceded by an issue on the tracking system related to Allura, explaining
the purpose of the branch itself. The name of the branch is also required to be
consistent with a predefined pattern: it should begin with the initials of the
contributor who is creating the branch, followed by the number of the issue
describing the branch itself. As for changes made by external contributors, the
features developed in a branch of the repository need to include appropriate
tests and to be revised by fellow committers prior to be included in the main
release of the forge. During the revision, changes are discussed on the mailing
list or on the discussion related to the issue which introduced the proposed
features.
In particular, the review of changes developed by committers or by external
users is conducted by a single member of the community, but any other contrib-
utor is allowed to contribute to the discussion. The reviewer is the developer
who is in charge of checking the quality of the code, suggesting improvements
and deciding whether to accept the proposed code or not.
The previously described process is also summarized through the flow chart
represented in Figure 4.3.
54

Chapter 5
Our Extension: Allura TITANS
The work presented in this thesis led to the development of a set of tools
aimed at including the previously exposed features within the forge Allura.
In particular, these tools will be referred to as Allura TITANS, Tools for
Increasing Trust and AwareNesS.
Some of the developed tools have been directly included in the core mod-
ules of the forge, while others have been developed as additional and optional
packages, which can be freely included or removed from a local installation of
Allura. Details about each tool architecture and functionalities are provided
in the remainder of this chapter. In particular, Section 5.1 describes the tool
allowing to add personal details, skills and availability timeslots to a user
profile. Section 5.2 explains the architecture and implementation of the tool
which allows to include the concept of organizations within the forge.
Section 5.3 focuses on the additional module which is responsible for collect-
ing and retrieving metrics concerning the previous activity of a user. Similary,
Section 5.4 describes the module which collects metrics and statistics about
the overall contributions provided by an organization to the projects hosted
on the forge.
Finally, Section 5.5 describes the development process, explaining the in-
teractions with the community working on Allura and the tools adopted to
discuss the described contributions and their inclusion on the forge.

Our Extension: Allura TITANS
5.1 User profiles
The first part of the work exposed in this thesis consisted in expanding the set
of data included in user profiles within the forge. Before this extension was
included, Allura provided developers with basic user profiles, allowing to show
only a username and a display name, usually intended as the user’s complete
real name.
As a result of the problem analysis exposed in Chapter 3, user profiles
were expanded, in order to allow each user to optionally include details about
themselves. The expanded set of personal data is publicly shown on the user’s
Web page. These details include information concerning the user’s localization,
time zone, usual working timeslots, personal contacts and skills. In particular,
the data a user can include on his or her profile now include:
• User’s gender. By default, this field is set to the value ’Unknown’, but
each user can freely set it to ’Male’, ’Female’ or ’Other’.
• Date of birth, including day, month and year in which the user was born.
• Country of residence. This data is mainly useful to help understanding
the cultural environment in which the user is currently living.
• City of residence. This allows to identify the user’s cultural environment
with a finer granularity than the country of residence.
• User’s time zone, specified according to the IANA Timezone Database.1
Knowing a user’s time zone allows to understand whether a user is in his
or her working time or not in a certain moment.
• Weekly availability timeslots. This data consist in weekly time intervals
during which a user is usually working on the projects hosted on the
forge. Together with the user’s time zone, it allows to easily assess when
a user is expected to be available for working on a project. This could
be useful, for example, when another user is waiting for an answer to a
certain message or needs the user to start working on a reported issue. In
order to overcome time zone differences, when a developer wants to know
someone else’s availability timeslots, these data can be shown converted
1http://www.iana.org/time-zones
56
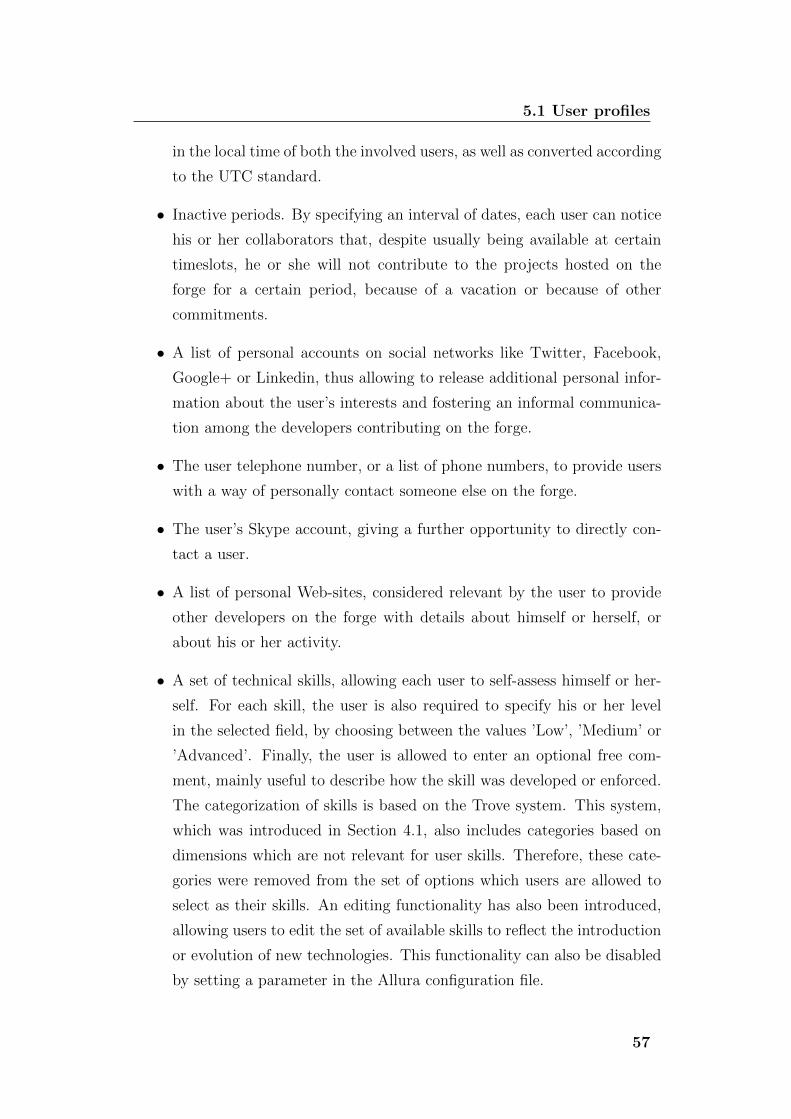
5.1 User profiles
in the local time of both the involved users, as well as converted according
to the UTC standard.
• Inactive periods. By specifying an interval of dates, each user can notice
his or her collaborators that, despite usually being available at certain
timeslots, he or she will not contribute to the projects hosted on the
forge for a certain period, because of a vacation or because of other
commitments.
• A list of personal accounts on social networks like Twitter, Facebook,
Google+ or Linkedin, thus allowing to release additional personal infor-
mation about the user’s interests and fostering an informal communica-
tion among the developers contributing on the forge.
• The user telephone number, or a list of phone numbers, to provide users
with a way of personally contact someone else on the forge.
• The user’s Skype account, giving a further opportunity to directly con-
tact a user.
• A list of personal Web-sites, considered relevant by the user to provide
other developers on the forge with details about himself or herself, or
about his or her activity.
• A set of technical skills, allowing each user to self-assess himself or her-
self. For each skill, the user is also required to specify his or her level
in the selected field, by choosing between the values ’Low’, ’Medium’ or
’Advanced’. Finally, the user is allowed to enter an optional free com-
ment, mainly useful to describe how the skill was developed or enforced.
The categorization of skills is based on the Trove system. This system,
which was introduced in Section 4.1, also includes categories based on
dimensions which are not relevant for user skills. Therefore, these cate-
gories were removed from the set of options which users are allowed to
select as their skills. An editing functionality has also been introduced,
allowing users to edit the set of available skills to reflect the introduction
or evolution of new technologies. This functionality can also be disabled
by setting a parameter in the Allura configuration file.
57

Our Extension: Allura TITANS
The relevance of some of the above listed details varies according to the scope
in which the forge is intended to be used. This consideration, together with
obvious privacy-related issues, led us to implement all these details as optional
fields. Therefore, developers are allowed to choose what kind of details they
want to provide to remaining members of the forge.
Nonetheless, providing users with the opportunity to include such details
has the goal to increase the awareness of someone else’s background, avail-
ability and potential interests or contributions. As discussed in Section 3.1,
informal communication among developers is a key element, and the extended
user profile includes data allowing to foster communication through external
tools like social networks. Moreover, the introduction of skills evaluation could
be very useful to improve task assignments within a project, as well as to im-
plement a matching system between project needs and users who would like
to start contributing to a new project.
Figure 5.1: UML class diagram representing the additional personal details ofa user.
58

5.1 User profiles
Figure 5.2: UML class diagram representing the controllers to manage personaldetails of a user.
From an architectural point of view, this extension did not require the
introduction of new packages and was mostly implemented by modifying the
existing classes. The model component of Allura was modified by including
additional attributes and methods in the class representing a single user of
the forge. This class, simply named User, is directly mapped to the Mongo
collection with the same name, which persistently stores data about users of the
forge. The most relevant changes are represented by the UML class diagram in
Figure 5.1. As shown by the diagram, a link with the concept TroveCategory,
which was already defined within the forge, was also introduced. In order to
reduce the complexity of the diagram, only attributes, methods and relations
relevant with the purpose to describe user profiles are included.
The class PreferencesController, which implements the logic allowing
to set users’ preferences, was also modified as shown in Figure 5.2, by in-
troducing the methods to update the previously listed details. A controller
implementing the logic to add or remove a skill from a user profile was also in-
troduced. This controller is represented by the class UserSkillsController.
Finally, the logic to manage the Trove categories collection was included in the
class TroveCategoryController. These changes are represented in Figure 5.2,
which also includes links with the already existing classes RootController,
representing the main controller of the whole forge, and AuthController,
which manages actions related to user management within the forge. Methods
of already existing classes are omitted to reduce the complexity of the diagram.
59

Our Extension: Allura TITANS
Figure 5.3: Screenshot representing a personal profile including the newlyintroduces personal details
The Web-page including a user’s personal profile was updated to include
the newly created fields, as shown in Figure 5.3.
Finally, additional Web-pages were introduced, including the forms to add,
remove or modify the additional data. In particular, the screenshot in Figure
5.4 represents the form displayed when a user wants to update his or her set
of skills. The page includes buttons to remove already existing skills, as well
as a form allowing a user to insert details about a skill to be added on his or
her profile.
60
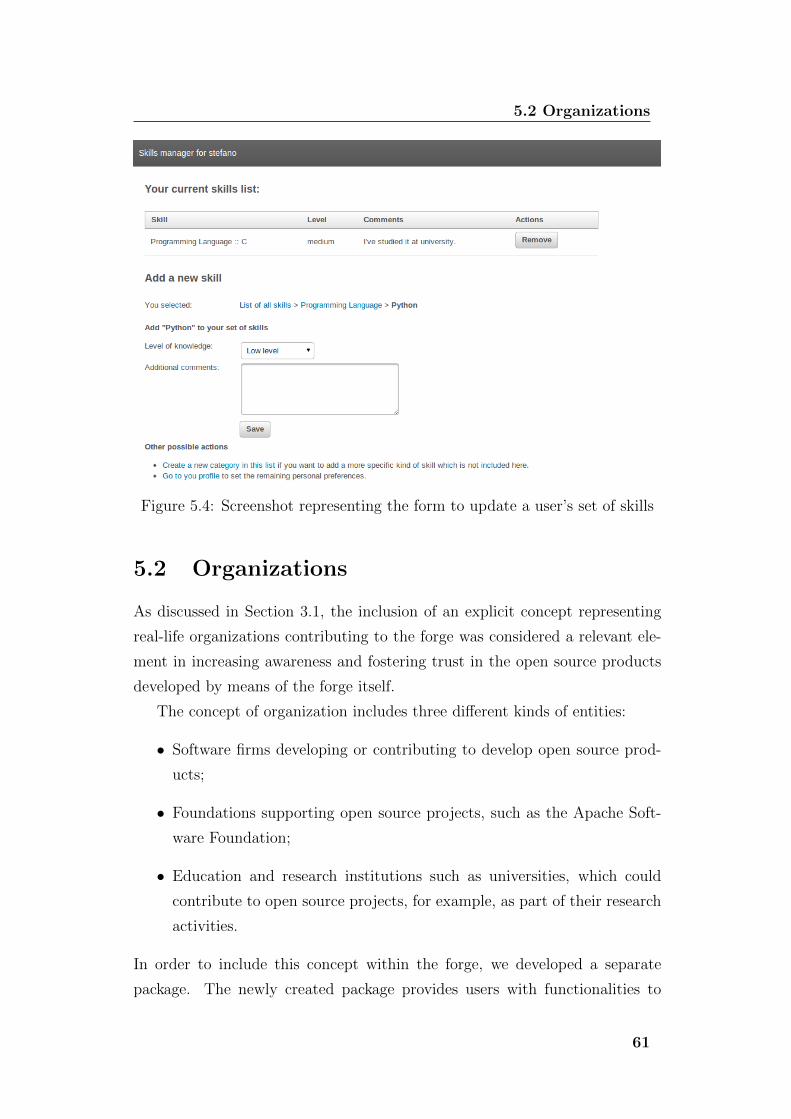
5.2 Organizations
Figure 5.4: Screenshot representing the form to update a user’s set of skills
5.2 Organizations
As discussed in Section 3.1, the inclusion of an explicit concept representing
real-life organizations contributing to the forge was considered a relevant ele-
ment in increasing awareness and fostering trust in the open source products
developed by means of the forge itself.
The concept of organization includes three different kinds of entities:
• Software firms developing or contributing to develop open source prod-
ucts;
• Foundations supporting open source projects, such as the Apache Soft-
ware Foundation;
• Education and research institutions such as universities, which could
contribute to open source projects, for example, as part of their research
activities.
In order to include this concept within the forge, we developed a separate
package. The newly created package provides users with functionalities to
61

Our Extension: Allura TITANS
create or update the profile of an organization, to explicitely link a project
to the organizations contributing to its development, and to connect each
organization to the profiles of its members registered on the forge.
Since the forge could be installed within different scopes, the rest of the
code is independent from the package. Therefore, users such as those who
intend to use the forge within a single organization are allowed to omit the
installation of the new package, so that they can continue to use the forge
without dealing with a concept they don’t need.
The package includes three separate components:
• The first one is a set of modules representing the concept of organiza-
tion. This component also implements the functionalities to create an
organization profile, and it provides users with functionalities to moni-
tor the list of their organizations and to change details related to their
memberships.
• Similarly to users, each organization is represented by a particular
project, an organization project, which is automatically created when
a user registers a new organization, and which includes tools to manage
and to present all the details related to the organization itself.The second
package is a tool which represents an organization’s public profile. The
tool includes functionalities to represent the profile of the organization,
but it also provides the administrators of the organization with a set of
functionalities to update the profile of the organization itself.
• The last component included in the package is an additional tool that is
automatically installed within a project to include the list of organiza-
tions directly contributing to the project itself. The tool also allows to
specify a different level of participation for each organization.
Since all the functionalities related to a single organization are included within
a project, the default mechanism allowing to manage groups of roles within a
project is used. This mechanism allows to create different groups with different
permission levels. Administrators are the only users with the power to edit
the profile of the organization and perform other actions, including sending
requests to collaborate to a project or to include a user within the list of
members of the organization itself.
62

5.2 Organizations
As for the rest of the software, each package’s architecture is based on
the Model-View-Controller pattern. The model of the organization’s concept
includes all the classes directly mapped to the database of the forge. As shown
in Figure 5.5, the most important class which was provided within this tool is
named Organization, and includes the attributes and methods representing
the most relevant details of each company, foundation or education institution.
In particular, for each organization, the following data is provided:
• The type of the organization, chosen among three predefined values: For-
profit business, Foundation or other non-profit organization and Research
and/or education institution.
• The dimension of the organization. By default, this value is set to Un-
known, but it can be changed to one of three predefined values: Big
organization, including more than 250 members, Medium organization,
including from 51 to 250 members, and Small organization, including at
most 50 members.
• A brief description of the organization, provided as free text.
• The link to the organization’s official website.
• A list of work-fields. This concept is represented by means of a relation-
ship with a class WorkFields, which includes a set of predefined working
areas. For each working area, a name is provided, together with a brief
description explaining its meaning.
• The localization of the organization’s headquarters.
All these details, except the organization type, are completely optional, so that
each organization can freely choose which data to include on its profile.
Figure 5.5 also shows existing relationships with users and projects within
the forge. For each class, the attributes and methods which don’t deal with
organizations are omitted, in order to focus on provided features only.
63

Our Extension: Allura TITANS
Figure 5.5: UML class diagram representing the introduced concept of orga-nization.
Each organization is linked to one or more users by means of the class
Membership. Details provided by the Membership class include:
• A free description of the user’s role. For example, typical roles within
a corporation are developer, software engineer or CEO, while some of
the most common roles within an education institution include student,
teacher and assistant.
• The status of the membership, which is used, for example, to specify
that the user is no longer active within the organization.
• The date in which the user was recognized as a member of the organiza-
tion.
• The date in which the user left the organization, if applicable.
Similarly, the relationship between an organization and its projects is imple-
mented through a class ProjectInvolvement, which is directly mapped on a
collection of the underlying database and which provides data such as:
• The organization’s involvement type. In particular, two values are al-
lowed: cooperation, meaning the organization plays a key role in the
64

5.2 Organizations
project development, or participation, in case the organization only pro-
vides some support, for example developing some portions of code, while
core decisions are taken by the remaining involved actors. This allows to
understand whether an organization has a primary or secondary role in
the development of a project hosted on the forge.
• The status of the organization’s involvement.
• The date in which the organization started to work on the project.
• The date in which the organization stopped to collaborate to the project,
if applicable.
Figure 5.6: Screenshot showing the public profile of an organization on theforge.
65
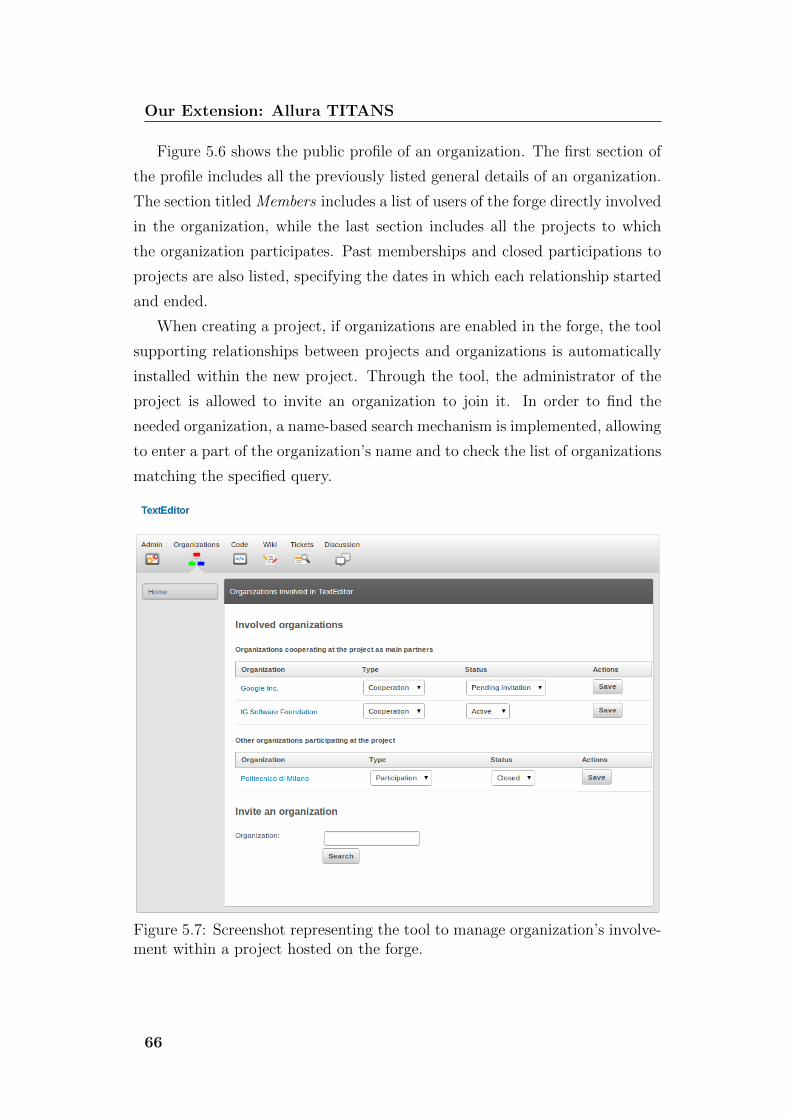
Our Extension: Allura TITANS
Figure 5.6 shows the public profile of an organization. The first section of
the profile includes all the previously listed general details of an organization.
The section titled Members includes a list of users of the forge directly involved
in the organization, while the last section includes all the projects to which
the organization participates. Past memberships and closed participations to
projects are also listed, specifying the dates in which each relationship started
and ended.
When creating a project, if organizations are enabled in the forge, the tool
supporting relationships between projects and organizations is automatically
installed within the new project. Through the tool, the administrator of the
project is allowed to invite an organization to join it. In order to find the
needed organization, a name-based search mechanism is implemented, allowing
to enter a part of the organization’s name and to check the list of organizations
matching the specified query.
Figure 5.7: Screenshot representing the tool to manage organization’s involve-ment within a project hosted on the forge.
66

5.2 Organizations
As show in Figure 5.7, the tool lists the organizations involved or previ-
ously involved in the project. The status and the type of the organization’s
involvement can be updated through this Web-page.
In order to manage his or her involvement within organizations operating
on the forge, each logged user is allowed to access a Web-page listing active
memberships. This page, represented in Figure 5.8, allows to change the user’s
role within the organization, and to change the status of the user’s member-
ships. If the user is an administrator of the organization, a link to the page to
update the organization’s profile is also included.
Figure 5.8: Screenshot representing the Web page allowing to edit a loggeduser’s enrollments.
In order to ensure reliability of the declared relationships, the membership
of a user within an organization needs to be confirmed according to a two-ways
mechanism. According to this mechanism, an organization is allowed to invite
a user to formally state his or her membership within the organization itself,
but the interested user has to confirm the stated involvement. Similarly, a user
can send a request of being listed among the members of an organization, but
67

Our Extension: Allura TITANS
Figure 5.9: State diagram outlining the state transitions related to a user’smembership in an organization.
before appearing in the public profile, the organization needs to confirm this
relationship.
The state diagram represented in Figure 5.9 summarizes how a user’s in-
volvement within an organization can evolve over time, highlighting the events
responsible for each transition between one state and another one. After the
membership has been closed, it is not possible to directly open it again: to
do so, it is necessary to open a new relationship, following the same steps
previously described.
The mechanism adopted to specify an organization’s involvement with a
project is based on a similar approach, as represented in the diagram in Figure
5.10. In this case, the request can either be sent by the organization adminis-
trator, on behalf of the organization itself, or by the project administrator.
These mechanisms are intended at preserving trust in the users and orga-
nizations working on the forge, avoiding the possibility for them to pretend of
being involved in someone else’s organizations or projects.
68

5.3 User statistics
Figure 5.10: State diagram outlining the state transitions related to an orga-nization’s involvement in a project.
5.3 User statistics
In order to allow users to have a deeper awareness of the past contributions
and experience of their fellow developers, an additional tool was introduced.
The aim of this tool is to gather statistics from activities performed by users
of the forge. This data is used to compute a set of metrics, made available to
developers through the forge itself.
These features of the forge were implemented in a separate package, which
represents a tool automatically installed within a project representing a user
of the forge. The package includes different components:
• The model representing all the relevant statistics;
• The controller component, implementing the logic to update and retrieve
a developer’s statistics;
• The set of classes to produce the Web-based interface providing com-
puted data;
• A package including some unit tests and some functional tests.
69

Our Extension: Allura TITANS
The architecture adopted to implement this tool was designed with the goal to
easily allow to plug additional tools collecting and showing statistics related
to different entities, such as projects or organizations. For example, the tool
introducing statistics related to a single organization was later designed and
implemented within the forge itself, as explained in Section 5.4.
The designed solution consists of an event-based mechanism. Events are
automatically generated each time a user performs an action which is consid-
ered to be relevant with the purpose of updating statistics. Generated events
are notified to registered listeners, which are responsible for updating statistics
related to controlled entities, according to their own logic and purposes. This
design solution allows to incrementally compute real-time statistics.
In order to register a new listener, it is necessary to develop and install a
new package. The package should introduce two new entry points:
• The first one, defined within the predefined group allura, should link to
a Python class representing the tool which provides the logic to present
statistics related to the considered entity;
• The second entry point should be defined within the group
allura.stats, and it should link to the listener class. The listener
should be defined as a child of the abstract class EventsListener,
and it should implement the logic adopted to update statistics as a
consequence of an event performed within the forge
Figure 5.11: Class diagram representing the abstract class EventsListener.
The class EventsListener was specifically defined for this purpose. As
represented by the UML class diagram in Figure 5.11, this class provides an
abstract method for each event. In particular, some of the considered events
are the registration of a new user and the login of a user. Other events are
generated when a user submits a new artifact or modifies an existing one, such
70
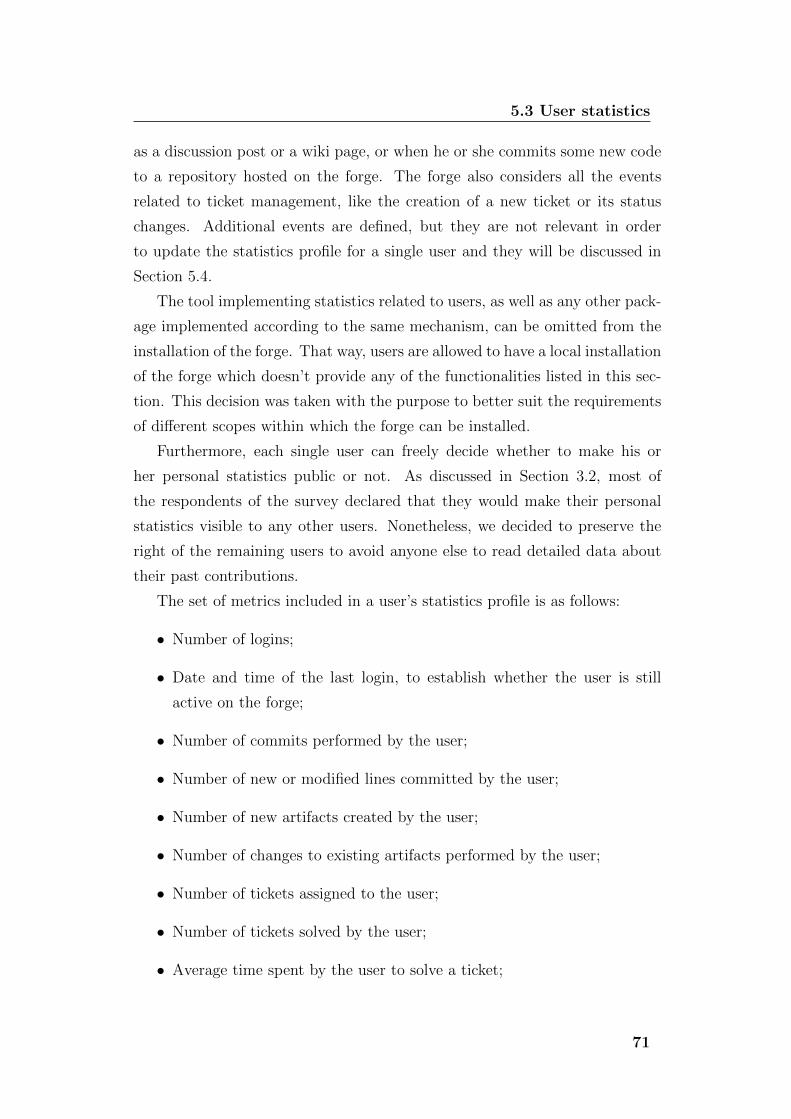
5.3 User statistics
as a discussion post or a wiki page, or when he or she commits some new code
to a repository hosted on the forge. The forge also considers all the events
related to ticket management, like the creation of a new ticket or its status
changes. Additional events are defined, but they are not relevant in order
to update the statistics profile for a single user and they will be discussed in
Section 5.4.
The tool implementing statistics related to users, as well as any other pack-
age implemented according to the same mechanism, can be omitted from the
installation of the forge. That way, users are allowed to have a local installation
of the forge which doesn’t provide any of the functionalities listed in this sec-
tion. This decision was taken with the purpose to better suit the requirements
of different scopes within which the forge can be installed.
Furthermore, each single user can freely decide whether to make his or
her personal statistics public or not. As discussed in Section 3.2, most of
the respondents of the survey declared that they would make their personal
statistics visible to any other users. Nonetheless, we decided to preserve the
right of the remaining users to avoid anyone else to read detailed data about
their past contributions.
The set of metrics included in a user’s statistics profile is as follows:
• Number of logins;
• Date and time of the last login, to establish whether the user is still
active on the forge;
• Number of commits performed by the user;
• Number of new or modified lines committed by the user;
• Number of new artifacts created by the user;
• Number of changes to existing artifacts performed by the user;
• Number of tickets assigned to the user;
• Number of tickets solved by the user;
• Average time spent by the user to solve a ticket;
71

Our Extension: Allura TITANS
Figure 5.12: Screenshot representing the tables summarizing user statisticsabout registration and contributions.
• Number of tickets revoked to the user, namely tickets that were assigned
to the user and were later assigned to someone else.
For each metric, data is computed as a total value since the user’s registration,
as well as a partial value, based on a sliding window which includes the last 30
days only. Average per-month values are also computed. Per-month metrics
allow users to easily understand the usual frequency of contribution of other
developers.
In order to establish whether a user’s commitment in the forge is increasing
or decreasing, additional indicators are included in a user’s statistics profile.
72

5.3 User statistics
Figure 5.13: Screenshot representing the Web page listing the topics of theprojects to which a user participates.
These indicators are shown as up or down arrows, representing that recent
contribution is higher or lower than its average per-month value, respectively,
or as an equal symbol, to represent a constant effort. The resulting Web-page
is represented in Figure 5.12.
The Web interface also includes a histogram which highlights the user’s
involvement in different topics. In particular, the histogram represents the
number of projects to which a user participates for each category or topic, as
shown in Figure 5.13.
With the same purpose, per-category statistics are also collected. The data
for each single category is obtained by considering all the user’s contributions
to projects which have been tagged as belonging to that category. This is
mainly useful to understand whether a user is strongly experienced within
certain kinds of software applications or not. By clicking on the name of each
category in the table listed in Figure 5.13, statistics filtered by category are
shown in a new Web-page, similar to the one represented in Figure 5.14.
73

Our Extension: Allura TITANS
Figure 5.14: Screenshot representing the Web page listing statistics about thecontributions submitted by a user in a single category of projects.
Finally, by clicking on the links included within the tables shown in Figure
5.12 and in Figure 5.14, users receive additional details about each single met-
ric. In particular, instead of presenting data for a single category, the resulting
Web-pages compare contributions in each different category, for a single area
only. Three different areas or sections are considered: the table in Figure 5.15
refers to code commits, the table in Figure 5.16 lists the number of artifacts
created and edited for each category, and the table in Figure 5.17 is related to
ticket management.
74

5.3 User statistics
Figure 5.15: Screenshot representing the table which includes data about auser’s commits for each category of projects.
Figure 5.16: Screenshot representing the table which includes data about auser’s artifacts for each category of projects.
Figure 5.17: Screenshot representing the table which includes data about auser’s tickets for each category of projects.
75

Our Extension: Allura TITANS
These screenshots also make it clear that, since each project can be related
to more than a single topic, a single action performed by a user can result in
increased values for indicators related to two or more categories. For example,
it is possible that the sum of the number of commits performed by a user for
each single category is higher than the total number of commits performed by
the same developer.
The last feature of the tool allows to compare contributions of a single user
with contributions submitted by remaining users of the forge. An indicator
representing the average per-month contributions of each user is compared
with the same data computed for all the other users of the forge. More in
details, three different indicators are considered:
1. An indicator representing code contribution, based on the number of
committed lines;
2. An indicator representing discussion contribution, based on the number
of created or edited artifacts;
3. An indicator representing issues solved by the developer, based on the
ratio between the number of issues solved by the user and the number
of assigned issues.
Figure 5.18: Screenshot representing the rankings of a user’s contributionwithin the forge.
As shown in Figure 5.18, the resulting values, expressed by percentages,
are included in the statistics profile of each user. A value of 100% for the
commit indicator means that the developer is the user who submitted the most
average per-month lines of code; a value of 100% for the artifacts indicator is
associated to the user who has the highest participation to discussions on the
76
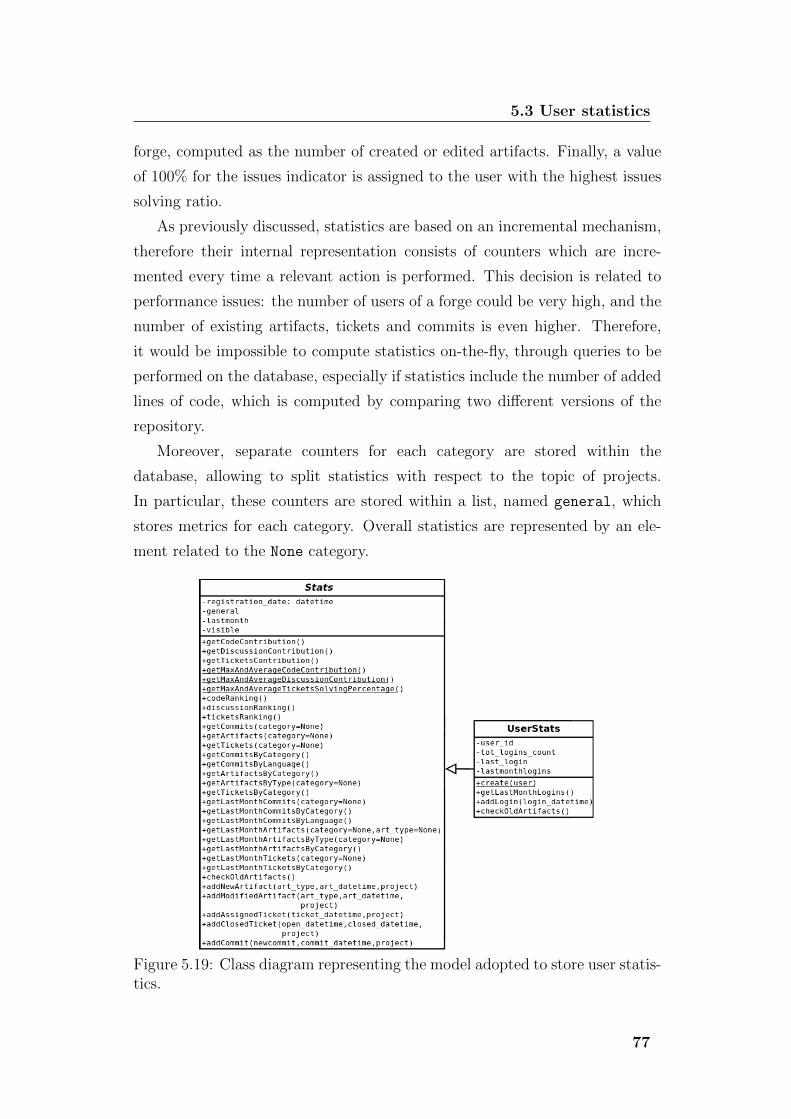
5.3 User statistics
forge, computed as the number of created or edited artifacts. Finally, a value
of 100% for the issues indicator is assigned to the user with the highest issues
solving ratio.
As previously discussed, statistics are based on an incremental mechanism,
therefore their internal representation consists of counters which are incre-
mented every time a relevant action is performed. This decision is related to
performance issues: the number of users of a forge could be very high, and the
number of existing artifacts, tickets and commits is even higher. Therefore,
it would be impossible to compute statistics on-the-fly, through queries to be
performed on the database, especially if statistics include the number of added
lines of code, which is computed by comparing two different versions of the
repository.
Moreover, separate counters for each category are stored within the
database, allowing to split statistics with respect to the topic of projects.
In particular, these counters are stored within a list, named general, which
stores metrics for each category. Overall statistics are represented by an ele-
ment related to the None category.
Figure 5.19: Class diagram representing the model adopted to store user statis-tics.
77

Our Extension: Allura TITANS
However, simple counters would not allow to implement statistics based
on a sliding window which includes the last 30 days only. As a consequence,
the list of events registered during the last 30 days is also stored, under the
name lastmonth. Every time this list is updated or retrieved, those events
which were registered more than 30 days ago are removed from the list itself,
ensuring correctness and avoiding the list to include too many events, since
this would once again worsen performances.
Figure 5.19 represents the structure of the model including gathered statis-
tics for a user of the forge.
More in details, the attribute general contains a list of dictionaries, each
of which represents data for a single category, represented through:
• A reference to the category to which data refers, set to None in case data
refers to general contributions of the user;
• An element messages, which is a list of dictionaries, each of which refers
to a particular type of artifacts. In particular, each dictionary includes:
– A string representing the type of artifacts to which data refers, such
as wiki pages, blog posts, discussion posts, and so on;
– A counter of created artifacts of the selected type;
– A counter of modified artifacts of the selected type;
• An element tickets, which is a dictionary, including:
– A counter of assigned tickets;
– A counter of revoked tickets;
– A counter of solved tickets;
– The total solving time, namely the sum of the amount of seconds
needed to close a ticket, obtained by considering all those tickets
which were assigned to the selected user.
• An element commits, which is a list of dictionaries, each of which repre-
sents data for a single programming language, represented through:
– A reference to the selected programming language, set to None in
case the dictionary refers to general statistics;
78

5.3 User statistics
– A counter of the number of commits;
– A counter of the number of committed lines, namely lines which
were created or modified by the user.
Finally, the attribute lastmonth consists of a dictionary which includes:
• An element messages, namely a list of events related to artifacts created
or modified during the last 30 days. Each artifact is represented by a
dictionary which includes:
– The date and time in which the event was registered;
– A boolean value specifying whether the event represents the creation
of a new artifact or was generated after an existing artifact was
modified;
– A string representing the type of the artifact;
– A list of the categories belonging to the project in which the artifact
was posted.
• An element assignedtickets and an element revokedtickets, namely
a list of events registered during the last 30 days and related to assigned
and revoked tickets, respectively. In both cases, each event is represented
by a dictionary which includes:
– The date and time in which the event was registered;
– A list of the categories belonging to the project in which the ticket
was posted.
• An element solvedtickets, which is the list of events registered during
the last 30 days notifying that a ticket was solved by the user to which
statistics refer. Each event is represented by a dictionary. Similarly
to dictionaries representing assigned and revoked tickets, it includes the
date and time of the event and the list of linked categories. However,
solved tickets also include an additional element, which represents the
solving time stored as the number of seconds between the creation of the
ticket and the moment in which the ticket itself was closed.
79

Our Extension: Allura TITANS
• An element commits, consisting of a list of dictionaries representing com-
mit events registered during the last 30 days and performed by the user
to which statistics refer. Each event is represented through:
– The date and time in which the commit was performed;
– A list of the categories belonging to the project in which the code
was committed.
– The number of committed lines;
– The list of involved programming languages.
Despite considering different programming languages while designing the
model to store statistics, at the moment, the number of commits and the
number of lines of code is not computed on a per-language basis. In fact,
many projects are tagged with two or more programming languages, and it is
impossible to automatically establish, for each single line of code, the program-
ming language in which it was written. Splitting statistics by programming
language could be easily implemented as an additional feature simply by pro-
viding a way to tag each single line of code with its programming language,
since the model already provides support for it.
5.4 Organization statistics
The last tool which was designed and developed to increase awareness and trust
within the forge, named ForgeOrganizationStats, has the goal to collect and
display statistics about contributions submitted by an organization to projects
hosted on the forge. This tool is therefore very similar to the one which gathers
statistics about contributions of single users, ForgeUserStats. In particular, the
ForgeOrganizationStats tool is based on the mechanism described in Section
5.3 to implement new statistics-related features. In this case, the created tool
is automatically installed within the project of a single organization.
Collected statistics for organizations are very similar to per-user statistics.
Data collected for each organization include:
• The date in which the organization was registered on the forge;
• The total number of committed lines of code;
80

5.4 Organization statistics
• The total number of code commits;
• The total number of created artifacts, including the number of artifacts
for each existing type, such as wiki pages, discussion posts, tickets and
blog posts;
• The total number of modified artifacts. As for created artifacts, this
data is also computed for each single existing type of artifacts;
• The total number of assigned tickets;
• The total number of revoked tickets;
• The total number of solved tickets;
• The average time needed to solve a ticket.
As explained in Section 5.3, all these metrics were also calculated on a per-user
basis. However, values for organizations are not simply computed as the sum
of the contributions of all the members of the organization itself. Since users
of the forge can be members of more than a single organization, and they are
also allowed to contribute to projects as single individuals in their spare time,
each action performed by a user is considered to be performed as a member
of the organization only in case the organization is explicitly involved in the
project in which the event was registered.
As for users contributions, all these metrics are not only computed as a total
value since the day in which the organization joined the forge, but also as a
per-month value, and as the value obtained by considering actions performed
during the last 30 days only. An example of the table including this data is
represented in Figure 5.20.
Moreover, organization statistics include data about per-member contribu-
tions during the last 30 days. In particular, as shown in Figure 5.21, some of
the previously listed values, obtained by considering the last 30 days only, are
computed as the average number of contributions submitted by each member
of the organization. This allows to establish individual effort, regardless of the
number of members working for the considered organization. Values are not
computed by considering contributions too far in time, since they could be
unreliable as a consequence of relevant variations in the number of employees.
81
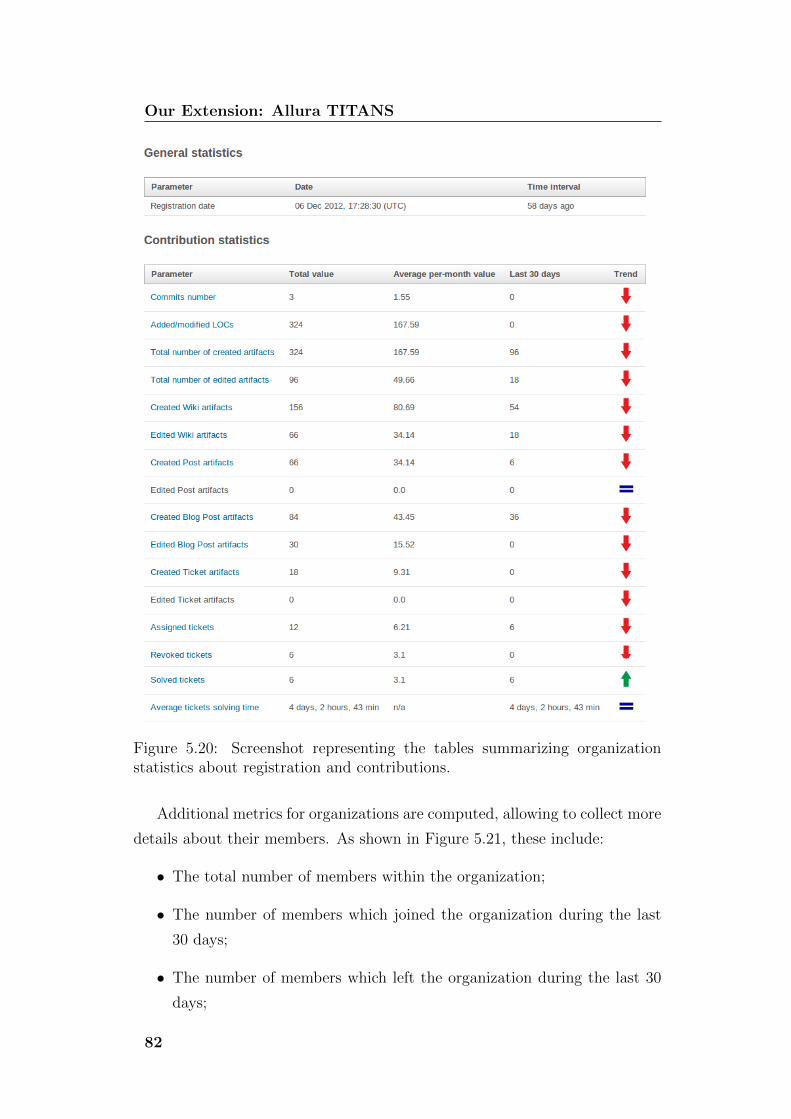
Our Extension: Allura TITANS
Figure 5.20: Screenshot representing the tables summarizing organizationstatistics about registration and contributions.
Additional metrics for organizations are computed, allowing to collect more
details about their members. As shown in Figure 5.21, these include:
• The total number of members within the organization;
• The number of members which joined the organization during the last
30 days;
• The number of members which left the organization during the last 30
days;
82

5.4 Organization statistics
Figure 5.21: Screenshot representing the tables summarizing membership dataand per-member contributions within an organization.
Similarly to profiles including statistics about single users, categories are
also considered. As shown in Figure 5.22, the number of projects for each
category is presented both within a table and as a histogram, allowing to un-
derstand at first sight which topics the organization is focused on. By clicking
on the name of a category, the Web-page including contributions submitted
by the organization in that category is presented. Since organizations can
contribute to a project both as cooperators and as supporting participants,
the number of projects is also split according to the type of involvement. This
data is included within a table, also showing the number of projects joined or
left during the last 30 days.
Metrics are also computed by considering a single topic to which the organi-
zation contributes on the forge. By clicking on the links included in the table
represented in Figure 5.20, Web-pages listing contributions in a single area
are shown, splitting data for each individual category. The considered areas
are code commits, issues solving and discussions participation. This allows to
compare the organization’s efforts in each single topic. Moreover, by clicking
on the links in Figure 5.22, a Web-page listing all statistics collected in a single
category is presented to the final user.
83

Our Extension: Allura TITANS
Figure 5.22: Screenshot representing data about projects involvement for asingle organization, as well as the organization’s topics of interest.
Figure 5.23: Screenshot representing indicators comparing the contributionsof an organization with contributions of the other ones registered on the forge.
84

5.5 Development and Discussion Process in the Allura community
Finally, a comparison between per-month contributions of each single or-
ganization is included. The adopted logic is the same described in Section 5.3
for users, and the presented output is shown in Figure 5.23.
The package ForgeOrganizationStats includes:
• The model storing per-organization statistics;
• The listener which updates data when relevant events are notified to it;
• The controller implementing the logic to present statistics to users;
• The templates representing the Web-based interface allowing users to
navigate through the statistics of organizations registered within the
forge;
• A set of unit tests and functional tests.
The structure of the model is very similar to the structure of the model adopted
to store statistics for a single user. In particular, the UML class diagram is
presented in Figure 5.24. The diagram does not include details about the class
Stats, which was discussed in Section 5.3.
Figure 5.24: UML class diagram representing the class adopted to store statis-tics about a single organization.
Finally, the tool allows to the administrators of the project representing
an organization to change the visibility of statistics related to the organization
itself. Therefore, as discussed for single users, each organization can decide to
hide its own statistics so that they are available to the organization’s admin-
istrators only.
5.5 Development and Discussion Process in
the Allura community
All the previously listed extensions have been implemented and discussed ac-
cordingly to the Allura community development process. First of all, we pro-
85

Our Extension: Allura TITANS
posed some members of GeekNet, the company owning SourceForge, to collab-
orate with the community to implement tools related to awareness. Given the
interest of these members, we subscribed to the development mailing list of
Allura and we registered to SourceForge.net, which currently hosts the project.
In our first message on the mailing list, we introduced ourselves to the com-
munity developing Allura and we briefly described our goals and our intended
contributions to the project. The community shown interest in our proposals
and proposed some changes to our requirements. The most relevant change in
the proposed features consisted of leaving out of scope the introduction of met-
rics and indicators related to a single project, already under development by a
different group of developers, which is following a slightly different approach.
We subsequently organized our work splitting it into four different parts, as
described in the Section 5.1, in Section 5.2, in Section 5.3 and in Section 5.4.
Starting from the extension related to personal profiles, we proposed our tools
one by one to the community. Each component, before being uploaded to be
evaluated by the community, was introduced by a more detailed description
provided through a discussion on the mailing list.
The first part of our work was submitted by creating a new fork of the main
repository, and working on it. A discussion with the community followed, and
the code was significantly modified in order to comply with the standards
adopted within Allura. After being reviewed, the code was accepted, and it
became available in the main repository of the forge.
Following the positive evaluation of our code, one of us was granted commit
access to the Allura repository, allowing us to directly work on a branch created
on the repository itself.
Starting from the second component of the project, which included statis-
tics about users, we submitted our contributions to the newly created branches.
Discussions with the community continued to take place on the mailing list as
well as on the discussions threads related to the issues which were raised to
propose the introduction of our tools.
During the development of the described tools, we were also allowed to
experience with the policies adopted to manage contributions and to provide
support to new contributors. Despite some barriers encountered during the
first steps of our contributions, such as the poor documentation related to the
code and the lack of initial knowledge of the adopted programming language,
86

5.5 Development and Discussion Process in the Allura community
Python, we were able to autonomously perform the analysis of the code, and we
later received a strong support from the community about how to contribute
to the software.
Encountered barriers could also be considered as a useful way to prevent
contributions by those users who don’t have the necessary skills and motiva-
tions to ensure a profitable collaboration.
The changes we proposed through the developers mailing list were also
received with attention from the community. Committers were ready to ex-
press their feedbacks about our proposals, recommending possible changes and
suggesting the adoption of already existing tools and architectural choices.
Moreover, the community provided effective support in helping us to under-
stand its policies and the coding conventions adopted to ensure readability and
consistency of the new code with the already existing one.
For each newly created set of features, provided code, as well as the tests
related to the code itself, was reviewed by a single committer, in order to
reduce individual effort. This activity consisted of some iterations, during
which the reviewer provided feedbacks about the code, and we were asked
to discuss about new proposals and to apply changes to our code. After a
change, the waiting time for new feedbacks usually consists of some days but,
due, to concurrent activities performed by community members, it can last
longer. Therefore, each one of our tools required approximately three months
to be accepted. The code-review activity proved to be very useful with the
purpose to detect possible issues not encountered by developers and to improve
provided functionalities, since it makes it possible to exchange ideas with expe-
rienced contributors. Architectural and implementative choices also received
attention and the community strove to suggest those solutions best fitting the
previously existing portions of code.
87


Chapter 6
Evaluation
This chapter includes an evaluation of the proposed tools, aimed at identifying
the results achieved through the discussed work. To evaluate the additional
features designed and implemented within Allura, two different approaches
have been adopted.
First of all, the software was evaluated by the Allura community, which
considered its potential impact on the forge and the quality of provided code.
This evaluation is presented in Section 6.1.
A further evaluation was obtained by considering the relevance of data
collected by the newly introduced tools with respect to a current study on
discovering latent social structures within organizations. This part of the eval-
uation process is presented in Section 6.2.
6.1 Evaluation by the community
The first evaluation of the developed work was conducted by the Allura com-
munity itself, which analyzed the proposals and inspected the submitted code,
evaluating its quality.
Therefore, by accepting the proposed code, the reviewers, on behalf of the
whole community, considered our contributions as good-quality pieces of code.
This also emerged during the discussion preceding the acceptance of the tools
themselves.
In particular, during the discussion following the development of the tool
extending user’s personal data, the reviewer initially praised the idea of the
tool, considering it as “very promising” and claiming to be “very pleasantly

Evaluation
surprised, actually, how far you’ve come without needing to ask for help or
pointers”, but also suggested improvements due to a lack of initial adherence
to some standards adopted by the community to develop the software. Most
notably, we were required to adopt EasyWidgets for HTML markup and in-
put validation, and to use JQuery instead of plain JavaScript. We were also
required to write additional tests for our software, and to improve the Python
syntax by removing some blank spaces preceding symbols like “:”, or by avoid-
ing to write the single-instruction body of conditional statements on the same
line of the condition itself
After committing the required fixes, subsequent work was considered “ex-
cellent” and “very nice” by the reviewer. These improvements required four
iterations, and the code was then merged into the main repository in early
December 2012.1 This also led the first of us to be granted committer rights
on the Allura repository.
Shortly after the acceptance of the first tool, on 12 December 2012, we
submitted the code related to statistics of single users. In particular, the code
was submitted within a branch of the original repository. The review process
started in late January 2013, but it was delayed due to concurrent reviews
involving the same developers. The process consisted of six iterations, during
which some improvements were proposed by the community. Most notably,
the implemented functionalities, initially developed as a separate feature, were
included as an additional tool within the project related to a single user, as
discussed in Section 5.3.
These changes also led to the introduction of other modifications. The first
version of the code included an option to disable user statistics by changing
a parameter in the configuration file, which became useless when the features
were included in a separate tool, and was therefore removed. Moreover, the dis-
cussion involved several developers in order to identify a way to automatically
install the newly created tool on the projects related to previously existing
users. The discussion led to the decision to set it as an anchored tool, a tool
which is automatically installed when a user accesses a project which doesn’t
include it yet. During the review process, some errors in provided tests, related
to missing updates following the developed modifications, were also identified
1http://sourceforge.net/p/allura/git/merge-requests/7/
90

6.2 Using collected metrics to uncover social structures
and fixed. Another required change was related to the registration date, which
was initially considered to be equal to the date of creation of the object in-
cluding user statistics, and later became exactly equal to the user’s registration
date on the forge.
Finally, the code related to organizations was submitted in February 2013
and is currently under discussion by the community, as well as the code allow-
ing to gather statistics related to single organizations.
A positive evaluation of the software emerges from its real exploitation.
In fact, those proposed tools which have been accepted by the community
are now installed on SourceForge.net, making them available to a worldwide
audience, by means of one of the most popular software forges in the world,
hosting more than 300,000 projects with cumulative daily downloads exceeding
4,000,000 units. By using our software, GeekNet Media, the Dice Holdings Inc.
company owning SourceForge.net, certified the industrial value of the devel-
oped software, using it for its commercial purposes. As discussed in Section 4.1,
contributions like the ones provided in this thesis represent the main reason
why a company releases the code adopted for its commercial purposes: our
tools allowed Allura to evolve by including innovative contributions developed
by external contributors, without any additional cost for the company itself.
6.2 Using collected metrics to uncover social
structures
In order to evaluate the relevance of the data collected through the developed
tools, we also tried to assess the impact of our work on a study conducted at
the VU University in Amsterdam by Damian A. Tamburri, Patricia Lago and
Hans van Vliet, and aimed at uncovering latent social structures in software
development [42]. The social structure of a community is often unknown,
and it repeatedly changes over time. Moreover, each different kind of social
structure is related to a different set of barriers, affecting the development of
the project and potentially compromising its success. Therefore, being aware
of a community’s social structure allows to identify potential problems and
critical situations which can affect its results.
91

Evaluation
In other words, data which effectively supports the identification of a com-
munity’s social structure can have a strong impact on awareness within the
community. As a result, we evaluated the impact of our tools by considering
whether collected data is useful or not with respect to the identification of
communities social structures.
6.2.1 Introduction to the study on social structures
Tamburri, Lago and van Vliet introduced a classification of different social
communities. In particular, different kinds of social structures were identified
by studying articles available in literature, and a detailed description for each
of them has been provided. As a result of the study, each class of social
structures was related to a key attribute, which allows to uniquely distinguish it
from the remaining ones. Moreover, they defined a set of additional attributes
characterizing every social community, defining its additional features.
Starting from these results, they provided a classification tree, allowing to
identify a social community based on a set of questions to be answered by
members of the community itself. Figure 6.1 shows the described decision
tree, outlining the set of proposed questions and listing the considered kinds
of organizations.
Figure 6.1: Decision tree adopted to classify a social community.
92

6.2 Using collected metrics to uncover social structures
6.2.2 Classification of social structures based on our
data
In order to evaluate the collected metrics, we chose a subset of four of the listed
kinds of social communities: Formal Networks, Informal Networks, Informal
Communities and Networks of Practice. The remaining ones were considered
not relevant in the scope of open source software, because they are mainly
related to co-located teams, groups of people developing proprietary software,
or communities pursuing different goals.
After analyzing the selected classes of social communities, we proposed a
set of metrics to evaluate their key-attributes. These metrics could therefore
be useful in allowing to automatically classify an organization, identifying the
kind of social community to which it belongs, and helping the organization
itself to detect changes in its social community, as well as to identify barriers
affecting its performances. We also considered a set of additional attributes
for each social structure. Attributes were based on the classification provided
by Tamburri [41].
The definition of these metrics was based on the Goal Question Metric
(GQM) approach, which prescribes the adoption of a top-down process. The
first step is represented by the conceptual level, consisting of the definition of
the goals specifying the reason why the measurement is performed, the adopted
point of view, and the quantity to be measured. The operational level leads
to the definition of a set of questions allowing to characterize what we need to
measure, keeping in mind the goal of the measurement itself. Finally, a set of
metrics is defined, by identifying those quantitative variables which allow to
answer the previously defined questions [32]. The metrics obtained with this
methodology will be discussed in the remainder of this chapter.
Proposed metrics are based both on data previously available on the Allura
forge and on data collected through our additional tools. In particular, the
newly introduced tools, which were described in Chapter 5, provide details
about users and organizations, and gather statistics about their previous work
and experience.
We also defined a set of thresholds allowing to answer the given questions,
starting from collected measures. In order to identify hese threshold, we com-
pared the statistics related to 5 different projects hosted on SourceForge.net.
93

Evaluation
In particular, the projects we considered for this purpose were Allura and
four additional projects which were listed by SourceForge within the section
“Projects of the Month”, created within the website in order to increase visi-
bility of good quality software developed by means of the forge.
6.2.3 Formal Networks
Formal Networks (FNs) are organizations characterized by the presence of
formality as a key-attribute, meaning that interaction dynamics and status of
the members are predefined in a formal manner.
Therefore, as summarized in Table 6.1, two main attributes allow us to
identify formal networks: formality and membership status. The table also
includes citations from the considered study to highlight the underlying rea-
son why each single attribute was identified. The symbol * denotes the key-
attribute for the considered class of social community.
Attribute Rationale cited from [41]
Formality* In Formal networks memberships and interaction dynamics are explicitly
“made” formal by corporate sponsors. Each site needs to be governed
with clear role definitions and responsibilities.
Membership status Members are rigorously selected and prescribed.
Table 6.1: Attributes identifying Formal Networks (FNs).
To evaluate formality within a group, we proposed a set of different metrics,
including the governance level, which is an indicator of whether the develop-
ment process is mainly driven by the organization or not, and the hierarchiza-
tion degree, showing how members differ from each other with respect to their
roles.
A formal network will thus be characterized by a high governance level.
In order to infer the governance level, we decided to calculate the number
of milestones assigned to the project and to relate it to the lifetime of the
project itself. In fact, each milestone represents a different phase of the de-
velopment process. Therefore, if several milestones are defined, it means that
there is a strong planning activity driving the evolution of the project itself,
thus highlighting that specific governance mechanisms are applyed.
Formality also implies a high hierarchization degree. By computing the
number of actually used groups of users, each of which is related to a differ-
94

6.2 Using collected metrics to uncover social structures
Goal
Purpose Measure
Issue The formality of
Object The organization
Viewpoint From the external observer point of view
Question Q1 Is there a high hierarchization degree?
MetricsM1 Number of non-empty groups of members’ permissions
M2 Average Max % of members of the same organization within a level
of permission
Question Q2 Is there a high governance level?
Metrics M3 Number Milestone / ProjectLifeTime
Table 6.2: GQM, formality of organization.
ent set of permissions, we can estimate the hierarchization degree. In fact,
a high number of groups suggests that there is a hierarchical structure, in
which administrators represent the top-level users, but several other roles are
included at different levels of the hierarchy. Another metric related to the
hierarchization degree is the concentration of members belonging to the same
organization within a single group of permissions. If all the members of the
same organization are concentrated within a unique level, the hierarchy is
considered to be well defined. The metrics related to formality are listed in
Table 6.2.
According to our experience, the hierarchy degree can be considered to
be high when the number of permission groups exceeds 2, or an average of
80% of the users of the same organization are concentrated within a single
group. Appendix B includes a list of the values of the metrics we gathered and
computed to determine the level of governance in the considered projects.
Among considered projects, ProjectLibre has a significantly higher formal-
ity level with respect to the reamining ones. In particular, ProjectLibre, which
is quite recent, has 0.03 milestones per day, meaning that, on average, a new
milestone is created every 33 days. Based on collected results, we can state
that an organization has a high level of governance if, on average, at least 0.02
new milestones are created every day.
Another attribute of Formal Networks is represented by the rigor adopted
to select the members of the community. This attribute will be referred to as
Membership importance. The results of the GQM approach applied to this
attribute are summarized in Table 6.3.
95

Evaluation
Goal
Purpose Measure
Issue The Membership importance within
Object The organization
Viewpoint From the external observer point of view
Question Q1 Are non-members allowed to access the project?
Metrics M1 Private project
Table 6.3: GQM, membership importance within organization.
In order to understand the importance of membership, it is necessary to
verify wheter non-members are allowed to access the project and actively par-
ticipate in its evolution. In case the project is private, it means that a selection
process is adopted to filter contributing members. Therefore, the metric Mem-
bership importance, has a value of “yes” or “no”.
Obviously, all the projects we analysed are public, since we would otherwise
not have been able to collect data about them. Nevertheless, we can intuitively
claim that membership is important for all those projects which have the metric
“Private project” equal to “yes”.
6.2.4 Informal Networks
As represented in Table 6.4, the key-attribute for informal networks is repre-
sented by informality in communication between the involved members. Infor-
mality is expressed by the presence of social and informal interactions between
developers. In other words, informal networks are looser networks of individu-
als, that come in contact as a consequence of the common interest in the same
project. Therefore, it is fundamental for the success of the community to build
a cohesion out of initially weak relationships.
Attribute Rationale cited from [41]
Informality* The key differentiating attribute for INs is the type of interaction that
binds its members. Interaction [...] is intended as a social and informal
interaction between individuals. INs can be seen as looser networks of
ties between individuals that happen to come in contact in the same
context. Its success is solely based on the emergent cohesion its
members have.
Opennes Anyone can join an IN, since there are no formal subscription processes.
Non-governance Finally, an IN differs from other types since it does not use governance
practices.
Table 6.4: Attributes identifying Informal Networks (INs).
96

6.2 Using collected metrics to uncover social structures
Goal
Purpose Measure
Issue The informality of
Object The organization
Viewpoint From the external observer point of view
Question Q1 Are there loose ties among members?
MetricsM1 Average number of projects in which two members have previously
collaborated
M2 Maximum % of members of the same organization
Table 6.5: GQM, informality of organization.
Informality is the result of loose ties among members. In order to establish
whether there is a relationship between two members, namely a continuative
collaboration involving them, we believe it is possible to consider the number
of projects they both contributed to as core developers. In fact, frequent
interactions between two developers usually results from a formal relationship
between them. Therefore, a community is informal when its members don’t
have a significant number of previous collaborations. Moreover, ties-strength
is related to the involvement of community members within an organization:
if the community members don’t belong to the same organization, ties among
them are looser than ties among communities in which all the developers belong
to the same organization. Table 6.5 highlights the GQM process adopted to
define the metrics related to informality.
In particular, we believe that ties within a community can be considered
loose when the average number of projects to which a couple of members
of the community itself have collaborated together does not exceed 1, and
the maximum percentage of community members of the same organization
represents no more than 5% of the involved developers.
Another attribute of informal networks is openness. As explained in Table
6.6, the metric allowing to understand the degree of openness of a community
is represented by the level of permissions granted to non-members. If external
developers are allowed to directly change the code of the project, for example,
it means that the community is very open; on the other hand, communities
which deny external users the pemission to post messages are very closed.
The openness degree of the community is therefore represented by the
permission level granted to external users (“Read”, “Create”, “Update” or
“Admin”). Obviously, the openness degree is high if the permission is differ-
ent from “Read”. According to our experience, there aren’t projects granting
97
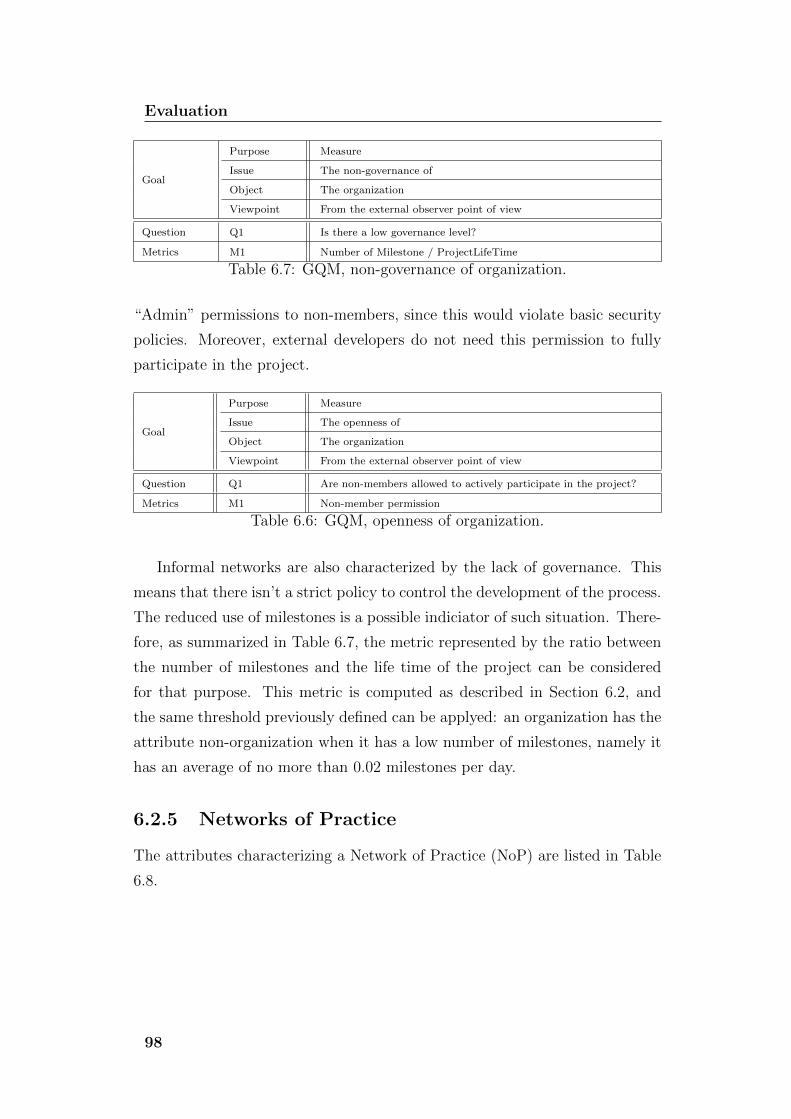
Evaluation
Goal
Purpose Measure
Issue The non-governance of
Object The organization
Viewpoint From the external observer point of view
Question Q1 Is there a low governance level?
Metrics M1 Number of Milestone / ProjectLifeTime
Table 6.7: GQM, non-governance of organization.
“Admin” permissions to non-members, since this would violate basic security
policies. Moreover, external developers do not need this permission to fully
participate in the project.
Goal
Purpose Measure
Issue The openness of
Object The organization
Viewpoint From the external observer point of view
Question Q1 Are non-members allowed to actively participate in the project?
Metrics M1 Non-member permission
Table 6.6: GQM, openness of organization.
Informal networks are also characterized by the lack of governance. This
means that there isn’t a strict policy to control the development of the process.
The reduced use of milestones is a possible indiciator of such situation. There-
fore, as summarized in Table 6.7, the metric represented by the ratio between
the number of milestones and the life time of the project can be considered
for that purpose. This metric is computed as described in Section 6.2, and
the same threshold previously defined can be applyed: an organization has the
attribute non-organization when it has a low number of milestones, namely it
has an average of no more than 0.02 milestones per day.
6.2.5 Networks of Practice
The attributes characterizing a Network of Practice (NoP) are listed in Table
6.8.
98

6.2 Using collected metrics to uncover social structures
Attribute Rationale cited from [41]
Dispersion* [...] “geodispersion” is a differentiator to identify a NoP. NoPs have a
high geodispersion, i.e. they can span geographical and time distances
alike.
Self-organization CoPs and NoPs share the characteristics of being emergent and
self-organizing.
Openness In principle anyone can join it without selection of candidates.
Self-similarity NoP comprises [...] participants engaged in a shared practice or common
topic of interest.
Size NoP comprises a larger [...] group of participants.
Table 6.8: Attributes identifying Networks of Practice (NoPs).
The key-attribute for a NoP is dispersion among developers. Dispersion
within a team could be evaluated by considering geo-cultural distance as a
metric. Geo-cultural distance is based on the geographical distance between
developers, as well as on cultural differences among members of the community.
The implemented tools allow each user to state his or her country and city
of residence, as well as the time zone in which the user is located. This data
allows us to estimate the distance separating members co-working in a team.
The average physical distance within a community is obtained by considering
the geographic distance between the coordinates of the city of reference of the
time zone of developers. These coordinates are defined by the IANA, which was
adopted by our tool as the standard set of time zones among which developers
are allowed to choose.
Obviously, a large physical distance between members means that there is a
high dispersion among them. In some cases, a limited physical distance among
the members of a community is counterbalanced by very relevant cultural
differences, which could have an equally important impact on the results of
the community’s efforts.
In order to estimate the cultural distance, we decided to consider the indices
defined by Hofstede in a study on cultural dimensions conducted for IBM from
1967 to 1973 [22]. These indices, which are defined for each single country, are
as follows:
• Power Distance Index (PDI), representing the propensity of members
with less power to accept an unequal power distribution;
99

Evaluation
• Individualism Index (II), which measures the members’ propensity to
focus on a small group of people or to work with the whole community;
• Masculinity Index (MI), a value indicating the propensity of members to
maintain gender discrimination;
• Uncertainty Avoidance Index (UAI), measuring the propensity of mem-
bers to accept uncertainty;
• Long-Term Orientation Index (LTOI), which represents the propensity
of members to exhibit future-oriented behaviors.
Therefore, for each couple of community members, it is possible to estimate
their cultural distance by computing the weighted average of the deviation
between the values of the given indices for their countries.
As an example, we considered the Allura community, computing the com-
munity’s physical and cultural dispersion. There is a quite high dispersion
within the community, with an average distance between committers of 4926
Km and a standard deviation of about 3199.5 Km. Generally speaking, we be-
lieve that an organization is highly dispersed when it has an average distance
among its members exceeding 4000 Km.
Similar considerations result from the analysis of cultural distance. By
computing it for Allura committers, we obtained a value of approximately
15.4%, with a standard deviation of 13%. Since the maximum cultural distance
among two members is equal to 40%, we can consider 15% as a threshold
above which a community is dispersed. Therefore, according to our analysis,
the Allura community has a quite high cultural dispersion.
Other attributes characterizing a NoP are self-organization, meaning that
collaborating members freely decide how to organize themselves and their
work, and self-similarity, resulting in communities whose members share com-
mon skills and interests. We identified a low degree of hierarchization and
a low level of governance control as conditions showing the presence of self-
organization, while self-similarity can be evaluated by considering the sim-
ilarity between the topics of interest and the stated skills of collaborating
developers. The metrics, together with the outcome obtained by applying the
GQM approach, are listed in Table 6.11 and Table 6.10, respectively.
100

6.2 Using collected metrics to uncover social structures
Goal
Purpose Measure
Issue The dispersion of
Object The organization
Viewpoint From the external observer point of view
Question Q1 What is the physical distance among the organization’s members?
MetricsM1 Average timezone distance between two members
M2 Standard deviation of the timezone distance between two members
Question Q2 What is the cultural distance among the organization’s members?
MetricsM3 Average cultural distance between two members
M4 Standard deviation of the cultural distance between two members
Table 6.9: GQM, dispersion of organization.
Goal
Purpose Measure
Issue The self-similarity of
Object The organization
Viewpoint From the external observer point of view
Question Q1 Is there a common background among members?
Metrics M1 Max % of members that share a particular skill
Question Q2 Is there a common experience among members?
Metrics M2 Max % of members that participated to projects belonging to a
particular topic
Table 6.10: GQM, self-similarity of organization.
101

Evaluation
Goal
Purpose Measure
Issue The self-organization of
Object The organization
Viewpoint From the external observer point of view
Question Q1 Is there a low hierarchization degree?
MetricsM1 Number of non-empty groups of member’s permissions
M2 Average Max % of member of the same organization within a level of
permission
Question Q2 Is there a low governance level?
Metrics M3 Number of Milestones / ProjectLifeTime
Table 6.11: GQM: self-organization of organization.
Goal
Purpose Measure
Issue The size of
Object The organization
Viewpoint From the external observer point of view
Question Q1 Are there many active members involved in the project?
Metrics M1 # of active members
Table 6.12: GQM, size of organization.
In particular, in order to be considered self-similar, a community needs
to show a very high percentage of members with the same skill. Based on
considerations from the projects we analysed and on our experience, we decided
to fix this percentage to a value of 90%.
NoPs also show openness as a further attribute: members are allowed to
enter the community without any formal process or admission.
Finally, NoPs are usually groups including a high number of people, there-
fore the attribute size was considered as the last relevant attribute for a Net-
work of Practice. This attribute can be simply evaluated through a metric
expressing the number of project members, as highlighterd in Table 6.12.
In order to calculate the number of active members, we have considered
those developers with the largest contribution, namely the ones whose total
contribution is at least equal to 50% of the entire contributions to the project.
The values collected for the projects we considered are included in Appendix
B. Given the distribution of these values, we decided to define the size of an
organization as “big” if the number of active members is greater than 10.
102

6.2 Using collected metrics to uncover social structures
6.2.6 Informal Communities
The attributes of informal communities are summarized in Table 6.13.
Attribute Rationale cited from [41]
Engagement*
The key differentiating attribute for ICs is the high degree of member
engagement. The success of the IC is exclusively tied to members’
engagement since their effort is what drives the community to expand.
Self-organizationThey interact informally [...]. One characteristic which also differentiates
ICs from other communities is the assumption of self-organization.
Self-similarity
ICs are usually sets of [...] with a common interest, often closely
dependent on their practice [...] on a common history or culture (eg
shared ideas, experience etc).
Dispersion
Their localization is necessarily dispersed so that the community can
reach a wider audience. [...] They interact [...] usually across unbound
distances.
Table 6.13: Attributes identifying Informal Communities (ICs).
Engagement of community members is the key-attribute which identifies an
Informal Community (IC). In order to evaluate the engagement, metrics related
to each member’s participation are needed. For that purpose, we considered
the metric resulting from the per-month number of posts and responses sent by
the group’s members, since it clearly represents a measure of the involvement
of the community in discussions. The metric also considers the number of
active members, so that average individual efforts are computed.
Unique commenters of the community are members with a higher number of
contributions if related to the one of the remaining members. Therefore, unique
commenters are a group of supporters who significantly contribute pursuing
the success of the project and its popularity outside the community itself,
and they can be identified by comparing the amount of contributions they
submitted to the total number of contributions.
The same computation can be applied to organizations instead of single
users. This allows us to identify those organizations which have greater visi-
bility within the community.
Moreover, the number of comments belonging to a thread, as well as the
average per-month number of messages posted within the thread, allows us
to evaluate the interest gathered by the discussions related to the project.
Considering the breadth of each discussion thread is also useful to understand
103

Evaluation
the engagement of the community, since it shows whether the discussion is alive
or not, and it indicates the thread’s impact on the members of the community.
The amount of threads that generate from a post further contribute to un-
derstand the involvement of community members and the value they recognize
to a discussion thread.
Finally, contributors may show interest in a discussion simply by subscrib-
ing to the discussion itself. In that case, members don’t directly contribute to
the thread, but their subscription indicates an interest in being in the know.
Therefore, the number of subscriptions to feeds and events related to a discus-
sion can also be considered as an indicator to evaluate the engagement within
the community.
All these metrics were defined by applying the GQM approach, as reported
in Table 6.14.
Given the values included in Appendix B, we can claim that engagement
within a community is high if, on average, each member posts no less than
30 comments per-month. Moreover, a member is considered to be a unique
commenter if he or she is responsible for 30% of contributions or more. In case
there are at least a user and an organization which are unique commenters,
engagement within the community can be considered significant.
The size of a discussion thread is considered high if, on average, each thread
has at least 3.5 comments, or there are at least 0.1 comments per month for
each thread, on average. Given our experience, the average number of dis-
cussion spread from a thread post is high if it exceeds 0.5. In most cases, in
fact the number of discussion spreads from a thread is 0 or 1. For what con-
cerns subscriptions, we did not have any data allowing us to estimate reliable
thresholds.
Beyond engagement, other non-key attributes contributing to characterize
an informal community are self-similarity and self-organization, which have
already been introduced in Section 6.2.5. Finally, dispersion was considered as
an attribute of ICs, since members of an informal community usually operate in
several different locations. Therefore, a high value of the metrics related to the
dispersion attribute, which have been discussed in Section 6.2.5, characterizes
informal communities.
104

6.2 Using collected metrics to uncover social structures
Goal
Purpose Measure
Issue The engagement of
Object The organization
Viewpoint From the external observer point of view
Question Q1 Is there a high contribution in terms of comments?
Metrics M1 Average per-month comments / # of active members
Question Q2 Are there many unique commenters within the project?
MetricsM2 Total # of members that are unique commenters
M3 Total # of organizations that are unique commenters
Question Q3 Which is the size of the discussion thread?
Metrics
M4 Average # of thread comments
M5 Average per-month # of thread comments
M6 Average # of discussions spread from a thread’s post
Question Q4 Are there many subscripions within the project?
Metrics M7 Total # of artifact subscriptions
Table 6.14: GQM, engagement of organization.
6.2.7 Results
The previously exposed analysis resulted in the introduction of 21 different
metrics, which have been discussed in the previous sections.
The data which is required to compute some of the listed metrics was made
available with the introduction of the new tools. In particular:
• The introduction of additional details about each developer allows to
compute metrics related to geographic and cultural distance.
• The shared knowledge among community members can be evaluated
thanks to the newly introduced skills profile, which allows each user
working on the forge to self-assess his capabilities.
• The UserStats tool allows to gather data about per-user comments. This
is necessary to evaluate most of the metrics needed to assess the engage-
ment of the community and the number of active members.
• In order to evaluate the concept of hierarchization, it is necessary to
consider user’s membership within organizations. This concept was in-
troduced by the tool OrganizationStats, discussed in Section 5.2.
105
Evaluation
• Similarly, involvement of users within organizations is also relevant for
computing ties-strength. Users of the forge can be provided with this
data thanks to the tool OrganizationStats, described in Section 5.2.
Therefore, this analysis highlights that the computation of 14 out of 21 iden-
tified metrics strictly depends on the introduction of the new tools, while the
remaining ones can be obtained by computing data already available on the
forge, either publicly available or not. Moreover, the key-attributes for each
one of the considered social structures are based on one or more of the 14
metrics depending on the newly implemented tools.
Finally, by considering the results we obtained from the metrics we collected
on our sample of projects hosted on SourceForge.net, we can classify these
projects with respect to the social structures of the communities which are de-
veloping them. In particular, the ProjectLibre community can be considered
as a Formal Network, since it exhibits a high governance level. Instead, the
high engagement of the communities supporting the projects Allura, Kiwix and
jStock, suggests that they are Informal Communities. More in details, Allura
is the community with the highest engagement among the considered ones.
Finally, DOSBox has a very large community with a low level of engagement,
indicating that its community could be a Network of Practice. However, the
analysis should also considered its member’s dispersion but, since the commu-
nity is not using the tools we introduced to include personal details on user
profiles, it was not possible to compute it.
In conclusion, this analysis allows us to understand that the implemented
tools collect data which is relevant to identify latent social structures within
communities on the forge, therefore contributing to create awareness about
the most relevant barriers potentially affecting the results of the work itself.
This means that provided data can have a strong impact on the awareness of
potential problems affecting open source communities.
106
Chapter 7
Conclusions and future work
The work presented in this thesis demonstrated that the world of open source
software is a very heterogeneous context, in which different interests and back-
grounds coexist. Nonetheless, open source communities are often affected by
the same issues, mostly related to the global approach adopted for the software
development, which results in a lack of awareness of the community itself.
By conducting a survey, we confirmed the heterogeneity of open source
communities. This also allowed us to identify the need of developers involved in
the open source field to receive more details about the communities supporting
the open source projects they contribute to, they would like to join, or they
are interested in as final users.
Gathered requirements led us to develop some tools to be installed within a
forge adopted for the development of open source software itself. These tools,
aimed at providing awareness-related data to the members of open source
communities, were developed by directly interacting with an existing open
source community, allowing us to better understand the open source context
and its needs.
All the functional requirements gathered through the survey were satisfied
by the implemented tools, except for the evaluation of the quality of previous
open source projects developed by existing organizations. In fact, these re-
quirement would require the collection and computation of data related to a
single project, which was left out of scope since it is still under development
by a separate team collaborating with the Allura community.
The interaction with the open source community also led us to develop a
critical point of view about the mechanisms adopted to manage contributions

Conclusions and future work
and to take decisions within the community itself. Our work revealed that
many different policies and organizational models can be adopted by open
source communities, and that some communities suffer from a lack of clear
documentation about these details. Nonetheless, each developer’s skills and
contributions are generally the driving factor to recognize members with more
power, ensuring the adoption of meritocratic mechanisms within the commu-
nity.
Transparency is often regarded as one of the features characterizing open
source communities, but the big amount of data, together with its dispersion,
is at the basis of the need to provide developers and final users with tools
allowing to summarize available information.
Therefore, we believe that the implementation of tools to compute metrics
about personal statistics increased transparency within the community, making
it easier to access available data, and it potentially enforces the adoption of
meritocracy within the community. the introduction of personal details and
the inclusion of the concept of organization also allows to address some issues
related to trust by making it clear what’s the technical and organizational
background of the community supporting offered products.
The evaluation of our work presented in Chapter 6 allows us to conclude
that provided data is actually important in order to understand the commu-
nity which is developing a software project, as well as the barriers potentially
preventing the success of the project itself.
Finally, the positive reception that the open source community developing
Allura reserved to the implemented tools confirmed us that our work actually
meets the requirements of existing open source communities and represented
a positive feedback about the quality of our code.
With the goal to further increase awareness and enforce trust in open source
communities, several evolutions of the presented work are possible. First of
all, the most relevant strength of the implemented tools gathering statistics
consists in its expandability. Additional tools gathering statistics from different
perspectives could be implemented. For example, it is possible to provide users
with tools monitoring single projects and showing metrics about its evolution
and status, by integrating the work of the team which is currently developing
these functionalities in collaboration with the Allura community.
Moreover, the most obvious evolution of the implemented features consists
108

in implementing matching tools with the purpose to make it easier for a de-
veloper to discover which projects are interesting for him or her, as well as
allowing existing communities to recruit new members among the ones with
the required skills, interests, experience and background. In particular, the
proposed tool should allow to provide these functionalities by querying the
database, considering data directly provided by developers within their per-
sonal profile, as well as by using the developer’s statistics and the connection
of the user with existing organizations.
Additional future work related to our thesis could be represented in the im-
plementation of a tool allowing to automatically uncover the underlying social
structure of each open source community, according to the metrics discussed
in Section 6.2. This tool would contribute increasing awareness within the
community and, most of all, it would help in highlighting the potential barri-
ers generally affecting communities characterized by the same social structure,
thus providing communities with a way to forecast their issues and to take
actions to avoid them affecting the outcome of their work.
Finally, thresholds defined for the metrics we introduced to identify latent
social structures could be refined by gathering a more reliable sample of data
about existing projects.
109


Appendix A
Survey
This Appendix includes the complete list of question composing the ques-
tionnaire we created to gather requirements from members of open source
communities, as well as the detailed results we collected through the survey
itself.
A.1 The questionnaire
In this section, the full template of the questionnaire created to conduct our
survey is included.
On-line Survey: Increasing Awareness in Open Source
project development
This is a simple and brief on-line survey dedicated to people participating in open
source projects. It consists in few questions on the current practices adopted
while developing open source software. Answering these questions will take only
a few minutes of your time, but it will be very useful to us in order to design
and implement tools increasing awareness in open source project delevopment.
* Mandatory

Survey
Section 1: You and your organization
This sections contains a few questions helping us to understand your back-
ground and which kind of organization (enterprises, research institutions,
public bodies, ...) you belong to.
1. How long have you been working in open source projects? *
(a) Less than 3 years
(b) 3 years or more
2. When was the last time you contributed developing open source
projects? *
(a) Less than one month ago
(b) Between one month and six months ago
(c) Between six months ago and one year ago
(d) More than one year ago
(e) Never
3. What kind of organization do you work for? *
(a) Research and/or education institution
(b) For-profit business
(c) Foundation or other non-profit organization
(d) No-one (independent developer)
(e) Other:
4. What is your role in the research and/or education institution? *This question was only presented to those respondents who answer (a) in question 3.
(a) Professor or researcher
(b) Student
(c) Administrative assistant
(d) Other:
112

A.1 The questionnaire
5. What is your role in the business? *This question was only presented to those respondents who answer (b) in question 3.
(a) Top-responsibility role (e.g.: CEO, board of directors member,
...)
(b) Manager with technical responsibility (e.g.: CIO, Project man-
ager, product manager, ...)
(c) Developer
(d) Other:
6. What is your role in the non-profit organization? *This question was only presented to those respondents who answer (c) in question 3.
(a) Top-responsibility role (e.g.: executive director, community
leader, ...)
(b) Developer
(c) Other:
7. How long have you been working for you current employer? *This question was only presented to those respondents who did not answer (d) in question 3.
(a) Less than 3 years
(b) 3 years or more
8. What size is your organization? *This question was only presented to those respondents who did not answer (d) in question 3.
(a) A small organization (up to 50 members)
(b) A medium-size organization (51-250 members)
(c) A big organization (at least 251 members)
113

Survey
9. What software categories does your organization develop? *This question was only presented to those respondents who did not answer (d) in question 3.
More than one answer was allowed.
(a) Home & Entertainment (applications designed primarily for use
in or for the home, or for entertainment)
(b) Content & Communication (office productivity suites, multime-
dia players, file viewers, Web browsers, collaboration tools, ...)
(c) Education & Reference (educational software, learning support
tools, ...)
(d) Operations & Professionals (ERPs, CRMs, SCMs, applications
for specific business uses, ...)
(e) Product manufacturing and service delivery (software to sup-
port specific product manufacturing and service delivery)
(f) Platform & Management (operating systems, security, infras-
tructure services, hardware components controllers, ...)
(g) Mobile apps
(h) Web applications
10. In which geographic area(s) does the developing team(s) of your or-ganization work? *This question was only presented to those respondents who did not answer (d) in question 3.
More than one answer was allowed.
(a) Africa
(b) Asia
(c) Europe
(d) Northern America
(e) Oceania
(f) South America
114

A.1 The questionnaire
Section 2: Partnership and coordination
This section includes questions focused on the organization of your team(s)
and on the cooperation with external organizations, like companies, uni-
versities or foundations.
1. Does your organization usually cooperate with other organizationsor individuals? *This question was only presented to those respondents who did not answer (d) in question 3
of section 1.
(a) No one
(b) Organizations only
(c) Freelance programmers only
(d) Both organizations and freelance programmers
2. Which elements do you consider while choosing the organizations orfreelance programmers to cooperate with? *This question was only presented to those respondents who did not answer (a) in question 1
of section 2. For each sub-question, only one answer was allowed.
• The organization/freelance programmer has participated in
many previous open source projects
(a) I don’t consider it
(b) It’s a secondary element
(c) It’s quite important
(d) It’s very important
• The organization/freelance programmer is contributing fre-
quently to other projects
(a) I don’t consider it
(b) It’s a secondary element
(c) It’s quite important
(d) It’s very important
115

Survey
• The organization/freelance programmer has been working in
projects similar to the one to be developed
(a) I don’t consider it
(b) It’s a secondary element
(c) It’s quite important
(d) It’s very important
• Success and popularity of projects developed or co-developed by
the organization/freelance programmer
(a) I don’t consider it
(b) It’s a secondary element
(c) It’s quite important
(d) It’s very important
3. When you chose an organization/freelance as a partner, what wasyour main goal? *This question was only presented to those respondents who did not answer (a) in question 1
of section 2.
(a) Reducing the individual effort needed to develop your projects
(b) Taking advantage of your partner’s specific skills and experience
(c) Both of them
4. How do you manage the cooperation with your partners? *This question was only presented to those respondents who did not answer (a) in question 1
of section 2.
(a) You outsource to your partner
(b) Your partner outsources to you
(c) The two of you collaborate on a peer-to-peer basis
116

A.1 The questionnaire
5. How do the involved members usually cooperate in multi-organizations projects? *This question was only presented to those respondents who did not answer (a) in question 1
of section 2.
(a) A unique team is created, including all the involved members
(b) Different teams are created, each one including members from
the same organization only
(c) Different teams are created, and some of them include members
form different organizations
6. What factors drive the adoption of open-source in your company? *This question was only presented to those respondents who did not answer (d) in question 3
of section 1. More than one answer was allowed.
(a) It’s cheap
(b) It’s readily available
(c) The community
(d) The originality of the idea
(e) Other:
7. Are there any open-source policies adopted by your company con-cerning the interoperability with the open-source communities? *This question was only presented to those respondents who did not answer (d) in question 3
of section 1.
(a) No, the company doesn’t have any policy
(b) Protocol-based interoperability is adopted with the open source
community
(c) Open interoperability is adopted with the open source commu-
nity
(d) Other interoperability models are adopted with the open source
community
117

Survey
Section 3: Organizations and Users Information
This section includes questions related to the relevance of features of orga-
nizations and users contributing in open source software projects.
1. The most known forges (e.g.: SourceForge) do not show personal de-
tails about developers and their association to specific organizations.
How do you consider providing this informations? *
(a) Extremely important
(b) Important
(c) Not so important
(d) Useless
2. What kind of information do you think an organization should pub-lish on a software forge hosting its projects? *This question was only presented to those respondents who did not answer (d) in question 1
of section 3. More than one answer was allowed.
(a) A description of the organization and of its activity
(b) The organization’s website and other contact information
(c) The organization’s dimension
(d) The organization’s main working areas
(e) The list of projects coordinated or entirely developed by the
organization
(f) The list of projects to which the organization has participated,
even with a minor role
(g) The contacts of all the organization members participating in
the project
(h) The roles of all the organization members participating in the
project
118

A.1 The questionnaire
3. How do you regard the possibility of consulting an indicator of skillsand previous experiences of the users? *This question was only presented to those respondents who did not answer (d) in question 1
of section 3.
(a) Useless
(b) Not so relevant
(c) Quite relevant
(d) Very important
4. How do you regard the possibility of consulting an indicator of skillsand previous experiences of the organizations? *This question was only presented to those respondents who did not answer (d) in question 1
of section 3.
(a) Useless
(b) Not so relevant
(c) Quite relevant
(d) Very important
5. Would you trust an automatic system for collecting reputation met-rics, that is statistics on previous work developed by users and orga-nizations? *This question was only presented to those respondents who did not answer (d) in question 1
of section 3.
(a) Not at all
(b) Not much
(c) Pretty much
(d) Completely
6. Assuming that your reputation metrics are available, what kind ofvisibility would you like them to have? *This question was only presented to those respondents who did not answer (d) in question 1
of section 3.
(a) I would use them only for internal assessment
(b) I would make them available to external users
(c) They should not be available even for internal use
119

Survey
7. Which kind of data should be included in user’s reputation metrics? *This question was only presented to those respondents who did not answer (d) in question 1
of section 3. More than one answer was allowed.
(a) Contribution frequency in terms of changed/added lines of code
per month
(b) Contribution frequency in terms of posted messages per month
(c) Total number of LOC written or modified by the user
(d) Total number of messages posted by the user
(e) Total number of bugs reported by the user
(f) Total number of bugs assigned to the user and percentage of
solved ones
(g) Average time needed to solve a bug
(h) Separated evaluation of the total amount of contribution for
each programming language
(i) Separated evaluation of the total amount of contribution for
each category of projects
(j) Indication of preference for specific categories of projects
8. Which kind of data should be included in an organization’s reputationmetrics? *This question was only presented to those respondents who did not answer (d) in question 1
of section 3. More than one answer was allowed.
(a) Aggregated figures of the data acquired for each team member
(b) The projects coordinated or entirely developed by the organiza-
tion
(c) The projects in which the organization participates, even with
a minor role
(d) The quality and success of the devolped projects
(e) The organization’s previous partners
120

A.2 Detailed results
Section 4: Open comments
Do you have something else you want to tell us?
1. Write here any comment or additional information that you think
it’s useful to us (optional).
A.2 Detailed results
This section includes a complete report of the results gathered by means of
the survey. The following tables include presented questions and, together
with the number and the percentage of respondents selecting each one of the
proposed answers.
Question 1.1: How long have you been working in open source projects?
Answer Respondents Percentage
Less than 3 year 31 62%
3 years or more 19 38%
Total 50
Table A.1: Results of the survey: Section 1, 1st question.
Question 1.2: When was the last time you contributed developing open source
projects?
Answer Respondents Percentage
Less than one month ago 17 34%
Between one month and six months ago 8 16%
Between six months ago and one year ago 4 8%
More than one year ago 15 30%
Never 6 12%
Total 50
Table A.2: Results of the survey: Section 1, 2nd question.
121

Survey
Question 1.3: What kind of organization do you work for?
Answer Respondents Percentage
Research and/or education institution 23 46%
For-profit business 13 26%
Foundation or other non-profit organization 2 4%
No-one (independent developer) 11 22%
Other 1 2%
Total 50
Table A.3: Results of the survey: Section 1, 3rd question.
Question 1.4: What is your role in the research and/or education institution?
Answer Respondents Percentage
Professor or researcher 9 46%
Student 14 26%
Administrative assistant 0 0%
Other 0 0%
Total 23
Table A.4: Results of the survey: Section 1, 4th question.
Question 1.5: What is your role in the business?
Answer Respondents Percentage
Top-responsibility role 2 15%
Manager with technical responsibility 2 15%
Developer 8 62%
Other 1 8%
Total 13
Table A.5: Results of the survey: Section 1, 5th question.
Question 1.6: What is your role in the non-profit organization?
Answer Respondents Percentage
Top-responsibility role 0 0%
Developer 2 100%
Other 0 0%
Total 2
Table A.6: Results of the survey: Section 1, 6th question.
Question 1.7: How long have you been working for you current employer?
Answer Respondents Percentage
Less than 3 year 24 62%
3 years or more 15 38%
Total 39
Table A.7: Results of the survey: Section 1, 7th question.
122

A.2 Detailed results
Question 1.8: What size is your organization?
Answer Respondents Percentage
A small organization (up to 50 members) 16 41%
A medium-size organization (51-250 members) 8 21%
A big organization (at least 251 members) 15 38%
Total 39
Table A.8: Results of the survey: Section 1, 8th question.
Question 1.9: What software categories does your organization develop?
Answer Respondents Percentage
Home & Entertainment 3 8%
Content & Communication 10 26%
Education & Reference 12 31%
Operations & Professionals 16 41%
Product manufacturing and service delivery 4 10%
Platform & Management 6 15%
Mobile apps 8 21%
Web applications 18 46%
Total respondents (multiple choices allowed) 39
Table A.9: Results of the survey: Section 1, 9th question.
Question 1.10: In which geographic area(s) does the developing team(s)of your organization work?
Answer Respondents Percentage
Africa 1 3%
Asia 6 15%
Europe 38 97%
Northern America 8 21%
Oceania 0 0%
Southern America 3 8%
Total respondents (multiple choices allowed) 39
Table A.10: Results of the survey: Section 1, 10th question.
Question 2.1: Does your organization usually cooperate with other organizations
or individuals?
Answer Respondents Percentage
No one 6 15%
Organizations only 13 33%
Freelance programmers only 3 8%
Both organizations and freelance programmers 17 44%
Total 39
Table A.11: Results of the survey: Section 2, 1st question.
123
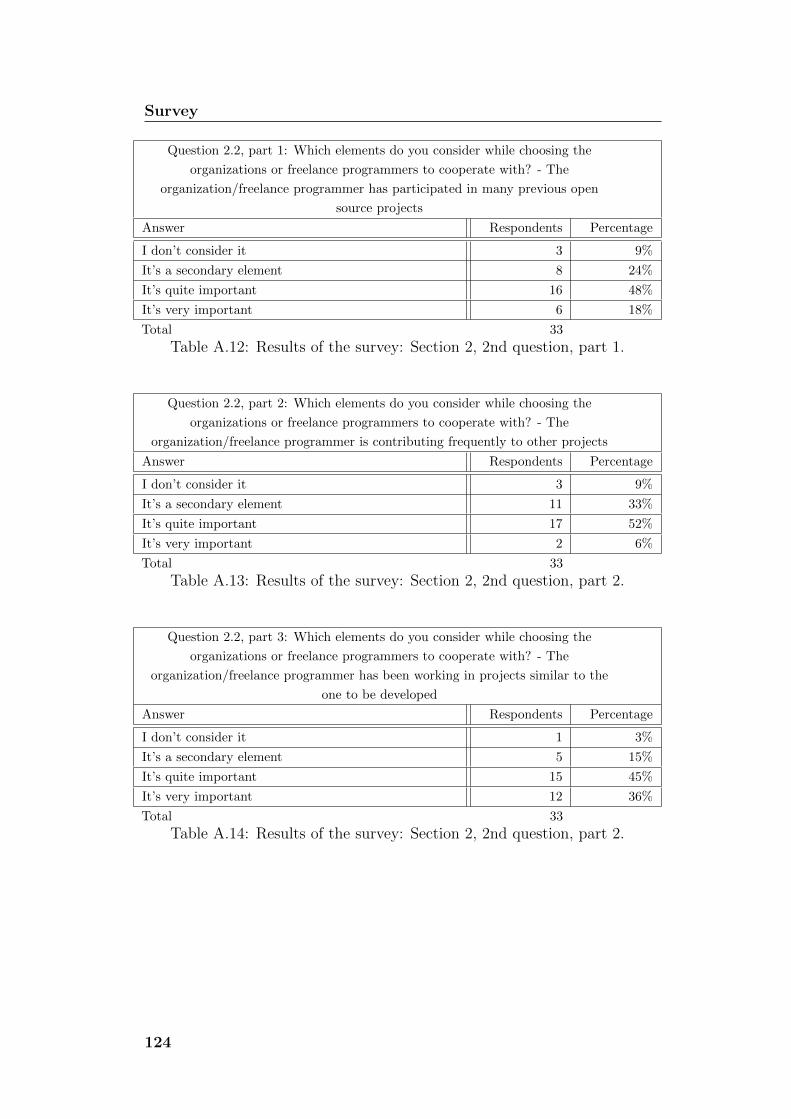
Survey
Question 2.2, part 1: Which elements do you consider while choosing the
organizations or freelance programmers to cooperate with? - The
organization/freelance programmer has participated in many previous open
source projects
Answer Respondents Percentage
I don’t consider it 3 9%
It’s a secondary element 8 24%
It’s quite important 16 48%
It’s very important 6 18%
Total 33
Table A.12: Results of the survey: Section 2, 2nd question, part 1.
Question 2.2, part 2: Which elements do you consider while choosing the
organizations or freelance programmers to cooperate with? - The
organization/freelance programmer is contributing frequently to other projects
Answer Respondents Percentage
I don’t consider it 3 9%
It’s a secondary element 11 33%
It’s quite important 17 52%
It’s very important 2 6%
Total 33
Table A.13: Results of the survey: Section 2, 2nd question, part 2.
Question 2.2, part 3: Which elements do you consider while choosing the
organizations or freelance programmers to cooperate with? - The
organization/freelance programmer has been working in projects similar to the
one to be developed
Answer Respondents Percentage
I don’t consider it 1 3%
It’s a secondary element 5 15%
It’s quite important 15 45%
It’s very important 12 36%
Total 33
Table A.14: Results of the survey: Section 2, 2nd question, part 2.
124

A.2 Detailed results
Question 2.2, part 4: Which elements do you consider while choosing the
organizations or freelance programmers to cooperate with? - Success and
popularity of projects developed or co-developed by the organization/freelance
programmer
Answer Respondents Percentage
I don’t consider it 4 12%
It’s a secondary element 9 27%
It’s quite important 15 45%
It’s very important 5 15%
Total 33
Table A.15: Results of the survey: Section 2, 2nd question, part 4.
Question 2.3: When you chose an organization/freelance as a partner, what was
your main goal?
Answer Respondents Percentage
Reducing the individual effort needed to develop your
projects
3 9%
Taking advantage of your partner’s specific skills and
experience
7 21%
Both of them 23 70%
Total 33
Table A.16: Results of the survey: Section 2, 3rd question.
Question 2.4: How do you manage the cooperation with your partners?
Answer Respondents Percentage
You outsource to your partner 8 24%
Your partner outsources to you 4 12%
The two of you collaborate on a peer-to-peer basis 21 64%
Total 33
Table A.17: Results of the survey: Section 2, 4th question.
Question 2.5: How do the involved members usually cooperate in
multi-organizations projects?
Answer Respondents Percentage
A unique team is created, including all the involved
members
12 36%
Different teams are created, each one including
members from the same organization only
11 33%
Different teams are created, and some of them include
members form different organizations
10 30%
Total 33
Table A.18: Results of the survey: Section 2, 5th question.
125
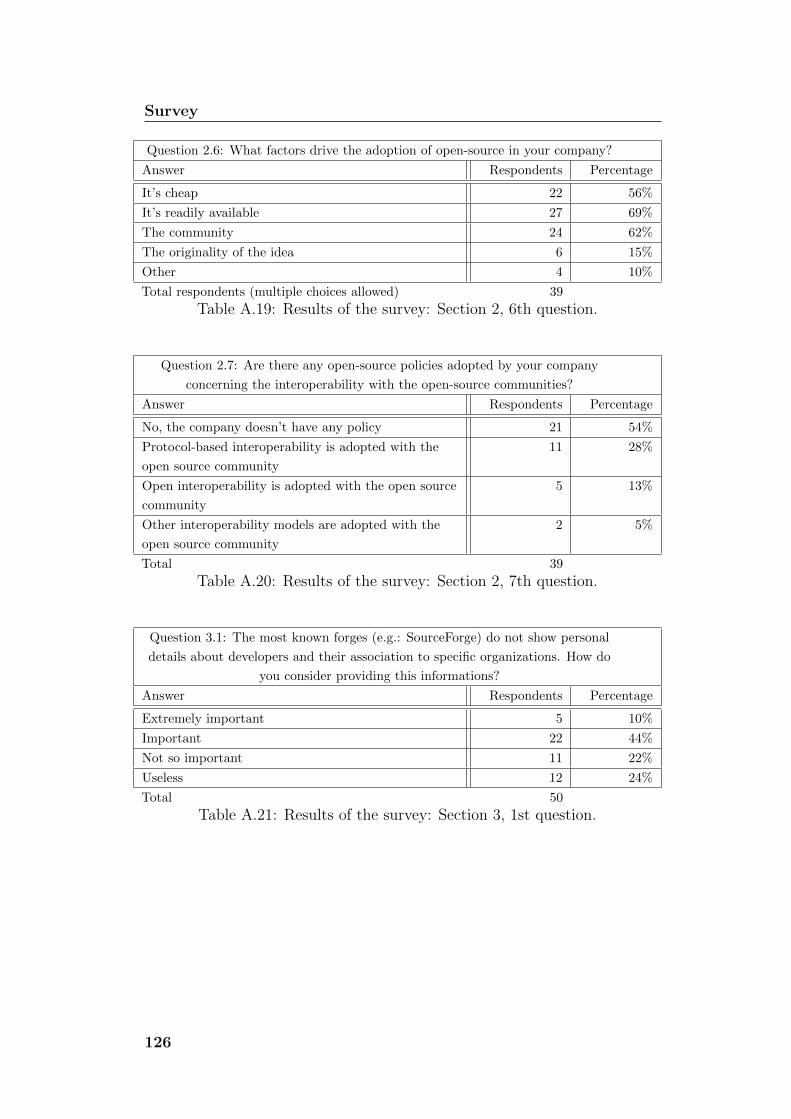
Survey
Question 2.6: What factors drive the adoption of open-source in your company?
Answer Respondents Percentage
It’s cheap 22 56%
It’s readily available 27 69%
The community 24 62%
The originality of the idea 6 15%
Other 4 10%
Total respondents (multiple choices allowed) 39
Table A.19: Results of the survey: Section 2, 6th question.
Question 2.7: Are there any open-source policies adopted by your company
concerning the interoperability with the open-source communities?
Answer Respondents Percentage
No, the company doesn’t have any policy 21 54%
Protocol-based interoperability is adopted with the
open source community
11 28%
Open interoperability is adopted with the open source
community
5 13%
Other interoperability models are adopted with the
open source community
2 5%
Total 39
Table A.20: Results of the survey: Section 2, 7th question.
Question 3.1: The most known forges (e.g.: SourceForge) do not show personal
details about developers and their association to specific organizations. How do
you consider providing this informations?
Answer Respondents Percentage
Extremely important 5 10%
Important 22 44%
Not so important 11 22%
Useless 12 24%
Total 50
Table A.21: Results of the survey: Section 3, 1st question.
126

A.2 Detailed results
Question 3.2: What kind of information do you think an organization should
publish on a software forge hosting its projects?
Answer Respondents Percentage
A description of the organization and of its activity 25 66%
The organization’s website and other contact
information
27 71%
The organization’s dimension 7 18%
The organization’s main working areas 18 47%
The list of projects coordinated or entirely developed
by the organization
19 50%
The list of projects to which the organization has
participated, even with a minor role
16 42%
The contacts of all the organization members
participating in the project
14 37%
The roles of all the organization members
participating in the project
16 42%
Total respondents (multiple choices allowed) 38
Table A.22: Results of the survey: Section 3, 2nd question.
Question 3.3: How do you regard the possibility of consulting an indicator of
skills and previous experiences of the users?
Answer Respondents Percentage
Useless 1 3%
Not so relevant 6 16%
Quite relevant 22 58%
Very important 9 24%
Total 38
Table A.23: Results of the survey: Section 3, 3rd question.
Question 3.4: How do you regard the possibility of consulting an indicator of
skills and previous experiences of the organizations?
Answer Respondents Percentage
Useless 1 3%
Not so relevant 5 13%
Quite relevant 22 58%
Very important 10 26%
Total 38
Table A.24: Results of the survey: Section 3, 4th question.
127

Survey
Question 3.5: Would you trust an automatic system for collecting reputation
metrics, that is statistics on previous work developed by users and organizations?
Answer Respondents Percentage
Not at all 1 3%
Not much 13 34%
Pretty much 18 47%
Completely 6 16%
Total 38
Table A.25: Results of the survey: Section 3, 5th question.
Question 3.6: Assuming that your reputation metrics are available, what kind of
visibility would you like them to have?
Answer Respondents Percentage
I would use them only for internal assessment 12 32%
I would make them available to external users 25 66%
They should not be available even for internal use 1 3%
Total 38
Table A.26: Results of the survey: Section 3, 6th question.
Question 3.7: Which kind of data should be included in user’s reputation metrics?
Answer Respondents Percentage
Contribution frequency in terms of changed/added
lines of code per month
28 74%
Contribution frequency in terms of posted messages
per month
20 53%
Total number of LOC written or modified by the user 18 47%
Total number of messages posted by the user 16 42%
Total number of bugs reported by the user 23 61%
Total number of bugs assigned to the user and
percentage of solved ones
25 66%
Average time needed to solve a bug 15 39%
Separated evaluation of the total amount of
contribution for each programming language
19 50%
Separated evaluation of the total amount of
contribution for each category of projects
18 47%
Indication of preference for specific categories of
projects
15 39%
Total respondents (multiple choices allowed) 38
Table A.27: Results of the survey: Section 3, 7th question.
128

A.2 Detailed results
Question 3.8: Which kind of data should be included in an organization’s
reputation metrics?
Answer Respondents Percentage
Aggregated figures of the data acquired for each team
member
18 47%
The projects coordinated or entirely developed by the
organization
22 58%
The projects in which the organization participates,
even with a minor role
14 37%
The quality and success of the devolped projects 29 76%
The organization’s previous partners 6 16%
Total respondents (multiple choices allowed) 38
Table A.28: Results of the survey: Section 3, 8th question.
129


Appendix B
Sample metrics gathered from
OSS projects
This Appendix includes the list of data gathered from a set of existing projects
hosted on SourceForge. As exlained in Section 6.2, these data were collected
with the purpose to study the distribution of metrics defined to identify latent
social structures and to help us in defining thresholds for the classification of
existing communities.
B.1 Distributions of projects contribution
The following tables include, for each single project, the distribution of contri-
butions among the most active developers. For each project, the 25 developers
which contribute the most to the project itself are listed, showing the number
of posts they submitted, as well as the percentage of total existing posts that
they created, and the cumulative sum of contributions.

Sample metrics gathered from OSS projects
Member # contributions % contributions% cumulative sum
contributions
1st Member 6283 28.05% 28.05%
2nd Member 2192 9.78% 37.83%
3th Member 1713 7.65% 45.48%
4th Member 1208 5.39% 50.87%
5th Member 1105 4.93% 55.80%
6th Member 925 4.13% 59.93%
7th Member 919 4.10% 64.03%
8th Member 898 4.01% 68.04%
9th Member 842 3.76% 71.80%
10th Member 698 3.12% 74.92%
11th Member 694 3.10% 78.02%
12th Member 406 1.81% 79.83%
13th Member 333 1.49% 81.31%
14th Member 243 1.08% 82.40%
15th Member 226 1.01% 83.41%
16th Member 216 0.96% 84.37%
17th Member 145 0.65% 85.02%
18th Member 103 0.46% 85.48%
19th Member 89 0.40% 85.88%
20th Member 86 0.38% 86.26%
21th Member 32 0.14% 86.40%
22th Member 28 0.12% 86.53%
23th Member 27 0.12% 86.65%
24th Member 26 0.12% 86.76%
25th Member 22 0.10% 86.86%
Other members 2943 13,14% 100.00%
Total 22402 100.00%Table B.1: Distribution of contributions in Allura.
132

B.1 Distributions of projects contribution
Member # contributions % contributions% cumulative sum
contributions
1st Member 757 25,67% 25.67%
2nd Member 103 3.49% 29.16%
3th Member 92 3.12% 32.28%
4th Member 91 3.09% 35.37%
5th Member 83 2.81% 38.18%
6th Member 77 2.61% 40.79%
7th Member 77 2.61% 43.40%
8th Member 76 2.58% 45.98%
9th Member 71 2.41% 48.39%
10th Member 42 1.42% 49.81%
11th Member 41 1.39% 51.20%
12th Member 35 1.19% 52.39%
13th Member 33 1.12% 53.51%
14th Member 30 1.02% 54.53%
15th Member 30 1.02% 55.54%
16th Member 25 0.85% 56.39%
17th Member 24 0.81% 57.21%
18th Member 24 0.81% 58.02%
19th Member 22 0.75% 58.77%
20th Member 20 0.68% 59.44%
21th Member 19 0.64% 60.09%
22th Member 19 0.64% 60,73%
23th Member 18 0.61% 61.34%
24th Member 17 0.58% 61.92%
25th Member 16 0.54% 62.46%
Other members 1107 37.54% 100.00%
Total 2949 100.00%Table B.2: Distribution of contributions in DOSBox.
133

Sample metrics gathered from OSS projects
Member # contributions % contributions% cumulative sum
contributions
1st Member 1340 61.41% 61.41%
2nd Member 34 1.56% 62.97%
3th Member 32 1.47% 64.44%
4th Member 21 0.96% 65.40%
5th Member 21 0.96% 66.36%
6th Member 20 0.92% 67.28%
7th Member 19 0.87% 68.15%
8th Member 18 0.82% 68.97%
9th Member 11 0.50% 69.48%
10th Member 11 0.50% 69.98%
11th Member 10 0.46% 70.44%
12th Member 10 0.46% 70.90%
13th Member 10 0.46% 71.36%
14th Member 9 0.41% 71.77%
15th Member 9 0.41% 72.18%
16th Member 9 0.41% 72.59%
17th Member 8 0.37% 72.96%
18th Member 8 0.37% 73.33%
19th Member 8 0.37% 73.69%
20th Member 7 0.32% 74.01%
21th Member 7 0.32% 74.34%
22th Member 7 0.32% 74.66%
23th Member 7 0.32% 74.98%
24th Member 7 0.32% 75.30%
25th Member 6 0.27% 75.57%
Other members 533 24.43% 100.00%
Total 2182 100.00%Table B.3: Distribution of contributions in JStock.
134

B.1 Distributions of projects contribution
Member # contributions % contributions% cumulative sum
contributions
1st Member 2156 81.02% 81.02 %
2nd Member 63 2.37% 83.39%
3th Member 53 1.99% 85.38%
4th Member 44 1.65% 87.03%
5th Member 43 1.62% 88.65%
6th Member 43 1.62% 90.27%
7th Member 24 0.90% 91.17%
8th Member 13 0.49% 91.66%
9th Member 12 0.45% 92.11%
10th Member 11 0.41% 92.52%
11th Member 10 0.38% 92.90%
12th Member 10 0.38% 93.27%
13th Member 9 0.34% 93.61%
14th Member 9 0.34% 93.95%
15th Member 8 0.30% 94.25%
16th Member 8 0.30% 94.55%
17th Member 7 0.26% 94.81%
18th Member 6 0.23% 95.04%
19th Member 6 0.23% 95.26%
20th Member 6 0.23% 95.49%
21th Member 6 0.23% 95.72%
22th Member 5 0.19% 95.90%
23th Member 5 0.19% 96.09%
24th Member 5 0.19% 96.28%
25th Member 4 0.15% 96.43%
Other members 95 3.57% 100.00%
Total 2661 100.00%Table B.4: Distribution of contributions in Kiwix.
135

Sample metrics gathered from OSS projects
Member # contributions % contributions% cumulative sum
contributions
1st Member 69 28.16% 28.16%
2nd Member 47 19.18% 47.35%
3th Member 14 5.71% 53.06%
4th Member 12 4.90% 57.96%
5th Member 9 3.67% 61.63%
6th Member 6 2.45% 64.08%
7th Member 5 2.04% 66.12%
8th Member 5 2.04% 68.16%
9th Member 5 2.04% 70.20%
10th Member 4 1.63% 71.84%
11th Member 3 1.22% 73.06%
12th Member 3 1.22% 74.29%
13th Member 3 1.22% 75.51%
14th Member 3 1.22% 76.73%
15th Member 3 1.22% 77.96%
16th Member 3 1.22% 79.18%
17th Member 3 1.22% 80.41%
18th Member 3 1.22% 81.63%
19th Member 2 0.82% 82.45%
20th Member 2 0.82% 83.27%
21th Member 2 0.82% 84.08%
22th Member 2 0.82% 84.90%
23th Member 2 0.82% 85.71%
24th Member 2 0.82% 86.53%
25th Member 2 0.82% 87.35%
Other members 31 12.65% 100.00%
Total 245 100.00%Table B.5: Distribution of contributions in ProjectLibre.
136

B.2 Metrics of projects
B.2 Metrics of projects
Table B.6 summarizes the metrics computed for a set of sample open source
projects hosted at SourceForge.net.
Metric Allura ProjectLibre Kiwix DOSBox Jstock
% of active memb.(AMs)
1.13% 5.36% 1.30% 2.91% 0.37%
# of activemembers
5 3 1 11 1
Project life time(days)
985 196 2401 3975 2049
Total # ofmilestones
10 6 3 19 1
Governancelevel
0.0101 0.0306 0.0012 0.0048 0.0005
Project life time(months)
32.83 6.53 80.03 132.50 68.30
Total # ofcomments
22402 245 2661 2949 2182
Average per-monthcomments
682.23 37.50 33.25 22.26 31.95
Averageper-month
comments / #of AMs
136.46 12.50 33.25 2.02 31.95
# of uniquecommenter-members
0 0 1 0 1
Total # of threads 6070 134 1096 741 708Average # of
threadcomments
3.69 1.83 2.43 3.98 3.08
Averageper-month # of
threadcomments
0.112 0.280 0.030 0.030 0.045
Table B.6: Computation of metrics for a set of sample OSS projects.
The geographical distance among committers of the Allura project was also
computed, based on our knowledge of the location of the community members.
Results, expressed in kilometers, are summarized in Table B.7.
Member B C D E F G H I J
A 7780 7913 7323 9295 503.2 1150 857.7 7323 7322B - 476.8 1589 3589 8239 7025 7737 1589 952.8C - - 1974 3982 8341 7092 7996 1974 1419D - - - 3069 7797 6706 7226 0.1 636.6E - - - - 9798 9483 8869 3069 3069F - - - - - 1366 1181 7797 7796G - - - - - - 1871 6706 6705H - - - - - - - 7226 7225I - - - - - - - - 636.6
Table B.7: Distance values among committers of the Allura projects.
Finally, Table B.8. shows the cultural distance among each couple of mem-
bers of the Allura community.
137
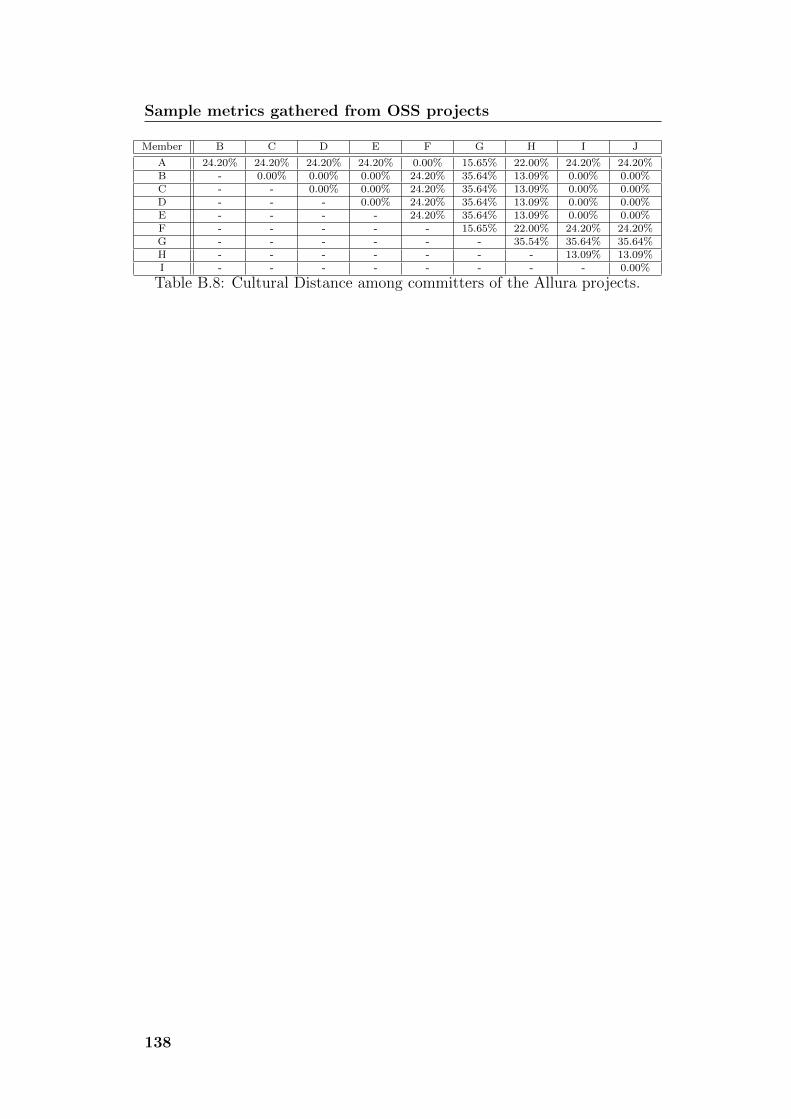
Sample metrics gathered from OSS projects
Member B C D E F G H I J
A 24.20% 24.20% 24.20% 24.20% 0.00% 15.65% 22.00% 24.20% 24.20%B - 0.00% 0.00% 0.00% 24.20% 35.64% 13.09% 0.00% 0.00%C - - 0.00% 0.00% 24.20% 35.64% 13.09% 0.00% 0.00%D - - - 0.00% 24.20% 35.64% 13.09% 0.00% 0.00%E - - - - 24.20% 35.64% 13.09% 0.00% 0.00%F - - - - - 15.65% 22.00% 24.20% 24.20%G - - - - - - 35.54% 35.64% 35.64%H - - - - - - - 13.09% 13.09%I - - - - - - - - 0.00%
Table B.8: Cultural Distance among committers of the Allura projects.
138

List of Figures
2.1 Most relevant issues in Global Software Development. . . . . . . 10
2.2 Complexity and barriers in a GSE project [31]. . . . . . . . . . . 11
2.3 Power distribution among centers of power [30]. . . . . . . . . . 17
2.4 Conceptual architecture of the tool ALERT. . . . . . . . . . . . 23
3.1 Survey results. Background of survey respondents. . . . . . . . . 33
3.2 Survey results. Roles of survey respondents within their orga-
nizations. . . . . . . . . . . . . . . . . . . . . . . . . . . . . . . 34
3.3 Survey results. Size of the organizations of interviewees and
duration of respondent’s involvement within them. . . . . . . . . 35
3.4 Survey results. Background of organizations in which intervie-
wees operate. . . . . . . . . . . . . . . . . . . . . . . . . . . . . 36
3.5 Survey results. Elements considered while selecting collaborators. 38
3.6 Survey results. Collaborations within open source communities. 39
3.7 Survey results. Open source-related policies. . . . . . . . . . . . 40
3.8 Survey results. Relevance of single details about organizations
developing open source software. . . . . . . . . . . . . . . . . . . 41
3.9 Survey results. Relevance of indicators about skills and experi-
ence of organizations and developers. . . . . . . . . . . . . . . . 41
3.10 Survey results. Relevance of single indicators about users and
organizations developing open source software. . . . . . . . . . . 42
4.1 The external tools in Allura. . . . . . . . . . . . . . . . . . . . . 46
4.2 The architecture of the Allura event-based system. . . . . . . . . 48
4.3 The development process adopted by the Allura community to
implement new features. . . . . . . . . . . . . . . . . . . . . . . 53

LIST OF FIGURES
5.1 UML class diagram representing the additional personal details
of a user. . . . . . . . . . . . . . . . . . . . . . . . . . . . . . . . 58
5.2 UML class diagram representing the controllers to manage per-
sonal details of a user. . . . . . . . . . . . . . . . . . . . . . . . 59
5.3 Screenshot representing a personal profile including the newly
introduces personal details . . . . . . . . . . . . . . . . . . . . . 60
5.4 Screenshot representing the form to update a user’s set of skills 61
5.5 UML class diagram representing the introduced concept of or-
ganization. . . . . . . . . . . . . . . . . . . . . . . . . . . . . . . 64
5.6 Screenshot showing the public profile of an organization on the
forge. . . . . . . . . . . . . . . . . . . . . . . . . . . . . . . . . . 65
5.7 Screenshot representing the tool to manage organization’s in-
volvement within a project hosted on the forge. . . . . . . . . . 66
5.8 Screenshot representing the Web page allowing to edit a logged
user’s enrollments. . . . . . . . . . . . . . . . . . . . . . . . . . 67
5.9 State diagram outlining the state transitions related to a user’s
membership in an organization. . . . . . . . . . . . . . . . . . . 68
5.10 State diagram outlining the state transitions related to an or-
ganization’s involvement in a project. . . . . . . . . . . . . . . . 69
5.11 Class diagram representing the abstract class EventsListener. . . 70
5.12 Screenshot representing the tables summarizing user statistics
about registration and contributions. . . . . . . . . . . . . . . . 72
5.13 Screenshot representing the Web page listing the topics of the
projects to which a user participates. . . . . . . . . . . . . . . . 73
5.14 Screenshot representing the Web page listing statistics about
the contributions submitted by a user in a single category of
projects. . . . . . . . . . . . . . . . . . . . . . . . . . . . . . . . 74
5.15 Screenshot representing the table which includes data about a
user’s commits for each category of projects. . . . . . . . . . . . 75
5.16 Screenshot representing the table which includes data about a
user’s artifacts for each category of projects. . . . . . . . . . . . 75
5.17 Screenshot representing the table which includes data about a
user’s tickets for each category of projects. . . . . . . . . . . . . 75
5.18 Screenshot representing the rankings of a user’s contribution
within the forge. . . . . . . . . . . . . . . . . . . . . . . . . . . 76
140

LIST OF FIGURES
5.19 Class diagram representing the model adopted to store user
statistics. . . . . . . . . . . . . . . . . . . . . . . . . . . . . . . 77
5.20 Screenshot representing the tables summarizing organization
statistics about registration and contributions. . . . . . . . . . . 82
5.21 Screenshot representing the tables summarizing membership
data and per-member contributions within an organization. . . . 83
5.22 Screenshot representing data about projects involvement for a
single organization, as well as the organization’s topics of interest. 84
5.23 Screenshot representing indicators comparing the contributions
of an organization with contributions of the other ones registered
on the forge. . . . . . . . . . . . . . . . . . . . . . . . . . . . . . 84
5.24 UML class diagram representing the class adopted to store
statistics about a single organization. . . . . . . . . . . . . . . . 85
6.1 Decision tree adopted to classify a social community. . . . . . . 92
141


List of Tables
3.1 Functional requirements gathered by means of the survey. . . . . 44
6.1 Attributes identifying Formal Networks (FNs). . . . . . . . . . . 94
6.2 GQM, formality of organization. . . . . . . . . . . . . . . . . . . 95
6.3 GQM, membership importance within organization. . . . . . . . 96
6.4 Attributes identifying Informal Networks (INs). . . . . . . . . . 96
6.5 GQM, informality of organization. . . . . . . . . . . . . . . . . . 97
6.7 GQM, non-governance of organization. . . . . . . . . . . . . . . 98
6.6 GQM, openness of organization. . . . . . . . . . . . . . . . . . . 98
6.8 Attributes identifying Networks of Practice (NoPs). . . . . . . . 99
6.9 GQM, dispersion of organization. . . . . . . . . . . . . . . . . . 101
6.10 GQM, self-similarity of organization. . . . . . . . . . . . . . . . 101
6.11 GQM: self-organization of organization. . . . . . . . . . . . . . . 102
6.12 GQM, size of organization. . . . . . . . . . . . . . . . . . . . . . 102
6.13 Attributes identifying Informal Communities (ICs). . . . . . . . 103
6.14 GQM, engagement of organization. . . . . . . . . . . . . . . . . 105
A.1 Results of the survey: Section 1, 1st question. . . . . . . . . . . 121
A.2 Results of the survey: Section 1, 2nd question. . . . . . . . . . . 121
A.3 Results of the survey: Section 1, 3rd question. . . . . . . . . . . 122
A.4 Results of the survey: Section 1, 4th question. . . . . . . . . . . 122
A.5 Results of the survey: Section 1, 5th question. . . . . . . . . . . 122
A.6 Results of the survey: Section 1, 6th question. . . . . . . . . . . 122
A.7 Results of the survey: Section 1, 7th question. . . . . . . . . . . 122
A.8 Results of the survey: Section 1, 8th question. . . . . . . . . . . 123
A.9 Results of the survey: Section 1, 9th question. . . . . . . . . . . 123
A.10 Results of the survey: Section 1, 10th question. . . . . . . . . . 123

LIST OF TABLES
A.11 Results of the survey: Section 2, 1st question. . . . . . . . . . . 123
A.12 Results of the survey: Section 2, 2nd question, part 1. . . . . . . 124
A.13 Results of the survey: Section 2, 2nd question, part 2. . . . . . . 124
A.14 Results of the survey: Section 2, 2nd question, part 2. . . . . . . 124
A.15 Results of the survey: Section 2, 2nd question, part 4. . . . . . . 125
A.16 Results of the survey: Section 2, 3rd question. . . . . . . . . . . 125
A.17 Results of the survey: Section 2, 4th question. . . . . . . . . . . 125
A.18 Results of the survey: Section 2, 5th question. . . . . . . . . . . 125
A.19 Results of the survey: Section 2, 6th question. . . . . . . . . . . 126
A.20 Results of the survey: Section 2, 7th question. . . . . . . . . . . 126
A.21 Results of the survey: Section 3, 1st question. . . . . . . . . . . 126
A.22 Results of the survey: Section 3, 2nd question. . . . . . . . . . . 127
A.23 Results of the survey: Section 3, 3rd question. . . . . . . . . . . 127
A.24 Results of the survey: Section 3, 4th question. . . . . . . . . . . 127
A.25 Results of the survey: Section 3, 5th question. . . . . . . . . . . 128
A.26 Results of the survey: Section 3, 6th question. . . . . . . . . . . 128
A.27 Results of the survey: Section 3, 7th question. . . . . . . . . . . 128
A.28 Results of the survey: Section 3, 8th question. . . . . . . . . . . 129
B.1 Distribution of contributions in Allura. . . . . . . . . . . . . . . 132
B.2 Distribution of contributions in DOSBox. . . . . . . . . . . . . . 133
B.3 Distribution of contributions in JStock. . . . . . . . . . . . . . . 134
B.4 Distribution of contributions in Kiwix. . . . . . . . . . . . . . . 135
B.5 Distribution of contributions in ProjectLibre. . . . . . . . . . . . 136
B.6 Computation of metrics for a set of sample OSS projects. . . . . 137
B.7 Distance values among committers of the Allura projects. . . . . 137
B.8 Cultural Distance among committers of the Allura projects. . . 138
144

Bibliography
[1] The alert project. http://alert-project.eu/.
[2] The open source definition. http://opensource.org/osd.
[3] Debian constitution. http://www.debian.org/devel/constitution.
en.html, October 2007.
[4] Debian new members corner. http://www.debian.org/devel/join/
newmaint.en, August 2012.
[5] What is free software? http://www.gnu.org/philosophy/free-sw.en.
html, July 2012.
[6] M.A. aris Eykelhoff. Increasing awareness in global software development.
8th Twente Student Conference on IT, Enschede, jan 2008.
[7] Christian Bartelt, Manfred Broy, Christoph Herrmann, Eric Knauss,
Marco Kuhrmann, Andreas Rausch, Bernhard Rumpe, and Kurt Schnei-
der. Orchestration of global software engineering projects - position pa-
per. In Proceedings of the 2009 Fourth IEEE International Conference
on Global Software Engineering, ICGSE ’09, pages 332–337, Washington,
DC, USA, 2009. IEEE Computer Society.
[8] Li-Te Cheng, Susanne Hupfer, Steven Ross, and John Patterson. Jazzing
up eclipse with collaborative tools. In Proceedings of the 2003 OOPSLA
workshop on eclipse technology eXchange, eclipse ’03, pages 45–49, New
York, NY, USA, 2003. ACM.
[9] Kevin Crowston, Kangning Wei, Qing Li, U. Yeliz Eseryel, and James
Howison. Coordination of free/libre open source software development.

BIBLIOGRAPHY
In In Proceedings of the International Conference on Information Systems
(ICIS 2005), Las Vegas, pages 181–193, 2005.
[10] Paul Dourish and Victoria Bellotti. Awareness and coordination in shared
workspaces. In Proceedings of the 1992 ACM conference on Computer-
supported cooperative work, CSCW ’92, pages 107–114, New York, NY,
USA, 1992. ACM.
[11] Mica R. Endsley. Toward a theory of situation awareness in dynamic
systems. Human Factors: The Journal of the Human Factors and Er-
gonomics Society, 37:32–64(33), March 1995.
[12] Jerry Z. Gao, Cris Chen, Yasufumi Toyoshima, and David K. Leung.
Engineering on the internet for global software production. Computer,
32(5):38–47, May 1999.
[13] Giampaolo Garzarelli and Roberto Galoppini. Capability coordination in
modular organization: Voluntary fs/oss production and the case of debian
gnu/linux. Industrial Organization 0312005, EconWPA, December 2003.
[14] D. M. German. Decentralized open source global software development,
the gnome experience. Journal of Software Process: Improvement and
Practice, 8(4):201–215, 2004.
[15] J.M. Gonzales-Barahona, J.S. Pascual, D.M. Jimenez, and G. Robles.
Introduction to Free Software. Universitat Oberta de Catalunya, 2009.
[16] M.T. Hansen and H. Baggesen. From cmmi and isolation to scrum, agile,
lean and collaboration. In Agile Conference, 2009. AGILE ’09., pages 283
–288, aug. 2009.
[17] Ahmed E. Hassan. The road ahead for mining software repositories. Fron-
tiers of Software Maintenance, 2008. FoSM 2008, pages 48–57.
[18] James D. Herbsleb. Global software engineering: The future of socio-
technical coordination. In 2007 Future of Software Engineering, FOSE
’07, pages 188–198, Washington, DC, USA, 2007. IEEE Computer Society.
[19] James D. Herbsleb, Audris Mockus, Thomas A. Finholt, and Rebecca E.
Grinter. An empirical study of global software development: distance and
146
BIBLIOGRAPHY
speed. In Proceedings of the 23rd International Conference on Software
Engineering, ICSE ’01, pages 81–90, Washington, DC, USA, 2001. IEEE
Computer Society.
[20] James D. Herbsleb and Deependra Moitra. Global software development.
IEEE Software, pages 16–20, 1999.
[21] G. Hofstede, G.J. Hofstede, and M. Minkov. Cultures and Organi-
zations: Software of the Mind, Third Edition. McGraw-Hill Compa-
nies,Incorporated, 2010.
[22] Gert Jan Hofstede Michael Minkov Hofstede, Geert. Cultures and Or-
ganizations: Software of the Mind. McGraw-Hill Publishing Company,
2010.
[23] E. Hossain, M.A. Babar, and Hye young Paik. Using scrum in global
software development: A systematic literature review. In Global Software
Engineering, 2009. ICGSE 2009. Fourth IEEE International Conference
on, pages 175 –184, july 2009.
[24] I. Keivanloo, C. Forbes, A. Hmood, M. Erfani, C. Neal, G. Peristerakis,
and J. Rilling. A Linked Data platform for mining software repositories.
Mining Software Repositories (MSR), 2012 9th IEEE Working Conference
on, pages 32–35, june 2012.
[25] Lori Kiel. Experiences in distributed development: A case study. In
Global Software Development, 2003. ICSE 2003. International Conference
on Software Engineering, pages 44 –47, may 2003.
[26] Rafael Kobylinski, Oliver Creighton, Allen H. Dutoit, and Bernd Bruegge.
Building awareness in global software engineering: Using issues as context.
In Workshop on Global Software Development, part of the International
Conference on Software Engineering (ICSE, 2002.
[27] Sang-Yong T. Lee, Hee-Woong Kim, and Sumeet Gupta. Measuring open
source software success. Omega, 37(2):426–438, April 2009.
[28] Bertrand Meyer Julian Tschannen Carlo Ghezzi Martin Nordio,
H.Christian Estler and Elisabetta Di Nitto. How do distribution and
147

BIBLIOGRAPHY
time zones affect software development? a case study on communication.
In 2011 Sixth IEEE International Conference on Global Software Engi-
neering, pages 176 –184, 2011.
[29] Robert Morgan and Frank Maurer. Maseplanner: A card-based dis-
tributed planning tool for agile teams. 2012 IEEE Seventh International
Conference on Global Software Engineering, 0:132–138, 2006.
[30] Ludovico Prattico. Governance of open source software foundations: Who
holds the power? Technology Innovation Management Review, pages 37–
42, 12/2012 2012.
[31] Ita Richardson, Valentine Casey, Fergal McCaffery, John Burton, and
Sarah Beecham. A process framework for global software engineering
teams. Information and Software Technology, 54(11):1175 – 1191, 2012.
[32] Egon Berghout Rini van Solingen. The Goal/Question/Metric Method: a
practical guide for quality improvement of software development. McGraw-
Hill Publishing Company, 1999.
[33] Gregorio Robles, Jesus M. Gonzalez-Barahona, Daniel Izquierdo-
Cortazar, and Israel Herraiz. Tools and Datasets for Mining Libre Soft-
ware Repositories, volume 1, chapter 2, page 24–42. IGI Global, Hershey,
PA, 2011.
[34] Bert Sadowski, Gaby Sadowski-Rasters, and Geert Duysters. Transition
of governance in a mature open software source community: Evidence
from the debian case. Technical report, 2007.
[35] Sundeep Sahay. Global software alliances: the challenge of ’standardiza-
tion’. Scandinavian Journal of Information Systems, 15:3–21, 2003.
[36] R. Sangwan, N. Mullick, and M. Bass. Global Software Development
Handbook. Auerbach Series on Applied Software Engineering Series. Tay-
lor & Francis Group, 2007.
[37] Richard Stallman. Why Open Source misses the point of Free Software.
Viewpoints, 52(6):31–33, 2009.
148

BIBLIOGRAPHY
[38] Ljiljana Stojanovic, Felipe Ortega, Santiago Duenas, and Luis Canas-
Dıaz. Alert: Active support and real-time coordination based on event
processing in open source software development. In Software Maintenance
and Reengineering 2011 (CSMR), page 359–362, Oldenburg, Germany,
04/2011 2011. IEEE, IEEE.
[39] D.A. Tamburri. Going global with agile service networks. In Software
Engineering (ICSE), 2012 34th International Conference on, pages 1475
–1478, june 2012.
[40] D.A. Tamburri, I.S. Razo-Zapata, H. Fernandez, and C. Tedeschi. Sim-
ulating awareness in global software engineering: A comparative analysis
of scrum and agile service networks. In Principles of Engineering Service
Oriented Systems (PESOS), 2012 ICSE Workshop on, pages 1 –7, june
2012.
[41] Damian A. Tamburri. Organizational social structures for software engi-
neering. ACM Computing Surveys, 46(1), 2013.
[42] Damian A. Tamburri, Patricia Lago, and Hans van Vliet. Uncover-
ing latent social communities in software development. IEEE Software,
30(1):29–36, 2013.
[43] Damian Andrew Tamburri and Patricia Lago. Supporting communica-
tion and cooperation in global software development with agile service
networks. In Proceedings of the 5th European conference on Software ar-
chitecture, ECSA’11, pages 236–243, Berlin, Heidelberg, 2011. Springer-
Verlag.
[44] G. Vonkrogh and S. Spaeth. The open source software phenomenon: Char-
acteristics that promote research. The Journal of Strategic Information
Systems, 16(3):236–253, September 2007.
[45] David A. Wheeler. Why open source software / free software (oss/fs, floss,
or foss)? look at the numbers! http://www.dwheeler.com/oss_fs_why.
html, 2007.
149