Policy Lessons from Ireland’s Latest Depression · policy lessons from ireland’s latest...
36
Policy Lessons from Ireland’s Latest Depression Karl Whelan * University College Dublin Prepared for McGill Summer School July 20, 2009 * E-mail: [email protected].
Transcript of Policy Lessons from Ireland’s Latest Depression · policy lessons from ireland’s latest...
Policy Lessonsfrom Ireland’s Latest Depression
Karl Whelan∗
University College Dublin
Prepared for McGill Summer SchoolJuly 20, 2009
∗E-mail: [email protected].
POLICY LESSONS FROM IRELAND’S LATEST DEPRESSION 1
1. Introduction
I have an interesting book on my shelves calledIreland’s Economic Success, edited by
ICTU’s Paul Sweeney and published in December 2007. It features chapters by a range
of eminent figures, with each contribution putting forward reasons why we were so suc-
cessful: Social partnership, sound management of the public finances, low corporation
tax, good education policies. An empirical economist looking for explanations for the
Celtic Tiger would find our success to be over-explained and would have to sift through
to get at the root causes of the miracle.
Of course, that was long ago and everybody is now familiar with a far different story.
Yes, things were ok for a while—back in the age of World Cups, Riverdance, Eurovision
wins and the like. But then our government recklessly overheated the economy and cre-
ated a bloated public sector. Irish people went on a credit-fueled spending binge, enabled
by reckless banks while our financial regulator stood idly by. A housing bubble that even
a child could diagnose was allowed to get out of control and house building exploded,
while the economy was allowed become wildly uncompetitive.Despite repeated warn-
ings of doom from economists on the TV, the government didn’tlisten and now we are
enduring the inevitable crash, with the cumulative fall in output making us candidates for
the only country to have two depressions since the Great Depression.1
I suspect that the grim fingerpointing material is what most people would expect my
talk here to be about. I think, however, that a fairer analysis would show that both the
wide-eyed optimism of 2007 and the recrimination fueled hindsight of 2009 contain some
truths, some half-truths, and some falsehoods. Blamestoming sessions can be cathartic
but learning usefully from our mistakes will require a careful assessment of both what
has gone right in the past, as well as what has gone wrong lately.
In this paper, I’m going to provide a selective review of Ireland’s economic perfor-
mance of the last 20 years, from the early days of the Celtic Tiger, through to the housing
boom and the recent slump, and then attempt to draw a few lessons from the period.
In looking at the appalling situation that the current government is in, it is easy to be
sympathetic. After all, there are few that can claim to have predicted a global financial
1Ahearne, Kydland, and Wynne (2006) define a Depression as requiring a cumulative drop in outputrelative to trend of at least 20 percent with 15 percent of thedecline occurring in the first decade. Onecan argue with whether the 1970s and 1980s in Ireland really corresponded to a depression. However, outcurrent episode, with its double-digit peak to trough decline in output, fits with many definitions.
2 POLICY LESSONS FROM IRELAND’S LATEST DEPRESSION
meltdown and recession on the scale that has occurred. And since Ireland is a small open
economy, we would almost surely be in recession today no matter what actions had been
taken by our governments in recent years. However, I would argue, based on a range of
observations, that a substantial slowdown was looming for Ireland by 2007, independent
of what was going to happen in the global economy, and much of this evidence was ig-
nored in the implementation of economic policy. The result was a range of policies based
on an unwarranted over-optimism which left Ireland terribly exposed to the international
downturn. That said, I also want to emphasise that some of thecriticisms that are widely
aired have little merit.
2. The Good Times: 1987-2000
One of the things that makes the current period of soaring unemployment and crisis in the
public finances so depressing is most of us have been here before and it wasn’t much fun
the first time. By the late 1980s, Ireland’s economy was in crisis with unemployment of
17% and a public finance problem that appeared out of control.However, at a time when
few had much hope for us, something remarkable happened—economic growth returned.
Slowly enough at first, and partially thwarted by world recession in the early 1990s but
by the mid-1990s Ireland appeared to have a full-scale “economic miracle” on its hands.
2.1. Initial Conditions
In truth, the Celtic Tiger was perhaps less miraculous than itlooked. My favourite discus-
sion of this period in Ireland’s modern economic growth is Patrick Honohan and Brendan
Walsh’s excellent 2002 paper “Catching up with the Leaders: The Irish Hare.” Honohan
and Walsh pointed out that by the mid-1970s, Ireland had manyof the policies in place
that could work together with our native economic advantages to foster strong economic
growth. Policies such as obtaining EU membership, focusingon industrial policies based
on attracting foreign direct investment with low corporatetax rates, and the increased rate
of investment in second and third-level education were primed to work with our natural
advantages such as our proximity to Europe, the English language and our long-standing
links with the United States which was a key provider of FDI. However, a decade of poor
fiscal and monetary policies had failed to provide the necessary stability for these factors
POLICY LESSONS FROM IRELAND’S LATEST DEPRESSION 3
to deliver the expected economic growth.
When the late 1980s saw Ireland stabilise its precarious fiscal situation—thanks in
large part to a short, but crucial, period of cross-party consensus—the Irish economy was
finally ready for growth. As Honohan and Walsh put it “inappropriate fiscal and perhaps
monetary policies held Ireland back in earlier years, with the result that convergence,
when it occurred, was telescoped into a short period.” Luck also played a factor, as
Ireland’s commitment to the EU began to pay off more than could have been expected.
The fiscal stabilisation took place against a background of other positive factors such as
the introduction of EU structural funds for poorer member states, the strengthening of the
internal market and, during the 1990s, a return to stable monetary arrangements leading
to Ireland’s participation in the Euro.
Figure 1 provides a description of the factors contributingto Irish economic growth
from 1985 onwards. The figure is based on the following simpledecomposition:
GDP = Pop ∗
Emp
Pop∗
GDP
Emp
GDP growth can be broken into a part due to higher population,a part due to having
a higher fraction of the population at work, and a part due to getting more output from
the average worker. All three of these factors contributed over time to Ireland’s boom
but there are interesting stories to be teased out of how these contributions changed over
time.
2.2. Employment and Productivity
By the early 1990s then, Ireland had an enormous capacity to grow far faster than it had
been doing. Perhaps the clearest way to illustrate how much room Ireland had to grow is
to show how underemployed its people were. In 1989, only 31% of Ireland’s population
was at work, the lowest in the OECD and fifteen percentage points below either the UK or
the US (see Figure 2). To understand the factors contributing to Irish underemployment,
consider another decomposition:
Emp
Pop=
WorkingAge
Pop∗
Lforce
WorkingAge∗
Emp
LForce
4 POLICY LESSONS FROM IRELAND’S LATEST DEPRESSION
Ireland’s underemployment partly reflected its exceptionally high unemployment rate.
However, it also reflected demographic factors. Ireland’s baby boom occurred in the
1970s and peaked in 1980, so the depressed Ireland of the 1980s was supporting a very
large population below working age. This demographic factor gradually unwound over
time so that by the late 1990s, Ireland had higher fraction ofthe working age population
than either the US or the UK (see Figure 3). Ireland in the late1980s also had a very low
rate of labour force participation: While female labour force participation had increased
steadily in other countries throughout the 1960s and 1970s,the increase in Ireland did not
occur until the 1980s and still left Ireland far behind (see Figure 4). However, when the
economy recovered, there was a large female labour supply ready to enter the workforce.
With good fundamental policies in place, the combination ofmacroeconomic stability
and a starting point of severe underemployment meant that the Irish economy became an
incredible employment creating machine. Employment rose steadily from 1.1 million in
the late 1980s to 2.1 million in 2007.
In most other countries in the world, the employment growth rates generated by the
Celtic Tiger would have soon enough lead to low rates of unemployment, which would
have provoked rapid wage growth and cut off the boom. However, in Ireland in the
1990s, the job creation machine only gradually outpaced theenormous increases in labour
supply stemming from young workers entering the labour force, increased labour force
participation and, by the mid-1990s a reversing of the traditional net migration outflow
as Irish people abroad began taking jobs at home (note the upturn in the contribution to
economic growth of increases in population starting in the mid-1990s). As a result, for
most of the 1990s, the average unemployment rate remained quite high, remaining as high
as 10.4% as late as 1997. Only by the year 2000 had the boom generated enough jobs for
the economy to reach effective “full employment” with the measured unemployment rate
reaching 4.3% (see Figure 5).
In addition to getting more people employed at an a rapid pace, the 1990s saw the a
strong productivity performance. Productivity growth averaged just under 3 percent per
annum during the 1990s. However, as Honohan and Walsh (2002)emphasised, this was a
highly positive but not miraculous productivity performance, falling short of other well-
known economic miracles such as East Asia. Furthermore, Ireland went into the Celtic
Tiger period with living standards that were well short of those in the rest of Europe and
POLICY LESSONS FROM IRELAND’S LATEST DEPRESSION 5
some amount of “catching up” would have been expected.
The exceptional capacity for growth unleashed during the 1990s had profound impli-
cations for Irish fiscal policy. After stepping away from thebrink of a debt disaster in
1987, rapid economic growth allowed successive governments to achieve the fiscal holy
grail of cutting taxes, raising spending and also achievingsubstantial reductions in the
debt-GDP ratio.
3. The Housing Boom and the Inevitability of Slowdown
By the start of the new millennium, there was every reason to expect that the Celtic Tiger
period was coming to an end. The unemployment rate was extremely low by international
standards, GDP per capita had caught up with the EU average (see Figure 6) and the
employment to population ratio was only just below the levels recorded in the US and
UK. While there was still some limited additional growth potential left from demographic
factors such as young workers coming into the labour force and a still somewhat low level
of female labor force participation, these factors would only be capable of providing a
more limited boost to future growth. Surveying the data up to2001, Honohan and Walsh
(2002) believed the “exceptional growth spurt” had come to an end and they worried
about the more difficult times ahead “with most of the potential for catch-up exhausted.”
They were right of course. It had to end. And it did. But it took longer than almost
anyone could have imagined.
3.1. The Housing Boom
By 2000, Irish people had far higher incomes than they had beenduring the 1980s. How-
ever, income is not wealth and there are a number of aspects ofthe economy that still
reflected our poorer past. Public infrastructure such as roads and public transport were
poor by international standards and the current decade saw asubstantial program of pub-
lic investment.
More importantly, however, even by the early part of this decade, Ireland still had a
relatively small housing stock, the smallest stock per capita in the European Union.2 Our
2See Somerville, 2007.
6 POLICY LESSONS FROM IRELAND’S LATEST DEPRESSION
higher incomes and lower unemployment rates were bound to lead to smaller average
household sizes, as younger people started to be in a position to buy their own homes at
a younger age.
The result was an extraordinary construction boom. The total stock of dwellings—
which had stood at 1.2 million homes in 1991 and had graduallyincreased to 1.4 million
homes in 2000—exploded to 1.9 million homes in 2008. As housecompletions went from
19,000 in 1990 to 50,000 in 2000 to a whopping 93,000 in 2006, construction became a
dominant factor in the Irish economy. With the economy already at full employment,
much of the labour employed in the construction boom came from the new EU member
states in Eastern Europe, and the inward migration further fueled demand for housing. By
2007, construction accounted for 13.3 percent of all employment, the highest share in the
OECD. Indeed, with the exception of Spain and Portugal, Ireland’s share of construction
employment exceeded all other OECD member states by almost five percentage points.
This extreme concentration of the economy in the construction sector is something
that marks Ireland’s housing boom out from other recent familiar examples such as the
house price booms in the UK and the US, where the share of employment accounted for
by construction stayed below eight percent. The construction boom ensured that Ireland’s
unemployment rate remained at around 4 percent until 2008 and and the tight labour
market associated with this low rate of unemployment naturally triggered high rates of
wage growth througout this period. The economy’s loss of competitiveness at this time
and the weakening in the performance of the traded sector hasoften been commented on.
However, the loss of competitiveness and consequent crowding out of the tradable sector
is perhaps best seen a consequence of the housing boom ratherthan an independent event
triggered by greedy workers or trade unions.3
One might have expected the huge increase in the supply of housing to have cooled
off house prices. Most likely, if the economy hadn’t had the substantial supply response,
3It is common now to argue that social partnership was very constructive in the late 1980s and allthrough the 1990s and that it helped to keep wage growth restrained and the economy competitive but thatduring the later years the process was responsible for undoing all this good work, leading to uncompetitivewages. I suspect that both the positives and negative sides of this story are overstated. It is likely that socialpartnership contributed to wage moderation in its earlier days. However, it should also be rememberedthat these social partnership deals took place against a background of high unemployment rates while thelater deals took place during an era when the labour market was continually overheated. Market forcesrather than social cohesion were the most likely factor underlying the wage restraint of the earlier era andits absence in later years.
POLICY LESSONS FROM IRELAND’S LATEST DEPRESSION 7
house prices would have gone higher. However, the supply response was still not able to
keep up with the growing demand and the increase in ability topay generated by income
tax cuts and the low interest rates regime that came with our membership of the Euro.
The result was an astonishing combination of rising house prices and an increasingly
construction-dependent economy. Figure 7 shows that the rise in house prices far out-
stripped the increase seen in the US that were widely seen as remarkable: While US
house prices doubled between 1996 and 2006, Irish house prices quadrupled over the
period 1996-2007.
An obvious reaction to Figure 7 is to declare that it was patently obvious that Irish
house prices were driven by a speculative bubble. However, it’s not quite so simple.
Comparisons with the US need to account for the huge increase in disposable income
for Irish households, which far outstripped anything that occurred in other countries with
housing booms. One way to see control for this is to graph the average house price relative
to per capital disposable income. Figure 8 does this by graphing house prices relative to
the average disposable income per person aged over 15.
Perhaps surprisingly, during the first ten years of the CelticTiger, house prices only
rose in line with increases in disposable income and the ratio of prices to income remained
at a relatively low level. However, over the period 1997-2007 this ratio rose above any
levels seen previously. This on its own isn’t necessarily a sign that prices had lost links
with reality because interest rates shifted to a lower average level than prevailed prior
to EMU making housing more affordable. However, almost every careful analysis did
suggest that by 2006-2007, Irish house prices were significantly over-valued, perhaps by
as much as 30 percent.4
3.2. The Slowdown was Coming
My reason for documenting the evidence on Ireland’s economic performance up to 2007
is to make one simple point: Any reasonable analysis of the economic circumstances in
early 2007 would have suggested that a substantial economicslowdown was imminent.
• The factors underlying the long expansion in our employment-population ratio had
run out. Labour force participation rates had reached the high levels that had been
4See, for instance, McQuinn and O’Reilly (2006).
8 POLICY LESSONS FROM IRELAND’S LATEST DEPRESSION
sustained by the UK and US and further growth was unlikely.5 Unemployment
could hardly go lower.
• Demographic factors, often cited as a positive underlying factor for growth in Ire-
land, were no longer working in our favour. In fact, the CSO were projecting that
the share of the population that was of working age had peakedand was set to fall.
• The composition of recent growth had fundamentally changed: Figure 1 shows that
productivity growth had slacked off during the later construction-dominated years
of the boom, as the room for catch-up growth fell off (see Figure 6). Indeed, pop-
ulation growth driven by immigration had become the key factor driving growth.
These patterns were not consistent with sustaining a high growth rate.
• Both house prices and the level of construction activity wereunsustainable. With
house prices very likely to fall, much of the development andconstruction business
was going to become unprofitable leading to the sector shrinking. The economy
was going to have to be re-oriented away from construction and such economic
re-organisations are rarely easy to undertake quickly.
The landing was almost certainly going to be bumpy. Underlying economic growth
in most other countries in the EU had been in the region of 2 percent per annum (see
McQuinn and Whelan, 2008) and we had largely run out of room in relation to those
factors that would let us grow faster than comparable economies.
However, despite this economic background, our leading political party, Fianna Fail,
was re-elected to government in 2007 on the basis of an election manifesto whose under-
lying assumption was that growth over the following five years would average 4.5% per
year. And rather than challenge these assumptions, our opposition political parties largely
agreed with this assessment.
This endemic over-optimism was, I believe, the fundamentalsource of a range of
different policy mistakes which left Ireland badly placed for coping with the economic
slowdown to come. Then we had a global financial crisis and themost severe global
recession since the Great Depression.
5According the the OECD’s Social Indicators report, Ireland’s employment to population ratio for fe-males, at 60.4% is exactly equal to the OECD average. However, most of the countries with higher ratios,such as the Scandinavian countries, differ from Ireland in providing substantial state supports, such aslow-cost childcare, to enable high rates of female labour force participation.
POLICY LESSONS FROM IRELAND’S LATEST DEPRESSION 9
4. Consequences of Over-Optimism
The over-optimism about economic growth that prevailed during the period leading up to
2007 was responsible for a number of serious policy errors. Here I’ll discuss fiscal policy
first and then banking and credit policy.
4.1. Fiscal Policy
The long boom that preceeded 2008 had allowed successive Irish governments a freedom
from the normal fiscal constraints faced by governments around the world. There were
sizable increases in public expenditure, income tax rates were cut and yet the debt-GDP
ratio had gradually tumbled to one of the lowest in Europe. However, by the later years
of the boom, fiscal policy as well as the rest of the economy hadbecome distorted by the
housing boom.
While tax revenues had continued to rise throughout the boom,Figure 9 shows that
composition of these revenues had substantially changed. Income tax rates, which had
been very high in the 1980s, were repeatedly cut. The substantial increases in income
meant that the income tax take still rose every year but income taxes as a share of GNP fell
from 20 percent in 1988 to around 13 percent in the later yearsof the boom. In addition
to rate cuts, exemption points were raised to a level that took significant numbers out of
the tax net altogether. The result was that the income tax burden that was exceptionally
light, particularly for those on low to middle incomes. Table 1 uses calculations from
the OECD publication,Taxing Wages to illustrate how light the income tax burden had
become by 2007. For example, the combined PAYE and PRSI average tax rate for a
single earning married couple with two children, taking home the average wage, was
6.7 percent in Ireland, compared with an EU-15 average of 23.7 percent and an OECD
average of 21.1 percent.6
Despite this erosion of the income tax base, the Irish government’s coffers remained
buoyant due to revenue earned from other sources. In particular, the construction boom
generated huge tax revenues in the form of stamp duty, capital gains taxes and VAT.
6If one subtracts off government transfers such as child benefits, the single earner average-wage familyhave a negative net contribution to the state of -33%. Admittedly, however, making comparisons of thisfigure with other countries is made complicated by the extentof free childcare and other state supportsprovided to families in other European countries.
10 POLICY LESSONS FROM IRELAND’S LATEST DEPRESSION
Figure 9 shows that as income taxes (PAYE and PRSI) declined from 48 percent of tax
revenues in 1988 to 36 percent in 2006, revenues from stamp duty and capital gains rose
from 2 percent of tax revenues to 12 percent over the corresponding period.
Because these tax revenues were dependent on activity in the housing market which
had reached extraordinary levels by international standards, it was as clear in 2007 as it
is now, that the government could not continue to rely on housing-related tax revenues.
However, it appears that policy was based upon the assumption that the housing market,
and by implication the rest of the economy, would glide towards the now-infamous soft
landing. The government seems to have been expecting the huge revenues from the hous-
ing boom to disappear only gradually, with strong growth allowing other sources of tax
revenues to be found to replace them.
From today’s perspective, the soft landing scenario now seems faintly ludicrous but
it is less so if one remembers that there was cross-party agreement that the economy
would continue to grow at somewhere in the four to five percentrange. If the economy
could continue to grow at that pace, with nominal incomes perhaps growing between
seven and eight percent per year, then it seemed possible that even if house prices were
as over-valued as economic models had suggested, that the over-valuation could have
been worked off slowly over time without requiring a declinein nominal house prices.
Indeed, a similar pattern had already occurred during 2000-2001 when the government
had introduced various measures to cool the housing market,after the first Bacon report:
Economic models showed the market to be substantially over-valued at the start of this
period, with most of this over-valuation being worked off bya period of flat prices.
Pulling off a second soft landing was always going to be tricky and the evidence
suggests that perhaps it was not going to be achieved. House prices peaked in early
2007, before the international financial crisis had gotten going. However, by late 2007,
the US economy was in recession and by 2008 the world economy was in the midst of
the greatest economic and financial crisis since the 1930s. By2007, Irish house prices
could only be rationalised on the basis of exceptionally optimistic future growth rates.
Once this positive outcome failed to materialise, house prices were set for a large drop.
With nominal house prices falling, potential home buyers had little incentive to buy and
the housing market came to what Brian Lenhihan, the incoming Minister for Finance,
accurately referred to in June 2008 as “a shuddering halt.”
POLICY LESSONS FROM IRELAND’S LATEST DEPRESSION 11
The implications for our budgetary situation were profound. Tax revenues, which had
been running somewhat ahead of expenditures for a number of years, suddenly slumped
far behind: Total government revenue declined from 68 billion in 2007 to a projected 60
billion this year as revenues from stamps and capital gains dropped from 6.3 billion to a
projected 1.6 billion (see Figure 10) These figures underestimate the effect of the housing
sector collapse on tax revenues since the sector contributed further direct revenues in
the form of VAT as well as the income taxes from construction employment, which has
collapsed from 270,000 in early 2007 to 184,000 in 2009:Q1, and likely has further to
fall. The associated increase in unemployment has necessitated a substantial increase in
spending, with transfers rising from 18.7 billion in 2007 toa projected 23.5 billion this
year. Within the space of two years, the budget went from being in surplus to having a
deficit in the region of 20 billion.
We will never know how badly the Irish fiscal situation would have deteriorated with-
out the world recession. However, it can plausibly be arguedthat an abrupt weakening
was going to follow any decline in house prices and this eventpreceded the global cri-
sis. What we can say for sure is that the over-optimism that pervaded economic policy
making in Ireland in the years up to 2007 left the economy in a very percarious position.
4.2. Banking and Credit Policy
The other key aspect of Ireland’s current economic problemsis the banking crisis. It is
undeniable now that in Ireland, as with elsewhere, there were substantial financial regu-
latory failures. However, we should be wary of false equivalences between the banking
collapse in Ireland and events elsewhere.
For example, it is now commonplace to argue that the emergence of complicated
financial instruments and their lack of regulation played a key role in the international fi-
nancial crisis. In Ireland, however, despite the presence of a large number of international
financial firms in the IFSC carrying out various intricate financial operations, complicated
financial instruments have played little or no part in our banking crisis.
Lax mortgage lending is also commonly cited as a cause of our banking crisis, with
practices such as 100 percent loan-to-value mortgages and subprime lending often raised.
However, subprime lending was negligible in Ireland. And while loose mortgage criteria
may have played an important role in fueling the boom in houseprices (high multiples be-
12 POLICY LESSONS FROM IRELAND’S LATEST DEPRESSION
ing far more important than low-equity loans) it is also important to recognise that losses
on mortgage defaults have not been the problem that has brought down the Irish banks.
Mortgages are usually the last type of debt that people will default on, and though these
losses will be significant over the next few years, the Irish banks were almost certainly
well enough capitalised to have dealt with these losses.
Rather than mortgages or complex financial instruments, the demise of the Irish banks
stemmed from their loans to property developers. The value of Irish houses is down
significantly from their peak level; with housing activity at minimal levels, the value of
much of the speculative development land bought near the peak is now close to zero.
A common criticism of international financial regulation has been the weakness of the
Basle framework for banking supervision. International regulators spent years developing
the Basle 2 framework, with its emphasis on more sophisticated capital adequacy rules
to ensure that banks had appropriate capital cushions to absorb losses on bad loans. It is
now widely accepted, however, that these new rules would have done little to prevent the
global financial crisis (and in fact may have contributed to making it worse.) In the case
of the Irish banks, it appears that regulators and other monitors such as the IMF paid too
much attention to capital adequacy. For example, the 2007 IMF Article 4 report has a
heading summarising the position of the banking sector as “Banks Have Large Exposures
to Property, But Big Cushions Too” which was consistent with thewidespread belief that
the highly profitable Irish banks were going to be safe even ifthe economy hit a serious
downturn.
The focus on capital adequacy, Pillar One, of the Basle framework, appears to have
come at the expense of a lack of emphasis on the second pillar,which relates to the
supervisory process. It’s worth quoting the Basle 2 documentat length on the issue of
“credit concentration risk” (see pages 179-180 of the PDF file):
770. A risk concentration is any single exposure or group of exposures with
the potential to produce losses large enough (relative to a bank’s capital, total
assets, or overall risk level) to threaten a bank’s health orability to maintain
its core operations. Risk concentrations are arguably the single most impor-
tant cause of major problems in banks.
772. Credit risk concentrations, by their nature, are based on common or
correlated risk factors, which, in times of stress, have an adverse effect on
POLICY LESSONS FROM IRELAND’S LATEST DEPRESSION 13
the creditworthiness of each of the individual counterparties making up the
concentration. Such concentrations are not addressed in the Pillar 1 capital
charge for credit risk.
777. In the course of their activities, supervisors should assess the extent
of a bank’s credit risk concentrations, how they are managed, and the extent
to which the bank considers them in its internal assessment of capital ade-
quacy under Pillar 2. Such assessments should include reviews of the results
of a bank’s stress tests. Supervisors should take appropriate actions where
the risks arising from a bank’s credit risk concentrations are not adequately
addressed by the bank.
Translation: Rules about capital adequacy hardly matter if you let banks concentrate a lot
of lending in a single risk area.
The failures in Irish banking regulation thus did not relateto financial innovations or
regulatory arbitrage but to a failure to enforce the Basle recommendations about supervi-
sory oversight of credit concentration risk. With the widespread belief that the housing
market was heading for a soft landing, insufficient attention was paid to the extreme
concentration of property development risk that could cause huge losses. And since the
development loans that are causing the most problems for thebanks are the substantial
quantity that were lent out during the final years of the boom,an intervention even as
late as 2005 to cool development lending could have prevented the upcoming meltdown.
Given the likely cost to the Irish taxpayer stemming from thebanking crisis, we can only
hope that the simplicity of this lesson isn’t lost amid the various complicated debates in
the coming years about principles-versus-rules and regulating complex instruments.
Of course, when thinking about future financial regulation,we also need to careful
about fighting the last war. For example, stung by a serious ofhigh-profile scams ripping
off Irish consumers, the Irish Financial Regulator devoted large amounts of resources to
consumer protection and regulation, when we know that a stricter focus on prudential
regulation would have been more helpful.
Financial regulation should and will be tighter in future. However, just because an
over-concentration of property development loans was the problem this time doesn’t
mean that it will be the problem next time; in fact, it almost certainly won’t be. I suspect
that general but simple rules such as strict limits on creditgrowth at individual banks may
14 POLICY LESSONS FROM IRELAND’S LATEST DEPRESSION
end up working better than capital adequcy rules in protecting the financial system from
future unforseen sources of risk.
5. Some Myths
The previous discussion has made clear that serious errors were made in the formulation
of Irish economic policy in recent years. Over-optimism about the growth capacity of
the economy affected key decisions about fiscal and financialregulatory policies and left
Ireland in a poor position to deal with a global economic slowdown. However, I noted
above that popular discussion of the boom and subsequent bust regularly overstate or
misrepresent the roles played by other factors. Here I’ll focus on two.
5.1. The Bloated Public Sector?
A staple talking point in the Irish media these days is that the Celtic Tiger was ruined
by the government’s decision to create an enormous public sector. The “bloated public
sector” as it is now known caused the economy to become uncompetitive and is now the
key source of our fiscal problems.
In truth, I think this characterisation is somewhat misleading. Consider, for instance,
Figure 11, which shows the share of non-interest public spending in GDP. For most of the
Celtic Tiger period, the share of public spending declined and by 2000 was well below
the European average. The share moved up somewhat up until 2007. The last datapoint
in the chart is for 2008 and by this time falling GDP and increasing welfare costs caused
the ratio to jump and it is projected to increase further thisyear as well.
This series includes government spending on transfers, capital programs and other
items. However, the focus in public discussions of our bloated public sector tend to be
on the number of public sector employees and their pay. Perhaps surprisingly, Figure
12 shows that the share of GDP spent on public sector pay and pensions in Ireland has
consistently remained below the EU15 average. It is certainly true of course that public
sector employment has increased substantially. But, as was discussed above, employment
in the private sector of the Irish economy also increased substantially. In fact, the public
sector’s share of total employment in Ireland has declined significantly in Ireland over the
past 20 years (see the left panel of Figure 13). Also, despitethe common focus on the
POLICY LESSONS FROM IRELAND’S LATEST DEPRESSION 15
bloated and bureaucratic nature of the public sector, the right panel of Figure 13 shows
that the share of public sector employment accounted for by administration has barely
changed over the past 20 years.
Note that I am not arguing here that there is no room or need to cut public expenditure
or that there is no waste in public spending. The substantialloss in output from this
recession is such that maintaining previous levels of public spending would likely see us
shoot beyond European levels of spending relative to GDP, with clear implications for
taxation.
In addition, the argument that thesize of our public sector is standard says nothing
about thequality of what it provides and it is hard to escape the feeling that the substantial
increases in public sector spending have not delivered as much as we might have hoped.
There can be little doubt that the boom-era environment in which recent public spending
decisions were made did not lend itself to extracting efficiency improvements from the
public sector. Countries where public spending can only growby 2 percent per year are
effectively operating under mini-Board-Snip conditions atall times: Since new spending
initatives often have to displace old ones under such condition, this keeps pressure on
program managers to deliver in an efficient pattern. There isrobust evidence that Irish
public sector employees earn a substantial premium over their private sector counterparts,
suggesting room for savings there also.
So, without doubt, there is some room to cut Irish public spending in ways that min-
imise delivery of services and the recent report of An Bord Snip will prove invaluable in
highlighting the areas requiring cuts. However, by most of the usual metrics, the char-
acterisation of policy prior to 2008 as producing an outsized public sector doesn’t quite
fit the facts. And once the lower-hanging fruits such as the proliferation of new agencies
introduced in recent years with weak justifications and the elimination of various restric-
tive public sector practices, it is likely that further reductions in public expenditure will
involve serious cuts in the delivery of popular public services.
5.2. The Credit Binge?
Those familiar with TV documentaries about the Irish economy will recall these programs
usually feature a segment in which we are informed that reckless Irish consumers went on
an unprecedented spending binge fuelled by cheap credit (commentary usually intoned
16 POLICY LESSONS FROM IRELAND’S LATEST DEPRESSION
over pictures of frenzied shoppers at Dundrum Town Centre on aSaturday afternoon.)
According to these accounts, the current slump is just the inevitable hangover from this
period of irresponsibility.
In truth, there is little merit in this theory. Those who propose it usually focus on
statistics for debt (drowning in it we usually are). However, it is generally misleading
to just focus on statistics for debt without looking at the other side of the balance sheet,
i.e. looking at household assets. The evidence shows that, while the boom period saw a
substantial build-up in Irish household debt, it also saw aneven bigger increase in assets.
A recent Central Bank article by Mary Cussen, John Kelly and Gillian Phelan shows that
household net worth (assets minus liabilities) rose from 640% of net disposable income
in 2002 to a peak of 800% in 2006.
This substantial increase in the value of assets was, of course, mainly due to increases
in the value of the Irish housing stock. However, it is worth noting that Irish households
maintained moderate savings rates during this period and these savings also contributed to
asset accumulation. For instance, during the booming period 2002-2005, Irish consumers
saved a relatively healthy six to seven percent of their disposable income: See Figure 14.
So rather than behaving irresponsibly, Irish households continued to save and despite the
increased levels of debt, their net worth increased considerably.7
None of this is to say that all was perfect with the savings andinvestment decisions
of Irish households during the waning years of the Celtic Tiger. Much of the increase in
net worth has now been eroded as house prices have fallen (theCentral Bank article only
captures the start of this process as it ends at 2007) and the average figures for debt and
asset levels likely hide enormous cross-sectional variations. Older people with houses
purchased long ago saw huge increases in the valuation of their homes. Now they are
seeing these “paper wealth” gains eroded but, by and large, they did not go on spending
sprees during the boom and did not accumulate large debts. Younger people, however,
ended up purchasing assets (houses to live in) at over-valued prices and paid for them with
debt that still has to paid off. So, the composition of recentchanges in assets and debts
likely differed substantially across demographic groups and it is the younger cohorts that
are most likely to be in trouble now. But, to the best of my knowledge, we have very little
7As a general rule, I think people need to be wary of moralisticcommentators who warn that economictroubles are caused by greedy and feckless consumers. Most of the time, most of us are making the bestdecisions we can with the information available.
POLICY LESSONS FROM IRELAND’S LATEST DEPRESSION 17
data to put numbers on this story.
6. Boston versus Berlin: For Real This Time.
At this time of fiscal crisis and in light of the mistakes that it has made in the recent past,
the government is to be commended for commissioning expert advice on public spending
and taxation from An Bord Snip Nua and the Commission on Taxation. However, it is
important to remember that decisions on the balance of public spending and taxation are
political decisions. We cannot simply hope that Bord Snips and Taxation Commissions
will solve for us the difficult tradeoffs that exist between spending priorities and taxation
levels.
The famous remarks in 2000 of former Tanaiste, Mary Harney, about the choice be-
tween Boston and Berlin sparked off regular debates in Irelandabout the socio-economic
model being chosen by Ireland. In retrospect, these Boston-versus-Berlin debates now
seem somewhat false. Ireland had increasing public spending and falling taxes rates and
governments did not have to confront the long-run incompatibility of these developments.
If, as I believe likely, economic growth resumes at significantly lower average rates than
in the recent past, we will have to confront a range of difficult choices that go beyond our
current difficulties in achieving fiscal solvency.
Figure 15 shows that, even prior to the collapse in construction-related revenue, the
Celtic Tiger left Ireland with a tax take relative to GDP that is well below the European av-
erage. Such comparisons are undoubtedly odious (and difficult) given differences across
countries in the need for military spending and in the treatment of pensions. However,
my assessment of the evidence is that Ireland’s tax take is still relatively low by European
standards, even after controlling for such factors.8 After the various tax levies that were
introduced in recent months, the idea that we have no furtherroom for income tax in-
creases has gained much currency. However, the OECD calculations reported in Table 1
show that, even after accounting for the new levies, income tax rates for average families
in Ireland are still very low by international standards anda decision to keep these rates
at such low levels will have clear consequences for spendingoptions.
8Another argument is that GNP rather than GDP should be used for such comparisons. I disagree withthese arguments because all income produced in Ireland is eligible for taxation by the Irish government.
18 POLICY LESSONS FROM IRELAND’S LATEST DEPRESSION
Over the next few years, our governments will have to face up to serious tradeoffs
in dealing with expenditure and taxation issues. How they deal with them will have
fundamental implications for the type of Irish economy and society that will emerge.
7. Conclusions
If I had to offer one over-riding lesson to be learned from ourrecent economic history, it
would be that Irish economic policy should be formulated on the basis of an expectation
of relatively low sustainable growth rates, and that it is far safer to have a pessimistic bias
than an optimistic one.
If, as is projected by a number of forecasters, unemploymentrates reach the high-
teens by next year, then Ireland will again be starting from apoint of having a significantly
underemployed population. If our major macroeconomic and financial problems are dealt
with successfully in the coming years and the world economy picks up again, then this
starting point will allow room for a period of fast growth. Itwill be essential, however,
the this fast growth not be interpreted as a return of the Celtic Tiger. Analysis based on a
clear understanding of our demographic profile, labour market structures and productivity
performance are unlikely to justify such a conclusion.
References
[1] Ahearne, Alan, Finn Kydland and Mark Wynne (2006). “Ireland’s Great Depres-
sion,” Economic and Social Review, pages 215-243.
[2] Cussen, Mary, John Kelly and Gillian Phelan (2008). The Impact of Asset Price
Trends on Irish Households,Central Bank Quarterly Bulletin.
[3] Honohan, Patrick and Brendan Walsh (2002). “Catching up with the Leaders: The
Irish Hare,”Brookings Papers on Economic Activity part 1, pages 1-57.
[4] McQuinn, Kieran and Gerard O’Reilly (2006). Assessing the Role of Income and
Interest Rates in Determining House Prices, Central Bank of Ireland working paper.
[5] McQuinn, Kieran and Karl Whelan (2008). “Prospects for Growth in the Euro
Area,” CESIfo Economic Studies.
[6] Somerville, R.A. (2007). “Housing Tenure in Ireland,”Economic and Social Re-
view, pages 107-134.
[7] Sweeny, Paul (ed.) (2008).Ireland’s Economic Success.
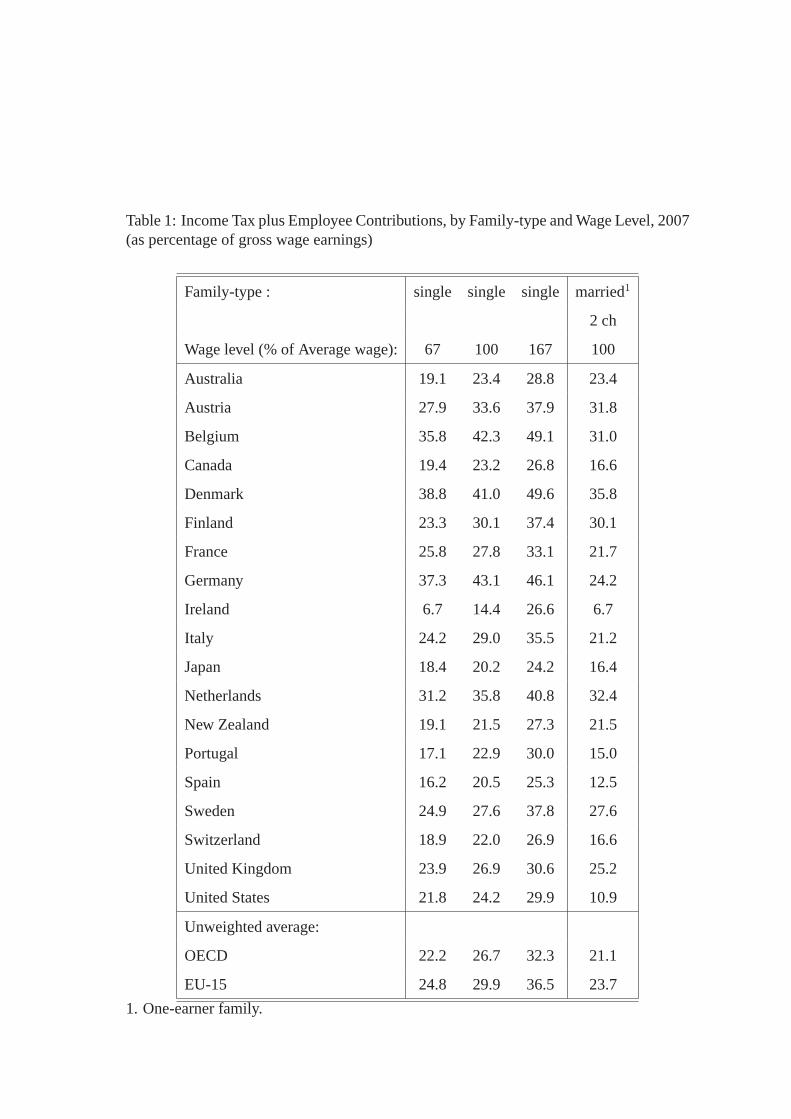
Table 1: Income Tax plus Employee Contributions, by Family-type and Wage Level, 2007(as percentage of gross wage earnings)
Family-type : single single single married1
2 ch
Wage level (% of Average wage): 67 100 167 100
Australia 19.1 23.4 28.8 23.4
Austria 27.9 33.6 37.9 31.8
Belgium 35.8 42.3 49.1 31.0
Canada 19.4 23.2 26.8 16.6
Denmark 38.8 41.0 49.6 35.8
Finland 23.3 30.1 37.4 30.1
France 25.8 27.8 33.1 21.7
Germany 37.3 43.1 46.1 24.2
Ireland 6.7 14.4 26.6 6.7
Italy 24.2 29.0 35.5 21.2
Japan 18.4 20.2 24.2 16.4
Netherlands 31.2 35.8 40.8 32.4
New Zealand 19.1 21.5 27.3 21.5
Portugal 17.1 22.9 30.0 15.0
Spain 16.2 20.5 25.3 12.5
Sweden 24.9 27.6 37.8 27.6
Switzerland 18.9 22.0 26.9 16.6
United Kingdom 23.9 26.9 30.6 25.2
United States 21.8 24.2 29.9 10.9
Unweighted average:
OECD 22.2 26.7 32.3 21.1
EU-15 24.8 29.9 36.5 23.7
1. One-earner family.
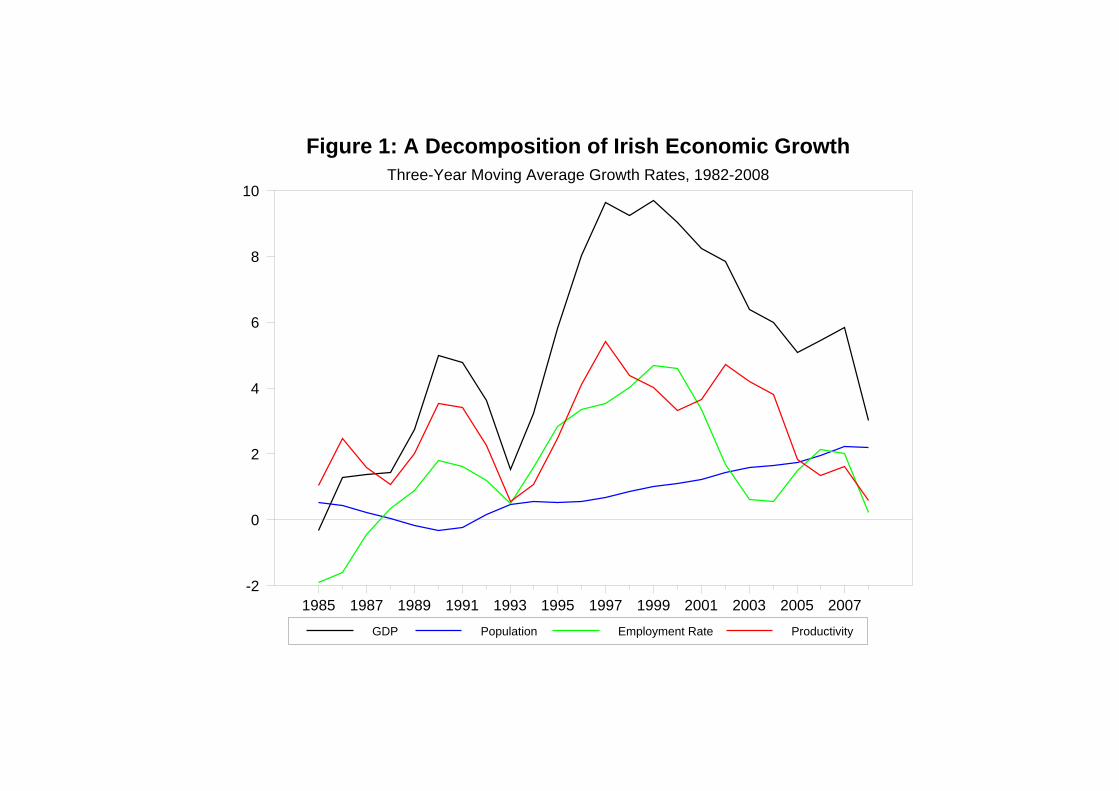
Figure 1: A Decomposition of Irish Economic GrowthThree-Year Moving Average Growth Rates, 1982-2008
GDP Population Employment Rate Productivity
1985 1987 1989 1991 1993 1995 1997 1999 2001 2003 2005 2007-2
0
2
4
6
8
10
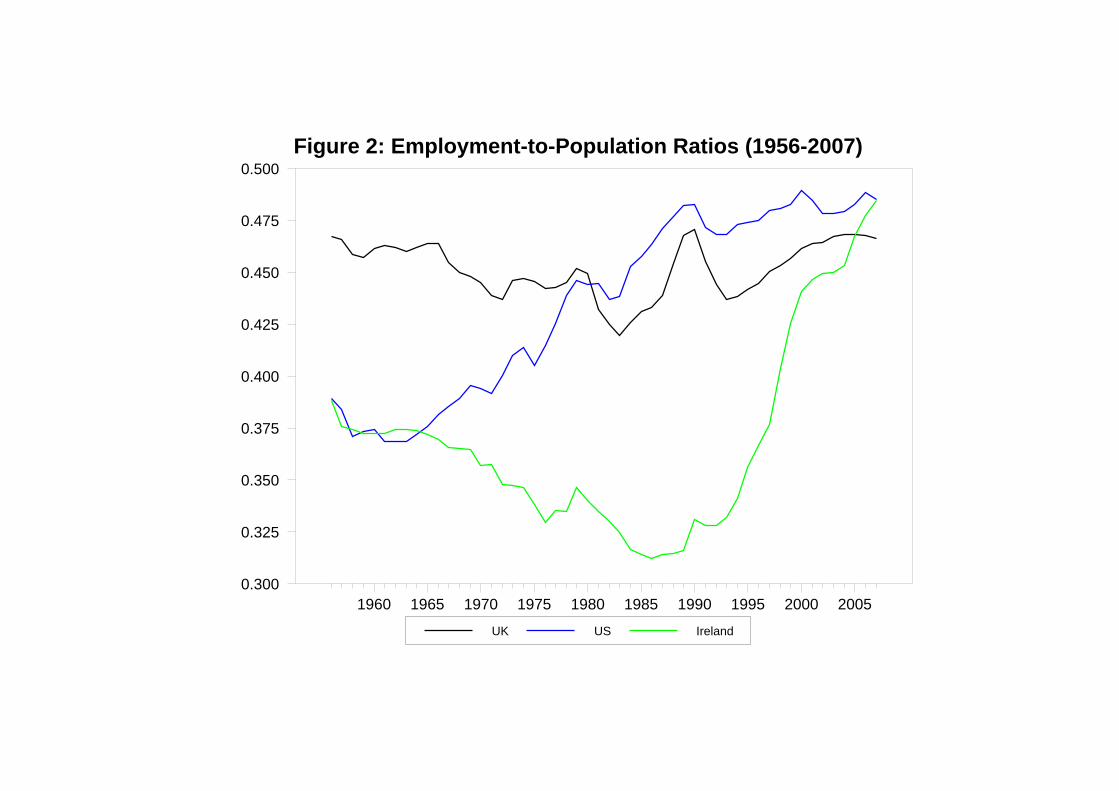
Figure 2: Employment-to-Population Ratios (1956-2007)
UK US Ireland
1960 1965 1970 1975 1980 1985 1990 1995 2000 20050.300
0.325
0.350
0.375
0.400
0.425
0.450
0.475
0.500
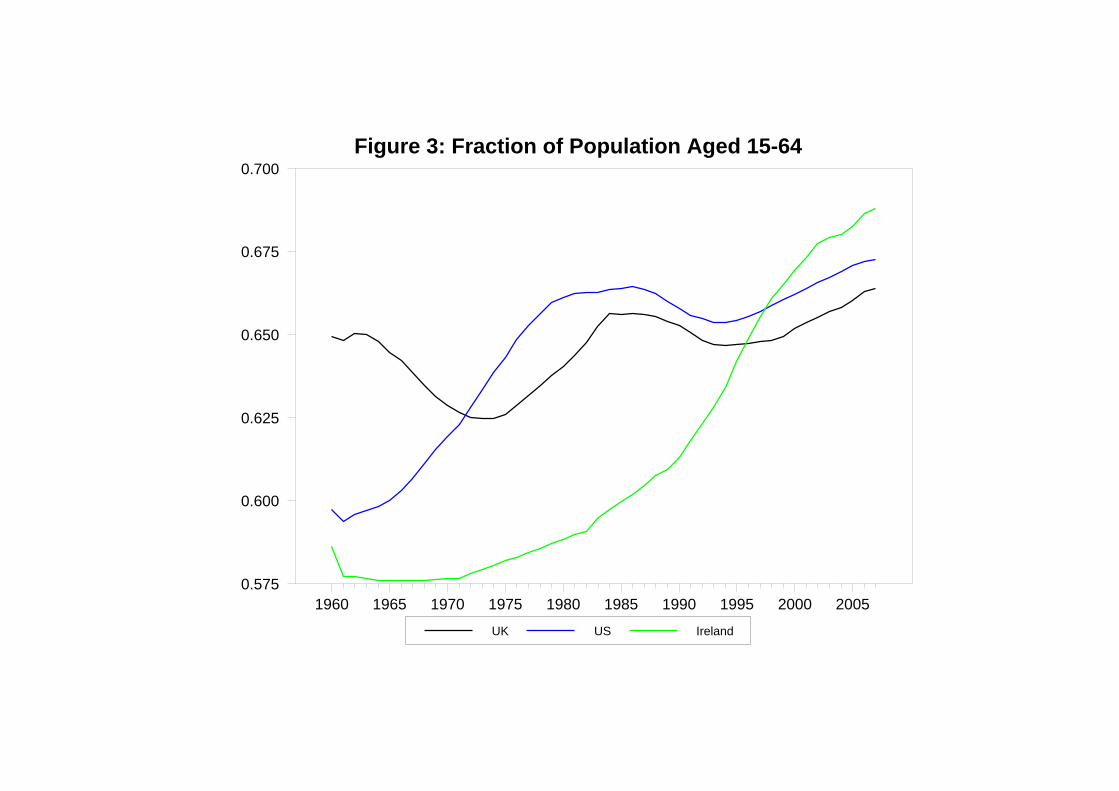
Figure 3: Fraction of Population Aged 15-64
UK US Ireland
1960 1965 1970 1975 1980 1985 1990 1995 2000 20050.575
0.600
0.625
0.650
0.675
0.700
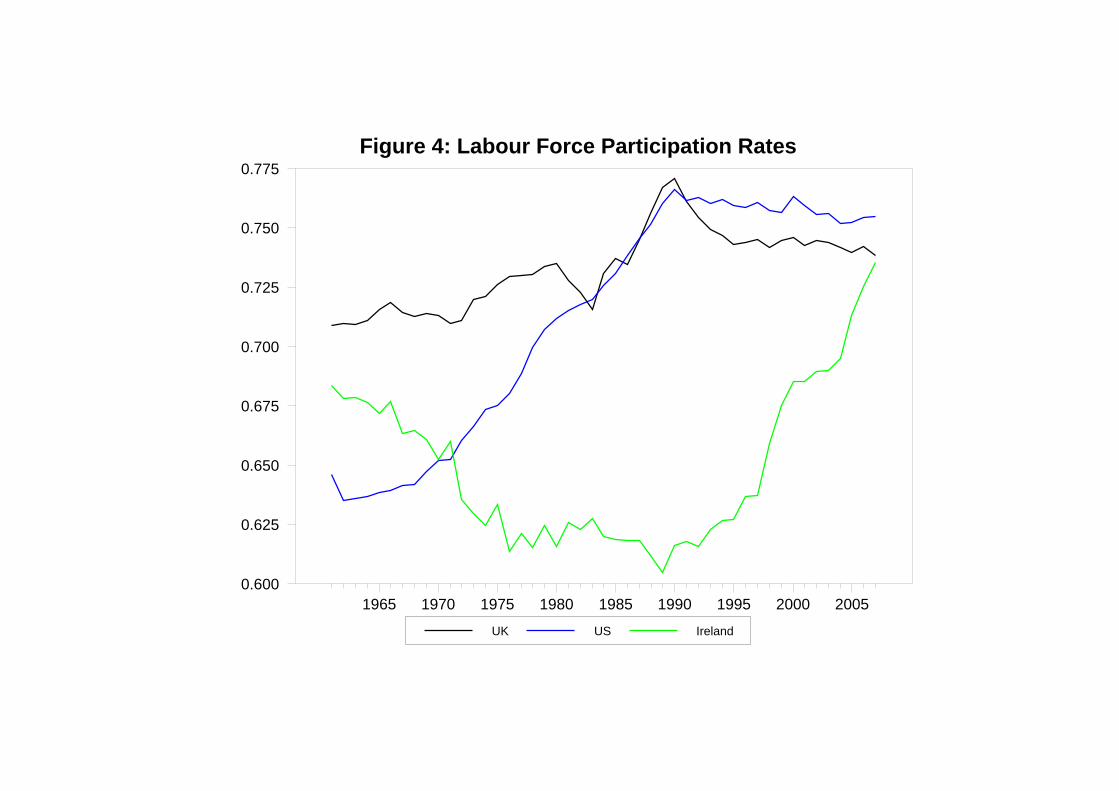
Figure 4: Labour Force Participation Rates
UK US Ireland
1965 1970 1975 1980 1985 1990 1995 2000 20050.600
0.625
0.650
0.675
0.700
0.725
0.750
0.775
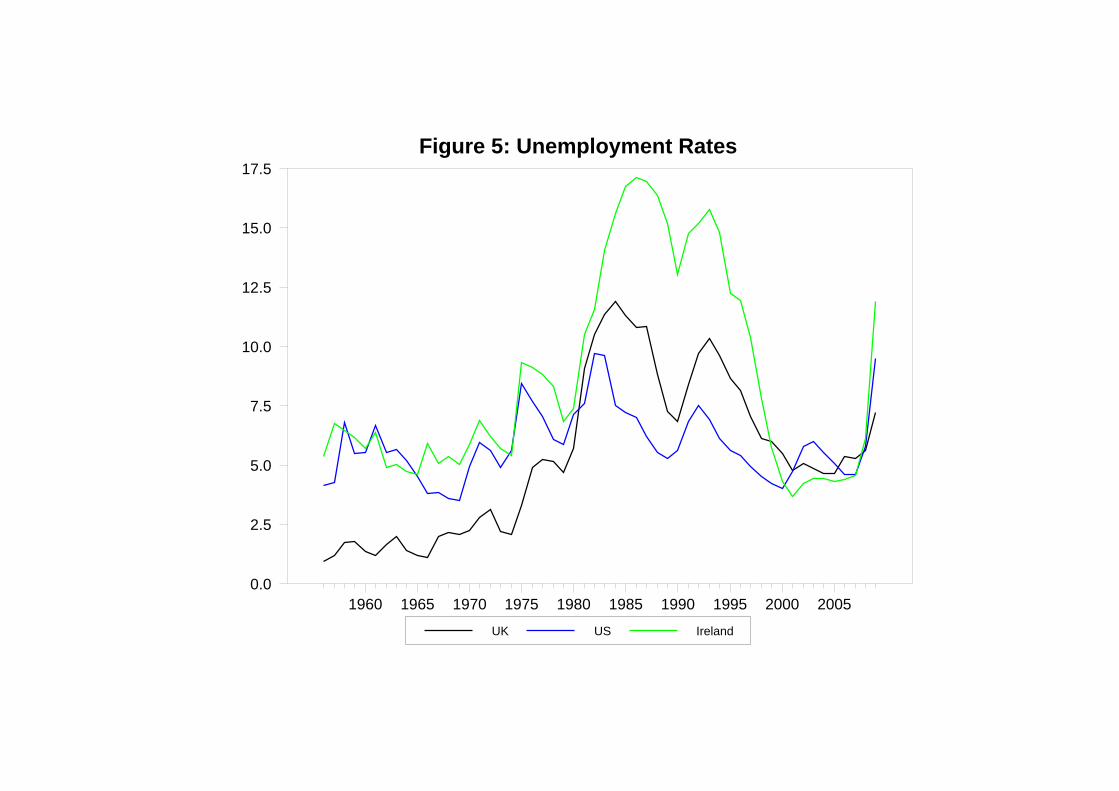
Figure 5: Unemployment Rates
UK US Ireland
1960 1965 1970 1975 1980 1985 1990 1995 2000 20050.0
2.5
5.0
7.5
10.0
12.5
15.0
17.5
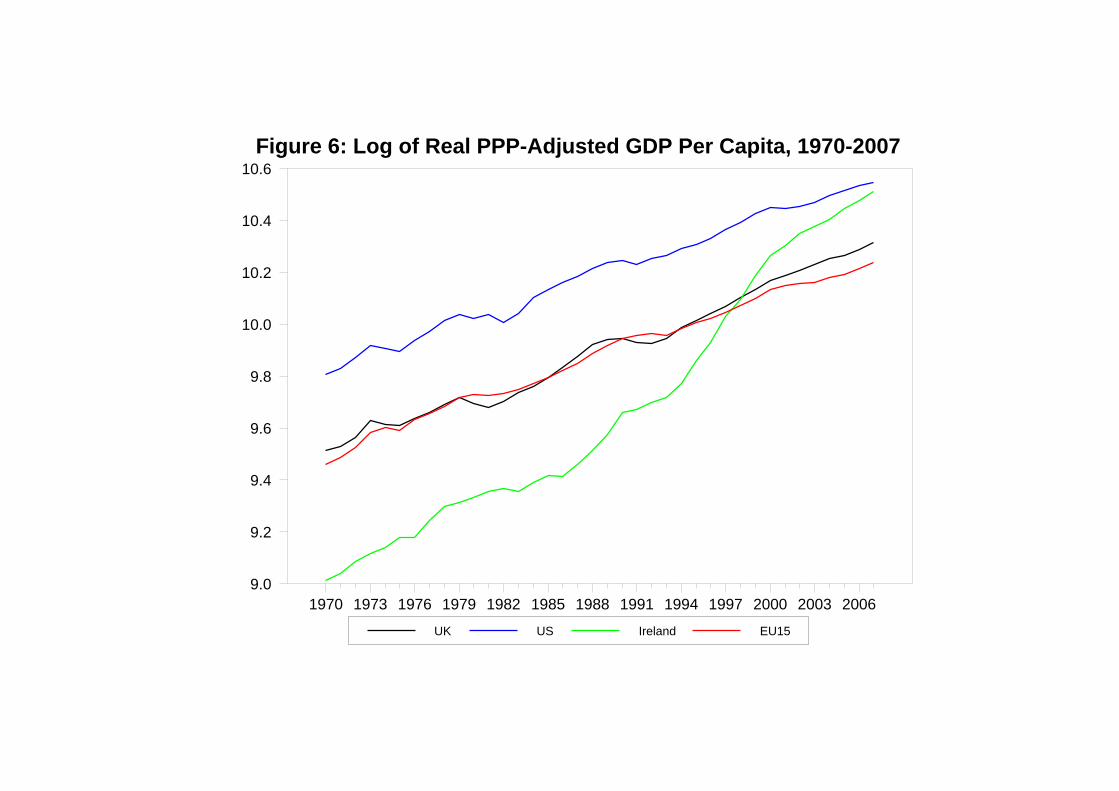
Figure 6: Log of Real PPP-Adjusted GDP Per Capita, 1970-2007
UK US Ireland EU15
1970 1973 1976 1979 1982 1985 1988 1991 1994 1997 2000 2003 20069.0
9.2
9.4
9.6
9.8
10.0
10.2
10.4
10.6
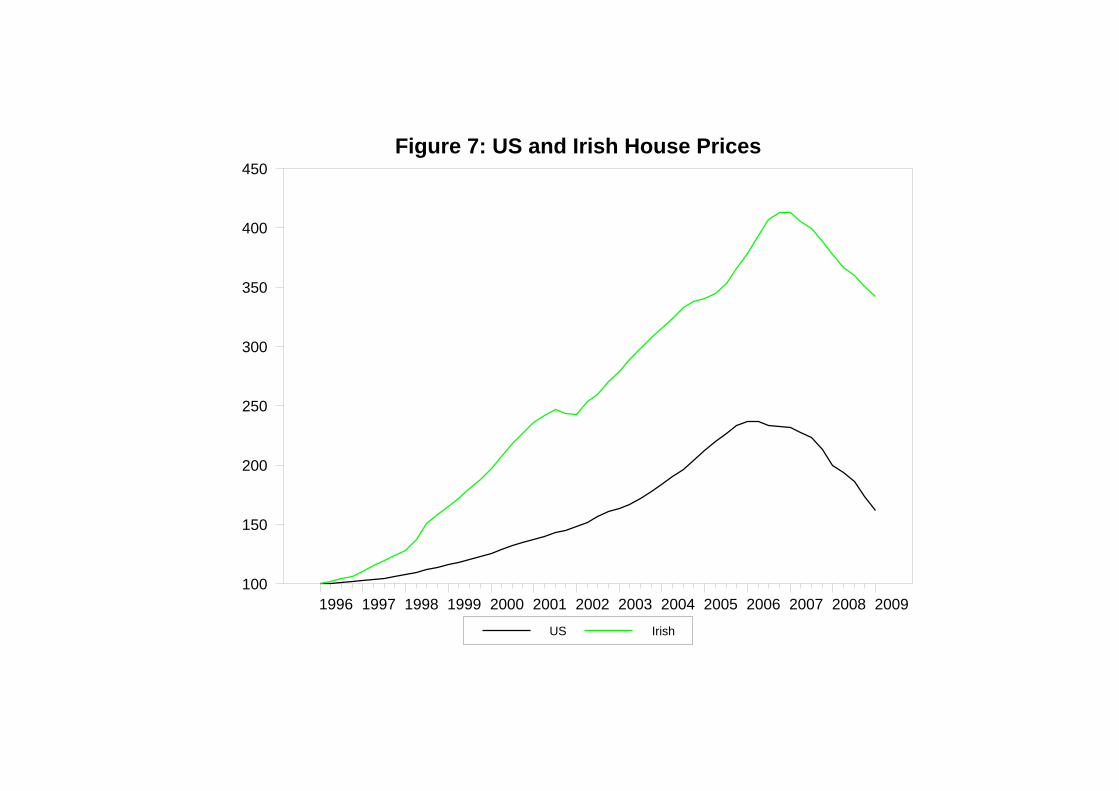
Figure 7: US and Irish House Prices
US Irish
1996 1997 1998 1999 2000 2001 2002 2003 2004 2005 2006 2007 2008 2009100
150
200
250
300
350
400
450
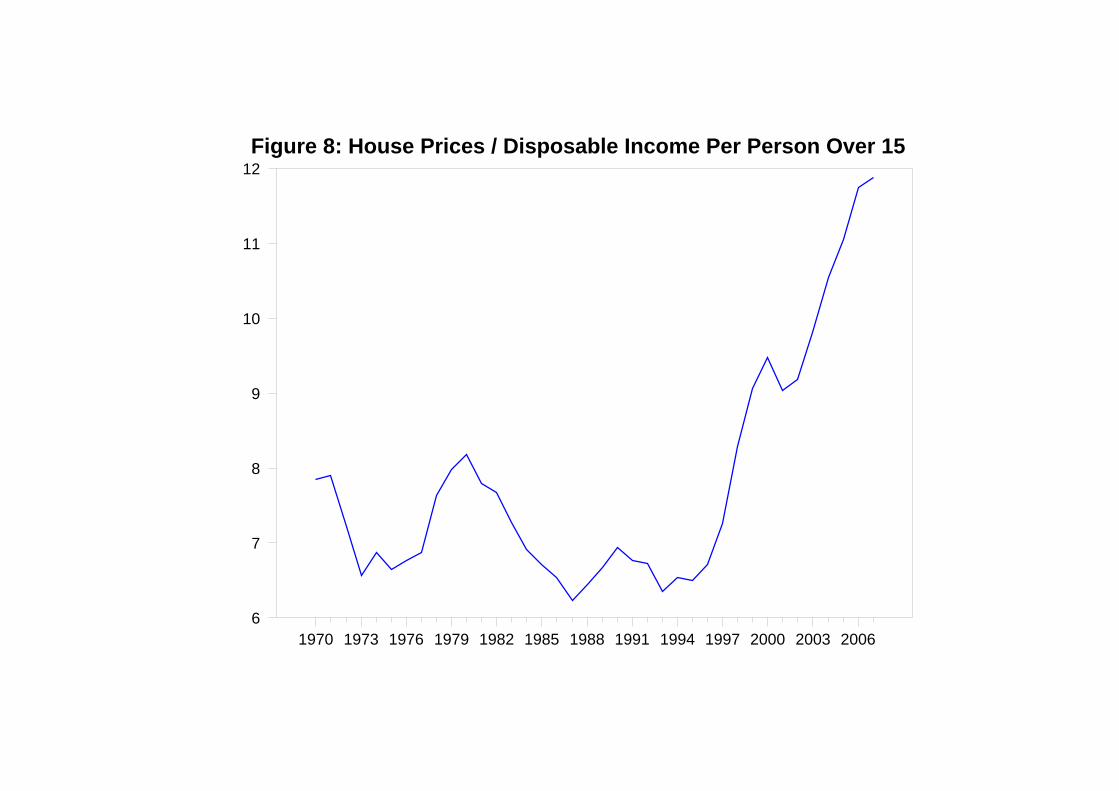
Figure 8: House Prices / Disposable Income Per Person Over 15
1970 1973 1976 1979 1982 1985 1988 1991 1994 1997 2000 2003 20066
7
8
9
10
11
12
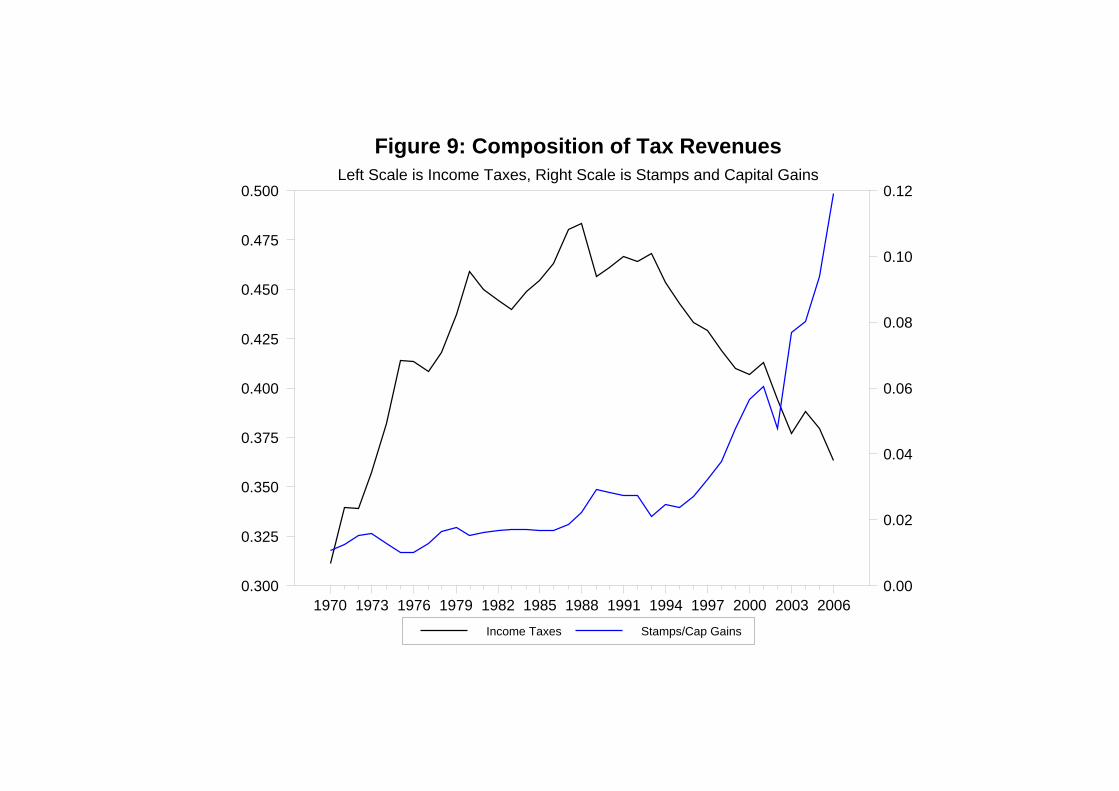
Figure 9: Composition of Tax RevenuesLeft Scale is Income Taxes, Right Scale is Stamps and Capital Gains
Income Taxes Stamps/Cap Gains
1970 1973 1976 1979 1982 1985 1988 1991 1994 1997 2000 2003 20060.300
0.325
0.350
0.375
0.400
0.425
0.450
0.475
0.500
0.00
0.02
0.04
0.06
0.08
0.10
0.12
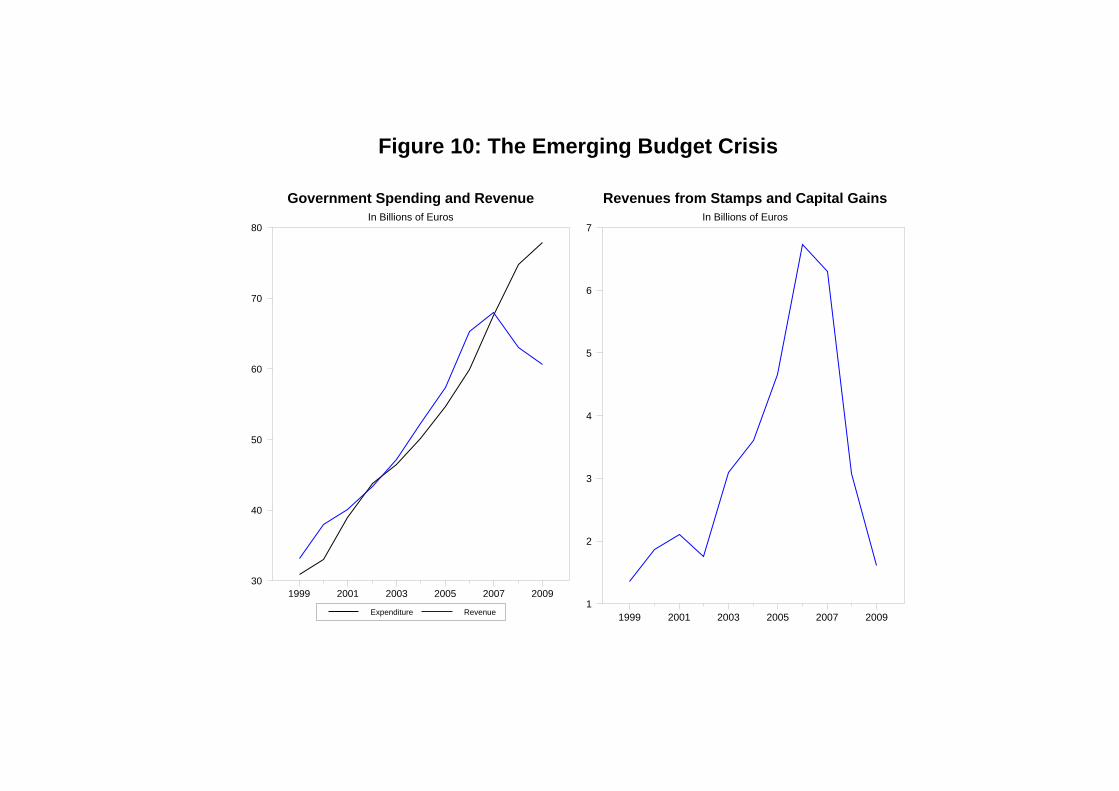
Figure 10: The Emerging Budget Crisis
Government Spending and RevenueIn Billions of Euros
Expenditure Revenue
1999 2001 2003 2005 2007 200930
40
50
60
70
80
Revenues from Stamps and Capital GainsIn Billions of Euros
1999 2001 2003 2005 2007 20091
2
3
4
5
6
7
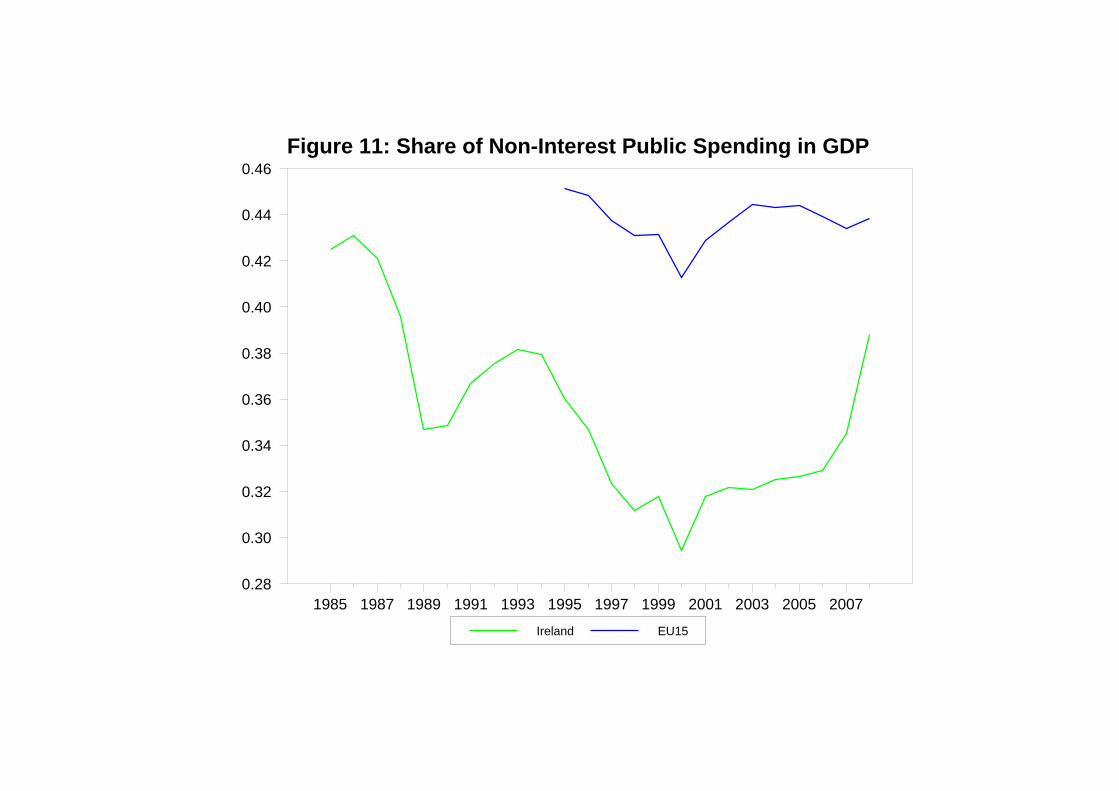
Figure 11: Share of Non-Interest Public Spending in GDP
Ireland EU15
1985 1987 1989 1991 1993 1995 1997 1999 2001 2003 2005 20070.28
0.30
0.32
0.34
0.36
0.38
0.40
0.42
0.44
0.46
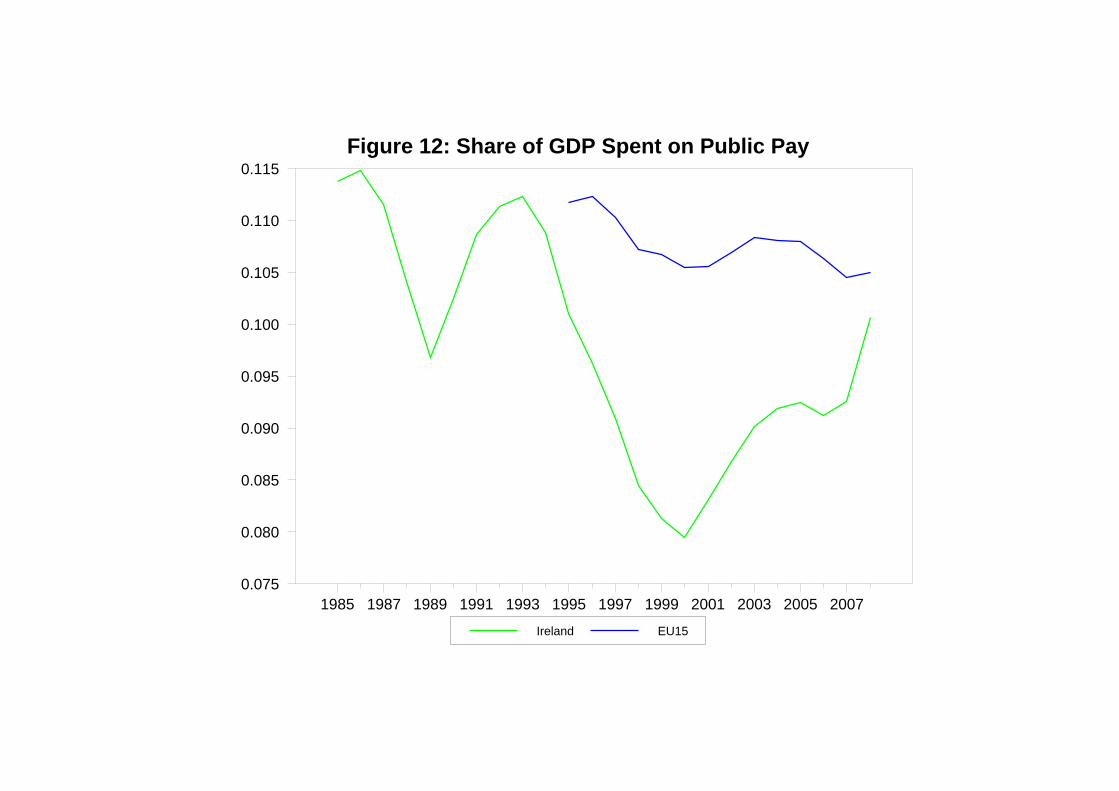
Figure 12: Share of GDP Spent on Public Pay
Ireland EU15
1985 1987 1989 1991 1993 1995 1997 1999 2001 2003 2005 20070.075
0.080
0.085
0.090
0.095
0.100
0.105
0.110
0.115
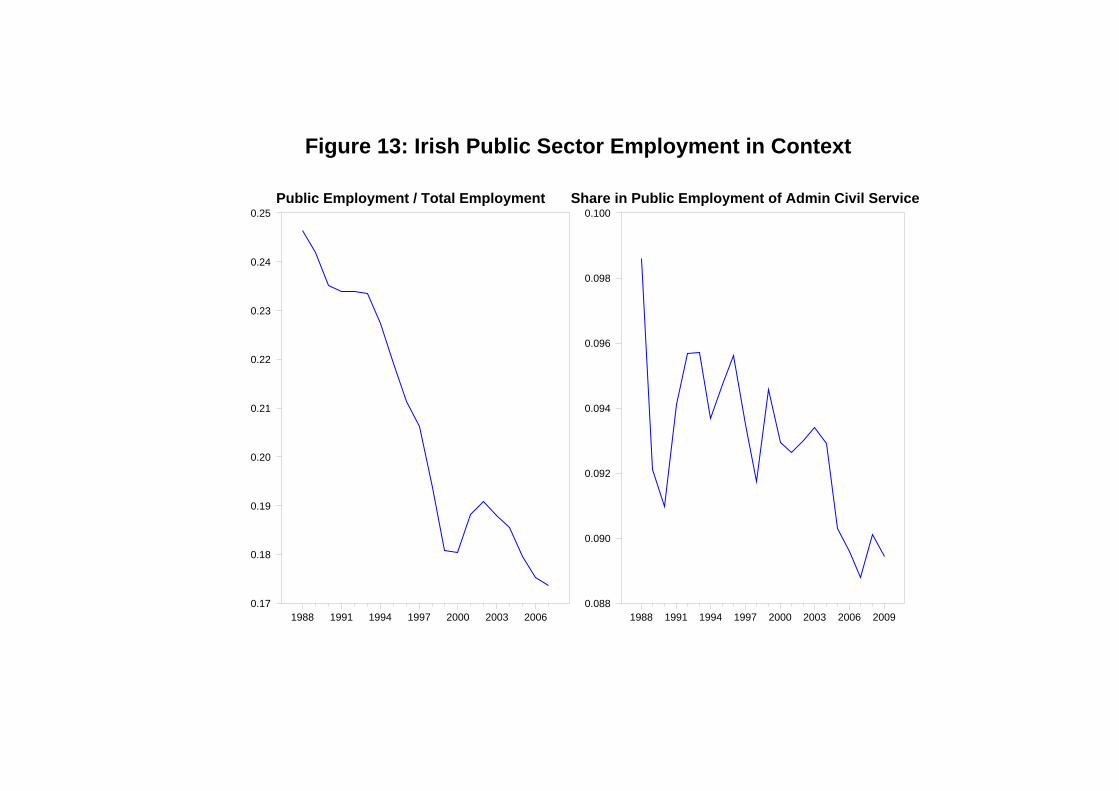
Figure 13: Irish Public Sector Employment in Context
Public Employment / Total Employment
1988 1991 1994 1997 2000 2003 20060.17
0.18
0.19
0.20
0.21
0.22
0.23
0.24
0.25Share in Public Employment of Admin Civil Service
1988 1991 1994 1997 2000 2003 2006 20090.088
0.090
0.092
0.094
0.096
0.098
0.100
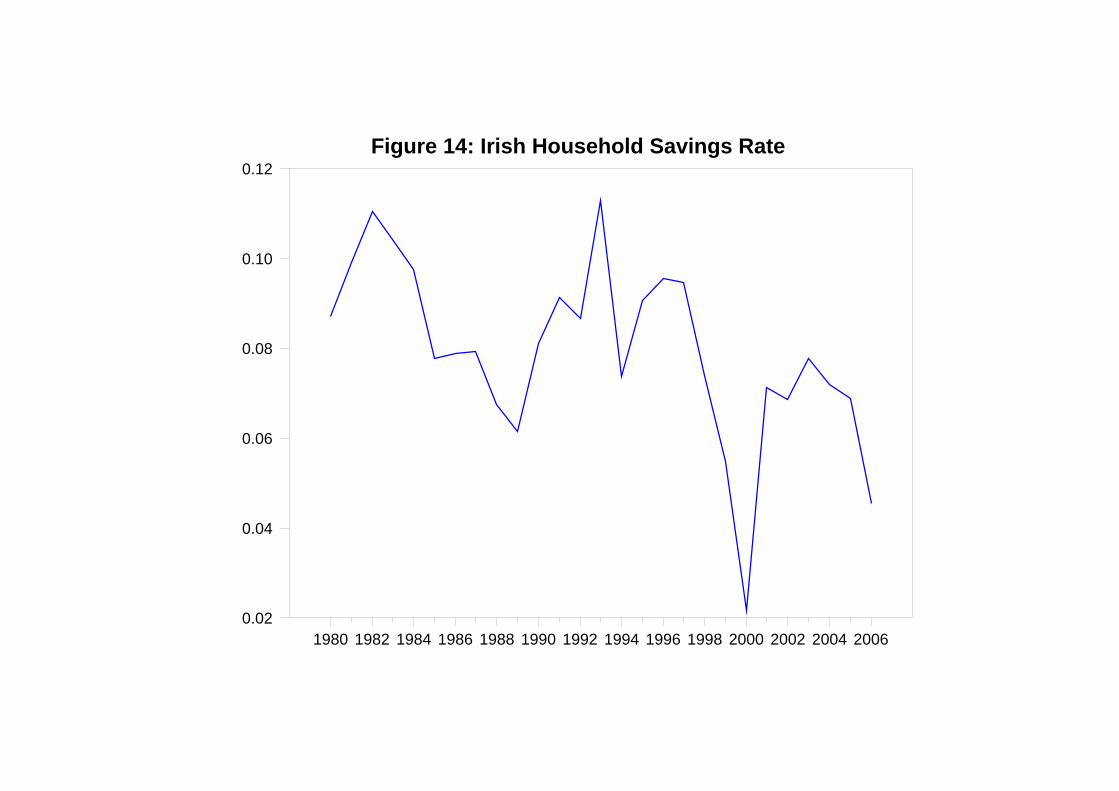
Figure 14: Irish Household Savings Rate
1980 1982 1984 1986 1988 1990 1992 1994 1996 1998 2000 2002 2004 20060.02
0.04
0.06
0.08
0.10
0.12
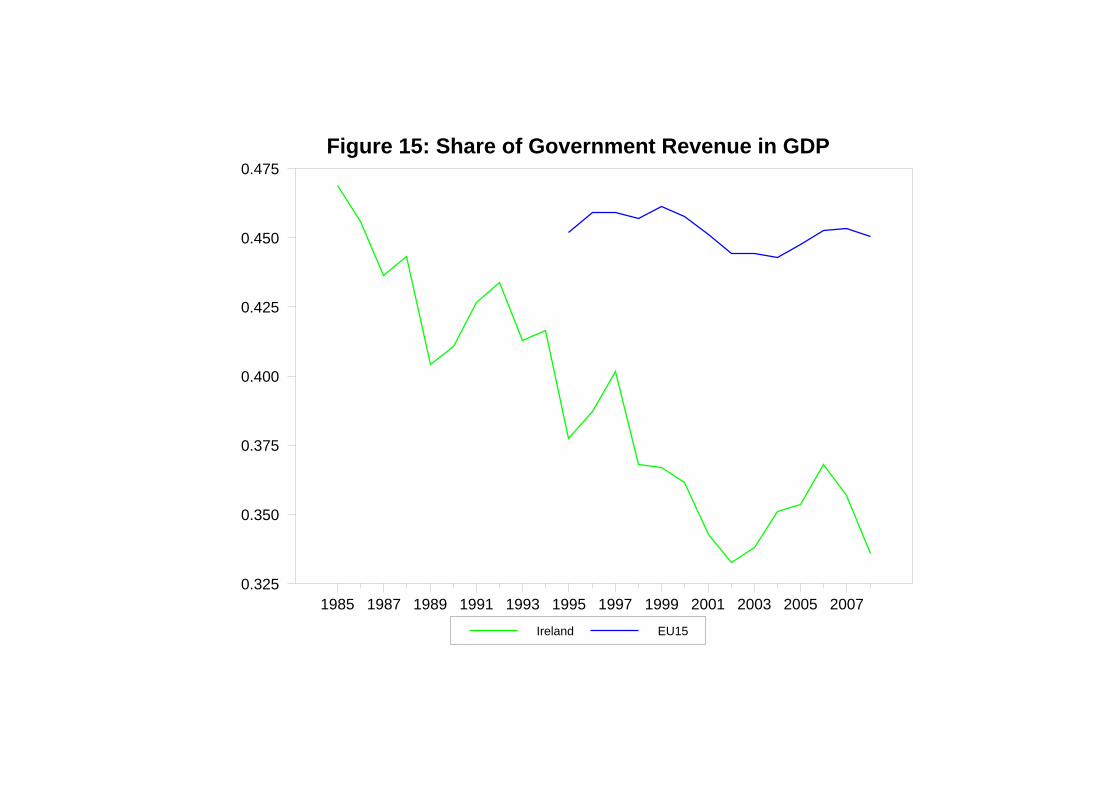
Figure 15: Share of Government Revenue in GDP
Ireland EU15
1985 1987 1989 1991 1993 1995 1997 1999 2001 2003 2005 20070.325
0.350
0.375
0.400
0.425
0.450
0.475