Policy June 2015 Briefing - United...
14
Policy Briefing • The deforestation rate in Palawan seems to have reduced and potentially reversed in the period 2010–14. • There have been dramatic declines in coral reef quality in the period 2001–10. • Mangrove ecosystems also showed a strong decline, whereas there was no clear negative trend for seagrass communities. • There has been a strong expansion of oil palm plantations in the Pulot watershed in the past decade, facilitated by the establishment of a palm oil mill. • The forests of Southern Palawan are an important carbon sink and are important to maintain water supply to irrigated paddy fields. Ecosystem Accounts for Southern Palawan There are numerous competing demands on resources in biodiversity-rich Southern Palawan—the area is home to a number of indigenous tribes and three large protected areas; there is also great potential for ecotourism, agriculture and mining. The accounts include the ecosystem condition, capacity, and services flow indicators for land/soil, fisheries, and forestry resources. These are some key findings: Figure 1. Site of the Phil-WAVES Project in Southern Palawan: Pulot Watershed, Sofronio Española; Inset Maps: Southern Palawan and the Philippines www.wavespartnership.org Wealth Accounting and the Valuation of Ecosystem Services WAVES Policy Briefing Philippines June 2015 Summary This briefing contains findings of a preliminary ecosystem account for Southern Palawan region. They include physical and monetary ecosystem services account as well as ecosystem condition account for coastal ecosystems, focusing on the Pulot watershed and the adjacent coastal zone. In addition, a land account was developed for Southern Palawan. Background The development of the accounts is a multi-agency task involving key national and local government units, supported by national and international experts. The national technical working group (TWG) is co-chaired by the Department of Environment and Natural Resources (DENR). The TWG in Southern Palawan is co-chaired by the Palawan Council for Sustainable Development (PCSD) and the DENR Provincial Environment and Natural Resources Office.
Transcript of Policy June 2015 Briefing - United...
PolicyBriefing
•The deforestation rate in Palawan
seems to have reduced and
potentially reversed in the period
2010–14.
•There have been dramatic declines
in coral reef quality in the period
2001–10.
•Mangrove ecosystems also showed
a strong decline, whereas there was
no clear negative trend for seagrass
communities.
•There has been a strong expansion
of oil palm plantations in the Pulot
watershed in the past decade,
facilitated by the establishment of a
palm oil mill.
•The forests of Southern Palawan
are an important carbon sink and
are important to maintain water
supply to irrigated paddy fields.
EcosystemAccountsforSouthernPalawanTherearenumerouscompetingdemandsonresourcesinbiodiversity-richSouthernPalawan—theareaishometoanumberofindigenoustribesandthreelargeprotectedareas;thereisalsogreatpotentialforecotourism,agricultureandmining.Theaccountsincludetheecosystemcondition,capacity,andservicesflowindicatorsforland/soil,fisheries,andforestryresources.Thesearesomekeyfindings:
Figure1.Site of the Phil-WAVES Project in Southern Palawan: Pulot Watershed, Sofronio Española; Inset Maps: Southern Palawan and the Philippines
www.wavespartnership.org Wealth Accounting and the Valuation of Ecosystem Services
WAVESPolicyBriefing
Philippines June 2015
Summary
Thisbriefingcontains
findingsofapreliminary
ecosystemaccountfor
SouthernPalawanregion.
Theyincludephysical
andmonetaryecosystem
servicesaccountaswell
asecosystemcondition
accountforcoastal
ecosystems,focusing
onthePulotwatershed
andtheadjacentcoastal
zone.Inaddition,aland
accountwasdeveloped
forSouthernPalawan.
Background
The development of the
accounts is a multi-agency
task involving key national
and local government
units, supported by
national and international
experts. The national
technical working group
(TWG) is co-chaired by
the Department of
Environment and Natural
Resources (DENR). The
TWG in Southern Palawan
is co-chaired by the
Palawan Council for
Sustainable Development
(PCSD) and the DENR
Provincial Environment
and Natural Resources
Office.
The Southern Palawan ecosystem
account has been tested at
different scales: (i) the Southern
Palawan region; (ii) the Pulot
watershed; and (iii) the coastal
zone of Sofronio Española
municipality (figure 1).
In the case study watershed area
(Pulot watershed, in Sofronio
Espanola in Southern Palawan),
three distinct zones can be
distinguished: uplands, lowlands,
and coastal. For each zone, a
number of key ecosystem condition
indicators and services have been
selected. The ecosystem accounts
include four core accounts as well as
a number of component accounts
(table 1).
LandandEcosystemCoverAccount:DeforestationReversedinPeriod2010–14
The Phil-WAVES TWG for Southern
Palawan together with the national
mapping agency NAMRIA has
mapped land cover in 2003, 2010,
and 2014, and created land cover
change matrices for these three
years. Comparison of land cover
classes (table 2) shows that there
has been a marked increase in
perennial crop. In addition, after
2007 there has been a rapid increase
in oil palm plantations, in particular
in the Pulot watershed (but not in
most other areas of Southern
Palawan). Closed forest decreased
strongly in the period 2003–10, but it
recovered somewhat between 2010
and 2014. In particular, closed forest
cover increased by about 5,181
hectares in the period 2010–14, but
the total amount that year still
represents a substantial loss
compared to the closed forest cover
in 2003. The recent increase may be
related to the effort of the Palawan
Council for Sustainable
Development, the local government
units, and the DENR to effectively
enforce Executive Order 23—that is,
the total log ban for the entire
country—and to create anti-illegal
logging task forces.
The open/barren land cover class
shows significant changes in a short
period of time. However, it is only a
small class, in absolute terms, and
this class is sensitive to the timing of
the remote-sensing images; for
instance, annual crop land may be
classified as open/barren if the
image is taken just before planting.
Likewise, the inland water category
appears to vary considerably, but
this may be related to using remote-
sensing images from a period when
paddy fields are under water (when
some of the paddy fields may be
recorded as open water) versus
when they are dry.
Land and ecosystem accounts may
be able to address a variety of
policy questions, depending on the
spatial scale of the “ecosystem” that
is the subject of the account. Fine
spatial scale accounts for specific
forest/land cover areas could be
used to assess and compare the
physical and economic outcomes of
different development and
conservation strategies for a
particular site or region. National
accounts would be useful to track
rates of ecosystem loss in order to
track progress toward national
conservation targets or
international commitments, or to
develop indicators of sustainability
or depletion and to inform the
design and development of
payment for ecosystem services
(PES) schemes. At even larger
spatial scales, SEEA land accounts
might be used to count the global
cost of climate change and
associated carbon stock, and could
serve as an argument for national
Comparison of land cover classes shows that there has been a marked increase in perennial crop. In addition, after 2007 there has been a rapid increase in oil palm plantations, in particular in the Pulot watershed (but not in most other areas of Southern Palawan). Closed forest decreased strongly in the period 2003–10, but it recovered somewhat between 2010 and 2014.
2Ecosystem Accounts for Southern Palawan
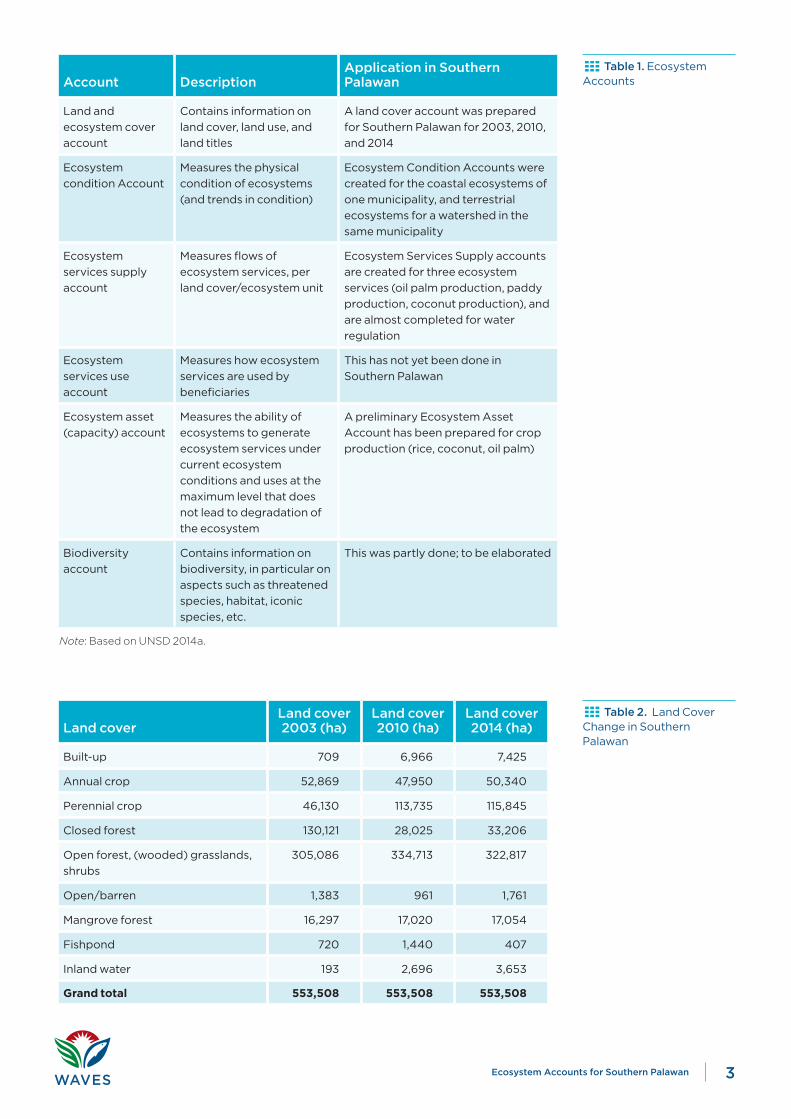
Table1.Ecosystem Accounts
Table2. Land Cover Change in Southern Palawan
Account DescriptionApplicationinSouthernPalawan
Land and
ecosystem cover
account
Contains information on
land cover, land use, and
land titles
A land cover account was prepared
for Southern Palawan for 2003, 2010,
and 2014
Ecosystem
condition Account
Measures the physical
condition of ecosystems
(and trends in condition)
Ecosystem Condition Accounts were
created for the coastal ecosystems of
one municipality, and terrestrial
ecosystems for a watershed in the
same municipality
Ecosystem
services supply
account
Measures flows of
ecosystem services, per
land cover/ecosystem unit
Ecosystem Services Supply accounts
are created for three ecosystem
services (oil palm production, paddy
production, coconut production), and
are almost completed for water
regulation
Ecosystem
services use
account
Measures how ecosystem
services are used by
beneficiaries
This has not yet been done in
Southern Palawan
Ecosystem asset
(capacity) account
Measures the ability of
ecosystems to generate
ecosystem services under
current ecosystem
conditions and uses at the
maximum level that does
not lead to degradation of
the ecosystem
A preliminary Ecosystem Asset
Account has been prepared for crop
production (rice, coconut, oil palm)
Biodiversity
account
Contains information on
biodiversity, in particular on
aspects such as threatened
species, habitat, iconic
species, etc.
This was partly done; to be elaborated
Note: Based on UNSD 2014a.
LandcoverLandcover2003(ha)
Landcover2010(ha)
Landcover2014(ha)
Built-up 709 6,966 7,425
Annual crop 52,869 47,950 50,340
Perennial crop 46,130 113,735 115,845
Closed forest 130,121 28,025 33,206
Open forest, (wooded) grasslands,
shrubs
305,086 334,713 322,817
Open/barren 1,383 961 1,761
Mangrove forest 16,297 17,020 17,054
Fishpond 720 1,440 407
Inland water 193 2,696 3,653
Grand total 553,508 553,508 553,508
3Ecosystem Accounts for Southern Palawan
and global commitment to reducing
greenhouse gas emissions.
TerrestrialConditionAccount:HydrologyChangesImpactingLowlandProductionandCoastalEcosystems
Terrestrial ecosystem condition is
described in this case study in terms
of land cover and vegetation type and
in terms of key hydrological
parameters and landscape processes.
The terrestrial condition account
variables selected were (i) elevation,
(ii) precipitation, (iii)
evapotranspiration, (iv) slope,
(v) hazards, and (vi) soil loss. These are
important inputs for modeling
hydrological services, including “soil
erosion control” or sediment retention
services. These indicators were
selected because, in addition to land
cover, they are important for
understanding the services provided
by the uplands and provide insights
relevant for ecosystem management,
in particular land use change and
aspects such as encroachment in
protected areas and forest reserves.
The understanding of terrestrial
ecosystem condition is now fairly
complete for the Pulot watershed, and
all if not most of this information
would also be available if the condition
account were scaled up to, say, the
whole of Palawan. However, the
analysis of ecosystem condition
indicators conducted for this study
shows that information is missing on
river and coastal water quality in
particular sediment and pollutant
indicators. In addition, the river flow
measurement stations in Pulot River
are no longer operational, and this will
increasingly be a constraint for
modeling and monitoring the impacts
of land use change on water
availability and effects on coastal
ecosystems—which is certainly a
management issue, if not an issue on
budget allocation policy.
CoastalConditionAccount:DecliningQualityofCoralReefs,SeagrassFields,andMangroveForests
The coastal resources included in the
account are coral reefs, seagrass beds,
and mangroves forests, which represent
the three key coastal ecosystems
supporting the fishery production
services. Given the complexity and high
spatial variability of the three types of
coastal ecosystems included in the
accounts, a relatively fine spatial grain is
needed to understand the condition of
these ecosystems. Therefore, this
experimental ecosystem account
focused on one municipality: Sofronio
Española. The spatial extent of the
three coastal ecosystems condition
characterization was produced from
images generated and interpreted by
the European Space Agency (ESA)
from unsupervised classification
(figure 2).
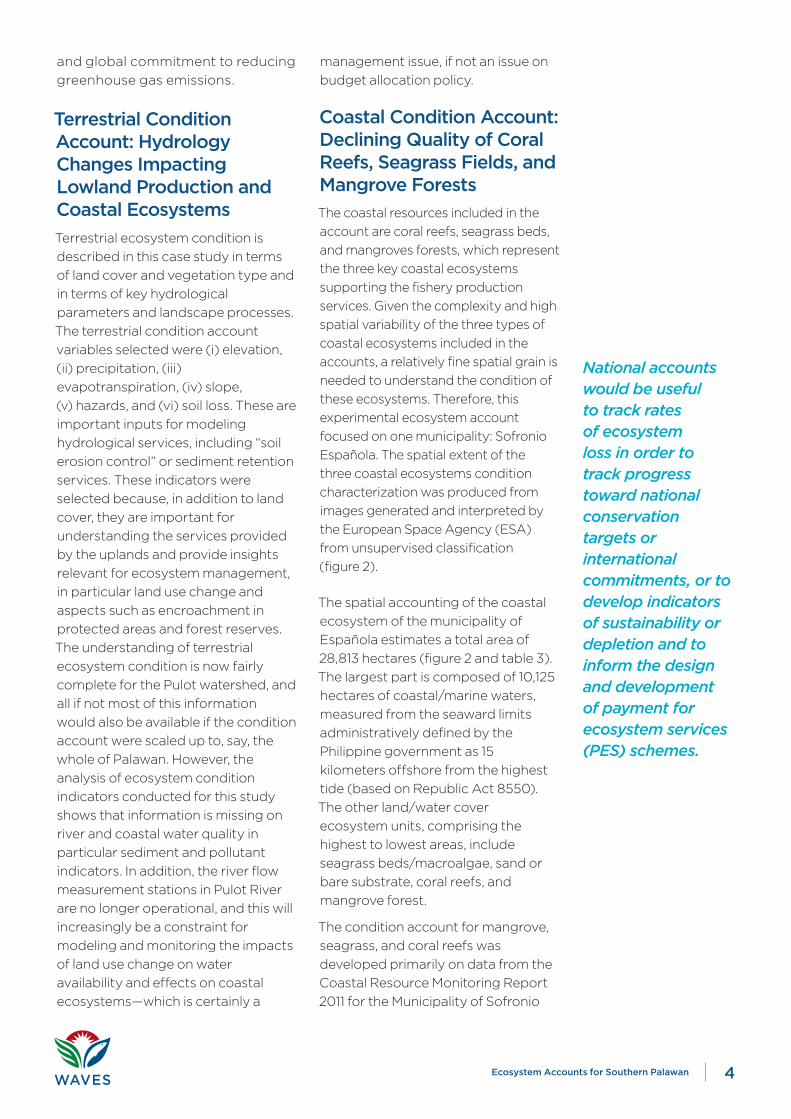
The spatial accounting of the coastal
ecosystem of the municipality of
Española estimates a total area of
28,813 hectares (figure 2 and table 3).
The largest part is composed of 10,125
hectares of coastal/marine waters,
measured from the seaward limits
administratively defined by the
Philippine government as 15
kilometers offshore from the highest
tide (based on Republic Act 8550).
The other land/water cover
ecosystem units, comprising the
highest to lowest areas, include
seagrass beds/macroalgae, sand or
bare substrate, coral reefs, and
mangrove forest.
The condition account for mangrove,
seagrass, and coral reefs was
developed primarily on data from the
Coastal Resource Monitoring Report
2011 for the Municipality of Sofronio
National accounts would be useful to track rates of ecosystem loss in order to track progress toward national conservation targets or international commitments, or to develop indicators of sustainability or depletion and to inform the design and development of payment for ecosystem services (PES) schemes.
4Ecosystem Accounts for Southern Palawan
Española (PCSD 2011). The account
shows the general decline of the three
ecosystems in terms of selected key
indicators.
•Mangrove condition: Province-wide,
mangroves have expanded, but
certain municipalities (including
Sofronio Española) manifested
reduction.
The municipalities with a noticeable
increase (greater than 1,000
hectares) in mangrove forests since
1998 are Bataraza, Culion, Roxas,
and Taytay. Municipalities that
manifested reduction in mangrove
forests include Dumaran, Sofronio
Española, Quezon, San Vicente, and
Jose Rizal. Natural regeneration of
Figure2.Coastal/Marine Ecosystem Extent Map, Sofronio Española, Southern Palawan, 2014
Table3. Coastal/Marine Land/Water Account, Sofronio Española, Palawan, August 2014
Source: European Space Agency, August 2014.
Area(ha) PercentofTotal
Total Coastal Ecosystem Accounting Unit 28,813 100
Coastal/Marine deep waters 10,125 35.14
Land/Island 119 0.41
Sand or Bare Substrate 4,663 16.18
Seagrass beds and Macroalgae 8,323 28.89
Thin vegetation 8,254 28.65
Dense vegetation 69 0.24
Coral Reefs 4,253 14.76
Reef flat/coral and rubble field 2,201 7.64
Reef crest/high coral cover 574 1.99
Reef slope/deep reef 1,478 5.13
Mangrove Forest 1,330 4.62
Source: European Space Agency, August 2014.
5Ecosystem Accounts for Southern Palawan
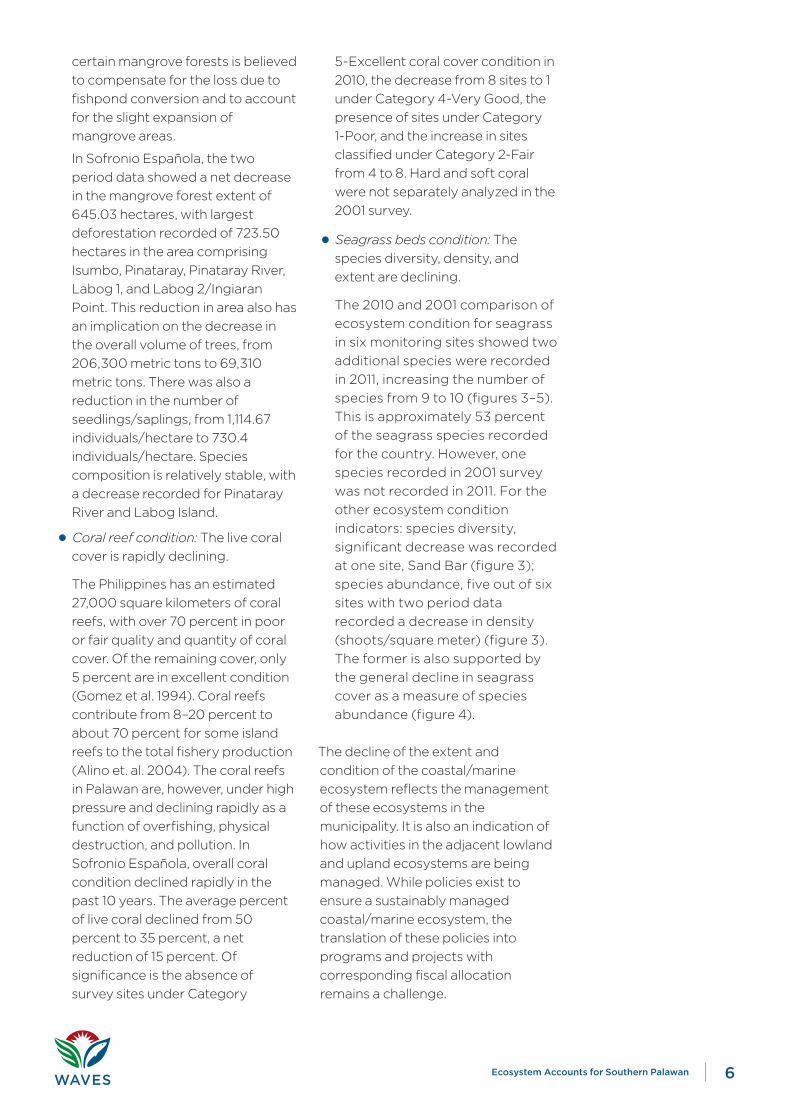
certain mangrove forests is believed
to compensate for the loss due to
fishpond conversion and to account
for the slight expansion of
mangrove areas.
In Sofronio Española, the two
period data showed a net decrease
in the mangrove forest extent of
645.03 hectares, with largest
deforestation recorded of 723.50
hectares in the area comprising
Isumbo, Pinataray, Pinataray River,
Labog 1, and Labog 2/Ingiaran
Point. This reduction in area also has
an implication on the decrease in
the overall volume of trees, from
206,300 metric tons to 69,310
metric tons. There was also a
reduction in the number of
seedlings/saplings, from 1,114.67
individuals/hectare to 730.4
individuals/hectare. Species
composition is relatively stable, with
a decrease recorded for Pinataray
River and Labog Island.
•Coral reef condition: The live coral
cover is rapidly declining.
The Philippines has an estimated
27,000 square kilometers of coral
reefs, with over 70 percent in poor
or fair quality and quantity of coral
cover. Of the remaining cover, only
5 percent are in excellent condition
(Gomez et al. 1994). Coral reefs
contribute from 8–20 percent to
about 70 percent for some island
reefs to the total fishery production
(Alino et. al. 2004). The coral reefs
in Palawan are, however, under high
pressure and declining rapidly as a
function of overfishing, physical
destruction, and pollution. In
Sofronio Española, overall coral
condition declined rapidly in the
past 10 years. The average percent
of live coral declined from 50
percent to 35 percent, a net
reduction of 15 percent. Of
significance is the absence of
survey sites under Category
5-Excellent coral cover condition in
2010, the decrease from 8 sites to 1
under Category 4-Very Good, the
presence of sites under Category
1-Poor, and the increase in sites
classified under Category 2-Fair
from 4 to 8. Hard and soft coral
were not separately analyzed in the
2001 survey.
•Seagrass beds condition: The
species diversity, density, and
extent are declining.
The 2010 and 2001 comparison of
ecosystem condition for seagrass
in six monitoring sites showed two
additional species were recorded
in 2011, increasing the number of
species from 9 to 10 (figures 3–5).
This is approximately 53 percent
of the seagrass species recorded
for the country. However, one
species recorded in 2001 survey
was not recorded in 2011. For the
other ecosystem condition
indicators: species diversity,
significant decrease was recorded
at one site, Sand Bar (figure 3);
species abundance, five out of six
sites with two period data
recorded a decrease in density
(shoots/square meter) (figure 3).
The former is also supported by
the general decline in seagrass
cover as a measure of species
abundance (figure 4).
The decline of the extent and
condition of the coastal/marine
ecosystem reflects the management
of these ecosystems in the
municipality. It is also an indication of
how activities in the adjacent lowland
and upland ecosystems are being
managed. While policies exist to
ensure a sustainably managed
coastal/marine ecosystem, the
translation of these policies into
programs and projects with
corresponding fiscal allocation
remains a challenge.
6Ecosystem Accounts for Southern Palawan
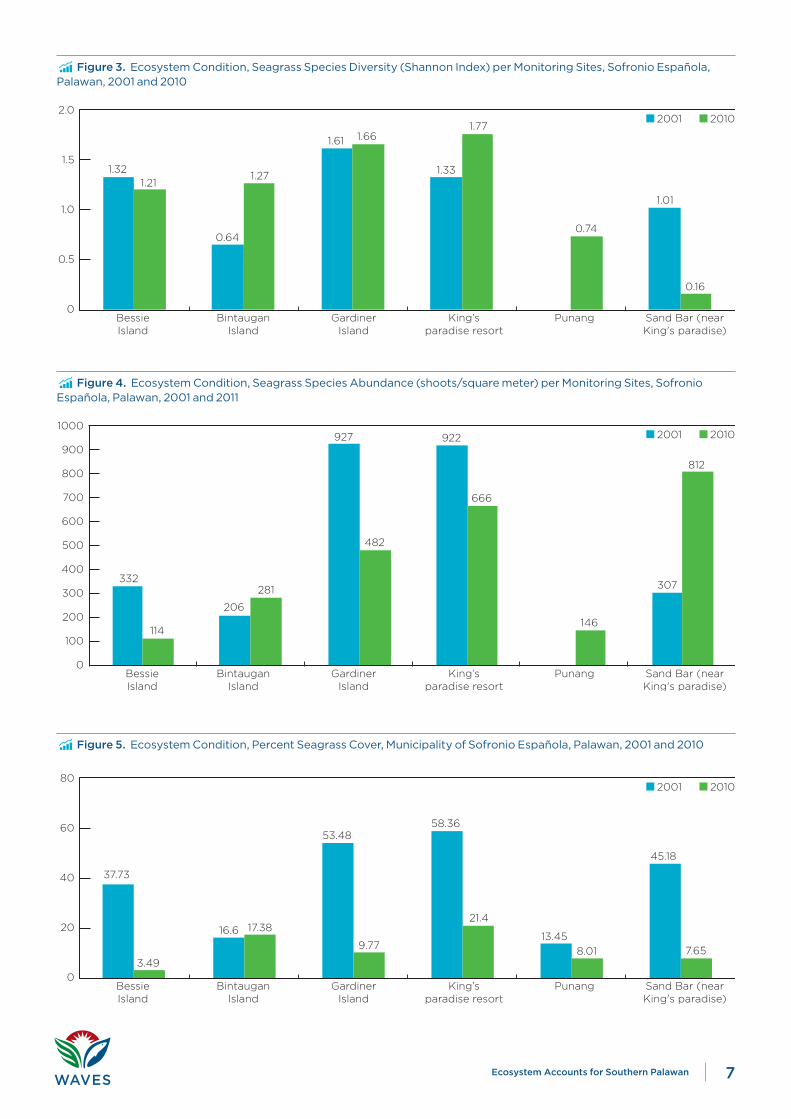
Figure3.Ecosystem Condition, Seagrass Species Diversity (Shannon Index) per Monitoring Sites, Sofronio Española, Palawan, 2001 and 2010
Figure4.Ecosystem Condition, Seagrass Species Abundance (shoots/square meter) per Monitoring Sites, Sofronio Española, Palawan, 2001 and 2011
BessieIsland
BintauganIsland
GardinerIsland
King’sparadise resort
Punang Sand Bar (nearKing's paradise)
1.321.21
1.77
1.01
0.16
0.64
1.66
1.331.27
1.61
0.74
2001 20102.0
1.5
1.0
0.5
0
BessieIsland
BintauganIsland
GardinerIsland
King’sparadise resort
Punang
2001 2010
Sand Bar (nearKing's paradise)
332
206
666
307
812
927
482
281
922
146114
1000
900
800
0
700
600
500
400
300
200
100
Figure5.Ecosystem Condition, Percent Seagrass Cover, Municipality of Sofronio Española, Palawan, 2001 and 2010
BessieIsland
BintauganIsland
GardinerIsland
King’sparadise resort
Punang Sand Bar (nearKing's paradise)
37.73
2001 2010
53.48
8.019.77
3.49
17.38
45.18
13.45
58.36
16.6
7.65
21.4
80
60
40
20
0
7Ecosystem Accounts for Southern Palawan
EcosystemServiceSupplyAccountThe ecosystem services supply
account records the flow of
ecosystem services in both physical
and monetary terms. For this account,
the services carbon sequestration
(uplands), water regulation (uplands),
palm oil production (lowlands), rice
production (lowlands), and coconut
production (lowlands) were selected.
The selection was made on the basis
of the relative importance of these
services for the local economy, and
the availability of data.
•Declining carbon stock between
2003 and 2010, but reversed for the
period 2010–14
The Phil-WAVES Palawan TWG has
prepared the biomass and carbon
account for the years 2003, 2010,
and 2014 to provide physical and
monetary accounts of carbon in
Southern Palawan and to link policy
issues or concerns affecting the
forestry sector. This includes the
breakdown of the carbon
sequestered and released in each
key land cover, namely closed,
open, and mangrove forests. The
forest biomass takes into account
the stem, above-ground (AGB),
below-ground (BGB), and tree
biomass. The total opening carbon
stock in 2003 is 12.4 million tC
(tonne carbon); stock in 2010 is 9.3
million tC; and the closing carbon
stock in 2014 is about 10 million tC.
Between 2003 and 2010, closed,
open, and mangrove forests have
declining carbon contents that
range from an average stock of 54
tC per hectare to 41 tC per hectare.
However, in 2014, it increased to 43
tC per hectare. The decrease in the
first period can be attributed to the
decrease in the area (and volume)
of closed forest and the wide-range
conversion of closed forest to other
land cover. The increase of stock in
the period 2010–14 is also due to the
increase of area (and timber
volume) from 2010 to 2014 in these
forests.
In terms of carbon annually
sequestered in closed forest, the
values are as follows: 672,000 tC
in 2003; 145,000 tC in 2010; and
172,000 tC in 2014. For open
forests, the values are 777,000 tC
in 2003; 1.65 million tC in 2010,
and 1.63 million tC in 2014. In line
with expectations, closed forests
have the highest carbon storage
whereas most open forests have
a higher annual sequestration of
carbon. In general, 2003 had the
lowest carbon sequestration, and
sequestration gradually
increased again between 2010
and 2014.
In translating the physical account
on carbon into monetary terms,
the net present values (NPVs) (in
pesos) for closed and open
forests in 2003 and 2010 were
computed. The present values
generated for carbon from the net
price method were then used to
yield the NPVs through the asset
value approach.
Although there is slight increase in
carbon stock in 2014, the results
show that forests as natural capital
have depreciated during the period
2003 to 2010, which means that
over the longer term the forest
resources in Southern Palawan
have not been sustainably
managed. This is indicative of some
challenges in implementating
forest policies, particularly the ban
on commercial logging in Palawan,
and dealing with illegal logging as
well as the regulation on the
possession, ownership, or use of
power chain saws within the
province of Palawan (DENR
Administrative Order 49, dated
November 6, 1992). This shows that
The decline of the extent and condition of the coastal/marine ecosystem reflects the management of these ecosystems in the municipality. It is also an indication of how activities in the adjacent lowland and upland ecosystems are being managed.
8Ecosystem Accounts for Southern Palawan
the present efforts of the
government in implementing the
National Greening Program are
timely, relevant, and need
continuous support. The
continuing pressure on the forests
shows the rationale of a clear,
appropriate, and well-funded
forest protection and law
enforcement program, including
strict implementation of forest
policies such as EO 23, and policies
related to community-based forest
management and integrated forest
management agreement, among
others.
Ecosystem accounting is useful in
identifying areas subject to
particularly rapid land use change
(such as the Pulot watershed), and
areas where illegal logging is having
an impact on overall forest cover.
Such information should be
regularly updated (at least every
two years) in order to support
planning of forest monitoring
activities. Frontline forestry services
need strengthening and equipping
with the necessary logistics to
undertake regular monitoring and
evaluation on the ground, in
particular since the remote-sensing
imagery cannot differentiate
between different types of closed
and open forest.
In terms of regulating services, the
Forest Management Bureau should
explore the possibility of valuing not
only carbon sequestration but also
water yield and soil erosion
protection in watersheds in
partnership with the Ecosystems
Research and Development Bureau.
With the realization of the effects
and impacts of climate change,
people want to balance the
ecological and socioeconomic
benefits derived from the forest
ecosystem. In this connection,
efforts should also be made to
protect forestlands per se against
encroachment to allow natural
regeneration of other wooded lands.
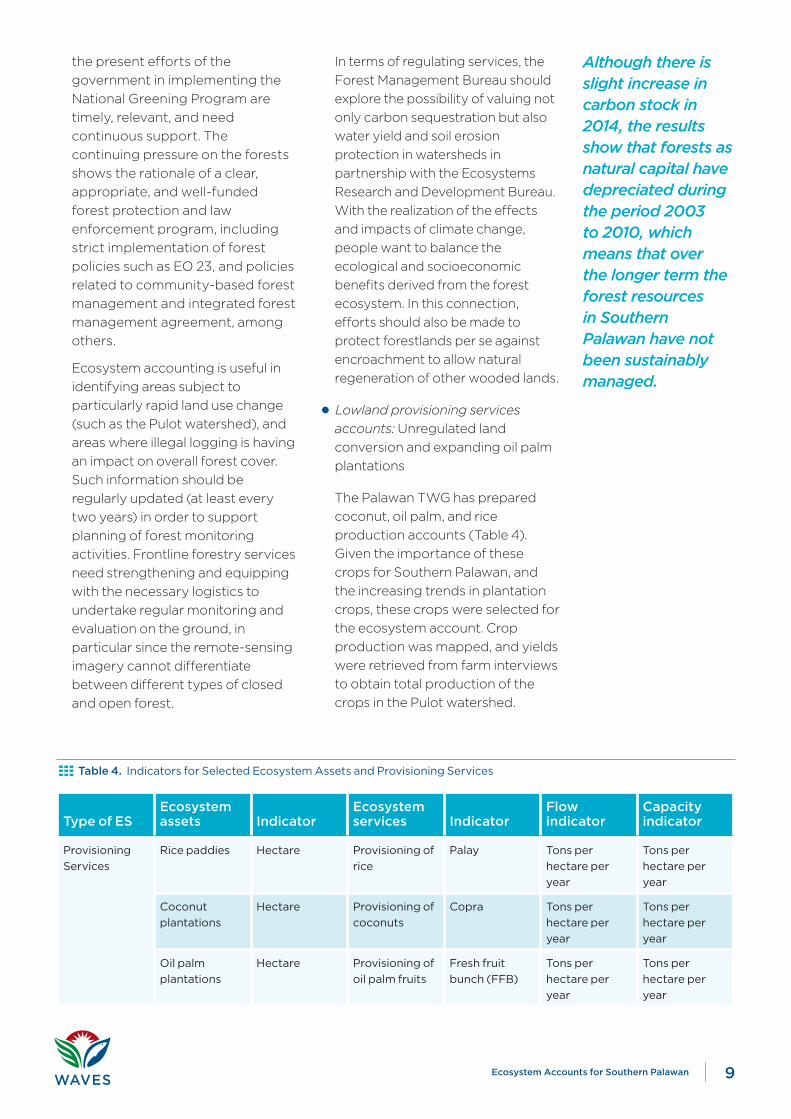
•Lowland provisioning services accounts: Unregulated land
conversion and expanding oil palm
plantations
The Palawan TWG has prepared
coconut, oil palm, and rice
production accounts (Table 4).
Given the importance of these
crops for Southern Palawan, and
the increasing trends in plantation
crops, these crops were selected for
the ecosystem account. Crop
production was mapped, and yields
were retrieved from farm interviews
to obtain total production of the
crops in the Pulot watershed.
TypeofESEcosystemassets Indicator
Ecosystemservices Indicator
Flowindicator
Capacityindicator
Provisioning
Services
Rice paddies Hectare Provisioning of
rice
Palay Tons per
hectare per
year
Tons per
hectare per
year
Coconut
plantations
Hectare Provisioning of
coconuts
Copra Tons per
hectare per
year
Tons per
hectare per
year
Oil palm
plantations
Hectare Provisioning of
oil palm fruits
Fresh fruit
bunch (FFB)
Tons per
hectare per
year
Tons per
hectare per
year
Table4. Indicators for Selected Ecosystem Assets and Provisioning Services
Although there is slight increase in carbon stock in 2014, the results show that forests as natural capital have depreciated during the period 2003 to 2010, which means that over the longer term the forest resources in Southern Palawan have not been sustainably managed.
9Ecosystem Accounts for Southern Palawan
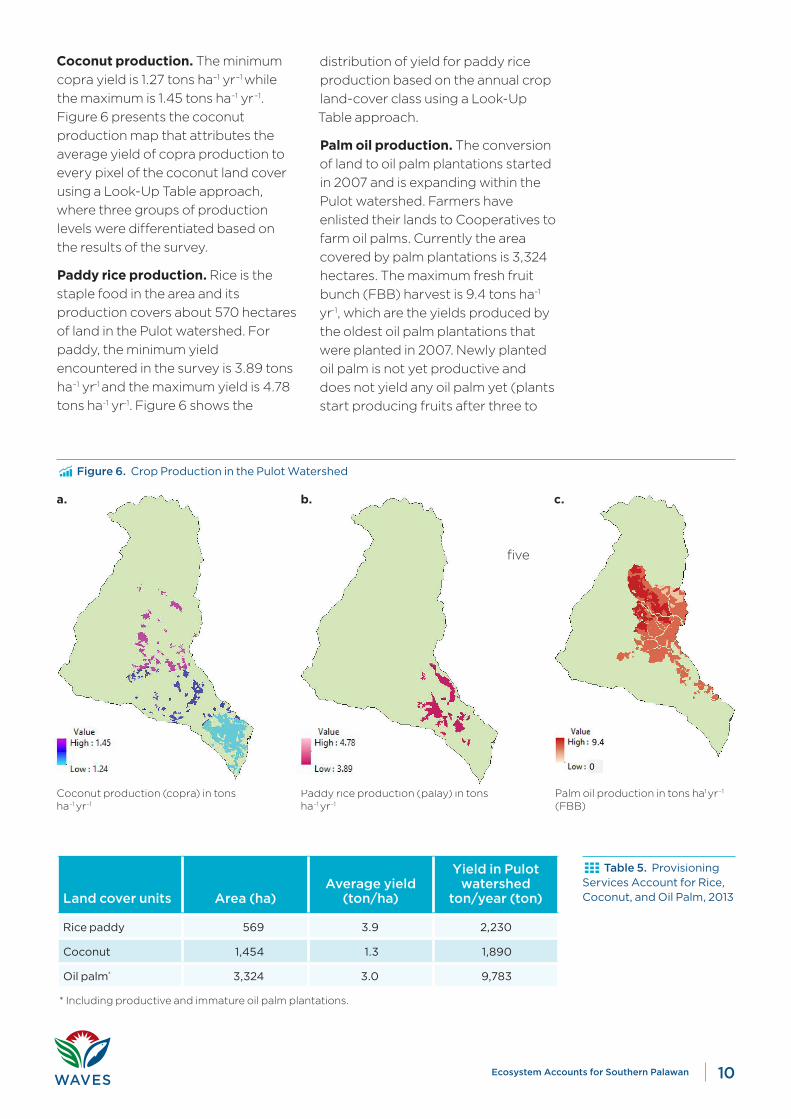
Coconut production. The minimum
copra yield is 1.27 tons ha–1 yr–1 while
the maximum is 1.45 tons ha–1 yr–1.
Figure 6 presents the coconut
production map that attributes the
average yield of copra production to
every pixel of the coconut land cover
using a Look-Up Table approach,
where three groups of production
levels were differentiated based on
the results of the survey.
Paddy rice production. Rice is the
staple food in the area and its
production covers about 570 hectares
of land in the Pulot watershed. For
paddy, the minimum yield
encountered in the survey is 3.89 tons
ha–1 yr-1 and the maximum yield is 4.78
tons ha-1 yr-1. Figure 6 shows the
distribution of yield for paddy rice
production based on the annual crop
land-cover class using a Look-Up
Table approach.
Palm oil production. The conversion
of land to oil palm plantations started
in 2007 and is expanding within the
Pulot watershed. Farmers have
enlisted their lands to Cooperatives to
farm oil palms. Currently the area
covered by palm plantations is 3,324
hectares. The maximum fresh fruit
bunch (FBB) harvest is 9.4 tons ha-1
yr-1, which are the yields produced by
the oldest oil palm plantations that
were planted in 2007. Newly planted
oil palm is not yet productive and
does not yield any oil palm yet (plants
start producing fruits after three to
five
Coconut production (copra) in tons ha–1 yr–1
Paddy rice production (palay) in tons ha–1 yr–1
Palm oil production in tons ha1 yr–1
(FBB)
Figure6.Crop Production in the Pulot Watershed
a. b. c.
Landcoverunits Area(ha)Averageyield
(ton/ha)
YieldinPulotwatershed
ton/year(ton)
Rice paddy 569 3.9 2,230
Coconut 1,454 1.3 1,890
Oil palm* 3,324 3.0 9,783
* Including productive and immature oil palm plantations.
Table5. Provisioning Services Account for Rice, Coconut, and Oil Palm, 2013
10Ecosystem Accounts for Southern Palawan
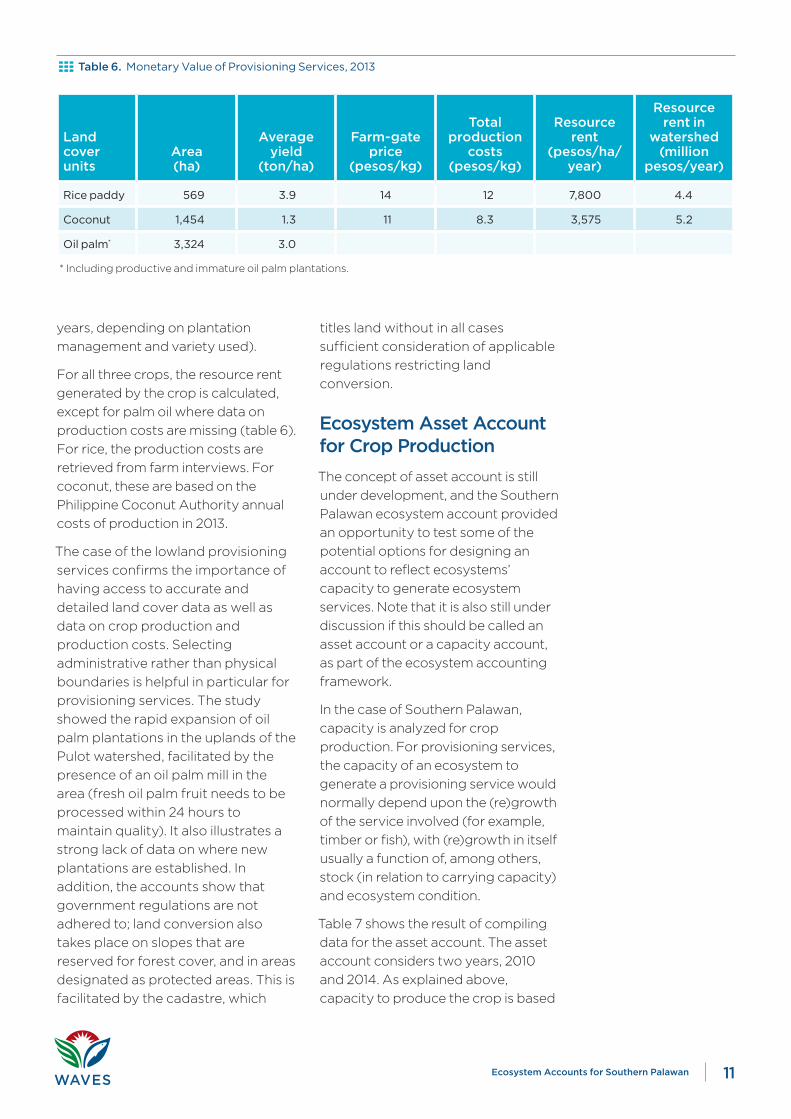
years, depending on plantation
management and variety used).
For all three crops, the resource rent
generated by the crop is calculated,
except for palm oil where data on
production costs are missing (table 6).
For rice, the production costs are
retrieved from farm interviews. For
coconut, these are based on the
Philippine Coconut Authority annual
costs of production in 2013.
The case of the lowland provisioning
services confirms the importance of
having access to accurate and
detailed land cover data as well as
data on crop production and
production costs. Selecting
administrative rather than physical
boundaries is helpful in particular for
provisioning services. The study
showed the rapid expansion of oil
palm plantations in the uplands of the
Pulot watershed, facilitated by the
presence of an oil palm mill in the
area (fresh oil palm fruit needs to be
processed within 24 hours to
maintain quality). It also illustrates a
strong lack of data on where new
plantations are established. In
addition, the accounts show that
government regulations are not
adhered to; land conversion also
takes place on slopes that are
reserved for forest cover, and in areas
designated as protected areas. This is
facilitated by the cadastre, which
titles land without in all cases
sufficient consideration of applicable
regulations restricting land
conversion.
EcosystemAssetAccountforCropProduction
The concept of asset account is still
under development, and the Southern
Palawan ecosystem account provided
an opportunity to test some of the
potential options for designing an
account to reflect ecosystems’
capacity to generate ecosystem
services. Note that it is also still under
discussion if this should be called an
asset account or a capacity account,
as part of the ecosystem accounting
framework.
In the case of Southern Palawan,
capacity is analyzed for crop
production. For provisioning services,
the capacity of an ecosystem to
generate a provisioning service would
normally depend upon the (re)growth
of the service involved (for example,
timber or fish), with (re)growth in itself
usually a function of, among others,
stock (in relation to carrying capacity)
and ecosystem condition.
Table 7 shows the result of compiling
data for the asset account. The asset
account considers two years, 2010
and 2014. As explained above,
capacity to produce the crop is based
Table6. Monetary Value of Provisioning Services, 2013
Landcoverunits
Area(ha)
Averageyield
(ton/ha)
Farm-gateprice
(pesos/kg)
Totalproduction
costs(pesos/kg)
Resourcerent
(pesos/ha/year)
Resourcerentin
watershed(million
pesos/year)
Rice paddy 569 3.9 14 12 7,800 4.4
Coconut 1,454 1.3 11 8.3 3,575 5.2
Oil palm* 3,324 3.0
* Including productive and immature oil palm plantations.
11Ecosystem Accounts for Southern Palawan
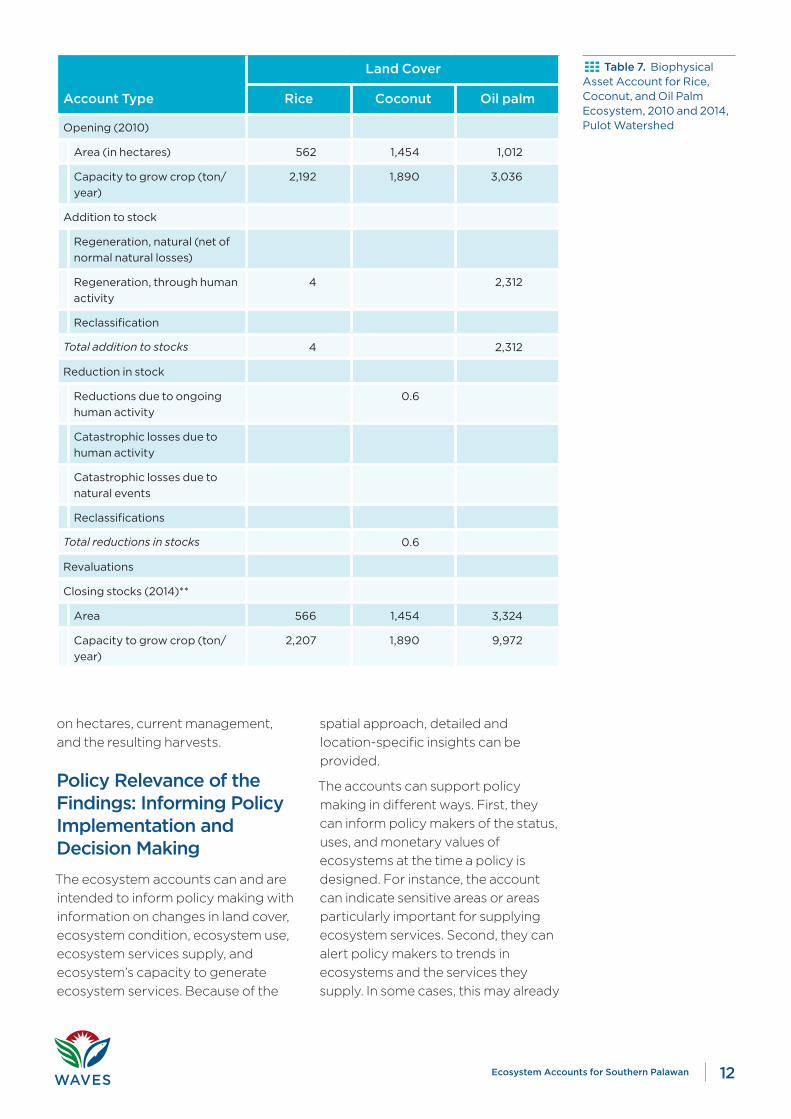
Table7. Biophysical Asset Account for Rice, Coconut, and Oil Palm Ecosystem, 2010 and 2014, Pulot Watershed
on hectares, current management,
and the resulting harvests.
PolicyRelevanceoftheFindings:InformingPolicyImplementationandDecisionMaking
The ecosystem accounts can and are
intended to inform policy making with
information on changes in land cover,
ecosystem condition, ecosystem use,
ecosystem services supply, and
ecosystem’s capacity to generate
ecosystem services. Because of the
spatial approach, detailed and
location-specific insights can be
provided.
The accounts can support policy
making in different ways. First, they
can inform policy makers of the status,
uses, and monetary values of
ecosystems at the time a policy is
designed. For instance, the account
can indicate sensitive areas or areas
particularly important for supplying
ecosystem services. Second, they can
alert policy makers to trends in
ecosystems and the services they
supply. In some cases, this may already
AccountType
LandCover
Rice Coconut Oilpalm
Opening (2010)
Area (in hectares) 562 1,454 1,012
Capacity to grow crop (ton/
year)
2,192 1,890 3,036
Addition to stock
Regeneration, natural (net of
normal natural losses)
Regeneration, through human
activity
4 2,312
Reclassification
Total addition to stocks 4 2,312
Reduction in stock
Reductions due to ongoing
human activity
0.6
Catastrophic losses due to
human activity
Catastrophic losses due to
natural events
Reclassifications
Total reductions in stocks 0.6
Revaluations
Closing stocks (2014)**
Area 566 1,454 3,324
Capacity to grow crop (ton/
year)
2,207 1,890 9,972
12Ecosystem Accounts for Southern Palawan
have affected incomes of the people
depending upon these ecosystems; in
other cases, this information can be
used to forecast potential future
impacts, for instance, in case the
underlying ecosystem condition and
capacity to generate services is
deteriorating but not yet the actual
supply of services (for example,
because of increases in harvest
efforts). Third, the accounts allow
monitoring trends in ecosystems over
time, thereby providing information on
the effectiveness of specific policies.
A particular added value of the
accounts is that they bring together
information that is usually dispersed in
different government units and line
agencies, leading to easier access to an
integrated data set and new insights
resulting from bringing together these
data. The accounts also make clear
what data are missing in order to
obtain a good understanding of
environmental change and its effects
on people’s livelihoods.
The pilot ecosystem account
completed by the TWG with support
from national and international
experts demonstrates a number of
points:
i. Ecosystem accounting fills an
important information gap in
provincial- and municipal-level
ecosystem management.
ii. The pilot demonstrated that
information required for
analyzing many ecosystems was
available in the various line
agencies; data availability was
much higher than anticipated.
iii. The accounts demonstrated that
it was time-consuming to compile
the accounts, requiring the effort
of a number of staff from the
PCSD and DENR, as well as
substantial support from national
and international experts.
However, with increasing
experience further accounts can
be produced in a more cost-
effective manner.
iv. It is clear that an important part of
the value of the accounts is in
showing trends in ecosystem
condition, asset, and service flows.
This means that the accounts
should be regularly updated.
v. The pilot provided a number of
lessons on the appropriate scale
of the accounts. For some
services, such as carbon
sequestration, it is likely to be
most cost-effective if they are
analyzed for large areas at a time,
rather than for individual
watersheds.
vi. The pilot study showed the need
for a proper and well-designed
system to store and share
information, including GIS maps,
as well as the critical importance
of having people with good GIS
capacity involved.
vii. The ecosystem accounting
approach shows the key data
gaps for information required for
environmental management.
viii. There is a need to consider what
lessons can be drawn from the
case study for national-level
environmental and
environmental-economic
statistics, jointly with the
Philippines Statistics Authority.
The policy relevance of the account
will be tested and evaluated by
means of a stakeholder consultation
process.
The World Bank through the WAVES
Partnership Program provided
technical assistance and capacity
building in ecosystem accounting
while other national government
agencies and government-owned
and controlled corporations provided
support in data acquisition.
13Ecosystem Accounts for Southern Palawan
Download Policy Briefings at www.wavespartnership.org
References
Aliño, P. M., C. Nañola, W. Campos, V.
Hilomen, A. Uychiaoco, and S.
Mamauag. 2004. “Philippine
Coral Reef Fisheries: Diversity in
Adversity.” In In Turbulent Seas:
The Status of Philippine Marine
Fisheries, edited by DA-BFAR
(Department of Agriculture-
Bureau of Fisheries and Aquatic
Resources). Cebu City,
Philippines: Coastal Resource
Management Project.
DENR (Department of Environment
and Natural Resources).
Administrative Order 49
(November 6, 1992).
PCSD (Palawan Council for
Sustainable Development). 2011.
“Coastal Resource Monitoring
Report 2011 for the Municipality of
Sofronio Española.” Palawan,
Philippines: PCSD.
Phil-WAVES TWG – Southern
Palawan. 2015. “Ecosystem
Account for Southern Palawan:
Interim Report.” Manila: World
Bank.
United Nations, 2014a. System of Environmental-Economic Accounting 2012: Experimental Ecosystem Accounting. New
York: United Nations.
United Nations. 2014b. System of Environmental-Economic Accounting 2012: Central Framework. New York: United
Nations.
Wealth Accounting and the Valuation of Ecosystem Services (WAVES) is a global partnership led by the World Bank that aims to promote
sustainable development by ensuring that natural resources are mainstreamed in development planning and national economic accounts.


![[Exercise Name] Actor Briefing [Date] Actor Briefing [Date]](https://static.fdocuments.in/doc/165x107/56649e615503460f94b5bd60/exercise-name-actor-briefing-date-actor-briefing-date.jpg)