Policy Brief 13-19: Progress on Sovereign Wealth Fund ... · Progress on Sovereign Wealth Fund...
29
NUMBER PB13-19 AUGUST 2013 REVISED DECEMBER 2013 1750 Massachusetts Avenue, NW Washington, DC 20036 Tel 202.328.9000 Fax 202.659.3225 www.piie.com Policy Brief Progress on Sovereign Wealth Fund Transparency and Accountability: An Updated SWF Scoreboard Allie E. Bagnall and Edwin M. Truman Allie E. Bagnall was a research analyst at the Peterson Institute between 2010 and 2013. Edwin M. Truman, senior fellow since 2001, served as assistant secretary of the US Treasury for International Affairs from December 1998 to January 2001, and returned as counselor to the secre- tary March–May 2009. He directed the Division of International Finance of the Board of Governors of the Federal Reserve System from 1977 to 1998. He is the author, coauthor, or editor of Sovereign Wealth Funds: reat or Salvation? (2010), Reforming the IMF for the 21st Century (2006), A Strategy for IMF Reform (2006), Chasing Dirty Money: e Fight Against Money Laundering (2004), and Inflation Targeting in the World Economy (2003). Authors’ note: We thank Steve Weisman for very helpful comments on an earlier draft. is revision reflects the 2011 replacement of Iran’s Oil Stabilization Fund with its National Development Fund as a member of the International Forum of Sovereign Wealth Funds. We have scored the latter as the successor of the former. © Peterson Institute for International Economics. All rights reserved. e term sovereign wealth fund (SWF) had not been coined a decade ago. By 2007, economists and the financial world were alternatively excited about or alarmed by the growing influence of these institutions, though in fact many of them had been around for decades. Politicians in countries in which the funds invested generally welcomed the additional finan- cial resources from abroad while expressing concern about the motivations of investors and what they feared could be threats to political, economic, and financial security. e general public in the countries in which the funds were based real- ized at the same time that political leaders were investing large amounts of national wealth at home and abroad with limited disclosure, and they wanted to know more. Following the global economic and financial crisis of 2008–09, the highly publicized debate over SWFs died down, in part because the assets managed by the funds stopped growing as rapidly as many had predicted. In addition, the general public in both recipient and home countries learned more about the funds, and the authorities and managers responsible for SWFs in many countries took steps to demystify the funds. For example, in September 2008 the International Working Group (IWG) of Sovereign Wealth Funds adopted a set of Generally Accepted Principles and Practices for SWFs in Santiago, Chile. is framework is known as the Santiago Principles. Truman was an early advocate of greater transpar- ency and accountability for SWFs and, in part with Bagnall, actively participated in subsequent reviews of progress. 1 is Policy Brief provides an update on the transparency and accountability of SWFs based on the SWF scoreboard that Truman first developed in 2007 and subsequently refined. For comparison, we have also scored the funds according to the Santiago Principles. 2 Many SWFs, in particular funds associated with the International Forum of Sovereign Wealth Funds (IFSWF), which succeeded the IWG in 2009, have made substantial progress in responding to demands at home and abroad for greater transparency and accountability about their activities. However, that progress has not been uniform. Moreover, most of the newer SWFs appear not to be following the example of the best of the older funds. e IFSWF also has fallen short in promoting the substantial adherence of some of its members to those principles. e highest scoring funds are those of Norway, New Zealand, Chile, the United States (Alaska), and Ireland. Norway’s Government Pension Fund–Global currently is the largest in the world as well as the highest ranking, but it is the only fund ranking in the top five that has more than $50 billion in assets under management. Each of these funds, as well as six of the next seven high-ranking funds, is associated with the IFSWF. At the other end of the spectrum, three of five lowest-scoring funds, those of Qatar, Libya, and Equatorial Guinea, are also associated with the IFSWF, and the estimated 1. See Truman (2007, 2008a, 2008b, 2008c, 2010, 2011) and Bagnall and Truman (2011). 2. Our scoring of SWFs on the Santiago Principles uses the elements of the SWF scoreboard where there is an overlap.
Transcript of Policy Brief 13-19: Progress on Sovereign Wealth Fund ... · Progress on Sovereign Wealth Fund...

N U M B E R P B 1 3 - 1 9 A U G U S T 2 0 1 3R E V I S E D D E C E M B E R 2 0 1 3
1750 Massachusetts Avenue, NW Washington, DC 20036 Tel 202.328.9000 Fax 202.659.3225 www.piie.com
Policy Brief
Progress on Sovereign
Wealth Fund Transparency
and Accountability: An
Updated SWF Scoreboard
A l l i e E . B a g n a l l a n d E d w i n M . Tr u m a n
Allie E. Bagnall was a research analyst at the Peterson Institute between 2010 and 2013. Edwin M. Truman, senior fellow since 2001, served as assistant secretary of the US Treasury for International Aff airs from December 1998 to January 2001, and returned as counselor to the secre-tary March–May 2009. He directed the Division of International Finance of the Board of Governors of the Federal Reserve System from 1977 to 1998. He is the author, coauthor, or editor of Sovereign Wealth Funds: Th reat or Salvation? (2010), Reforming the IMF for the 21st Century (2006), A Strategy for IMF Reform (2006), Chasing Dirty Money: Th e Fight Against Money Laundering (2004), and Infl ation Targeting in the World Economy (2003).
Authors’ note: We thank Steve Weisman for very helpful comments on an earlier draft. Th is revision refl ects the 2011 replacement of Iran’s Oil Stabilization Fund with its National Development Fund as a member of the International Forum of Sovereign Wealth Funds. We have scored the latter as the successor of the former.
© Peterson Institute for International Economics. All rights reserved.
Th e term sovereign wealth fund (SWF) had not been coined a decade ago. By 2007, economists and the fi nancial world were alternatively excited about or alarmed by the growing infl uence of these institutions, though in fact many of them had been around for decades. Politicians in countries in which the funds invested generally welcomed the additional fi nan-cial resources from abroad while expressing concern about the motivations of investors and what they feared could be threats to political, economic, and fi nancial security. Th e general public in the countries in which the funds were based real-ized at the same time that political leaders were investing large amounts of national wealth at home and abroad with limited disclosure, and they wanted to know more.
Following the global economic and fi nancial crisis of 2008–09, the highly publicized debate over SWFs died down, in part because the assets managed by the funds stopped growing as rapidly as many had predicted. In addition, the general public in both recipient and home countries learned more about the funds, and the authorities and managers responsible for SWFs in many countries took steps to demystify the funds. For example, in September 2008 the International Working Group (IWG) of Sovereign Wealth Funds adopted a set of Generally Accepted Principles and Practices for SWFs in Santiago, Chile. Th is framework is known as the Santiago Principles. Truman was an early advocate of greater transpar-ency and accountability for SWFs and, in part with Bagnall, actively participated in subsequent reviews of progress.1
Th is Policy Brief provides an update on the transparency and accountability of SWFs based on the SWF scoreboard that Truman fi rst developed in 2007 and subsequently refi ned. For comparison, we have also scored the funds according to the Santiago Principles.2 Many SWFs, in particular funds associated with the International Forum of Sovereign Wealth Funds (IFSWF), which succeeded the IWG in 2009, have made substantial progress in responding to demands at home and abroad for greater transparency and accountability about their activities. However, that progress has not been uniform. Moreover, most of the newer SWFs appear not to be following the example of the best of the older funds. Th e IFSWF also has fallen short in promoting the substantial adherence of some of its members to those principles.
Th e highest scoring funds are those of Norway, New Zealand, Chile, the United States (Alaska), and Ireland. Norway’s Government Pension Fund–Global currently is the largest in the world as well as the highest ranking, but it is the only fund ranking in the top fi ve that has more than $50 billion in assets under management. Each of these funds, as well as six of the next seven high-ranking funds, is associated with the IFSWF. At the other end of the spectrum, three of fi ve lowest-scoring funds, those of Qatar, Libya, and Equatorial Guinea, are also associated with the IFSWF, and the estimated
1. See Truman (2007, 2008a, 2008b, 2008c, 2010, 2011) and Bagnall and Truman (2011).
2. Our scoring of SWFs on the Santiago Principles uses the elements of the SWF scoreboard where there is an overlap.

N U M B E R P B 1 3 - 1 9 A U G U S T 2 0 1 3R E V I S E D D E C E M B E R 2 0 1 3
2
size of the Qatar Investment Authority is more than $100 billion and of the Libyan Investment Authority more than $50 billion. Th e IFSWF appears to have been broadly, but not universally, successful in raising global standards of transpar-ency and accountability of SWFs.
In what follows, we fi rst review updated estimates of the size of SWFs.3 We next present the 2012 SWF scoreboard including six funds that we have scored for the fi rst time. We also examine the progress in accountability and transparency that has been achieved, on the basis of this standard, since 2007. In addition, we compare results based on the Santiago Principles, and we look briefl y at three other related indicators of transparency.
G R O W T H O F S W F S
A rough estimate is that the total assets of SWF assets sextu-pled between the end of 2002 and the end of 2007, at which point assets under management were $2.8 trillion (Truman 2008c), on the IWG’s defi nition of SWFs. Contemporary esti-mates (Truman 2010, 17) were that they would have reached as much as $7.5 trillion by 2011, $12 trillion by 2015, and $17.5 trillion by 2017. Truman (2010, table 2.1) estimated
3. In this Policy Brief, we employ the defi nition of a SWF adopted by the International Working Group of SWFs (IWG 2008, 3). Th at defi nition includes government pension reserve funds as SWFs. Th ese are funds that are not directly linked to the fi nancing of social security systems but are expected to be used for that purpose in the future. Th e defi nition does not include other forms of government pension funds. However, we report some information on such funds in some of the tables that follow. Th e IWG agreed: “SWFs are spe-cial purpose investment funds or arrangements that are owned by the general government. Created by the general government for macroeconomic purposes, SWFs hold, manage, or administer assets to achieve fi nancial objectives, and employ a set of investment strategies that include investing in foreign fi nancial assets.” Th e IWG noted that “general government includes both central govern-ment and subnational government.” It added, “SWFs are commonly established out of balance of payments surpluses, offi cial foreign currency operations, the proceeds of privatizations, fi scal surpluses, and/or receipts resulting from commodity exports.” Th is language on the fi nancial resources used to establish and expand SWFs is also found in the International Monetary Fund’s (IMF) Sixth Balance of Payments and International Investment Position Manual (IMF 2009).
total SWF assets in mid-2010 at $3.1 trillion, including $2.6 trillion in foreign assets. As shown in table 1, estimated total SWF assets as of mid-2013 were $4.2 trillion, including $3.6 trillion in foreign assets—increases of almost 40 percent from mid-2010.4
Th us, SWFs have not grown at the rate that was antici-pated six years ago.5 Some have failed.6 Nevertheless, SWFs remain important international fi nancial players; 18 SWFs have estimated assets of more than $50 billion, nine have assets of more than $100 billion, and fi ve have assets of more than $300 billion. Consequently the accountability and trans-parency of SWFs remain a matter of public concern in both host and home countries.
T H E 2012 S W F S CO R E B O A R D
Table 2 presents a summary assessment of the accountability and transparency of 49 SWFs and nine government pension funds using the SWF scoreboard that Truman fi rst developed in 2007, updated with the most recently available informa-tion.7 In this new edition of the scoreboard, we include six new SWFs and dropped one SWF, as discussed below.8 Th erefore, table 2 provides results for 49 SWFs and nine government pension funds for a total of 58 funds, which is fi ve more than the 54 funds scored in the 2009 edition of the scoreboard. Th e funds scored span 52 countries, 48 of which have SWFs, four with only government pension funds and fi ve with both.
4. Th e total fi gure is essentially identical to the Sovereign Wealth Fund Institute (SWFI) estimate for June 2010, $4.1 trillion, scaled down by 25 percent. See www.swfi nstitute.org/fund-rankings (accessed July 1, 2013). Th e SWFI estimates include some entities that do not fi t the IWG defi nition of SWFs. Based on the SWFI fi gures for June 2013 the estimate in table 1 of total SWF assets is about 25 percent lower than the SWFI estimate of $5.5 trillion.
5. Th e SWFI estimates imply an increase in SWF assets of 59 percent over the six-year period. Interestingly, the imprecise proxy for SWF investments in the United States, the line in the US international investment position data “other foreign offi cial assets,” implies a 90 percent increase in SWF investments in the United States over the same period.
6. We have dropped Papua New Guinea’s Mineral Resource Stabilization Fund, which has not been scored, from this tabulation in table 1 because it has failed; see Monk (2010). It is not the fi rst, nor likely to be the last, SWF to have failed; domestic politics and poor design often defeat sound intentions.
7. Appendix A provides a description of the SWF-scoreboard approach, the 33 individual elements included in the scoreboard, and how the scoreboard has evolved. Appendix B provides the 2012 scores for each of the 49 SWFs and nine government pension funds. Th e assessment was completed in July 2013, using currently available information, but in many cases that information is from the end of 2012. Th erefore, this scoreboard should be regarded as the 2012 scoreboard, and the results in Truman (2010) as the 2009 scoreboard.
8. We treat the Oil Revenue Stabilization Account previously owned by Sudan as being owned by Sudan and South Sudan because that is the way we under-stand the terms of the agreement to create a new country. However, there is not a lot of information on its activities.
Nor way ’s Government Pension Fund–
Global c urrently is the largest in the
world as well as the highest ranking,
but it is the only fund ranking in the
top five that has more than $50 bil l ion
in assets under management.

N u m b e r P b 1 3 - 1 9 a u g u s t 2 0 1 3r e v i s e d d e c e m b e r 2 0 1 3
3
N U M B E R P B 1 3 - X X X M O N T H 2 0 1 3
1
Table 1 SWF assets (billions of US dollars) Country Fund Total assets Foreign assets
Norway Government Pension Fund-Global* 720 720
UAE (Abu Dhabi) Abu Dhabi Investment Authority* 627** 627**
China China Investment Corporation* 482 187
Hong Kong Exchange Fund 359 334
Kuwait Kuwait Investment Authority* 342 342
Singapore Government of Singapore Investment Corporation* 248** 248**
Singapore Temasek Holdings* 174 122
Russia National Welfare Fund and Reserve Fund* 171 171
Qatar Qatar Investment Authority* 115** 115**
Australia Future Fund (PR)* 88 61
Kazakhstan National Fund 76 64
UAE (Dubai) Investment Corporation of Dubai 70* 70*
UAE (Abu Dhabi) International Petroleum Investment Company 65 65
Korea Korea Investment Corporation* 57 57
Libya Libyan Investment Authority* 56** 56**
Algeria Revenue Regulation Fund 55 55
UAE (Abu Dhabi) Mubadala Development Company 55 22**
Iran National Development Fund 54 18**
United States Alaska Permanent Fund* 47 17
Malaysia Khazanah Nasional* 40 4
Azerbaijan State Oil Fund* 35 35
Brunei Brunei Investment Agency 30** 30**
United States Texas Permanent School Fund 29 8
New Zealand Superannuation Fund (PR)* 23 18
Chile Economic and Social Stabilization Fund* 22 22
Kazakhstan National Investment Corp 20 20**
Canada Alberta Heritage Savings Trust Fund* 17 7
Ireland National Pensions Reserve Fund (PR)* 15 4**
Timor-Leste Petroleum Fund* 13 13
UAE (Dubai) Dubai International Capital 13** 12**
UAE (Dubai) Istithmar World 12** 12**
Bahrain Mumtalakat Holding Company 11** 9**
Oman State General Reserve Fund 8* 8*
Chile Pension Reserve Fund (PR)* 6 6
Mexico Oil Income Stabilization Fund* 6 6
United Arab Emirates Emirates Investment Authority 6 6
United States Permanent Mineral Trust Fund (Wyoming) 6 1
Brazil Sovereign Wealth Fund of Brazil 5** 2**
Angola Fundo Soberano de Angola 5** 5**
Botswana Pula Fund* 5 5
Canada Fonds des générations 5 2**
Trinidad and Tobago Heritage and Stabilization Fund* 5 5
Peru Fiscal Stabilization Fund 4 4
United States Severance Tax Permanent Fund (New Mexico) 4 0.5
(continues)

N u m b e r P b 1 3 - 1 9 a u g u s t 2 0 1 3r e v i s e d d e c e m b e r 2 0 1 3
4
N U M B E R P B 1 3 - X X X M O N T H 2 0 1 3
2
Table 1 SWF assets (billions of US dollars) (continued)Country Fund Total assets Foreign assets
United States Alabama Trust Fund 2 0.6
Colombia Oil Stabilization Fund 2** 2**
UAE (Ras al Khaimah) RAK Investment Authority 1** 1**
China Shanghai Financial Holdings 1** 1**
Nigeria Sovereign Investment Authority 1 1
North Dakota Legacy Fund 1 1**
Ghana Ghana Petroleum Funds 0.9 .9**
Venezuela National Development Fund 0.8** 0.8**
Venezuela Macroeconomic Stabilization Fund 0.8 0.8
Vietnam State Capital Investment Corporation 0.7 0.7
Kiribati Revenue Equalization Reserve Fund 0.6* 0.6*
Turkmenistan Stabilization Fund 0.5** 0.5**
UAE (Dubai) DIFC Investments 0.5** 0.5**
Gabon Fund for Future Generations 0.4 0.4
Uganda Poverty Action Fund 0.4** 0.4**
Indonesia Government Investment Unit of Indonesia 0.3 0.3
Mauritania National Fund for Hydrocarbon Reserves 0.3 0.3
Mongolia Fiscal Stability Fund 0.3 0.3**
Panama Fondo de Ahorro de Panama 0.3 0.3**
São Tomé and Príncipe National Oil Account 0.1** 0.1**
Sudan /South Sudan Oil Revenue Stabilization Account 0.1 0.1
Equatorial Guinea Fund for Future* 0.08* 0.08*
Nauru Phosphate Royalties Trust 0.06 0.06
Subtotal 4,221 3,609
of which IFSWF members 3,384 2,869
of which non-IFSWF members 837 740
Country Government pension funds Total Assets Foreign Assets
Japan Government Pension Investment Fund 1,293 292
Netherlands Stichting Pensioenfonds ABP 369 303**
United States California Public Employees’ Retirement System 258 71
Canada Canada Pension Plan 183 116
Canada Caisse de dépôt placement du Québec 176 75
China National Social Security Fund (China) 161 32**
Canada Ontario Teachers’ Pension Plan 130 60**
France Fonds de réserve pour les retraites 48 32**
Thailand Government Pension Fund (Thailand) 17 3**
Subtotal 2,635 984
Total 6,852 4,595
Note: Funds evaluated on the SWF scoreboard are italicized.
* denotes International Forum of Sovereign Wealth Funds (IFSWF) member.** denotes estimate.PR denotes a pension reserve fund.
Source: National and international reports.

N U M B E R P B 1 3 - 1 9 A U G U S T 2 0 1 3R E V I S E D D E C E M B E R 2 0 1 3
5
Table 2 2012 SWF scoreboard
Country Fund Score
Norway Government Pension Fund-Global 98
New Zealand Superannuation Fund (PR) 94
Chile Economic and Social Stabilization Fund 91
United States Alaska Permanent Fund 91
Ireland National Pensions Reserve Fund (PR) 90
Australia Future Fund (PR) 89
United States Wyoming Permanent Mineral Trust Fund 89
Azerbaijan State Oil Fund 88
Canada Alberta Heritage Savings Trust Fund 86
Chile Pension Reserve Fund (PR) 85
Timor-Leste Petroleum Fund 85
Trinidad and Tobago Heritage and Stabilization Fund 83
United States New Mexico Severance Tax Permanent Fund 79
Singapore Temasek Holdings 76
Kuwait Kuwait Investment Authority 73
Kazakhstan National Fund 71
Hong Kong Exchange Fund 70
Korea Korea Investment Corporation 69
United States Alabama Trust Fund 67
Singapore Government of Singapore Investment Corporation 66
United Arab Emirates Mubadala Development Company 65
China China Investment Corporation 64
Malaysia Khazanah Nasional 59
United Arab Emirates Abu Dhabi Investment Authority 58
Botswana Pula Fund 56
United Arab Emirates Dubai International Capital 55
Russia National Welfare Fund and Reserve Fund 53
São Tomé & Principe National Oil Account 48
Ghana Petroleum Funds 47
United Arab Emirates International Petroleum Investment Company 46
Mexico Oil Income Stabilization Fund 44
Iran National Development Fund 41
Bahrain Mumtalakat Holding Company 39
Vietnam State Capital Investment Corporation 38
Kiribati Revenue Equalization Reserve Fund 35
Brazil Sovereign Fund of Brazil 30
Algeria Revenue Regulation Fund 29
Venezuela National Development Fund 29
Oman State General Reserve Fund 27
Venezuela Macroeconomic Stabilization Fund 27
Brunei Darussalam Brunei Investment Agency 21
United Arab Emirates Investment Corporation of Dubai 21
Nigeria Sovereign Investment Authority 18
(continues)

N U M B E R P B 1 3 - 1 9 A U G U S T 2 0 1 3R E V I S E D D E C E M B E R 2 0 1 3
6
Th e scoreboard has 33 individual elements that are equally weighted and translated into a 100-point scale. Th e average score for all funds (pension and nonpension) is 59. Th e average for all funds is positively skewed by the nine pension funds’ average of 86; the average for the SWFs alone is 54. Within the group of SWFs, the 26 funds that are members of the IFSWF average 65, and the 23 nonmembers average 42.
As was the case with the 2009 scoreboard published in Truman (2010), the scores for the SWFs are distributed widely from a low of 2 for Equatorial Guinea’s Fund for Future Generations to a high of 98 for Norway’s Government Pension Fund–Global.9 Th e funds do not fall into one high-scoring group and another low-scoring group. Instead, 12
9. Norway’s SWF has consistently scored at or near the top on the SWF scoreboards. Its score has increased from 97 on the 2009 scoreboard to 98 because, in our judgment, it now has a clearly stated policy on the use of lever-age (element 31). Th e SWF does not receive a perfect score because we give it only partial credit for having a policy on the use of derivatives (element 32). Th e SWF provides a great deal of information on its use of derivatives, but we could not fi nd a statement of underlying policy in that area.
funds score above 80; 14 funds score 30 or below; and 23 funds score more than 30 and 80 or less.
Th e evolution of the SWF scoreboard results since Truman published the fi rst scoreboard in 2007 is discussed in some detail below. However, in brief, since the 2009 scoreboard (published in 2010), the number of SWFs scoring above 80 has increased from 7 to 12. Conversely, the number of funds scoring 30 or below has also increased, from 13 to 14.10 Th e principal reason for this increase in the number of low-scoring funds is that in the 2012 scoreboard we have scored six new funds, and fi ve of them score 30 or less, including Nigeria’s new Sovereign Investment Authority, at 18, which is even lower than Nigeria’s liquidated Excess Crude Account that scored 29 in 2009.11 Th e other newly scored funds include
10. Table 5.1 in Truman (2010) lists the score for the Abu Dhabi Investment Authority (ADIA) at 11, but text box 5.2 updated that score to 58, reducing the number of funds scoring 30 or less to 13.
11. Th e Nigerian Sovereign Investment Authority was established in 2011, and reportedly its board approved its investment policies in May 2013, but the Financial Times reported on June 25, 2103 (“Volatility Delays Investment
Table 2 2012 SWF scoreboard (continued)Country Fund Score
Sudan/South Sudan Oil Revenue Stabilization Account 18
Qatar Qatar Investment Authority 17
United Arab Emirates Istithmar World 17
Angola Fundo Soberano de Angola 15
Libya Libyan Investment Authority 6
Equatorial Guinea Fund for Future Generations 2
SWF average (49) 54
IFSWF members (26) 65
Non-IFSWF members (23) 42
Pension funds
United States California Public Employees’ Retirement System 95
Canada Canada Pension Plan 93
France Fonds de réserve pour les retraites 93
Canada Caisse de dépôt et placement du Québec 91
Japan Government Pension Investment Fund 86
Canada Ontario Teachers’ Pension Plan 85
Netherlands Stichting Pensioenfonds ABP 85
Thailand Government Pension Fund 80
China National Social Security Fund 70
Pension fund average (9) 86
All funds average (58) 59
IFSWF = International Forum of Sovereign Wealth Funds
Note: The number of funds in each subgroup is indicated in the parentheses. PR denotes a pension reserve fund.
Source: Appendix B.

N U M B E R P B 1 3 - 1 9 A U G U S T 2 0 1 3R E V I S E D D E C E M B E R 2 0 1 3
7
Equatorial Guinea’s Fund for Future Generations (2) and the Libyan Investment Authority (6). We could fi nd essentially no reliable public information on these funds, which was not unexpected, but we wanted to include them because they are members of the IFSWF and, in principle, adhere to the Santiago Principles.
We scored the new, as of 2009, Sovereign Fund of Brazil (30) because it has the potential to become very large. Brazil’s record on transparency has been uneven. Brazil released the annual International Monetary Fund (IMF) staff report on its Article IV consultation for the fi rst time only last year. And only in the past few years has Brazil begun to release IMF reports on the stability of its fi nancial system. On the other hand, Brazil has subscribed to the Special Data Dissemination Standard and releases a considerable amount of information on its debt and fi scal situation as well as on domestic infl ation.
We also scored the new (2011) Ghana Petroleum Funds (47) and Angola’s new (2012) Fundo Soberano de Angola (15) because both these funds are important as African extractive-economy models. We were entirely not encouraged by the results. Th e score of Ghana’s SWF places it in the middle group but below the average for all funds. Th e creation of this SWF was politically controversial in Ghana, because societies are tempted to consume the wealth now before politicians can steal or misuse it; for that reason the government took care in establishing the Ghanaian SWF’s legal structure. But the subsequent evidence of careful implementation is skimpy.12 We also wanted to score Mongolia’s Fiscal Stability Fund, established in 2011, because it could play a signifi cant role in contributing to that country’s macroeconomic stability in the context of a boom in its commodity exports; however, there is
from Nigeria Sovereign Wealth Fund”) (accessed July 22, 2013) that it has delayed making its initial investments. Th is may explain why the SWF has yet to provide much information on its activities.
12. For example, the governing law requires both annual reports and semian-nual reports, but the public record so far includes only semiannual reports by the Bank of Ghana. Th ey focus more on tracing the funds fl owing from the petroleum investments than on the deployment of the funds into the two com-ponents of the SWF: a stabilization fund and a longer-term investment fund.
insuffi cient information available to do any type of an assess-ment of that fund.13
For each of the fi ve newly scored SWFs with very low scores, it might be argued that there are extenuating circumstances. A more disturbing conclusion is that despite the availability of the Santiago Principles, to say nothing of the SWF scoreboard, to guide their policies on transparency and accountability, these funds have fallen substantially short, or continue to fall substan-tially short, of many of their peers. It is also discouraging that only three of the SWFs that registered 30 or less on the 2009 scoreboard have moved up signifi cantly: Bahrain’s Mumtalakat Holding Company, whose score improved marginally to 39, Iran somewhat more to 41, and United Arab Emirates’ International Petroleum Investment Company, whose score increased to 46.
A S S E S S I N G P R O G R E S S
Notwithstanding the apparent lack of progress in increasing the transparency and accountability of some SWFs, a number of SWFs have made substantial progress over the fi ve years since the publication of the fi rst SWF scoreboard, from 2007 to 2012.14,15 Th e upper panel of table 3 summarizes the progress of 32 SWFs and the California Public Employees’ Retirement System (CalPERS). Th e average total change in the score of these 32 SWFs is 17 percentage points. Th e change in the score for CalPERS is 8 percentage points, from a higher 2007 score than for the 32 SWFs, suggesting that the trend toward greater transparency and accountability is not limited to SWFs.
As can be seen from table 3, a number of funds made signifi cant improvements in the entire 2007–12 period, led by the Abu Dhabi Investment Authority (ADIA) and the Government of Singapore Investment Corporation, with increases of more than 50 percentage points each, and Chile’s Economic and Social Stabilization Fund, Trinidad and Tobago’s Heritage and Stabilization Fund, the Korea Investment Corporation, the UAE’s Mubadala Development Company, the China Investment Corporation, and the UAE’s
13. Th e same is true for the SWFs of Libya and Equatorial Guinea, but in those cases we wanted to establish the lack of information in connection with their membership in the IFSWF.
14. As described in appendix A, some adjustments in the SWF scoreboard were made between 2007 and 2009, which accounts for some of the minus signs in the 2007–09 column in the table. However, the results are broadly comparable; see Truman (2010, 89–91).
15. Th e 2009 scores are slightly diff erent from those published in Truman (2010) because we have included the score for the ADIA that appeared in the text boxes (5.2 and 6.1) and we have marginally adjusted the scores for a few elements for a few countries to make them consistent with the other 2009 scores.
Notwithstanding the apparent lack of
progress in increasing the transparenc y and
accountabil ity of some SWFs, a number of
SWFs have made substantial progress over
the five years since the public ation of the
first SWF scoreboard, from 2007 to 2012.

N U M B E R P B 1 3 - 1 9 A U G U S T 2 0 1 3R E V I S E D D E C E M B E R 2 0 1 3
8
Table 3 Progress on SWF transparency and accountability
Change in percentage points
Country Fund 2012 score 2009–12 2007–09 2007–12
Funds first scored in 2007
Norway Government Pension Fund-Global 98 1 5 6
New Zealand Superannuation Fund (PR) 94 0 2 2
Chile Economic and Social Stabilization Fund 91 9 20 29
United States Alaska Permanent Fund 91 0 19 19
Australia Future Fund (PR) 89 9 12 21
Azerbaijan State Oil Fund 88 12 10 22
Canada Alberta Heritage Savings Trust Fund 86 13 –5 8
Timor-Leste Petroleum Fund 85 0 –2 –2
Trinidad and Tobago Heritage and Stabilization Fund 83 0 34 34
Singapore Temasek Holdings 76 3 19 22
Kuwait Kuwait Investment Authority 73 10 15 25
Kazakhstan National Fund 71 6 7 13
Korea Korea Investment Corporation 69 9 24 33
Singapore Government of Singapore Investment Corporation 66 1 56 57
United Arab Emirates Mubadala Development Company 65 6 45 51
China China Investment Corporation 64 7 33 40
Malaysia Khazanah Nasional 59 15 6 21
United Arab Emirates Abu Dhabi Investment Authority 58 0 56 56
Botswana Pula Fund 56 0 –2 –2
Russia National Welfare Fund and Reserve Fund 53 3 12 15
São Tomé & Principe National Oil Account 48 0 –1 –1
Mexico Oil Income Stabilization Fund 44 0 16 16
Iran National Development Fund 41 12 7 19
Kiribati Revenue Equalization Reserve Fund 35 0 5 5
Algeria Revenue Regulation Fund 29 0 11 11
Venezuela National Development Fund 29 2 3 5
Oman State General Reserve Fund 27 4 3 7
Venezuela Macroeconomic Stabilization Fund 27 0 5 5
Brunei Darussalam Brunei Investment Agency 21 0 11 11
Sudan/South Sudan Oil Revenue Stabilization Account 18 0 –2 –2
Qatar Qatar Investment Authority 17 2 7 9
United Arab Emirates Istithmar World 17 0 2 2
Average 59 4 14 17
Memo: United States California Public Employees’ Retirement System 95 0 8 8
Funds first scored in 2009
Canada Canada Pension Plan 93 1
France Fonds de réserve pour les retraites 93 4
Canada Caisse de dépôt et placement du Québec 91 2
Ireland National Pensions Reserve Fund (PR) 90 4
United States Wyoming Permanent Mineral Trust Fund 89 0
Japan Government Pension Investment Fund 86 2
Chile Pension Reserve Fund (PR) 85 17
Canada Ontario Teachers’ Pension Plan 85 2
(continues)

N U M B E R P B 1 3 - 1 9 A U G U S T 2 0 1 3R E V I S E D D E C E M B E R 2 0 1 3
9
International Petroleum Investment Company, with increases of 20 percentage points or more each.
A number of the SWFs with substantial increases in their scores over the entire period have also made substantial prog-ress over the past three years.16 Th ese include Azerbaijan’s State Oil Fund, Alberta Canada’s Heritage Savings Trust Fund, the Kuwait Investment Authority, Malaysia’s Khazanah Nasional, Iran’s National Development Fund, and, as shown in the lower panel, Chile’s Pension Reserve Fund and the UAE’s International Petroleum Investment Company, each with an increase of at least 10 percentage points. In general, larger increases in scores were recorded in the 2007–09 period, when the SWF issue was hot and pressure on SWFs to be more transparent and account-able was signifi cant.
Table 4 presents changes in scores from the vantage point of the 24 individual elements that have been common to each of the SWF scoreboards for the 32 SWFs that have been scored since 2007. Th is allows us to measure the areas of improvement over time for the funds that we’ve been scoring since the initial edition of the scoreboard in 2007. Th e table also provides some perspective on the relative scores on these elements for all funds as of 2012.
Th e average for the 24 elements is 60 (out of 100), which is close to the average score of 54 for all 33 elements in 2012. It is
16. Of course, the room for improvement for some funds was limited. Th ree of the 32 SWFs scored at 85 or above in the 2007 SWF scoreboard, and seven did so in the 2009 scoreboard.
not surprising that the highest scores for individual elements are those for a clear statement of an SWF’s objective and its source of funding, followed by the role of managers in the fund, having a clear process for changing the fund’s structure, and the size of the fund. Th e last element is not required or recommended by the Santiago Principles though 75 percent of these 32 SWFs and currently 80 percent of the 49 funds in the 2012 scoreboard release at least some information about their size.17 Th e lowest scores are recorded for elements on whether an SWF has a publicly stated guideline on the nature and speed of the adjust-ment in its portfolio, which would help to limit market disrup-tion, and whether it has a publicly stated guideline for ethical investment, which would govern what types of investments the SWF does not undertake. What may be most surprising about the scores on these 24 elements is how dispersed they are. Th is dispersion of behavior of the individual funds emphasizes a basic feature of the SWF scoreboard: Each element has been adopted by at least one fund.18
Not so surprisingly, most of the improvement in scores on the individual elements was during the 2007–09 period, with substantially less since 2009. Th e most substantial overall improvements, based on changes in percentage points, were with respect to clarity about how a fund’s structure can be changed, identifying the holders of investment mandates,
17. Ten funds release no information.
18. In fact, among the 49 funds, the minimum number is six practitioners for the speed of adjustment and 11 for having ethical investment guidelines.
Table 3 Progress on SWF transparency and accountability (continued)Change in
percentage points
Country Fund 2012 score 2009–12
Funds first scored in 2009 (continued)
Netherlands Stichting Pensioenfonds ABP 85 0
Thailand Government Pension Fund 80 2
United States New Mexico Severance Tax Permanent Fund 79 0
Hong Kong Exchange Fund 70 0
China National Social Security Fund 70 0
United States Alabama Trust Fund 67 0
United Arab Emirates Dubai International Capital 55 0
United Arab Emirates International Petroleum Investment Company 46 20
Bahrain Mumtalakat Holding Company 39 9
Vietnam State Capital Investment Corporation 38 3
United Arab Emirates Investment Corporation of Dubai 21 0
Average 72 3
Notes: Funds associated with the IFSWF (International Forum of Sovereign Wealth Funds) are italicized. PR denotes a pension reserve fund.
Sources: Appendix B and Truman (2010, 2008b).

N U M B E R P B 1 3 - 1 9 A U G U S T 2 0 1 3R E V I S E D D E C E M B E R 2 0 1 3
10
publishing audits, and publishing information on the returns of funds. In the more recent period, the most substantial improvements were with respect to providing information on the currency composition of investments, having ethical investment guidelines, and publishing audits.
T H E S A N T I AG O P R I N C I P L E S
Th is section compares the 2012 performance of the 49 SWFs and nine pension funds on the SWF scoreboard to the Santiago Principles. Th e Santiago Principles include 30 principles and subprinciples. Th ey overlap with 25 of the 33 elements in the
Table 4 Comparison of 24 SWF scoreboard elements
Change in percentage points
Element 2102 score 2009–12 2007–09 2007–12
Structure
Objective stated 97 3 6 9
Changes in structure 78 3 35 38
Investment strategy 75 7 15 22
Source of funding 88 0 8 8
Use of fund earnings 59 1 6 7
Integrated with policies 62 0 8 8
Separate from international reserves 72 0 0 0
Average 76 2 11 12
Governance
Role of government 75 2 20 22
Role of managers 77 0 7 7
Guidelines for corporate responsibility 28 9 5 14
Ethical investment guidelines 21 10 2 12
Average 50 5 9 14
Accountability and transparency
Categories of investments 69 5 21 26
Mandates identified 50 0 33 33
Size of fund 75 0 7 7
Returns of fund 59 4 22 26
Location of investments 48 7 16 23
Specific investments 30 7 12 19
Currency composition 44 11 7 18
Annual reports 67 1 22 23
Quarterly reports 41 2 8 10
Regular audits 74 2 17 19
Published audits 54 10 20 30
Independent audits 72 5 12 17
Average 57 5 16 21
Behavior
Portfolio adjustment 11 0 6 6
Overall average 60 4 13 17
Sources: Appendix B and Truman (2010, 2008b).

N U M B E R P B 1 3 - 1 9 A U G U S T 2 0 1 3R E V I S E D D E C E M B E R 2 0 1 3
11
SWF scoreboard; see Truman, (2010, appendix 6A) for the correspondence.19 Alternatively, 16 of the 24 major Santiago Principles overlap with one or more of the elements in the SWF scoreboard. Table 5 presents the scores of the SWFs and government pension funds on the SWF scoreboard and two versions of the Santiago Principles: 25 and 16 elements.20
Th e rankings of funds are broadly similar. In fact, the simple correlation of the scoreboard scores with the 25 elements included in the Santiago Principles is 0.9912, and the correlation with the 16 elements is 0.9609. Th e average score on the Santiago principles is 3 to 5 percentage points higher, but this diff erence is not statistically signifi cant.21 Interestingly the higher average score is essentially the same for the 26 funds that are associated with the IFSWF, which sponsors the Santiago Principles, as for the 23 funds that are not. One might expect that the funds that are associated with the IFSWF would be more inclined to tailor their adherence to international standards in the direction of the Santiago Principles, rather than the independent SWF scoreboard.
Seven SWFs record slightly lower scores on the 25-element version of the Santiago Principles than on the SWF scoreboard, and 12 funds have lower scores on the 16-element version of the Santiago Principles. Only three funds stand out with scores on the 25-element version of the Santiago principles that are 10 percentage points or more higher than on the SWF scoreboard: the Government of Singapore Investment Corporation, the ADIA, and São Tomé and Principe’s National Oil Account. Th ey are joined on the 16-element version by the China Investment Corporation, Dubai International Capital, Kiribati’s Revenue Equalization Reserve Fund, and the Fundo Soberano de Angola. On the whole, the tale of transparency and accountability told by the SWF scoreboard and that told by the Santiago Principles are very similar. Th e principal diff erence is the improvement in performance, as of 2012, of those funds that are associated with the IFSWF and those that are not.
Returning to table 3, the 24 funds associated with the IFSWF are identifi ed in italics.22 Four of the funds already
19. In fact, some elements from the Santiago Principles were incorporated into the SWF scoreboard when it was revised in 2010; see appendix A. Th e drafters of the Santiago Principles also were aware of the guidance off ered to them in Truman (2008).
20. In the latter case, the scores of more than one element on the SWF scoreboard are averaged to produce a composite score for one of the Santiago Principles; see Truman (2010, appendix 6A).
21. A small bias is introduced into the scoring because with a smaller number of elements each element that receives a score of 1.0 has a larger value on a scale of 100. Th is may, in part, explain the fact that the nine pension funds also score higher on the two versions of the Santiago Principles and by a similar margin of 3 percentage points.
22. Th e website of the IFSWF associates two funds in Singapore and two in Chile with those countries’ membership. (Note: we scored two of the 26 SWFs
had received high scores in the earliest editions of the SWF scoreboard; they did not have much room to improve because their scores at the start were 85 or above, though most scores did increase marginally.23 Th irteen of the funds have recorded increases in their scores of 20 percentage points or more, in either the 2007–12 period or just the 2009–12 period, and only two of those were not directly associated with the IFSWF: Abu Dhabi’s Mubadala Development Company and its International Petroleum Investment Company.24
Considering only the 32 SWFs that were fi rst scored in 2007, the 21 funds that now are associated with the IFSWF had an average SWF scoreboard score at that time of 49, which has increased 21 percentage points on average to 71 in 2012. In contrast, the 11 funds that are not associated with the IFSWF had a lower average score of 25 in 2007, and a more modest 10 percentage point average increase to 35 in 2012. Of the 49 SWFs scored in 2012, 26 were recorded above the mean of 54, of which 19 (73 percent) are associ-ated with the IFSWF. Of the 23 recorded below the mean, only 7 (30 percent) were associated with the IFSWF. Th us, we can conclude that association with the IFSWF appears to have served as an incentive for a number of funds to improve their performance.
On the other hand, the seven IFSWF funds that are now below the average for all SWFs are problematic in diff erent degrees.25 Th e funds of Russia and Mexico have boosted their SWF scores by 15 and 16 percentage points, respectively, since 2007 but remain below the mean. Th e scores for the other four SWFs associated with the IFSWF started out at 30 or
associated with the IFSWF for the fi rst time only in the 2012 scoreboard.) Conversely, in the case of the United Arab Emirates and the United States, which have multiple SWFs that we have scored, only one is associated with each of those countries on the website. Th ese funds are the ADIA and Alaska Permanent Fund, respectively.
23. Th e exception is Timor-Leste’s Petroleum Fund, where a slight decline is recorded, refl ecting changes in elements in the scoreboard.
24. Of the six SWFs associated with the UAE, three are linked to Abu Dhabi and three to Dubai (Dubai International Capital, Investment Corporation of Dubai, and Istithmar World). Th e average for the three Abu Dhabi funds on the 2012 SWF scoreboard is 56 and each has improved its score. Th e average for the three Dubai funds is 31, with only Dubai International Capital, at 55, about the average for all SWFs. All of the Abu Dhabi funds have improved their initial scores. Only Istithmar World, among the Dubai funds, has recorded a marginal improvement. It would appear that there has been some positive “neighborhood eff ect” in Abu Dhabi. In contrast, we fi nd no such neighborhood eff ect among the fi ve US funds that we have scored, CalPERS and four subnational SWFs. Only the Alaska Permanent Fund is linked to the IFSWF. Both CalPERS and the Alaska fund have improved their scores since 2007 when they were fi rst scored, by 8 percentage points to 95 for CalPERS and by 19 percentage points to 91 for Alaska; the scores for the other three US subnational SWFs are unchanged from 2009 when they were fi rst scored, averaging 78, 13 percentage points less than Alaska’s SWF; see table 3.
25. It does not matter whether the SWF scoreboard, the 25 Santiago Principles, or the 16 Santiago Principles are used to rate these funds, the aver-ages come out about the same at 27, 28, and 27, respectively.

N U M B E R P B 1 3 - 1 9 A U G U S T 2 0 1 3R E V I S E D D E C E M B E R 2 0 1 3
12
Table 5 2012 SWF scoreboard and the Santiago Principles
Santiago Principles
Country Fund Scoreboard 25 elements 16 elements
Norway Government Pension Fund-Global 98 98 99
New Zealand Superannuation Fund (PR) 94 98 97
Chile Economic and Social Stabilization Fund 91 92 92
United States Alaska Permanent Fund 91 94 91
Ireland National Pensions Reserve Fund (PR) 90 94 85
Australia Future Fund (PR) 89 96 96
United States Wyoming Permanent Mineral Trust Fund 89 94 93
Azerbaijan State Oil Fund 88 90 87
Canada Alberta Heritage Savings Trust Fund 86 90 89
Chile Pension Reserve Fund (PR) 85 86 83
Timor-Leste Petroleum Fund 85 80 73
Trinidad and Tobago Heritage and Stabilization Fund 83 82 81
United States New Mexico Severance Tax Permanent Fund 79 78 68
Singapore Temasek Holdings 76 82 84
Kuwait Kuwait Investment Authority 73 77 85
Kazakhstan National Fund 71 75 78
Hong Kong Exchange Fund 70 74 71
Korea Korea Investment Corporation 69 76 77
United States Alabama Trust Fund 67 74 69
Singapore Government of Singapore Investment Corporation 66 79 82
United Arab Emirates Mubadala Development Company 65 70 72
China China Investment Corporation 64 70 79
Malaysia Khazanah Nasional 59 64 69
United Arab Emirates Abu Dhabi Investment Authority 58 71 78
Botswana Pula Fund 56 62 64
United Arab Emirates Dubai International Capital 55 62 73
Russia National Welfare Fund and Reserve Fund 53 56 49
São Tomé & Principe National Oil Account 48 58 60
Ghana Petroleum Funds 47 54 54
United Arab Emirates International Petroleum Investment Company 46 47 53
Mexico Oil Income Stabilization Fund 44 42 40
Iran National Development Fund 41 48 45
Bahrain Mumtalakat Holding Company 39 43 39
Vietnam State Capital Investment Corporation 38 42 45
Kiribati Revenue Equalization Reserve Fund 35 44 54
Brazil Sovereign Fund of Brazil 30 32 36
Algeria Revenue Regulation Fund 29 32 32
Venezuela National Development Fund 29 27 30
Oman State General Reserve Fund 27 32 32
Venezuela Macroeconomic Stabilization Fund 27 28 25
Brunei Darussalam Brunei Investment Agency 21 28 25
United Arab Emirates Investment Corporation of Dubai 21 22 19
Nigeria Sovereign Investment Authority 18 24 23
(continues)

N U M B E R P B 1 3 - 1 9 A U G U S T 2 0 1 3R E V I S E D D E C E M B E R 2 0 1 3
13
lower and—with the exception of Iran’s successor National Development Fund, which has recorded an increase of 19 percentage points to a still-low total, and Bahrain’s Mumtalakat Holding Company, which has recorded a small increase of 9 percentage points—are still below 30 as of 2012. In the case of two funds, those of Libya and Equatorial Guinea, perhaps the low scores and lack of improvement is not surprising, given political conditions in those countries. In the cases of Bahrain’s Mumtalakat Holding Company and the Qatar Investment Authority (QIA), the limited improvement is decidedly disappointing.
Th e score for Bahrain’s SWF has increased 9 points since 2009. Public information about its structure and governance remains meager though it does a bit better on the elements relating directly to transparency and accountability in its operations. (See appendix B.) With respect to transparency, its website states, “We always maintain the highest standards of international corporate governance and openness.” Th e website also notes its score of 9 out of 10 on the Linaburg-Maduell Transparency Index for Sovereign Wealth Funds.
Th e QIA is associated in the press with a number of high-profi le investments through Qatar Holding, a subsidiary. Th ese investments include ownership of Harrods and stakes in Barclays Bank (which has sparked controversy), Volkswagen, and Credit Suisse. With more than $100 billion in estimated assets under management, fi nancial market participants and the citizens of Qatar as well as the citizens of host countries to the QIA’s investments are justifi ed to expect more transparency and accountability. Qatar Holding announced on February 19, 2013 that it would seek a credit rating.26 Doing so would require more disclosure of the fund’s activities, but that has not yet occurred. Moreover, the website of QIA contains very little or no information germane to either the SWF scoreboard or the Santiago Principles. It declares, “As usual with many global investment institutions which are not listed on the public markets, the QIA does not publish fi nancial information. We are acknowledged, however, as a well resourced, responsible
26. See “Qatar Holding to see Credit Rating, Didn’t have Debt Last Year,” http://www.qatarholding.qa/Media%20Center/QH%20News/Pages/QHSeeksCreditRate.aspx (accessed July 16, 2013).
Table 5 2012 SWF scoreboard and the Santiago Principles (continued) Santiago Principles
Country Fund Scoreboard 25 elements 16 elements
Sudan/South Sudan Oil Revenue Stabilization Account 18 16 16
Qatar Qatar Investment Authority 17 17 20
United Arab Emirates Istithmar World 17 16 19
Angola Fundo Soberano de Angola 15 20 27
Libya Libyan Investment Authority 6 7 5
Equatorial Guinea Fund for Future Generations 2 2 2
SWF average (49) 54 58 58
IFSWF members (26) 65 68 69
Non-IFSWF members (23) 42 46 47
Pension funds
United States California Public Employees’ Retirement System 95 96 96
Canada Canada Pension Plan 93 97 96
France Fonds de réserve pour les retraites 93 93 95
Canada Caisse de dépôt et placement du Québec 91 98 97
Japan Government Pension Investment Fund 86 89 91
Canada Ontario Teachers’ Pension Plan 85 88 91
Netherlands Stichting Pensioenfonds ABP 85 84 87
Thailand Government Pension Fund 80 83 84
China National Social Security Fund 70 74 68
Pension fund average (9) 86 89 89
All funds average (59) 59 63 63
IFSWF = International Forum of Sovereign Wealth Funds
Note: The number of funds in each subgroup is indicated in the parentheses. PR denotes a pension reserve fund.
Source: Appendix B.

N U M B E R P B 1 3 - 1 9 A U G U S T 2 0 1 3R E V I S E D D E C E M B E R 2 0 1 3
14
investor, as manifested by our track record of transactions.” Such a claim is impossible to substantiate without supporting documentation. In this case, the Linaburg-Maduell rating provides less of an endorsement, at 5 out of 10, but that rela-tive score is still substantially higher than the QIA receives on the SWF scoreboard or the Santiago Principles.
What are we to conclude about the IFSWF and the Santiago Principles? It is a mixed story so far. First, the Santiago Principles were a compromise and, as a result, are not as rigorous as outsiders would prefer. For example, they are not explicit about what information should be publicly disclosed. In addition, 10 of the 30 Santiago Principles and subprinciples have little to do with the public and, rather, focus on relations between the fund and its government. Managers of SWFs, like central bankers that are often their philosophical cousins if not their de facto brothers and sisters, treasure their independence from their governments, which is a questionable long-term posture for both.
Also, as part of the 2008 compromise, the Santiago Principles do not call for SWFs to disclose their size, though about 80 percent of funds do so. Th ey also are silent about the need to distinguish between SWF funds and international reserves; about 60 percent of SWFs make that distinction. Th ey do not call for disclosure of the currency composition of investments although more than a third of all SWFs do so. Th ey are silent on providing information on specifi c invest-ments, but one-third of funds do so. And they do not advocate that SWF audits be published despite the fact that more than 50 percent of all SWFs and two-thirds of funds associated with the IFSWF do so. Given that SWF transparency is of primary concern to citizens in SWF home and investment host countries, we consider these points of nondisclosure to be of considerable importance. Th e size of a fund is an indication of its potential infl uence; information on reserves, currency composition, and investment suggest how the fund is trans-parent and accountable in its management of that infl uence.
Second, however, it would appear from the results presented above that association with the IFSWF has provided an incentive to a number of funds to increase their transpar-ency and accountability. On the other hand, not all funds associated with the IFSWF have responded to such incentives, and progress among nonmembers lags substantially behind progress among members.
Th ird, it is gratifying that Malaysia and its Khazanah Nasional have recently quietly joined the IFSWF; a search of the internet turned up no announcement of that deci-sion, but they are listed as members on the IFSWF website. Nevertheless, three economies with SWFs with estimated assets under management of more than $50 billion have not joined the IFSWF: Kazahkstan’s National Fund, Hong Kong’s Exchange Fund, and Algeria’s Revenue Regulation Fund. Th e
fi rst and second register a reasonably respectable 71 and 70, respectively, on the SWF scoreboard, and the third is at 32.
CO M PA R I S O N W I T H OT H E R T R A N S PA R E N C Y I N D E X E S
Neither the Santiago Principles nor the SWF scoreboard is the only game in town when it comes to assessing the transparency and accountability of SWFs or the countries with which they are associated. In this fi nal section, we look at the correlation between the SWF scoreboard measure of transparency and accountability of SWFs and the March 2013 Linaburg-Maduell Transparency Index for SWFs associated with the Sovereign Wealth Fund Institute, the Revenue Watch Institute’s 2013 Resource Governance Index, and Transparency International’s 2012 Corruption Perceptions Index. Table 6 presents results from the 2012 SWF scoreboard for the 49 SWFs along with comparable results on the Linaburg-Maduell index, where available for the SWF, and on the Revenue Watch Institute’s index and the Transparency International index where avail-able for the home country.
Th e scores on the three indexes are strongly correlated with the SWF scoreboard results at a very high level of signifi -cance.27 Th is result is not surprising. Th e high correlation is also somewhat reassuring because each index looks at the SWF elephant and its sponsoring country from a slightly diff erent perspective.
Truman (2010, 94–96) is critical of the Lindburg-Maduell index for being superfi cial in some of its 10 elements (such as: Does the fund have a website?), not releasing the resulting scores for each element, and for combining many factors into some elements, such as portfolio value, returns, and management compensation, without providing any information about how the factors were weighted within each element. Although the Linaburg-Maduell index yields results that are broadly similar to the SWF scoreboard, it assigns high scores, relative to the SWF scoreboard, to the SWFs of Korea, Bahrain, Brazil, Qatar, and three funds of the United Arab Emirates, and relatively low scores to Singapore’s Temasek and the SWF of Kiribati.
Th e Revenue Watch Institute’s country index rates highly, again relative to the scoreboard for one or more of their SWFs, Ghana, Mexico, Brazil, Venezuela, Nigeria, and Angola, and the reverse for Azerbaijan, Timor-Leste, and Kuwait. On the other hand Transparency International’s Corruption Perceptions Index rates relatively highly the United Arab
27. Th e simple correlation coeffi cients with the SWF scoreboard are 0.8049, 0.6067, and 0.6007, respectively. Each is signifi cant at the 1 percent level. In the case of the Revenue Watch and Transparency International indexes, the scores for SWFs from the same country were averaged before calculating the correlation.

N U M B E R P B 1 3 - 1 9 A U G U S T 2 0 1 3R E V I S E D D E C E M B E R 2 0 1 3
15
Table 6 2012 SWF scoreboard and other transparency indexes
Country Fund
2012 SWF
scoreboard
Linaburg-
Maduell
Index
Resource
Governance
Index
Corruption
Perceptions
Index
Norway Government Pension Fund-Global 98 10 98 85
New Zealand Superannuation Fund (PR) 94 10 n.a. 90
Chile Economic and Social Stabilization Fund 91 10 75 72
United States Alaska Permanent Fund 91 10 92 73
Ireland National Pensions Reserve Fund (PR) 90 10 n.a. 69
Australia Future Fund (PR) 89 10 85 85
United States Wyoming Permanent Mineral Trust Fund 89 9 92 73
Azerbaijan State Oil Fund 88 10 48 27
Canada Alberta Heritage Savings Trust Fund 86 9 76 84
Chile Pension Reserve Fund (PR) 85 10 75 77
Timor-Leste Petroleum Fund 85 8 68 33
Trinidad and Tobago Heritage and Stabilization Fund 83 8 74 39
United States New Mexico Severance Tax Permanent Fund 79 9 92 73
Singapore Temasek Holdings 76 10 n.a. 87
Kuwait Kuwait Investment Authority 73 6 41 44
Kazakhstan National Fund 71 8 57 28
Hong Kong Exchange Fund 70 8 n.a. 77
Korea Korea Investment Corporation 69 9 n.a. 56
United States Alabama Trust Fund 67 n.a. 92 73
Singapore Government of Singapore Investment Corporation 66 6 n.a. 87
United Arab Emirates Mubadala Development Company 65 10 n.a. 68
China China Investment Corporation 64 7 73 39
Malaysia Khazanah Nasional 59 5 46 49
United Arab Emirates Abu Dhabi Investment Authority 58 5 n.a. 68
Botswana Pula Fund 56 6 47 65
United Arab Emirates Dubai International Capital 55 n.a. n.a. 68
Russia National Welfare Fund and Reserve Fund 53 5 56 28
São Tomé & Principe National Oil Account 48 n.a. n.a. 42
Ghana Petroleum Funds 47 n.a. 63 45
United Arab Emirates International Petroleum Investment Company 46 9 n.a. 68
Mexico Oil Income Stabilization Fund 44 n.a. 77 34
Iran National Development Fund 41 5 28 28
Bahrain Mumtalakat Holding Company 39 9 47 51
Vietnam State Capital Investment Corporation 38 4 41 31
Kiribati Revenue Equalization Reserve Fund 35 1 n.a. n.a.
Brazil Sovereign Fund of Brazil 30 9 80 73
Algeria Revenue Regulation Fund 29 1 38 34
Venezuela National Development Fund 29 n.a. 56 19
Oman State General Reserve Fund 27 4 n.a. 47
Venezuela Macroeconomic Stabilization Fund 27 1 56 19
Brunei Brunei Investment Agency 21 1 n.a. 55
United Arab Emirates Investment Corporation of Dubai 21 4 n.a. 68
(continues)

N U M B E R P B 1 3 - 1 9 A U G U S T 2 0 1 3R E V I S E D D E C E M B E R 2 0 1 3
16
Emirates, Oman, Brunei, Qatar, and Equatorial Guinea, and the reverse for Ireland, Azerbaijan, Timor-Leste, Trinidad and Tobago, Kuwait, Kazakhstan, China, and Russia. One inter-pretation of the lack of complete congruity in these assess-ments is that countries in the fi rst groups perform below expectations with respect to transparency and accountability in setting up their SWFs based on other indicators and coun-tries in the second groups perform above expectations.
CO N C LU S I O N
Th e growth of SWFs had slowed in recent years. However, with estimated total assets under management of $4.2 trillion, including an estimated $3.6 trillion in foreign assets, as of mid-2013, they are collectively major players in international fi nancial markets (table 1). With 18 funds with estimated assets of more than $50 billion, nine funds with assets of more $100 billion, and fi ve funds with assets of more than $300 billion, the activities of many funds are a potential source of continuing interest as well as potential concern.
On the 2012 SWF scoreboard, the average for 49 funds is 54 out of 100 (table 2). For a common group of 32 funds, the average is 59, up from 42 on the 2007 scoreboard (table 3). Th is 40 percent improvement is signifi cant. However, progress has not been uniform, and the ratings of individual funds, while higher on average, remain widely dispersed. Progress has been concentrated almost exclusively in funds associated with the IFSWF.
Th e SWFs of the remaining members of the IFSWF have low scores on both the SWF scoreboard and the Santiago Principles with limited changes. While excuses might be made for Equatorial Guinea and Libya, the same cannot be said for Russia, Mexico, Iran, Bahrain, and Qatar. Th ey had below average scores when they were fi rst rated, and they have lagged behind other SWFs in any subsequent improvements. Th e case of Qatar, with an extremely low initial score and essen-tially no improvement over fi ve years, is particularly troubling. Qatar fancies itself as a major political, economic, and fi nan-cial player, and as such should hold itself to a high standard.
In addition to scoring the SWFs of Libya and Equatorial Guinea for the fi rst time, we also scored the new SWFs of Angola, Brazil, Ghana, and Nigeria. With the exception of the Ghanaian SWF, each of these funds recorded 30 or less on the 2012 scoreboard and not signifi cantly higher on the less demanding Santiago Principles. Brazil and Ghana score at above, or close to, the mean for the Revenue Watch Institute’s Resource Governance Index and Transparency International’s Corruption Perceptions Index, respectively, which makes the ratings on the SWF scoreboard for their funds all the more disappointing. Nigeria and Angola score not far from the mean of the Resource Governance Index.
Th e Santiago Principles and the IFSWF appear to have had limited infl uence on these countries. Th e IFSWF needs to strengthen its outreach to its low-performing members, to countries with new SWFs, and to the several countries with large funds (such as those of Hong Kong, Kazakhstan, and Algeria) that have yet to adhere to the Santiago Principles.
Progress has been made in increasing the transparency and accountability of SWFs, but more is needed.
Table 6 2012 SWF scoreboard and other transparency indexes (continued)
Country Fund
2012 SWF
scoreboard
Linaburg-
Maduell
Index
Resource
Governance
Index
Corruption
Perceptions
Index
Nigeria Sovereign Investment Authority 18 n.a. 42 27
Sudan/South Sudan Oil Revenue Stabilization Account 18 n.a. 31 13
Qatar Qatar Investment Authority 17 5 26 68
United Arab Emirates Istithmar World 17 n.a. n.a. 68
Angola Fundo Soberano de Angola 15 n.a. 42 22
Libya Libyan Investment Authority 6 1 11 21
Equatorial Guinea Fund for Future Generations 2 n.a. 13 20
n.a. = score not available for this index.
Note: PR denotes a pension reserve fund.
Sources: Appendix B and Revenue Watch Institute (2013), Sovereign Wealth Fund Institute (2013), and Transparency International (2012).

N U M B E R P B 1 3 - 1 9 A U G U S T 2 0 1 3R E V I S E D D E C E M B E R 2 0 1 3
17
A P P E N D I X A S CO R E B O A R D F O R S O V E R E I G N W E A LT H F U N D S
Th is appendix provides brief descriptions of the individual elements of the SWF scoreboard. Th e scoreboard has evolved since the fi rst edition in 2007, as summarized below. See Truman (2010, chapter 5) for more discussion.
For each of the 33 elements, posed as questions, if the answer is an unqualifi ed yes, we score it as 1. If the answer is no, we score it as 0. However, partial scores of 0.25, 0.50, and 0.75 are recorded for many elements, indicated by (p) in the descriptions below.
Th e four categories in the scoreboard are listed below with subcategories where relevant. Th e words in bold are keyed to the presentation of results in appendix B.
S T R U C T U R E
1. Is the SWF’s objective clearly stated? (p)
2. Is there a clear legal framework for the SWF? Th is element was incorporated into the 2008 scoreboard from the Santiago Principles.
3. Is the procedure for changing the structure of the SWF clear? (p)
4. Is the overall investment strategy clearly stated? (p)
Fiscal Treatment
5. Is the source of the SWF’s funding clearly specifi ed? (p)
6. Is the nature of the subsequent use of the principal and earnings of the fund clearly specifi ed? (p)
7. Are the SWF’s operations appropriately integrated with fi scal and monetary policies?28 (p)
8. Is the SWF separate from the country’s international reserves?29
G O V E R N A N C E
9. Is the role of the government in setting the investment strategy of the SWF clearly established? (p)
28. Because this element is only marginally relevant to government pension funds and subnational SWFs, we give them an arbitrary score of 0.5 on it so as not to bias their results upward.
29. Because this element is not relevant to government pension funds and subnational SWFs, we give them an arbitrary score of 0.5 on it so as not to bias their results upward.
10. Is the role of the governing body of the SWF clearly established? (p) Th is element was incorporated into the 2008 scoreboard from the Santiago Principles.
11. Is the role of the managers in executing the investment strategy clearly established? (p)
12. Are decisions on specifi c investments made by the managers? (p)
13. Does the SWF have internal ethical standards for its management and staff ? (p) Th is element was incorporated into the 2008 scoreboard from the Santiago Principles.
14. Does the SWF have in place, and make publicly available, guidelines for corporate responsibility that it follows? (p)
15. Does the SWF have ethical investment guidelines that it follows? (p)
T R A N S PA R E N C Y A N D ACCO U N TA B I L I T Y
Investment Strategy Implementation
16. Do regular reports on investments by the SWF include information on the categories of investments? (p)
17. Does the strategy use benchmarks? (p)
18. Does the strategy use credit ratings? (p)
19. Are the holders of investment mandates identifi ed? (p)
Investment Activities
20. Do regular reports on the investments by the SWF include the size of the fund? (p)
21. Do regular reports on the investments by the SWF include information on its returns? (p)
22. Do regular reports on the investments by the SWF include information on the geographic location of investments? (p)
23. Do regular reports on the investments by the SWF include information on the specifi c investments? (p)
24. Do regular reports on the investments by the SWF include information on the currency composition of investments? (p)
Reports
25. Does the SWF provide at least an annual report on its activities and results? (p)
26. Does the SWF provide quarterly reports? (p)
N U M B E R P B 1 3 - 1 9 A U G U S T 2 0 1 3R E V I S E D D E C E M B E R 2 0 1 3
18
Audits
27. Is the SWF subject to a regular annual audit? (p)
28. Does the SWF publish promptly the audits of its operations and accounts? (p)
29. Are the audits independent? (p)
B E H AV I O R
30. Does the SWF have an operational risk management policy? Th is element was incorporated into the 2008 scoreboard from the Santiago Principles.
31. Does the SWF have a policy on the use of leverage? (p)
32. Does the SWF have a policy on the use of derivatives? (p)
33. Does the SWF have a guideline on the nature and speed of adjustment in its portfolio? (p)
Four elements in the 2008 scoreboard are not included in the current scoreboard.
Element (a) was also included in the 2007 version. Th e others were new with the 2008 version.
(a) Are the guidelines for fi scal treatment generally followed without frequent adjustment?
(b) Does the SWF have limits on the size of its stakes?
(c) Does the SWF not take controlling stakes?
(d) Are derivatives used primarily for hedging?
Five elements in this scoreboard and the 2008 version were not included in the 2007 version.
(a) Are decisions on specifi c investments made by the managers?
(b) Does the strategy use benchmarks?
(c) Does the strategy use credit ratings?
(d) Does the SWF have a policy on the use of leverage?
(e) Does the SWF have a policy on the use of derivatives?

N U M B E R P B 1 3 - 1 9 A U G U S T 2 0 1 3R E V I S E D D E C E M B E R 2 0 1 3
19
Ap
pe
nd
ix B
2
01
2 s
core
bo
ard
fo
r so
ve
reig
n w
ea
lth
fu
nd
s, r
aw
sco
res
12
34
56
78
Co
un
try
Fu
nd
Ob
jec
tiv
e
sta
ted
Le
ga
l fr
am
e-
wo
rk
Ch
an
gin
g
the
str
uc
-
ture
Inv
est
me
nt
stra
teg
y
So
urc
e o
f
fun
din
g
Use
of
fun
d
ea
rnin
gs
Inte
gra
ted
wit
h p
oli
cie
s
Se
pa
rate
fro
m i
nte
r-
na
tio
na
l
rese
rve
sS
ub
tota
l
Alg
eria
Reve
nue
Regu
latio
n Fu
nd1
11
01
0.5
01
5.50
Ang
ola
Fund
o So
bera
no d
e A
ngol
a1
10
00.
50
00
2.50
Aust
ralia
Futu
re F
und
(PR)
11
11
11
0.5
0.5
7.00
Aze
rbai
jan
Stat
e O
il Fu
nd1
11
11
11
18.
00
Bahr
ain
Mum
tala
kat H
oldi
ng C
ompa
ny1
00
11
00
03.
00
Bots
wan
aPu
la F
und
11
01
0.5
11
05.
50
Braz
ilSo
vere
ign
Fund
of B
razi
l1
10
00
00
02.
00
Brun
ei D
arus
sala
mBr
unei
Inve
stm
ent A
genc
y1
11
00.
50
00
3.50
Cana
daA
lber
ta H
erita
ge S
avin
gs T
rust
Fun
d1
11
11
10.
50.
57.
00
Cais
se d
e dé
pôt e
t pla
cem
ent d
u Q
uébe
c (P
)1
11
11
10.
50.
57.
00
Cana
da P
ensi
on P
lan
(P)
11
11
11
0.5
0.5
7.00
Ont
ario
Teac
hers
’ Pen
sion
Pla
n (P
)1
11
11
10.
50.
57.
00
Chile
Econ
omic
and
Soc
ial S
tabi
lizat
ion
Fund
11
11
11
11
8.00
Pens
ion
Rese
rve
Fund
(PR)
11
11
11
0.5
0.5
7.00
Chin
aCh
ina
Inve
stm
ent C
orpo
ratio
n1
0.5
01
11
11
6.50
Nat
iona
l Soc
ial S
ecur
ity F
und
(P)
11
0.5
11
10.
50.
56.
50
Equa
toria
l Gui
nea
Fund
for F
utur
e G
ener
atio
ns0
00
00.
50
00
0.50
Fran
ceFo
nds
de ré
serv
e po
ur le
s re
trai
tes
(P)
11
11
11
0.5
0.5
7.00
Gha
naPe
trol
eum
Fun
ds1
11
11
11
0.5
7.50
Hon
g Ko
ngEx
chan
ge F
und
11
11
11
10
7.00
Iran
Nat
iona
l Dev
elop
men
t Fun
d1
11
0.5
10.
50
16.
00
Irela
ndN
atio
nal P
ensi
ons
Rese
rve
Fund
(PR)
11
11
11
0.5
0.5
7.00
Japa
nG
over
nmen
t Pen
sion
Inve
stm
ent F
und
(P)
11
11
11
0.5
0.5
7.00
Kaza
khst
anN
atio
nal F
und
11
0.5
11
11
17.
50
Kirib
ati
Reve
nue
Equa
lizat
ion
Rese
rve
Fund
11
10.
51
11
06.
50
Kore
aKo
rea
Inve
stm
ent C
orpo
ratio
n1
11
11
01
06.
00
Kuw
ait
Kuw
ait I
nves
tmen
t Aut
horit
y1
11
11
01
17.
00
Liby
aLi
byan
Inve
stm
ent A
utho
rity
01
00
0.5
00
01.
50
Mal
aysi
aKh
azan
ah N
asio
nal
11
00.
51
00
14.
50
Mex
ico
Oil
Inco
me
Stab
iliza
tion
Fund
11
0.5
0.5
10.
51
16.
50
Net
herla
nds
Stic
htin
g Pe
nsio
enfo
nds
ABP
(P)
11
11
11
0.5
0.5
7.00
(con
tinue
s)
A P P E N D I X B

N U M B E R P B 1 3 - 1 9 A U G U S T 2 0 1 3R E V I S E D D E C E M B E R 2 0 1 3
20
Ap
pe
nd
ix B
2
01
2 s
core
bo
ard
fo
r so
ve
reig
n w
ea
lth
fu
nd
s, r
aw
sco
res
(con
tinue
d)1
23
45
67
8
Co
un
try
Fu
nd
Ob
jec
tiv
e
sta
ted
Le
ga
l fr
am
e-
wo
rk
Ch
an
gin
g
the
str
uc
-
ture
Inv
est
me
nt
stra
teg
y
So
urc
e o
f
fun
din
g
Use
of
fun
d
ea
rnin
gs
Inte
gra
ted
wit
h p
oli
cie
s
Se
pa
rate
fro
m i
nte
r-
na
tio
na
l
rese
rve
sS
ub
tota
l
New
Zea
land
Supe
rann
uatio
n Fu
nd (P
R)1
11
11
10.
50.
57.
00
Nig
eria
Sove
reig
n In
vest
men
t Aut
horit
y1
10
11
10
05.
00
Nor
way
Gov
ernm
ent P
ensi
on F
und-
Glo
bal
11
11
11
11
8.00
Om
anSt
ate
Gen
eral
Res
erve
Fun
d1
10.
50.
51
0.5
0.5
16.
00
Qat
arQ
atar
Inve
stm
ent A
utho
rity
11
0.5
0.25
00
01
3.75
Russ
iaRe
serv
e Fu
nd a
nd N
atio
nal W
elfa
re F
und
11
11
10.
751
06.
75
São
Tom
é &
Prin
cipe
Nat
iona
l Oil
Acco
unt
11
11
11
11
8.00
Sing
apor
eG
over
nmen
t of S
inga
pore
Inve
stm
ent
Corp
orat
ion
11
11
0.5
11
06.
50
Tem
asek
Hol
ding
s1
11
11
01
17.
00
Suda
n/So
uth
Suda
nO
il Re
venu
e St
abili
zatio
n Ac
coun
t0.
50
00
10.
51
14.
00
Thai
land
Gov
ernm
ent P
ensi
on F
und
(P)
11
11
11
0.5
0.5
7.00
Tim
or-L
este
Petr
oleu
m F
und
11
11
11
11
8.00
Trin
idad
and
Toba
goH
erita
ge a
nd S
tabi
lizat
ion
Fund
11
11
11
11
8.00
Uni
ted
Ara
b Em
irate
sA
bu D
habi
Inve
stm
ent A
utho
rity
0.5
11
10.
50.
50.
51
6.00
Dub
ai In
tern
atio
nal C
apita
l1
01
10.
51
10.
56.
00
Inte
rnat
iona
l Pet
role
um In
vest
men
t Com
pany
10
10
10
00.
53.
50
Inve
stm
ent C
orpo
ratio
n of
Dub
ai1
10
01
00
0.5
3.50
Istit
hmar
Wor
ld1
00
0.5
0.5
00
0.5
2.50
Mub
adal
a D
evel
opm
ent C
ompa
ny1
10.
51
10
00.
55.
00
Uni
ted
Stat
esA
laba
ma
Trus
t Fun
d1
11
11
10.
50.
57.
00
Ala
ska
Perm
anen
t Fun
d1
11
11
10.
50.
57.
00
Calif
orni
a Pu
blic
Em
ploy
ees’
Retir
emen
t Sy
stem
(P)
11
11
11
0.5
0.5
7.00
New
Mex
ico
Seve
ranc
e Ta
x Pe
rman
ent F
und
11
11
11
0.5
0.5
7.00
Wyo
min
g Pe
rman
ent M
iner
al T
rust
Fun
d1
11
11
10.
50.
57.
00
Vene
zuel
aM
acro
econ
omic
Sta
biliz
atio
n Fu
nd1
11
0.5
10
01
5.50
Nat
iona
l Dev
elop
men
t Fun
d1
11
00.
50
01
4.50
Viet
nam
Stat
e Ca
pita
l Inv
estm
ent C
orpo
ratio
n1
11
11
0.5
01
6.50
Tota
l (58
fund
s)55
.00
51.5
042
.50
43.2
551
.00
37.2
530
.00
33.0
05.
92
of w
hich
pen
sion
(9 fu
nds)
9.00
9.00
8.50
9.00
9.00
9.00
4.50
4.50
6.94
of w
hich
SW
Fs (4
9 fu
nds)
46.0
042
.50
34.0
034
.25
42.0
028
.25
25.5
028
.50
5.73
o
f whi
ch IF
SWF
(26
fund
s)23
.50
23.5
018
.50
21.2
522
.50
16.2
516
.50
16.0
06.
08
o
f whi
ch n
on-IF
SWF
(23
fund
s)22
.50
19.0
015
.50
13.0
019
.50
12.0
09.
0012
.50
5.35
(con
tinue
s)

N U M B E R P B 1 3 - 1 9 A U G U S T 2 0 1 3R E V I S E D D E C E M B E R 2 0 1 3
21
Ap
pe
nd
ix B
2
01
2 s
core
bo
ard
fo
r so
ve
reig
n w
ea
lth
fu
nd
s, r
aw
sco
res
(con
tinue
d)9
10
11
12
13
14
15
Co
un
try
Fu
nd
Ro
le o
f g
ov
-
ern
me
nt
Ro
le o
f
go
ve
rnin
g
bo
dy
Ro
le o
f
ma
na
ge
rs
De
cis
ion
s
ma
de
by
ma
na
ge
rs
Inte
rna
l
eth
ica
l
sta
nd
ard
s
Gu
ide
lin
es
for
corp
o-
rate
re
spo
n-
sib
ilit
y
Eth
ica
l
inv
est
me
nt
gu
ide
lin
es
Su
bto
tal
Alg
eria
Reve
nue
Regu
latio
n Fu
nd1
01
00
00
2.00
Ang
ola
Fund
o So
bera
no d
e A
ngol
a1
10
00
00
2.00
Aust
ralia
Futu
re F
und
(PR)
11
11
11
17.
00
Aze
rbai
jan
Stat
e O
il Fu
nd1
11
11
00
5.00
Bahr
ain
Mum
tala
kat H
oldi
ng C
ompa
ny0
10
00
0.5
0.25
1.75
Bots
wan
aPu
la F
und
11
11
00
04.
00
Braz
ilSo
vere
ign
Fund
of B
razi
l1
10
00
00
2.00
Brun
ei D
arus
sala
mBr
unei
Inve
stm
ent A
genc
y0
00
00
00
0.00
Cana
daA
lber
ta H
erita
ge S
avin
gs T
rust
Fun
d1
11
11
01
6.00
Cais
se d
e dé
pôt e
t pla
cem
ent d
u Q
uébe
c (P
)1
11
11
11
7.00
Cana
da P
ensi
on P
lan
(P)
11
11
11
17.
00
Ont
ario
Teac
hers
’ Pen
sion
Pla
n (P
)1
11
10.
51
16.
50
Chile
Econ
omic
and
Soc
ial S
tabi
lizat
ion
Fund
11
11
10
16.
00
Pens
ion
Rese
rve
Fund
(PR)
11
11
00
15.
00
Chin
aCh
ina
Inve
stm
ent C
orpo
ratio
n1
11
11
0.5
05.
50
Nat
iona
l Soc
ial S
ecur
ity F
und
(P)
11
10
00
03.
00
Equa
toria
l Gui
nea
Fund
for F
utur
e G
ener
atio
ns0
00
00
00
0.00
Fran
ceFo
nds
de ré
serv
e po
ur le
s re
trai
tes
(P)
11
11
11
17.
00
Gha
naPe
trol
eum
Fun
ds1
0.5
00
00
0.5
2.00
Hon
g Ko
ngEx
chan
ge F
und
11
10
00
03.
00
Iran
Nat
iona
l Dev
elop
men
t Fun
d0.
51
0.5
0.5
00
02.
50
Irela
ndN
atio
nal P
ensi
ons
Rese
rve
Fund
(PR)
11
11
11
17.
00
Japa
nG
over
nmen
t Pen
sion
Inve
stm
ent F
und
(P)
11
11
11
0.5
6.50
Kaza
khst
anN
atio
nal F
und
11
11
01
05.
00
Kirib
ati
Reve
nue
Equa
lizat
ion
Rese
rve
Fund
11
11
00
04.
00
Kore
aKo
rea
Inve
stm
ent C
orpo
ratio
n1
11
11
00
5.00
Kuw
ait
Kuw
ait I
nves
tmen
t Aut
horit
y1
11
11
0.5
16.
50
Liby
aLi
byan
Inve
stm
ent A
utho
rity
00
00
00
00.
00
Mal
aysi
aKh
azan
ah N
asio
nal
11
10.
50.
51
05.
00
Mex
ico
Oil
Inco
me
Stab
iliza
tion
Fund
0.5
00.
50
00
01.
00
Net
herla
nds
Stic
htin
g Pe
nsio
enfo
nds
ABP
(P)
11
11
01
16.
00
(con
tinue
s)

N U M B E R P B 1 3 - 1 9 A U G U S T 2 0 1 3R E V I S E D D E C E M B E R 2 0 1 3
22
Ap
pe
nd
ix B
2
01
2 s
core
bo
ard
fo
r so
ve
reig
n w
ea
lth
fu
nd
s, r
aw
sco
res
(con
tinue
d)9
10
11
12
13
14
15
Co
un
try
Fu
nd
Ro
le o
f g
ov
-
ern
me
nt
Ro
le o
f
go
ve
rnin
g
bo
dy
Ro
le o
f
ma
na
ge
rs
De
cis
ion
s
ma
de
by
ma
na
ge
rs
Inte
rna
l
eth
ica
l
sta
nd
ard
s
Gu
ide
lin
es
for
corp
o-
rate
re
spo
n-
sib
ilit
y
Eth
ica
l
inv
est
me
nt
gu
ide
lin
es
Su
bto
tal
New
Zea
land
Supe
rann
uatio
n Fu
nd (P
R)1
11
11
11
7.00
Nig
eria
Sove
reig
n In
vest
men
t Aut
horit
y0
00
00
00
0.00
Nor
way
Gov
ernm
ent P
ensi
on F
und-
Glo
bal
11
11
11
17.
00
Om
anSt
ate
Gen
eral
Res
erve
Fun
d0
00
00.
50
00.
50
Qat
arQ
atar
Inve
stm
ent A
utho
rity
01
00
00
0.25
1.25
Russ
iaRe
serv
e Fu
nd a
nd N
atio
nal W
elfa
re F
und
10
10
00
02.
00
São
Tom
é &
Prin
cipe
Nat
iona
l Oil
Acco
unt
11
11
00
04.
00
Sing
apor
eG
over
nmen
t of S
inga
pore
Inve
stm
ent
Corp
orat
ion
11
11
10
05.
00
Tem
asek
Hol
ding
s1
11
11
0.5
05.
50
Suda
n/So
uth
Suda
nO
il Re
venu
e St
abili
zatio
n Ac
coun
t0
00
00
00
0.00
Thai
land
Gov
ernm
ent P
ensi
on F
und
(P)
11
11
01
16.
00
Tim
or-L
este
Petr
oleu
m F
und
11
10
00
03.
00
Trin
idad
and
Toba
goH
erita
ge a
nd S
tabi
lizat
ion
Fund
11
11
0.5
00
4.50
Uni
ted
Ara
b Em
irate
sA
bu D
habi
Inve
stm
ent A
utho
rity
11
11
10.
50.
56.
00
Dub
ai In
tern
atio
nal C
apita
l1
11
01
11
6.00
Inte
rnat
iona
l Pet
role
um In
vest
men
t Com
pany
0.5
0.5
10
01
03.
00
Inve
stm
ent C
orpo
ratio
n of
Dub
ai0.
50
00
00
00.
50
Istit
hmar
Wor
ld0
10.
50
00
01.
50
Mub
adal
a D
evel
opm
ent C
ompa
ny1
11
01
10
5.00
Uni
ted
Stat
esA
laba
ma
Trus
t Fun
d1
11
10
00
4.00
Ala
ska
Perm
anen
t Fun
d1
11
11
10
6.00
Calif
orni
a Pu
blic
Em
ploy
ees’
Retir
emen
t Sy
stem
(P)
11
11
11
17.
00
New
Mex
ico
Seve
ranc
e Ta
x Pe
rman
ent F
und
11
10.
50
00
3.50
Wyo
min
g Pe
rman
ent M
iner
al T
rust
Fun
d1
11
11
0.5
16.
50
Vene
zuel
aM
acro
econ
omic
Sta
biliz
atio
n Fu
nd0
10
00
00
1.00
Nat
iona
l Dev
elop
men
t Fun
d0
10
00
00
1.00
Viet
nam
Stat
e Ca
pita
l Inv
estm
ent C
orpo
ratio
n1
11
10
00
4.00
Tota
l (58
fund
s)45
.00
47.0
042
.50
32.0
024
.00
21.0
019
.00
3.97
of w
hich
pen
sion
(9 fu
nds)
9.00
9.00
9.00
8.00
5.50
8.00
7.50
6.22
of w
hich
SW
Fs (4
9 fu
nds)
36.0
038
.00
33.5
024
.00
18.5
013
.00
11.5
03.
56
o
f whi
ch IF
SWF
(26
fund
s)21
.00
22.0
021
.00
17.5
015
.00
8.50
9.00
4.38
o
f whi
ch n
on-IF
SWF
(23
fund
s)15
.00
16.0
012
.50
6.50
3.50
4.50
2.50
2.63
(con
tinue
s)
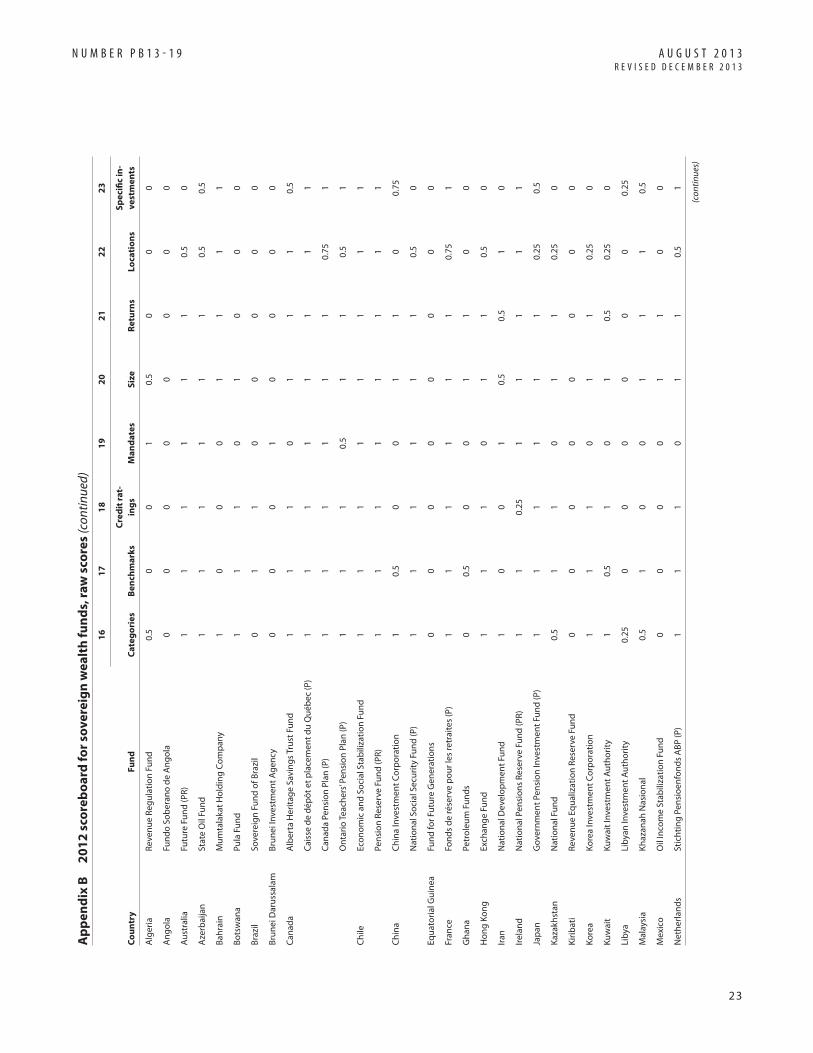
N U M B E R P B 1 3 - 1 9 A U G U S T 2 0 1 3R E V I S E D D E C E M B E R 2 0 1 3
23
Ap
pe
nd
ix B
2
01
2 s
core
bo
ard
fo
r so
ve
reig
n w
ea
lth
fu
nd
s, r
aw
sco
res
(con
tinue
d)1
61
71
81
92
02
12
22
3
Co
un
try
Fu
nd
Ca
teg
ori
es
Be
nc
hm
ark
s
Cre
dit
ra
t-
ing
sM
an
da
tes
Siz
eR
etu
rns
Lo
ca
tio
ns
Sp
ec
ific
in
-
ve
stm
en
ts
Alg
eria
Reve
nue
Regu
latio
n Fu
nd0.
50
01
0.5
00
0
Ang
ola
Fund
o So
bera
no d
e A
ngol
a0
00
00
00
0
Aust
ralia
Futu
re F
und
(PR)
11
11
11
0.5
0
Aze
rbai
jan
Stat
e O
il Fu
nd1
11
11
10.
50.
5
Bahr
ain
Mum
tala
kat H
oldi
ng C
ompa
ny1
00
01
11
1
Bots
wan
aPu
la F
und
11
10
10
00
Braz
ilSo
vere
ign
Fund
of B
razi
l0
11
00
00
0
Brun
ei D
arus
sala
mBr
unei
Inve
stm
ent A
genc
y0
00
10
00
0
Cana
daA
lber
ta H
erita
ge S
avin
gs T
rust
Fun
d1
11
01
11
0.5
Cais
se d
e dé
pôt e
t pla
cem
ent d
u Q
uébe
c (P
)1
11
11
11
1
Cana
da P
ensi
on P
lan
(P)
11
11
11
0.75
1
Ont
ario
Teac
hers
’ Pen
sion
Pla
n (P
)1
11
0.5
11
0.5
1
Chile
Econ
omic
and
Soc
ial S
tabi
lizat
ion
Fund
11
11
11
11
Pens
ion
Rese
rve
Fund
(PR)
11
11
11
11
Chin
aCh
ina
Inve
stm
ent C
orpo
ratio
n1
0.5
00
11
00.
75
Nat
iona
l Soc
ial S
ecur
ity F
und
(P)
11
11
11
0.5
0
Equa
toria
l Gui
nea
Fund
for F
utur
e G
ener
atio
ns0
00
00
00
0
Fran
ceFo
nds
de ré
serv
e po
ur le
s re
trai
tes
(P)
11
11
11
0.75
1
Gha
naPe
trol
eum
Fun
ds0
0.5
00
11
00
Hon
g Ko
ngEx
chan
ge F
und
11
10
11
0.5
0
Iran
Nat
iona
l Dev
elop
men
t Fun
d1
00
10.
50.
51
0
Irela
ndN
atio
nal P
ensi
ons
Rese
rve
Fund
(PR)
11
0.25
11
11
1
Japa
nG
over
nmen
t Pen
sion
Inve
stm
ent F
und
(P)
11
11
11
0.25
0.5
Kaza
khst
anN
atio
nal F
und
0.5
11
01
10.
250
Kirib
ati
Reve
nue
Equa
lizat
ion
Rese
rve
Fund
00
00
00
00
Kore
aKo
rea
Inve
stm
ent C
orpo
ratio
n1
11
01
10.
250
Kuw
ait
Kuw
ait I
nves
tmen
t Aut
horit
y1
0.5
10
10.
50.
250
Liby
aLi
byan
Inve
stm
ent A
utho
rity
0.25
00
00
00
0.25
Mal
aysi
aKh
azan
ah N
asio
nal
0.5
10
01
11
0.5
Mex
ico
Oil
Inco
me
Stab
iliza
tion
Fund
00
00
11
00
Net
herla
nds
Stic
htin
g Pe
nsio
enfo
nds
ABP
(P)
11
10
11
0.5
1
(con
tinue
s)

N U M B E R P B 1 3 - 1 9 A U G U S T 2 0 1 3R E V I S E D D E C E M B E R 2 0 1 3
24
Ap
pe
nd
ix B
2
01
2 s
core
bo
ard
fo
r so
ve
reig
n w
ea
lth
fu
nd
s, r
aw
sco
res
(con
tinue
d)1
61
71
81
92
02
12
22
3
Co
un
try
Fu
nd
Ca
teg
ori
es
Be
nc
hm
ark
s
Cre
dit
ra
t-
ing
sM
an
da
tes
Siz
eR
etu
rns
Lo
ca
tio
ns
Sp
ec
ific
in
-
ve
stm
en
ts
New
Zea
land
Supe
rann
uatio
n Fu
nd (P
R)1
11
11
11
1
Nig
eria
Sove
reig
n In
vest
men
t Aut
horit
y0
00
00
00
0
Nor
way
Gov
ernm
ent P
ensi
on F
und-
Glo
bal
11
11
11
11
Om
anSt
ate
Gen
eral
Res
erve
Fun
d0
00
00
00
0
Qat
arQ
atar
Inve
stm
ent A
utho
rity
00
00
00
00
Russ
iaRe
serv
e Fu
nd a
nd N
atio
nal W
elfa
re F
und
10
11
10.
51
0.5
São
Tom
é &
Prin
cipe
Nat
iona
l Oil
Acco
unt
0.5
00
10.
50
00
Sing
apor
eG
over
nmen
t of S
inga
pore
Inve
stm
ent
Corp
orat
ion
11
0.5
00
0.75
10
Tem
asek
Hol
ding
s1
0.5
00.
51
11
0.5
Suda
n/So
uth
Suda
nO
il Re
venu
e St
abili
zatio
n Ac
coun
t0
00
11
00
0
Thai
land
Gov
ernm
ent P
ensi
on F
und
(P)
11
11
11
0.25
1
Tim
or-L
este
Petr
oleu
m F
und
11
11
11
11
Trin
idad
and
Toba
goH
erita
ge a
nd S
tabi
lizat
ion
Fund
11
11
11
10
Uni
ted
Ara
b Em
irate
sA
bu D
habi
Inve
stm
ent A
utho
rity
11
0.5
00
0.5
0.25
0
Dub
ai In
tern
atio
nal C
apita
l1
00
0.5
10
11
Inte
rnat
iona
l Pet
role
um In
vest
men
t Com
pany
10
00.
51
00
1
Inve
stm
ent C
orpo
ratio
n of
Dub
ai1
00
00
01
1
Istit
hmar
Wor
ld0.
250
00
0.5
00.
250.
5
Mub
adal
a D
evel
opm
ent C
ompa
ny1
0.5
0.5
0.5
11
10.
5
Uni
ted
Stat
esA
laba
ma
Trus
t Fun
d1
11
01
10
0
Ala
ska
Perm
anen
t Fun
d1
11
11
11
1
Calif
orni
a Pu
blic
Em
ploy
ees’
Retir
emen
t Sy
stem
(P)
11
11
11
0.5
1
New
Mex
ico
Seve
ranc
e Ta
x Pe
rman
ent F
und
11
11
11
0.5
0
Wyo
min
g Pe
rman
ent M
iner
al T
rust
Fun
d1
11
11
10.
50
Vene
zuel
aM
acro
econ
omic
Sta
biliz
atio
n Fu
nd0.
50
01
10
00
Nat
iona
l Dev
elop
men
t Fun
d0.
250
00
10
00.
25
Viet
nam
Stat
e Ca
pita
l Inv
estm
ent C
orpo
ratio
n1
00
01
00
0
Tota
l (58
fund
s)41
.25
33.5
030
.75
28.5
044
.00
35.7
525
.75
23.2
5
of w
hich
pen
sion
(9 fu
nds)
9.00
9.00
9.00
7.50
9.00
9.00
5.00
7.50
of w
hich
SW
Fs (4
9 fu
nds)
32.2
524
.50
21.7
521
.00
35.0
026
.75
20.7
515
.75
o
f whi
ch IF
SWF
(26
fund
s)20
.75
17.5
015
.25
12.5
020
.50
19.7
515
.75
11.5
0
o
f whi
ch n
on-IF
SWF
(23
fund
s)11
.50
7.00
6.50
8.50
14.5
07.
005.
004.
25
(con
tinue
s)

N U M B E R P B 1 3 - 1 9 A U G U S T 2 0 1 3R E V I S E D D E C E M B E R 2 0 1 3
25
Ap
pe
nd
ix B
2
01
2 s
core
bo
ard
fo
r so
ve
reig
n w
ea
lth
fu
nd
s, r
aw
sco
res
(con
tinue
d)2
42
52
62
72
82
9
Co
un
try
Fu
nd
Cu
rre
nc
y
com
po
siti
on
An
nu
al
rep
ort
s
Qu
art
erl
y
rep
ort
s
Re
gu
lar
au
dit
s
Pu
bli
she
d
au
dit
s
Ind
ep
en
-
de
nt
au
dit
sS
ub
tota
l
Alg
eria
Reve
nue
Regu
latio
n Fu
nd0
00
00
02.
00
Ang
ola
Fund
o So
bera
no d
e A
ngol
a0
00
00
00.
00
Aust
ralia
Futu
re F
und
(PR)
11
11
11
12.5
0
Aze
rbai
jan
Stat
e O
il Fu
nd1
11
11
113
.00
Bahr
ain
Mum
tala
kat H
oldi
ng C
ompa
ny0
10
10
18.
00
Bots
wan
aPu
la F
und
0.5
10.
51
01
8.00
Braz
ilSo
vere
ign
Fund
of B
razi
l0
10
11
16.
00
Brun
ei D
arus
sala
mBr
unei
Inve
stm
ent A
genc
y0
0.5
01
01
3.50
Cana
daA
lber
ta H
erita
ge S
avin
gs T
rust
Fun
d1
11
11
112
.50
Cais
se d
e dé
pôt e
t pla
cem
ent d
u Q
uébe
c (P
)1
10
11
113
.00
Cana
da P
ensi
on P
lan
(P)
11
11
11
13.7
5
Ont
ario
Teac
hers
’ Pen
sion
Pla
n (P
)1
10.
51
11
12.5
0
Chile
Econ
omic
and
Soc
ial S
tabi
lizat
ion
Fund
11
11
11
14.0
0
Pens
ion
Rese
rve
Fund
(PR)
11
11
11
14.0
0
Chin
aCh
ina
Inve
stm
ent C
orpo
ratio
n0
10
11
18.
25
Nat
iona
l Soc
ial S
ecur
ity F
und
(P)
01
11
11
11.5
0
Equa
toria
l Gui
nea
Fund
for F
utur
e G
ener
atio
ns0
00
00
00.
00
Fran
ceFo
nds
de ré
serv
e po
ur le
s re
trai
tes
(P)
11
11
11
13.7
5
Gha
naPe
trol
eum
Fun
ds0
0.5
0.5
10
15.
50
Hon
g Ko
ngEx
chan
ge F
und
0.5
11
11
111
.00
Iran
Nat
iona
l Dev
elop
men
t Fun
d0
0.5
0.5
00
05.
00
Irela
ndN
atio
nal P
ensi
ons
Rese
rve
Fund
(PR)
11
11
11
13.2
5
Japa
nG
over
nmen
t Pen
sion
Inve
stm
ent F
und
(P)
01
11
11
11.7
5
Kaza
khst
anN
atio
nal F
und
0.25
0.5
0.5
11
19.
00
Kirib
ati
Reve
nue
Equa
lizat
ion
Rese
rve
Fund
00.
50.
50
00
1.00
Kore
aKo
rea
Inve
stm
ent C
orpo
ratio
n0.
250.
50
11
19.
00
Kuw
ait
Kuw
ait I
nves
tmen
t Aut
horit
y0.
750.
50
11
18.
50
Liby
aLi
byan
Inve
stm
ent A
utho
rity
00
00
00
0.50
Mal
aysi
aKh
azan
ah N
asio
nal
01
01
11
9.00
Mex
ico
Oil
Inco
me
Stab
iliza
tion
Fund
10.
50.
50.
50.
51
6.00
Net
herla
nds
Stic
htin
g Pe
nsio
enfo
nds
ABP
(P)
11
0.5
11
112
.00
(con
tinue
s)

N U M B E R P B 1 3 - 1 9 A U G U S T 2 0 1 3R E V I S E D D E C E M B E R 2 0 1 3
26
Ap
pe
nd
ix B
2
01
2 s
core
bo
ard
fo
r so
ve
reig
n w
ea
lth
fu
nd
s, r
aw
sco
res
(con
tinue
d)2
42
52
62
72
82
9
Co
un
try
Fu
nd
Cu
rre
nc
y
com
po
siti
on
An
nu
al
rep
ort
s
Qu
art
erl
y
rep
ort
s
Re
gu
lar
au
dit
s
Pu
bli
she
d
au
dit
s
Ind
ep
en
-
de
nt
au
dit
sS
ub
tota
l
New
Zea
land
Supe
rann
uatio
n Fu
nd (P
R)1
11
11
114
.00
Nig
eria
Sove
reig
n In
vest
men
t Aut
horit
y0
00
00
00.
00
Nor
way
Gov
ernm
ent P
ensi
on F
und-
Glo
bal
11
11
11
14.0
0
Om
anSt
ate
Gen
eral
Res
erve
Fun
d0
0.5
01
01
2.50
Qat
arQ
atar
Inve
stm
ent A
utho
rity
0.25
00
00
00.
25
Russ
iaRe
serv
e Fu
nd a
nd N
atio
nal W
elfa
re F
und
0.5
0.5
0.5
0.25
00
7.75
São
Tom
é &
Prin
cipe
Nat
iona
l Oil
Acco
unt
00
01
01
4.00
Sing
apor
eG
over
nmen
t of S
inga
pore
Inve
stm
ent
Corp
orat
ion
01
0.5
11
18.
75
Tem
asek
Hol
ding
s1
10
11
110
.50
Suda
n/So
uth
Suda
nO
il Re
venu
e St
abili
zatio
n Ac
coun
t0
00
00
02.
00
Thai
land
Gov
ernm
ent P
ensi
on F
und
(P)
01
11
11
12.2
5
Tim
or-L
este
Petr
oleu
m F
und
11
11
11
14.0
0
Trin
idad
and
Toba
goH
erita
ge a
nd S
tabi
lizat
ion
Fund
11
11
11
13.0
0
Uni
ted
Ara
b Em
irate
sA
bu D
habi
Inve
stm
ent A
utho
rity
01
01
01
6.25
Dub
ai In
tern
atio
nal C
apita
l0
0.5
00
00
5.00
Inte
rnat
iona
l Pet
role
um In
vest
men
t Com
pany
01
01
11
7.50
Inve
stm
ent C
orpo
ratio
n of
Dub
ai0
00
00
03.
00
Istit
hmar
Wor
ld0
00
00
01.
50
Mub
adal
a D
evel
opm
ent C
ompa
ny0.
51
01
11
10.5
0
Uni
ted
Stat
esA
laba
ma
Trus
t Fun
d0
10
11
19.
00
Ala
ska
Perm
anen
t Fun
d1
11
11
114
.00
Calif
orni
a Pu
blic
Em
ploy
ees’
Retir
emen
t Sy
stem
(P)
11
11
11
13.5
0
New
Mex
ico
Seve
ranc
e Ta
x Pe
rman
ent F
und
11
11
11
12.5
0
Wyo
min
g Pe
rman
ent M
iner
al T
rust
Fun
d0.
51
11
11
12.0
0
Vene
zuel
aM
acro
econ
omic
Sta
biliz
atio
n Fu
nd0
00
00
02.
50
Nat
iona
l Dev
elop
men
t Fun
d0
10.
51
00
4.00
Viet
nam
Stat
e Ca
pita
l Inv
estm
ent C
orpo
ratio
n0
00
00
02.
00
Tota
l (58
fund
s)24
.00
40.5
25.0
042
.75
34.5
042
.00
8.13
of w
hich
pen
sion
(9 fu
nds)
6.00
9.0
7.00
9.00
9.00
9.00
12.6
7
of w
hich
SW
Fs (4
9 fu
nds)
18.0
031
.518
.00
33.7
525
.50
33.0
07.
30
o
f whi
ch IF
SWF
(26
fund
s)15
.25
20.5
13.0
020
.75
17.5
021
.00
9.29
o
f whi
ch n
on-IF
SWF
(23
fund
s)2.
7511
.05.
0013
.00
8.00
12.0
05.
04
(con
tinue
s)

N U M B E R P B 1 3 - 1 9 A U G U S T 2 0 1 3R E V I S E D D E C E M B E R 2 0 1 3
27
Ap
pe
nd
ix B
2
01
2 s
core
bo
ard
fo
r so
ve
reig
n w
ea
lth
fu
nd
s, r
aw
sco
res
(con
tinue
d)3
03
13
23
3
Co
un
try
Fu
nd
Ris
k m
an
-
ag
em
en
t
po
lic
y
Po
lic
y o
n
lev
era
ge
Po
lic
y o
n
de
riv
ati
ve
s
Po
rtfo
lio
ad
just
me
nt
Su
bto
tal
To
tal
Alg
eria
Reve
nue
Regu
latio
n Fu
nd0
00
00.
09.
50
Ang
ola
Fund
o So
bera
no d
e A
ngol
a0.
50
00
0.5
5.00
Aust
ralia
Futu
re F
und
(PR)
11
10
3.0
29.5
0
Aze
rbai
jan
Stat
e O
il Fu
nd1
11
03.
029
.00
Bahr
ain
Mum
tala
kat H
oldi
ng C
ompa
ny0
00
00.
012
.75
Bots
wan
aPu
la F
und
00
10
1.0
18.5
0
Braz
ilSo
vere
ign
Fund
of B
razi
l0
00
00.
010
.00
Brun
ei D
arus
sala
mBr
unei
Inve
stm
ent A
genc
y0
00
00.
07.
00
Cana
daA
lber
ta H
erita
ge S
avin
gs T
rust
Fun
d1
11
03.
028
.50
Cais
se d
e dé
pôt e
t pla
cem
ent d
u Q
uébe
c (P
)1
11
03.
030
.00
Cana
da P
ensi
on P
lan
(P)
11
10
3.0
30.7
5
Ont
ario
Teac
hers
’ Pen
sion
Pla
n (P
)1
01
02.
028
.00
Chile
Econ
omic
and
Soc
ial S
tabi
lizat
ion
Fund
11
00
2.0
30.0
0
Pens
ion
Rese
rve
Fund
(PR)
11
00
2.0
28.0
0
Chin
aCh
ina
Inve
stm
ent C
orpo
ratio
n1
00
01.
021
.25
Nat
iona
l Soc
ial S
ecur
ity F
und
(P)
10
10
2.0
23.0
0
Equa
toria
l Gui
nea
Fund
for F
utur
e G
ener
atio
ns0
00
00.
00.
50
Fran
ceFo
nds
de ré
serv
e po
ur le
s re
trai
tes
(P)
10
11
3.0
30.7
5
Gha
naPe
trol
eum
Fun
ds0.
500
00
0.5
15.5
0
Hon
g Ko
ngEx
chan
ge F
und
10
10
2.0
23.0
0
Iran
Nat
iona
l Dev
elop
men
t Fun
d0
00
00.
013
.50
Irela
ndN
atio
nal P
ensi
ons
Rese
rve
Fund
(PR)
10
10.
52.
529
.75
Japa
nG
over
nmen
t Pen
sion
Inve
stm
ent F
und
(P)
10
11
3.0
28.2
5
Kaza
khst
anN
atio
nal F
und
10
10
2.0
23.5
0
Kirib
ati
Reve
nue
Equa
lizat
ion
Rese
rve
Fund
00
00
0.0
11.5
0
Kore
aKo
rea
Inve
stm
ent C
orpo
ratio
n1
0.25
10.
52.
822
.75
Kuw
ait
Kuw
ait I
nves
tmen
t Aut
horit
y1
10
02.
024
.00
Liby
aLi
byan
Inve
stm
ent A
utho
rity
00
00
0.0
2.00
Mal
aysi
aKh
azan
ah N
asio
nal
10
00
1.0
19.5
0
Mex
ico
Oil
Inco
me
Stab
iliza
tion
Fund
00
10
1.0
14.5
0
Net
herla
nds
Stic
htin
g Pe
nsio
enfo
nds
ABP
(P)
10
11
3.0
28.0
0
(con
tinue
s)

N U M B E R P B 1 3 - 1 9 A U G U S T 2 0 1 3R E V I S E D D E C E M B E R 2 0 1 3
28
Ap
pe
nd
ix B
2
01
2 s
core
bo
ard
fo
r so
ve
reig
n w
ea
lth
fu
nd
s, r
aw
sco
res
(con
tinue
d)3
03
13
23
3
Co
un
try
Fu
nd
Ris
k m
an
-
ag
em
en
t
po
lic
y
Po
lic
y o
n
lev
era
ge
Po
lic
y o
n
de
riv
ati
ve
s
Po
rtfo
lio
ad
just
me
nt
Su
bto
tal
To
tal
New
Zea
land
Supe
rann
uatio
n Fu
nd (P
R)1
11
03.
031
.00
Nig
eria
Sove
reig
n In
vest
men
t Aut
horit
y1
00
01.
06.
00
Nor
way
Gov
ernm
ent P
ensi
on F
und-
Glo
bal
11
0.5
13.
532
.50
Om
anSt
ate
Gen
eral
Res
erve
Fun
d0
00
00.
09.
00
Qat
arQ
atar
Inve
stm
ent A
utho
rity
00.
250
00.
35.
50
Russ
iaRe
serv
e Fu
nd a
nd N
atio
nal W
elfa
re F
und
00
10
1.0
17.5
0
São
Tom
é &
Prin
cipe
Nat
iona
l Oil
Acco
unt
00
00
0.0
16.0
0
Sing
apor
eG
over
nmen
t of S
inga
pore
Inve
stm
ent
Corp
orat
ion
10
0.5
01.
521
.75
Tem
asek
Hol
ding
s1
01
02.
025
.00
Suda
n/So
uth
Suda
nO
il Re
venu
e St
abili
zatio
n Ac
coun
t0
00
00.
06.
00
Thai
land
Gov
ernm
ent P
ensi
on F
und
(P)
0.5
00.
50
1.0
26.2
5
Tim
or-L
este
Petr
oleu
m F
und
10
11
3.0
28.0
0
Trin
idad
and
Toba
goH
erita
ge a
nd S
tabi
lizat
ion
Fund
10
01
2.0
27.5
0
Uni
ted
Ara
b Em
irate
sA
bu D
habi
Inve
stm
ent A
utho
rity
10
00
1.0
19.2
5
Dub
ai In
tern
atio
nal C
apita
l1
00
01.
018
.00
Inte
rnat
iona
l Pet
role
um In
vest
men
t Com
pany
10
0.25
01.
315
.25
Inve
stm
ent C
orpo
ratio
n of
Dub
ai0
00
00.
07.
00
Istit
hmar
Wor
ld0
00
00.
05.
50
Mub
adal
a D
evel
opm
ent C
ompa
ny1
00
01.
021
.50
Uni
ted
Stat
esA
laba
ma
Trus
t Fun
d0
11
02.
022
.00
Ala
ska
Perm
anen
t Fun
d1
11
03.
030
.00
Calif
orni
a Pu
blic
Em
ploy
ees’
Retir
emen
t Sy
stem
(P)
11
11
4.0
31.5
0
New
Mex
ico
Seve
ranc
e Ta
x Pe
rman
ent F
und
01
11
3.0
26.0
0
Wyo
min
g Pe
rman
ent M
iner
al T
rust
Fun
d1
11
14.
029
.50
Vene
zuel
aM
acro
econ
omic
Sta
biliz
atio
n Fu
nd0
00
00.
09.
00
Nat
iona
l Dev
elop
men
t Fun
d0
00
00.
09.
50
Viet
nam
Stat
e Ca
pita
l Inv
estm
ent C
orpo
ratio
n0
00
00.
012
.50
Tota
l (58
fund
s)34
.50
15.5
026
.75
10.0
01.
5019
.58
of w
hich
pen
sion
(9 fu
nds)
8.50
3.00
8.50
4.00
2.67
28.5
0
of w
hich
SW
Fs (4
9 fu
nds)
26.0
012
.50
18.2
56.
001.
2817
.95
o
f whi
ch IF
SWF
(26
fund
s)18
.00
9.50
13.0
04.
001.
7121
.61
o
f whi
ch n
on-IF
SWF
(23
fund
s)8.
003.
005.
252.
000.
7913
.82
Not
e: P
R de
note
s a
pens
ion
rese
rve
fund
. P d
enot
es a
gov
ernm
ent p
ensi
on fu
nd.
IFSW
F =
Inte
rnat
iona
l For
um o
f Sov
erei
gn W
ealth
Fun
ds
Sour
ce: A
utho
rs’ c
alcu
latio
ns fr
om v
ario
us n
atio
nal a
nd in
tern
atio
nal s
ourc
es.

N U M B E R P B 1 3 - 1 9 A U G U S T 2 0 1 3R E V I S E D D E C E M B E R 2 0 1 3
29
Th is publication has been subjected to a prepublication peer review intended to ensure analytical quality. Th e views expressed are those of the authors. Th is publication is part of the overall program of the Peterson Institute for International Economics, as endorsed by its Board of Directors, but it does not necessarily refl ect the views of individual members of the Board or of the Institute’s staff or management. Th e Institute is an independent, private, nonprofi t institution for rigorous,
intellectually honest study and open discussion of international economic policy. Its work is made possible by fi nan-cial support from a highly diverse group of philanthropic foundations, private corporations, and interested individuals,
as well as by income on its capital fund. For a list of Institute supporters, please see www.piie.com/supporters.cfm.
R E F E R E N C E S
Bagnall, Allie E. and Edwin M. Truman. 2011. IFSWF Report on Compliance with the Santiago Principles: Admirable but Flawed Transparency. Policy Brief 11-14 (August). Washington: Peterson Institute for International Economics.
IMF (International Monetary Fund). 2009. Sixth Balance of Payments and International Investment Position Manual. Washington. Available at www.imf.org.
IWG (International Working Group of Sovereign Wealth Funds). 2008. Sovereign Wealth Funds Generally Accepted Principle and Practices “Santiago Principles” (October). Washington. Available at www.iwg‐swf.org (accessed July 10, 2013).
Monk, Ashby. 2010. Papua New Guinea: Lessons Learned. Oxford SWF Project. Available at http://oxfordswfproject.com/?s=Papua+New+ Guinea (accessed July 26, 2013).
Revenue Watch Institute. 2013. Resource Governance Index. Available at http://www.revenuewatch.org/rgi/report (accessed July 16, 2013).
Sovereign Wealth Fund Institute. 2013. Linaburg-Maduell Transparency Index. Available at http://www.swfi nstitute.org/statistics-research/lina-burg-maduell-transparency-index/ (accessed July 16, 2013).
Transparency International. 2012. 2012 Corruption Perceptions Index. Available at http://cpi.transparency.org/cpi2012/results/ (accessed on July 16, 2013).
Truman, Edwin M. 2007. Sovereign Wealth Funds: Th e Need for Greater Transparency and Accountability. Policy Brief 07‐6 (August). Washington: Peterson Institute for International Economics.
Truman, Edwin M. 2008a. A Blueprint for SWF Best Practices. Policy Brief 08‐3 (April). Washington: Peterson Institute for International Economics.
Truman, Edwin M. 2008b. Th e Management of China’s International Reserves: China and a Sovereign Wealth Fund Scoreboard. In Debating China’s Exchange Policy, ed. Morris Goldstein and Nicholas Lardy. Washington: Peterson Institute for International Economics.
Truman, Edwin M. 2008c. Th e Rise of Sovereign Wealth Funds: Impacts on US Foreign Policy and Economic Interests. Testimony before the Committee on Foreign Aff airs, US House of Representatives (May 21). Available at www.piie.com (accessed on August 2, 2013).
Truman, Edwin M. 2010. Sovereign Wealth Funds: Th reat or Salvation? Washington: Peterson Institute for International Economics.
Truman, Edwin M. 2011. Are Asian Sovereign Wealth Funds Diff erent? Asian Economic Policy Review 6: 249–68.