Policing in America Public Opinion Report 080117 JEEdits
93
Transcript of Policing in America Public Opinion Report 080117 JEEdits


FINDINGS FROM THE 2016 CATO INSTITUTE CRIMINAL JUSTICE SURVEY 1
Overview Stark racial and partisan divides in favorability toward police, but no group is “anti-cop”
While 68% of white Americans have a favorable view of the police, only 40% of African Americans and 59% of Hispanics have a favorable view.1 Attitudes have changed little since the 1970s when 67% of whites and 43% of blacks reported favorable views of the police.2 Racial minorities do not have monolithic attitudes toward the police. This report finds that Hispanics’ perceptions of police occupy a “middle ground” between black and white Americans’ views. Republicans (81%) are far more favorable toward the police than independents (59%) and Democrats (59%). Nevertheless, majorities of all three groups share a favorable view.
• Confidence gaps matter: Groups who feel less favorable toward local law enforcement are less certain they would report a crime they witnessed. For instance, black and Hispanic Americans are more than 20 points less likely than white Americans to say they definitely would report a crime. Research finds that when the police have legitimacy, the law has legitimacy, which encourages compliance and cooperation.3
• No group is “anti-cop”: Although some groups have less positive views of the police, survey findings weaken the assertion that these groups are “anti-cop.” For instance, few individuals have “unfavorable” views of law enforcement. Instead, 40% of African Americans, 28% of Hispanics, and 18% of whites are conflicted and report having “neutral” feelings toward the police. A quarter of Democrats and independents and 13% of Republicans share such feelings.
Emily Ekins is a research fellow and director of polling at the Cato Institute. 1 In this study the term ‘Hispanic’ is used interchangeably with ‘Latino,’ ‘Caucasian’ interchangeably with ‘white,’ and
‘African American’ interchangeably with ‘black.’ 2 Louis Harris and Associates Study No. 2043, 1970, cited in Michael J. Hindelang, "Public Opinion Regarding Crime,
Criminal Justice, and Related Topics." Journal of Research in Crime and Delinquency 11 (1974): 101-116. 3 See Linquin Cao, James Frank, and Francis T. Cullen, "Race, Community Context and Confidence in the Police,"
American Journal of Police 15 (1996): 3-22; Tom Tyler and Jeffrey Fagan, "Legitimacy and Cooperation: Why Do People Help the Police Fight Crime in Their Communities?" Ohio State Journal of Criminal Law 6 (2008): 232-275; Andrew V. Papachristos, Tracey L. Meares, and Jeffrey Fagan, "Why Do Criminals Obey the Law? The Influence of Legitimacy and Social Networks on Active Gun Offenders," Journal of Criminal Law and Criminology 102 (2009): 397-440; Tom R. Tyler, "The Role of Perceived Injustice in Defendants' Evaluations of Their Courtroom Experience," Law & Society Review 18 (1984): 51-74; Tom Tyler, Why People Obey the Law (Princeton: Princeton University Press, 2006); Jonathan Blanks, "How Pretextual Stops Undermine Police Legitimacy." Case W. Res. L. Review 66 (2016): 931-946.

FINDINGS FROM THE 2016 CATO INSTITUTE CRIMINAL JUSTICE SURVEY 2
Furthermore, it’s hard to argue that any group is “anti-cop” since no group wishes to cut the number of police officers in their communities (9 in 10 oppose) and majorities are sympathetic toward the difficulty of police work.4 About 6 in 10 believe officers have “very dangerous” jobs. However, groups diverge widely on whether Americans show enough respect for officers these days—64% of whites, 45% of Hispanics, and 34% of blacks say Americans don’t show enough.
Perceptions of how the police do their jobs vary widely by race and partisanship • Police Tactics: African Americans (73%) are far more likely than whites (35%)
and Hispanics (54%) to say that police are too quick to use lethal force. Similarly African Americans (56%) are far more likely to say police tactics are generally too harsh, compared to Hispanics (33%) and whites (26%). Republicans (80%) are considerably more likely to believe that police only use lethal force when necessary, while 63% of Democrats think police are too quick to use it.
• Courteousness: White Americans (62%) are 19 points more likely than African Americans (43%) and 13 points more likely than Hispanics (49%) to rate their local police departments highly for being courteous. Similarly, Republicans (74%) are nearly 30 points more likely than Democrats (48%) to say their local police conduct themselves professionally.
• Racial Impartiality: Black (31%) and Hispanic (42%) Americans are far less likely than white Americans (64%) to be highly confident their local police departments treat all racial groups equally. Democrats (40%) are about half as likely as Republicans (78%) to believe the police are impartial.
• Competency: Four in 10 African Americans and 5 in 10 Hispanics give their
local police high ratings for enforcing the law, protecting them from crime, and responding quickly to a call for help, compared to 6 in 10 white Americans. In a similar pattern, 5 in 10 independents and Democrats believe the police are highly competent, compared to about 7 in 10 Republicans.
Reported experiences with police vary by race and ethnicity Most Americans have had positive experiences with the police but those who have experienced verbal and physical misconduct are disproportionately black and Hispanic.
4 To be sure, advocates of cutting police presence are not necessarily “anti-cop” either; however, it is hard to argue someone is
“anti-cop” if that person doesn’t want to cut the police force.
FINDINGS FROM THE 2016 CATO INSTITUTE CRIMINAL JUSTICE SURVEY 3
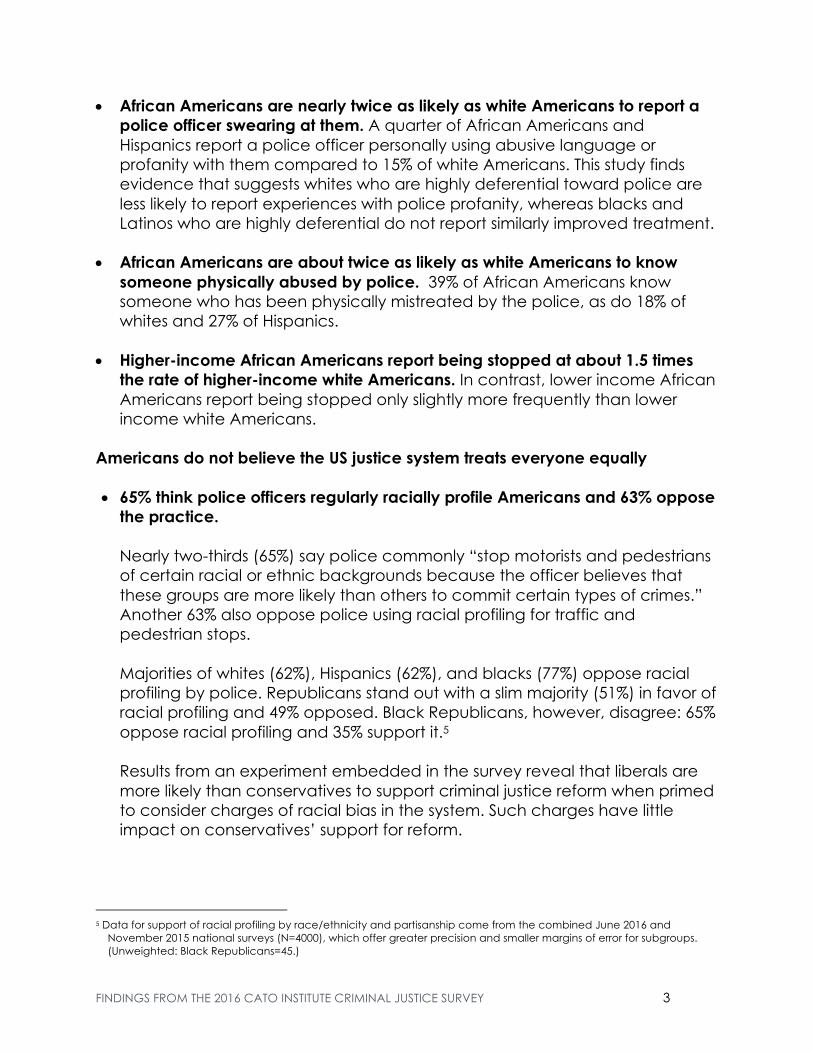
• African Americans are nearly twice as likely as white Americans to report a police officer swearing at them. A quarter of African Americans and Hispanics report a police officer personally using abusive language or profanity with them compared to 15% of white Americans. This study finds evidence that suggests whites who are highly deferential toward police are less likely to report experiences with police profanity, whereas blacks and Latinos who are highly deferential do not report similarly improved treatment.
• African Americans are about twice as likely as white Americans to know someone physically abused by police. 39% of African Americans know someone who has been physically mistreated by the police, as do 18% of whites and 27% of Hispanics.
• Higher-income African Americans report being stopped at about 1.5 times
the rate of higher-income white Americans. In contrast, lower income African Americans report being stopped only slightly more frequently than lower income white Americans.
Americans do not believe the US justice system treats everyone equally • 65% think police officers regularly racially profile Americans and 63% oppose
the practice.
Nearly two-thirds (65%) say police commonly “stop motorists and pedestrians of certain racial or ethnic backgrounds because the officer believes that these groups are more likely than others to commit certain types of crimes.” Another 63% also oppose police using racial profiling for traffic and pedestrian stops. Majorities of whites (62%), Hispanics (62%), and blacks (77%) oppose racial profiling by police. Republicans stand out with a slim majority (51%) in favor of racial profiling and 49% opposed. Black Republicans, however, disagree: 65% oppose racial profiling and 35% support it.5 Results from an experiment embedded in the survey reveal that liberals are more likely than conservatives to support criminal justice reform when primed to consider charges of racial bias in the system. Such charges have little impact on conservatives’ support for reform.
5 Data for support of racial profiling by race/ethnicity and partisanship come from the combined June 2016 and
November 2015 national surveys (N=4000), which offer greater precision and smaller margins of error for subgroups. (Unweighted: Black Republicans=45.)

FINDINGS FROM THE 2016 CATO INSTITUTE CRIMINAL JUSTICE SURVEY 4
• 58% say the US justice system fails to treat everyone equally before the law. Only 42% of Americans say the US justice system treats all racial groups equally. A plurality (45%) says the US justice system gives preference to white Americans, and 13% say the system treats blacks and Hispanics better. About half of whites (49%) say the justice system treats all racial groups equally, compared to 17% of African Americans and 27% of Hispanic Americans. White Republicans stand out with a solid majority (65%) who say the justice system treats everyone the same; however, only about a third of non-white Republicans agree. Seven in 10 white and non-white Democrats alike believe the system is biased in favor of whites. White Americans are more likely to believe accounts of racial bias in the system if they are predisposed toward empathy. Respondents who score high on the Sensitivity to Harm Index (SHI) are more than twice as likely to believe racial bias plagues the criminal justice system than those who score low (62% vs. 28%).6
• African Americans are five times as likely as Caucasians to personally
expect worse treatment from police officers, but a majority still expect to receive equal treatment from law enforcement. A third of African Americans expect police officers to treat them worse than other people, compared to 6% of white and 13% of Hispanic Americans. Nevertheless, while many believe the system overall is not impartial, majorities of whites (77%), Hispanics (72%) and blacks (60%) expect to personally receive equal treatment from law enforcement.
Americans aren’t convinced most police officers have integrity • Nearly half (49%) of Americans say “most” police officers think they are
“above the law.” African Americans (61%) and Hispanics (61%) are considerably more likely than whites (46%) to say that most police officers think they are above the law. In contrast, a majority of whites (54%) say police don’t think they’re above the law.
• 46% of Americans say police are “generally not” held accountable for
misconduct. 64% of African Americans say police are generally not held accountable for misconduct, compared to 43% of white Americans. A slim majority (51%) of Hispanics say police aren’t held accountable. Most Democrats (59%) worry police aren’t held accountable. In contrast, a strong
6 High Sensitivity to Harm Index (SHI) scores are defined as those in the top quartile, while low SHI scores are defined as
those in the bottom quartile. (See Appendix F for further details).

FINDINGS FROM THE 2016 CATO INSTITUTE CRIMINAL JUSTICE SURVEY 5
majority (76%) of Republicans and a slim majority (51%) of independents think officers are brought to account.
Most Americans agree about top priorities for the police Although Americans have different perceptions about how the police actually do their jobs, majorities of black, white, and Hispanic Americans agree on what the top three priorities for the police should be: investigating violent crime (78%), protecting citizens from crime (64%), and investigating property crime (58%). Majorities across racial and ethnic groups agree on path toward reform • 89% of Americans support police body cameras and slim majorities are
willing to raise taxes pay for them (51%) and let police look at the footage before making official statements (52%). Three-fourths also think body cameras protect both officers and citizens equally.
• 79% support outside law enforcement agencies conducting investigations of
police misconduct, while 21% prefer police departments handle such investigations internally.
• 68% support additional training for police officers to deal with confrontations, while 32% think officers already have the appropriate training.
• 63% oppose pretextual stops and searches—police using minor traffic
violations to search cars for drugs. • 73% want police to notify citizens if they may refuse to submit to a stop and
requested search. • 77% support prohibiting police officers from using profanity with citizens. Majorities across racial and ethnic groups also oppose a variety of actual and alleged police practices • 84% oppose civil asset forfeiture: Americans oppose police seizing “a
person’s money or property that is suspected to have been involved in a drug crime before the person is convicted.” When police departments seize people’s property, 76% say the local department should not keep the assets. Instead Americans think seized assets should go either to the state general fund (48%) or a state-level law enforcement fund (28%). A quarter (24%) say police departments should keep the property they seize.

FINDINGS FROM THE 2016 CATO INSTITUTE CRIMINAL JUSTICE SURVEY 6
• 54% say police using military equipment is going too far, while 46% say it’s necessary for law enforcement purposes. Majorities across racial groups oppose police using military weapons and armored vehicles (58% of blacks, 53% of whites and 51% of Latinos). Most Republicans (65%) believe police need to use military weapons, while 60% of both Democrats and independents believe police using such equipment goes too far.
• 63% oppose racial profiling, but 65% think it’s commonly used. Six in 10 Americans (59%) support police using drones, but a majority (54%) also worry drones could invade people’s privacy Americans across demographic and political groups support police use of drones. However, Democrats and independents (57%) are more wary than Republicans (46%) about the risks drones present to privacy. Americans want police to get warrants before conducting searches of cars and houses and before monitoring phone calls Americans agree that even if a person is suspected of breaking the law, police should obtain a court order before searching suspected drug dealers’ homes (66%) and before monitoring suspected criminals’ phone calls (76%). A majority (63%) also oppose police regularly checking cars for drugs during routine traffic stops without a court order. However, Americans might be willing to bend the rules depending on the suspect. While 66% say police ought to obtain a court order before searching the home of a suspected drug dealer, only 51% feel the same for individuals who “might be sympathetic to terrorists”—a 15 point difference. Forty-nine percent (49%) say police shouldn’t need a court order to search the home of a person the police think “might” be sympathetic to terrorists.7 60% say it’s more important to protect the innocent than punish the guilty When asked which would be worse, 60% say it would be worse to imprison 20,000 innocent people, while 40% say it would be worse to have 20,000 guilty people go free. Majorities of Republicans (55%), independents (60%), and Democrats (64%) all agree it’s worse to imprison innocent people. However, Donald Trump’s early supporters stand out with a majority (52%) who say it’s actually worse to not
7 Results are from the November 2015 Cato Institute/YouGov National Survey, conducted November 19 to 24, 2015.

FINDINGS FROM THE 2016 CATO INSTITUTE CRIMINAL JUSTICE SURVEY 7
punish the guilty. Other Republican voters disagree. For instance 65% of Ted Cruz’s early supporters say it’s worse to imprison the innocent.8 Changes in socioeconomic status or partisanship do little to change African Americans’ perceptions of law enforcement White Republicans and whites with higher incomes report more favorable attitudes toward the police than white Democrats and whites with lower incomes. However, blacks who are Republican or have higher incomes are not much more likely to report favorable attitudes toward the police than blacks who are Democratic or have lower incomes.9 Thus, race appears to affect views of the police even after considering the influence of income and ideology. • Favorability: White Americans with annual incomes exceeding $60,000 a year
are 23 points more favorable toward the police than white Americans with incomes less than $30,000 a year (79% vs. 56%). However, African Americans with higher incomes are about as favorable toward the police as those with lower incomes, with a little less than half favorable toward the police.
• Impartiality: White Republicans are 41 points more likely than white Democrats to believe the US justice system treats everyone equally (67% vs. 26%). However, black Republicans (15%), black independents (16%), and black Democrats (13%) are about equally likely to think the system is impartial. Hispanic Republicans are 28 points more likely than Hispanic Democrats to agree (45% vs. 17%).
• Use of Force: White Republicans are 41 points more likely than white
Democrats to believe police only use lethal force when necessary (85% vs. 44%). However, black Republicans (36%) are only 16 points more likely than black Democrats (20%) to agree. Similarly, Hispanic Republicans (58%) are 16 points more likely than Hispanic Democrats (42%) to say police only use necessary force.
These data provide some indication that if whites become wealthier and more Republican they become more favorable toward the police; however, African Americans do not become more favorable toward the police if their income rises or they become more Republican. Respect for Authority Figures Informs Public Attitudes Toward Police 8 Results are from the November 2015 Cato Institute/YouGov National Survey, conducted November 19 to 24, 2015. 9 Data for this section come from the combined June 2016 and November 2015 national surveys (N=4000), which offer
greater precision and smaller margins of error for subgroups. (Unweighted: Black Republicans=45, Hispanic Republicans=165, White Republicans=1193, Black Democrats=630, Hispanic Democrats=409, White Democrats=634.)

FINDINGS FROM THE 2016 CATO INSTITUTE CRIMINAL JUSTICE SURVEY 8
Many American conservatives have a greater respect for authority that may predispose them to hold more positive views of the police. Americans who score high on our Respect for Authority Index (RAI) (who also happen to be disproportionately conservative) are much more likely than those who score low to favor pedestrian stops (87% vs. 43%), to favor police using drones (71% vs. 46%), to say police only use lethal force when necessary (69% vs. 41%), and to say there is a war on police (77% vs. 42%).10 Statistical tests indicate that being conservative predicts attitudes toward the police much more than being liberal. 61% say there is a “War on Police” in America At first glance, most Americans (64%) have favorable attitudes toward their local police department and are confident their local police use the appropriate amount of force (58%), are courteous (57%) and honest (57%), treat all racial groups equally (56%), protect people from violent crime (56%), respond quickly to a call for help (56%), and care about community members (55%). Furthermore, 65% of Americans worry that police officers have “very dangerous jobs,” and 58% feel officers too often must deal with recalcitrant citizens who don’t show enough respect. Since many Americans don’t perceive systemic problems in policing, they view intensifying criticism of policing practices as an attack on police: 61% of Americans think there is a “war on police” today. Attitudes toward the police vary across four ideological groups of Americans: Libertarians, Liberals, Conservatives, and Communitarians To improve upon ideological self-identification (i.e. liberal/conservative) this report uses answers to a three-question screen (found in Appendix A) about the role of government in economic and personal affairs to identify four primary groups of Americans: Liberals (18%) who favor a larger government that doesn’t promote traditional values, Libertarians (17%) who favor a smaller government that doesn’t promote traditional values, Communitarians (16%) who favor a larger government that promotes traditional values, and Conservatives (26%) who favor a smaller government that promotes traditional values. (Another 25% do not fit in any of these categories). This report also examines how these four ideological clusters perceive policing in America today.
10 High Respect for Authority (RAI) scores are defined as those in the top quartile, while low RAI scores are defined as
those in the bottom quartile. (See Appendix E for additional information).

FINDINGS FROM THE 2016 CATO INSTITUTE CRIMINAL JUSTICE SURVEY 9
Acknowledgments The author would like to thank the many individuals who provided valuable input into the survey design and research process including Gene Healy, John Samples, Tim Lynch, Matthew Feeney, Jonathan Blanks, Adam Bates, Trevor Burrus, as well as Sam Henick, Mitchell Howley, and Anthony Ward for their research and creative assistance. For questions please contact: Emily Ekins [email protected] Cover design by Roshni Ashar and Jon Meyers. CATO INSTITUTE 1000 Massachusetts Ave., N.W. Washington, D.C. 20001 www.cato.org

FINDINGS FROM THE 2016 CATO INSTITUTE CRIMINAL JUSTICE SURVEY 10
Table of Contents
I. Overview ......................................................................................................... 1 II. The Dilemma of American Policing ........................................................... 12
a. The Confidence Gap ............................................................................................... 12 b. Consequences of the Confidence Gap ................................................................ 14 c. What to Do About the Confidence Gap ................................................................ 15
III. Determinants of Favorability Toward the Police ....................................... 18 a. Anxiety About Crime ............................................................................................... 18 b. Public Priorities for Policing ..................................................................................... 20 c. Personal Contact with the Police and Justice System ......................................... 22 d. Perceived Police Competency .............................................................................. 27 e. Perceived Police Professionalism and Empathy .................................................. 29 f. Police Misconduct: Experience and Perception .................................................. 30 g. Perceived Bias .......................................................................................................... 32
i. Perceptions of Systemic Racial Bias ......................................................................................... 32 ii. Perceptions of Personal Bias ..................................................................................................... 34 iii. Racial Profiling ............................................................................................................................ 36
h. BOX: Who Perceives Bias? ...................................................................................... 37 i. BOX: Talking about Police, Reform, and Race: What’s Persuasive? .................. 38 j. Evaluations of Police Tactics and Use of Force .................................................... 39 k. Perceptions of Police Accountability and Integrity ............................................. 41 l. Respect for Authority ............................................................................................... 44 m. BOX: Statistical Determinants of Favorability Toward Police ............................... 47
IV. The Path Toward Reform .............................................................................. 50 a. Reform Overview ...................................................................................................... 50 b. BOX: Police Reform Fact Sheet ............................................................................... 51 c. Training ..................................................................................................................... 52 d. Police Technology ................................................................................................... 53
i. Police Body Cameras ................................................................................................................ 53 ii. Drones .......................................................................................................................................... 55 iii. Militarization ................................................................................................................................ 56
e. Civil Asset Forfeiture ................................................................................................. 57 f. Investigating Police Misconduct ............................................................................ 58 g. BOX: Blackstone’s Ratio: Better to protect innocence or punish guilt? ............. 59 h. Police Stops, Searches, and Surveillance ............................................................. 61
i. Racial Profiling ............................................................................................................................ 61 ii. Notification of Voluntary Interactions with Police .................................................................. 63 iii. Police Professionalism During Police Stops .............................................................................. 63 iv. BOX: Do Americans Know the Law Regarding Police Stops? ............................................... 64 v. Who Should be Eligible for Police Stops? ................................................................................ 65 vi. Do Americans Think Police Searches and Frisks Help Fight Crime? ...................................... 67 vii. Do Americans Think Warrants are Necessary for Police Searches of Cars and Houses? .. 68 viii. Do Americans Think Warrants are Necessary for Police Monitoring Phone Calls? ............. 71
i. War on Drugs ............................................................................................................ 73 j. Who Needs to Change: Citizens, Cops, or Both? ................................................. 74
V. Conclusion .................................................................................................... 78

FINDINGS FROM THE 2016 CATO INSTITUTE CRIMINAL JUSTICE SURVEY 11
VI. Appendices .................................................................................................. 79 a. Appendix A: Ideological Clusters .......................................................................... 79 b. Appendix B: Police Department Ratings ............................................................... 80 c. Appendix C: Number of Police Stops in Past 5 Years .......................................... 81 d. Appendix D: Police Department Ratings by Demographics .............................. 83 e. Appendix E: Respect for Authority Index (RAI) ..................................................... 84 f. Appendix F: Sensitivity to Harm Index (SHI) .......................................................... 85 g. Appendix G: Predicting Perceptions of Justice System Bias .............................. 86 h. Appendix H: Persuasive Impact of Charging Justice System with Bias ............ 87 i. Appendix I: Predicting Favorability Toward Police—Measurements ................. 88 j. Appendix J: Predicting Favorability Toward Police ............................................. 89
VII. Survey Methodology .................................................................................... 91

FINDINGS FROM THE 2016 CATO INSTITUTE CRIMINAL JUSTICE SURVEY 12
The Dilemma of American Policing
At first glance Americans seem generally satisfied with their local law enforcement. Nearly two-thirds (64%) of Americans have a favorable view of the police in their communities, including 33% who have a “very favorable” and 31% who have a “somewhat favorable” view. Only 14% say they have an unfavorable view of their local police, and another 22% say they have neither positive nor negative feelings. (See Appendix B for citizen evaluations of police.) These topline numbers, however, conceal stark differences in attitudes toward the police across race/ethnicity, age, education, income, and ideology. While some groups have firmly positive views of the police, others believe policing suffers from systematic problems.
Although 64% of Americans overall have a favorable opinion of their local police, only 40% of black Americans and 59% of Hispanic Americans agree. In contrast, white Americans have a much more favorable (68%) perception of the police in their communities. This striking divide across racial and ethnic groups’ attitudes toward the police particularly merits additional investigation.
Racial&Divide&in&Favorability&Toward&the&Police%"Favorable"Opinion"of"the"Police
CATO"INSTITUTE/YOUGOV"2016"CRIMINAL"JUSTICE"SURVEY
Caucasian( African(American( Hispanic( All(Americans(
68% 40% 59% 64%
Overall,(Americans(Have(a(Favorable(View(of(Police(In(their(CommunitiesDo#you#have#a#favorable#or#unfavorable#view#of#the#police#in#your#community?#
CATO%INSTITUTE/YOUGOV%2016%CRIMINAL%JUSTICE%
Very(Favorable(
33%(Neither(
22%(Somewhat)Favorable(
31%)

FINDINGS FROM THE 2016 CATO INSTITUTE CRIMINAL JUSTICE SURVEY 13
Millennials (Americans under 35) (54%), lower income households (<$30,000), and high school graduates (59%) are also about 20 points less favorable toward the police than Americans over 65 (82%), middle and higher income households ($50,000+) (76%), and high school graduates (73%).11 Suburban residents are only slightly more favorable toward the police (69%) than urban residents (60%). Notably, men and women have similar views of the police. (See Appendix C for breakdown of attitudes by demographics.) Partisanship significantly correlates with attitudes toward the police. Republicans are more than 20 points more favorable toward the police (81%) than Democrats (59%) and independents (59%). Similarly, ideological Conservatives stand out as the group most favorable (80%) toward the police. Libertarians’ views (64%) are more similar to Communitarians’ (58%) and Liberals’ (54%). (See Appendix A for definitions of ideological clusters.) Americans Are Not “Anti-Cop” Although some groups have less favorable attitudes toward the police, additional findings in the survey suggest these groups are not “anti-cop.”12 First, few individuals have outright “very unfavorable” views of the police: only 5% of Hispanics, 11% of African Americans, and 3% of whites share this view. Instead, more African Americans (40%) and Hispanics (28%) feel conflicted and report neutral rather than positive or negative feelings toward the police, as do 18% of whites. In addition, majorities agree on what law enforcement’s top priorities ought to be: investigating violent and property crime and protecting people from crime. Furthermore, being “anti-cop” should lead a person to want fewer police in a 11 Millennials in this report are defined as Americans under the age of 35. 12 Some have claimed that individuals critical of policing practices, or those who have negative feelings toward the
police, are also anti-cop; see Matt Wilstein, "‘Daily Show’s’ Trevor Noah on Police Shootings: ‘You Can Be Pro-Cop and Pro-Black’," Daily Beast, July 8, 2016, http://www.thedailybeast.com/articles/2016/07/08/daily-show-s-trevor-noah-on-police-shootings-you-can-be-pro-cop-and-pro-black.html.
Favorable Toward
Local Police
Definitely Would Report
a Crime
White 68% 78%African American 40% 54%Hispanic 59% 57%
Male 65% 70%Female 64% 74%
18-29 54% 54%30-44 54% 63%45-64 70% 82%65+ 82% 87%
<$30,000 54% 62%$30,000-$49,999 64% 73%50,000-99,999 76% 76%100,000+ 76% 84%
High School or Less 59% 68%Some College 64% 69%College Grad+ 73% 81%
City 60% 69%Suburb 69% 74%Rural area 61% 72%
Democrat 59% 69%Independent 59% 67%Republican 81% 82%
Ideological IndexLibertarian 64% 70%Conservative 80% 82%Liberal 54% 77%Communitarian 58% 71%
Favorability Toward Police By Demographics and Ideology
CATO INSTITUTE/YOUGOV 2016 CRIMINAL JUSTICE SURVEY

FINDINGS FROM THE 2016 CATO INSTITUTE CRIMINAL JUSTICE SURVEY 14
community.13 But no group wishes to decrease the number of police officers in their communities (about 9 in 10 oppose). Instead, about half of blacks, whites, and Hispanics favor maintaining present levels and more than a third say their community needs more officers. Consequences of the Confidence Gap These confidence gaps come with consequences. Effective policing depends on police and their communities working together in a symbiotic relationship based on mutual respect and trust. The police are best able to serve and protect their communities when the residents freely cooperate with the police, for instance when residents are willing to report a crime they witness.
However, individuals who have less favorable opinions of the police are less likely to report a crime. For instance, while 78% of white Americans say they would “definitely” report a violent crime they witnessed, considerably fewer African Americans (54%) and Hispanics (57%) feel as confident. Fewer than half of African American men with annual incomes less than $30,000 a year would “definitely” report a crime. Young Americans are also less likely to say they would report a violent crime if they saw one compared to seniors (53% vs. 87%). In addition, households making less than $30,000 a year (62%) and high school graduates (68%) are considerably less likely than those making over $60,000 a year (79%) or college graduates (81%) to be confident they would report a violent crime they witnessed. When residents feel the justice system is fair and impartial, they have confidence in the police. Such confidence encourages cooperation with the police, which 13 To be sure, advocates of shrinking police departments are not necessarily “anti-cop” either; however, it’s difficult to
argue a person is if they do not want to cut the police force.
How$Willing$Are$Americans$to$Report$a$Crime?%"Who"Would"Definitely"Report"a"Crime
CATO"INSTITUTE/YOUGOV"2016"CRIMINAL"JUSTICE"SURVEY
White&American& African&American& All&Americans&
78% 54% 57% 72%
Hispanic American

FINDINGS FROM THE 2016 CATO INSTITUTE CRIMINAL JUSTICE SURVEY 15
is necessary to reduce crime.14 Moreover, when the police have legitimacy, the law has legitimacy, which encourages compliance with the law. Studies have shown that citizens are more likely to obey the law when the police have legitimacy.15 What to Do About the Confidence Gap? In communities that distrust local law enforcement, police departments should seek to earn the trust and confidence of community members. This will bolster the law’s legitimacy and help officers do their jobs effectively and safely. In order to rebuild trust and confidence in law enforcement, we must first understand what is driving these disparate attitudes toward police. The use of public opinion surveys can help to uncover not only what people think about the police but also to understand why they think what they do. This can enable police departments and lawmakers to craft policies to improve police-community relations. The Race Gap This report focuses on racial gaps in views of the police and does so for several reasons. First, race and ethnicity are associated with sharp differences in favorability toward the police (see Appendix C). Moreover, public opinion studies of the police have long found that race strongly predicts attitudes toward the police.16 Age, income, and education can change, but the race and ethnicity of individuals persist. Thus, racial gaps in views of the police are more durable over time. 14 See Linquiin Cao, James Frank, and Francis T. Cullen, "Race, Community Context and Confidence in the Police."
American Journal of Police 15 (1996): 3-22. Tom Tyler, and Jeffrey Fagan, "Legitimacy and Cooperation: Why Do People Help the Police Fight Crime in Their Communities?" Ohio State Journal of Criminal Law 6 (2008): 231-275; Andrew V. Papachristos, Tracey L. Meares, and Jeffrey Fagan, "Why Do Criminals Obey the Law? The Influence of Legitimacy and Social Networks on Active Gun Offenders," Journal of Criminal Law and Criminology 102 No. 2 (2009): 397-440; Tom R. Tyler, "The Role of Perceived Injustice in Defendants' Evaluations of Their Courtroom Experience," Law & Society Review 18 (1984): 51-74; Tom Tyler, Why People Obey the Law (Princeton: Princeton University Press, 2006); Jonathan Blanks, "How Pretextual Stops Undermine Police Legitimacy," Case W. Res. L. Review 66 (2016): 931-946.
15 Andrew V. Papachristos, Tracey L. Meares, and Jeffrey Fagan, "Why Do Criminals Obey the Law? The Influence of Legitimacy and Social Networks on Active Gun Offenders," Journal of Criminal Law and Criminology 102, no. 2 (2009): 397-440.
16 Ben Brown and Wm Reed Benedict, "Perceptions of the Police: Past findings, Methodological Issues, Conceptual Issues and Policy Implications," Policing: An International Journal of Police Strategies & Management 25 (2002): 543-580; W. S. Wilson Huang and Michael S. Vaughn, "Support and Confidence: Public Attitudes Toward the Police," in Americans View Crime and Justice: A National Public Opinion Survey, edited by Timothy J. Flanagan and Dennis R. Longmire, (Thousand Oaks: Sage, 1996).
Little&Change&in&White&and&Black&Americans'&Attitudes&Toward&the&Police&1970?2016
CATO%INSTITUTE/YOUGOV%2016;Note:%Louis%Harris%and%Associates,%1970
67%& 68%&
43%& 40%&
1970& 2016&
%&Favorable&View&of&Police&Among%White%Americans%Among%Black%Americans%

FINDINGS FROM THE 2016 CATO INSTITUTE CRIMINAL JUSTICE SURVEY 16
Surveys indicate that the racial divide on policing has not changed much over the past 50 years. In 1970 a national poll found 67% of white Americans and 43% of African Americans had a favorable view of the police.17 Similarly today, 68% of whites and 40% of blacks have a favorable view of the police. This suggests police reforms implemented since the 1970s have done little to close the confidence gap. Race appears to affect views of the police even after considering the effects of other demographic factors. For instance, whites making more than $60,000 a year (79%) are more than 20 points more likely than whites making less than $30,000 (56%) a year to have a favorable view of the police. However, higher income African Americans (48%) are not much more likely than lower income African Americans (41%) to have positive views of the police. A similar pattern emerges across partisans. White Republicans (83%) are nearly 20 points more likely than white Democrats to feel favorable toward the police. However, black Republicans (44%) are no more likely than black Democrats (44%) to have a favorable view.18 Thus race appears to affect attitudes toward the police even after considering the influence of income and ideology.19 Despite the fact that Hispanics comprise 17.4% of the US population, little research has examined the similarities and differences in attitudes between Hispanics and other groups.20 The little research that does exist suggests Hispanics may take a “middle ground” between white and black Americans in their attitudes toward the police and thus should not be combined with other groups. 21 Our data also indicate that Hispanic attitudes are distinct from blacks’ and whites’. 17 Louis Harris and Associates Study No. 2043, 1970, cited in Michael J. Hindelang,"Public Opinion Regarding Crime,
Criminal Justice, and Related Topics." Journal of Research in Crime and Delinquency 11 (1974):101-116. 18 These data come from the combined June 2016 and November 2015 national surveys (N=4000), which offer greater
precision and smaller margins of error for subgroups. (Unweighted: Black Republicans=45.) 19 All racial groups become more supportive of the police as they age; however, age does not erase the race gap. 20 US Census. US Census Quick Facts. (Washington, D.C.: United States Census Bureau, 2014),
https://www.census.gov/quickfacts/table/RHI725214/00; Ronald Weitzer, "The Puzzling Neglect of Hispanic Americans in Research on Police–Citizen Relations," Ethnic and Racial Studies 37 (2013): 1995-2013.
21 Ronald Weitzer, "The Puzzling Neglect of Hispanic Americans in Research On Police–Citizen Relations," Ethnic and Racial Studies 37 (2013): 1995-2013; James R. Lasley, "The Impact of the Rodney King Incident on Citizen Attitudes Toward the Police," Policing and Society 3 (1994): 245-255, cited in W. S. Wilson Huang, and Michael S. Vaughn, "Support and Confidence: Public Attitudes Toward the Police," in Americans View Crime and Justice: A National Public Opinion Survey, edited by Timothy J. Flanagan and Dennis R. Longmire (Thousand Oaks: Sage, 1996).
For$African$Americans,$Favorability$Toward$Police$Changes$Little$With$Income
CATO%INSTITUTE/YOUGOV%2016,%2015%CRIMINAL%JUSTICE%SURVEYS
56%$
79%$
41%$48%$
57%$
69%$
<$30K$ $30K/$59K$ $60K+$
%$Favorable$View$of$Police$
White& Black& Hispanic&

FINDINGS FROM THE 2016 CATO INSTITUTE CRIMINAL JUSTICE SURVEY 17
This report carefully examines the racial gap in views of the police and makes efforts to identify potential causes. To assist in this endeavor, the survey included oversamples of African Americans and Hispanics (see Survey Methodology Section). Results are weighted to be representative of the national sample. In the next section, the report explores a variety of Americans’ perceptions, experiences, and beliefs about law enforcement that may impact overall favorability toward the police. Next it examines which of these perceptions and experiences best predicts favorability toward the police. Lastly, the report investigates public support for a variety of reforms and policy changes proposed in recent years to improve police-community relations.

FINDINGS FROM THE 2016 CATO INSTITUTE CRIMINAL JUSTICE SURVEY 18
Potential Determinants of Favorability Toward the Police This section examines Americans’ beliefs, perceptions, and experiences that may impact their general favorability toward the police, including anxiety about crime in one’s neighborhood, respect for authority figures, preferences about police priorities, experiences with the police and perceptions of police competency, professionalism, impartiality, use of force, accountability and integrity. It then examines the extent to which each may correlate with favorability toward the police.
Anxiety about Crime Thirty-seven percent (37%) of Americans say they know a victim of a violent crime, and 19% say they know someone who was murdered. About a quarter (26%) of Americans say they are very or extremely concerned about personally being a victim of a crime, while 37% say they are somewhat concerned, 31% are not too concerned and 6% are not at all concerned.
Americans are far less worried about being a crime victim today than they were in the 1990s, which reflects actual declines in federal crime statistics.22 In the early 1990s about half (51%) of Americans said they were “very concerned” about being a victim of a crime, this has since declined to about 26% today.23 22 Despite falling crime rates nationally, some surveys show Americans continue to believe crime is getting worse each
year. For instance, Gallup found about two-thirds of Americans say there is more crime in the United States today that there was a year ago, and that this share has increased over time. Even at a local level, about half of Americans say there is “more crime” in their area than there was a year ago. However, although Americans may say crime is higher, this report shows they are less concerned about being a crime victim than in the past, which reflects the fact that crime rates are decreasing. See Justin McCarthy, “Most Americans Still See Crime Up Over Last Year,” Gallup November 21, 2014, http://www.gallup.com/poll/179546/americans-crime-last-year.aspx.
Knows&a&victim&of&a&violent&crime
Knows&someone&who&was&murdered
Extremely/Very&Concerned&About&Being&Crime&Victim
Anxiety&about&Crime
CATO%INSTITUTE/YOUGOV%2016%CRIMINAL%JUSTICE%SURVEY
37% 19% 26%

FINDINGS FROM THE 2016 CATO INSTITUTE CRIMINAL JUSTICE SURVEY 19
While concern about crime has dropped to 26% overall, African Americans and Hispanics (4 in 10) are about twice as likely as white Americans (2 in 10) to fear being crime victims. Furthermore, 41% of African Americans say they know someone who was murdered, about twice the level reported by whites (17%) and Hispanics (15%). Americans living in cities (34%), with high school educations or less (28%), or earning less than $30,000 annually (31%) are also about twice as likely as rural residents (17%), those with college degrees (19%), or households making over $100,000 a year (19%) to be very concerned about crime. Anxiety about being a crime victim does not correlate with favorability toward the police, but it may modestly bolster support for increasing police presence. For instance, Americans very concerned about becoming a crime victim are more likely to support adding new police officers to their local departments (41%) than those who are not concerned about crime (26%).
23 This data is compiled from the following surveys, which are available at the Roper Center or from the author: 1988,
Gallup/Times Mirror; 1994 and 1995, Princeton Survey Research Associates (PSRA)/Times Mirror; 1996, PSRA/Kaisier Foundation; 1997, PSRA/Pew Research Center; 1999, 2001, 2004, 2006, 2007 PSRA/Pew; 2015 and 2016, YouGov/Cato Institute. Crime statistics compiled from FBI, Uniform Crime Reports, prepared by the National Archive of Criminal Justice Data.
Americans Recognize Falling Crime Rates
CATO INSTITUTE/YOUGOV 2016 CRIMINAL JUSTICE SURVEYCRIME STATISTICS SOURCE: FBI, Uniform Crime Reports, National Archive of Criminal Justice Data
% Who Are Very Concerned about Being a Crime Victim
Leve
l of C
rime
Per 1
00,0
00
Property + Violent Crime Per 100,000
1985 1990 1995 2000 2005 2010 2015
%VeryConcernedAboutBeingCrim
eVictim
36%
51%
26%
Blacks'and'La+nos'are'about'twice'as'likely'as'whites'to'report'being'very'worried'about'being'a'crime'vic+m'
Worry%about%Crime%Vic0miza0on%
2x#

FINDINGS FROM THE 2016 CATO INSTITUTE CRIMINAL JUSTICE SURVEY 20
Public Priorities for Policing Police officers have limited time and resources and thus must decide how to prioritize their duties. Americans generally agree on the top three priorities for law enforcement: first, investigating violent crime like murder, assaults, and domestic violence (78%), second, protecting individuals from violent crime (64%), and third investigating property crime and robbery (58%). A little under a third (30%) think police should make enforcing drug laws a top three priority. Notably, only 19% say police should make enforcing traffic laws a top priority. In other words, Americans de-prioritize the task leading to the most common interaction individuals have with the police—receiving a traffic ticket.24 Another 18% think police should prioritize going beyond traditional law enforcement responsibilities by “providing guidance and social services to troubled young adults.” And another 12% say police enforcing public nuisance laws is most important. Black, white, and Hispanic Americans prioritize the same top three tasks for law enforcement; however, groups differ in intensity of support. Perhaps most strikingly, African Americans and Hispanics (45%) are 18 points less likely than white Americans (63%) to prioritize the police investigating property crime and robbery, (although this difference largely dissipates among individuals above the median income). African Americans and Latinos (27%) are also about 24 Christine Eith and Matthew R. Durose, Contacts between Police and the Public, 2008, edited by Bureau of Justice
Statistics (Washington, D.C.: U.S. Department of Justice, 2011), https://www.bjs.gov/content/pub/pdf/cpp08.pdf.
Say$Enforcing$$Traffic&Laws&
Should$Be$a$Top$Police$Priority$
19%$
How$Should$the$Police$Prioritize$Tasks?What%do%you%think%the%top%three%priorities%of%law%enforcement%should%
CATO%INSTITUTE/YOUGOV%2016%CRIMINAL%JUSTICE%SURVEY
Note:%Investigating%violent%crime%included%murder,%assaults,%and%domestic%violence;%Enforcing%
public%nuisance%laws%included%loitering%and%disorderly%conduct%as%examples.
78%%
64%%
58%%
30%%
19%%
18%%
12%%
InvesWgaWng%%
Violent%Crime%
ProtecWng%You%%
From%Violent%Crime%
InvesWgaWng%%
Property%Crime/Robbery%
Enforcing%Drug%Laws%
Enforcing%Traffic%Laws%
Providing%Guidance%%
and%Social%Services%
Enforcing%Public%%
Nuisance%Laws%
Top$Three$Priori7es$of$Law$Enforcement$

FINDINGS FROM THE 2016 CATO INSTITUTE CRIMINAL JUSTICE SURVEY 21
twice as likely as Caucasians (15%) to say the police should prioritize “providing guidance and social services to troubled young adults.” Despite these modest differences, Americans across partisanship and demographics generally have similar priorities in mind for law enforcement. In addition, beliefs about police priorities don’t vary with favorability toward the police and thus likely have little impact on attitudes toward law enforcement.
Race%Gap%Narrows%on%Police%Priorities
CATO%INSTITUTE/YOUGOV%2016%CRIMINAL%JUSTICE%SURVEY
%%Who%Say%Task%Should%Be%Top%Three%Police%Priority
White%American% Black%American% Hispanic%American%
W,%80%%
W,%66%%W,%63%%
W,%30%%
W,%20%%
W,%15%% W,%12%%
B,%78%%
B,%64%%
B,%45%%
B,%30%%
B,%14%%
B,%28%%
B,%12%%
H,%65%%
H,%59%%
H,%44%%
H,%30%%
H,%15%%H,%26%%
H,%16%%
Inves;ga;ng%violent%crime%
Protec;ng%you%from%
being%crime%vic;m%
Inves;ga;ng%property%crime%
Enforcing%drug%laws%
Enforcing%traffic%laws%
Providing%social%
services%to%young%people%
Enforcing%public%
nuisance%laws%

FINDINGS FROM THE 2016 CATO INSTITUTE CRIMINAL JUSTICE SURVEY 22
Personal Contact with the Police and Justice System Personal interactions with police officers and the criminal justice system can influence favorability toward law enforcement.25 The experiences of family members and friends may also cause a person to “vicariously experience” those interactions, thereby shaping views of the police.26 In turn, disparate personal and vicarious experiences with the police may help explain differences in favorability toward law enforcement. Rating Personal Contact Sixty-seven percent (67%) of Americans who have had personal contact with a police officer in the past five years report being satisfied with their encounter, rating their satisfaction as either 4 or 5 on a scale of 1 to 5.27 African Americans are considerably less likely than whites and Hispanics to positively rate their personal interactions with police officers. Seven in 10 white Americans (70%) and Hispanic Americans (66%) rate their personal police encounters as a 4 or 5, compared to 50% of African Americans.
25 Several scholarly studies find that personal satisfaction with police contact may be the strongest determinant of
positive attitudes toward the police. See W. S. Wilson Huang and Michael S. Vaughn, "Support and Confidence: Public Attitudes toward the Police," in Americans View Crime and Justice: A National Public Opinion Survey, edited by Timothy J. Flanagan and Dennis R. Longmire (Thousand Oaks: Sage, 1996); Richard Scaglion and Richard G. Condon, "Determinants of Attitudes toward City Police," Criminology 17, no. 4 (1980): 485-94.
26 Ronald Weitzer and Steven A. Tuch, "Racially Biased Policing: Determinants of Citizen Perceptions," Social Forces 83 (2005): 1009-1030.
27 Americans who have had personal contact with a police officer in the past 5 years were asked to rate their level of personal satisfaction with their encounter on a scale of 1 (low satisfaction) to 5 (high satisfaction). Americans who rated their encounters as either 4 or 5 are considered “highly satisfied.” Americans’ average level of satisfaction with personal police encounters is 3.83, with 67% who rated their interactions with police as a 4 or 5. About a fifth of Americans say they did not interact with police over the past five years. Racial groups were about equally likely to report having had some contact with police in the past 5 years.
Satisfaction*with*Personal*Police*Encounters%"Highly"Satisfied
CATO"INSTITUTE/YOUGOV"2016"CRIMINAL"JUSTICE"SURVEY
White&American& African&American& All&Americans&
70% 50% 66% 67%
Hispanic American

FINDINGS FROM THE 2016 CATO INSTITUTE CRIMINAL JUSTICE SURVEY 23
As a share of all respondents (both those with and without personal police contact in the past five years) 56% of white Americans report having had a satisfactory police encounter in the past five years, as do 38% of African Americans and 51% of Hispanics. Partisans evaluated their interactions with the police differently. Eight in 10 Republicans report being satisfied with their police encounters over the past five years, compared to six in 10 Democrats and independents. Not surprisingly, satisfaction with personal police contact is highly correlated with favorability toward one’s local police department. Among those satisfied with personal police contact, 86% have a favorable opinion of law enforcement. But, among those dissatisfied with their interactions with police, 61% have an unfavorable opinion. Frequency of Police Stops Thirty-eight percent (38%) of Americans report they’ve been officially stopped by a police officer in the past five years: 20% say they’ve been stopped once, 9% say they’ve been stopped twice, and another 9% say they’ve been stopped three or more times (August 2016 survey).28 Black Americans report being stopped at a higher frequency than whites and Hispanics. Among blacks, 27% report being stopped two or more times in the past five years, as do 18% of whites and 13% of Hispanics. In a similar pattern, 17% of blacks report being stopped three or more times, compared to 8% of whites and 4% of Hispanics.
28 Data on frequency of police stops in this section come from a national Cato Institute/YouGov survey conducted
August 10 to 12, 2016 (N=1000), which did not include oversamples of African-Americans and Hispanics. Thus, readers should exercise additional caution when interpreting these results with smaller sample sizes (African American (N=108) Hispanic (N=115)). Question wording: “Over the past five years, about how many times would you say you were stopped by the police?"
African(Americans(Report(Higher(Number(of(Police(StopsOver%the%past%five%years,%about%how%many%times%would%you%say%you%were%stopped%by%the%police?
CATO%INSTITUTE/YOUGOV%AUG%10112%2016
18%(
8%(
27%(
17%(13%(
4%(
2+(Times( 3+(Times(
White( Black( Hispanic(

FINDINGS FROM THE 2016 CATO INSTITUTE CRIMINAL JUSTICE SURVEY 24
There is some evidence that black Americans are more likely to be stopped by police as their income rises than white Americans similarly situated. A statistical test finds that as blacks’ incomes rise they are significantly more likely to report being stopped by police (see Appendix D).29 However, white and Hispanic Americans are no more likely to report being stopped by police as their income rises. For instance, blacks with incomes over $50,000 a year (Mean =1.34 stops) report being stopped at about 1.5 times the rate of whites with incomes over $50,000 a year (Mean =.91 stops). 30 Among those making less than $50,000 annually, blacks’ average number of reported stops (Mean=.84 stops) is only slightly above whites’ (Mean =.76 stops).
This fits with anecdotal reports from wealthy African Americans who report they avoid driving expensive cars to avoid added police scrutiny. For instance, actor Isaiah Washington tweeted that he sold his Mercedes and bought three less expensive Honda Priuses because he “got tired of being pulled over by the police.”31 Sen. Tim Scott (R-SC) and billionaire private-equity financier Robert Smith have shared similar stories of being stopped three to seven times a year.32 29 Model estimated via OLS regression 30 Black M=1.34 SD=1.62, white M=.91 SD=1.72. 31 Stereo Williams, "Chris Rock, Isaiah Washington, and Racial Profiling: Why Black People Shouldn’t Have to ‘Adapt’,"
Daily Beast, April 2, 2015. http://www.thedailybeast.com/articles/2015/04/02/chris-rock-isaiah-washington-and-racial-profiling-why-black-people-shouldn-t-have-to-adapt.html.
32 Sen. Tim Scott (R-SC) and Robert Smith report being pulled over between three to seven times per year. Keith L. Alexander, "‘Who Is This Robert Smith?’: A Quiet Billionaire Makes Some Noise with $20 Million Gift to the African American Museum." Washington Post, September 24, 2016, https://www.washingtonpost.com/national/who-is-this-robert-smith-a-quiet-billionaire-makes-some-noise-with-20-million-gift-to-the-african-american-museum/2016/09/23/547da3a8-6fd0-11e6-8365-b19e428a975e_story.html; Katie Reilly, "Read Senator Tim Scott’s Candid Account of Getting Stopped by Police," Time, July 14, 2016, http://time.com/4406540/senator-tim-scott-speech-transcript/.
Predicted(Number(of(Police(Stops(by(Race(and(Income
0.5
11.
52
Aver
age
# of
Sto
ps
Low HighIncome
Not Black BlackModel estimated via OLS
by Race and IncomePredicted Number of Police Stops

FINDINGS FROM THE 2016 CATO INSTITUTE CRIMINAL JUSTICE SURVEY 25
Types of Personal Contact
About a quarter (27%) of Americans report having had an experience in which a police officer kept them or their family member safe in a potentially dangerous situation. Such reports do not vary considerably among demographic and political groups. As one would expect, individuals who report being kept safe (76%) are about 16 points more likely to report a favorable opinion of the police than those without this experience (60%). Most Americans have also personally or vicariously come into contact with the police and justice system for less auspicious reasons. About half (47%) say they know
someone who has been stopped and searched by an officer, 63% say they know someone who has been arrested, and 57% say they know someone who has been in prison or jail.
African Americans (60%) are 13-20 points more likely than Caucasians (47%) and Hispanic Americans (40%) to know someone who has been stopped and searched by a police officer. About two-thirds of blacks and whites say they know someone who has been arrested or been to prison or jail, compared to a little less than half of Hispanics.
Been Stopped and Searched by a Police
Officer
Been Arrested
Been in Prison or in Jail
Do you know anyone who has ever…
CATO INSTITUTE/YOUGOV 2016 CRIMINAL JUSTICE SURVEY
47% 63% 57%
Report'Experience'Where'Police'Kept'Them'Safe'in'a'
Dangerous'Situa;on'
27%$

FINDINGS FROM THE 2016 CATO INSTITUTE CRIMINAL JUSTICE SURVEY 26
People who report knowing someone who has been stopped and searched by a police officer are about 14 points less favorable toward the police (57%) than those who do not know someone with this experience (71%). However knowing someone who has been arrested or been to prison or jail doesn’t correlate (either positively or negatively) with favorability toward the police.
Reported(Personal(or(Vicarious(Interactions(With(Criminal(Justice(System
CATO%INSTITUTE/YOUGOV%2016%CRIMINAL%JUSTICE%SURVEY
%%Who%Know%Someone%with%This%Experience
White(American( Black(American( Hispanic(American(
W,%47%%
W,%67%%
W,%59%%
W,%37%%
W,%17%%
B,%60%%
B,%68%%
B,%64%%
B,%47%%
B,%41%%H,%40%%
H,%46%% H,%46%%
H,%30%%
H,%15%%
Stopped(&(Searched(by(a(Police(Officer(
Arrested( In(Prison((or(Jail(
VicBm(of(a(Violent(Crime(
Murdered(

FINDINGS FROM THE 2016 CATO INSTITUTE CRIMINAL JUSTICE SURVEY 27
Urban Density Whether someone lives in an urban, suburban, or rural area might influence their attitudes toward the police.33 People who live in densely populated areas are more likely to come into contact with officers. City centers also are more likely to have higher crime rates, which may increase the likelihood one has an encounter with law enforcement.34 However, actual differences in favorability toward the police by community type are rather small. Sixty-nine percent (69%) of individuals living in the suburbs have a favorable view of the police, as do 60% of those living in cities and 61% residing in rural areas. Perceived Police Competency In general, nearly 6 in 10 Americans give their local police forces high marks for enforcing the law (59%), protecting people from violent crime (56%) and responding quickly to a call for help (56%). Slightly fewer (50%) give their local police a high rating for solving crime.35 However, there are significant differences across race/ethnicity, ideology, income, and urban density in perceptions of police competency (see Appendix C).
33 See W. S. Wilson Huang and Michael S. Vaughn, "Support and Confidence: Public Attitudes toward the Police," in
Americans View Crime and Justice: A National Public Opinion Survey, edited by Timothy J. Flanagan and Dennis R. Longmire (Thousand Oaks: Sage, 1996).
34 Elizabeth Kneebone and Steven Raphael, “City and Suburban Crime Trends in Metropolitan America,” Brookings Institutions Metropolitan Policy Program, May 2011, https://www.brookings.edu/wp-content/uploads/2016/06/0526_metropolitan_crime_kneebone_raphael.pdf.
35 High ratings are defined as answering 4 or 5 on a scale of 1-5: “How good a job is the police department in your community doing for each of the following, using a scale of 1 to 5 where 1 means you think it’s doing a poor job and 5 means you think it’s doing an excellent job."
White&American &&&&&&&&&&African&American&&&&&&&&&&Hispanic&American &&
Protects(You((from(Crime?(
60%(
38%(49%(
Are(Your(Local(Police(Competent?(
64%(
44%(49%(
Enforcing((the(Law?(
59%(
43%(49%(
Responding((Quickly?(
53%(
37%( 41%(
Solving((Crime?(
%&Who&Give&Very&Good/Excellent&Ra=ngs&
CATO%INSTITUTE/YOUGOV%2016%CRIMINAL%JUSTICE%SURVEY%

FINDINGS FROM THE 2016 CATO INSTITUTE CRIMINAL JUSTICE SURVEY 28
White Americans are roughly 20 points more likely than African Americans, and 10-15 points more likely than Hispanic Americans, to highly rate their local police departments for effectiveness. (See Appendix C for full breakdowns.) For instance, while 60% of white Americans think police effectively protect people from crime, only 38% of African Americans and 49% of Hispanics agree. Similarly about 6 in 10 whites think the police do a good job enforcing the law and responding quickly, compared to 4 in 10 blacks and less than half of Latinos. Perceptions of police competency strongly correlate with ideology. Seventy-eight percent (78%) of respondents who identify as “very conservative” gave their local police high ratings for enforcing the law, while only 46% of “very liberal” respondents agree. Similarly, while 62% of very conservative respondents have high confidence in their local police departments’ ability to solve crime, only 35% of very liberal respondents agree. Education, income, and age are also related to perceptions of police efficacy. College graduates (67%), households earning $60,000+ a year (69%), and seniors (72%) give the police high ratings for “enforcing the law.” In contrast, considerably fewer high school graduates (55%), households earning less than $30,000 a year (54%), and millennials (53%) agree.36 Suburban residents (62%) are somewhat more likely than urban residents (53%) to believe the police are effective at enforcing the law. In sum, Americans who are older, higher income, conservative, white, and living in the suburbs are the most likely to believe the police are good at their jobs. Conversely, individuals who are younger, lower income, liberal, African American or Hispanic, and living in urban neighborhoods are least confident that the police are competent. (See Appendix D for full breakdowns.) Evaluations of police competency are highly correlated with overall favorability toward the police. Among those who give the police high ratings for protecting people from crime, 83% have a favorable view of local law enforcement,
36 Within each racial/ethnic group, millennials have less confidence in police efficacy than seniors.
CATO%INSTITUTE/YOUGOV%2016%CRIMINAL%JUSTICE%SURVEY
Perceptions+of+Police+Competency+by+IdeologyHow$good$a$job$is$the$police$department$in$your$community$doing$for$each$of$the$following…
46%%
56%%53%%
72%%
78%%
35%% 37%%
63%% 62%%
Very%%Liberal%
Liberal% Moderate% ConservaJve% Very%%ConservaJve%
%+High+Ra:ngs+by+Ideology+
Enforcing%the%law% Solving%crime%

FINDINGS FROM THE 2016 CATO INSTITUTE CRIMINAL JUSTICE SURVEY 29
compared to 27% among those who have low confidence in police competency.37
Police Professionalism and Empathy Nearly six in 10 Americans give their local police department high ratings for “being courteous” (57%) and for demonstrating they care about the people in the community (55%).38 About 3 in 10 give the police an average rating and 1 in 10 give police a low rating. Responses differ by race, age, income, and partisanship. About 4 in 10 African Americans give their local police departments high ratings for being courteous and caring about community members, compared to 6 in 10 white Americans and half of Hispanics.
Millennials (46%) and households earning less than $30,000 a year (56%) are less likely than seniors (73%) and households earning more than $80,000 annually (64%) to give their police high ratings for courteousness. Similarly 44% of millennials and 50% of households earning less than $30,000 a year give the police high marks for caring about community members, compared to about two-thirds of seniors (69%) and households making more than $80,000 a year (61%). Republicans (7 in 10) are also more likely than Democrats (5 in 10) to highly rate their police departments for being courteous and caring about the community. Race and ethnicity do not account for this result. White Republicans (74%) are 24 points more likely than white Democrats (50%) to give their local police high marks for being courteous. Perceptions of police professionalism and empathy are highly correlated with individuals’ favorability toward the police. Of those who give their local police high ratings for caring about community members, 85% have a favorable opinion of the police, compared to 24% of those who give local police low ratings for empathy. 37 Low confidence is defined as answering 1 or 2 on a scale of 1-5: “How good a job is the police department in your
community doing for each of the following, using a scale of 1 to 5 where 1 means you think it’s doing a poor job and 5 means you think it’s doing an excellent job."
38 High ratings are defined as answering 4 or 5 on a scale of 1-5: “How good a job is the police department in your community doing for each of the following, using a scale of 1 to 5 where 1 means you think it’s doing a poor job and 5 means you think it’s doing an excellent job."
Give%Police%%High%Marks%for%%
“Being%Courteous”%
57%$
0"1"2"3"4"5"6"
Category"1"
White"American"African"American"Hispanic"American"
59%$
37%$
47%$
Do$Police$Care$$About$You?$
% Who rate local police 4 or 5 out of 5 for caring about
community membersCATO"INSTITUTE/YOUGOV"2016"

FINDINGS FROM THE 2016 CATO INSTITUTE CRIMINAL JUSTICE SURVEY 30
Police Misconduct: Experience and Perception About one in five Americans say a police officer has used profanity with them (17%) and say they know someone physically mistreated or abused by the police (21%).39 Reported experience with police mistreatment varies by race, age, gender, and income. African Americans are about twice as likely as whites to report profanity or knowing someone physically mistreated by the police. About a quarter of African Americans (26%) and Hispanics (22%) report police using abusive language with them compared to 15% of whites. Nearly 4 in 10 African Americans (39%) and 27% of Hispanics report knowing
someone physically mistreated by police, compared to 18% of whites. Men, millennials, and those making less than 30,000 a year (about a quarter) are also about 10 points more likely than women, seniors, and households making over $60,000 a year to report personal or vicarious experiences with police mistreatment. An AP/NORC survey conducted in 2015 found that 57% of Americans thought that citizens’ failure to cooperate with police during a stop was a “major reason” for police use of force.40 Some readers may wonder if police swearing occurs when citizens are uncooperative and disrespectful. Perhaps those inclined to respect authority defer to police and are thus less likely to incur verbal abuse. To investigate, the author created a Respect for Authority Index (RAI), a composite scale based on averaging responses to three questions that measured people’s general respect for authority without explicitly asking about police. (See Appendix E for question
39 Data for this section come from the combined June 2016 and November 2015 national surveys (N=4000), which offer
greater precision and smaller margins of error for subgroups. 40 Question wording: “Here are some reasons that have been given for police violence against civilians. For each one,
please tell me whether you think it is a major reason, a minor reason or not a reason at all...Some civilians confront the police when they are stopped rather than cooperating”. AP-NORC Center for Public Affairs Research, Associated Press-NORC Law Enforcement and Violence Survey, Roper Center for Public Opinion Research, iPOLL, July 2015.
1" """5"in"Report'Police'Using'Profanity'with'Them'
1" """5"in"Know'Someone'Police'Have'Physically'Mistreated'
0"1"2"3"4"5"6"
Category"1"
White&American& African&American&
Hispanic&American&
15%$
26%$22%$
Police$Use$Profanity?$
Blacks$and$Hispanics$More$Likely$to$Report$Experiences$with$Police$Misconduct$
% Who report police have used abusive language, such as
profanity, with them
% Who know someone who has
been physically mistreated by police
Police$Physical$Abuse?$
18%$
39%$
27%$
CATO"INSTITUTE/YOUGOV"2016/2015""CRIMINAL"JUSTICE"SURVEYS"

FINDINGS FROM THE 2016 CATO INSTITUTE CRIMINAL JUSTICE SURVEY 31
wording.) A higher RAI score indicates a respondent is more apt to respect authority figures. Higher RAI scores are not direct measures of deference to the police, but rather indicate a higher likelihood of deference. Individuals with a higher RAI score are less likely to report police swearing at them; however, this finding primarily holds for white Americans. Among whites, those with low RAI scores are 3 times as likely as whites with high RAI scores to report experience with police profanity—27% vs. 9%.41 In contrast, African Americans and Hispanics with lower RAI scores are not that much more likely than those with higher RAI scores to say they’ve experience police profanity. This gives some indication that whites who are highly deferential toward the police may have better experiences, whereas blacks and Hispanics who are very deferential may not experience similarly improved treatment. Unsurprisingly, only 40% of individuals who have personally or vicariously experienced verbal or physical abuse from officers have a favorable view of the police compared to 70% among those without these negative experiences. In sum, abuse at the hands of an individual police officer—whether individually or vicariously experienced—may be internalized and help explain differences in favorability toward the police.
41 High Respect for Authority (RAI) scores are defined as those in the top quartile, while low RAI scores are defined as
those in the bottom quartile.
High%Respect%for%Authority%Predicts%Less%Experience%with%Police%Profanity,%but%Mostly%for%White%AmericansHas$a$police$officer$ever$used$abusive$language$or$profanity$in$an$interaction$with$you?
CATO%INSTITUTE/YOUGOV%2016,%2015%CRIMINAL%JUSTICE%SURVEYS
22%% 24%%
16%%
29%% 27%% 27%%
21%%27%%
19%%
10%% 9%%
Low%RAI% Low?Med%RAI%
Med?High%RAI%
High%RAI%
Respect%for%Authority%Index%(RAI)%
%%Who%Say%Police%Officer%Has%Used%Profanity%with%Them%
Hispanic% Black% White%

FINDINGS FROM THE 2016 CATO INSTITUTE CRIMINAL JUSTICE SURVEY 32
Perceived Bias A belief that police are biased should affect public opinion about the police. Individuals might see the system as biased in general but not toward them. Alternatively, they might believe the system is both biased in general and toward them. This report investigates both perceptions. Perceptions of Systemic Racial Bias Fully 58% of Americans say the criminal justice system fails to treat all individuals equally, including 45% who believe the system gives preference to white Americans and 13% who think the system treats black and Hispanic Americans better. Less than half (42%) of Americans believe the justice system is impartial. However, a majority (56%) give their local police departments high marks for “treating racial and ethnic groups equally.”42 Perceptions of bias vary widely by race, ethnicity, and partisanship. About half (49%) of white Americans believe the criminal justice system treats everyone about the same. Only 17% of black Americans and 27% of Hispanic Americans agree. Instead, a strong majority (72%) of African Americans, a slim majority of Hispanics (51%), and 40% of Caucasians believe the justice system gives preferences to whites. About 1 in 10 black and white Americans and 2 in 10 Hispanic Americans think the justice system offers greater leniency to minorities.
42 High ratings are defined as answering 4 or 5 on a scale of 1-5: “How good a job is the police department in your
community doing for each of the following, using a scale of 1 to 5 where 1 means you think it’s doing a poor job and 5 means you think it’s doing an excellent job."
Majority)Say)Criminal)Justice)System)Fails)to)Treat)Everyone)EquallyDo#you#think#the#criminal#justice#system#in#the#United#States#treats#white#Americans#more#fairly#than#black#and#Hispanic#Americans,#treats#black#and#Hispanic#Americans#more#fairly#than#white#Americans,#or#are#they#treated#about#the#same?###
CATO%INSTITUTE/YOUGOV%2016%CRIMINAL%JUSTICE%
Treats)Whites)Be<er)
45%)Treats)All)Equally)
42%)Treats)Blacks/Hispanics)Be<er)
13%)
African(Americans(and(Hispanics(More(Likely(to(Perceive(Systemic(Bias(in(Justice(System
Does(the(Criminal(Justice(System(Treat…
CATO%INSTITUTE/YOUGOV%2016%CRIMINAL%JUSTICE%SURVEY
40%(
72%(
51%(49%(
17%(27%(
11%( 11%(
22%(
Among(White(Americans(
Among(Black(Americans(
Among(Hispanic(Americans(
White%Americans%More%Fairly%All%Equally%Black%and%Hispanic%Americans%More%Fairly%

FINDINGS FROM THE 2016 CATO INSTITUTE CRIMINAL JUSTICE SURVEY 33
More than two-thirds (69%) of Democrats say the system favors whites over blacks and Hispanics while 21% say the system treats everyone equally. But, 64% of Republicans say the system treats everyone the same while 21% think the system is biased in favor of whites. Independents are divided: 45% think the system is fair, and 41% think the system gives preference to Caucasians. Here again, race matters more than partisanship. Although white Republicans (67%) are 41 points more likely than white Democrats (26%) to believe the system treats everyone equally, black Republicans (15%) are about as likely as black Democrats (13%) to think the system is impartial. Hispanics fall in between, with Hispanic Republicans 28 points more likely than Hispanic Democrats to believe the system is fair (45% vs. 17%).43 Ultimately, white Republicans are the only group that solidly believes the justice system treats all citizens fairly. These data indicate partisan ideology is correlated with perceptions of impartiality in the justice system, but primarily for whites and Hispanics. Hispanic and white Republicans are both more likely than Hispanic and white Democrats to believe the system is fair. However, black Republicans and black Democrats have similar views about the system’s fairness. Why? African Americans may have different personal or vicarious experiences with the police. Local Police Departments These confidence gaps extend to evaluations of local police departments. While 64% of white Americans highly rate their local police for impartiality, only 31% of African Americans and 42% of Hispanics agree.44 Republicans (78%) are also considerably more likely than Democrats (40%) and independents (57%) to highly rate their local police for impartiality. 43 Data about perceptions of systemic bias by race/ethnicity and partisanship come from the combined June 2016 and
November 2015 national surveys (N=4000), which offer greater precision and smaller margins of error for subgroups. (Unweighted: Black Republicans=45, Hispanic Republicans=165, White Republicans=1193, Black Democrats=630, Hispanic Democrats=409, White Democrats=634.)
44 High ratings are defined as answering 4 or 5 on a scale of 1-5: “How good a job is the police department in your community doing for each of the following, using a scale of 1 to 5 where 1 means you think it’s doing a poor job and 5 means you think it’s doing an excellent job."
CATO%INSTITUTE/YOUGOV%2015,%2016%CRIMINAL%JUSTICE%SURVEYS
Note:%Black%Republicans%N=45
Perception*of*Criminal*Justice*System*Bias*Varies*By*Race*and*IdeologyJust%your%impression,%do%you%think%the%criminal%justice%system%in%the%United%States%treats%white%Americans%more%fairly%than%black%and%Hispanic%Americans,%treats%black%and%Hispanic%Americans%more%fairly%than%white%Americans,%or%are%they%treated%about%the%same?
26%*
51%*
67%*
13%*16%* 15%*17%*
32%*
45%*
Democrats* Independents* Republicans*
%*Who*Say*Criminal*JusGce*System*Treats*All*Americans*Equally*
White% Black% Hispanic%

FINDINGS FROM THE 2016 CATO INSTITUTE CRIMINAL JUSTICE SURVEY 34
Urban residents (47%) are also less likely than suburban (62%) and rural residents (59%) to believe the police treat all groups the same. This pattern generally holds across racial groups: whites living in suburbs are about 19 points more likely than whites living in cities to highly rate their local police for impartiality (70% vs. 51%). Suburban Hispanics (54%) are 14 points more likely than Hispanics living in cities (40%) to agree. Blacks living in cities are slightly more likely (33%) than blacks living in suburbs (25%) to highly rate their local police for impartiality. Belief that one’s local department suffers from racial bias strongly correlates with favorability toward the police. Among those who highly rate their department for impartiality, 83% have a favorable view of the police.45 However, only 31% of those who are not confident of such impartiality have a favorable view. Personal Bias Although most Americans believe the justice system suffers from bias, 75% expect the police will treat them the same as anyone else for a traffic violation or minor offense. Ten percent (10%) of Americans think police would treat them worse than other people, and 15% expect they would be treated better. Majorities of black (60%), Hispanic (60%), and white (77%) Americans personally expect to receive equal treatment from police; however, blacks and Hispanics comprise a disproportionate share of those who expect worse treatment. African Americans (32%) are about five times more likely, and Hispanics (13%) twice as likely, as white Americans (6%) to expect worse treatment. 45 High ratings are defined as answering 4 or 5, and low ratings are defined as answering 1 or 2, on a scale of 1-5: “How
good a job is the police department in your community doing for each of the following, using a scale of 1 to 5 where 1 means you think it’s doing a poor job and 5 means you think it’s doing an excellent job."
0"1"2"3"4"5"6"
Category"1"
White"American"African"American"Hispanic"American"
64%$
31%$
42%$
% Who rate local police 4 or 5 out of 5
Do$Police$Treat$Racial/Ethnic$Groups$Equally?$$
CATO"INSTITUTE/YOUGOV"2016"
Most%Expect%to%Personally%Receive%Equal%Treatment%From%Police
Would%You%Expect%to%Be%Treated….
CATO%INSTITUTE/YOUGOV%2016%CRIMINAL%JUSTICE%SURVEY
If#you#had#some#trouble#with#the#police55a#traffic#violation,#or#being#accused#of#a#minor#offense55do#you#think#that#someone#like#you#would#be#treated#a#little#worse#than#other#people,#about#the#same#as#other#people,#or#a#little#better#than#other#people?###
6%%
32%%
13%%
77%%
60%%72%%
17%%8%%
15%%
Among%White%Americans%
Among%Black%Americans%
Among%Hispanic%Americans%
A%li9le%worse% About%the%same% A%li9le%be9er%

FINDINGS FROM THE 2016 CATO INSTITUTE CRIMINAL JUSTICE SURVEY 35
Notably, although only a third of African Americans and 42% of Hispanics highly rate their police departments for impartiality, majorities of both groups (60% and 72% respectively) believe they personally would be treated the same as other people.46 This suggests that expectations about personal treatment are not sufficient to explain perceptions of bias in the department overall. Predictably, those who expect to receive equal treatment are more favorable toward the police than those who expect worse treatment by a margin of 70% to 29%. Taking these results together, Americans are more likely to perceive racial bias in the criminal justice system overall than at the level of their local police department. They are least likely to expect to personally be treated inequitably. Ultimately, perceptions of systemic bias more strongly and negatively correlate with favorability toward the police than do personal expectations. It is important for people to believe the system is fair—even to other people—for the police to have legitimacy. Who Believes Charges of Racial Bias? What might lead a person to believe disparate treatment exists if one doesn’t personally experience it? Perhaps an above average concern for others experiencing harm may
46 Sixty-four percent of white Americans highly rate their local police department for impartiality, while 77% expect they
personally would be treated like anyone else.
Empathy(Associated(with(Perception(of(Racial(Bias(in(Criminal(Justice(System
Just%your%impression,%do%you%think%the%criminal%justice%system%in%the%United%States%treats%white%Americans%more%fairly%than%black%and%Hispanic%Americans,%treats%black%and%Hispanic%Americans%more%fairly%than%white%Americans,%or%are%they%treated%about%the%same?
CATO%INSTITUTE/YOUGOV%2016%CRIMINAL%JUSTICE%SURVEY
%(Who(Think(Criminal(Justice(System….(Among%White%Respondents)
58%( 55%(47%(
36%(27%(
34%(43%(
58%(
Low%SHI% Low:Med%%SHI%
Med:High%%SHI%
High%SHI%
SensiIvity(to(Harm(Index((SHI)(
Treats%All%People%The%Same%Is%Biased%Against%Blacks%and%Hispanics%
Summary: Perceptions of Impartiality% Who Perceive…
CATO INSTITUTE/YOUGOV 2016 CRIMINAL JUSTICE SURVEY
49%
17%27%
64%
31%
42%
77%
60%
72%
Among White Americans
Among Black Americans
Among Hispanic Americans
Justice System Treats All EquallyLocal Police Treats All EquallyExpect to Personally be Treated Equally

FINDINGS FROM THE 2016 CATO INSTITUTE CRIMINAL JUSTICE SURVEY 36
lead one to be more apt to believe charges of racial bias. To investigate, the author created a Sensitivity to Harm Index (SHI), based on the Care/Harm Foundation in Moral Foundations Theory.47 The SHI is a composite scale based on averaging responses to two questions that measure people’s sensitivity to others’ suffering, without explicitly asking about police or race. (See Appendix F for question wording.) For instance, respondents who strongly agree that “compassion for those who are suffering is the most crucial virtue” score higher on the SHI scale. SHI scores do not vary considerably across demographics, except that women tend to have higher scores than men. Individuals who score high on the Sensitivity to Harm Index (SHI) are far more likely to believe racial bias is a problem in the criminal justice system. For instance, 58% of whites with high SHI scores believe the justice system is biased against blacks and Hispanics compared to 27% among those with low scores.48 Whites who score low on SHI are far more likely to say the system treats everyone the same than those who score high (58% vs. 36%). These results suggest that people who tend to empathize may be more sensitive to charges of racial bias in police encounters. Racial Profiling
Nearly two-thirds (65%) say police commonly “stop motorists and pedestrians of certain racial or ethnic backgrounds because the officer believes that these groups are more likely than others to commit certain types of crimes.” Another 63% also oppose police using racial profiling for traffic and pedestrian stops. An overwhelming majority of African Americans (81%) believe the police regularly racially profile. A majority of Hispanics (70%) and Caucasians (62%) agree.
Democrats (80%) are considerably more likely than Republicans (53%) and independents (61%) to believe the police engage in racial profiling. Ideological Conservatives comprise the only political group with a majority (54%) who believe racial profiling does not commonly occur. In contrast, majorities of Liberals (87%), Communitarians (67%), and Libertarians (63%) think police routinely racially profile. (See Appendix A for definitions of ideological clusters.)
47 For further discussion of Moral Foundations Theory, see Jonathan Haidt, The Righteous Mind: Why Good People Are
Divided by Politics and Religion (New York: Pantheon Books, 2012). 48 High Sensitivity to Harm Index (SHI) scores are defined as those in the top quartile, while low SHI scores are defined as
those scoring in the bottom quartile.
Believe&Police&Commonly&Use&Racial&Profiling&
65%$

FINDINGS FROM THE 2016 CATO INSTITUTE CRIMINAL JUSTICE SURVEY 37
Who Perceives Bias?
What best predicts perceptions of bias in the criminal justice system, particularly for those who have not personally observed it? Given the wide racial confidence gap in police impartiality, separate statistical tests (logit regressions) were run among white, black, and Hispanic Americans respectively to determine what demographic variables, beliefs, and experiences best predict the belief that the justice system favors white Americans.49 (See footnote and Appendix G for more statistical information).
Across all three groups, the belief that police tactics are “too harsh” positively and significantly predicts the perception that the justice system is not impartial. Conversely, conservatism among all three groups significantly predicts the belief that the system treats everyone equally. Being liberal does not predict perceptions of bias among blacks and Hispanics, but does among whites.
Among whites, being liberal, perceiving a lack of police accountability, and scoring high on the Sensitivity to Harm Index (SHI) also statistically predict perceiving bias in the justice system. Among blacks, being male and older also significantly predict perceptions of bias. Hispanics are also more likely to perceive bias if they know someone who was stopped and searched by an officer, arrested, or jailed.
The Sensitivity to Harm Index predicts perceptions of bias among white Americans and weakly among Hispanics. Empathy may lead whites to believe that other people may experience different treatment in the justice system. It may be harder for those with less empathy to believe the charge of bias if they don’t see or experience it personally.
Significant Predictors of Perceiving Bias in Justice System:
Among Whites Among Blacks Among Hispanics Predicts Perceiving Justice System as Biased
• Perceive police use harsh tactics • Perceive police lack
accountability • Liberal • High score on Sensitivity
to Harm Index (SHI)
• Perceive police use harsh tactics • Male • Older
• Perceive police use harsh Tactics • Know someone searched,
arrested, jailed • High score on Sensitivity to
Harm Index (SHI)
Predicts Perceiving Justice System as Impartial
• Conservative • Conservative • Conservative
Note: All results shown are statistically significant p <.05; see Appendix G for full results.
49 This uses a method similar to that used in Ronald Weitzer and Steven A. Tuch, "Racially Biased Policing: Determinants of
Citizen Perceptions," Social Forces 83, no. 3 (2005): 1009-30; The regression model shows how much variance in the dependent variable is explained by each independent variable when all other independent variables are held constant. The predicted dependent variable is the perception that the police treat whites better than other racial groups, or not. The independent variables include: gender, age, race, income, education, age, community type, ideology, concern about crime, knowing someone who was either stopped and searched by an officer, arrested, or sent to jail, experience with police mistreatment, perception that police use harsh tactics, perception that police lack accountability, and the Sensitivity to Harm Index (SHI).

FINDINGS FROM THE 2016 CATO INSTITUTE CRIMINAL JUSTICE SURVEY 38
Talking About Police, Reform, and Race: What’s Persuasive?
Is talking about racial bias effective? Many advocates of police reform argue that systemic racial bias plagues the criminal justice system and thus reform is necessary.50 Does this argument encourage people to consider reform? To find out, the survey embedded a small experiment to investigate how telling people the criminal justice system treats African Americans and Latinos unfairly affects their belief that the justice system is overly harsh. (See Appendix H for further details.) Survey respondents were randomly assigned to 1 of 2 groups. The first group was shown this message: “Some people say the US criminal justice system is unfair to African Americans and Hispanics and so we should consider reforms of the system.” Then both groups were asked: “In general, do you think the criminal justice system in this country is too harsh, too lenient, or about right in its handling of crime?” The following chart shows how considering racial bias affects one’s belief that the system is overly harsh.
Note: Perceptions of harshness in the criminal justice system following exposure to treatment message. Data from the Cato Institute/YouGov November 2015 National Survey.
The racial bias message has a statistically significant effect, especially among liberals.51 On average, priming people to consider racial bias has the effect of convincing the average person who thinks the system is “about right” to instead believe the system is a “little too harsh.” Liberals are already more likely than conservatives to say the justice system is more harsh than lenient—regardless of treatment effect. However, priming people to consider racial bias has the largest effect among “very liberal” respondents. There is only a weak effect among “very conservative” respondents.52 Part of the reason is that conservatives tend not to believe systemic racial bias exists in the criminal justice system whereas liberals do believe this. Consequently, “framing” criminal justice reform in terms of racial bias is more effective for liberals and moderates than among conservatives. Thus, these data indicate that charges of racial bias in the criminal justice system may effectively encourage liberals and moderates to consider reform; however, such charges will persuade few conservatives. Other approaches may be necessary to persuade conservatives to favor criminal justice reform.
50 Michelle Alexander, The New Jim Crow: Mass Incarceration in the Age of Colorblindness (New York: The New Press,
2010). 51 (Mt= 3.66, SDt=1.44) (Mc=4.08, SDc=1.44) t(1998)=7.52, p <.001. Appendix H presents results from an OLS regression that
finds that the treatment variable and interaction term between ideology and treatment are statistically significant indicating that the treatment may be more persuasive to some ideological groups. Comparisons of means tests indicate the effect was stronger among liberals than among conservatives.
52 Among “very conservative” respondents, t(287)=-1.92, p=.06. See Appendix I for full results.
Too
Leni
ent
Abou
t Rig
htTo
o H
arsh
Is T
he C
rimin
al J
ustic
e Sy
stem
...
Very Liberal Liberal Moderate Conservative Very Conservative
Control Treatment: Primed w/ Racial Bias MessageTreatment: 'Some people say the US criminal justice system is unfair to African-Americans and Hispanicsand so we should consider reforms of the system'
Is Too Harsh/Too Lenient/About Right In Its Handling of Crime?Do You Think the Criminal Justice System in This Country

FINDINGS FROM THE 2016 CATO INSTITUTE CRIMINAL JUSTICE SURVEY 39
Evaluations of Police Tactics and Use of Force Most Americans think the police typically use appropriate force for each situation. Nearly two-thirds (63%) say the “tactics used by police officers” are “about right” while 30% say that they are too harsh and 7% say they aren’t harsh enough. Most Americans (58%) also believe that police “only use deadly force when it is necessary” while 42% think that police are “too quick to use deadly force.” Thus Americans are slightly more likely to believe police use lethal force unnecessarily than to believe routine police tactics are too harsh. Yet, Americans evaluate police tactics differently across race and ethnicity, income, age, and political ideology.
Six in 10 African Americans say police tactics are “too harsh” and 7 in 10 say police are too quick to resort to deadly force. In contrast, 7 in 10 whites think that police tactics are appropriate and that police only use necessary lethal force. Hispanics are in between: although a majority (54%) say police often unnecessarily resort to lethal force, a majority (58%) also say routine police tactics are reasonable. Millennials are about 20 points more likely than seniors to say police are too quick to use deadly force (52% vs. 29%) and to think police tactics are too harsh (38% vs. 16%). White millennials are largely driving this shift:
CATO%INSTITUTE/YOUGOV%2016%CRIMINAL%JUSTICE%SURVEY
In#general,#do#you#think#the#police#are#too#quick#to#use#deadly#force,#or#do#they#typically#only#use#deadly#force#when#necessary?##
Most%Americans%Say%Police%Use%Right%Amount%of%ForceIn#general,#are#the#tactics#used#by#police#officers#too#harsh,#not#harsh#enough,#or#about#right?##
About%Right%
63%%
Too%%Harsh%
30%%
Not%Harsh%Enough%
%%%%%7%%Only%When%
Necessary%
58%%
Too%Quick%
42%%
WhiteAmerican AfricanAmericanHispanicAmerican
26%
56%
33%
Police Tactics Police Use of Deadly Force
Whites Least Likely to Perceive Police Tactics as Too Harsh
% Who say police officers’ tactics are “too harsh” % Who say police
are “too quick” to use deadly force
35%
73%
54%

FINDINGS FROM THE 2016 CATO INSTITUTE CRIMINAL JUSTICE SURVEY 40
white millennials are 23 points more likely than white seniors to believe the police are too quick to use lethal force (46% vs. 24%). However, Hispanic and black millennials are about as likely as Hispanic and black seniors to believe police too often resort to excessive force. Households making less than $30,000 a year are also 11-14 points more likely than those making more than $60,000 a year to believe that police too easily resort to lethal force (52% vs. 38%) and that police use harsh tactics (36% vs. 25%). Whites are primarily driving this shift by age and income, as African Americans are no less likely to perceive harsh tactics with increasing age and income. Partisans also disagree. Nearly two-thirds (63%) of Democrats say police are too quick to use lethal force, while 80% of Republicans say police only use it when necessary. Democrats are also nearly four times as likely as Republicans to say police tactics are too harsh (40% vs. 11%). Again, race matters more than partisanship in perceptions of police use of force. White Republicans are 41 points more likely than white Democrats to say police only use necessary deadly force (85% vs. 44%).53 However, black Republicans (36%) are only 16 points more likely than black Democrats (20%) to agree. In a 53 Data for evaluations of police use of force by race/ethnicity and partisanship come from the combined June 2016
and November 2015 national surveys (N=4000), which offer greater precision and smaller margins of error for subgroups. (Unweighted: Black Republicans=45, Hispanic Republicans=165, White Republicans=1193, Black Democrats=630, Hispanic Democrats=409, White Democrats=634.)
CATO%INSTITUTE/YOUGOV%2016%CRIMINAL%JUSTICE%SURVEY%%%%%%%
Perception*of*Police*Using*Excessive*Force*Strongly*Associated*with*IdeologyIn#general,#do#you#think#the#police#are#too#quick#to#use#deadly#force,#or#do#they#typically#only#use#deadly#force#when#necessary?#
63%*
40%*
20%*
37%*
60%*
80%*
Democrat* Independent* Republican*
Too%quick% Only%when%necessary%
CATO%INSTITUTE/YOUGOV%2016,%2015%CRIMINAL%JUSTICE%SURVEYS
Note:%Black%Republicans%N=45
Perception*of*Police*Use*of*Force*Varies*by*Race*and*IdeologyIn#general,#do#you#think#the#police#are#too#quick#to#use#deadly#force,#or#do#they#typically#only#use#deadly#force#when#necessary?#
44%*
85%*
20%*36%*
42%*
58%*
Democrats* Independents* Republicans*
%*Say*Police*Only*Use*Deadly*Force*When*Necessary*
White% Black% Hispanic%

FINDINGS FROM THE 2016 CATO INSTITUTE CRIMINAL JUSTICE SURVEY 41
similar fashion, Hispanic Republicans are only 16 points more likely than Hispanic Democrats to believe police only use necessary force (58% vs. 42%). This suggests that political ideology may affect evaluations of police use of force, though primarily for whites. This is a familiar pattern found in earlier analyses. White Republicans are far more likely than white Democrats to have a more positive opinion of the police; however, black Republicans do not differ much from black Democrats in their evaluations of police action. Americans who score high on the Respect for Authority Index (RAI) are significantly more likely than those who score low to believe that police tactics are about right (79% vs. 39%) and to say that police only use necessary lethal force (69% vs. 41%).54 (See Appendix E for RAI details.) Evaluations of police use of force strongly correlate with favorability toward the police. Eight in 10 have a favorable opinion of the police among those who believe officers use appropriate force. Among those who believe police use excessive force, only four in 10 agree.
Perceptions of Police Accountability and Integrity Accountability Nearly half of Americans (46%) believe police are not “generally held accountable for misconduct” when it occurs, while 54% believe they are. It is remarkable that nearly half believe misconduct “generally” is not brought to account. This view is held by larger shares of black and Hispanic Americans, younger people, lower income individuals, and Democrats. About two-thirds (64%) of African Americans and 52% of Hispanics believe police “generally” are not held accountable for misconduct. In contrast, 57% of white Americans think police are held accountable. Confidence in police accountability increases with age and income. Majorities of seniors (70%) and households earning more than $80,000 annually (60%) believe police are held accountable. In contrast, majorities of millennials (59%)
54 The Respect for Authority Index (RAI) is a composite scale based on averaging responses to three questions measuring
people’s general respect for authority, without asking explicitly about police authority. See Appendix E for question wording and further details. High Respect for Authority (RAI) scores are defined as those in the top quartile, while low RAI scores are defined as those in the bottom quartile.
Say Police are Generally Not Held
Accountable for Misconduct
46%

FINDINGS FROM THE 2016 CATO INSTITUTE CRIMINAL JUSTICE SURVEY 42
and those earning less than $30,000 a year (54%) doubt police misconduct is punished. Partisanship also strongly correlates with confidence in police accountability. Three-fourths (76%) of Republicans and a slim majority of independents (51%) believe police are held to account. In contrast, nearly 6 in 10 Democrats believe officers are not held accountable. These partisan differences are not merely a function of the parties’ racial compositions. Sixty-five percent (65%) of white Democrats also worry officers are not held accountable, compared to only 26% of white Republicans. Perceptions of police accountability are highly correlated with favorability toward the police. Americans who believe the police are held accountable for misconduct (81%) are 35 points more favorable toward the police than those who doubt police are brought account (46%).
61%
36%
50%
Honest & Trustworthy?
Police Integrity and Accountability
46%
61% 61%
Think They’re Above the Law?
57%
33%
46%
Gaining Trust of Local Residents?
% who say “most police officers think they are above the
law”
% Who rate local police 4 or 5 out of 5 for being “honest and
trustworthy”
% Who rate local police 4 or 5 out of 5 for “gaining trust of
local residents”
43%
64%
51%
Unaccountable for Misconduct?
% who say police officers are not generally held
accountable for misconduct
CATOINSTITUTE/YOUGOV2016CRIMINALJUSTICESURVEY
123456
WhiteAmerican AfricanAmerican HispanicAmerican
CATO%INSTITUTE/YOUGOV%2016%CRIMINAL%JUSTICE%SURVEY
Republicans,Most,Likely,to,Believe,Police,Are,Held,AccountableBased&on&what&you’ve&read&or&heard,&do&you&think&police&officers&are&generally&held&accountable&for&misconduct,&or¬?&
41%,51%,
76%,
59%,49%,
24%,
Democrat, Independent, Republican,
Yes% No%

FINDINGS FROM THE 2016 CATO INSTITUTE CRIMINAL JUSTICE SURVEY 43
Integrity Americans are also unconvinced that most police officers have integrity. Nearly half (49%) believe that “most police officers think they are above the law,” while 51% disagree. Perceptions vary widely across race and ethnicity, income, and partisanship. Six in ten African Americans and Hispanics believe officers think they are above the law. In contrast, a majority (54%) of white Americans believe police officers don’t think they are above the law. Democrats (61%) are also far more concerned than Republicans (36%) that the police think they are above the law. A majority (64%) of Republicans and a slim majority of independents (52%) think most police have integrity. Majorities of millennials (63%) and of households making less than $30,000 (54%) a year believe that most officers think they are above the law, compared to 32% of seniors and 37% of households earning $80,000 or more annually. Instead, majorities of these $80K+ households (63%) and seniors (68%) believe police follow the law. Institutions need legitimacy to function. A belief in the rule of law fosters their legitimacy. It is thus problematic that nearly half of all Americans and majorities of blacks, Hispanics, young people, Democrats, and lower income individuals think “most” police officers don’t believe the laws apply to them.
Believe&"Most"&Police&Officers&Think&They&Are&Above&the&Law&
49%$

FINDINGS FROM THE 2016 CATO INSTITUTE CRIMINAL JUSTICE SURVEY 44
Respect for Authority Social psychologists have found that respect for authority is a universal instinctive trait in human psychology.55 As Haidt and Graham (2007) explain, “People often feel respect, awe, and admiration toward legitimate authorities, and many cultures have constructed virtues related to good leadership, which is often thought to involve magnanimity, fatherliness, and wisdom…[Societies may also] value virtues related to subordination: respect, duty, and obedience.”56 While respect for authority figures is a universal human trait, it is more salient for some.57 These individuals believe strong authority figures are necessary to maintain social order and prevent society from devolving into chaos. Might these individuals be predisposed to have more favorable opinions of the police irrespective of circumstances? To investigate, the author created the Respect for Authority Index (RAI), a composite scale based on averaging responses to three questions that measured people’s deference toward authority, without explicitly asking about police. (See Appendix E for question wording.) A higher RAI score indicates a respondent has a higher respect for authority. 55 Jonathan Haidt, Jesse Graham, and Craig Joseph, "Above and Below Left-Right: Ideological Narratives and Moral
Foundations," Psychological Inquiry 20 (2009): 110-119. Jonathan Haidt, The Righteous Mind: Why Good People Are Divided by Politics and Religion (New York: Pantheon Books, 2012).
56 Jonathan Haidt and Jesse Graham, "When Morality Opposes Justice: Conservatives Have Moral Intuitions that Liberals May Not Recognize," Social Justice Research 20 (2012): 98-116.
57 Jesse Graham, Jonathan Haidt, and Brian A. Nosek, "Liberals and Conservatives Rely on Different Sets of Moral Foundations," Journal of Personality and Social Psychology 98, No. 5 (2009): 1029-46.
Respect'for'Authority'Related'to'Support'for'the'PoliceDo#you#have#a#favorable#or#unfavorable#view#of#the#police#in#your#community?#
CATO%INSTITUTE/YOUGOV%2016%CRIMINAL%JUSTICE%SURVEY%%Note:%Respect%for%Authority%Index%divided%into%quartiles.
45%'57%'
68%'79%'
55%'44%'
32%'21%'
Low%RAI% LowMMed%RAI%
MedMHigh%%RAI%
High%RAI%
Respect'for'Authority'Index'(RAI)'
Favorable' Neither/Unfavorable'
Conservatives+Score+Highest+on+Respect+for+Authority+Index+(RAI)
CATO%INSTITUTE/YOUGOV%2016%CRIMINAL%JUSTICE%SURVEY%
44%+38%+
27%+
16%+
ConservaDve+Communitarian+ Libertarian+ Liberal+
%+Scored+in+Highest+QuarDle+on+RAI+

FINDINGS FROM THE 2016 CATO INSTITUTE CRIMINAL JUSTICE SURVEY 45
Notably, the RAI index does not detect significant differences by demographic groups, with two exceptions. Forty-two percent (42%) of Americans over 55 are in the highest RAI quartile compared to 17% among those under 35. Ideological Conservatives (44%) are also much more likely to score in the highest quartile than Liberals (16%) and Libertarians (27%).58 Communitarians, who favor a bigger government that also promotes traditional values, are similar to Conservatives with 38% scoring in the top quartile. Respect for authority is correlated with favorability toward the police. Seventy-nine percent (79%) of those who score in the highest RAI quartile have a favorable opinion of the police, compared to 45% among those scoring in the lowest quartile. These results go beyond partisanship. Democrats who score high on RAI (71%) are 20 points more likely than Democrats who score low (51%) to have a favorable opinion of the police.
People with a high respect for authority are also far more likely to support stop-and-frisk-like policies. Eighty-seven percent (87%) of this group favor allowing police officers to stop and search people who the officer thinks looks “suspicious or out of place,” compared to 43% of low RAI scorers. High scorers are also 40 points more likely than low scorers to believe police use appropriate force (79% vs. 39%).
58 See Appendix A for definitions of ideological groups.
People Who Score High on Respect for Authority Index (RAI) Most
Supportive of Police Practices and Most Concerned for Police
CATO INSTITUTE/YOUGOV 2016 CRIMINAL JUSTICE SURVEY
43% 39% 41% 42% 35% 43%
87% 79%
69% 77% 76%
86%
Favor Pedestrian
Stops
Believe Police Tactics Are Acceptable
Say Police Only Use Lethal
Force When Necessary
Say There's a "War on Police"
Say People Show "Too
Little Respect" for Police
Say Police Jobs are "Very
Dangerous"
Score Low on RAI Score High on RAI

FINDINGS FROM THE 2016 CATO INSTITUTE CRIMINAL JUSTICE SURVEY 46
Americans who score high on respect for authority are far more concerned the police are under attack. Among high RAI scorers, 77% believe there is a “War on Police,” 76% say that Americans show “too little respect” for police these days, and 86% say that police officers’ jobs are “very dangerous.” In contrast, low RAI scorers are about 40 points less likely to believe there is a war on police (42%), that people aren’t sufficiently deferential (35%), and that police have very dangerous jobs (43%). People who highly respect authority figures are far more likely to believe society will break down if strong institutions do not regulate conduct. Among this group, 63% believe that violent crime would “increase a lot” if the government legalized drugs, compared to only 26% among low RAI scorers. They may also fear that criticizing the police undermines their legitimacy and thereby fosters social instability.59 Thus, reformers may be more effective by making clear their commitment to support police work to promote safety, security, order, and justice.
59 For example, see Heather MacDonald, "The Danger of the “Black Lives Matter” Movement," Imprimis 45 (2016),
http://imprimis.hillsdale.edu/the-danger-of-the-black-lives-matter-movement/.

FINDINGS FROM THE 2016 CATO INSTITUTE CRIMINAL JUSTICE SURVEY 47
Statistical Determinants of Favorability Toward Police As the previous data make clear, on average, black Americans, younger people, lower income individuals, urban residents, and liberals tend to have a more negative view of police integrity, use of force, impartiality, competency, accountability, and tactics. Conversely white Americans, older people, middle and higher income individuals, suburbanites, and conservatives tend to have a more positive view of the police. Hispanics typically take a middle ground, but are concerned about current policing practices.
If we are to improve public perceptions of the police and strengthen legitimacy of the law, ideally we’d like to know what’s really driving favorable and unfavorable attitudes toward the police. This is a difficult task because these attitudes are confounded. For instance, a person who thinks the police aren’t held accountable also likely thinks the police are racially biased. How might we unpack this puzzle? Statistical analyses can offer some clues. A statistical test (logit regression) can simultaneously take into account people’s backgrounds, experiences, and perceptions of police to determine which best predict favorable or unfavorable attitudes toward the local department. (Appendix I details which survey questions were used to measure each variable, and provides further methodological information). Demographics What demographic variables best predict attitudes toward the police? The previous survey results demonstrate that differences in favorability toward the police are most dramatic across racial groups. A statistical test (logit regression) confirms that both being African American and Hispanic strongly and significantly predict unfavorable attitudes toward the police; the prediction is especially stronger among African Americans.60 However, once age and education are accounted for in the model, being Hispanic no longer significantly predicts negative attitudes (see Appendix J.1).61 Perhaps with time, as Hispanics age and move up the educational and income ladders, the relationship between the police and the Hispanic community may improve. However, controlling for other standard demographic factors does not affect the relationship between being African American and favorability toward the police. When considering demographic factors altogether, increases in age, education, and income significantly and positively predict favorable attitudes toward the police and being African American predict negative attitudes. Living in a city or suburb, one’s gender, and being Hispanic do not significantly predict attitudes toward the police. A later section will show that after controlling for perceptions of police use of force and impartiality, race is no longer a statistically significant predictor of attitudes toward the police.
60 A linear combination of estimates test indicates the effect of being African American on attitudes toward the police is
about 50% larger than being Hispanic, (p <.01). 61 We can be 95 percent confident this result does not happen by chance.

FINDINGS FROM THE 2016 CATO INSTITUTE CRIMINAL JUSTICE SURVEY 48
Ideology Next we consider how well political ideology predicts attitudes toward the police while accounting for demographics. Being conservative is consistently a large and significant predictor of positive attitudes toward the police. However, identifying as politically liberal does not typically predict attitudes. These results suggest that police action notwithstanding, conservatives will tend to be more sympathetic to police than the average American (see Appendix J.2). As conservative writer Rachel Lu put it, “Conservatives like cops. We’re law and order people, so we need to believe that the good guys are the ones with the badges.”62 Perceptions of Police and Crime Next, a series of statistical tests (bivariate logit regression) respectively examines the impact of concerns about crime, evaluations of police competency, empathy, use of force, integrity, impartiality, accountability, and personal contact on general favorability toward the police, while controlling for demographics and ideology.63 (See Appendix J.2 for full results.) The statistical tests find each of these variables significantly predicts favorability toward the police, except for concerns about crime (see Appendix J.2). Race no longer predicts favorability toward the police when we control for perceptions of police use of force, impartiality, or satisfaction with personal contact.64 This indicates that if one were to equalize perceptions of police use of force, racial bias, or satisfaction with personal encounters, African Americans would have average views toward the police (i.e. they would be more favorable). Thus reformers may more effectively rebuild African Americans’ confidence in law enforcement by improving public perceptions of police use of force, impartiality, and professionalism during encounters. What Matters Most? All of these perceptions and reported experiences with police are highly correlated with one another. This makes it difficult to determine which best explain favorability toward the police. Thus caution should be used when interpreting results after combining all significant variables together in one statistical model. Doing so indicates that satisfaction with personal police contact may best predict favorable attitudes toward the police, even when accounting for the effects of these other variables.65 Satisfaction with police encounters also appears to “soak up”
62 Rachel Lu, "You Don’t Have to Be Black Lives Matter to Support Police Accountability," The Federalist, July 7, 2016,
http://thefederalist.com/2016/07/07/you-dont-have-to-be-black-lives-matter-to-support-police-accountability/. 63 Bivariate regressions were run between each key independent variable of interest while also controlling for
demographics in each model. 64 Demographic and political variables were included in each of these models. 65 A series of nested models were conducted omitting one key independent variable at a time. Likelihood ratio tests and
comparing improvements in pseudo-R2s indicate that each variable significantly improved model fit, except for concern about crime and frequency of interaction with law enforcement. There are particularly large improvements in model fit when including the measure of satisfaction with personal police contact (LR χ2 = 508.81 p < .001). To be sure, it is difficult to determine which variables are the strongest predictors of public attitudes toward the police because perceptions are highly correlated and are sensitive to measurement. Furthermore, satisfaction with personal police contact may itself mediate other attitudes and perceptions. Thus, caution should be used when interpreting what factors may be most important in explaining attitudes toward the police. In this report, care is taken to construct independent variables measured with survey questions using a similar response structure (i.e. scale of 1-5) to reduce the likelihood that one measure received unmerited advantage in the regression equation.

FINDINGS FROM THE 2016 CATO INSTITUTE CRIMINAL JUSTICE SURVEY 49
the statistical effects of perceptions of police empathy, experience with police mistreatment, and respect for authority. It’s not just personal experience that matters: perceptions of racial bias in policing, police competency, empathy, and accountability continue to have distinct effects on favorability toward the police.
Change in Predicted Probability of Being Favorable Toward the Police
Note: Estimated via logit regression. All results shown are statistically significant p <.05; see Appendix J for full results. ^About a quarter of Americans did not report any interaction with police officers in the past 5 years. Perceptions of police integrity, use of force, and impartiality seem welded together in the public mind, although each are technically separate constructs. In theory, one may feel the police are too quick to use lethal force but not believe the police are racially biased. However the data show that people who think the police use excessive force also tend to believe police are racially biased and lack personal integrity. Events that shape evaluations of police impartiality or integrity may by extension color perceptions of police use of force, and vice versa. Reformers might need to improve these public perceptions in tandem.
21%
-18%
12% 12% 10%
-9% -7%
-4%
0%
-17%
14%
21%
11%
-10% -7%
-10%
5%
SatisfiedPersonalContact^
PerceivePoliceRacial Bias
Perceive: PoliceCompetency
Perceive: PoliceCaring
ConservativeIdeology
BelievePoliceAren't
Accountable
BelievePoliceAre
Untrusthworthy
HaveExperiencedMistreatment
RespectforAuthorityIndex
Chan
geinPredicted
Proba
bility(Minto
Max)
ofbeingFa
vorableTowardthePo
lice
StatisticalModelIncludesSatisfactionwithPersonalContactfromModelStatisticalModelExcludesSatisfactionwithPersonalContactfromModel
1" Integrity"Use"of"force"2"Impar4ality"3"

FINDINGS FROM THE 2016 CATO INSTITUTE CRIMINAL JUSTICE SURVEY 50
The Path Toward Reform This section assesses public support for a variety of reforms including additional police training, police body cameras, civil asset forfeiture reform, independent investigations of police misconduct, and drug de-criminalization. This section also explores public attitudes towards a variety of possible policing practices including police use of military weapons, drones, and racial profiling; police stops and searches of pedestrians, cars, and houses; and telephone surveillance. It also examines the extent to which Americans believe citizens need to show greater respect for the police during their encounters, irrespective of police reform. Although Americans disagree about how police do their jobs, majorities across racial and ethnic groups support a variety of proposed reforms intended to improve police-community relations, including:
Additional police training (68%) Police body cameras (89%) Mandatory notification of voluntary stops (73%) Independent investigations of police misconduct (79%) Drug de-criminalization (54%)
Similarly, majorities across racial and ethnic groups oppose a variety of possible police practices including:
Racial profiling (63%) Police militarization (54%) Civil asset forfeiture (84%) Warrantless searches (6 in 10) Police profanity (77%) Pretextual stops and searches (63%)
Cato%Ins)tute/YouGov&
68% Support
Training
89% Body
Cameras
84% Asset
Forfeiture
63% Racial
Profiling
66% Pedestrian
Stops
79% Independent
Investigations
54% Military
Weapons
59% Drones

FINDINGS FROM THE 2016 CATO INSTITUTE CRIMINAL JUSTICE SURVEY 51
Police Reform Fact Sheet
SUPPORT MORE TRAINING
68% say police officers need additional training on how to handle confrontations with citizens, including 6 in 10 white Americans, and 8 in 10 Hispanic and black Americans.
SUPPORT BODY CAMERAS 9 in 10 across race/ethnic groups support police body cameras. 51% would pay higher taxes to outfit a local department with cameras.
SUPPORT POLICE USING DRONES 6 in 10 support police regularly using drones to assist in their police work. But 54% also worry police drones may invade their privacy.
SUPPORT OUTSIDE AGENCY INVESTIGATE MISCONDUCT 8 in 10 support having outside law enforcement agencies investigate alleged police misconduct rather than leave the investigation to the local police department.
SUPPORT DRUG DE-CRIMINALIZTION
54% support “re-categorizing drug offenses from felonies to civil offenses” and treating them like “minor traffic violations rather than crimes.”
OPPOSE PRETEXTUAL STOPS & SEARCHES 63% oppose police officers using minor traffic stops to search cars for drugs without a court order.
OPPOSE CIVIL ASSET FORFEITURE 84% say police should only “be able to take a person’s money or property that is suspected to have been involved in a drug crime” if the person is convicted, not before. 76% want properly seized assets directed toward a state-level fund.
OPPOSE POLICE USING MILITARY WEAPONS 54% say police departments using military weapons and armored vehicles are “going too far” while 46% believe this equipment is “necessary for law enforcement purposes.”
OPPOSE RACIAL PROFILING 63% oppose police officers “stopping motorists or pedestrians of certain racial or ethnic groups because the officer believes that these groups are more likely than others to commit certain types of crimes.” But 65% think the practice is commonly used.
68%
89%
59%
79%
63%
84%
54%
63%
54%

FINDINGS FROM THE 2016 CATO INSTITUTE CRIMINAL JUSTICE SURVEY 52
Training Americans believe police officers could do more to de-escalate situations. More than two-thirds (68%) say that “most” police officers “need additional training on how to handle confrontations with citizens.” A third (32%) think officers already have sufficient training. A solid majority of Americans approve of de-escalation training even though most believe police officers use appropriate force and have integrity. This implies one does not need to perceive systemic problems in order to support additional training. Instead, from the perspective of the average person, additional police training sounds sensible and useful both for police officers and citizens. Majorities across racial groups agree, although African Americans (82%) and Latinos (78%) are more likely to believe the police could benefit from further training than Caucasians (62%). Half of Republicans (50%) believe “police officers have the appropriate training needed” already for dealing with confrontations. In contrast, an overwhelming share of Democrats (84%) as well as two-thirds (66%) of independents say police could benefit from further training. Republicans may not want to spend more money on training. Alternatively, it may be that Republicans perceive calls for additional training as a criticism of police authority. Advocates might be more effective in persuading Republicans if they explain how police training improves officer safety.
Support'Addi+onal'Training'for'Police'
Officers'
68%$

FINDINGS FROM THE 2016 CATO INSTITUTE CRIMINAL JUSTICE SURVEY 53
Police Technology Police departments throughout the country have begun adopting new technologies to assist in their police work. Americans support such efforts, so long as they are convinced the technologies are necessary and will not invade their privacy. Police Body Cameras Almost all Americans (89%) support requiring police officers to wear body cameras to record their on-duty interactions: 53% “strongly support” and 35% “somewhat support” this proposal. A paltry 11% oppose police wearing body cameras. Support extends across demographic and political groups. In an era of hyper-partisanship, police body cameras attract bipartisan approval. Many police officers have interpreted public support for body cameras as public censure of the police.66 However, Americans who have a favorable opinion of the police are as likely as those with unfavorable views to support police body cameras. Moreover, most Americans (74%) believe such a policy will equally protect both the police officers that wear them and the citizens who interact with the police. Few expect cameras to exclusively protect citizens (15%) or police officers (11%). Paying for Body Cameras Raising taxes to pay for police body cameras enjoys less support. A slim majority (51%) of Americans say they would pay higher taxes to outfit their local police department with body cameras, while 49% would not.
66 John Ortiz Smykla et al., "Police Body-Worn Cameras: Perceptions of Law Enforcement Leadership." American Journal
of Criminal Justice 41 (2016): 424-443.
CATO%INSTITUTE/YOUGOV%2016%CRIMINAL%JUSTICE%
Americans*Overwhelmingly*Support*Equipping*Police*with*Body*CamerasDo#you#favor#or#oppose#requiring#police#to#wear#body#cameras#to#record#video#of#their#interactions?
Note:%Somewhat%oppose,%9%;%strongly%oppose,%2%.
Majority*Willing*to*Raise*Personal*Tax*Bill*to*Pay*For*Police*Body*CamerasWould#you#be#willing#to#pay#higher#taxes#in#order#to#outfit#your#local#police#department#with#body#cameras?
Strongly*Support*
53%*Somewhat*Support*
*36%*
51%*Yes,%%
Willing%
%
No,*Not*Willing*
49%%

FINDINGS FROM THE 2016 CATO INSTITUTE CRIMINAL JUSTICE SURVEY 54
Politics, rather than demographics, primarily drive attitudes toward tax increases for body cameras. Fifty-nine percent (59%) of Democrats and 52% of independents say they’d pay higher taxes for body cameras, while a majority (62%) of Republicans say they would not. Different groups favor body cameras for different reasons. Those who trust the police may believe cameras protect officers from frivolous lawsuits or encourage citizens to behave better. Those distrustful of the police may believe cameras improve officer behavior and accountability. Access to Body Camera Footage Although most Americans agree police should wear body cameras, only a slim majority (52%) say police officers should be allowed to watch body camera footage before making their official statements about violent encounters, while 48% oppose. A majority (58%) of those with a favorable opinion of police in general say officers should be allowed to watch the video footage before making a statement. Of those with an unfavorable view, a larger majority (71%) say officers should be denied access to the footage before giving their official statement. There are stark racial and political divisions as well. A majority of whites (57%), independents (52%), and Republicans (63%) say police should be allowed early access to video footage. In contrast, majorities of blacks (69%), Hispanics (56%), and Democrats (58%) oppose early access. Confidence in the police matters here. Those with greater confidence trust officers not to use their early access to change their stories or mislead investigators. Those who lack confidence may think officers will use early access to absolve themselves from blame.
Democrats*and*Independents*Willing*to*Pay*Higher*Taxes*for*Police*Body*CamerasWould&you&be&willing&to&pay&higher&taxes&in&order&to&outfit&your&local&police&department&with&body&cameras,&or¬?&
CATO%INSTITUTE/YOUGOV%2016%CRIMINAL%JUSTICE%SURVEY
59%*52%*
38%*41%*48%*
62%*
Democrats* Independents*Republicans*
Yes,%Willing% No,%Not%Willing%
Americans*Divided*Over*Giving*Police*Officers*Early*Access*to*Body*Camera*FootageShould'police'officers'be'allowed'to'watch'the'body'camera'footage'after'a'violent'encounter'before'making'their'official'statement'about'the'event?
CATO%INSTITUTE/YOUGOV%2016%CRIMINAL%JUSTICE%SURVEY
No#43%#
No#57%$
Not*Allowed** 52%%
Allowed*48%%

FINDINGS FROM THE 2016 CATO INSTITUTE CRIMINAL JUSTICE SURVEY 55
Drones A majority (59%) of Americans support police departments “regularly” using unmanned aircraft or drones. However, support is “soft:” only 15% strongly support while 44% somewhat support using drones. About 4 in 10 (41%) oppose, including 25% who somewhat oppose and 17% who strongly oppose police drones. Nevertheless, a majority (54%) of Americans are concerned police drones may invade their privacy.
Since police drones are new, the nation has had little debate over their use. People may change their minds about them as they become more familiar with the technology and related policy issues. Demographic groups don’t vary much in their support for police drones, although seniors (71%) are more supportive than millennials (54%). Ideology does matter. Conservatives (63%) and Communitarians (67%) are considerably more likely than Liberals and Libertarians (50%) to support police regularly using drones. 67 Respect for authority figures and general trust in the police likely increase approval of police drones. Americans who score high on the Respect for Authority Index (RAI) are 25 points more likely than those who score low to oppose police using drone technology (71% vs. 46%).68 Similarly, those favorable toward the police are 31 points more likely than those with unfavorable views to support police drones (68% vs. 37%).
67 See Appendix A for an explanation of ideological clusters. 68 The Respect for Authority Index (RAI) is a composite scale based on averaging responses to three questions measuring
people’s general respect for authority, without asking explicitly about police authority. See Appendix E for question wording and further details. High Respect for Authority (RAI) scores are defined as those in the top quartile, while low RAI scores are defined as those in the bottom quartile.
Support'Police'Regularly'Using'
Drones'
59%$
Worry%Police%Drones%May%%Invade%Privacy%
54%$
Democrats*and*Independents*Worry*Police*Drones*May*Invade*Privacy;*Republicans*DisagreeAre$you$concerned$that$police$departments$regularly$using$unmanned$aircraft$called$‘drones’$to$assist$in$their$police$work$may$invade$your$privacy?$
CATO%INSTITUTE/YOUGOV%2016%CRIMINAL%JUSTICE%SURVEY
57%* 57%*
46%*43%* 43%*
54%*
Democrat* Independent* Republican*
Concerned% Not%Concerned%

FINDINGS FROM THE 2016 CATO INSTITUTE CRIMINAL JUSTICE SURVEY 56
Democrats (57%), independents (57%), and tea party supporters (53%) are more wary of the risks drones present to privacy than Republicans who don't identify with the tea party (46%). Non-tea party Republicans stand out, with a majority (54%) who say they are not concerned about police drones. Libertarians (65%) are most concerned about drones invading privacy, followed by Liberals (58%), and then Communitarians (47%) and Conservatives (46%). Young people are more concerned than older people about the risks of drones. Sixty-one percent (61%) of millennials are worried drones may invade people’s privacy while 39% are not. Only 40% of seniors are concerned about drones and 60% are not. Americans who score high on the Respect for Authority Index (RAI) are 19 points less likely than those who score low to be concerned about drones invading privacy (42% vs. 61%). Predictably, people who trust the police are less concerned about them abusing new technology. Drone critics will need to explain how even a trustworthy police department may overstep its bounds with drones. Militarization Although Americans are open to police using new technologies, they are wary of military equipment. A majority—54%—of Americans says police using military weapons and armored vehicles is “going too far” while 46% say these tools are “necessary for law enforcement purposes.” Majorities across racial groups oppose police militarization. Support for police militarization comes from older Americans, conservative Republicans, and those with high school educations or less. Americans over 65 years old support police using military weapons and armored vehicles by a margin of 61% to 39%. However, support for police militarization declines to 43% among those under 55, with 57% opposed. People with high school degrees or less are also more supportive (51%) of police militarization compared to those with college degrees (42%).
Americans*Oppose*Militarization*of*the*Police
CATO%INSTITUTE/YOUGOV%2016%CRIMINAL%JUSTICE%SURVEY
%%Who%Say%Police%Using%Military%Weapons%and%Armored%Vehicles%is…
No#43%#
No#57%$
Necessary* 54%%Going**too*far%46%%

FINDINGS FROM THE 2016 CATO INSTITUTE CRIMINAL JUSTICE SURVEY 57
Conservatives and Republicans stand out in supporting police militarization. A majority of Republicans (65%) support police using military weapons and armored vehicles, while majorities of Democrats (60%) and independents (60%) oppose. Among ideological groups, Conservatives (60%) and Communitarians (51%) say police militarization is necessary today, while strong majorities of Liberals (75%) and Libertarians (60%) say it goes too far.69
Civil Asset Forfeiture Civil asset forfeiture is a process by which police officers seize a person’s property (e.g. their car, home, or cash) if they suspect the individual or property is involved with criminal activity. The individual does not need to be charged with, or convicted of, any crime for police to seize assets.70 In most jurisdictions police departments may keep the property they seize or the proceeds from its sale. What do Americans think of civil asset forfeiture?
Fully 84% of Americans oppose the practice of police taking “a person’s money or property that is suspected to have been involved in a drug crime before the person is convicted of a crime.” Only 16% approve.
In instances when police departments seize people’s cars, houses, or cash, 76% of Americans say local departments should not be allowed to keep the assets. Instead, 48% say seized assets should go into the state general fund, while another 28% say assets should go into a dedicated state-level general law enforcement fund.
Although Americans prefer policing be done by local (not state or federal) authorities, only 24% think local police departments should keep the assets they
69 See Appendix A for an explanation of ideological clusters. 70 The legal rationale is that the property itself may be involved in a crime, and thus must be seized. However in practice,
since property can be seized without charging a person with a crime or convicting them, many innocent people have had their property taken from them without due process. See Marian R. Williams et al, “Policing for Profit: The Abuse of Civil Asset Forfeiture,” Institute for Justice, March 2010, http://www.ij.org/images/pdf_folder/other_pubs/ assetforfeituretoemail.pdf; “Civil Asset Forfeiture: 7 Things You Should Know,” Heritage Foundation Factsheet no. 141, March 26, 2014, http://thf_media.s3.amazonaws.com/2014/pdf/FS_141.pdf.
Liberals)and)Libertarians)Most)Concerned)about)Police)Using)Military)WeaponsDo#you#think#local#police#departments#using#military#weapons#and#armored#vehicles#are#necessary#for#law#enforcement#purposes,#or#are#they#going#too#far?#
CATO%INSTITUTE/YOUGOV%2016%CRIMINAL%JUSTICE%SURVEY
25%)
40%)51%)
60%)
75%)
60%)49%)
40%)
Liberal) Libertarian) Communitarian) ConservaCve)
Necessary% Going%too%far%
Oppose&Civil&Asset&Forfeiture&
84%$

FINDINGS FROM THE 2016 CATO INSTITUTE CRIMINAL JUSTICE SURVEY 58
seize. 71 Americans may believe transferring seized assets to a state-level fund will reduce local departments’ material incentive to seize people’s property.
Opposition to civil asset forfeiture cuts across demographics and partisanship. Majorities of whites (84%), blacks (86%), Hispanics (80%), Democrats (86%), independents (87%), and Republicans (76%) all oppose. In fact, virtually every major group surveyed solidly rejects the practice and prefers property only be seized after a person is convicted of a crime. Even those highly favorable toward the police staunchly oppose (78%) civil asset forfeiture.
Few understand the concept of civil asset forfeiture. Yet, once the concept is explained to them in concrete terms the public overwhelmingly rejects the practice. Thus, reformers’ primary challenge is informing the public that this practice occurs. Policy reforms may follow broader public knowledge of civil forfeiture.
Investigating Police Misconduct
In most jurisdictions, local police departments typically conduct internal investigations of police officer misconduct complaints.72 However, 79% of Americans would prefer that an “outside law enforcement agency take over the investigation” when an officer is suspected of criminal wrongdoing. Alternatively, 21% favor police departments conducting internal investigations of their own officers. The proposal to have outside investigations of misconduct enjoys broad public support. Overwhelming majorities across demographics and partisan groups, including majorities of blacks (82%), whites (81%), Hispanics (66%), Democrats (83%), independents (77%), and Republicans (76%), all favor outside investigations and prosecutions of officers accused of misconduct. 71 John Samples and Emily Ekins, “Public Attitudes toward Federalism: The Public’s Preference for Renewed Federalism,”
Cato Institute Policy Analysis no. 759, September 23, 2014, http://www.cato.org/publications/policy-analysis/public-attitudes-toward-federalism-publics-preference-renewed.
72 USCCR, "Revisiting Who Is Guarding the Guardians? A Report on Police Practices and Civil Rights in America," U.S. Commission on Civil Rights, November 2000, http://www.usccr.gov/pubs/guard/main.htm.
Three%Fourths+of+Americans+Oppose+Local+Police+Departments+Keeping+Seized+PropertyWhen%police%departments%take%a%person’s%money%or%property%involved%in%a%drug%crime,%who%should%be%allowed%to%keep%the%property?
CATO%INSTITUTE/YOUGOV%2016%CRIMINAL%JUSTICE%
Who+Should+Keep+Private+Property+Seized+By+Police?
State+Level++Law+Enforcement+
Fund+
Local+Police+Department+
24%+State++
General+Fund+
48%+
28%+
Favor&Outside,&Independent&
Inves2ga2ons&of&Alleged&Police&Misconduct&
79%$

FINDINGS FROM THE 2016 CATO INSTITUTE CRIMINAL JUSTICE SURVEY 59
Blackstone’s Ratio: Is it more important to protect innocence or punish guilt? When crimes occur, societies often cannot know for certain if a suspect is guilty or innocent. Consequently, societies must grapple with what type of “mistakes” they will tolerate more—sometimes punishing or scrutinizing innocent people or sometimes allowing guilty people go free. 73 The American system, grounded in the British Common Law, has long erred on the side of protecting innocence. Thus we presume an accused person’s innocence until they are proven guilty. As the preeminent English jurist William Blackstone wrote,“[B]etter that ten guilty persons escape, than that one innocent suffer.”74 This principle can also be found in religious texts and in the writings of the American Founders.75 Benjamin Franklin went further arguing “it is better a hundred guilty persons should escape than one innocent person should suffer.”76 Other notable historical figures have worried more about punishing the guilty. For instance German chancellor Otto von Bismarck is believed to have remarked: “it is better that ten innocent men suffer than one guilty man escape.”77 Che Guevara and 20th century communist movements in China, Vietnam, and Cambodia also employed similar reasoning. 78 The survey posed this dilemma to the American people, asking respondents which of the following scenarios they believe would be worse:
• Having 20,000 people in prison who are actually innocent; or, • Having 20,000 people not in prison who are actually guilty
73 This dilemma is analogous to Type 1 and Type 2 errors found in empirical research. In this case, Type 1 errors would
mean convicting innocent people of crimes they didn’t commit or subjecting them to added scrutiny despite their innocence, and Type 2 errors would mean failing to convict guilty people of crimes they did commit and allowing them to go free unpunished.
74 Alexander Volokh, "n Guilty Men," University of Pennsylvania Law Review 146 (1997): 173-216. 75 Alexander Volokh, "n Guilty Men," University of Pennsylvania Law Review 146 (1997): 173-216; John Adams made similar
arguments in defending British soldiers after the Boston Massacre, “[W]e are to look upon it as more beneficial, that many guilty persons should escape unpunished, than one innocent person should suffer,” (p. 176).
76 Benjamin Franklin, "Letter from Benjamin Franklin to Benjamin Vaughn (Mar. 14, 1785)," The Works of Benjamin Franklin 11, ed. John Bigelow (1904), quoted in Alexander Volokh, "n Guilty Men," University of Pennsylvania Law Review 146 (1997): 173-216.
77 John W. Wade, "Uniform Comparative Fault Act," The Forum 14, no. 3 (1979): 379-405. 78 Communists employed similar reasoning during the uprisings in Jiangxi, China in the 1930s: “Better to kill a hundred
innocent people than let one truly guilty person go free,” and during uprisings in Vietnam in the 1950s: “Better to kill ten innocent people than let a guilty person escape.” Phillip Short, Pol Pot: Anatomy of a Nightmare (New York: Henry Holt, 2006), pp. 299, 496. Similarly in Cambodia, Pol Pot’s Khmer Rouge adopted a similar policy: “better arrest an innocent person than leave a guilty one free.” Henri Locard, Pol Pot's Little Red Book: The Sayings of Angkar Chang Mai (Chiang Mai: Silkworm Books, 2005), pp. 208-209. Maria C. Werlau, "Che Guevara Forgotten Victims," The Free Society Project, 2011, http://cubaarchive.org/home/images/stories/che-guevara_interior-pages_en_final.pdf.
Most%Americans%Say%It's%Worse%to%Imprison%Innocent%People%Than%Let%Guilty%People%Go%FreeWhat%do%you%think%would%be%worse:%having%20,000%people%in%prison%who%are%actually%innocent,%or%20,000%people%not%in%prison%but%who%
CATO%INSTITUTE/YOUGOV%2016%CRIMINAL%JUSTICE%SURVEY
Which%is%Worse?
No#43%#
No#57%$
20,000%Guilty%Free%
40%%60%%20,000%Innocent%Imprisoned%

FINDINGS FROM THE 2016 CATO INSTITUTE CRIMINAL JUSTICE SURVEY 60
The survey found that a majority (60%) of Americans say it would be worse to have 20,000 innocent people in prison, while 40% say it would be worse to have 20,000 people who are actually guilty but not in prison. Majorities across demographic and political groups prioritize protecting the innocent. African Americans (60%), Caucasians (61%), and Hispanics (55%) agree imprisoning innocent people is worse than allowing guilty people go free. People with high school degrees (43%) and incomes less than $30,000 a year (47%) are more likely than those with post-graduate degrees (27%) and making more than $60,000 a year (34%) to prioritize imprisoning guilty people. Majorities of Democrats (64%), independents (60%), and Republicans (55%) all agree that it’s worse to imprison 20,000 innocent people than allow 20,000 guilty people go free. However, Democrats are slightly more likely than Republicans to agree. Strikingly, Donald Trump’s early core supporters (from November 2015) stand out with a majority (52%) who say it’s worse to not punish the guilty. They are distinct from other Republican voters. For instance, a majority (65%) of Ted Cruz’s early core supporters say it's worse to imprison the innocent.79 People who care more about punishing guilty people also tend to be less concerned about due process. Americans who say it’s worse to allow guilty people go free than to imprison innocent people are about 15-30 points more likely to support warrantless police stops and searches in a variety of situations.80 This dilemma (to prioritize protecting innocence or punishing guilt) informs contemporary debates over law enforcement and reform. Take for instance New York City’s Stop and Frisk program which failed to uncover wrongdoing in 88% of the over 2 million pedestrian stops since 2010. 81 Was this policy worth it? Observers with the same set of facts have reached dramatically different conclusions.82 Individuals have different value priorities that lead them to prioritize either protecting the innocent or punishing the guilty. Law enforcement reformers across the political spectrum might consider how their audience makes this trade-off.
79 Results are from the November 2015 Cato Institute/YouGov National Survey, conducted November 19 to 24, 2015. 80 For instance, roughly 7 in 10 Americans who prioritize protecting the innocent oppose police conducting routine
vehicle searches during minor traffic stops or home searches of suspected drug dealers without a court order, while those who prioritize punishing wrongdoing are about evenly divided.
81 NYCLU, "Stop-and-Frisk Data," New York Civil Liberties Union, 2016, http://www.nyclu.org/content/stop-and-frisk-data. 82 For instance, the NYCLU has presented the Stop and Frisk error rate as evidence that the program has over-stepped,
while a Breitbart writer touted the exact same set of facts as evidence of the program’s success. Milo Yiannopoulos, "Milo Talks Who Illegal Immigration Hurts, and Who Stop & Frisk Helps," YouTube, 2016, https://www.youtube.com/watch?v=-2qHRMW7284.
Early&Trump&Supporters&Prioritize&Punishing&Criminals&over&Protecting&Innocent&PeopleWhat%do%you%think%would%be%worse:%having%20,000%people%in%prison%who%are%actually%innocent,%or%20,000%people%not%in%prison%but%who%are%actually%guilty?
CATO%INSTITUTE/YOUGOV%NOV%19124%2015
75%&
65%&57%&
48%&
25%&
35%&43%&
52%&
SANDERS&(D)&SUPPORTERS&
CRUZ&(R)&SUPPORTERS&
CLINTON&(D)&SUPPORTERS&
TRUMP&(R)&SUPPORTERS&
What's&Worse?&20,000%innocent%people%in%prison%
20,000%guilty%people%who%are%free%

FINDINGS FROM THE 2016 CATO INSTITUTE CRIMINAL JUSTICE SURVEY 61
Police Stops, Searches, and Surveillance The police traffic stop is the most common form of contact citizens have with police officers. 83 If the officer has probable cause, she may also search a person’s vehicle. Officers may also stop and in some cases search pedestrians, if the officer reasonably suspects the person has committed or is about to commit a crime. 84 Police may also indirectly interact with individuals who are criminal suspects when conducting a search of their home or when monitoring their phone calls, with a court order. 85 This next section explores public attitudes about a variety of possible police practices regarding police stops and searches of pedestrians, cars, houses, and attitudes toward police surveillance. Racial Profiling
When it comes to traffic and pedestrian stops, Americans solidly oppose police using someone’s race as a factor in deciding whom to stop. Two-thirds (63%) of Americans oppose police officers “stopping motorists or
pedestrians of certain racial or ethnic groups because the officer believes that these groups are more likely than others to commit certain types of crimes.” This percentage includes 34% who strongly oppose and 29% who somewhat oppose this practice. The remaining third (37%) support racial profiling, including 10% who strongly support and 26% who somewhat support it. Despite strong public opposition, fully 65% of Americans also believe police regularly use racial profiling for traffic and pedestrian stops.
83 Christine Eith and Matthew R. Durose, Contacts between Police and the Public, 2008, edited by Bureau of Justice
Statistics (Washington: Department of Justice, 2011), https://www.bjs.gov/content/pub/pdf/cpp08.pdf. 84 Terry v. Ohio, No. 67 (United States Supreme Court, 1968). For the safety of the officer, officers may search the person
for weapons if the officer has reasonable suspicion that the person is armed and dangerous. 85 Police may not need a court order to search a house if police have probable cause to believe a crime is
contemporaneously being committed, such as if they hear gunshots in a house or hear someone screaming for help.
Oppose&Police&Use&of&Racial&Profiling&
63%$Majorities*Across*Racial*Groups*Oppose*Racial*Profiling
CATO%INSTITUTE/YOUGOV%2016%CRIMINAL%JUSTICE%SURVEY
Some%police%officers%stop%motorists%or%pedestrians%of%certain%racial%or%ethnic%groups%because%the%officers%believe%that%these%groups%are%more%likely%than%others%to%commit%certain%types%of%crimes.%Do%you%support%or%oppose%this%practice%by%the%police?%
31%*
56%*
32%*
31%*
21%*
29%*
28%*13%*
29%*
10%* 10%* 10%*
White* AfricanBAmerican* LaEno*
Strongly)Oppose) Somewhat)oppose)Somewhat)support) Strongly)support)
62%*77%*
62%*
38%* 38%*23%*

FINDINGS FROM THE 2016 CATO INSTITUTE CRIMINAL JUSTICE SURVEY 62
Oddly, among Americans who believe the U.S. justice system treats all groups equally, nearly half also concede that police commonly racially profile people. Thus some Americans may continue to insist the system treats everyone impartially even though they believe police engage in racial profiling. This indicates that some believe racial profiling is consistent with a fair justice system. African Americans are the most opposed to racial profiling (77%), although majorities of both Latinos (62%) and whites (62%) also oppose. Black Americans are also nearly twice as likely to “strongly oppose” (56%) profiling as Latinos and whites (31%). Latinos and Caucasians are not significantly different in their support for racial profiling. Partisans see profiling differently. A strong majority (73%) of Democrats and independents (64%) oppose it while roughly 3 in 10 support its use. In contrast, a slim majority (51%) of Republicans support racial profiling while nearly as many (49%) oppose. However, Black Republicans differ from their fellow partisans: 65% oppose racial profiling and 35% support it.86 Hispanic Republicans also oppose by a margin of 57% to 43%. In addition, although all age groups oppose racial profiling, millennials (70%) are more opposed than seniors (54%). 86 Data about support for racial profiling by race and partisanship come from the combined June 2016 and November
2015 national surveys (N=4000), which offer greater precision and smaller margins of error for subgroups. (Unweighted: Black Republicans=45.)
Democrats*and*Independents*Oppose*Racial*Profiling,*Republicans*Narrowly*SupportSome%police%officers%stop%motorists%or%pedestrians%of%certain%racial%or%ethnic%groups%because%the%officers%believe%that%these%groups%are%more%likely%than%others%to%commit%certain%types%of%crimes.%Do%you%support%or%oppose%this%practice%by%the%police?%
CATO%INSTITUTE/YOUGOV%2016%CRIMINAL%JUSTICE%SURVEY
27%*
36%*
51%*
73%*
64%*
49%*
Democrat* Independent* Republican*
Favor% Oppose%
Americans*Least*Concerned*about*********************"False*Positives"*in*Justice*System*Most*Supportive*of*Racial*ProfilingWhat%do%you%think%would%be%worse:%having%20,000%people%in%prison%who%are%actually%innocent,%or%20,000%people%not%in%prison%but%who%are%actually%guilty?
CATO%INSTITUTE/YOUGOV%2016%CRIMINAL%JUSTICE%SURVEY
46%*
56%*59%*
69%*
53%*
44%*41%*
32%*
Strongly))Support)
Somewhat)Support)
Somewhat)Oppose)
Strongly)Oppose)
Support'for'Racial'Profiling'
What's*Worse?*20,000%Innocent%in%Prison%(False%PosiEve)%20,000%Guilty%Allowed%Free%(False%NegaEve)%

FINDINGS FROM THE 2016 CATO INSTITUTE CRIMINAL JUSTICE SURVEY 63
People who strongly support racial profiling are more likely to prioritize punishing guilt than protecting innocence. Among those who strongly favor police racial profiling, a majority (53%) say it would be worse to allow 20,000 guilty people go free rather than wrongly imprison 20,000 innocent people. Conversely, among those who strongly oppose racial profiling, 69% say it would be worse to imprison 20,000 innocent people than to allow 20,000 guilty people go unpunished. (Also see Blackstone’s Ratio: Is it More Important to Protect Innocence or Punish Guilt.) Notification of Voluntary Interactions with Police The law often requires citizens to comply with police during official police “stops” or justified searches of a person or their property. But not all interactions constitute official police stops, and citizens may refuse some searches. However, most jurisdictions do not require officers to inform citizens of their right to decline. Do Americans think police officers should be required to tell citizens when they are not being officially detained and when searches are voluntary? Yes. A strong majority (73%) of Americans would support a law to require officers to tell citizens if they may refuse a stop or a requested search. This includes 37% who strongly favor and 36% who somewhat favor. A quarter of Americans oppose such a law, including 18% who somewhat oppose and 9% who strongly oppose. This proposal enjoys strong support across partisans (Democrats (76%), independents (74%), and Republicans (67%)) and demographic groups. However, African Americans (63%) are somewhat less likely than white and Hispanic Americans (74%) to support this requirement. Police Professionalism During Police Stops About a fifth of Americans report a police officer having used profanity with them. An overwhelming majority (77%) of Americans say police officers should be prohibited from using profanity or swearing at citizens while on the job. Twenty-three percent (23%) say police ought to be allowed to swear at citizens while on duty. Strong majorities across demographic and political groups similarly agree that on-duty police officers should be prohibited from swearing at citizens. (This includes nearly equal shares of Caucasians (77%), African Americans
Support'Law'Requiring'Police'to'No5fy'Ci5zen'if'
Stop'and/or'Search'is'Voluntary'
73%$
Say$On'Duty$Police$Should$Be$
Prohibited$from$Swearing$at$Ci;zens$
77%#

FINDINGS FROM THE 2016 CATO INSTITUTE CRIMINAL JUSTICE SURVEY 64
(82%), Hispanics (72%), Democrats (77%), independents (77%), and Republicans (75%).) Although Americans who score high on the Respect for Authority Index (RAI) tend to favor giving police more latitude generally, they are no more likely to support allowing police profanity. This is perhaps unsurprising since those with above average respect for authority also expect authority figures to demonstrate magnanimity and fatherliness.87
Do Americans Know The Law Regarding Police Stops? Most Americans know their rights and responsibilities regarding interactions with the police. Nearly 9 in 10 (86%) Americans know drivers must show police officers photo identification if requested, while 14% think this is not required. Slightly fewer, but still an overwhelming majority (80%) know that a person may refuse a police officer’s request to search the person’s car. A fifth (20%) believe individuals must comply with a requested vehicle search. Seventy percent (70%) also correctly believe citizens are not required to tell police officers where they are going if asked, while 30% believe people are required to answer.
Americans vary little across demographic and political groups in knowing their basic rights and responsibilities when interacting with police officers, with a few exceptions. Hispanics are about twice as likely as whites to believe they must tell a police officer where they are going if asked (47% vs. 25%) and to believe they can’t refuse a police officer’s request to search their car (34% vs. 16%). African Americans’ responses fall between those of whites and Hispanics. High school graduates (38%) are about twice as likely as college graduates (19%) to incorrectly believe that a citizen is required by law to tell a police officer where they are going when asked. Nevertheless majorities of Americans overall tend to know the law regarding police stops.
Based on what you know now, if during a police stop a police officer asks… YES NO …for your photo identification, are you legally required to provide it? 86% √ 14%
…to search your car, are you legally allowed to refuse? 80% √ 20%
…where you are going, are you legally required to answer? 30% 70% √
87 Jonathan Haidt and Jesse Graham, "When Morality Opposes Justice: Conservatives Have Moral Intuitions that Liberals
May Not Recognize," Social Justice Research 20 (2007): 98-116.

FINDINGS FROM THE 2016 CATO INSTITUTE CRIMINAL JUSTICE SURVEY 65
Who Should be Eligible for Police Stops? Police may pull over a driver of a vehicle to issue a traffic violation or investigate a possible crime if the officer has reasonable suspicion that a crime has or is about to occur. The officer may search a person’s car if the officer has probable cause.88 Police may also briefly stop pedestrians and search them for weapons given a reasonable suspicion the person may be involved in criminal activity. What do Americans believe should give police officers justifiable grounds to stop and search a person? We asked respondents about hypothetical police practices to discern their views about the proper standard to govern police searches. Two-thirds (66%) of Americans favor allowing police in their area to “stop and search a person for weapons or drugs” if that person “looks suspicious or out of place,” including 31% who strongly favor and 35% who somewhat favor. A third say “looking suspicious or out of place” is not sufficient reason to stop and search a person for weapons or drugs, including 21% who somewhat oppose and 13% who strongly oppose. African Americans (52%) are considerably less likely than Hispanics (76%) and Caucasians (66%) to support giving police officers such discretion. Age also matters: Baby Boomers (82%) are most supportive of the described practice and millennials (55%) least. Republicans (75%) are more likely than Democrats (60%) and independents (64%) to allow police to use their subjective judgment about who looks out of place when deciding whom to stop and search. “Very liberal” respondents
88 For instance, probable cause may be established if the officer smells marijuana or the officer sees contraband in plain
sight. Officers may also ask the person for their consent to search their car even without establishing reasonable suspicion.
When%Are%Police%Stops%and%Searches%Justified?Do#you#favor#or#oppose#allowing#the#police#in#your#area#to#stop#and#search#a#person#for#weapons#or#drugs#if#that#person#looks#suspicious#or#out#of#place?
CATO%INSTITUTE/YOUGOV%2016%CRIMINAL%JUSTICE%SURVEY%
Strongly%Favor%
31%%Somewhat%Oppose%
21%% Somewhat%Favor%
35%%
Strongly%Oppose%
13%%

FINDINGS FROM THE 2016 CATO INSTITUTE CRIMINAL JUSTICE SURVEY 66
stand out as the only political group with a majority (60%) opposed and 40% in favor. Those who score high (87%) on the Respect for Authority Index (RAI) are 44 points more likely than those who score low (43%) to allow police to stop and search people based on looking suspicious or out of place.89 Americans who have experienced a police search, or know someone who has, are somewhat more skeptical of giving police this kind of autonomy. Nevertheless, majorities with (59%) and without (70%) this experience support such discretion. The practice described rests, at best, on questionable constitutional grounds.90 It is somewhat similar to what critics accused the New York Police Department’s Stop and Frisk program of doing.91 Critics argued that the NYPD gave officers too much latitude in deciding whom to stop and had violated Americans’ Fourth Amendment protections from unreasonable searches and seizures.92 Public support for the described practice is not unconditional. Individuals might oppose it if they were to learn they disagreed with police about what exactly “looks suspicious or out of place.” Furthermore, since 63% oppose racial profiling, Americans would oppose police discretion informed by racial bias. Reformers might consider why many Americans support such ostensibly unconstitutional practices. Many may personally feel uncomfortable around individuals who appear out of place and believe their discomfort should govern police stops. Therefore, reformers might explain the value of Fourth Amendment protections against unreasonable search and seizure. Among audiences who revere the US Constitution, reformers might expound on why the founders implemented these protections.
89 The Respect for Authority Index (RAI) is a composite scale based on averaging responses to three questions measuring
people’s general respect for authority, without asking explicitly about police authority. See Appendix E for question wording and further details. High Respect for Authority (RAI) scores are defined as those in the top quartile, while low RAI scores are defined as those in the bottom quartile.
90 Police officers are only allowed to stop a person if they have reasonable suspicion that the person has committed or is about to commit a crime. The officer is allowed to search the person for weapons for the safety of the officer. See Terry v. Ohio, No. 67 (United States Supreme Court, 1968).
91 See Christopher Dunn and Sara LaPlante, “Stop and Frisk 2012 NYCLU Briefing,” New York Civil Liberties Union, May 2013, http://www.nyclu.org/files/publications/2012_Report_NYCLU_0.pdf.
92 Arthur Garrison points out that “furtive movements” and presence in a high crime area were the two most commonly given reasons in police reports for pedestrian stops between 2004-2009. Furthermore, 78% of all stops between 2004-2009 were initiated by a police officer, not the result of a service call. Since the reasons for these stops were fairly broad, critics argued police had too much latitude in deciding whom to stop and search and this gave way to racial profiling. Arthur H. Garrison, "NYPD Stop and Frisk, Perceptions of Criminals, Race and the Meaning of Terry v. Ohio: A Content Analysis of Floyd, et al. v. City of New York*," Rutgers Race & Law Review 15 (2014): 65-156; Christopher Dunn and Sara LaPlante, “Stop and Frisk 2012 NYCLU Briefing,” New York Civil Liberties Union, May 2013, http://www.nyclu.org/files/publications/2012_Report_NYCLU_0.pdf.

FINDINGS FROM THE 2016 CATO INSTITUTE CRIMINAL JUSTICE SURVEY 67
Do Americans think police searches and frisks help fight crime? Americans believe that police stops and searches of individuals usually reveal useful information to fight crime. More than three-fourths (77%) of Americans believe police searches reveal useful information at least “some of the time” (54%), including 20% who say “most of the time” and 3% who say “almost every time.” Only 23% think police searches rarely yield evidence of criminal wrongdoing, including 18% who say it’s “not that often,” and 5% who say “hardly ever.” Among those who think searches reveal useful evidence most of the time, 88% favor police conducting searches of people who the officer thinks looks suspicious, while 12% oppose. However among those who think searches reveal evidence “not that often,” only 41% support giving police more latitude and 57% are opposed. In short, Americans appear more likely to allow officers to use greater discretion when deciding whom to stop and search if they believe searches reliably uncover evidence of criminal wrongdoing. However, some research suggests police stops and searches may not be particularly efficacious.93 These data provide some indication that if this were generally known, the public might oppose giving police such latitude in conducting stops and searches. 93 There is evidence that pedestrian and vehicle searches may not be very efficacious. For instance, the NYCLU finds that
How$Often$Do$Police$Searches$Produce$Evidence?When%police%officers%stop%and%search%individuals,%about%how%often%do%you%think%the%search%reveals%evidence%of%criminal%wrong:doing?
CATO%INSTITUTE/YOUGOV%2016%CRIMINAL%JUSTICE%SURVEY
5%$
18%$
54%$
20%$
3%$
Hardly$Ever$
Not$that$OCen$
Some$of$the$Time$
Most$of$the$Time$
Almost$Every$Time$
Belief&That&Police&Searches&Are&Effective&May&Boost&Support&for&Pedestrian&Stops
CATO%INSTITUTE/YOUGOV%2016%CRIMINAL%JUSTICE%SURVEYNote:%Excludes%DK/Refused
19%&
41%&
68%&
88%&81%&
57%&
32%&
12%&
Hardly%%Ever%
Not%%That%OJen%
Some%%of%the%Time%
Most%%of%the%Time%
How&OGen&Americans&Think&Police&Searches&Uncover&Criminal&AcLvity&
Favor/Oppose%Police%Searching%People%Who%Look%"Out%of%Place"%or%"Suspicious"%
NetUFavor% NetUOppose%

FINDINGS FROM THE 2016 CATO INSTITUTE CRIMINAL JUSTICE SURVEY 68
Do Americans Think Warrants are Necessary for Police Searches of Cars and Houses? The Supreme Court has ruled that police officers are allowed to search cars without a warrant if they have probable cause to believe that a person has engaged in some form of criminal activity.94 However, officers are not permitted to routinely search people’s cars for weapons, drugs, or contraband “just in case.” Searching a suspected criminal’s house, in most circumstances, requires police to first obtain a warrant.95 Would Americans tolerate police searches without probable cause or a warrant? The answer is no: majorities think law enforcement ought to meet a higher standard before subjecting even suspected criminals to additional scrutiny.
the NYPD’s Stop and Frisk program uncovered wrongdoing in about 12% of the over 2 million pedestrian stops since 2010 and Eith and Durose find that about 8.4% of vehicle searches uncovered evidence of criminal activity in 2008. See Christopher Dunn and Sara LaPlante, “Stop and Frisk 2012 NYCLU Briefing,” New York Civil Liberties Union, May 2013, http://www.nyclu.org/files/publications/2012_Report_NYCLU_0.pdf. Christine Eith and Matthew R. Durose, Contacts between Police and the Public, 2008, edited by Bureau of Justice Statistics (Washington, D.C.: U.S. Department of Justice, 2011), https://www.bjs.gov/content/pub/pdf/cpp08.pdf.
94 Probable cause could include contraband in plain view, overt smell of an illegal substance, or if a drug dog identifies drugs.
95 Police may not need a court order to search a house if police have probable cause to believe a crime is contemporaneously being committed, such as if they hear gunshots in a house or hear someone screaming for help.
Americans*Oppose*Most*Police*Searches*of*Cars,*Houses,*and*Monitoring*of*Phone*Calls*without*Court*Order
Support*for*Warrantless*Police*Searches/Surveillance*in*the*Following*Cases:
CATO%INSTITUTE/YOUGOV%2016,%2015%CRIMINAL%JUSTICE%SURVEYS
37%* 34%*
49%*
24%*
63%* 66%*
51%*
76%*
Search*cars*during*minor*traffic*stops*
Search*houses*of*suspected*drug*
dealers*
Search*houses*of*those*who*might*be*sympatheMc*to*
terrorists*
Monitor*phone*calls*of*anyone*suspected*of*
criminal*acMvity*
Without'Court'Order'
Favor% Oppose%

FINDINGS FROM THE 2016 CATO INSTITUTE CRIMINAL JUSTICE SURVEY 69
Vehicle Searches Americans acutely concerned about drug prohibition might support police using minor traffic stops to routinely check cars for illegal drugs and other contraband. Although this practice is unconstitutional, some might reason: if one isn’t breaking the law, one should have nothing to worry about.96 Do Americans think police should use minor traffic stops to routinely check cars for illegal activity—just in case? No. A solid majority of Americans—63%—say police officers should not be allowed to routinely search cars for drugs during minor traffic stops, unless they get a court order. A third say police should take the opportunity to check for drugs even without a court order. Majorities across demographic and political groups oppose police using minor traffic stops to routinely check cars for drugs. However, African Americans (70%) are more opposed than Hispanics (56%) and Caucasians (64%). Similarly, majorities of partisans oppose such a policy, although Democrats (68%) and non-partisan independents (71%) are more opposed than Republicans (54%). Liberals (18%) and Libertarians (26%) are the least supportive of such a practice, compared to Conservatives (37%) and Communitarians (61%). Communitarians stand out with a strong majority (61%) favoring routine vehicle searches. Americans who believe the “war on drugs” has been worth the costs to taxpayers and those who strongly oppose legalizing marijuana stand out with majorities (56% and 56% respectively) who say police should use minor traffic stops to routinely search cars for drugs. These data indicate being strongly committed to the Drug War may foster support for unconstitutional practices. Home Searches What about searching a person’s home? If a police officer suspects a person deals drugs, do Americans think police ought to obtain a court order before entering the house to search for drugs or other illegal activity?
96 This is the “nothing to hide” argument. For instance, consider Sen. Trent Lott’s reaction to the debate over the
collection of Americans’ phone records in 2006: "What are people worried about? What is the problem? Are you doing something you're not supposed to?" "BellSouth Denies Giving Records to NSA," CNN.com, May 15, 2006, http://www.cnn.com/2006/POLITICS/05/15/bellsouth.nsa/. For further discussion see Daniel J. Solove, "'I've Got Nothing to Hide' and Other Misunderstandings of Privacy," San Diego Law Review 44 (2007): 745-772.
Say$Police$Should$Not$Use$Minor$Traffic$Stops$to$Search$Cars$for$Drugs$Without$Court$Order$
63%$
Say$Police$Should$Not$Search$Homes$of$Suspected$Drug$Dealers$Without$Court$Order$
66%#

FINDINGS FROM THE 2016 CATO INSTITUTE CRIMINAL JUSTICE SURVEY 70
Yes. A strong majority 66% of Americans oppose police searching the homes of individuals suspected of dealing drugs without first obtaining a court order. A third say police should not have to get a court order first. This indicates that for most Americans, suspected law-breaking does not justify warrantless searches. Strong majorities across demographic and political groups agree that police ought to get a warrant before searching a suspected drug dealer’s house, including whites (69%), blacks (68%), Hispanics (54%), Democrats (63%), independents (72%), and Republicans (62%). However, women are about 15 points more likely than men to approve of such warrantless home searches of suspected drug dealers (41% vs. 26%). Similarly, high school graduates (40%) are about twice as likely as post-graduates (19%) to approve. Libertarians (81%) and Liberals (79%) are the most opposed to warrantless home searches of suspected drug dealers compared to 70% of Conservatives and 54% of Communitarians. In fact, Communitarians are more than twice as likely as Libertarians and Liberals to support such warrantless searches (46% vs. 20%).97 Americans who strongly oppose legalizing marijuana (47%) are about 20 points more likely than those who strongly support doing so (25%) to favor warrantless searches of suspected drug dealers’ homes. Some Americans seem willing to sacrifice rule of law and due process to fight the Drug War. Reformers may wish to keep in mind that those committed to drug prohibition may not respond to constitutional arguments criticizing warrantless searches. Americans may be willing to make exceptions regarding search warrants depending on their emotional reaction to the suspect. In a survey conducted several days after the November 2015 Paris attacks, 51% said police ought to obtain a court order before searching the home of a person who might be sympathetic to terrorists.98 This share is 15 points lower than the 66% in that same survey who said the police should first obtain a court order before searching the home of suspected drug dealers.
97 See Appendix A for an explanation of ideological clusters. 98 Results from the November 2015 Cato Institute/YouGov National Survey, conducted November 19 to 24, 2015.
Opposition(to(Warrantless(Home(Searches(Wanes(For(Suspects(Who(Might(be(Sympathetic(to(TerroristsWithout'a'court'order,'the'police'should'be'allowed'to'search'the'houses'of...
CATO%INSTITUTE/YOUGOV%NOV%19124%2015
Warrantless(Police(Searches(of(Houses
34%(
49%(
66%(
51%(
Suspected%%Drug%
Dealers%
People%Who%Might%be%
SympatheKc%to%Terrorists%
Favor% Oppose%
C32(
C2(

FINDINGS FROM THE 2016 CATO INSTITUTE CRIMINAL JUSTICE SURVEY 71
A majority of men (58%), non-evangelicals (54%), college graduates (60%), white Americans (54%) and black Americans (52%) oppose warrantless searches of people’s homes who police believe might be sympathetic to terrorists. However, a majority of women (56%), evangelicals (56%), high-school graduates (64%), and Hispanics (63%) favor such warrantless searches. Differences in educational attainment appear to largely underlie the ethnicity gap on this question. Although partisans largely agree, there are striking ideological differences. Libertarians are most opposed (72%) to warrantless searches of people who police suspect might be sympathetic to terrorists. This share is 15 points higher than Liberals (57%) who are opposed. In contrast, a slim majority (52%) of Conservatives favor such warrantless searches while 48% oppose. Communitarians stand out as most comfortable with such warrantless searches with 69% in support and 31% opposed.99 Although the United States demands equality before the law, reformers should keep in mind that the public may tolerate disparate treatment depending on their emotional reaction to the suspect. Interestingly, by June 2016, opposition rebounded to 62% saying the police ought to obtain a court order before searching the home of a person who might be sympathetic to terrorists. Do Americans Think Court Orders are Necessary for Police Monitoring of Phone Calls? By a margin of 76% to 24%, Americans highly oppose police monitoring phone calls of individuals suspected of criminal activity without a court order.
99 See Appendix A for an explanation of ideological clusters.
Libertarians*and*Liberals*Most*Opposed*to*Warrantless*Searches*of*Those*Suspected*of*Being*Sympathetic*to*TerroristsShould'the'police'be'allowed'to'search'the'houses'of'people'who'might'be'sympathetic'to'terrorists'without'a'court'order?
CATO%INSTITUTE/YOUGOV%NOV%19124%2015
28%*
52%*
43%*
69%*72%*
48%*
57%*
31%*
Libertarian* ConservaHve* Liberal* Communitarian*
Favor% Oppose%
Say$Police$Should$Not$Monitor$Phone$Calls$of$Criminal$Suspects$Without$
Court$Order$
76%$

FINDINGS FROM THE 2016 CATO INSTITUTE CRIMINAL JUSTICE SURVEY 72
Majorities across racial groups oppose warrantless phone monitoring of suspected criminals. However, there are some differences. Although a majority (60%) of Hispanics oppose such a practice, they are about 20 points less likely than blacks and whites (8 in 10) to oppose warrantless wiretapping. Americans with high school degrees or less (31%) and incomes below $30,000 (32%) are about twice as likely as those with post-graduate degrees (15%) and household incomes above $80,000 (12%) to support this kind of practice. Summary: Tolerance for Warrantless Searches Americans generally oppose police searches of cars and houses and monitoring phone calls without a court order. Several patterns emerge across demographics and ideology. Majorities oppose such unconstitutional searches, but women, evangelicals, high school graduates, and Hispanics are relatively more supportive. Men, non-evangelicals, college graduates, and non-Hispanics are less supportive of warrantless searches and phone monitoring. Perhaps surprisingly, Democrats and Republicans tend to oppose warrantless police searches and phone monitoring by similar margins. (They differ in support for police checking cars for drugs during traffic stops, however.) Instead, striking differences emerge by ideology. Libertarians and Liberals are most skeptical of warrantless searches and surveillance, followed by Conservatives, and then Communitarians. Libertarians and Communitarians are polar opposites with the former roughly 20-35 points less supportive.
Communitarians Most Sympathetic, Libertarians Most Opposed to Warrantless Police Searches
% Favor Warrantless Police Searches
CATO INSTITUTE/YOUGOV 2016, 2015 CRIMINAL JUSTICE SURVEYS
26%
37%
18%
61%
19%
30%
21%
46%
28%
52%
43%
69%
16%21%
15%
33%
Libertarian Conservative Liberal Communitarian
Search cars for drugs during minor traffic stopsSearch houses of suspected drug dealersSearch houses of those who might be sympathetic to terroristsMonitor phone calls of anyone suspected of criminal activity

FINDINGS FROM THE 2016 CATO INSTITUTE CRIMINAL JUSTICE SURVEY 73
War on Drugs According to the Bureau of Justice Statistics, police make about 1.6 million drug arrests each year.100 Some say legalizing or decriminalizing drugs like marijuana could improve police-citizen relations by reducing the frequency and intensity of interactions.101 Such changes could also free up additional resources for police to control property and violent crime. What do Americans think? Fifty-seven percent (57%) of Americans say they would favor legalizing marijuana and having the government regulate it
like alcohol. Only 15% favor a similar policy for drugs like cocaine. Although few Americans support across the board drug legalization, they are open to decriminalizing drugs. A majority—54%—support “re-categorizing drug offenses from felonies to civil offenses” and instead treating them “like minor traffic violations rather than crimes.” Support for legalizing marijuana enjoys similar support across most demographic groups. However, Americans over 65 are the only age cohort opposed to legalization, by a margin of 64% to 36%. Results are reversed among millennials, with 65% in favor and 35% opposed. Conservatives stand out as highly opposed to marijuana legalization by a margin of 64% to 36%. Conversely, solid majorities of Liberals (79%) Libertarians (69%), and a slim majority of Communitarians (53%), favor legalizing marijuana and regulating it like alcohol.102 100 H. Snyder and J. Mulako-Wangota, Arrest Data Analysis Tool, Bureau of Justice Statistics, July 7, 2016, www.bjs.gov. 101 COPS Office, "The President's Task Force on 21st Century Policing: Summary of Public Comments Submitted by Email,"
The Office of Community Oriented Policing Services, 2015, https://cops.usdoj.gov/pdf/taskforce/Implementation_Guide.pdf.
102 See Appendix A for an explanation of ideological clusters.
Support'Legalizing'Marijuana,'
Regula4ng'Like'Alcohol'
57%$
Support'Decriminalizing'
Drugs'
54%$
Conservatives+Stand+Out+in+Opposition+to+Marijuana+LegalizationWould&you&favor&or&oppose&legalizing&marijuana&and&the&government®ulating&it&like&alcohol?&
CATO%INSTITUTE/YOUGOV%2016%CRIMINAL%JUSTICE%SURVEY
69%+
36%+
79%+
53%+
31%+
64%+
21%+
47%+
Libertarian% ConservaAve% Liberal% Communitarian%
Favor& Oppose&

FINDINGS FROM THE 2016 CATO INSTITUTE CRIMINAL JUSTICE SURVEY 74
Similarly, most groups favor re-categorizing drug offenses from felonies to civil offenses. There are a few exceptions: a slim majority of women (52%) oppose decriminalizing drugs, while 59% of men favor. Similarly 55% of seniors oppose, but 56% of Americans under 65 favor decriminalization. Conservatives strongly oppose (64%) decriminalizing drug offenses. In contrast, Liberals (74%) and Libertarians (67%) solidly support it, while Communitarians are evenly divided (50%).
Who Needs to Change: Citizens, Cops, or Both? This report has examined public support for reforms police departments could implement in efforts to improve relations with their communities. However, some Americans believe that their fellow citizens, not the police, are primarily responsible for strained relations. They believe too few people show adequate respect for the law and the law’s enforcers and thus citizens should improve their behavior first. For instance, one online commenter wrote:
“I wonder how many deaths or injuries by law enforcement would have been prevented if the person would have shown respect to the officer, obeyed the directions, and didn’t try to resist arrest or flee. We need to better support our officers and not try to defend the criminals who get by with all of the above.”
Two-thirds (65%) of respondents say police officers have “very dangerous” jobs, 30% say police jobs are “somewhat dangerous” and only 5% say their jobs are not very dangerous. 103 In addition, most Americans (58%) believe their fellow citizens show “too little respect” for the police these days. Only a third think
103 Some might find this surprising given that fatal occupational injuries are lower for police officers than a multitude of
other professions, such as taxi drivers, truck drivers, and roofers. However, police are more likely to die from felonious acts than many other professions (although taxi drivers have a higher felonious fatality rate). See Bureau of Labor Statistics, "Fatal Occupational Injuries, Total Hours Worked, and Rates of Fatal Occupational Injuries by Selected Worker Characteristics, Occupations, and Industries, Civilian Workers, 2013," Census of Fatal Occupational Injuries (Washington: Department of Labor, 2013), http://www.bls.gov/iif/oshwc/cfoi/cfoi_rates_2013hb.pdf; Bureau of Labor Statistics, “Fatal Occupational Injuries by Occupation and Selected Event or Exposure, 2014,” Census of Fatal Occupational Injuries (Washington: Department of Labor, 2014), http://www.bls.gov/news.release/cfoi.t03.htm.
Say Police Officers Have a “Very
Dangerous” Job
65%Say There is a
“War on Police”
61%Say Americans
Show “Too Little Respect” for
Police Officers These Days”
58%

FINDINGS FROM THE 2016 CATO INSTITUTE CRIMINAL JUSTICE SURVEY 75
people show sufficient respect. Many Americans also don’t perceive systemic problems in policing. Americans give high marks to local law enforcement for enforcing the law (59%), using the appropriate amount of force (58%), being courteous (57%), being honest (57%), protecting people from violent crime (56%), treating all racial groups equally (56%), responding quickly to a call for help (56%), and caring about their community (55%). Furthermore, 54% believe officers are generally held accountable for misconduct when it occurs. (See Appendix B for a full breakdown.) If people a) believe police are in a dangerous line of work, b) believe citizens disrespect the police, and c) do not perceive systemic problems in law enforcement—it becomes less surprising that 61% of Americans think there is a “war on police” today. What does the public think a “war on police” means? The term “war” can mean “a state of open, armed, often prolonged conflict carried on between nations, states, or parties.” Police and citizens do have violent interactions; some have recently become public controversies. However, police fatalities are lower today than in the past.104 “War” also means “a condition of active antagonism or contention.”105 There is reason to believe that most Americans think the “war on police” is largely the latter given that those who argue of its existence say it’s a rhetorical war. For instance, Heather MacDonald argues in her recent book The War on Cops that the war is due to “virulent anti-cop rhetoric” [emphasis added].106 Although people across racial and partisan groups believe the police have dangerous jobs, they disagree about whether police are disrespected or are under attack. White Americans are 20-30 points more likely than African Americans to say people aren’t showing enough respect for police (64% vs. 34%) and to believe there is a war on police (64% vs. 46%). Hispanics fall in between with a plurality (45%) who say police don’t get adequate respect and a slim majority (52%) who believe there is a war on police. In contrast, majorities of African Americans say there is no war on police (54%) and that officers receive adequate deference (54%).
104 The American Enterprise Institute Ideas Blog; “Is There Really a ‘War on Cops’? The Data Show That 2015 Will Likely Be
One of the Safest Years in History for Police,” blog entry by Mark J. Perry, September 9, 2015, https://www.aei.org/publication/is-there-really-a-war-on-cops-the-data-show-that-2015-will-likely-be-one-of-the-safest-years-in-history-for-police/.
105 American Heritage Dictionary, 2016, s.v. “war,” https://ahdictionary.com/word/search.html?q=war&submit.x=0&submit.y=0.
106 Heather MacDonald, The War on Cops: How the New Attack on Law and Order Makes Everyone Less Safe (New York: Encounter Books, 2016), p. 3.

FINDINGS FROM THE 2016 CATO INSTITUTE CRIMINAL JUSTICE SURVEY 76
Partisanship also matters. Republicans are about 30-40 points more likely than Democrats to believe that police aren’t receiving adequate deference (77% vs. 45%) and to believe the police are under attack (82% vs. 40%). Independents lean with Republicans, with 56% who believe people don’t show enough respect for officers and 56% who believe there is a war on police.
Again, race matters more than partisanship. White Republicans are the most likely group to believe the police aren’t receiving enough respect; they are nearly 30 points more likely than white Democrats to feel this way (81% vs. 51%). Conversely, black Republicans are no more likely than black Democrats to agree (35% vs. 39%).108 108 Data for perceptions of systemic bias by race/ethnicity and partisanship come from the combined June 2016 and
November 2015 national surveys (N=4000), which offer greater precision and smaller margins of error for subgroups. (Unweighted: Black Republicans=44, Hispanic Republicans=165, White Republicans=1193, Black Democrats=630, Hispanic Democrats=409, White Democrats=634.)
0123456
Category1
WhiteAmerican AfricanAmerican HispanicAmerican
64%
46%52%
% Who Say There is a
“War on Police”in America
66% 65%58%
% Who Say Police Have
“Very Dangerous” Jobs
64%
34%
45%
% Who Say People Show “Too Little
Respect” for Police These Days
War on Police?
Democrat Independent Republican
War on Police?
49%56%
82%
% Who Say There is a
“War on Police”in America
65% 62%70%
% Who Say Police Have
“Very Dangerous” Jobs
45%56%
77%
% Who Say People Show “Too Little
Respect” for Police These Days
CATOINSTITUTE/YOUGOV2016CRIMINALJUSTICESURVEY

FINDINGS FROM THE 2016 CATO INSTITUTE CRIMINAL JUSTICE SURVEY 77
Older Americans are more concerned for police than younger Americans. Seniors (78%) are 34 points more likely than millennials (44%) to think the police aren’t getting the respect they deserve. Seniors are also 21 points more likely than millennials to believe that a war is being waged on cops (76% vs. 55%). Unsurprisingly, the Respect for Authority Index (RAI) is highly correlated with concern about people respecting police.109 Three-fourths (76%) of those who have a high respect for authority believe the police aren’t getting the respect they deserve, compared to only 35% of those who have a low RAI score. Our look at public opinion and the perceived “war on police” offers lessons to criminal justice reformers. Many people have had good experiences with the police and don't perceive systemic problems in policing. Such people might assume that citizens instigate conflict with the police. Some people greatly trust authority figures like the police whom they see as the ultimate linchpin of societal order. People with such experience and views of authority may see intensifying criticism of the police and impassioned calls for reform (“active antagonism and contention”) as an attack on police legitimacy, and thereby, law and order. As they seek to persuade their fellow citizens, reformers should consider the implications of this analysis. Has their audience generally had positive or negative interactions with the police? Do they have a propensity to trust authority figures? If so, reformers should present evidence that speaks directly to these experiences and assumptions. Reformers might indicate their shared commitment to helping police to promote law and order. They can then explain how their reforms will accomplish these goals and improve police safety and police-community relations.
109 The Respect for Authority Index (RAI) is a composite scale based on averaging responses to three questions measuring
people’s general respect for authority, without asking explicitly about police authority. See Appendix E for question wording and further details. High Respect for Authority (RAI) scores are defined as those in the top quartile, while low RAI scores are defined as those in the bottom quartile.
CATO%INSTITUTE/YOUGOV%2015,%2016%CRIMINAL%JUSTICE%SURVEYS
Regardless)of)Partisanship,)Black)Americans)More)Likely)to)Say)Police)Receive)Adequate)RespectIn#recent#years,#do#you#think#people#show#enough#respect#for#police,#too#little#respect,#or#too#much#respect?#
Note:%Black%Republicans%N=45
51%)59%)
81%)
39%)29%)
35%)44%)
47%)
71%)
Democrats) Independents) Republicans)
%)Who)Say)People)Don't)Show)Enough)Respect)to)Police)Officers)
White% Black% Hispanic%

FINDINGS FROM THE 2016 CATO INSTITUTE CRIMINAL JUSTICE SURVEY 78
Bridging the Racial Divide in Evaluations of the Police Black, white, and Hispanic Americans see the police differently. They differ about police efficacy, impartiality, honesty, empathy, tactics, and accountability. Their views may vary in part because Hispanic, black, and white Americans report considerably different personal and vicarious experiences with police officers. For instance, some groups are more likely to report verbal or physical abuse from officers. Taken together, these disparate perceptions and reported experiences form a deep divide in favorability toward law enforcement. However, many overlook agreement among these groups. Americans across race and ethnicity agree on what policing should be and on which reforms should be adopted. Blacks, whites, and Hispanics all agree on the top priorities for law enforcement, maintaining current levels of policing presence in their communities, and the danger inherent in police work. Majorities of Hispanic, white, and black Americans also support a variety of police reforms: more training, body cameras, warnings to citizens about stops and searches, and independent investigations of alleged police misconduct. Similarly, majorities oppose a variety of possible police practices: racial profiling, routine use of military weapons and armored vehicles, pretextual vehicle stops to search for drugs without a warrant, seizing personal and private property before a person is convicted of a crime (civil asset forfeiture), and officers swearing at citizens. Majorities also support decriminalizing drug offenses from felony to civil charges, a change that might improve interactions between police and citizens. Americans may consider police reforms without perceiving all possible problems and systemic biases in policing. Reformers need not insist that others agree with, and adopt their perceptions of policing today. Instead, by acknowledging concerns and emphasizing shared beliefs about what policing ought to be, reformers can forge a consensus to improve policies on behalf of officers, citizens, and the larger community.

FINDINGS FROM THE 2016 CATO INSTITUTE CRIMINAL JUSTICE SURVEY 79
Appendix A: Ideological Clusters How Libertarian, Communitarian, Liberal, and Conservative Groups are Identified The Cato Institute/YouGov survey asked the following three questions to identify clusters of likeminded respondents based on their answers to questions about the proper role of government involvement in economic affairs and in promoting traditional values.
1. If you had to choose, would you rather have a: a. Smaller government providing fewer services 54% b. Bigger government providing more services 46%
2. Some people say we need a strong government to handle today’s complex economic
problems; others say the free market can handle these problems with less government involvement. Which comes closer to your own view? a. We need a strong government to handle today’s complex economic problems 46% b. The free market can handle these problems with less government involvement 54%
3. Which of these two statements comes closer to your own view?
a. The government should promote traditional values in our society 54% b. The government should not favor any particular set of values 46%
Respondents were divided into five groups, based on whether they wanted more or less government involvement in economic affairs and promoting traditional values. Here are the five groups defined:
(17%) Libertarian: These respondents on average said they prefer a smaller government providing fewer services, believe the free market can handle complex problems with less government involvement, and say government should not favor any particular set of values.
(26%) Conservative: These respondents on average said they prefer a smaller government providing fewer services, believe the free market can handle complex problems with less government involvement, and say government should promote traditional values in society.
(18%) Liberal: These respondents on average said they prefer a larger government providing more services, believe a strong government is needed to handle today’s complex economic problems, and say government should not favor any particular set of values.
(16%) Communitarian: These respondents on average said they prefer a larger government providing more services, believe a strong government is needed to handle today’s complex economic problems, and say government should promote traditional values.
(25%) Middle: These respondents did not conform to any of the other four groups.
Ideally, we’d use a variety of issue questions to ascertain the share of libertarians, conservatives, liberals, and communitarians in the electorate. However, with limited space on the survey we used these three questions, which can identify the clusters relatively well.
17%
26%
18%
16%
25%

FINDINGS FROM THE 2016 CATO INSTITUTE CRIMINAL JUSTICE SURVEY 80
Appendix B: Police Department Ratings
Americans Overall Give Their Local Police High Marks on Competency, Fairness, and Trust
How good a job is the police department in your community doing for each of the following, using a scale of 1 to 5 where 1 means you think it’s doing a poor job and 5 means you think it’s doing an excellent job.
CATO INSTITUTE/YOUGOV 2016 CRIMINAL JUSTICE SURVEY
59%
58%
57%
57%
56%
56%
56%
55%
53%
50%
29%
25%
26%
26%
30%
26%
25%
30%
27%
33%
12%
16%
16%
16%
14%
18%
18%
15%
20%
17%
Enforcingthelaw
Notusingexcessiveforceonsuspects
Beingcourteous
Beinghonestandtrustworthy
Protectingpeoplelikeyoufromviolentcrime
Respondingquicklytoacallforhelp
Treatingracialandethnicgroupsequally
Caringaboutthepeopleinyourcommunity
Gainingthetrustoflocalresidents
Solvingcrime
High Average Low

FINDINGS FROM THE 2016 CATO INSTITUTE CRIMINAL JUSTICE SURVEY 81
Appendix C: Police Department Ratings by Demographics
High Rating: Protecting People Like
You from Crime^
High Rating: Responding Quickly to a
Call for Help^
High Rating: Honesty^
High Rating: Courtesy^
Most Police Think They Are Above
the Law
Justice System Gives Preference to Whites
Justice System Treats
All Equally
Race
White 60% 59% 62% 62% 46% 40% 49% Black 38% 44% 36% 43% 61% 72% 18% Hispanic 49% 50% 51% 49% 61% 51% 27%
Gender Male 55% 56% 56% 55% 46% 42% 43% Female 57% 56% 58% 60% 53% 48% 41%
Age 18-34 50% 47% 49% 46% 63% 52% 33% 35-54 52% 52% 52% 52% 48% 43% 45% 55+ 64% 66% 67% 73% 39% 41% 48%
Education High School or Less 54% 54% 55% 55% 53% 44% 42% Some College 52% 52% 50% 56% 51% 47% 41% College Grad 65% 65% 69% 66% 39% 43% 49% Post Grad 66% 61% 67% 63% 42% 49% 36%
Income <$30,000 50% 54% 51% 56% 56% 47% 39% $30,000-$49,999 54% 56% 57% 56% 50% 49% 37% $50,000-$79,999 65% 60% 64% 63% 47% 50% 43% $80,000+ 64% 60% 63% 64% 41% 43% 46%
Community Type City 51% 51% 49% 54% 55% 52% 34% Suburb 59% 61% 61% 61% 45% 44% 44% Rural Area 57% 54% 59% 57% 51% 37% 51%
Partisanship Democrat/Lean Dem 50% 50% 48% 48% 62% 70% 20% Independent 48% 48% 49% 50% 51% 40% 47% Republican/Lean GOP 68% 68% 72% 74% 35% 21% 63%
CATO INSTITUTE/YOUGOV 2016 CRIMINAL JUSTICE SURVEY ^ percentage answering 4 or 5 when asked: “How good a job is the police department in your community doing for each of the following, using a scale of 1 to 5 where 1 means you think it’s doing a poor job and 5 means you think it’s doing an excellent job.”

FINDINGS FROM THE 2016 CATO INSTITUTE CRIMINAL JUSTICE SURVEY 82
Appendix C: Police Department Ratings by Demographics (continued)
Knows Someone
Stopped & Searched by Police
Police Ever Used
Profanity with You
Knows Someone Physically
Abused by Police
Police Tactics are Too Harsh
Police are Too Quick to
Use Lethal Force
Police Only Use Lethal
Force When Necessary
Police Held Accountable
for Misconduct
Extremely/ Very
Concerned About Crime
Race
White 47% 15% 20% 26% 35% 65% 57% 20% Black 60% 24% 41% 56% 73% 27% 36% 41% Hispanic 40% 25% 29% 33% 54% 46% 49% 41%
Gender Male 52% 23% 25% 31% 42% 58% 53% 26% Female 41% 12% 21% 29% 42% 58% 55% 26%
Age 18-34 42% 21% 27% 38% 52% 48% 42% 34% 35-54 53% 21% 25% 31% 42% 58% 53% 26% 55+ 46% 12% 18% 22% 34% 66% 66% 20%
Education High School or Less 46% 19% 27% 29% 44% 56% 57% 29% Some College 49% 19% 25% 32% 43% 57% 49% 28% College Grad 43% 12% 11% 27% 39% 61% 58% 18% Post Grad 46% 14% 19% 28% 39% 61% 53% 22%
Income <$30,000 46% 23% 32% 36% 52% 48% 49% 31% $30,000-$49,999 49% 14% 24% 27% 39% 61% 56% 33% $50,000-$79,999 45% 19% 20% 31% 38% 62% 50% 22% $80,000+ 51% 14% 16% 23% 38% 62% 60% 19%
Community Type City 46% 23% 28% 33% 51% 49% 52% 34% Suburb 43% 16% 19% 29% 37% 63% 54% 26% Rural Area 53% 14% 22% 27% 40% 60% 57% 18%
Partisanship Democrat/Lean Dem 47% 21% 29% 41% 62% 38% 38% 29% Independent 47% 19% 22% 36% 44% 56% 50% 25% Republican/Lean GOP 45% 12% 16% 13% 20% 80% 75% 24%
CATO INSTITUTE/YOUGOV 2016 CRIMINAL JUSTICE SURVEY

FINDINGS FROM THE 2016 CATO INSTITUTE CRIMINAL JUSTICE SURVEY 83
Appendix D: Number of Police Stops in Past 5 Years OLS Regression Predicting # of Police Stops in Past 5 years DV=# of Police Stops (1) (2) (3) Income 0.044* 0.039 0.049* (2.24) (1.08) (2.28) Black -0.39 -0.12 -0.49 (1.29) (0.35) (1.60) Black * Income Interaction 0.11* 0.12* 0.11* (2.04) (1.93) (2.01) White 0.39 (1.53) White * Income Interaction 0.0067 (0.16) Hispanic -0.41 (1.46) Hispanic * Income Interaction -0.025 (0.55) Male 0.40*** 0.40*** 0.40*** (3.71) (3.70) (3.72) Age -0.023*** -0.025*** -0.025*** (7.33) (7.84) (7.88) Some College -0.10 -0.14 -0.14 (0.82) (1.07) (1.10) College Graduate -0.23 -0.28 -0.32 (1.35) (1.65) (1.86) Post Graduate -0.16 -0.22 -0.26 (0.74) (1.07) (1.22) Constant 1.54*** 1.37*** 1.74*** (7.70) (5.30) (8.01) N 872 872 872 R2 0.092 0.102 0.103 Model estimated via OLS regression; t statistics in parentheses * p<0.05 ** p<0.01 *** p<0.001 Data from Cato Institute/YouGov Aug 2016 National Survey

FINDINGS FROM THE 2016 CATO INSTITUTE CRIMINAL JUSTICE SURVEY 84
Appendix E: Respect for Authority Index (RAI) In order to gauge Americans’ disposition toward authority figures, the author created the Respect for Authority Index (RAI). The scale is constructed by averaging responses to three questions taken from a version of the Moral Foundations Theory Questionnaire used to measure the Authority/Subversion Foundation:110 Respect for Authority Index (RAI) 1. Agree/Disagree: Respect for authority is something all children need to learn. 2. Relevant/Not Relevant to Moral Judgment: Whether or not someone showed a lack of
respect for authority 3. Relevant/Not Relevant to Moral Judgment: Whether or not an action caused chaos or
disorder The Cronbach’s alpha for the three items is .66, which indicates these questions are suitable to combine into a composite measure of respect for authority. Each of the three questions had response options ranging from 1-5. The first question asked respondents their level of agreement with a series of statements with 1 indicating strongly disagree and 5 indicating strongly agree. The second two questions asked respondents how relevant a series of statements were when deciding if something is right or wrong, with 1 indicating Not at All Relevant and 5 indicating Extremely Relevant. Respondents’ answers to these three questions were averaged together such that lower scores indicate a lower respect for authority and higher scores indicate a higher respect for authority. The Respect for Authority Index (RAI) was then divided into quarters, according to the Interquartile Range, such that roughly the first 25% of respondents scoring the lowest were assigned to Group 1 (Low RAI), the respondents scoring between 26-50% along the scale were assigned to Group 2 (Low-Med RAI), the respondents scoring between 51-75% were assigned to Group 3 (Med-High RAI), and the respondents scoring between 76-100% were assigned to group 4 (High RAI). Respondents in Group 4 are identified in this report as scoring “High” on RAI and respondents from Group 1 are identified as scoring “Low” on RAI.
110 Jonathan Haidt, Jesse Graham, and Craig Joseph, "Above and Below Left-Right: Ideological Narratives and Moral
Foundations," Psychological Inquiry 20 (2009): 110-119; Jonathan Haidt, The Righteous Mind: Why Good People Are Divided by Politics and Religion (New York: Pantheon Books, 2012).

FINDINGS FROM THE 2016 CATO INSTITUTE CRIMINAL JUSTICE SURVEY 85
Appendix F: Sensitivity to Harm Index (SHI) In order to gauge Americans’ disposition towards others experiencing harm, the author created the Sensitivity to Harm Index (RAI). The scale is constructed by averaging responses to two questions taken from the Moral Foundations Theory Questionnaire used to measure the Care/Harm Foundation: 111 Sensitivity to Harm (SHI)
1. Agree/Disagree: Compassion for those who are suffering is the most crucial virtue. 2. Relevant/Not Relevant to Moral Judgment: Whether or not someone suffered emotionally The Cronbach’s alpha for the three items is .48, which indicates these questions are moderately suitable to combine into a composite measure. Both questions had response options ranging from 1-5. The first question asked respondents their level of agreement with a series of statements with 1 indicating strongly disagree and 5 indicating strongly agree. The second question asked respondents how relevant a series of statements were when deciding if something is right or wrong, with 1 indicating Not at All Relevant and 5 indicating Extremely Relevant. Respondents’ answers to these two questions were averaged together such that lower scores indicate a lower sensitivity to others experiencing harm and higher scores indicate a higher sensitivity to others experiencing harm. The Sensitivity to Harm Index (SHI) was then divided into quarters, according to the Interquartile Range, such that roughly the first 25% of respondents scoring the lowest were assigned to Group 1 (Low SHI), the respondents scoring between 26-50% along the scale were assigned to Group 2 (Low-Med SHI), the respondents scoring between 51-75% were assigned to Group 3 (Med-High SHI), and the respondents scoring between 76-100% were assigned to Group 4 (High-SHI). Respondents in Group 4 are identified in this report as scoring “High” on RAI and respondents from Group 1 are identified as scoring “Low” on RAI.
111 Jonathan Haidt, Jesse Graham, and Craig Joseph, "Above and Below Left-Right: Ideological Narratives and Moral
Foundations," Psychological Inquiry 20 (2009): 110-119; Jonathan Haidt, The Righteous Mind: Why Good People Are Divided by Politics and Religion (New York: Pantheon Books, 2012).

FINDINGS FROM THE 2016 CATO INSTITUTE CRIMINAL JUSTICE SURVEY 86
Appendix G: Predicting Perceptions of Justice System Bias
White Black Hispanic All
Model
A Model
B Model
A Model
B Model
A Model
B Model
A Model
B
Male 0.24 0.24 0.85* 1.02** 0.13 -0.074 0.18 0.20
(0.210) (0.228) (0.360) (0.386) (0.265) (0.331) (0.139) (0.172)
Age 0.0011 0.0021 0.031** 0.023* -0.0020 -0.009 -0.0024 -0.0028
(0.007) (0.007) (0.011) (0.011) (0.008) (0.008) (0.004) (0.005)
Education 0.16 0.19 0.28 0.31 0.15 0.055 0.19** 0.23**
(0.095) (0.107) (0.225) (0.177) (0.155) (0.163) (0.068) (0.075)
Income Above $40K -0.34 -0.30 0.47 0.35 -0.0080 0.090 -0.26 -0.22
(0.232) (0.278) (0.456) (0.392) (0.341) (0.434) (0.143) (0.177)
City 0.11 0.21 -0.028 0.43 0.24 0.34 0.17 0.28
(0.235) (0.272) (0.335) (0.346) (0.219) (0.243) (0.192) (0.202)
Liberal 1.78*** 1.44*** -0.39 -0.42 0.14 -0.078 1.25*** 0.88*
(0.339) (0.332) (0.440) (0.429) (0.488) (0.586) (0.374) (0.347)
Conservative -0.92*** -0.77*** -1.22** -0.98* -0.59* -0.50* -0.94*** -0.74***
(0.211) (0.183) (0.437) (0.445) (0.249) (0.237) (0.151) (0.150)
Concern About Crime -0.81 0.20 -0.34 -0.53*
(0.487) (0.488) (0.426) (0.220) Know Someone Searched, Arrested, or Jailed -0.029 0.36 1.55*** 0.16
(0.331) (0.714) (0.387) (0.238)
Experienced Mistreatment -0.80 -0.37 -0.19 -0.66**
(0.499) (0.471) (0.343) (0.248)
Perceived Harsh Tactics 1.36*** 2.00*** 1.86*** 1.59***
(0.221) (0.462) (0.357) (0.130)
No Accountability 0.56* 0.40 0.12 0.54**
(0.278) (0.562) (0.418) (0.187) Sensitivity to Harm Scale (SHI) 0.85*** 0.85 0.96* 0.98***
(0.216) (0.446) (0.403) (0.205)
African American 1.84*** 1.33***
(0.246) (0.250)
Hispanic 0.50* 0.52
(0.246) (0.279)
Constant -0.83** -1.88*** -0.32 -2.52** 0.020 -1.55* -0.55* -1.93***
(0.311) (0.537) (0.769) (0.907) (0.511) (0.656) (0.269) (0.391)
Observations 1152 1151 391 391 369 368 1998 1996
Models estimated via Logit regression; robust standard errors in parentheses * p<0.05, ** p<0.01, *** p<.001 Data from Cato Institute/YouGov November 2015 National Survey

FINDINGS FROM THE 2016 CATO INSTITUTE CRIMINAL JUSTICE SURVEY 87
Appendix H: Experiment: Effectiveness of Charging Justice System with Bias [TREATMENT] Some people say that the US criminal justice system is unfair to African Americans and Hispanics and so we should consider reforms of the system. In general, do you think the criminal justice system in this country is too harsh, too lenient, or about right in its handling of crime? [CONTROL] In general, do you think the criminal justice system in this country is too harsh, too lenient, or about right in its handling of crime?
Effect of Receiving Message about Racial Bias on Perception of Harsh or Lenient Justice System 1 2 3 Treatment -0.069*** -0.068*** -0.151*** (0.011) (0.010) (0.036) Ideology 0.080*** 0.067*** (0.005) (0.008) Ideology X Treatment 0.026* (0.011) Constant 0.510*** 0.257*** 0.297*** (0.007) (0.019) (0.025) Observations 2000 2000 2000 R-squared 0.021 0.116 0.119 Models estimated via OLS regression * p<0.05 ** p<0.01 *** p<0.001 Data from Cato Institute/YouGov November 2015 Survey
Treatment Control Comparisons of Means Test M (SD) M (SD) Diff
Very Liberal 2.19 1.06 3.50 1.87 -1.31 t(163)=-5.59*** Liberal 2.95 1.38 3.39 1.48 -0.44 t(286)=-2.61** Moderate 3.71 1.34 4.04 1.31 -0.33 t(569)=-2.97** Conservative 4.13 1.19 4.39 1.33 -0.26 t(473)=-2.24* Very Conservative 4.48 1.57 4.81 1.34 -0.33 t(287)=-1.92^
^ p <.10 * p<0.05 ** p<0.01 *** p<0.001 Note: Comparisons of means tests comparing treatment and control groups among political groups. Responses were on a scale of 1 to 7, in answer to this question: In general, do you think the criminal justice system in this country is too harsh, too lenient, or about right in its handling of crime, with 1 indicating far too harsh and 7 indicating far too lenient.

FINDINGS FROM THE 2016 CATO INSTITUTE CRIMINAL JUSTICE SURVEY 88
Appendix I: Predicting Favorability Toward Police; Measurement Care was taken to construct independent variables with survey questions using a similar response structure (i.e. scale of 1-5) and each coded from min to max (0-1) to reduce the likelihood that one measure received unmerited advantage in the regression equation.
Satisfaction with Personal Contact (1) Please rate your overall level of satisfaction with interactions you’ve had with police officers in the past 5 years on a scale of 1 to 5 with 1 meaning you were highly dissatisfied and 5 meaning you were highly satisfied. Response options ranged from 1 to 5 and were recoded 0 to 1 (min to max). Perception of Police: Caring (1) How good a job is the police department in your community doing for each of the following, using a scale of 1 to 5 where 1 means you think it’s doing a poor job and 5 means you think it’s doing an excellent job….Caring about the people in your community. Response options ranged from 1 to 5 and were recoded 0 to 1 (min to max). Perception of Police: Racial Bias (1) How good a job is the police department in your community doing for each of the following, using a scale of 1 to 5 where 1 means you think it’s doing a poor job and 5 means you think it’s doing an excellent job…. Treating racial and ethnic groups equally. Response options ranged from 1 to 5 and were recoded 0 to 1 (min to max). Perception of Police: Untrustworthy (1) How good a job is the police department in your community doing for each of the following, using a scale of 1 to 5 where 1 means you think it’s doing a poor job and 5 means you think it’s doing an excellent job…. Being honest and trustworthy. Response options ranged from 1 to 5 and were recoded 0 to 1 (min to max). Perception of Police: Competency (1) How good a job is the police department in your community doing for each of the following, using a scale of 1 to 5 where 1 means you think it’s doing a poor job and 5 means you think it’s doing an excellent job…. Protecting people like you from violent crime. Response options ranged from 1 to 5 and were recoded 0 to 1 (min to max). Perception of Police: Use Harsh Tactics (1) How good a job is the police department in your community doing for each of the following, using a scale of 1 to 5 where 1 means you think it’s doing a poor job and 5 means you think it’s doing an excellent job…. Not using excessive force on suspects. Response options ranged from 1 to 5 and were recoded 0 to 1 (min to max). Perception of Police: Lack Accountability (1) Based on what you’ve read or heard, do you think police officers are generally held accountable for misconduct, or not? Response options ranged from 1 to 2 and were recoded 0 to 1 (min to max). Perception of Police: Experienced Mistreatment (1) Has a police officer ever used abusive language or profanity in an interaction with you? (Yes/No) (2) Do you happen to know anyone who has been physically mistreated or abused by the police? (Yes/No) Respondents who reported experience both with verbal and physical police abuse were coded as 1 and those with neither of these experiences or just one were coded as 0. Respect for Authority (1) Respect for authority is something all children need to learn. (2) Relevant/Not Relevant to Moral Judgment: Whether or not someone showed a lack of respect for authority (3) Relevant/Not Relevant to Moral Judgment: Whether or not an action caused chaos or disorder This variable coded respondents who scored above average on the Respect for Authority Index (RAI) as 1 and coded respondents scored at the average or below on RAI as 0. (Please see Appendix E for more information).

FINDINGS FROM THE 2016 CATO INSTITUTE CRIMINAL JUSTICE SURVEY 89
Appendix J.1: Predicting Favorability Toward Police
Predicting Favorability Toward the Police Using Demographics Only (1) (2) (3) (4) (5) (6) (7) (8) (9) African American -1.163*** -1.165*** -1.097*** -1.090*** -1.053*** -1.129*** -1.017*** -0.947*** -0.931*** (0.173) (0.173) (0.182) (0.176) (0.176) (0.172) (0.186) (0.187) (0.185) Hispanic -0.592** -0.592** -0.432* -0.457* -0.510** -0.545** -0.283 -0.250 -0.221 (0.190) (0.191) (0.204) (0.205) (0.196) (0.183) (0.218) (0.223) (0.212) Male -0.080 -0.112 (0.155) (0.160) Age 0.019*** 0.019*** 0.019*** 0.019*** (0.005) (0.005) (0.005) (0.005) Education 0.245*** 0.262*** 0.206** 0.208** (0.067) (0.069) (0.075) (0.075) Income Above $40K 0.498*** 0.393* 0.390* (0.147) (0.161) (0.160) Lives in City -0.140 -0.084 (0.126) (0.131) Constant 0.890*** 0.929*** -0.001 0.404* 0.568*** 0.924*** -0.543 -0.678 -0.603 (0.091) (0.091) (0.283) (0.186) (0.139) (0.108) (0.350) (0.363) (0.363) Observations 1998 1998 1998 1998 1998 1998 1998 1998 1998 Pseudo R-squared .03 .03 .05 .04 .04 .03 .06 .06 .06
Models estimated via Logit regression robust standard errors in parentheses * p<0.05, ** p<0.01, *** p<.001 Data from Cato Institute/YouGov November 2015 National Survey

FINDINGS FROM THE 2016 CATO INSTITUTE CRIMINAL JUSTICE SURVEY 90
Appendix J.2: Predicting Favorability Toward Police
(1) (2) (3) (4) (5) (6) (7) (8) (9) (10) (11)
Satisfied Personal Contact^ 2.54*** 1.51*** (^ If had contact <5 yrs) (0.21) (0.22) Perception of Police:
Caring 2.41*** 1.38*** 0.91*** (0.17) (0.20) (0.27) Racial Bias -2.25*** -1.14*** -1.37*** (0.20) (0.27) (0.32) Untrustworthy -2.22*** -0.51 -0.58* (0.26) (0.28) (0.25) Competency 2.08*** 0.99*** 0.96*** (0.17) (0.17) (0.20) Use Harsh Tactics -2.02*** -0.13 0.34 (0.19) (0.24) (0.27) Lack Accountability -1.42*** -0.75*** -0.75**
(0.19) (0.16) (0.23) Experienced Mistreatment -1.50*** -0.73* -0.34 (0.33) (0.31) (0.30) Respect for Authority 0.81*** 0.40* -0.01 (0.16) (0.18) (0.18) DEMOGRAPHIC/POLITICAL African American -0.15 -0.50* -0.19 -0.61** -0.66** -0.45 -0.64** -0.79*** -0.91*** -0.02 0.35 (0.37) (0.25) (0.19) (0.20) (0.24) (0.24) (0.21) (0.20) (0.19) (0.25) (0.34) Hispanic 0.09 0.03 -0.03 -0.10 -0.02 -0.05 -0.13 -0.17 -0.10 0.10 0.15 (0.27) (0.25) (0.26) (0.25) (0.25) (0.21) (0.23) (0.23) (0.24) (0.31) (0.31) Male -0.00 -0.05 -0.00 -0.10 -0.22 -0.04 -0.01 -0.01 -0.09 0.18 0.20 (0.20) (0.15) (0.17) (0.17) (0.16) (0.16) (0.15) (0.16) (0.15) (0.17) (0.21) Age 0.01* 0.01 0.01* 0.01 0.01 0.01* 0.01* 0.01* 0.01 0.01 0.01 (0.01) (0.01) (0.01) (0.01) (0.01) (0.01) (0.01) (0.01) (0.01) (0.01) (0.01) Education 0.20* 0.25*** 0.28*** 0.27** 0.26*** 0.26** 0.23*** 0.19* 0.23** 0.34*** 0.26** (0.10) (0.07) (0.08) (0.08) (0.08) (0.08) (0.07) (0.08) (0.08) (0.08) (0.10) Income Above $40K 0.45 0.25 0.33 0.33 0.34 0.39* 0.32 0.34 0.43* 0.09 0.14 (0.28) (0.20) (0.21) (0.19) (0.20) (0.19) (0.18) (0.18) (0.18) (0.25) (0.32) City -0.05 0.07 0.01 -0.03 -0.02 0.11 -0.04 -0.06 -0.05 0.14 0.08 (0.18) (0.13) (0.14) (0.14) (0.15) (0.14) (0.15) (0.14) (0.14) (0.17) (0.21) Liberal 0.02 0.21 0.37 0.22 0.22 0.32 0.39* 0.22 0.17 0.62* 0.40 (0.24) (0.24) (0.21) (0.22) (0.21) (0.21) (0.20) (0.21) (0.20) (0.28) (0.31) Conservative 1.13*** 0.97*** 1.05*** 1.11*** 1.22*** 1.15*** 0.93*** 1.08*** 1.07*** 0.84*** 0.94*** (0.21) (0.17) (0.17) (0.16) (0.18) (0.16) (0.16) (0.16) (0.16) (0.20) (0.24) Constant -2.45*** -1.95*** -0.72 -0.54 -1.79*** -0.76 -0.09 -0.56 -1.11* -1.64** -2.24*** (0.49) (0.46) (0.43) (0.41) (0.45) (0.43) (0.46) (0.40) (0.44) (0.51) (0.50) Observations 1552 1994 1994 1992 1991 1994 1996 1998 1998 1983 1541^ Pseudo R-squared 0.308 0.285 0.187 0.185 0.246 0.164 0.166 0.130 0.122 0.374 0.437
Models estimated via Logit regression; robust standard errors in parentheses * p<0.05, ** p<0.01, *** p<.001 Data from Cato Institute/YouGov November 2015 National Survey
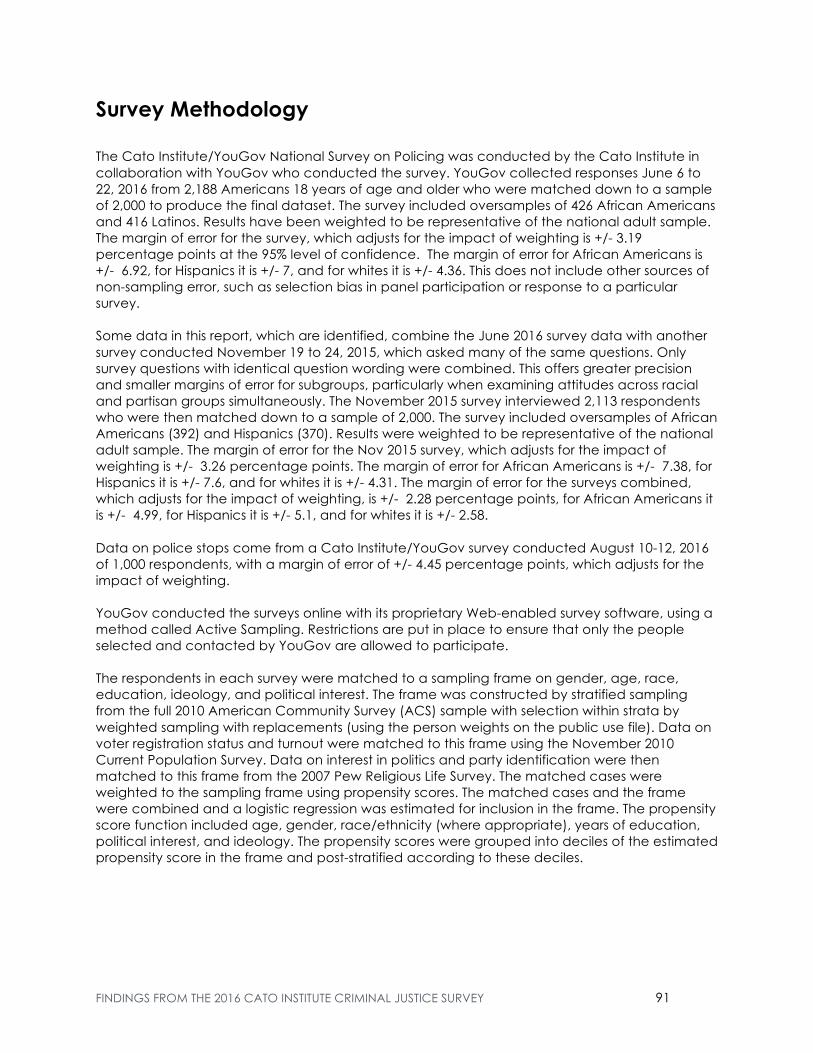
FINDINGS FROM THE 2016 CATO INSTITUTE CRIMINAL JUSTICE SURVEY 91
Survey Methodology The Cato Institute/YouGov National Survey on Policing was conducted by the Cato Institute in collaboration with YouGov who conducted the survey. YouGov collected responses June 6 to 22, 2016 from 2,188 Americans 18 years of age and older who were matched down to a sample of 2,000 to produce the final dataset. The survey included oversamples of 426 African Americans and 416 Latinos. Results have been weighted to be representative of the national adult sample. The margin of error for the survey, which adjusts for the impact of weighting is +/- 3.19 percentage points at the 95% level of confidence. The margin of error for African Americans is +/- 6.92, for Hispanics it is +/- 7, and for whites it is +/- 4.36. This does not include other sources of non-sampling error, such as selection bias in panel participation or response to a particular survey. Some data in this report, which are identified, combine the June 2016 survey data with another survey conducted November 19 to 24, 2015, which asked many of the same questions. Only survey questions with identical question wording were combined. This offers greater precision and smaller margins of error for subgroups, particularly when examining attitudes across racial and partisan groups simultaneously. The November 2015 survey interviewed 2,113 respondents who were then matched down to a sample of 2,000. The survey included oversamples of African Americans (392) and Hispanics (370). Results were weighted to be representative of the national adult sample. The margin of error for the Nov 2015 survey, which adjusts for the impact of weighting is +/- 3.26 percentage points. The margin of error for African Americans is +/- 7.38, for Hispanics it is +/- 7.6, and for whites it is +/- 4.31. The margin of error for the surveys combined, which adjusts for the impact of weighting, is +/- 2.28 percentage points, for African Americans it is +/- 4.99, for Hispanics it is +/- 5.1, and for whites it is +/- 2.58. Data on police stops come from a Cato Institute/YouGov survey conducted August 10-12, 2016 of 1,000 respondents, with a margin of error of +/- 4.45 percentage points, which adjusts for the impact of weighting. YouGov conducted the surveys online with its proprietary Web-enabled survey software, using a method called Active Sampling. Restrictions are put in place to ensure that only the people selected and contacted by YouGov are allowed to participate. The respondents in each survey were matched to a sampling frame on gender, age, race, education, ideology, and political interest. The frame was constructed by stratified sampling from the full 2010 American Community Survey (ACS) sample with selection within strata by weighted sampling with replacements (using the person weights on the public use file). Data on voter registration status and turnout were matched to this frame using the November 2010 Current Population Survey. Data on interest in politics and party identification were then matched to this frame from the 2007 Pew Religious Life Survey. The matched cases were weighted to the sampling frame using propensity scores. The matched cases and the frame were combined and a logistic regression was estimated for inclusion in the frame. The propensity score function included age, gender, race/ethnicity (where appropriate), years of education, political interest, and ideology. The propensity scores were grouped into deciles of the estimated propensity score in the frame and post-stratified according to these deciles.