policies to stimulate biofuel production in canada: lessons from
64
POLICIES TO STIMULATE BIOFUEL PRODUCTION IN CANADA: LESSONS FROM EUROPE AND THE UNITED STATES Dr. Allan M. Walburger, University of Lethbridge, principal researcher Dr. Danny Le Roy, University of Lethbridge Dr. Krishan K. Kaushik, Himachal Pradesh University Dr. K. K. Klein, University of Lethbridge March 2006 A BIOCAP Research Integration Program Synthesis Paper www.biocap.ca
Transcript of policies to stimulate biofuel production in canada: lessons from

POLICIES TO STIMULATE BIOFUEL PRODUCTION IN CANADA: LESSONS FROM
EUROPE AND THE UNITED STATES Dr. Allan M. Walburger, University of Lethbridge, principal researcher
Dr. Danny Le Roy, University of Lethbridge Dr. Krishan K. Kaushik, Himachal Pradesh University
Dr. K. K. Klein, University of Lethbridge
March 2006
A BIOCAP
Research Integration Program Synthesis Paper
www.biocap.ca

This paper was supported by BIOCAP through a targeted research program.
The report reflects the research findings and opinions of the research team and not necessarily those of BIOCAP Canada.

Walburger, A. 4/21/2006 2 of 63
Executive Summary Canada has a huge stock of biomass resources. Each year, the biomass harvest from Canada’s forestry and agricultural sectors is about 143 million tonnes of carbon, an amount of carbon that is similar to the atmospheric emissions of carbon from fossil fuel use in Canada. These exceptional bio-mass resources could be used to develop a major bio-fuels industry in Canada. A bio-fuel industry would provide several benefits, including improvements to the environment from less use of fossil fuels, economic diversification through increased rural development, and offer an additional market to hard-pressed agricultural producers. The production of biofuel from agricultural and forestry sources has been a focus of attention for many years, particularly after the energy crisis of the 1970s. While the potential to produce energy from biomass is significant and technologically possible, it appears to offer insufficient financial rewards to encourage much private sector investment. As a result, governments of many countries have implemented policies to promote the production and consumption of energy from bio-mass. However, progress in Canada has been markedly slower than in many other countries. In 2004, ethanol production in Canada was less than two percent of the amount produced in the United States. In fact, there is less ethanol produced in Canada than in several developing countries including Thailand and Ukraine. This project reviews policies in the United States, Western Europe, and elsewhere that are designed to stimulate production and consumption of biofuels. The international comparison identifies the strengths and weaknesses inherent in the various policies and suggests important aspects of policies that ought to be considered by Canadian governments. From the survey of policies and conditions for biofuel production and consumption in several countries, eight major observations were made: 1) Biofuel has become a growth industry. In 2000, total world production of ethanol for fuel was less than 20 billion litres and by 2005, production had more than doubled to around 40 billion litres. This provided about 2.8% of the motor gasoline use in the world, with a slightly smaller percentage in North America. Brazil produces more ethanol than does any other country. More than 300 ethanol plants are located in Brazil and together they have a combined annual capacity of 14 billion litres. As well as being the largest producer of ethanol, Brazil is also the largest consumer of ethanol: 3 million vehicles a day run on pure ethanol. The United States is the second largest producer of ethanol with a capacity that is approaching that in Brazil. The number of ethanol plants in the United States has increased to 95 in 2005 from 50 in 1999, with 31 additional plants under construction. Production capacity over the six year period has increased 254%. China is the third largest world producer of ethanol and the largest in Asia with more than 3 billion litres per year capacity, followed by India with about 2.7 billion litres of capacity. Many western European countries (principally Spain, France, Sweden, Germany and the United Kingdom) have been increasing their production of biofuels very rapidly during the last five years. 2) Governments are using a wide variety of measures to stimulate the biofuels industry. It is widely believed that biofuels can play an important part in reducing greenhouse gas emissions as well as providing opportunities for improvements in the welfare of rural people. As a result, many governments around the world have developed policies and programs to stimulate the production and use of biofuels. These include investment tax credits, capital grants, guaranteed prices, consumer rebates, excise tax exemptions, tax credits, and a wide variety of subsidies for production, consumption, and research. Establishment of targets (or mandates) for biofuel production and consumption also has been popular. However, most targets have been on the ambitious side and have not been reached by the target dates. 3) Ethanol production can be a profitable business.
Walburger, A. 4/21/2006 3 of 63
The profitability of ethanol production is largely determined by the price of competing outputs, principally petroleum products, and the cost of its feedstock, mainly cereal grains. Relatively high oil prices over the past year have provided a good opportunity for ethanol producers to sell their output in a high-priced market. At the same time, relatively low grain prices have allowed ethanol producers to capture much larger financial margins than were possible as recently as 2003. Many ethanol plants in the United States have achieved return on equity of 25-40% in the last two years. The high rates of return on invested capital, and the expectation that demand for ethanol will continue to grow, has attracted a lot of private capital in the United States and other countries. 4) Modest increases in prices of farm crops can be expected from biofuel production. One of the major objectives of most biofuel policies is to provide opportunities for primary agricultural producers to get a higher price for the products they produce. An ethanol plant that uses cereal grains (or eventually plant residues) provides an additional market for these products. Although most agricultural products are traded over wide areas and the relationship among markets is very complex, there is some evidence of higher prices for some agricultural products as a result of production of biofuels. The large scale use of sugar cane to produce ethanol in Brazil seems to have raised the world price of sugar. In the United States, it was found that biofuel production led to an increase in prices of traditional crops (like corn, sorghum, wheat, soybeans, cotton and rice) from four to 14% because these crops compete for the same land and that net farm income had increased by up to 0.3%. 5) Ethanol for reduction of carbon seems to be very expensive. Many jurisdictions around the world, including Canada, have exempted ethanol from the gasoline tax to increase consumer demand in relation to conventional gasoline. A major justification for this policy has been the reduction on greenhouse gas emissions that result when ethanol, rather than gasoline, is burned in internal combustion engines. However, comprehensive studies in Europe have revealed that the cost of abating carbon dioxide emissions was likely to be in the range of €200 ($286) to €1,000 ($1429) per tonne of CO2 equivalent. This compares to estimated costs of about €30 ($43) per tonne by using the most efficient ways of reducing greenhouse gases. 6) There is evidence of large economies of scale in manufacturing. A general result found in cost studies is that there are economies of scale in production. As plants increase in size, they often become more efficient in production and can apply their fixed costs over a larger output. This phenomenon seems to exist in ethanol production as well. In the United States, economic studies have shown that ethanol plants with a capacity of 80 million gallons per year had investment costs per unit of production that were 23% lower than did plants with half the capacity. It was estimated that a tripling of plant size (from 55 to 150 million litres per year for dry-mill plants and from 110 to 375 litres per year for wet-mill plants) reduced capital costs by about 40% and operating costs by 15-20%. 7) Research and development activities are bringing costs down. Virtually all countries that are involved in the production of biofuels have programs that support biofuel research. In Canada, several government-supported programs have funded a wide-array of biofuel research, much of it aimed at developing more efficient processes for converting plant-based starches to alcohol. This production-oriented research has been instrumental in bringing down the average costs of producing biofuels. The greatest potential cost reductions lie in the development of technologies that convert cellulosic feedstock to ethanol, and eventually to hydrogen and other liquid fuels like synthetic diesel. The cost of cellulosic feedstock, including grasses, harvest residues and trees generally is much lower than that of cereals. As a result of on-going research, the International Energy Agency estimates the cost of producing a litre of ethanol made from cellulose (poplar trees) to decline by about half within ten years and the cost of producing a litre of ethanol from corn in the United States to decline by about 14% in the same timeframe. 8) There are many trade restrictions in biofuels.

Walburger, A. 4/21/2006 4 of 63
Production costs of biofuels are much lower in the developing countries in tropical and sub-tropical areas with low land and labour costs. Crops such as sugarcane, tapioca, sorghum, and cassava have been used as feedstocks for ethanol production. Palm oil, soybeans, peanuts, cocoanut, and jatropha have been used to produce bio-diesel. In Brazil, the costs of producing ethanol from sugarcane are now similar to the cost of petroleum fuels. The production cost advantage of ethanol in lower income countries provides an obvious opportunity for increased international trade in this product. However, like many other agricultural-related commodities, restrictions to trade in biofuels exist in most high income countries. National governments in the United States, Canada, Australia, and within the European Union, all impose import taxes on ethanol. As a consequence, the quantity of ethanol traded on international markets is less than it would be otherwise. International trade barriers in biofuels have their counterparts within Canada in the form of interprovincial barriers to trade. Each provincial government has implemented its own set of tax exemptions on ethanol which are complex and heterogeneous with respect to amounts, eligibility, and duration. These market interventions further distort the market for ethanol in Canada by encouraging production in areas where this activity is not naturally well suited. Reviews of the situations for biofuels in various countries revealed the cost of producing ethanol and biodiesel in countries where land and labour prices are relatively high (as in Canada) discourages biofuel production. The relatively high costs can be overcome by subsidies, but the necessary income transfers from more profitable activities is likely counterproductive. Canada is a large net exporter of energy so does not need a biofuel industry to ensure energy security. The evidence is overwhelming that there are much less expensive ways to reduce greenhouse gases than by producing ethanol from grains or bio-diesel from canola/rapeseed. Thus, the arguments for supporting development of a biofuel industry in Canada must focus on the ability to increase agricultural incomes and to promote rural development. There is some evidence the input requirements of viable, large scale biofuel plants increase prices for locally produced commodity feedstock. However, due to the competitive market structure of the grains and oilseeds sector in Canada, it is well known that most improvements in commodity prices, whether through the market or through government transfers, result in higher prices for land with only small increases in the returns to agricultural labour. Establishing a major biofuel industry in the rural areas of Canada would provide some additional jobs in those locations. While some surplus labour is available in rural areas on a seasonal basis (mostly during the winter), the reality is that most permanent jobs in new ethanol production facilities could be filled only by attracting labour away from existing jobs. This would generate a net benefit only if new enterprises were competitive and could produce biofuels profitably without government assistance. If government transfers or mandates were required to establish or maintain the industry, this would generate economy wide losses rather than gains. It appears that biofuels can be produced less expensively in developing countries and then imported into Canada. Nevertheless, there is political desire in Canada to develop a large-scale biofuels industry to help realize policy objectives related to the environment and rural development. These policy objectives provide further motivation for Canadian scientists and industry stakeholder to stay abreast of developments in the broader bio-products industry. Four recommendations can be made that would allow the industry to develop as competitively as possible.
1) Remove inter-provincial barriers to trade so the industry may develop and expand in the most profitable locations.
2) Remove impediments that discourage the construction and operation of large-scale biofuel plants.
3) Enhance funding for research and development activities related to the production and marketing of biofuel.
4) Identify and remove regulations that currently are in place to ensure adequate functioning of a supply chain for grains and oilseeds but increase the costs of supplying feed stocks that are used for biofuel production.

Walburger, A. 4/21/2006 5 of 63
Table of Contents
List of Figures ......................................................................................................................................... 6
List of Tables........................................................................................................................................... 7
1. Introduction ..................................................................................................................................... 8
1.1 Purpose and Objectives ....................................................................................................... 9
2. Situation in Canada ..................................................................................................................... 10
2.1 Federal Government Policies ........................................................................................... 10 2.2.1 Alberta............................................................................................................................. 13 2.2.2 Ontario ............................................................................................................................ 13 2.2.3 Saskatchewan ............................................................................................................... 13 2.2.4 Manitoba ......................................................................................................................... 14
3. Situation in Other Countries ..................................................................................................... 15
3.1 Brazil........................................................................................................................................ 15
3.2 The United States................................................................................................................. 17
3.3 European Union.................................................................................................................... 27
3.4 Other Regions ....................................................................................................................... 30
3.5 Summary ................................................................................................................................ 30
4. What Can Be Learned From the Experiences in Other Countries?................................ 32
4.1 Observation 1 – Biofuel Has Become a Growth Industry............................................... 32
4.2 Observation 2 – Countries Are Using a Wide Variety of Measures to Stimulate Production and Consumption of Biofuels................................................................................. 36
4.3 Observation 3 – Ethanol Production Can Be A Profitable Business .......................... 36
4.4 Observation 4 – Modest Increases in Prices of Farm Crops Can Be Expected From Biofuel Production........................................................................................................................... 36
4.5 Observation 5 – Ethanol for Reduction of Carbon Seems to be Very Expensive.... 37
4.6 Observation 6 – Evidence of Large Economies of Scale in Manufacturing .............. 37
4.7 Observation 7 – Research and Development Activities Are Bringing Costs Down 38
4.8 Observation 8 – Existence of Many Restrictions to Trade in Biofuels ....................... 39
5. Implications and Recommendations for Canada ................................................................ 41
References ............................................................................................................................................. 44

Walburger, A. 4/21/2006 6 of 63
List of Figures
Figure 1: Fuel Ethanol Production in the United States, 1980-2005 ............................................ 18 Figure 2: Existing and Projected Canadian Ethanol Production Capacity ................................... 33 Figure 3: Existing and Projected Ethanol Plants in Canada .......................................................... 34 Figure 4: Ethanol Production Costs by Plant Size ........................................................................... 38
Walburger, A. 4/21/2006 7 of 63
List of Tables
Table 1: Canadian Ethanol Plant Capacities, 1976-2000 (million litres/year) ............................. 10 Table 2: Tax Exemptions for Fuel Ethanol in Canadian Provinces............................................... 12 Table 3: Annual World Ethanol Production, by Country (millions of litres) .................................. 16 Table 4: Ethanol Industry Overview ................................................................................................... 19 Table 5: U.S. Fuel Ethanol Industry Plants and Production Capacity .......................................... 20 Table 6: Estimated Use of Gasohol, by State, 2003 1/ .................................................................... 24 Table 7: U.S. Fuel Ethanol Imports, by Country (millions of litres) ............................................... 26 Table 8: Production of Ethanol in the EU, 2004 ............................................................................... 28 Table 9: Ethanol Production Capacities and Motor Gasoline Consumption................................ 35

Walburger, A. 4/21/2006 8 of 63
1. Introduction Canada has a huge stock of biomass resources. Of the 998 million hectares of land in Canada, about 42% is forested, and about 25% (245 million hectares) is considered timber productive forest. A further 6.8% (67.5 million hectares) of Canada is agricultural land, of which 36.4 million hectares (3.6%) is cropland. The 245 million hectares of timber productive forest in Canada has a biomass carbon stock of about 15,835 million tonnes of carbon. This resource has an energy content that is equal to 69 years of Canada’s current energy demand that is met by fossil fuels. Each year, the biomass harvest from Canada’s forestry and agricultural sectors is about 143 million tonnes of carbon, an amount that is similar to the atmospheric emissions of carbon from fossil fuel use in Canada (about 150 million tonnes of carbon per year in 1998) (Wood and Layzell, 2003). These exceptional resources appear tempting for development of a major bio-fuels industry in Canada. Indeed, many have been calling for creation of a strategy to promote the production and consumption of bio-fuels in Canada. In early 2006, BIOCAP Canada engaged approximately 160 key government, industry and technology leaders in a Bioenergy Challenge Dialogue group. After their deliberations, they stated “[we] believe the bioenergy sector has the potential to become a significant supplier of Canadian energy and also an important and growing part of the Canadian economy.” Their announced challenge is “to align and coalesce the interests of multiple bioenergy initiatives in order to form a comprehensive Canadian strategy that will stimulate the development of an environmentally, economically and socially sustainable and viable bioenergy industry; an industry that supplies 10% of Canada’s energy needs by 2012 and 20% by 2020.” A bio-fuel industry promises many benefits. A listing of advantages of biofuels in a recent report produced by the Pembina Institute for Industry Canada (Taylor et al. 2005) lists several reasons why many are excited about the possibility of a bio-fuels industry. The report states that biofuels offer:
• Environmental improvements • Energy security • Economic diversification • Employment opportunities • Export market development • Rural economic development • Off-grid energy supply • Waste management • Development of value-added products • Human health improvements
The production of biofuel from agricultural and forestry sources has been considered for many years, particularly after the energy crisis of the 1970s. In spite of high prices of fuel derived from non-renewable sources during that period and again during the early 1990s, biofuel production has not proven to be broadly economically feasible without government support (Schneider and McCarl, 2003). Government and industry partnerships are therefore widely used to create the necessary conditions for promoting and managing the production and consumption of bio-energy (Janssen, 1999). Governments of many countries (including Canada’s) have been pursuing policies to promote and manage the production and consumption of energy from bio-mass. However, progress in Canada has been markedly slower than in many other countries. In 2004, Canada produced less than 2% of the ethanol produced in the United States and had less production than several developing countries including Thailand and Ukraine. Despite the many claimed advantages of a bio-fuel industry and the fact that Canada has such enormous bio-mass resources, it seems surprising the industry has developed so slowly in Canada. While the potential to produce energy from biomass is significant and technologically possible, it appears to offer insufficient financial rewards to encourage much private sector investment. Consequently, national governments have implemented programs designed to overcome economic challenges to foster growth in the bio-energy industry and to increase the market penetration of new technologies. Preliminary evidence suggests the rate of bio-energy production and consumption are highest in countries where governments have taken a pro-active role and forged strong ties with stakeholders in the renewable energy industry (Janssen, 1999; Taylor et al. 2005).

Walburger, A. 4/21/2006 9 of 63
1.1 Purpose and Objectives Federal and provincial governments in Canada are aware that public assistance of some kind may be necessary to stimulate development of a biofuels industry. Tax incentives, research assistance, procurement policies, and a creative and transparent legal framework must be set to kick-start the efforts of environmentalists, manufacturers, farmers and consumers to make ethanol an alternative to conventional fuel source for Canada (Islam et al. 2004). In the European Union, Brazil, the United States, and many other countries, alternative transportation fuels have been considered as renewable components in their national energy systems. The general motivations of governments have been to (1) meet national targets for the reduction of greenhouse gas emissions; (2) provide an independent, secure, diverse, sustainable and competitive energy supply; (3) stimulate the economic development of the agricultural industry and rural sector; and (4) assist renewable industries to become competitive in domestic and export markets (Mitchell and Connor, 2004, Goldemberg et al. 2004). Despite the lofty objectives, it is well known that budget constraints, political opposition, economic efficiency, social equity, environmental integrity and cross-sector balance are important concerns for governments. The purpose of this project is to review policies in the United States, Western Europe, and elsewhere designed to stimulate the production and consumption of biofuels. This study has three specific objectives. The first is to describe existing policies for promoting the production and consumption of biofuels in Canada – both federally and in the provinces. The second objective is to review available economic studies on the policies chosen to stimulate the production of biofuels in the United States, key countries in the European Union, and elsewhere. The third objective is to provide an assessment of the lessons learned from available economic research policies that could be used to further encourage development of biofuels in Canada. The international comparison identifies the strengths and weaknesses inherent in the various policies and suggests important aspects of these policies that ought to be considered by Canadian governments.

Walburger, A. 4/21/2006 10 of 63
2. Situation in Canada Commercial production of ethanol in Canada has grown slowly since it began in the 1970s in two small plants in Ontario and one larger facility in Quebec. As late as 1995, only 60 million litres per year were being produced in four plants. That increased to 238 million litres produced in six plants by 2000 (Table 1). The federal government and most provincial governments have policies that promote the production of ethanol.
Table 1: Canadian Ethanol Plant Capacities, 1976-2000 (million litres/year)
Company Location 1976 1980 1990 1995 2000
Ontario Paper Thorold, ON 4 4
St Lawrence Starch Mississauga, ON 15 15
Commercial Alcohols Varennes, QC 70 70 70
North West Kerrobert, SK 3 3
Mohawk Oil Minnedosa, MB 4 9 10 10
Commercial Alcohols Tiverton, ON 12 22 22
Tembec Enterprises Temiscaming, QC 18 18 18
Pound-Maker Agventures Lanigan, SK 10 12
API Grain Processing Red Deer, AB 26
Commercial Alcohols Chatham, ON 150
Total 89 96 112 60 238 Source: Cheminfo Services Inc. et al., 2000
2.1 Federal Government Policies The federal government in Canada sustains the development of the fuel ethanol industry through two main instruments: an excise gasoline tax exemption and an Ethanol Expansion Program (EEP). Additionally, the federal government provides an example with its eight E851 fuelling stations and approximately 800 flexi-fuel vehicles that can use up to 85% ethanol (Government of Canada 2003a). The federal excise gasoline tax of $0.10 per litre is not imposed on the portion of ethanol contained in gasohol. The Ethanol Expansion Program is part of the Climate Change Plan for Canada, which was created to meet the targets of the Kyoto Protocol. The Ethanol Expansion Program2 specifies a target for fuel ethanol consumption in Canada: at least 35% of the Canadian consumption of gasoline must be E103 by 2010 (mid-point of the 2008 –2012 period targeted by the Kyoto Protocol). To achieve this target, it is estimated that ethanol production must be increased more than five times to 1.33 billion litres per year by 2010 (from the existing 0.238 billion litres) (Canadian Renewable Fuels Association December 2002).
1 E85 refers to a blend of 85% ethanol and 15% gasoline. 2 The Ethanol Expansion Program includes the Future Fuels Initiative program, which includes the National Biomass Ethanol Program. 3 E10 refers to fuel blend of 10% ethanol, 90% gasoline.

Walburger, A. 4/21/2006 11 of 63
The Ethanol Expansion Program provides support on three fronts: $140 million for contingent loan guarantees, public awareness financing ($3 million for market information to consumers) and up to $118 million for the partial financing of fuel ethanol production facilities in Canada. The contingent loan guarantee program was created under the name of National Biomass Ethanol Program. Its purpose is to counter any reduction or elimination of the excise tax exemption if a future government were to make this change prior to December 31, 2014 (Farm Credit Canada 2003). In order to qualify for the loan guarantee, ethanol producers would have to experience a reduction in cash flow due to a change in the excise tax treatment. Loans would be made directly to lenders in order for ethanol manufacturers to be able to restructure their long-term debts. The contingent loans would be repayable at commercial rates of interest (Government of Canada 2001b). In addition to loan guarantees, the program adds $3 million over 5 years for a public outreach component. Its aim is to provide essential market information to consumers through such activities as public education on fuel ethanol, analysis of fuel ethanol markets and producer economics and liaison with provinces and industries interested in ethanol plant expansion (Government of Canada 2001a). The subsidies for fuel ethanol production capacities were offered in two rounds of funding for a total of $118 million over 3 years. The maximum amount payable to any applicant in all rounds of the program is $50 million and cannot represent more than 50% of the total project costs minus other federal, provincial/territorial and municipal governmental contributions. The eligibility criteria include a minimum new or expanded production capacity of 10 millions litres per year and the requirement to start production no more than 30 months after signing the contribution agreement. Contributions are repayable starting three years after the date of the final contribution payment and must end 10 years after the date of the final contribution payment (Government of Canada 2003b). 2.2 Provincial Government Policies A wide variety of types of policies (and the level of subsidies) prevails in the Canadian provinces. Most are inward-looking and were developed to respond to special economic conditions that prevail in specific provinces. For example, the governments of Manitoba and Saskatchewan have policies that promote the production of ethanol primarily as a potential boost to their rural economies. The government of Alberta has a lower level of subsidy, possibly because of the importance of its oil industry. British Columbia and New Brunswick are analyzing the commercial feasibility of cellulose-based ethanol production technology; the former because of its forest residues and the latter because of an agricultural base that is not sufficiently large to support an ethanol plant of the scale necessary for economic viability (Government of New Brunswick). Table 2 shows the provincial fuel tax exemptions for fuel ethanol by province.

Walburger, A. 4/21/2006 12 of 63
Table 2: Tax Exemptions for Fuel Ethanol in Canadian Provinces
Province Provincial Fuel Tax Exemptions for Ethanol (¢/litre)
Eligibility for the subsidy Duration
Alberta 9 No restriction on ethanol source.
5 years after the start-up of an ethanol production plant.
British Columbia 14.5
For E85 to E100 and E5 to E25. Ethanol must be produced in B.C.
Ontario 14.7
No restriction on ethanol source. Until 2010.
Saskatchewan 15
Ethanol must be produced and consumed in SK. 5 years.
Québec (under project)
up to 20 (up to 130% of the 15.2 ¢/litre gasoline tax)
Ethanol must be produced in QC. 1999 - 2012
Manitoba
20, until August 2007 15, Sept. 2007 – Aug. 2010 10, Sept. 2010 – Aug. 2013
(in addition, 1.5 ¢/l excise tax reduction for the gasoline blended with 10% Manitoba-made ethanol)
Ethanol must be produced and consumed in MB.
No duration specification.
Federal 10 - No duration specification.
Sources: Cheminfo Services Inc. et al. 2000, Government of Manitoba 2002b, 2003b, Government of Quebec 1996 and 1997, British Columbia Ministry of Provincial Revenue 2004.

Walburger, A. 4/21/2006 13 of 63
The heterogeneity of the provincial tax exemptions (amounts, eligibility and duration) represents an important barrier to inter-provincial trade. For example, Alberta’s single ethanol plant exports almost all its production to the U.S. because Saskatchewan’s tax exemption applies only to locally produced ethanol. On the other hand, Saskatchewan ethanol producers can sell their production in Alberta where the tax exemption does not impose any restriction on the source of the ethanol. Several provinces have specified targets for ethanol use. Targets have been set in Manitoba (E10 to represent 85% of total gasoline consumption in Manitoba by 2005) and Saskatchewan (fuel volumes to contain 7.5% by May 1st, 2006). Ontario also intends to impose a mandate; all gasoline sold in Ontario is to contain 5% ethanol by 2007, and 10% ethanol by 2010. Saskatchewan and Ontario have offered financial aid to investors in ethanol plants. The Ontario government assisted the Commercial Alcohols plant in Chatham with a $5 million taxpayer contribution.
2.2.1 Alberta
The Alberta Ministry of Agriculture, Food and Rural Development has maintained an ethanol policy since 1993. The policy guarantees that the exemption of provincial fuel tax payable on vehicle fuel will continue for a period of 5 years after the start-up of an ethanol production plant. The exemption is currently 9 ¢/litre of ethanol sold in the province. A revision of the policy was considered in 2000 but no modifications were made (Cheminfo Services Inc. et al. 2000).
2.2.2 Ontario Since 1980, Ontario has provided an exemption from its road and usage tax on gasoline for the ethanol portion of ethanol-blended fuels sold in the province. The current value of the exemption is 14.7 cents per litre of ethanol (Seaway Valley Farmers Energy Co-operative Inc.). In October of 1994, the provincial government announced it would offer assistance through project-specific agreements with ethanol producers that used renewable feedstock. This guarantees that the financial benefit of the 14.7 cents per litre exemption to producers will remain until 2010, even if the tax structure is changed by administrative or legislative action in the interim (Seaway Valley Farmers Energy Co-operative Inc.). Two other governmental initiatives for sustaining the domestic ethanol industry are the $5 million grant to Commercial Alcohols Inc. for building its Chatham plant and the use of ethanol blends in the governmental vehicle fleets (Government of Ontario 2002).
2.2.3 Saskatchewan From 1991 to 1993 the government of Saskatchewan provided a 40 cent per litre subsidy to the Lanigan ethanol plant owned by Pound-Maker Agventures Ltd. (Freeze and Peters 1999). In March 2000 the Saskatchewan government reinstated an exemption of 15 ¢/litre for ethanol blended with gasoline (such an exemption had existed in the early 1990s, but was phased out in the 1994/95 period). The Saskatchewan government announced in March 2002 a plan to develop a much larger ethanol industry in the province (Government of Saskatchewan 2002a). The plan is called Greenprint for Ethanol Production in Saskatchewan (Government of Saskatchewan 2002b). One component of the plan is the Ethanol Fuel Act established in 2002 and modified in 2004. This Act sets a target that fuel volumes contain 1% ethanol commencing on November 1, 2005 and ending on April 30, 2006, and 7.5% ethanol by May 1st, 2006 (Government of Saskatchewan 2005). A second part of the plan is the obligation for distributors to buy at least 30% of their ethanol from plants that produce 25 million litres per year or less (Briere 2002). The government of Saskatchewan previously had set a target of having 7.5% ethanol by 2005. However, this depended on construction of three new ethanol plants to supply the fuel. The government had entered into negotiations with Broe Company of Denver to build the three new ethanol plants, each with projected costs of $55 million each and 80 million litres/year capacity. It was announced that the publicly owned Crown Investments Corp would invest 40% of the cost and Broe Companies would invest the remaining 60%. However, none of the three plants has been built yet because Broe has had difficulty securing its financing. Therefore, the ethanol target of 7.5% was deferred to May 2006 and it appears that the target may have to be deferred further into the future. The government of Saskatchewan planned to finance 40% of the investment costs for three plants, each of which was projected to produce 80 million litres per year. Unfortunately, the private firms have

Walburger, A. 4/21/2006 14 of 63
not yet proceeded with construction, thus delaying the provincial government’s plans to reach its target of ethanol production and use. 2.2.4 Québec The tax policy for sustaining ethanol industry in Québec has not yet been established. The Fuel Tax Act calls for a reduction on tax on gasohol blends but is vague on the conditions attached. Québec’s Minister of Finance announced in 1996 that the reduction in the fuel tax for ethanol could reach 130% of the gasoline tax (Government of Québec 1996). One reason for such a high tax exemption is the competition with the ethanol produced in Ontario. While Québec applies the provincial sales tax to fuels, Ontario does not. This creates a price advantage for ethanol that is produced in Ontario and the 130% fuel tax exemption projected for ethanol produced in Québec tries to eliminate the difference. One year after the announcement of the projected fuel tax exemption, it was announced that the period during which it would be effective was January 1, 1999 – March 31, 2012 (Government of Québec 1997). But all these announcements were contingent on the construction of a large ethanol plant in Varennes. Because the construction was delayed, ratification of the precise regulations concerning the reduction of fuel tax for ethanol was deferred. With the new funds obtained from the federal government’ ethanol expansion program, the ethanol plant in Varennes should soon start construction and consequently, the tax policy for ethanol in Québec should be clarified.
2.2.4 Manitoba In December 2003, the Government of Manitoba passed The Biofuels and Gasoline Tax Amendment Act. The Act establishes a mandate for ethanol use in the province such that 85% of all gasoline sold must contain 10% ethanol by September 2005. The Act also outlines a gasoline tax reduction for gasohol (E10) of $0.02 per litre of gasohol until August 31, 2007, reduced to $0.015 per litre of gasohol for the next three years and to $0.01 per litre of gasohol for the following three years (Government of Manitoba 2003b). As in the case of Saskatchewan, the Manitoba subsidy is available only for ethanol that is produced and consumed in the province. As a result, an ethanol producer in Manitoba that is not engaged in the distribution or retail of gasohol does not qualify for the tax preference (Manness et al. 2002). The Manitoba ethanol program also provides a declining tax preference averaging approximately $0.015/litre of gasoline that is blended with 10% Manitoba-made ethanol. This component of the program is scheduled to end in 2013 (Government of Manitoba 2003a). Despite having the most generous incentive in the industry, the Manitoba ethanol industry has not changed for over two decades. However, the government of Manitoba states that since the announcement of an ethanol mandate in the 2002 Budget, there has been renewed interest by the oil industry and ethanol producers from across North America in building ethanol plants in Manitoba (Manness et al. 2002).

Walburger, A. 4/21/2006 15 of 63
3. Situation in Other Countries Many governments outside Canada are implementing policies to encourage the use of biomass and outputs from agricultural processes to produce biofuel. These policies have a variety of objectives: reducing greenhouse gas emissions, improving air and water quality by reducing toxins and criteria air pollutants, reusing waste materials, creating revenue for primary producers, and increasing energy security. As a result, global demand is expanding for fuels derived from corn, sugarcane, and soybeans, or from biomass resources such as agricultural, wood, animal, and municipal wastes and residues. Ethanol and biodiesel have become the predominant biofuels because both can be substituted economically for gasoline and diesel or they can be blended with them. The objective of this section is to describe the market for ethanol and biodiesel in selected geo-political regions and the policies governing its production and consumption. This relates to the purpose of the paper by placing the situation in Canada in context and to help understand the consequences of similar or alternative policies in other geo-political jurisdictions. 3.1 Brazil Table 1 reveals that Brazil produces more ethanol than does any other country in the world. More than 300 ethanol plants are located in Brazil and together they have a combined annual capacity of 14 billion litres (Le Soleil, August 13, 2003). Ethanol production in Brazil has expanded since the 1970s in response to government policies to reduce, and even to avoid, oil import dependency. According to Luiz Carlos Correa Carvahlo, the director of Canaplan, a large manufacturer of ethanol, the Brazilian ethanol industry is no longer subsidised. The main feedstock used to produce ethanol in Brazil is sugarcane. An intended consequence of government policy is that many fuel consumers in Brazil choose ethanol for their vehicles. In a special report on ethanol, Briere (2003) noted that more than 3 million vehicles a day run on pure ethanol in Brazil.

Walburger, A. 4/21/2006 16 of 63
Table 3: Annual World Ethanol Production, by Country (millions of litres) Country 2004 Brazil 15,100 U.S. 13,381 China 3,649 India 1,749 France 829 Russia 750 South Africa 416 U.K. 401 Saudi Arabia 299 Spain 299 Thailand 280 Germany 269 Ukraine 250 Canada 231 Poland 201 Indonesia 167 Argentina 159 Italy 151 Australia 125 Japan 117 Pakistan 98 Sweden 98 Philippines 83 South Korea 83 Guatemala 64 Cuba 61 Ecuador 45 Mexico 34 Nicaragua 30 Mauritius 23 Zimbabwe 23 Kenya 11 Swaziland 11 Others 1,279 Total 40,769 Source: F.O. Lichts
Walburger, A. 4/21/2006 17 of 63
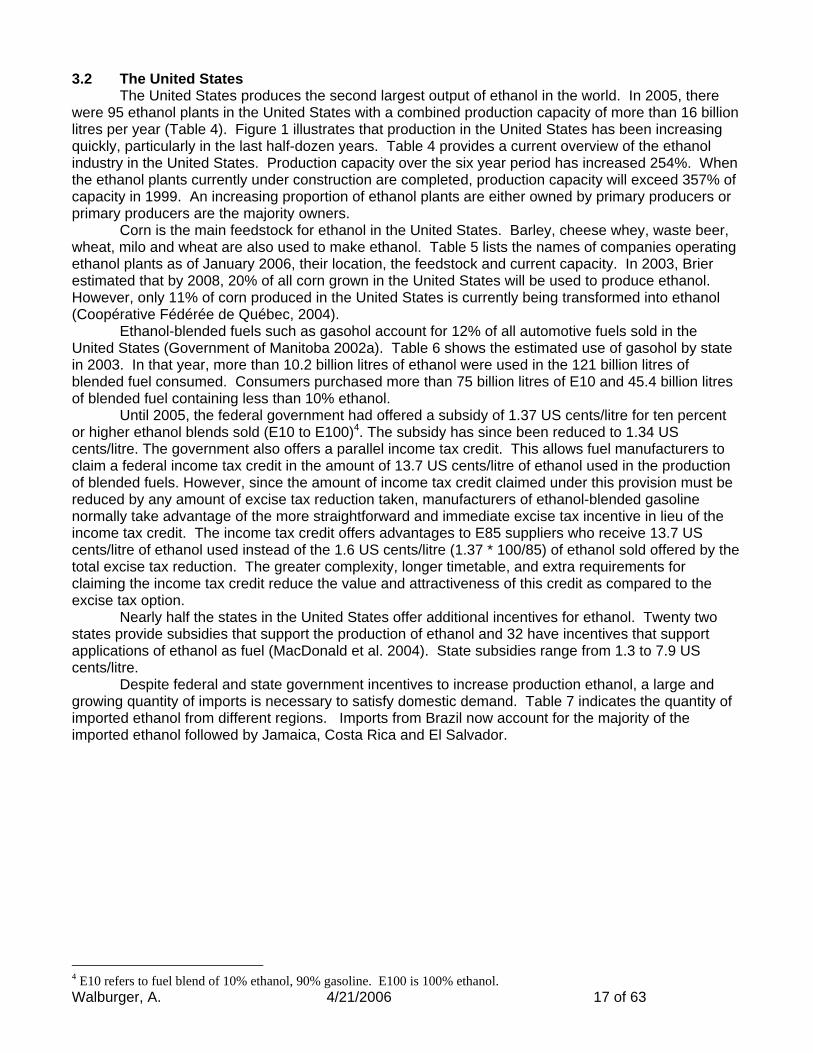
3.2 The United States The United States produces the second largest output of ethanol in the world. In 2005, there were 95 ethanol plants in the United States with a combined production capacity of more than 16 billion litres per year (Table 4). Figure 1 illustrates that production in the United States has been increasing quickly, particularly in the last half-dozen years. Table 4 provides a current overview of the ethanol industry in the United States. Production capacity over the six year period has increased 254%. When the ethanol plants currently under construction are completed, production capacity will exceed 357% of capacity in 1999. An increasing proportion of ethanol plants are either owned by primary producers or primary producers are the majority owners. Corn is the main feedstock for ethanol in the United States. Barley, cheese whey, waste beer, wheat, milo and wheat are also used to make ethanol. Table 5 lists the names of companies operating ethanol plants as of January 2006, their location, the feedstock and current capacity. In 2003, Brier estimated that by 2008, 20% of all corn grown in the United States will be used to produce ethanol. However, only 11% of corn produced in the United States is currently being transformed into ethanol (Coopérative Fédérée de Québec, 2004). Ethanol-blended fuels such as gasohol account for 12% of all automotive fuels sold in the United States (Government of Manitoba 2002a). Table 6 shows the estimated use of gasohol by state in 2003. In that year, more than 10.2 billion litres of ethanol were used in the 121 billion litres of blended fuel consumed. Consumers purchased more than 75 billion litres of E10 and 45.4 billion litres of blended fuel containing less than 10% ethanol. Until 2005, the federal government had offered a subsidy of 1.37 US cents/litre for ten percent or higher ethanol blends sold (E10 to E100)4. The subsidy has since been reduced to 1.34 US cents/litre. The government also offers a parallel income tax credit. This allows fuel manufacturers to claim a federal income tax credit in the amount of 13.7 US cents/litre of ethanol used in the production of blended fuels. However, since the amount of income tax credit claimed under this provision must be reduced by any amount of excise tax reduction taken, manufacturers of ethanol-blended gasoline normally take advantage of the more straightforward and immediate excise tax incentive in lieu of the income tax credit. The income tax credit offers advantages to E85 suppliers who receive 13.7 US cents/litre of ethanol used instead of the 1.6 US cents/litre (1.37 * 100/85) of ethanol sold offered by the total excise tax reduction. The greater complexity, longer timetable, and extra requirements for claiming the income tax credit reduce the value and attractiveness of this credit as compared to the excise tax option. Nearly half the states in the United States offer additional incentives for ethanol. Twenty two states provide subsidies that support the production of ethanol and 32 have incentives that support applications of ethanol as fuel (MacDonald et al. 2004). State subsidies range from 1.3 to 7.9 US cents/litre. Despite federal and state government incentives to increase production ethanol, a large and growing quantity of imports is necessary to satisfy domestic demand. Table 7 indicates the quantity of imported ethanol from different regions. Imports from Brazil now account for the majority of the imported ethanol followed by Jamaica, Costa Rica and El Salvador.
4 E10 refers to fuel blend of 10% ethanol, 90% gasoline. E100 is 100% ethanol.

Figure 1: Fuel Ethanol Production in the United States, 1980-2005
16,000
14,000
12,000
Mill
ion
Litr
es
10,000
8,000
6,000
4,000
2,000
- 1 1 1 1 1 1 1 1 1 1 1 1 1 1 1 1 1 1 1 1 2 2 2 2 2 29 9 9 9 9 9 9 9 9 9 9 9 9 9 9 9 9 9 9 9 0 0 0 0 0 08 8 8 8 8 8 8 8 8 8 9 9 9 9 9 9 9 9 9 9 0 0 0 0 0 00 1 2 3 4 5 6 7 8 9 0 1 2 3 4 5 6 7 8 9 0 1 2 3 4 5
Year
Walburger, A. 4/21/2006 18 of 63

Walburger, A. 4/21/2006 19 of 63
Table 4: Ethanol Industry Overview
Year January 1999
January 2000
January 2001
January 2002
January 2003
January 2004
January 2005 present
Total Ethanol Plants 50 54 56 61 68 72 81 95
Ethanol Production Capacity
6441.6 mly
6619.5 mly
7275.2 mly
8885.5 mly
10246.4 mly
11737.8 mly
13792.9 mly
16415.1Mly
Plants Under Construction 5 6 5 13 11 15 16 31
Capacity Under Construction 291.5 mly 346.4 mly 244.9 mly 1479 mly 1828.4
mly 2263.7 mly
2854.2 mly
6598 mly
Farmer Owned Plants 14 18 21 25 28 33 40 46
Farmer Owned Capacity
1110.3 mly
1288.2 m;y
1790.5 m;y
2443.9 m;y
3015.5 m;y
3941.0 m;y
5256.4 m;y
6348.5 Mly
percent of Total Cap Farmer 17% 19% 25% 28% 29% 34% 38% 39%
Farmer Owned UC Plants 5 3 3 10 8 12 10 5
Farmer Owned UC Capacity 291.5 mly 227.1 mly 227.1 mly 1268.1
mly 1203.8 mly
1692.1 mly
1703.4 mly
1200 mly
% of Total UC Capacity 100% 66% 71% 86% 66% 75% 60% 18%
States with Ethanol Plants 17 17 18 19 20 19 18 20

Walburger, A. 4/21/2006 20 of 63
Table 5: U.S. Fuel Ethanol Industry Plants and Production Capacity
Company Location Feedstock
Current Capacity (mmly)
Under Construction/ Expansions (mmly)
York, NE Corn/milo 208 Colwich, KS 95 Portales, NM 114
Abengoa Bioenergy Corp.
Ravenna, NE 333 ACE Ethanol, LLC Stanley, WI Corn 148 Adkins Energy, LLC* Lena, IL Corn 151 Advanced Bioenergy Fairmont, NE Corn 379 AGP* Hastings, NE Corn 197 Agra Resources Coop. d.b.a. EXOL*
Albert Lea, MN Corn 151 30
Agri-Energy, LLC* Luverne, MN Corn 79 Alchem Ltd. LLLP Grafton, ND Corn 40 Al-Corn Clean Fuel* Claremont, MN Corn 132 Amaizing Energy, LLC* Denison, IA Corn 151
Decatur, IL Corn 4,050 Cedar Rapids, IA Corn Clinton, IA Corn Columbus, NE Corn Marshall, MN Corn Peoria, IL Corn
Archer Daniels Midland
Wallhalla, ND Corn/barley Albion, NE Corn 379 ASAlliances Biofuels, LLC Linden, IN Corn 379 Pekin, IL Corn 379 216 Aventine Renewable Energy, LLC Aurora, NE Corn 189
Badger State Ethanol, LLC* Monroe, WI Corn 182 Big River Resources, LLC* West Burlington, IA Corn 151 Broin Enterprises, Inc. Scotland, SD Corn 34 Bushmills Ethanol, Inc.* Atwater, MN Corn 151
Blair, NE Corn 322 Cargill, Inc.Eddyville, IA Corn 132
Central Indiana Ethanol, LLC Marion, IN Corn 151 Central MN Ethanol Coop* Little Falls, MN Corn 81 Central Wisconsin Alcohol Plover, WI Seed corn 15 Chief Ethanol Hastings, NE Corn 235 Chippewa Valley Ethanol Co.* Benson, MN Corn 170 Commonwealth Agri-Energy, LLC* Hopkinsville, KY Corn 91 34 Corn, LP* Goldfield, IA Corn 189

Walburger, A. 4/21/2006 21 of 63
Cornhusker Energy Lexington, LLC
Lexington, NE Corn 151
Corn Plus, LLP* Winnebago, MN Corn 167 Dakota Ethanol, LLC* Wentworth, SD Corn 189 DENCO, LLC* Morris, MN Corn 81 E3 Biofuels Mead, NE Corn 91 East Kansas Agri-Energy, LLC* Garnett, KS Corn 132 ESE Alcohol Inc. Leoti, KS Seed corn 6 Ethanol2000, LLP* Bingham Lake, MN Corn 121 Frontier Ethanol, LLC Gowrie, IA Corn 227 Front Range Energy, LLC Windsor, CO Corn 151 Glacial Lakes Energy, LLC* Watertown, SD Corn 189 Golden Cheese Company of California*
Corona, CA Cheese whey
19
Golden Grain Energy, LLC* Mason City, IA Corn 151 Golden Triangle Energy, LLC* Craig, MO Corn 76 Grain Processing Corp. Muscatine, IA Corn 76 Granite Falls Energy, LLC Granite Falls, MN Corn 170 Great Plains Ethanol, LLC* Chancellor, SD Corn 189 Green Plains Renewable Energy Shenandoah, IA Corn 189
Iowa Falls, IA Corn 189 189 Hawkeye Renewables, LLCFairbank, IA Corn 379
Heartland Corn Products* Winthrop, MN Corn 136 Aberdeen, SD Corn 34 Heartland Grain Fuels, LP*Huron, SD Corn 45 68
Heron Lake BioEnergy, LLC Heron Lake, MN Corn 189 Horizon Ethanol, LLC Jewell, IA Corn 227 Husker Ag, LLC* Plainview, NE Corn 100 Illinois River Energy, LLC Rochelle, IL Corn 189 Iowa Ethanol, LLC* Hanlontown, IA Corn 189 Iroquois Bio-Energy Company, LLC
Rensselaer, IN Corn 151
James Valley Ethanol, LLC Groton, SD Corn 189 KAAPA Ethanol, LLC* Minden, NE Corn 151 Land O' Lakes* Melrose, MN Cheese
whey 10
Lincolnland Agri-Energy, LLC* Palestine, IL Corn 182 Lincolnway Energy, LLC* Nevada, IA Corn 189 Liquid Resources of Ohio Medina, OH Waste
Beverage 11
Little Sioux Corn Processors, LP* Marcus, IA Corn 197 Merrick/Coors Golden, CO Waste beer 6 6 MGP Ingredients, Inc. Pekin, IL Corn/wheat
starch 295

Walburger, A. 4/21/2006 22 of 63
Atchison, KS Michigan Ethanol, LLC Caro, MI Corn 189 Mid America Agri Products/Wheatland
Madrid, NE Corn 167
Mid-Missouri Energy, Inc.* Malta Bend, MO Corn 170 Lakota, IA Corn 189 170 Midwest Grain Processors*Riga, MI Corn 216
Midwest Renewable Energy, LLC Sutherland, NE Corn 66 17Minnesota Energy* Buffalo Lake, MN Corn 68 Missouri Ethanol Laddonia, MO Corn 170 New Energy Corp. South Bend, IN Corn 386 North Country Ethanol, LLC* Rosholt, SD Corn 76 Northeast Missouri Grain, LLC* Macon, MO Corn 170 Northern Lights Ethanol, LLC* Big Stone City, SD Corn 189 Northstar Ethanol, LLC Lake Crystal, MN Corn 197 Otter Creek Ethanol, LLC* Ashton, IA Corn 208 Pacific Ethanol Madera, CA Corn 132 Panhandle Energies of Dumas, LP
Dumas, TX Corn/Grain Sorghum
114
Louisville, KY Beverage waste
20 Parallel Products
R. Cucamonga, CA Permeate Refining Hopkinton, IA Sugars &
starches 6
Phoenix Biofuels Goshen, CA Corn 95 Pine Lake Corn Processors, LLC* Steamboat Rock, IA Corn 76 Platte Valley Fuel Ethanol, LLC Central City, NE Corn 151 Prairie Ethanol, LLC Loomis, SD Corn 227 Prairie Horizon Agri-Energy, LLC Phillipsburg, KS Corn 151 Pro-Corn, LLC* Preston, MN Corn 159 Quad-County Corn Processors* Galva, IA Corn 102 Red Trail Energy, LLC Richardton, ND Corn 189 Redfield Energy, LLC Redfield, SD Corn 189 Reeve Agri-Energy Garden City, KS Corn/milo 45 Siouxland Energy & Livestock Coop*
Sioux Center, IA Corn 95
Siouxland Ethanol, LLC Jackson, NE Corn 189 Sioux River Ethanol, LLC* Hudson, SD Corn 208 Sterling Ethanol, LLC Sterling, CO Corn 159 Tall Corn Ethanol, LLC* Coon Rapids, IA Corn 185 Tate & Lyle Loudon, TN Corn 254 The Andersons Albion Ethanol LLC
Albion, MI Corn 208
Trenton Agri Products, LLC Trenton, NE Corn 132 38

Walburger, A. 4/21/2006 23 of 63
United WI Grain Producers, LLC* Friesland, WI Corn 185 Albert City, IA Corn 379 US BioEnergy Corp.Lake Odessa, MI Corn 170
U.S. Energy Partners, LLC Russell, KS Milo/wheat starch
182
Utica Energy, LLC Oshkosh, WI Corn 182 Val-E Ethanol, LLC Ord, NE Corn 170
Aurora, SD Corn 871 VeraSun Energy CorporationFt. Dodge, IA Corn
Voyager Ethanol, LLC* Emmetsburg, IA Corn 197 Western Plains Energy, LLC* Campus, KS Corn 170 Western Wisconsin Renewable Energy, LLC*
Boyceville, WI Corn 151
Wind Gap Farms Baconton, GA Brewery waste
2
Wyoming Ethanol Torrington, WY Corn 19 Xethanol BioFuels, LLC Blairstown, IA Corn 19 Total Current Capacity 16415 Total Under Construction/Expansions
7499
Total Capacity 23914 * farmer-owned Updated: January 2006

Walburger, A. 4/21/2006 24 of 63
Table 6: Estimated Use of Gasohol, by State, 2003 1/
NOVEMBER 2004
(THOUSANDS OF LITRES) Table MF-33E
GASOHOL
STATE TOTAL ETHANOL USED IN GASOHOL 2/ 10-PERCENT
GASOHOL 3/LESS THAN 10-PERCENT GASOHOL 4/
TOTAL
Alabama 56,728 567,267 - 567,267 Alaska 9,971 - 141,889 141,889 Arizona 49,286 436,382 80,364 516,747 Arkansas - - - - California 2,228,635 - 39,098,828 39,098,828 Colorado 314,076 3,140,753 - 3,140,753 Connecticut 77,518 775,158 - 775,158 Delaware - - - - Dist. of Col. - - - - Florida - - - - Georgia - - - - Hawaii - - - - Idaho - - - - Illinois 1,457,588 14,550,696 35,863 14,586,563 Indiana 496,430 4,546,204 709,034 5,255,238 Iowa 395,163 3,951,629 - 3,951,629 Kansas 154,521 1,545,190 - 1,545,190 Kentucky 217,601 2,116,950 93,344 2,210,294 Louisiana 176,900 1,768,984 - 1,768,984 Maine - - - - Maryland 874 8,729 - 8,729 Massachusetts 3,244 20,456 18,723 39,183 Michigan 573,180 5,731,788 - 5,731,788 Minnesota 1,041,783 10,417,817 - 10,417,817 Mississippi - - - - Missouri 334,100 2,322,293 1,777,645 4,099,942 Montana 4,648 - 66,139 66,139 Nebraska 140,647 1,406,481 - 1,406,481 Nevada 159,377 1,423,799 241,888 1,665,687 New Hampshire - - - - New Jersey 3,997 31,722 14,483 46,205 New Mexico 22,815 - 324,694 324,694 New York 84,945 849,446 - 849,446 North Carolina 325,288 3,252,865 - 3,252,865

Walburger, A. 4/21/2006 25 of 63
NOVEMBER 2004
(THOUSANDS OF LITRES) Table MF-33E
GASOHOL
STATE TOTAL ETHANOL USED IN GASOHOL 2/ 10-PERCENT
GASOHOL 3/LESS THAN 10-PERCENT GASOHOL 4/
TOTAL
North Dakota 42,143 421,434 - 421,434 Ohio 695,463 6,954,619 - 6,954,619 Oklahoma - - - - Oregon 98,239 - 1,398,108 1,398,108 Pennsylvania 25,260 164,355 154,823 319,178 Rhode Island 5/ 1,738 17,360 - 17,360 South Carolina - - - - South Dakota 90,517 905,160 - 905,160 Tennessee - - - - Texas 86,777 - 1,234,964 1,234,964 Utah 11,845 - 168,564 168,564 Vermont - - - - Virginia 301,792 3,017,905 - 3,017,905 Washington 250,874 2,508,748 - 2,508,748 West Virginia 63,531 635,313 - 635,313 Wisconsin 408,359 4,083,600 - 4,083,600 Wyoming - - - - Total 10,405,853 77,573,103 45,559,353 123,132,469
1/ This table shows Federal Highway Administration estimates of gasohol use. The gasohol volumes shown include both the ethanol and the gasoline components. The Energy Policy Act of 1992 expanded the definition of gasohol effective January 1, 1993. Prior to the Act, gasohol was defined as a blend of gasoline and at least 10%, by volume, fuel alcohol. Under the Act, three types of gasohol were defined: (1) 10-percent gasohol, which corresponds to the definition before the Act; (2) 7.7-percent gasohol, which contains at least 7.7% alcohol but less than 10%; and (3) 5.7-percent gasohol which contains at least 5.7% alcohol but less than 7.7%.
2/ The amount of ethanol used in gasohol is estimated from gasohol tax collections, refunds, and credits reported by the Internal Revenue Service, U.S. Department of the Treasury.
3/ For most States, the figures shown for 10-percent blends are State data.
4/ 7.7-percent gasohol is generally used to meet the requirements for oxygenated fuel to reduce winter carbon monoxide
5/ Rhode Island's estimate is based on 2002 data.

Walburger, A. 4/21/2006 26 of 63
Table 7: U.S. Fuel Ethanol Imports, by Country (millions of litres)
Country 2002 2003 2004 Brazil 0 0 341.8 Costa Rica 45.4 55.6 96.1 El Salvador 17 26.1 21.6 Jamaica 109.8 148.8 138.5 Total 172.2 230.5 598

Walburger, A. 4/21/2006 27 of 63
3.3 European Union According to Cheminfo Services Inc (2000), annual production capacity of ethanol in Western Europe in 2000 was 200 million litres. Of that quantity, 5% was for motor fuel and 95% was for industrial purposes. By 2004 production capacity had increased to 536 million litres. Table 8 reveals that almost half of this capacity is located in Spain. Significant quantities of ethanol are also produced in France, Sweden, Poland and Germany.
Spain Of the ethanol and ethyl tertiary butyl ether5 in Europe, most is produced in Spain. While ethanol is produced in many regions outside Spain, the only other region within the European Union where ethyl tertiary butyl ether is produced is in France. In 2000, almost 80,000 tonnes of ethanol and 170,000 tonnes of ethyl tertiary butyl ether were produced in Spain. The crops used for biofuel production were grown on 43,500 hectares of land, of which 36,000 hectares were used for grain. The remaining 7,500 hectares were used mainly for growing sunflower. The production and consumption of biofuels in Spain is governed by national and regional policies. Commercial biofuel manufacturers face little in the way of government restrictions or subsidization. However, there is a fiscal measure that guarantees a state deduction of 10% for investments made in new tangible fixed assets that are intended for the use of renewable energy sources. Agricultural materials, forestry or oils used for transformation into biofuels (ethanol or biodiesel) are among the investments which qualify for this deduction. The development of biofuels is also influenced by a reduced excise duty. Another incentive on a national level for the production of biofuels is found within the framework of the Spanish Energy Saving and Efficiency Plan. Subsidies are available for projects concerning fuel production from forestry, agriculture and industry residues. The subsidy rate on these activities is 30% of eligible costs. Finally, there is a loan interest discount for renewable energy and energy efficiency projects. The projects can be financed up to 70% with reduction of five percentage points below market interest rates. Biofuels projects qualify for this discount as well. On October 9, 2005, the Spanish Institute for Energy Diversification and Saving announced a transfer of $60.6 million to the second largest biodiesel plant in Spain. The construction works on the plant in Martorell, in northeastern Catalonia region, are scheduled to start in 2006. The new plant will have a capacity to produce annually 100,000 tonnes of biodiesel from vegetable seeds like rape and sunflower seeds. Forty percent of the biodiesel made in the plant will be allocated to the urban transport companies in Catalonia and the rest will be sold to oil and gas companies like Repsol, Cepsa and British Petroleum, which currently sell biodiesel in some of their retail stations. Methyl ester is produced in Spain using waste vegetable oils, and is consumed in the transport sector by mixing it with automotive petrol. In 2003 approximately 152,000 tonnes bioethanol was produced and used as bio-ethyl tertiary butyl ether. The amount of biodiesel used in 2003 was 65,810 t. The total share of biofuels in the transport sector in 2003 was 1.09%. The Spanish government set a national target of 2% biofuel use by 2005. Since 2002 Spain has a complete exemption of excise duty for biofuels, which is valid until 2012. However, if the comparative trend in the production costs of petroleum products and biofuels so warrants, this may be replaced with a positive rate of tax. In both Spain and France ethanol-derived ethyl tertiary butyl ether is encouraged by payments related to the use of agricultural "set-aside" lands that are used to produce biomass feedstocks.
5 Ethyl tertiary butyl ether is an oxygenated fuel that can be blended with gasoline to make it burn more cleanly and thus improve overall air quality. It is produced by mixing ethanol and isobutylene and reacting them with heat over a catalyst. The potential for significantly increased ethanol use in the future may be in its application as a feedstock for ethyl tertiary butyl ether.

Walburger, A. 4/21/2006 28 of 63
Table 8: Production of Ethanol in the EU, 2004
Country Million litres Tonnes
Spain 254 202,354
France 102 80,887
Sweden ¹ 71 56,529
Poland 48 38,270
Germany 25 20,000
Netherlands 14 11,146
Latvia 12 9,800
Total 526 418,986
¹ In the case of Sweden 30% of the volume originates from wine alcohol. The upgrading of the wine alcohol to fuel quality happens only partially in Sweden. Sources: Member State reports to the European Commission, industry, eBIO

Walburger, A. 4/21/2006 29 of 63
Germany
Germany is both the largest producer and consumer of biodiesel in Europe. The fuel is produced from rapeseed and it is used as B100. As of 2003, there were 19 biodiesel plants in Germany with a total annual capacity of 936,000 tonnes and five additional plants under construction to produce a further 173,000 tonnes per year. There are 11.1 million hectares of arable land in Germany. Of this area, about ten percent is set aside land that producers are paid not to grow crops for food. However, growers can produce crops on the set aside acreage for the production of fibre or fuel. The most common feedstock for biodiesel is rapeseed oil because it is the only type of biodiesel covered under warrantee by German car manufacturers. This means that growing rapeseed for biodiesel production is a lucrative activity in Germany, about 350,000 hectares is used for this purpose and is processed into 500,000 tonnes of biodiesel. The remaining biodiesel production comes from the rapeseed diverted from the food market, soybean oils, sunflower oil or recycled cooking oils. B100 has a 100% tax exemption in Germany. The resulting C$0.70 per litre advantage relative to conventional diesel makes biodiesel an attractive choice for consumers. The combination of low feedstock prices, the tax incentive and high prices for diesel produced by conventional means imply that biodiesel typically sells at a discount. The difference in relative prices is a key motivation for the growth of biodiesel production and consumption in Germany. B100 is sold at more than 1500 services stations, most which are independently owned and operated. While private sales of biodiesel account for one-third of biodiesel consumed, government fleet vehicles account for the other two-thirds. Ethanol is still a nascent industry in Germany. Three ethanol plants under construction were scheduled to be completed and operating by 2005 with a combined annual capacity of 500,000 tonnes. Two plants of the three plants use rye as the feedstock. The other uses wheat. In constrast to the situation in Brazil, almost none of the personal vehicles in Germany can drive on 100% ethanol.
France France is the second largest producer of biodiesel in the European Union after Germany and the second largest producer of ethanol after Spain. In France, biodiesel is manufactured from rapeseed while ethanol is obtained from sugarbeets and wheat. As is the case in other regions, ethanol is not used directly in gasoline, but is blended to produce ethyl tertio-butyl ester which is then added to gasoline. As in Germany, commodities used in the manufacture of biofuels in France are grown on set-aside land. While biofuel production developed rapidly in France during the early 1990s, the growth in production capacity has since slowed down. Current policy measures addressing the biofuels market have been mainly targeted at biofuel producers. These measures typically involve reducing the cost differential with fossil fuels through the excise duty exemption. To control the impact to the central government’s budget, the volumes of biofuels produced are monitored through an accreditation system. France has a quota system in place for biodiesel production. Thus, a plant needs to have a governmental agreement for a maximum volume of biodiesel. In return, the biodiesel producer benefits from preferential tax treatment. In 2002, there was a total of 317,500 tonnes of vegetable oil methyl ester approved by the central government to be produced annually under reduced taxation. As the quantity supplied exceeded this amount, only a portion of the 365,000 tonnes produced was eligible for reduced taxation. The leading producer of biodiesel in France is Diester Industrie. Diester owns the largest biodiesel plant in Europe with an annual capacity of 250,000 tonnes and a second smaller plant with an annual capacity of 60,000 tonnes. Three additional, small plants are eligible to receive preferential tax treatment. One acre of rapeseed produces roughly 1.2 tonnes of vegetable oil methyl ester. At present, two-thirds of the ethanol in France is derived from sugar beets. The rest is manufactured using wheat. These proportions vary over time in response to changes in relative prices and the returns generated from the sales of by-products. There is no marketable by-product from the ethanol production with sugar beets, while animal feed pellets are made from ethanol production from wheat. One hectare of sugar beets yields 5.8 tonnes of ethanol. In comparison, one hectare of wheat can produce 2.5 tonnes of ethanol.

Walburger, A. 4/21/2006 30 of 63
Biofuels currently represent 1% of total fuel consumption in France. However, biodiesel and ethanol consumption are not increasing at the same rate. Sixty three percent of private vehicles in France use diesel, and 37% use gasoline. This situation creates a large problem for French oil refiners as the refining process creates both gasoline and diesel. Since the demand for diesel is greater, gasoline is exported and diesel imported. Fuel retailers in France therefore do like to blend ethanol in gasoline as it increases costs and the quantity supplied of a product that is exported. However blending vegetable oil methyl ester with diesel reduces the quantity of imports needed to satisfy consumers. Vegetable oil methyl ester is blended with diesel at the rate of five percent with no specific label at the pump, and at a higher rate for government fleet vehicles. Ethyl tertiary butyl ether is blended up to 15 % in gasoline. In France, biofuels are not price competitive with fossil fuels. Therefore, to encourage production and consumption, the central government has implemented significant tax reductions on these products. From 1992 to 2002, vegetable oil methyl ester and ethanol received tax rebates of €35.06 ($50.08) per hectoliter €50.23 ($71.75) per hectoliter, respectively. The tax reductions have since been reduced to €35 ($50) per hectoliter for vegetable oil methyl ester and €38 ($54.28) per hectoliter for ethanol. The French Ministry of Agriculture considers that biofuel production important because these new markets for farmers increase farm income, have a positive impact on land management, creates jobs, and reduces its deficit in protein meals for animal feed. The futures opportunities for ethanol in France include direct blending with gasoline, as is currently done in Sweden. This would require modifying fuel volatility norms within the European Union or grants an exemption for blended gasoline. Another boost for ethanol would be a larger tax differential with higher taxes for conventionally produced fuels, especially diesel. Such a policy would motivate some consumers to switch to gasoline cars. 3.4 Other Regions Italy has the third largest biodiesel production capacity in Europe. Like France, it has used a quota system. Biodiesel production quotas have increased from 125,000 tonnes to 300,000 tonnes. More than two-thirds of the feedstock used to produce biodiesel in Italy has been imported rapeseed oil from France and Germany. Domestic oil is used for only a small proportion of total production, most of which is derived from sunflowers. Unlike Germany or France, the biodiesel produced in Italy is used not for transportation for home heating in the domestic market. Conventionally produced heating oil is taxed at $0.87 per litre while biodiesel is tax exempt. Biodiesel is produced in other European countries, but production capacities and consumption are less than in Germany, France and Italy. As of 2003, production capacity in the Czech Republic, Denmark, Austria, Sweden, Great Britain and Spain totaled 60 000, 60 000, 45 000, 30 000, 30 000, and 18 000 tonnes respectively. China is the third largest world producer of ethanol and the largest in Asia with more than 3 billion litres per year capacity, followed by India with about 2.7 billion litres of capacity (Cheminfo Services Inc. et al. 2000). Production in Eastern Europe is dominated by the Russian Federation, where there is an estimated capacity of 2.5 billion litres per year of which only 1 billion litres is fuel ethanol (Cheminfo Services Inc. et al. 2000). Several novel policy mechanisms are used to encourage biofuel production and consumption in other regions. In Denmark for example, the government has exempted CO2 taxes on bioenergy products in view of reducing the cost disadvantage of biofuels. Tax credits are granted in Sweden for specific environmentally friendly cars. Cars powered completely or in part by biofuels qualify far a tax reduction in relation to their environmental impact compared to a similar sized, conventionally powered car. There are mandatory substitutions of biofuels in place of conventional fuels in Austria. The substitution requirement involves imposing certain biofuel content in the marketplace. This policy results in higher consumer prices for fuels, given the higher costs of production of biofuels relative to conventional fuel. In contrast, in Portgual, voluntary agreements are negotiated with transport fuel producers and distributors to meet the demand of consumers for biofuel. 3.5 Summary

Walburger, A. 4/21/2006 31 of 63
Beyond the North America, biofuel production and consumption is encouraged by governments through several means. Excise duty exemptions, subsidized research and development programs and public awareness programs have been the most prevalent ways to promote biofuels. There is an almost universal policy of reducing or exempting excise taxes on biofuels. The exemption has been applied to biofuels in pure form as well as those used in blends in view of increasing consumer demand. Sometimes the exemption is limited by a quota, such as in France and Italy, or it takes the form of a refund. Government funded research and development programs also a very popular. Research on biofuels cover a large array of topics including, but not limited to: ways of reducing production costs, modifications required for novel feedstocks, and issues related to blending with fossil fuels and performance in extreme weather conditions. Public awareness programs is a taxpayer subsidized undertaking in several countries. With cooperation from industry stakeholders, these programs are aimed at informing consumers of the benefits of biofuels and at increasing general institutional awareness. Reductions in motor fuels taxes have been minimal in Europe, in part due to the push toward uniform taxation policies across the European Union. While some reductions in motor fuels taxes have been made on a temporary basis for "demonstration scale" facilities such as those in Sweden, these mechanisms are unlikely to be widely adopted in Europe.

Walburger, A. 4/21/2006 32 of 63
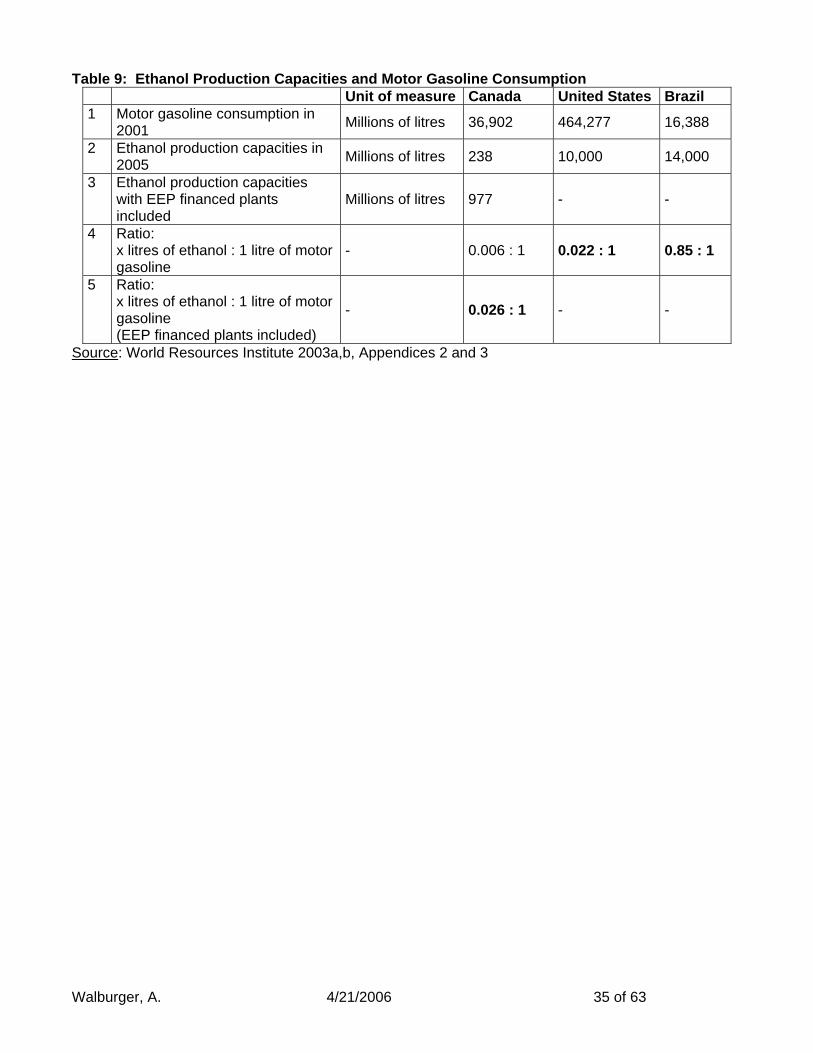
4. What Can Be Learned From the Experiences in Other Countries? The experiences of several countries around the world (as described in the previous chapter) provide a basis for considering the appropriate directions for government policies in Canada. 4.1 Observation 1 – Biofuel Has Become a Growth Industry There is ample evidence of an increasing international emphasis on production of renewable energy, a major part of which includes biofuels (Table 3). This priority has been established primarily in response to (1) concern for the environmental effects of burning fossil fuels; (2) desire for a more secure source of energy since much available hydrocarbon fuel comes from areas of the world that are unstable and worries about the limit of their production; and (3) beliefs that a biofuel industry would aid primary agricultural producers and rural areas that are seen as being perpetually in financially strapped conditions. As well as being the largest producer of ethanol, Brazil is also the largest consumer of ethanol: 3 million vehicles a day run on pure ethanol (Briere 2003). The main feedstock used to produce ethanol in Brazil is sugarcane. Brazil uses 85 litres of ethanol for every litre of gasoline. In the United States, ethanol accounts for 2.2 % of gasoline used. In Canada, only 6/10 of one percent of gasoline used is accounted for by ethanol (row 4 of Table 9). Canada’s ratio will grow to 2.6% if all present plans to expand ethanol production are realized (row 5 of Table 9). It is evident that Canada has lagged many countries in the development of a biofuels industry. Figure 2 shows that annual ethanol production capacity in Canada was stagnant, even declining slightly from the mid 1970s to the mid 1990s. Then, production capacity took a sharp upward turn that has led to its present output level of about 0.24 billion litres/year. The dashed line indicates government projections for ethanol production to 2015. Recent government initiatives, especially the federal Ethanol Expansion Program, have resulted in plans to build an additional 0.74 billion litres/year of production capacity in the near term. If all announced plans are realized, this will allow Canada’s ethanol production capacity to approach 1 billion litres per year in the near future. Figure 3 shows where all announced plants will be located in Canada and their production capacities.
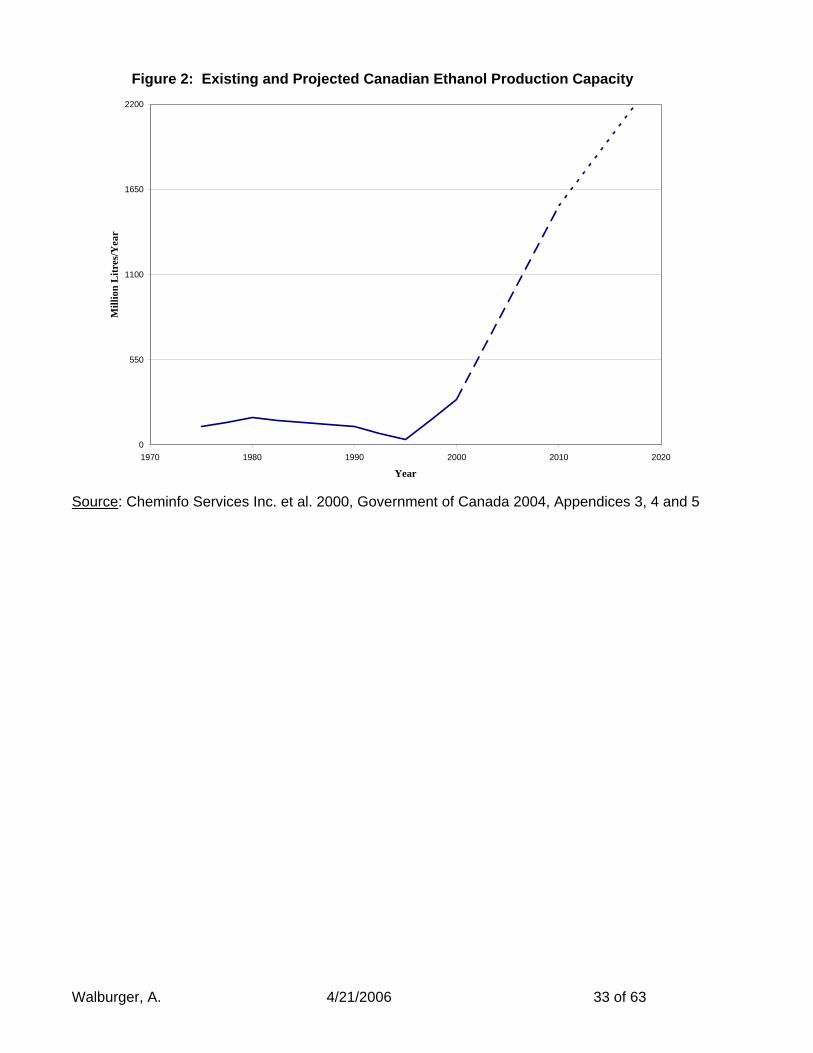
Figure 2: Existing and Projected Canadian Ethanol Production Capacity
0
550
1100
1650
2200
1970 1980 1990 2000 2010 2020
Year
Mill
ion
Litr
es/Y
ear
Source: Cheminfo Services Inc. et al. 2000, Government of Canada 2004, Appendices 3, 4 and 5
Walburger, A. 4/21/2006 33 of 63

Figure 3: Existing and Projected Ethanol Plants in Canada (Production Capacity in Million litres/year)
Walburger, A. 4/21/2006 34 of 63
Walburger, A. 4/21/2006 35 of 63
Table 9: Ethanol Production Capacities and Motor Gasoline Consumption
Unit of measure Canada United States Brazil 1 Motor gasoline consumption in
2001 Millions of litres 36,902 464,277 16,388
2 Ethanol production capacities in 2005 Millions of litres 238 10,000 14,000
3 Ethanol production capacities with EEP financed plants included
Millions of litres 977 - -
4 Ratio: x litres of ethanol : 1 litre of motor gasoline
- 0.006 : 1 0.022 : 1 0.85 : 1
5 Ratio: x litres of ethanol : 1 litre of motor gasoline (EEP financed plants included)
- 0.026 : 1 - -
Source: World Resources Institute 2003a,b, Appendices 2 and 3

Walburger, A. 4/21/2006 36 of 63
4.2 Observation 2 – Countries Are Using a Wide Variety of Measures to Stimulate Production and Consumption of Biofuels It is widely believed that biofuels can play an important part in reducing greenhouse gas emissions as well as providing opportunities for improvements in the welfare of rural people. As a result, many countries around the world have developed policies and programs to stimulate the production and use of biofuels. Appendix A includes information on a long list of policies for stimulating the production of renewable energy from 30 different countries as well as the European Union. Although not all forms of renewable energy refer to biofuels, the vast majority of policies listed in Appendix A do pertain to this form of renewable energy. Policies used by governments include investment tax credits, capital grants, guaranteed prices, consumer rebates, excise tax exemptions, tax credits, and a wide variety of subsidies for production, consumption, and research. In addition to the countries included in Appendix A, several other countries also have their own policies designed to stimulate the production and consumption of biofuels. Thailand recently has implemented a €30 million ($42.85 million) roadmap to support a bio-diesel program over the next eight years using palm oil as the primary feedstock. Thailand has established a target of producing 8.5 million litres of bio-diesel per day by 2012 in a bid for self-sufficiency (F. O. Licht, 2005). The Philippines launched a National Program in 2004 to develop ethanol from sugar cane, as have several countries on Africa. (F. O. Licht, 2005). Establishment of targets (or even mandates) for biofuel production and consumption has been a popular policy (see the list by country in Appendix B), possibly because it is costless. However, most targets have been on the ambitious side and, over time, the setting of unrealistic and unreachable targets may erode governments’ credibility. 4.3 Observation 3 – Ethanol Production Can Be A Profitable Business The profitability of ethanol production is largely determined by the price of competing outputs, principally petroleum products, and the cost of its feedstock, mostly cereal grains. The prices of petroleum and agricultural prices are notoriously variable. This, combined with the uncertainties involved in agricultural crop production presents several risks for ethanol producers. Relatively high oil prices over the past year have provided a good opportunity for ethanol producers to sell their output in a high-priced market. At the same time, relatively low grain prices have allowed ethanol producers to capture much larger financial margins than were possible as recently as 2003. Eidman (2005) reported that many ethanol plants in the United States have achieved return on equity of 25-40 % in the last two years, “with rumours of plants achieving over 60 %.” The high levels of subsidies paid to encourage ethanol production appear to be unnecessary at the present time. The high rates of return on invested capital, and the expectation that demand for ethanol will continue to grow, has attracted a lot of private capital in the United States and other countries. Although ownership of most ethanol plants in the United States, Canada and Europe has been mostly fragmented with a large number of farmer co-operatives, some industry observers expect the profitable production conditions and the injection of a lot of private capital may lead to consolidation of ownership, particularly when ethanol prices decline and profits are diminished (Eidman, 2005). 4.4 Observation 4 – Modest Increases in Prices of Farm Crops Can Be Expected From Biofuel Production One of the major objectives of most biofuel policies is to provide opportunities for primary agricultural producers to get a higher price for the products they produce. An ethanol plant that uses cereal grains (or eventually plant residues) provides an additional market for these products. However, most agricultural products are traded over wide areas (including internationally) and the relationship among markets is very complex. Additionally, most countries have a web of price and income supports, input subsidies, non-tariff barriers to imports, and other measures to protect their domestic farm industry. This makes it very difficult to estimate the impacts of the production of biofuels on commodity prices even with advanced econometric systems models. Despite the difficulties, there is some evidence of higher prices for some agricultural products as a result of production of biofuels. The large scale use of sugar cane to produce ethanol in Brazil seems to have raised the world price of sugar. Brazilian sugar producers have a major impact on world prices

Walburger, A. 4/21/2006 37 of 63
of sugar through their decisions on how much sugar to produce. Koizumi (2003) studied several scenarios through 2010 to estimate the impact of different levels of ethanol demand on sugar production and international sugar prices. He found that Brazilian sugar prices could increase by up to 28 % and world sugar prices could increase by up to 4 %. A simulation modelling study by Walsh et al (2002) that evaluated the potential market impacts of growing switchgrass, willow and poplar for the production of cellulosic ethanol in the United States found that it would not only lead to an increase in price of those products but also to an increase in prices of traditional crops (like corn, sorghum, wheat, soybeans, cotton and rice) of 4-14 % because these crops compete for the same land. A simulation study of increased demand for bio-diesel produced from soybeans in the Untied States found soybean prices could be increased by 0.4 to 2.0 %, resulting in an increase in net farm income in the U.S. by up to 0.3 % (Raneses et al 1999). While these studies are tentative and based on a large number of assumptions, it is clear that a large biofuel industry has the potential to increase farm incomes. Whether the increase in farm incomes exceeds the level of subsidy required to establish a large biofuel industry has not been investigated thoroughly as yet. 4.5 Observation 5 – Ethanol for Reduction of Carbon Seems to be Very Expensive Many jurisdictions around the world, including Canada, have exempted ethanol from the gasoline tax in order to increase its competitiveness in relation to conventional gasoline. A major justification for this policy has been the reduction on greenhouse gas emissions that result when ethanol, rather than gasoline, is burned in internal combustion engines. Henke et al (2005) reported on a comprehensive study they conducted using a meta-analysis of several existing data sets from Germany to determine if the strategy to use farmland to grow the raw materials for bio-ethanol production is a reasonable option for climate policy. Like in Canada, the major goal of climate policy in Germany is to reduce the use of fossil fuels and, therefore, carbon dioxide emissions. To determine the saving in carbon dioxide emissions, the energy required to produce the agricultural feedstock and then convert it to ethanol must be calculated. The energy required to produce ethanol varies considerably depending on the level of agricultural inputs used to produce the feedstock and the average yields of various crops that are grown. Surveying several detailed studies of ethanol feedstock production, Henke et al calculated net energy balances resulting from production of ethanol using sugar beets, wheat, corn, rapeseed and wood products as feedstock. The authors calculated that the cost of abating carbon dioxide emissions was likely to be in the range of 300 to1,500 Canadian dollars per tonne of CO2 equivalent, depending on the assumptions used and the value of resulting by-products. This compares to estimated costs of about 45 Canadian dollars per tonne by using the most efficient ways of reducing greenhouse gases (Boehringer and Loeschel, 2002). Henke et al (2005) concluded that, from an economic perspective, there are better (less expensive) strategies for reducing greenhouse gases than using agricultural land to produce ethanol. A study by Ryan et al (2004) looked at the benefits of reducing greenhouse gases in the European Union by stimulating the use of biofuels through subsidizing the difference between the costs of biofuels and fossil fuels. The subsidies could take the form of a reduction in excise taxes (a prominent strategy in Canada) or outright subsidization of the production cost of biofuels. The authors found the level of subsidy required to produce enough ethanol to reduce CO2 emissions by one tonne would cost between 269-404 Canadian dollars, depending on assumptions used. They concluded that other strategies to reduce greenhouse gases were available at much lower costs and that other benefits from biofuel production, such as increased security of energy supply and employment generation in rural areas (both notoriously difficult to quantify), would be needed to justify the use of subsidies to produce ethanol. 4.6 Observation 6 – Evidence of Large Economies of Scale in Manufacturing One of the most general results found in cost studies is the almost universal finding of economies of scale in production. As plants increase in size, they often become more efficient in production and can apply their fixed costs over a larger output. This phenomenon seems to exist in ethanol production as well. Shapouri and Gallagher (2005) reported economies of scale in a cost of production survey in the United States. Tiffany and Eidman (2003) found that ethanol plants in the United States Midwest that had a capacity of 80 million gallons per year had investment costs per unit

of production that were 23 % lower than did plants with half the capacity. A study by Whims (2002) of ethanol plants in the United States estimated that a tripling of plant size (from 55 to 150 million litres per year for dry-mill plants and from 110 to 375 litres per year for wet-mill plants) reduced capital costs by about 40 %, resulting in a cost reduction of about $0.03 per litre. The tripling of plant size also was found to reduce operating costs by 15-20 %, resulting in another reduction in average cost of production of $.02 to $.03 per litre. A study by the government of Manitoba also showed significant economies of scale and that these result in considerable cost advantages for plants that produce in the order of 100 million litres or more per year (Figure 4). Despite the recognized cost advantages from larger scale production of ethanol, Saskatchewan has instituted a regulation that, to qualify for tax exemptions, distributors must buy at least 30% of their ethanol from plants that produce less than 25 million annually. While the Saskatchewan government clearly has its eye on using ethanol production as a rural development scheme, such an incentive encourages construction of plants with much higher costs of production and the near certainty that that they will become unprofitable if the tax exemption is ever stopped. It may also discourage private sector investment in the industry as investors seek jurisdictions that promote enterprises that could become competitive internationally in the long run.
Figure 4: Ethanol Production Costs by Plant Size
30
35
40
45
50
55
20 40 60 80 100 120
Plant Size
Mill
ion
Dol
lars
Source: Government of Manitoba (2002c)
4.7 Observation 7 – Research and Development Activities Are Bringing Costs Down Virtually all countries that are involved in the production of biofuels have programs that support biofuel research. Many of these programs are listed in Appendix A but much other biofuel research is fully or partially funded by governments or government agencies through targeted priorities of existing research programs. In Canada, several state-supported programs have funded a wide-array of biofuel research, much of it aimed at developing more efficient processes for converting plant-based starches to alcohol. A wide variety of new processes are under investigation in Canada and elsewhere, including gasification and Fischer-Tropsch synthesis. Although these new processes do not appear
Walburger, A. 4/21/2006 38 of 63

Walburger, A. 4/21/2006 39 of 63
competitive at present, it is likely that continued research will result in significant breakthroughs in cost efficiency. This production-oriented research has been instrumental in bringing down the average costs of producing biofuels. The largest ethanol cost component is the plant feedstock (although about half of this cost can be offset by selling by-products such as distiller’s dried grains for animal feed) (IEA, 2004). Research into higher yields of feedstock grains can achieve important reductions in the average cost of producing ethanol. In Brazil, substantial improvements in efficiency of sugar cane production and conversion processes lowered production costs of ethanol substantially over the last decade, to a level of about US$ 0.15 per litre (IEA, 2004). The greatest potential cost reductions lie in the development of technologies that convert cellulosic feedstock to ethanol, and eventually to hydrogen and other liquid fuels like synthetic diesel. Ethanol derived from cellulosic materials requires greater processing than that required for converting starch or sugar based feedstocks to ethanol. However, the cost of cellulosic feedstock, including grasses, harvest residues and trees generally is much lower than that of cereals. Iogen Ltd, a Canadian-based company, has developed an advanced new technology to make ethanol from biomass. The process combines innovations in pre-treatment, state-of-the-art enzyme technology, and advanced fermentation technology. Pre-treated cellulosic fibre is converted to sugars using enzymes; sugars are subsequently fermented to ethanol; and ethanol is purified to fuel (www.iogen.ca). After successfully operating a pilot plant in Ottawa for several years, the company currently is considering alternative sites for a full-scale operating plant. As a result of on-going research, the IEA estimates the cost of producing a litre of ethanol made from cellulose (poplar trees) to decline by about half within ten years and the cost of producing a litre of ethanol from corn in the United States to decline by about 14% in the same timeframe (IEA, 2004). The IEA projects that with continued research and development, “the cost of both ethanol and sugar cane in Brazil (and probably in many other developing countries) and cellulosic ethanol in all regions of the world have the potential to reach parity or near-parity with the cost of gasoline, with oil prices between $25 and $35 per barrel” (IEA, 2004: 84). With oil prices in the last year about double that level, this may happen much sooner. 4.8 Observation 8 – Existence of Many Restrictions to Trade in Biofuels Although the cost of oil has increased substantially recently, it generally remains true that the cost of producing biofuels still is substantially higher than the cost of petroleum fuels, up to three times higher in most high income countries (Fulton 2005). However, a lot of evidence exists that production costs of biofuels (particularly ethanol) are much lower in the developing countries that lie in tropical and sub-tropical areas with low land and labour costs. Crops such as sugarcane, tapioca, sorghum, and cassava have been used as feedstocks for ethanol production. Palm oil, soybeans, peanuts, cocoanut, and jatropha have been used to produce bio-diesel. In Brazil, the costs of producing ethanol from sugarcane are now similar to the cost of petroleum fuels. In other tropical and sub-tropical countries, especially in Thailand and the Philippines, major new initiatives have been implemented to boost production of biofuels (F. O. Lichts, 2005). The production cost advantage of ethanol in lower income countries provides an obvious opportunity for increased international trade in this product. However, like many other agricultural-related commodities, restrictions to trade in biofuels exist in most high income countries. The United States imposes a tariff against ethanol from Brazil of about 14 US cents/litre. This is partially offset by imports that occur through the Caribbean Initiative, which allows up to 7% of the previous year’s ethanol use to enter without duty. Mostly, this is hydrated ethanol from Brazil that is converted to anhydrous ethanol and denatured in the Caribbean before being shipped to the United States (Eidman, 2005). Relatively small quantities of ethanol have been imported into the United States, though imports have been increasing (Table 7). The European Union imposes tariffs of 10.2% on imports of ethanol from Brazil, the USA and Poland (Henke et al, 2005). Australia imposes tariffs of about US$0.23 per litre on ethanol imports and Canada imposes tariffs of about US$0.06 per litre (IEA, 2004). The international barriers to trade in biofuels have their counterparts within Canada in the form of interprovincial barriers to trade. As shown above in the section on Canada, the Canadian provinces have implemented a set of provincial tax exemptions that are complex and heterogeneous with respect

Walburger, A. 4/21/2006 40 of 63
to amounts, eligibility, and duration. Manitoba and Saskatchewan subsidies for ethanol production are available only for production within their own provincial boundaries. Partly as a result, all ethanol produced in Alberta is exported to the United States. These measures are provincially competitive and discourage production and use of ethanol in Canada. The International Energy Agency has called for the lowering of tariffs on biofuels and “it appears that the EU is negotiating with Latin American countries to arrange reduced tariffs for the import of bioethanol into the EU” (Ryan et al, 2004: 10). The current multi-lateral trade negotiations under the auspices of the World Trade Organization (WTO) “encourages negotiations” on the reduction or elimination of tariffs and non-tariff barriers to trade in environmental goods and services, including biofuels (De la Torre Ugarte, 2005).

Walburger, A. 4/21/2006 41 of 63
5. Implications and Recommendations for Canada The production and use of fuel ethanol has been increasing rapidly throughout the world, particularly since the turn of the century. In the year 2000, total world production of ethanol for fuel was less than 20 billion litres and by 2005, production had more than doubled to around 40 billion litres (IEA 2004). This provided about 2.8% of the motor gasoline use in the world, with a slightly smaller percentage in North America (IEA, 2004). In a review of recent policy initiatives, the International Energy Agency projects that total ethanol production in the world may rise to 65 billion litres by 2010 (and account for about 4% of motor gasoline use) and to 120 billion liters by 2020 (and account for about 6% of motor gasoline use) (IEA, 2004). While the costs of producing biofuels are relatively easy to measure, the benefits are much more difficult to quantify and, therefore, the market price does not adequately reflect the benefits of biofuels (IEA, 2004). Undoubtedly, there are some clear benefits that stem from the use of biofuels in place of fossil fuels. Biofuels lower greenhouse gas emissions, reduce air pollution (though there are increases in certain pollutants, especially nitrogen oxides), and improve vehicle performance. In countries that are net energy importers (e.g., United States, western European countries, Japan, Brazil), domestic production of biofuels offer some degree of energy security even though the reduction in oil imports through this method might entail some additional costs. The cost of producing ethanol and bio-diesel in countries where land and labour prices are relatively high (as in Canada) discourages establishment of a biofuel industry. The relatively high costs can be overcome by subsidies, of course, but large income transfers from more productive sectors of the economy might not be in the country’s best interests. Although it appears that large profits are being made in U.S. ethanol plants at the present time (when ethanol prices are high and corn prices are low), it cannot be assumed that this situation will prevail into the long run. Since existing and new ethanol plants in the United States have received fairly large government transfers, it is unclear the extent to which the recent profitability would have inspired investment in new plants in the absence of the subsidies. Canada is a large net exporter of energy so does not need a biofuel industry to help ensure energy security. Thus, the arguments for supporting development of a biofuel industry must rely mainly on reducing greenhouse gases and certain air pollutants, and increasing agricultural incomes and rural development. The evidence is overwhelming that there are much less expensive ways to reduce greenhouse gases than by producing ethanol from grains or bio-diesel from canola/rapeseed. Only in Brazil (and possibly some other low income countries) where the average cost of producing ethanol from sugar is much lower than in the high income countries is the cost per tonne of CO2 reduction reasonably competitive with other methods of reducing greenhouse gases. Production of ethanol from cellulosic materials (when large scale commercial production becomes possible) would substantially reduce the cost per tonne of CO2 reduction. However, even this process is unlikely to be competitive with other methods to reduce CO2 (as shown by recent simulation studies). What about using the development of a biofuel industry as a rural development initiative? Certainly, primary grain and oilseed producers struggle financially in Canada and much of the rural infrastructure is running down as a result. This is a complicated issue and is not easy to analyze. There is some evidence that commodity prices would be increased by a small percentage if a viable, large-scale biofuel industry could be established. However, due to the competitive market structure of the grains and oilseeds sector in Canada, it is well known that most improvements in commodity prices, whether through the market or through government transfers, result in higher prices for land with little or no improvements in the returns to agricultural labour. Of course, increases in equity (through higher valued farmland) can have some positive spin-offs for the rural economy. Establishment of a major biofuel industry in the rural areas of Canada certainly would provide some additional jobs in the rural areas. In Brazil, for example, it has been estimated that 700,000 jobs have been created in rural areas to support the additional sugar cane and ethanol industry (IEA, 2004). However, Canada does not have the high levels of unemployment and underemployment that characterize Brazil. While some surplus labour is available in rural areas on a seasonal basis (mostly during the winter), the reality is that most permanent jobs in new ethanol production facilities could be filled only by attracting labour away from existing jobs. This would be an improvement in Canada’s welfare if the new industry was competitive and could produce profitably without government

Walburger, A. 4/21/2006 42 of 63
assistance. However, if substantial subsidies were required to establish the industry, then jobs created by this method would very likely lower the nation’s overall welfare rather than increase it. It is likely that the demand for biofuels will continue to increase in Canada. There has been an increased awareness of environmental issues in recent years and this seems likely to continue. Government efforts to inform Canadians about the benefits of biofuels and to establish targets for their use are inexpensive and should be continued. Additionally, demand is likely to grow due to new regulations being established in the United States and Canada on automobile emissions and in other areas. Despite the extensive biomass resources that exist in Canada, it appears that Canada has a comparative disadvantage in the production of biofuels. However, if the Canadian public desires to replace some portion of its fossil fuels by ethanol and bio-diesel, every effort ought to be made to do it as inexpensively as possible. A high priority should be to encourage imports of biofuels from places where they can be produced less expensively (e.g., Brazil, India, Thailand, Philippines, etc.). If tariff and non-tariff barriers were removed, it is likely that many plants in the low income countries would be eager to supply a growing demand for these biofuels in Canada. This would also promote economic development in these low income countries by giving them a potentially lucrative market for their products. Although it seems obvious that biofuels can be produced less expensively in developing countries, the Canadian public may still wish to establish a large-scale biofuels industry in Canada. This would promote Canadian goals of environmental sensitivity (as expressed in numerous surveys) and rural development. It would also allow Canadian scientists and industry to stay abreast of developments in the broader bio-products industry. If Canada desires to establish a substantial biofuels industry, close attention should be paid to four important economic factors in order to allow the industry to develop as competitive an industry as possible. First, every effort should be made to work with the provinces to remove inter-provincial barriers to trade and let the industry become established in the most profitable locations. Associated with the location issue, agreement should be sought to discourage local governments from offering hidden subsidies in attempts to alter the location decision of prospective plants. Second, large plants that can achieve economies of scale ought to be promoted. Regulations that promote the building of small plants (as in Saskatchewan) may be suitable (and even profitable) in specific circumstances, as when an ethanol plant is associated with an adjacent feedlot. However, widespread establishment of small plants is likely to result in a much higher cost, and ultimately unsuccessful, industry. Third, assistance for research should be continued, even enhanced. A Canadian company has developed the best techniques (so far) for establishment of an ethanol manufacturing process based on cellulosic materials. Substantial cost and environmental advantages would be available by producing ethanol from cellulosic materials. Progress made so far (mainly by Iogen Inc) give Canada a lead in this technology and continuing research efforts in this area as well as in other bio-chemical and engineering processes to make ethanol production more efficient should be supported. A prudent strategy for Canada would be to maintaining a competent and well-trained scientific work force. It is likely that future bio-product opportunities will emerge and Canada ought to have trained scientists who stay abreast of these developments. Fourth, much work remains to be done to identify and remove regulations (or change certain institutions) that currently are in place to ensure adequate functioning of a supply chain for grains and oilseeds on the one hand, and to deliver gasoline and diesel fuel efficiently to consumers on the other. In the grains and oilseeds sector, plant breeding, registration of new cultivars, grain handling and storage procedures, etc. are oriented to efficiently deliver high quality food and feed to consumers. Present procedures discourage (or prevent) the growing of plants that have higher yields of low quality grains (for food) and longer stemmed varieties (that would lower average costs of producing cellulosic materials). What is especially clear from this review of policies that have been used to stimulate the ethanol industry in countries around the world is the shortage of peer-reviewed economic studies on the industry. Part of the reason for the paucity of economic studies undoubtedly can be attributed to the relative newness of the industry. It has only been in the last five years that production of biofuels has begun to increase at a fast pace around the world. Still, governments (including the Canadian federal

Walburger, A. 4/21/2006 43 of 63
and provincial governments) have diverted vast resources to stimulate development of the industry. There are many papers that promote the industry and argue that the benefits of establishing a biofuel industry greatly exceed the costs. However, the evidence is thin at best and much more focus should be placed on systematic and thorough economic studies that examine critically the least expensive ways to achieve the objectives that are laid out by governments. The biofuels industry in every country is integrally related to the agricultural industry. Subsidies, price supports, tariffs and non-tariff barriers to trade bedevil the agricultural industry and make it very difficult to analyze the costs and impacts of any biofuel policies that also affect the agricultural industry. Like research in the biological and chemical areas on biofuels, research in the economic area is at least as important and at least as difficult to conduct. This does not mean that economic research should be avoided. On the contrary, the future welfare of Canadian citizens depends greatly on policy decisions taken by governments and the decision-making process can be improved if properly researched economic information is made available.

Walburger, A. 4/21/2006 44 of 63
References
1. Boehringer, C. and A Loeschel (2002) Assessing the cost of compliance: The Kyoto Protocol. European Environment 12(1): 1-16.
2. Briere, K. (2002) Ethanol Special Report. The Western Producer, November 21. http://www.producer.com/articles/20021121/special_report/media/ethanol_sr.pdf
3. Canadian Renewable Fuels Association. Ethanol Production in Canada. http://www.greenfuels.org/ethaprod.html
4. Cheminfo Services Inc., (S&T)2 Consultants Inc. and Cemcorp Ltd (2000) Ethanol Production in Alberta. Final report prepared for the Government of Alberta. http://www1.agric.gov.ab.ca/$department/deptdocs.nsf/all/agc6751/$FILE/ethanol%20production%20in%20alberta%20final.doc
5. Coelho, Suani Teixera (2005) Bio-fuels – Advantages and trade barriers. Presented to the Expert Meeting on the developing Countries’ Participation in New and Dynamic Sectors of World Trade, Geneva.
6. Coopérative Fédérée de Québec. (2004), “Éthanol: les enjeux d’un carburant ‘écolo’.”, January. http://www.coopfed.com/COOPERATEUR/contenu/janv_2004/page34.htm
7. De la Torre Ugarte, Daniel (2000) The contribution of bioenergy to a new energy paradigm.
8. De la Torre Ugarte, Daniel (2005) The contribution of bioenergy to a new energy paradigm. EuroChoices: The Agricultural Economics Society and the European Association of Agircultural Economics 4(3): 06-12.
9. Eidman, Vernon R. (2005) Agriculture’s role in energy production: Current levels and future prospects. Presented at Conference on Energy From Agriculture: New Technologies, Innovative Programs & Success Stories. Farm Foundation, St. Louis, Missouri.
10. F. O. Licht (2005) Biofuels and the international development agenda. F. O. Licht World ethanol and biofuels report. Volume 3, No. 21, 5 pp.
11. Farm Credit Canada (2004) “National Biomass Ethanol Production”, June. http://www.fcc-sca.ca/en/Products/Partnerships/nbep_e.asp?main=2&sub1=partnerships&sub2=nbep
12. Freeze B.S., and T. Peters. (1999) “A Note on the Profitability of Wheat-ethanol-feedlot Production in Alberta.” Canadian Journal of Agricultural Economics 47 (1999): 67-78.
13. Fulton, Lew (2005) Biofuels for transport: An international perspective. International Energy Agency, OECD, Paris.
14. Goldemberg, José, Suani Teixeira Coelho, Plinio Mário Nastari and Oswaldo Lucon (2004) Ethanol learning curve – the Brazilian experience. Biomass and Bioenergy 26:301-304.
15. Government of Canada (2001a) “Future Fuels Program”, September. http://oee.nrcan.gc.ca/vehiclefuels/ethanol/ethanol_futurefuels.cfm?PrintView=N&Text=N
16. Government of Canada (2001b) “Future Fuels Initiative, National Biomass Program”. http://www.climatechange.gc.ca/english/newsroom/2001/steps/steps_future.asp
17. Government of Canada (2003a) “Backgrounder - Ethanol Expansion Program”, October. http://www.climatechange.gc.ca/english/newsroom/2003/bg_ethanol.asp

Walburger, A. 4/21/2006 45 of 63
18. Government of Canada (2003b) “Ethanol Expansion Program Invitation to Proponents – Round 1”, October 20. http://climatechange.gc.ca/english/publications/announcement/pdf/invitation.pdf This internet address is no longer available because the site www.climatechange.gc.ca has recently been changed.
19. Government of Canada (2003c) “Government of Canada Announced $1 Billion Toward Implementation of the Climate Change Plan for Canada”, August 12. http://climatechange.gc.ca/english/newsroom/2003/budget/20030812_budget.asp
20. Government of Canada (2004) “Government of Canada Announces Successful Proposals in Ethanol Expansion Program”, February 13. http://www.nrcan-rncan.gc.ca/media/newsreleases/2004/200402_e.htm
21. Government of Manitoba (2002a) “Developing Manitoba’s Ethanol Industry (part of Homegrown energy: Manitoba energy development initiative)”, April. http://www.gov.mb.ca/est/energy/ethanol/ethanol.pdf
22. Government of Manitoba (2002b) “Ethanol Backgrounder (part of Homegrown energy: Manitoba energy development initiative)”. http://www.gov.mb.ca/est/energy/ethanol/ebckgrder2.html#Benefits http://www.gov.mb.ca/est/energy/ethanol/ebckgrder1.html#Intro
23. Government of Manitoba (2002c) “Ethanol Made in Manitoba”, A report by the Ethanol Advisory Panel to the Government of Manitoba. http://www.gov.mb.ca/est/energy/ethanol/ethanol2-low.pdf
24. Government of Manitoba (2003a) “Province Introduces Proposed Legislation to Mandate 10 per cent Ethanol Blends by 2005”, November. http://www.gov.mb.ca/chc/press/top/2003/11/2003-11-21-03.html
25. Government of Manitoba (2003b) ‘The Biofuels and Gasoline Tax Amendment Act”, December. http://web2.gov.mb.ca/laws/statutes/2003/c00503e.php
26. Government of New Brunswick, “New Brunswick Energy Policy”, Chapter 3.5 Alternative Energy, http://www.gnb.ca/0085/alt.htm
27. Government of Ontario (2002) “Ontario Supports Clean, Renewable Power Generation”, October. http://www.ene.gov.on.ca/envision/news/2002/102401fs.htm
28. Government of Quebec (1996) Ministry of Finance, Déclaration ministérielle concernant la réduction
de la taxe sur les carburants à l`égard de l`éthanol, December 12.
29. Government of Quebec (1997) Ministry of Finance, Entente pour la production d`éthanol au Québec, May 27.
30. Government of Saskatchewan (2002a) “Plan to develop ethanol industry”, May. http://www.gov.sk.ca/newsrel/releases/2002/03/21-178.html
31. Government of Saskatchewan (2002b) “An Industry for Saskatchewan”, April. http://www.ir.gov.sk.ca/adx/asp/adxGetMedia.asp?DocID=3288,3286,2937,2936,Documents&MediaID=4734&Filename=Greenprint.pdf
32. Henke, J. M., G. Klepper and N. Schmitz (2005) Tax exemption for biofuels in Germany: Is bio-ethanol really an option for climate policy? Energy 30: 2617-2635.
33. International Energy Agency (IEA) (2004) Biofuels for transport: An international perspective. International Energy Agency, OECD, Paris.

Walburger, A. 4/21/2006 46 of 63
34. Islam, Mazharul, Amir Fartaj and David S. -K. Ting M. (2004) Current utilization and future prospects of emerging renewable energy applications in Canada, Renewable & Sustainable Energy Reviews 8: 493-519.
35. Koizumi, T. (2003) The Brazilian ethanol program: Impacts on world ethanol and sugar markets. Presented at OECD Workshop on Biomass and Agriculture, Vienna, Austria.
36. Le Soleil (2003) “De l’espoir pour l’usine d’éthanol de Varennes" by Pierre Asselin, August 13.
37. Manness, G., T. Nicholson and C. Nicolaou (2002) Ethanol made in Manitoba. Ethnaol Advisory Panel to the Government of Manitoba. http://www.gov.mb.ca/est/energy/ethanol/ethanol2-low.pdf
38. Mitchell C. and P. Connor (2004) Renewable energy policy in the UK 1990 – 2003. Energy Policy 32: 1935-1947.
39. Raneses, A. R., L.K. Glaser, J.M. Price, and J.A. Duffield (1999) Potential biodiesel markets and their economic effects on the agricultural sector of the United States. Industrial Crops and Products 9(2): 151-162.
40. Ryan, L., F. Connery and S. Ferreira (2004) Stimulating the use of biofuels in the European Union: Implications for climate change policy. PEP 04/08, Department of Planning and Environmental Policy, University College Dublin, Ireland.
41. Schneider, U. A. and Bruce McCarl (2003) "Economic Potential of Biomass Based Fuels for Greenhouse Gas Emission Mitigation" Environmental and Resource Economics 24(4): 291-312, April.
42. Seaway Valley Farmers Energy Co-operative Inc. “The Project.” http://www.glen-net.ca/ethanol/project.html
43. Shapouri, H. and P. Gallagher (2005) USDA’s 2002 ethanol cost-of-production survey. United States Department of Agriculture, Agricultural Economic Report No. 841, Washington, D. C.
44. Taylor, Amy, Marlo Reynolds and Matthew Horne (2005) Bio-product market development strategy: A scoping study on federal policies for creating market demand for bio-products in Canada. Produced by the Pembina Institute. Industry Canada, Ottawa.
45. Tiffany, D. G. and V. R. Eidman (2003) Factors associated with success of fuel ethanol producers. University of Minnesota, Department of Applied Economics Staff paper P03-07, St. Paul, Minnesota.
46. Walsh, Marie E., Robert L. Perlack, Anthony Turhollow, Daniel de la Torre Ugarte, Denny A. Becker, Robin L. Graham, Stephen E. Slinsky, and Daryll E. Ray (2002) The economic impacts of bioenergy crop production on US agriculture. ORNL Bioenergy Information Network. http://bioenergy.ornl.gov/resourcedata/index.html
47. Whims, J. (2002) Corn based ethanol costs and margins. Attachment 1, AGMRC, Kansas State University. http://www.agmrc.org/corn/info/ksueth1.pdf
48. Wood, S. M. and Layzell, D.B. (2003) A Canadian biomass inventory: Feedstocks for bio-based Energy. Final Report Prepared for Industry Canada, Ottawa.
49. World Resources Institute (2003a) Resource Consumption: Motor gasoline consumption, http://earthtrends.wri.org/text/ENG/variables/291.htm
50. World Resources Institute (2003b) Agricultural Production: Cereals production, total. http://earthtrends.wri.org/text/AGR/variables/183.htm

Walburger, A. 4/21/2006 47 of 63
Appendix A: Policies for Renewable Energy, by Country Country Technology Policy name Policy Type
Australia •Bioenergy Queensland Bagasse based electricity http://www.iea.org/textbase/pamsdb/detail.aspx?mode=gr&id=1180
•Regional Policies
Australia •Biofuel Biofuels Capital Grants Program http://www.iea.org/textbase/pamsdb/detail.aspx?mode=gr&id=2142
•Capital Grants
Australia •Biofuel Ethanol Production Grant http://www.iea.org/textbase/pamsdb/detail.aspx?mode=gr&id=2191
•Fossil Fuel Taxes •Capital Grants
Australia •Biofuel Study on Ethanol http://www.iea.org/textbase/pamsdb/detail.aspx?mode=gr&id=184 •RD&D
Australia •Biofuel Ethanol Production Bounty Scheme http://www.iea.org/textbase/pamsdb/detail.aspx?mode=gr&id=1056
•Capital Grants •RD&D
Austria •Bioenergy •Solar thermal
Dwelling Improvement Act and Housing Promotion Subsidies http://www.iea.org/textbase/pamsdb/detail.aspx?mode=gr&id=1116
•Consumer Grants / Rebates
Austria
•Bioenergy •Onshore wind •Offshore wind •Solar photovoltaics
Eco-Plants Feed-In Tariffs http://www.iea.org/textbase/pamsdb/detail.aspx?mode=gr&id=7
•Guaranteed Prices / Feed in
Austria
•Bioenergy •Solar photovoltaics •Solar thermal
Housing Creation and Refurbishment http://www.iea.org/textbase/pamsdb/detail.aspx?mode=gr&id=837 •Tax Credits
Austria
•Biofuel •Bioenergy •Geothermal •Offshore wind •Onshore wind •Solar photovoltaics •Waste (organic)
Renewable Energy Targets http://www.iea.org/textbase/pamsdb/detail.aspx?mode=gr&id=8 •Obligations
Austria
•Bioenergy •Geothermal •Onshore wind •Solar photovoltaics
EIWOG http://www.iea.org/textbase/pamsdb/detail.aspx?mode=gr&id=1184
•Guaranteed Prices / Feed in
Austria •Biofuel •Bioenergy
Eco-Tax http://www.iea.org/textbase/pamsdb/detail.aspx?mode=gr&id=1183
•Fossil Fuel Taxes •Excise Tax Exemptions
Austria •Onshore Voluntary Agreement between Ministry of Economic Affairs and •Guaranteed

Walburger, A. 4/21/2006 48 of 63
wind •Solar photovoltaics •Bioenergy •Biofuel
Association of Electricity Utilities http://www.iea.org/textbase/pamsdb/detail.aspx?mode=gr&id=1117
Prices / Feed in
Belgium
•Solar photovoltaics •Offshore wind •Onshore wind •Hydropower •Waste (organic) •Bioenergy •Biofuel •Geothermal
Specific incentive for renewable energy (prime spécifique en matiere d'energies renouvelables) http://www.iea.org/textbase/pamsdb/detail.aspx?mode=gr&id=63
•Capital Grants
Belgium
•Solar photovoltaics •Offshore wind •Onshore wind •Hydropower •Waste (organic) •Biofuel
Tax deduction for investments in energy savings http://www.iea.org/textbase/pamsdb/detail.aspx?mode=gr&id=65 •Tax Credits
Belgium •Biofuel Pilot Programme for biofuels in cars http://www.iea.org/textbase/pamsdb/detail.aspx?mode=gr&id=1282
•RD&D •3rd Party Finance
Belgium •Bioenergy Financial support for demonstration projects - Flanders http://www.iea.org/textbase/pamsdb/detail.aspx?mode=gr&id=994
•Capital Grants •RD&D
Brazil
•Onshore wind •Bioenergy •Hydropower
The PROINFA Programme http://www.iea.org/textbase/pamsdb/detail.aspx?mode=gr&id=1474
•Guaranteed Prices / Feed in •Obligations •Tradable Certificates •3rd Party Finance
Canada •Biofuel Fuel excise tax exemption http://www.iea.org/textbase/pamsdb/detail.aspx?mode=gr&id=68
•Sales Tax Rebates
Canada
•Offshore wind •Onshore wind •Solar photovoltaics •Biofuel •Hydropower
Market Incentive Program http://www.iea.org/textbase/pamsdb/detail.aspx?mode=gr&id=58
•Capital Grants
Canada •Biofuel Future Fuels http://www.iea.org/textbase/pamsdb/detail.aspx?mode=gr&id=663
•Excise Tax Exemptions

Walburger, A. 4/21/2006 49 of 63
•3rd Party Finance •RD&D •Obligations
Canada •Biofuel Ethanol Blended Fuel Reminders http://www.iea.org/textbase/pamsdb/detail.aspx?mode=gr&id=14
•Government Purchases •Public Awareness
Canada
•Hydropower •Onshore wind •Solar photovoltaics •Bioenergy
Renewable Energy for Remote Communities http://www.iea.org/textbase/pamsdb/detail.aspx?mode=gr&id=1236
•Public Awareness
Canada •Bioenergy National Biomass Ethanol Programme http://www.iea.org/textbase/pamsdb/detail.aspx?mode=gr&id=1234 •Tax Credits
Denmark •Bioenergy The Biomass Agreement http://www.iea.org/textbase/pamsdb/detail.aspx?mode=gr&id=75
•Obligations •Guaranteed Prices / Feed in
Denmark
•Solar thermal •Bioenergy •Offshore wind •Onshore wind
Act on Support for Utilisation of Renewable Energy Sources http://www.iea.org/textbase/pamsdb/detail.aspx?mode=gr&id=72
•Capital Grants •Guaranteed Prices / Feed in •RD&D •Public Awareness
Estonia •Bioenergy 2nd National Energy Efficiency Target Programme http://www.iea.org/textbase/pamsdb/detail.aspx?mode=gr&id=2249
•Capital Grants
European Union •Bioenergy Directive 2003/30/EC on liquid biofuels
http://www.iea.org/textbase/pamsdb/detail.aspx?mode=gr&id=1322
European Union
•Offshore wind •Onshore wind •Solar concentrating power •Solar photovoltaics •Solar thermal •Geothermal •Hydropower •Bioenergy •Waste (organic)
Directive on the Promotion of Electricity Produced from Renewable Energy Sources http://www.iea.org/textbase/pamsdb/detail.aspx?mode=gr&id=20
•Obligations
Finland •Bioenergy VAT Reduction http://www.iea.org/textbase/pamsdb/detail.aspx?mode=gr&id=79
•Sales Tax Rebates
Finland •Bioenergy Small-scale Production and Use of Wood fuels - RD&D Programme http://www.iea.org/textbase/pamsdb/detail.aspx?mode=gr&id=1639
•RD&D

Walburger, A. 4/21/2006 50 of 63
Finland
•Bioenergy •Biofuel •Hydropower •Offshore wind •Onshore wind •Solar photovoltaics •Waste (organic) •Solar thermal
Action Plan for Renewable Energy Sources http://www.iea.org/textbase/pamsdb/detail.aspx?mode=gr&id=219
•3rd Party Finance •Capital Grants •Consumer Grants / Rebates •Fossil Fuel Taxes •General Energy Policy•Production Tax Credits •Public Awareness •RD&D •Regulatory and Administrative Rules •Voluntary Programmes
Finland
•Bioenergy •Hydropower •Offshore wind •Onshore wind •Solar photovoltaics •Solar thermal
Energy Aid http://www.iea.org/textbase/pamsdb/detail.aspx?mode=gr&id=21
•Capital Grants
Finland •Bioenergy Wood Energy Technology Programme http://www.iea.org/textbase/pamsdb/detail.aspx?mode=gr&id=22 •RD&D
Finland
•Offshore wind •Onshore wind •Bioenergy •Hydropower
Motion 510/98 - Feed-in Tariffs http://www.iea.org/textbase/pamsdb/detail.aspx?mode=gr&id=1243
•Guaranteed Prices / Feed in
Finland
•Bioenergy •Hydropower •Offshore wind •Onshore wind •Waste (organic)
Tax subsidies for power production based on renewable energy sources http://www.iea.org/textbase/pamsdb/detail.aspx?mode=gr&id=1249
•Production Tax Credits
Finland •Biofuel •Bioenergy
Bioenergy Promotion Programme http://www.iea.org/textbase/pamsdb/detail.aspx?mode=gr&id=1240 •Obligations
Finland •Bioenergy Bioenergy - RD&D Programme http://www.iea.org/textbase/pamsdb/detail.aspx?mode=gr&id=1635 •RD&D
Finland •Bioenergy LIEKKI 2 - RD&D Programme •RD&D

Walburger, A. 4/21/2006 51 of 63
http://www.iea.org/textbase/pamsdb/detail.aspx?mode=gr&id=1637
France •Biofuel •Bioenergy
Biofuel R&D Programme http://www.iea.org/textbase/pamsdb/detail.aspx?mode=gr&id=1253 •RD&D
France
•Onshore wind •Offshore wind •Bioenergy •Waste (organic)
Call for Tender for Renewable Electricity http://www.iea.org/textbase/pamsdb/detail.aspx?mode=gr&id=1646
•Bidding Systems •Guaranteed Prices / Feed in
France •Bioenergy •Biofuel
Bioproducts R&D Programme http://www.iea.org/textbase/pamsdb/detail.aspx?mode=gr&id=1645 •RD&D
France
•Bioenergy •Geothermal •Waste (organic) •Solar photovoltaics
Renewable Energy Feed-in Tariffs (II) http://www.iea.org/textbase/pamsdb/detail.aspx?mode=gr&id=941
•Guaranteed Prices / Feed in
France •Bioenergy Wood Energy Programme http://www.iea.org/textbase/pamsdb/detail.aspx?mode=gr&id=240
•Capital Grants •Obligations •Voluntary Programmes
France •Biofuel Biofuel Production Programme http://www.iea.org/textbase/pamsdb/detail.aspx?mode=gr&id=1255
•Capital Grants
Germany
•Bioenergy •Geothermal •Hydropower •Offshore wind •Onshore wind •Solar photovoltaics •Waste (organic)
Renewable Energy Sources Act (2004) (Erneuerbare-Energien-Gesetz EEG) http://www.iea.org/textbase/pamsdb/detail.aspx?mode=gr&id=2241
•Guaranteed Prices / Feed in •Obligations
Germany •Bioenergy Combined Heat and Power Law (KWK Modernisierungsgesetz) http://www.iea.org/textbase/pamsdb/detail.aspx?mode=gr&id=1631
•Guaranteed Prices / Feed in •Obligations •Production Tax Credits
Germany •Solar photovoltaics •Biofuel
Law to Amend the Mineral Oil Tax Law and Renewable Energy Law http://www.iea.org/textbase/pamsdb/detail.aspx?mode=gr&id=861
•Guaranteed Prices / Feed in
Germany
•Bioenergy •Solar photovoltaics •Solar thermal •Geothermal •Geothermal heat
Market Stimulation Programme (Marktanreizprogramm) http://www.iea.org/textbase/pamsdb/detail.aspx?mode=gr&id=83
•3rd Party Finance •Capital Grants •Consumer Grants / Rebates

Walburger, A. 4/21/2006 52 of 63
Germany
•Offshore wind •Onshore wind •Solar photovoltaics •Solar concentrating power •Solar thermal •Geothermal •Hydropower •Waste (organic) •Bioenergy
Renewable Energy Feed-in Law http://www.iea.org/textbase/pamsdb/detail.aspx?mode=gr&id=31
•Guaranteed Prices / Feed in
Germany •Onshore wind •Bioenergy
Federal Building Codes http://www.iea.org/textbase/pamsdb/detail.aspx?mode=gr&id=1623
•Regulatory and Administrative Rules
Germany
•Bioenergy •Geothermal •Hydropower •Onshore wind •Offshore wind •Solar photovoltaics
Green Electricity http://www.iea.org/textbase/pamsdb/detail.aspx?mode=gr&id=1622
•Green Pricing
Germany
•Bioenergy •Geothermal •Hydropower •Onshore wind •Solar photovoltaics •Waste (organic)
Electricity Feed Law (EFL) (Stromeinspeisungsgesetz) http://www.iea.org/textbase/pamsdb/detail.aspx?mode=gr&id=1057
•Guaranteed Prices / Feed in
Germany
•Offshore wind •Onshore wind •Bioenergy •Hydropower •Solar thermal •Solar photovoltaics
ERP-Environment and Energy-Saving Programme http://www.iea.org/textbase/pamsdb/detail.aspx?mode=gr&id=1619
•3rd Party Finance
Ghana
•Bioenergy •Biofuel •Hydropower •Onshore wind •Solar
Energy for Poverty Alleviation and Economic Growth: Policy Framework, Programmes and Projects http://www.iea.org/textbase/pamsdb/detail.aspx?mode=gr&id=2265
•3rd Party Finance •Excise Tax Exemptions •General Energy Policy

Walburger, A. 4/21/2006 53 of 63
photovoltaics •Solar thermal •Waste (organic)
•RD&D •Rural Electrification•Regulatory and Administrative Rules
Greece
•Bioenergy •Geothermal •Hydropower •Offshore wind •Onshore wind •Solar concentrating power •Solar photovoltaics •Solar thermal
New Operational Programme for Energy http://www.iea.org/textbase/pamsdb/detail.aspx?mode=gr&id=1310
Greece
•Offshore wind •Onshore wind •Hydropower •Bioenergy •Solar photovoltaics
Operational Programme for Energy (OPE) : Fiscal Incentives for Renewables and Energy Conservation http://www.iea.org/textbase/pamsdb/detail.aspx?mode=gr&id=32
•Capital Grants
Greece
•Bioenergy •Geothermal •Hydropower •Offshore wind •Onshore wind •Solar concentrating power •Solar photovoltaics •Solar thermal
Founding decree of the Centre for Renewable Energy Sources (CRES) http://www.iea.org/textbase/pamsdb/detail.aspx?mode=gr&id=1311
•Regulatory and Administrative Rules
Hungary •Biofuel Government resolution on the use of biofuels http://www.iea.org/textbase/pamsdb/detail.aspx?mode=gr&id=2155 •Obligations
Hungary
•Bioenergy •Geothermal •Solar photovoltaics •Solar thermal •Waste (organic)
Energy Conservation and Energy Efficiency Improvement Action Programme http://www.iea.org/textbase/pamsdb/detail.aspx?mode=gr&id=1281
•Obligations
Ireland •Hydropower Tax Relief •Investment

Walburger, A. 4/21/2006 54 of 63
•Solar photovoltaics •Offshore wind •Onshore wind •Bioenergy
http://www.iea.org/textbase/pamsdb/detail.aspx?mode=gr&id=1143 Tax Credits
Ireland
•Hydropower •Offshore wind •Onshore wind •Solar photovoltaics •Bioenergy
Tax Relief http://www.iea.org/textbase/pamsdb/detail.aspx?mode=gr&id=88
•Investment Tax Credits
Italy
•Solar thermal •Solar photovoltaics •Bioenergy •Geothermal
Decrees of Ministry of Industry 24 April 2001 and Ministry of Production Activities 20 July 2004 http://www.iea.org/textbase/pamsdb/detail.aspx?mode=gr&id=1076
•Obligations
Italy •Biofuel Biofuels Tax Exemption http://www.iea.org/textbase/pamsdb/detail.aspx?mode=gr&id=571
•Excise Tax Exemptions
Italy •Bioenergy CIPE 2000 http://www.iea.org/textbase/pamsdb/detail.aspx?mode=gr&id=1069
•Capital Grants
Italy •Bioenergy •Geothermal heat
Tax Credit for Geothermal Energy and Biomass http://www.iea.org/textbase/pamsdb/detail.aspx?mode=gr&id=37 •Tax Credits
Italy •Biofuel •Bioenergy
Tax Reduction for Fuels with Lower Environmental Impact http://www.iea.org/textbase/pamsdb/detail.aspx?mode=gr&id=36
•Excise Tax Exemptions
Italy •Bioenergy CIPE resolution http://www.iea.org/textbase/pamsdb/detail.aspx?mode=gr&id=1070 •Obligations
Italy
•Solar thermal •Solar photovoltaics •Bioenergy
Financial Law of 449/97 http://www.iea.org/textbase/pamsdb/detail.aspx?mode=gr&id=1079
•Property Tax Exemptions •Tax Credits
Japan
•Solar photovoltaics •Offshore wind •Onshore wind •Hydrogen (from Renewables) •Bioenergy •Solar thermal •Waste (organic)
Project for Supporting New Energy Operators http://www.iea.org/textbase/pamsdb/detail.aspx?mode=gr&id=1696
•Capital Grants
Japan •Offshore wind
Special Measures Law Concerning the Use of New Energy by Electricity Retailers
•Obligations •Tradable

Walburger, A. 4/21/2006 55 of 63
•Onshore wind •Solar photovoltaics •Solar thermal •Solar concentrating power •Bioenergy •Hydrogen (from Renewables) •Geothermal
http://www.iea.org/textbase/pamsdb/detail.aspx?mode=gr&id=1694 Certificates
Japan
•Solar photovoltaics •Offshore wind •Onshore wind •Waste (organic) •Bioenergy •Solar thermal
New Energy Indicator http://www.iea.org/textbase/pamsdb/detail.aspx?mode=gr&id=1695 •Obligations
Japan
•Hydrogen (from Renewables) •Bioenergy •Solar photovoltaics
Subsidy for RD&D http://www.iea.org/textbase/pamsdb/detail.aspx?mode=gr&id=680 •RD&D
Japan
•Solar photovoltaics •Offshore wind •Onshore wind •Solar thermal •Hydrogen (from Renewables) •Waste (organic) •Bioenergy
Promotion for the Local Introduction of New Energy http://www.iea.org/textbase/pamsdb/detail.aspx?mode=gr&id=94
•Consumer Grants / Rebates •Capital Grants
Japan
•Solar photovoltaics •Offshore wind •Onshore wind •Waste (organic) •Bioenergy
The Law Concerning Promotion of the Use of New Energy http://www.iea.org/textbase/pamsdb/detail.aspx?mode=gr&id=1690
•General Energy Policy

Walburger, A. 4/21/2006 56 of 63
•Solar thermal •Biofuel •Hydrogen (from Renewables)
Latvia •Biofuel National Program on the Production and Utilisation of Biological Fuels in Latvia http://www.iea.org/textbase/pamsdb/detail.aspx?mode=gr&id=1412
•Obligations
Latvia •Biofuel Use of biofuel for road transport http://www.iea.org/textbase/pamsdb/detail.aspx?mode=gr&id=1445
Luxembourg
•Biofuel •Bioenergy •Hydropower •Onshore wind •Solar photovoltaics
Reglement Grand-Ducal (28 Decembre 2001) http://www.iea.org/textbase/pamsdb/detail.aspx?mode=gr&id=1319
•Guaranteed Prices / Feed in
Luxembourg
•Onshore wind •Solar thermal •Solar photovoltaics •Bioenergy
Ministerial Regulation http://www.iea.org/textbase/pamsdb/detail.aspx?mode=gr&id=1316
•Consumer Grants / Rebates •Capital Grants
Luxembourg
•Bioenergy •Onshore wind •Solar photovoltaics
Energy Efficiency Law http://www.iea.org/textbase/pamsdb/detail.aspx?mode=gr&id=1321
•Guaranteed Prices / Feed in
Nepal
•Bioenergy •Onshore wind •Solar photovoltaics •Solar thermal
Renewable Energy Subsidy Delivery Mechanism, 2000 http://www.iea.org/textbase/pamsdb/detail.aspx?mode=gr&id=2279
•Capital Grants •Rural Electrification
Netherlands •Bioenergy •Solar photovoltaics
VAMIL Depreciation scheme http://www.iea.org/textbase/pamsdb/detail.aspx?mode=gr&id=100
•Investment Tax Credits
Norway
•Bioenergy •Biofuel •Hydropower •Hydrogen (from Renewables) •Ocean energy •Offshore wind •Onshore wind •Solar
RENERGI http://www.iea.org/textbase/pamsdb/detail.aspx?mode=gr&id=2267 •RD&D

Walburger, A. 4/21/2006 57 of 63
photovoltaics •Solar thermal
Norway
•Solar photovoltaics •Solar thermal •Solar concentrating power •Biofuel
Incentives for Non-Electric Heating Technologies http://www.iea.org/textbase/pamsdb/detail.aspx?mode=gr&id=886
•3rd Party Finance
Norway •Bioenergy Imposed Connection to District Heating http://www.iea.org/textbase/pamsdb/detail.aspx?mode=gr&id=1591
•Regulatory and Administrative Rules
Poland
•Bioenergy •Geothermal heat •Hydropower •Offshore wind •Onshore wind •Solar concentrating power •Solar photovoltaics •Solar thermal
Development Strategy of Renewable Energy Sector http://www.iea.org/textbase/pamsdb/detail.aspx?mode=gr&id=1678
•General Energy Policy
Portugal
•Bioenergy •Geothermal •Hydropower •Offshore wind •Onshore wind
Despacho Normativo no.681/94 http://www.iea.org/textbase/pamsdb/detail.aspx?mode=gr&id=1200
•3rd Party Finance
South Africa
•Biofuel •Bioenergy •Geothermal •Hydropower •Ocean energy •Onshore wind •Solar photovoltaics •Waste (organic)
White Paper on Renewable Energy http://www.iea.org/textbase/pamsdb/detail.aspx?mode=gr&id=1450
•Obligations •RD&D
Spain
•Bioenergy •Offshore wind •Onshore wind
Modification to the Biomass, Waste and Wind Energy Premiums http://www.iea.org/textbase/pamsdb/detail.aspx?mode=gr&id=963
•Guaranteed Prices / Feed in

Walburger, A. 4/21/2006 58 of 63
•Waste (organic)
Spain •Bioenergy Inter-ministerial Commission for Biomass http://www.iea.org/textbase/pamsdb/detail.aspx?mode=gr&id=780
•Regulatory and Administrative Rules
Spain
•Bioenergy •Offshore wind •Onshore wind •Hydropower •Solar photovoltaics •Solar concentrating power •Solar thermal •Waste (organic)
Plan on Renewables http://www.iea.org/textbase/pamsdb/detail.aspx?mode=gr&id=614 •Obligations
Sweden •Bioenergy Tax Reduction for Installation Costs of Biomass Heating Systems and Energy Efficient Windows http://www.iea.org/textbase/pamsdb/detail.aspx?mode=gr&id=1580
•Tax Credits
Sweden •Bioenergy Energy Taxation http://www.iea.org/textbase/pamsdb/detail.aspx?mode=gr&id=43
•Fossil Fuel Taxes
Sweden
•Offshore wind •Onshore wind •Hydropower •Biofuel •Geothermal •Solar photovoltaics
Market Based Support Schemes for Renewable Electricity Generation http://www.iea.org/textbase/pamsdb/detail.aspx?mode=gr&id=46
•Tradable Certificates
Sweden
•Bioenergy •Offshore wind •Onshore wind
Feed-in tariffs http://www.iea.org/textbase/pamsdb/detail.aspx?mode=gr&id=110
•Guaranteed Prices / Feed in
Sweden •Bioenergy RD&D http://www.iea.org/textbase/pamsdb/detail.aspx?mode=gr&id=109 •RD&D
Sweden
•Bioenergy •Offshore wind •Onshore wind
Renewable Energy Investment Support Programme http://www.iea.org/textbase/pamsdb/detail.aspx?mode=gr&id=111
•Capital Grants
Sweden •Bioenergy Energy Research and Development http://www.iea.org/textbase/pamsdb/detail.aspx?mode=gr&id=1582 •RD&D
Switzerland •Bioenergy Lothar Wood Energy Promotion Programme http://www.iea.org/textbase/pamsdb/detail.aspx?mode=gr&id=1606
•Consumer Grants / Rebates
Switzerland •Bioenergy Naturemade Labelling Scheme •Voluntary

Walburger, A. 4/21/2006 59 of 63
•Geothermal •Hydrogen (from Renewables) •Onshore wind •Solar photovoltaics •Solar concentrating power •Hydropower
http://www.iea.org/textbase/pamsdb/detail.aspx?mode=gr&id=1169 Programmes
Switzerland •Bioenergy •Hydropower
DIANE (Energy2000 Action) http://www.iea.org/textbase/pamsdb/detail.aspx?mode=gr&id=1165
•Consumer Grants / Rebates
Switzerland
•Bioenergy •Geothermal •Solar concentrating power •Solar photovoltaics •Onshore wind •Hydropower
Feed-in Tariff (SwissEnergy Action) http://www.iea.org/textbase/pamsdb/detail.aspx?mode=gr&id=1161
•Guaranteed Prices / Feed in
Uganda •Bioenergy •Solar photovoltaics
Energy for Rural Transformation (ERT) http://www.iea.org/textbase/pamsdb/detail.aspx?mode=gr&id=1961
•Capital Grants
United Kingdom •Bioenergy Funding for Using Willow as a Renewable Energy Source
http://www.iea.org/textbase/pamsdb/detail.aspx?mode=gr&id=1957•Capital Grants
United Kingdom
•Bioenergy •Hydropower •Geothermal •Offshore wind •Onshore wind •Ocean energy •Solar photovoltaics •Waste (organic)
Renewable Energy Guarantee of Origin http://www.iea.org/textbase/pamsdb/detail.aspx?mode=gr&id=1596
•Tradable Certificates
United Kingdom
•Biofuel •Bioenergy
Bio-energy Capital Grants Scheme http://www.iea.org/textbase/pamsdb/detail.aspx?mode=gr&id=892
•Capital Grants
United Kingdom
•Biofuel •Hydrogen (from Renewables) •Solar photovoltaics •Offshore wind
New and Renewable Research and Development Energy Programme http://www.iea.org/textbase/pamsdb/detail.aspx?mode=gr&id=824
•RD&D
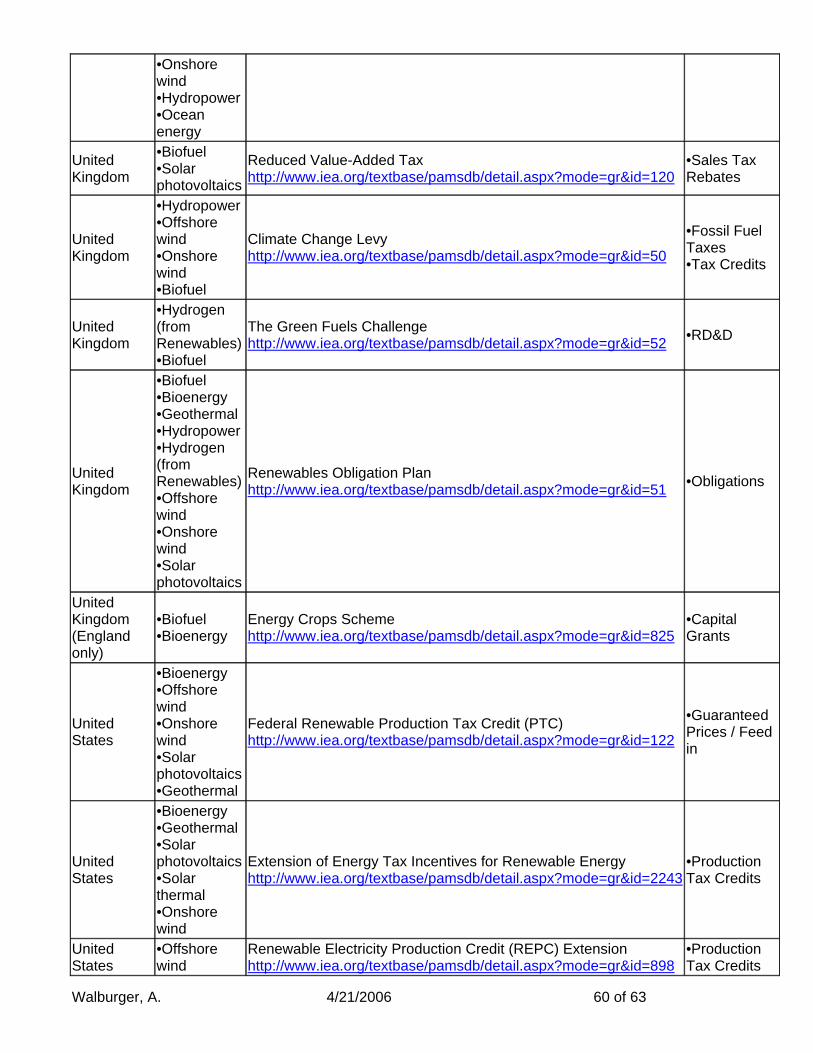
Walburger, A. 4/21/2006 60 of 63
•Onshore wind •Hydropower •Ocean energy
United Kingdom
•Biofuel •Solar photovoltaics
Reduced Value-Added Tax http://www.iea.org/textbase/pamsdb/detail.aspx?mode=gr&id=120
•Sales Tax Rebates
United Kingdom
•Hydropower •Offshore wind •Onshore wind •Biofuel
Climate Change Levy http://www.iea.org/textbase/pamsdb/detail.aspx?mode=gr&id=50
•Fossil Fuel Taxes •Tax Credits
United Kingdom
•Hydrogen (from Renewables) •Biofuel
The Green Fuels Challenge http://www.iea.org/textbase/pamsdb/detail.aspx?mode=gr&id=52 •RD&D
United Kingdom
•Biofuel •Bioenergy •Geothermal •Hydropower •Hydrogen (from Renewables) •Offshore wind •Onshore wind •Solar photovoltaics
Renewables Obligation Plan http://www.iea.org/textbase/pamsdb/detail.aspx?mode=gr&id=51 •Obligations
United Kingdom (England only)
•Biofuel •Bioenergy
Energy Crops Scheme http://www.iea.org/textbase/pamsdb/detail.aspx?mode=gr&id=825
•Capital Grants
United States
•Bioenergy •Offshore wind •Onshore wind •Solar photovoltaics •Geothermal
Federal Renewable Production Tax Credit (PTC) http://www.iea.org/textbase/pamsdb/detail.aspx?mode=gr&id=122
•Guaranteed Prices / Feed in
United States
•Bioenergy •Geothermal •Solar photovoltaics •Solar thermal •Onshore wind
Extension of Energy Tax Incentives for Renewable Energy http://www.iea.org/textbase/pamsdb/detail.aspx?mode=gr&id=2243
•Production Tax Credits
United States
•Offshore wind
Renewable Electricity Production Credit (REPC) Extension http://www.iea.org/textbase/pamsdb/detail.aspx?mode=gr&id=898
•Production Tax Credits

Walburger, A. 4/21/2006 61 of 63
•Onshore wind •Bioenergy
United States
•Bioenergy •Offshore wind •Onshore wind •Waste (organic)
The Economic Security and Recovery Act of 2001 http://www.iea.org/textbase/pamsdb/detail.aspx?mode=gr&id=1707
•Production Tax Credits
United States
•Biofuel •Bioenergy
Biomass Research and Development Act http://www.iea.org/textbase/pamsdb/detail.aspx?mode=gr&id=53 •RD&D
United States
•Bioenergy •Biofuel
Funding for the Development of Ethanol http://www.iea.org/textbase/pamsdb/detail.aspx?mode=gr&id=551 •RD&D
United States •Bioenergy Funding to Develop Clean Burning Fuels
http://www.iea.org/textbase/pamsdb/detail.aspx?mode=gr&id=54 •RD&D
United States
•Bioenergy •Biofuel
Increased Use of Bioenergy http://www.iea.org/textbase/pamsdb/detail.aspx?mode=gr&id=183
•RD&D •Obligations
United States
•Bioenergy •Offshore wind •Onshore wind •Waste (organic)
Tax Relief Extension Act of 1999 http://www.iea.org/textbase/pamsdb/detail.aspx?mode=gr&id=1706
•Production Tax Credits
United States
•Bioenergy •Biofuel
Biomass Energy and Alcohol Fuels Act of 1980 http://www.iea.org/textbase/pamsdb/detail.aspx?mode=gr&id=1704
•3rd Party Finance
United States
•Solar photovoltaics •Offshore wind •Onshore wind •Geothermal •Bioenergy •Waste (organic) •Biofuel
Crude Oil Windfall Profits Tax Act http://www.iea.org/textbase/pamsdb/detail.aspx?mode=gr&id=1064
•Tax Credits •Investment Tax Credits •Excise Tax Exemptions •Production Tax Credits
United States
•Geothermal •Bioenergy •Waste (organic) •Solar photovoltaics •Offshore wind •Onshore wind •Hydropower •Solar thermal
Public Utility Regulatory Policies Act (PURPA) http://www.iea.org/textbase/pamsdb/detail.aspx?mode=gr&id=1060
•Guaranteed Prices / Feed in

Walburger, A. 4/21/2006 62 of 63
Appendix B: Targets for Renewable Energy, by Country Country Renewable Energy Targets
Austria 78.1% of electricity output by 2010 http://www.iea.org/textbase/pamsdb/grcountry.aspx?country=Austria
Belgium 6% of electricity output by 2010 http://www.iea.org/textbase/pamsdb/grcountry.aspx?country=Belgium
Brazil Additional 3300 MW from wind, small hydro, biomass by 2016 http://www.iea.org/textbase/pamsdb/grcountry.aspx?country=Brazil
Cyprus 6% of electricity output by 2010 http://www.iea.org/textbase/pamsdb/grcountry.aspx?country=Cyprus
Czech Republic
5-6 % of TPES by 2010 8-10% of TPES by 2020 8% of electricity output by 2010 http://www.iea.org/textbase/pamsdb/grcountry.aspx?country=Czech%20Republic
Denmark 29% of electricity output by 2010 http://www.iea.org/textbase/pamsdb/grcountry.aspx?country=Denmark
Estonia 5.1% of electricity output by 2010 http://www.iea.org/textbase/pamsdb/grcountry.aspx?country=Estonia
Finland 35% of electricity output by 2010 http://www.iea.org/textbase/pamsdb/grcountry.aspx?country=Finland
France 21% of electricity output by 2010 http://www.iea.org/textbase/pamsdb/grcountry.aspx?country=France
Germany 12.5% of electricity output by 2010 http://www.iea.org/textbase/pamsdb/grcountry.aspx?country=Germany
Greece 20.1% of electricity output by 2010 http://www.iea.org/textbase/pamsdb/grcountry.aspx?country=Greece
Hungary 3.6% of electricity output by 2010 http://www.iea.org/textbase/pamsdb/grcountry.aspx?country=Hungary
Ireland 13.2% of electricity output by 2010 http://www.iea.org/textbase/pamsdb/grcountry.aspx?country=Ireland
Israel 2% of electricity from renewable energy resources by 2007 5% of electricity from renewable energy sources by 2016 http://www.iea.org/textbase/pamsdb/grcountry.aspx?country=Israel
Italy 25% of electricity output by 2010 http://www.iea.org/textbase/pamsdb/grcountry.aspx?country=Italy
Korea, Republic of 2% of total energy consumption from new and renewable energy, including solar, wind and biomass energy by 2006 http://www.iea.org/textbase/pamsdb/grcountry.aspx?country=Korea,%20Republic%20of
Latvia 6% of TPES (excluding large hydro) by 2010 49.3% of electricity output by 2010 http://www.iea.org/textbase/pamsdb/grcountry.aspx?country=Latvia
Lithuania 12% of TPES by 2010 7% of electricity output by 2010 http://www.iea.org/textbase/pamsdb/grcountry.aspx?country=Lithuania
Luxembourg 5.7% of electricity output by 2010 http://www.iea.org/textbase/pamsdb/grcountry.aspx?country=Luxembourg
Mali 15% of TPES by 2020 http://www.iea.org/textbase/pamsdb/grcountry.aspx?country=Mali
Malta 5% of electricity output by 2010 http://www.iea.org/textbase/pamsdb/grcountry.aspx?country=Malta

Walburger, A. 4/21/2006 63 of 63
Netherlands 12% of electricity output by 2010 http://www.iea.org/textbase/pamsdb/grcountry.aspx?country=Netherlands
New Zealand 30 PJ of new capacity (including heat and transport fuels) by 2012 http://www.iea.org/textbase/pamsdb/grcountry.aspx?country=New%20Zealand
Norway 7 TWh from heat and wind by 2010 http://www.iea.org/textbase/pamsdb/grcountry.aspx?country=Norway
Poland
7.5 % of TPES by 2010 (Development Strategy of Renewable Energy Sector) 14 % of TPES by 2020 (Development Strategy of Renewable Energy Sector) 7.5% of electricity output by 2010 (As per Directive 2001/77/EC) http://www.iea.org/textbase/pamsdb/grcountry.aspx?country=Poland
Portugal 45.6% of electricity output by 2010 http://www.iea.org/textbase/pamsdb/grcountry.aspx?country=Portugal
Singapore Installation of 50,000 m2 of solar thermal systems by 2012 Complete recovery of energy from municipal waste http://www.iea.org/textbase/pamsdb/grcountry.aspx?country=Singapore
Slovak Republic 31% of electricity output by 2010 http://www.iea.org/textbase/pamsdb/grcountry.aspx?country=Slovak%20Republic
Slovenia 33.6% of electricity output by 2010 http://www.iea.org/textbase/pamsdb/grcountry.aspx?country=Slovenia
Spain 29.4% of electricity output by 2010 http://www.iea.org/textbase/pamsdb/grcountry.aspx?country=Spain
Sweden 60% of electricity output by 2010 http://www.iea.org/textbase/pamsdb/grcountry.aspx?country=Sweden
Switzerland 3.5 TWh from electricity and heat by 2010 http://www.iea.org/textbase/pamsdb/grcountry.aspx?country=Switzerland
Turkey 2% of electricity from wind by 2010 http://www.iea.org/textbase/pamsdb/grcountry.aspx?country=Turkey
United Kingdom 10% of electricity output by 2010 http://www.iea.org/textbase/pamsdb/grcountry.aspx?country=United%20Kingdom