Policies in Transition Economies - World Bank€¦ · · 2016-07-17WORLD BANK TECHNICAL PAPER NO....
172
WORLD BANK TECHNICAL PAPER NO. 470 la , Europeand Central Asia Environmentally and Socially Sustainable 'r Developinent Series Work in progress WTP470 for public discussion May 2000 Agricultural Support Policies in Transition Economies Edited by Alberto Valdis Public Disclosure Authorized Public Disclosure Authorized Public Disclosure Authorized Public Disclosure Authorized
Transcript of Policies in Transition Economies - World Bank€¦ · · 2016-07-17WORLD BANK TECHNICAL PAPER NO....
WORLD BANK TECHNICAL PAPER NO. 470
la , Europe and Central Asia Environmentally and Socially Sustainable'r Developinent Series
Work in progress WTP470for public discussion May 2000
Agricultural SupportPolicies in TransitionEconomies
Edited byAlberto Valdis
Pub
lic D
iscl
osur
e A
utho
rized
Pub
lic D
iscl
osur
e A
utho
rized
Pub
lic D
iscl
osur
e A
utho
rized
Pub
lic D
iscl
osur
e A
utho
rized

Recent World Bank Technical Papers
No. 395 Saleth and Dinar, Satisfying Urban Thirst: Water Supply Augmentation and Pricing Policy in Hyderabad City,India
No. 396 Kikeri, Privatization and Labor: What Happens to Workers When Governments Divest?
No. 397 Lovei, Phasing Out Leadfrom Gasoline: Worldwide Experience and Policy Implications
No. 398 Ayres, Anderson, and Hanrahan, Setting Prioritiesfor Environmental MAnagement: An Application to theMining Sector in Bolivia
No. 399 Kerf, Gray, Irwin, Levesque, Taylor, and Klein, Concessionsfor Infrastructure: A Guide to Their Design andAward
No. 401 Benson and Clay, The Impact of Drought on Sub-Saharan African Economies: A Preliminary Examination
No. 402 Dinar, Mendelsohn, Evenson, Parikh, Sanghi, Kumar, McKinsey, and Lonergan, Measuring the Impact ofClimate Change on Indian Agriculture
No. 403 Welch and Fremond, The Case-by-Case Approach to Privatization: Techniques and Examples
No. 404 Stephenson, Donnay, Frolova, Melnick, and Worzala, Improving Women's Health Services in the RussianFederation: Results of a Pilot Project
No. 405 Onorato, Fox, and Strongman, World Bank Group Assistancefor Minerals Sector Development and Reform inMember Countries
No. 406 Milazzo, Subsidies in World Fisheries: A Reexamination
No. 407 Wiens and Guadagni, Designing Rulesfor Demand-Driven Rural Investment Funds: The Latin AmericanExperience
No. 408 Donovan and Frank, Soil Fertility Management in Sub-Saharan Africa
No. 409 Heggie and Vickers, Commercial Management and Financing of Roads
No. 410 Sayeg, Successful Conversion to Unleaded Gasoline in Thailand
No. 411 Calvo, Optionsfor Managing and Financing Rural Transport Infrastructure
No. 413 Langford, Forster, and Malcolm, Toward a Financially Sustainable Irrigation System: Lessonsfrom the State ofVictoria, Australia, 1984-1994
No. 414 Salman and Boisson de Chazoumes, International Watercourses: Enhancing Cooperation and ManagingConflict, Proceedings of a World Bank Seminar
No. 415 Feitelson and Haddad, Identification of Joint Management Structuresfor Shared Aquifers: A CooperativePalestinian-Israeli Effort
No. 416 Miller and Reidinger, eds., Comprehensive River Basin Development: The Tennessee Valley Authority
No. 417 Rutkowski, Welfare and the Labor Market in Poland: Social Policy during Economic Transition
No. 418 Okidegbe and Associates, Agriculture Sector Programs: Sourcebook
No. 420 Francis and others, Hard Lessons: Primary Schools, Community, and Social Capital in Nigeria
No. 421 Gert Jan Bom, Robert Foster, Ebel Dijkstra, and Marja Tummers, Evaporative Air-Conditioning: Applicationsfor Environmentally Friendly Cooling
No. 422 Peter Quaak, Harrie Knoef, and Huber Stassen, Energyfrom Biomass: A Review of Combustion and Gasifica-tion Technologies
No. 423 Energy Sector Unit, Europe and Central Asia Region, World Bank, Non-Payment in the Electricity Sector inEastern Europe and the Former Soviet Union
No. 424 Jaffee, ed., Southern African Agribusiness: Gaining through Regional Collaboration
No. 425 Mohan, ed., Bibliography of Publications: Africa Region, 1993-98
No. 426 Rushbrook and Pugh, Solid Waste Landfills in Middle- and Lower-Income Countries: A Technical Guide toPlanning, Design, and Operation
No. 427 Mariho and Kemper, Institutional Frameworks in Successfu! Water Markets: Brazil, Spain, and Colorado, USA
No. 428 C. Mark Blackden and Chitra Bhanu, Gender, Growth, and Poverty Reduction: Special Program of Assistancefor Africa, 1998 Status Report on Poverty in Sub-Saharan Africa
No. 429 Gary McMahon, Jose Luis Evia, Alberto Pasc6-Font, and Jose Miguel Sanchez, An Environmental Study ofArtisanal, Small, and Medium Mining in Bolivia, Chile, and Peru
No. 430 Maria Dakolias, Court Performance around the World: A Comparative Perspective
No. 431 Severin Kodderitzsch, Reforms in Albanian Agriculture: Assessing a Sector in Transition
(List continues on the inside back cover)
WORLD BANK TECHNICAL PAPER NO. 470
Europe and CentralAsia Environmentally and Socially SustainableDevelopment Series
Agricultural SupportPolicies in TransitionEconomies
Edited byAlberto Valdes
The World BankWashington, D.C
Copyright © 2000The International Bank for Reconstructionand Development/THE WORLD BANK1818 H Street, N.W.Washington, D.C. 20433, U.S.A.
All rights reservedManufactured in the United States of AmericaFirst printing May 2000
Technical Papers are published to communicate the results of the Bank's work to the developmentcommunity with the least possible delay. The typescript of this paper therefore has not been prepared inaccordance with the procedures appropriate to formal printed texts, and the World Bank accepts noresponsibility for errors. Some sources cited in this paper may be informal documents that are notreadily available.
The findings, interpretations, and conclusions expressed in this paper are entirely those of theauthor(s) and should not be attributed in any manner to the World Bank, to its affiliated organizations,or to members of its Board of Executive Directors or the countries they represent. The World Bank doesnot guarantee the accuracy of the data included in this publication and accepts no responsibility for anyconsequence of their use. The boundaries, colors, denominations, and other information shown on anymap in this volume do not imply on the part of the World Bank Group any judgment on the legal statusof any territory or the endorsement or acceptance of such boundaries.
The material in this publication is copyrighted. The World Bank encourages dissemination of itswork and will normally grant pernission promptly.
Permission to photocopy items for internal or personal use, for the internal or personal use ofspecific clients, or for educational classroom use, is granted by the World Bank, provided that theappropriate fee is paid directly to Copyright Clearance Center, Inc., 222 Rosewood Drive, Danvers, MA01923, U.S.A., telephone 978-750-8400, fax 978-750-4470. Please contact the Copyright Clearance Centerbefore photocopying items.
For permission to reprint individual articles or chapters, please fax your request with completeinformation to the Republication Department, Copyright Clearance Center, fax 978-750-4470.
All other queries on rights and licenses should be addressed to the World Bank at the address aboveor faxed to 202-522-2422.
ISBN: 0-8213-4771-3ISSN: 0253-7494
Alberto Valdes is a consultant to the Rural Development Department at the World Bank.
Library of Congress Cataloging-in-Publication Data has been applied for.
Contents
Foreword .................................................................... v
Abstract ................................................................... vi
Preface .................................................................... vii
Executive Summary .................................................................... ix
Part I: Synthesis Report
MEASURES OF AGRICULTURAL SUPPORT IN TRANSITION ECONOMIES: 1994-1997 A. Valdes ........1Introduction ................................................................... 1The Approach ................................................................... 2Patterns of Intervention at the Commodity Level ................................................................... 8Aggregate Measures of Support ................................................................. 13Who Gains, Who Pays, for Agricultural Support Policies? ....................................................... 16Real Price Trends and Implications for Agricultural Profitability ............................................. 18The Bottom Line ................................................................. 22References .................................................................. 24Appendix ................................................................. 25
Part II: Country Agricultural Policy Notes
CHAPTER 1: RUSSIA E.Serova ................................................................. 29Agriculture in the Russian Economy ................................................................. 29Major Instruments of Agricultural Policy 1994-98 .................................................................. 30Background Information on Calculations of Sectoral Protection and Taxation ........................ 41Conclusions and Implications for Future Performance of the Sector ........................................ 46
CHAPTER 2: ROMANIA E. Tesluic ................................................................ 48The Romanian Agricultural Sector .................................................................. 48Agricultural Policy During Transition ................................................................. 49Calculations of Aggregate Measures ................................................................. 55Conclusion and Main Lessons ................................................................. 59References ................................................................. 61Appendix ................................................................. 62
iii

CHAPTER 3: POLAND M Safin ............................................... 65Overview on the Evolution of Farm Support Policies 1988-1997 ............................................. 65The Extent and Impact of Production-Coupled Policy Interventions ........................................ 66Production De-coupled and Overall Policy Interventions .................................................. 69Notes for Support Measurement .................................................. 71Looking Ahead .................................................. 72References .................................................. 74Appendix .................................................. 75
CHAPTER 4: BULGARIA H Gordon, N. Ivanova, N. Nikolov .................................................. 77Early Transition Years .................................................. 77Principal Intervention Mechanisms ............................................... 78Main Assumptions for Calculation of Indicators .................................................. 81Summary and Implications of Main Results .................................................. 83References .................................................. 86Appendix ............................................................ 87
CHAPTER 5: TURKEY H. Kasnakodlu, E. (7akmak .................................................. 91Introduction .................................................. 91Instruments of Agricultural Policy in Turkey .................................................. 91Measurement of Support to Agriculture .................................................. 94Transfers to Agriculture in Turkey and OECD Countries .................................................. 101Distribution of the Benefits of Agricultural Support .................................................. 105Distribution of the Burden of Agricultural Support .................................................. 113References .................................................. 114Appendix .................................................. 115
Part III: Data File .................................................... 121
iv
Foreword
The World Bank's Unit for Environmentally and Socially Sustainable Development
sponsored the study upon which this report is based. The study examined agricultural price and
trade interventions and the impacts these interventions had on farm incomes, consumer spending,
and government budgets during the years 1994-1997 in several countries in the ECA region. We
felt that the study would yield important data on the impact these interventions have in the
affected countries and become an important resource for developing further World Bank
assistance strategies for the region as a whole.
It is our hope that this report will serve as a useful information resource for agricultural
policy makers and other government officials in the region devoted to agricultural reform, as well
as providing a tool for others engaged in further research on this important issue.
Kevin CleaverDirector
Environmentally and Socially Sustainable Development UnitEurope and Central Asia Region
The World Bank
v
Abstract
This report is based on a study which examined agricultural price and trade interventions, andtheir impact on farm income, consumers' real income, and the government budget for the period1994-1997 in Bulgaria, Poland, Romania, Russia, and Ukraine. Germany and Turkey were alsoincluded in the study for comparative purposes. This report is intended for agricultural policy
makers and other government officials in the countries involved, EU officials, World Bank andFAO staff, and others interested in agricultural reform in Europe and Central Asia.
vi

Preface
This report presents the findings of a study prepared under the Regional Studies Programsponsored by the Environmentally and Socially Sustainable Rural Development Unit (ECSSD) ofthe Europe and Central Asia Regional Office (ECA) of the World Bank.
The study examined agricultural price and trade interventions, and their impact on farmincome, consumers' real income, and the government budget for the period 1994-1997 inBulgaria, Poland, Romania, Russia, and Ukraine. Germany and Turkey were also included in thestudy for comparative purposes. Turkey was the only case where the measures of priceintervention used were taken from the analysis by the OECD, and thus were not estimatesexpressive for this study.
The Synthesis chapter, which presents the comparative analysis for the seven countries, isfollowed by five country notes describing and analyzing the experience in each country.
I gratefully acknowledge the dedicated and efficient assistance of Guilherme Bastos,Claudia Ocana, and Natalie Olsen in different stages of this project, and the helpful commentsfrom Karen Brooks, Laura Tuck, and Csaba Csaki on the synthesis report.
A team of local collaborators in each country provided the basic data and initial estimatesof several of the indicators. In Bulgaria - Henry Gordon (World Bank), Nedka Ivanova andNikalay Nikolov (Soffia), in Poland - Waldemar Guba and Mariusz Safin (Warsaw), in Turkey -Haluk Kasnakoglu and Erol Carmak (Ankara), in Romania - Emil Tesliuc (Bucharest), in Russia- Eugenia Serova (Moscow), in Ukraine - Alberto Valdes for the period 1994-95 and DavidSedik of the Center for Privatization and Economic Reform (Kiev) for the period 1996-97, and inGermany - Achim Fock (World Bank) and Guenter Peter (IAMO, Halle).
Alberto Valdes (RDV)editor
vii

Executive Summary
In the pre-reform period, agriculture was heavily subsidized in most central and easternEuropean countries (CEECs). Around 1989, most CEECs began to open up their markets,liberalize prices, and reduce subsidies, and the level of support provided to agriculture declineddrastically.
Although supportive of the general direction of economic reforms, some economists havebeen concerned that the resulting decline in profitability in farming, related to lower levels ofsupport, concurrent with the implementation of major structural reforms, would slow the impetusfor farm restructuring, in particular the drive for privatization of land as demanded by potentialnew farmers. This study concludes that some CEEC countries have been reintroducing direct andindirect support to the agricultural sector since approximately 1996, while others such asRomania, have not. In some cases, most notably Russia, the agricultural sector has been taxedless in recent years.
The current structural transformations in the region have presented enormous challengesfor the public and private sectors. It is clear that an important determinant of the "efficiency" ofthis transition is the ability to access relevant and reliable socio-economic data needed to guidepublic action during the reform process. The statistical basis for analytical work on agriculture inthe transition economies studied is still weak, and the empirical work available to rigorouslyexamine the major trends in agricultural support policies, assess their impact on producer'sincome, the government budget, and on consumer's welfare, is still very limited. We hope thisstudy will go some way toward filling this gap.
The study includes Bulgaria, Poland, Romania, Russia, and Ukraine in the years between1994 and 1997. Germany and Turkey were included as comparators located at the border of theCEECs.
At the beginning of this volume a synthesis of the multi-country investigation is presentedand serves three purposes. First, it presents our own estimates of various agricultural supportindicators for the period beginning in 1994 until 1997, roughly corresponding to the second andmost recent phase of the reform period. Second, it presents an analysis of the impact of trade andprice policy interventions and of government non-price-related subsidies on productionincentives and on the net income of farmners. We examine how and to what extent governmentsin transition economies intervened to support agriculture, and through which policy instruments.Finally, it asks to what extent the economic environment prevailing in 1994-97 provided anappropriate and sound basis for adjustment towards a more internationally competitiveagricultural sector.
There are essentially two types of support policies directed towards agriculture. They areprice interventions and direct government subsidies. Market-price support operates directlythrough price-related interventions of outputs and purchased inputs. This support derives from
ix
domestic price interventions (for example, minimum-price policy) supported by foreign tradebarriers such as tariffs and quantitative restrictions (QRs) on both imports and exports. Thisintervention is reflected in the difference between the domestic and border price of a product ofsimilar quality. This support, when positive, does not necessarily imply explicit governmentoutlays, just as when negative, and referred to as taxation, does not necessarily imply fiscalrevenues. The second type of support consists of government budget transfers or subsidies madeby national as well as regional governments. These subsidies, including subsidies for capitalinvestment, land improvements, direct payments and others, do not directly affect prices receivedor paid for by farmers.
In this investigation three different indicators have been used to measure agriculturalsupport in specific production activities in various studies in other regions. These include thenominal rate of protection (NRP), the effective rate of protection (ERP), and the effective rate ofassistance (ERA). These indicators capture the direct affect of agricultural price policies on theagricultural sector itself, but do not take into account their effects on other sectors (such as onurban wages), or the repercussions of non-agricultural policies (such as high industrialprotection) on the cost structure of agriculture. They also do not adjust for misalignments of theexchange rate. All three of these indicators can, however, be used to compare the levels ofagricultural support across comrmodities, over time, and across countries.
The analysis on protection coefficients is complemented by an analysis of: (a) trends inreal domestic farm prices for the major commodities in each country, examining its implicationsfor agricultural profitability, and (b) a decomposition analysis to explain the sources of domesticfarrn price variability through time, where the variables considered include changes in borderprices, in the real exchange rate, and in domestic trade policies.
The report is structured in two parts. The first part (chapter 1) presents a synthesis of allresults for all the countries studied. The second part presents a detailed discussion of theagricultural trade and price regime in each of the countries that prevailed in the periodconsidered. A data file is available with the relevant annual data used for the analysis.
The results reported in this study confirm that some CEECs have been re-introducingdirect and indirect support to the agricultural sector. This trend is very clear between 1996 and1997 for all countries studied except Romania. Turkey and Germany maintained high levels ofoutput price protection over the years studied.
The net transfers from output, input, and credit subsidies indicate that, relative to the sizeof the sector (agricultural GDP), the net effect of government support policies has beenenormous. In some cases, government support has greatly increased sector income (by 63 percentin Ukraine in 1997) while in others, the transfer from agriculture has been extremely large (up to36 percent of agricultural GDP in Bulgaria in 1997). Such high levels of income transfers areincompatible with both improved market orientation, efficient resource allocation withinagriculture, and economy-wide growth. In these countries, fluctuations in the income of theagricultural sector have been largely determined by government policy, primarily through outputprice support, rather than by the sector's adjustment to market conditions.
x
Agricultural policy in transition economies remains unfocused and, as a result, fails tocontribute to competitiveness in the sector, or to induce an increase in the flow of privateinvestment into the sector. The significant instability of producer prices results in largefluctuations in producer income. Moreover, a large fraction of producer income is determined bygovernment policy, primarily through output price support. The profile of incentives indicates apattern of highly selective treatment, both helpful and harmful, of the various agriculturalsubsectors.
In interpreting the significance of the results of protection indicators to understand theactual agricultural supply response and private investment behavior, readers should consider that:(a) incentive is only one of the various deterninants of supply response and, particularly fortransition economies, institutional factors and developments in the rural factor markets (such asland and financial markets) are also critical; and (b) the Effective Rate of Protection is a moreappropriate indicator than the Effective Rate of Assistance (or PSE in other studies) in that itcaptures more directly the effect of policies on the returns to farming in the various activities.
While there may be no single story that characterizes trade and price interventions intransition economies, there are several important common elements. In all cases, we observe:
* extraordinarily high levels of price intervention;
* enormous implicit income transfers to and from farmers;
• high selectivity among different activities; and
- an extremely high year-to-year variability in real producer prices.
The statistical base for analytical work on agricultural support in transition economies isweak and its interpretation is exceptionally complex. That impedes real access to the informationthat policy makers need.
While part of this instability is exogenous, the impact of government price and tradepolicy in exacerbating price instability and creating additional uncertainty about returns infarming is striking. Ultimately, this instability will have a severe and adverse effect on privateinvestment prospects in the sector. To facilitate and inform the policy debate at the country level,continuous monitoring needs to be done to document the net impact of agricultural priceinterventions on efficiency and income effects.
The benefits of a more competitive sector are indisputable, including increased farmincome, lower overall prices to consumers, a reduction in government expenditures (through thereduction in subsidies), and an improved position for gaining accession to the EU. Governmentswould do well to turn their attention away from price interventions in support of agriculture, andinstead pursue programs that will increase the competitiveness of the sector, for example inproviding public goods such as research and extension services, pushing for further reform inland markets, simplifying administrative procedures, supporting the development of marketinformation systems, or devising grading systems that will improve the quality of goodsproduced. The private investment flows required to make agriculture more competitive are huge,
xi
which is why a proper incentive framework is so critical. Private investment will only beattracted to the sector if farming and agroprocessing is made profitable, guided by a credible andconsistent policy framework that more fully integrates agriculture with international markets.
xii
Part I
Synthesis Report


MEASURES OF AGRICULTURAL SUPPORT IN TRANSITIONECONOMIES: 1994-1997
Alberto Valdes
INTRODUCTION
In the pre-reform period, agriculture was heavily subsidized in most central and eastern
European countries (CEECs). Around 1989, most CEECs began to open up their markets,liberalize prices, and reduce subsidies, and the level of support provided to agriculture declined
drastically.
Although supportive of the general direction of economic reforms, some economists havebeen concerned that the resulting decline in profitability in farming, related to lower levels of
support, simultaneous with the implementation of major structural reforms, would slow theimpetus for farm restructuring, in particular the drive for privatization of land as demanded bypotential new farmers. However, preliminary evidence from 1994-95 was emerging that some
CEECs were re-introducing higher levels of support (Tangerman, 1996).
This synthesis serves three purposes. First, we present our own estimates of variousagricultural support indicators for the period beginning in 1994 until 1997, roughlycorresponding to the second and most recent phase of the reform period. Second, we present an
analysis of the impact of trade and price policy interventions and of government non-price-related subsidies on production incentives and on the net income of farmers. We examine howand to what extent governments in transition economies intervened to support agriculture, andthrough which policy instruments. Finally, we ask to what extent the economic environmentprevailing in 1994-97 provided an appropriate and sound basis for adjustment towards a moreinternationally competitive agricultural sector.
The current structural transformations have presented enormous challenges for the publicand private sectors. It is clear that an important determinant of the "efficiency" of this transitionis the ability to access relevant and reliable socio-economic data needed to guide public actionduring the reform process.
The larger study on which this note is based covered the period 1994-97 and includedBulgaria, Poland, Romania, Russia, and Ukraine. We also included Germany and Turkey ascomparators located at the border of the CEECs. Following a common format, local collaborators

2 A. Valdes
in each country provided the basic data and initial estimates of several of the indicators. Arefined and comprehensive version of this database is available from ECSSD at the World Bank.
THE APPROACH
The debate on agricultural support in transition economies has, in most cases, focused onthe evolution of the terms of trade (prices received relative to prices paid) relative to a baseperiod. Indications of deteriorating terms of trade against agriculture, one of which is thepurchasing power of outputs relative to inputs (for example, the price of grain relative to theprice of fertilizer) have been used to justify the need for agricultural subsidies in the region, justas they have been elsewhere in the world. However, relative prices such as these fail to capturethe misalignments of policies and incentives in the base period.
Moreover, the cornerstone of agricultural policy reform in countries all over the world isthat prices paid by farmers for inputs, and the prices paid for their products, should be similar tothe real value of those goods to the economy as a whole. That is, for products that can be tradedinternationally, they should pay and receive prices that are close to international prices forimports and exports (farm production), as well as for inputs and services. For this reason, wefocused on the effect of prevailing policies in any given year relative to world prices of outputand tradable inputs for that year. In addition, we examined the evolution of real producer pricesduring the 1994-97 period as a proxy for the changes in profitability in farming. To more fullyunderstand the causes of evolution of real producer prices ("real" meaning farm prices deflatedby the consumer price index), we broke down the (percentage) change in real producer pricesinto its three component parts: changes in border prices, changes in the real exchange rate, andthat part of the fluctuations that could be attributed to changes in domestic price interventions.This approach provides rough estimates of the magnitude and direction of changes in thesevariables.
There are essentially two types of support policies directed towards agriculture. They areprice interventions and direct government subsidies. Market-price support operates directlythrough price-related interventions of outputs and purchased inputs. This support derives fromdomestic price interventions (for example, minimum-price policy) supported by foreign tradebarriers such as tariffs and quantitative restrictions (QRs) on both imports and exports. Thisintervention is reflected in the difference between the domestic and border price of a product ofsimilar quality. This support, when positive, does not necessarily imply explicit governmentoutlays, just as when negative, and referred to as taxation, does not necessarily imply fiscalrevenues. The second type of support consists of government budget transfers or subsidies madeby national as well as regional governments. These subsidies, including subsidies for capitalinvestment, land improvements, direct payments and others, do not directly affect prices receivedor paid for by farmers.

Measures ofAgricultural Support in Transition Economies: 1994-1997 3
We looked at three different indicators that have been used to measure agriculturalsupport in specific production activities in various studies in other regions'. These include thenominal rate of protection (NRP), the effective rate of protection (ERP), and the effective rate ofassistance (ERA). These indicators capture the direct affect of agricultural price policies on theagricultural sector itself, but do not take into account their effects on other sectors (such as onurban wages), or the repercussions of non-agricultural policies (such as high industrialprotection) on the cost structure of agriculture. They also do not adjust for misalignments of theexchange rate. All three of these indicators can, however, be used to compare the levels ofagricultural support across commodities, over time, and across countries.
The application of these indicators to transition economies raises some issues. One iswhether to adjust for excessive margiris in marketing. Two, whether to adjust the indicators forexchange rate misalignment. Three, the lack of data on government expenditures on individualproduction activities at the commodity level.
A high producer price/border price margin could be due to poor physical and institutionalinfrastructure, an uncompetitive agroprocessing industry, or the high intermediate transactioncosts for traders due to erratic policy changes regarding QRs on imports or exports. Althoughthey do not result from explicit government policies on agriculture, these high margins indirectlytax farmers by raising the cost of moving and processing domestic production. This indirecttaxation could be interpreted as a policy failure that weakens competitiveness in upstream anddownstream activities (Harley, 1996). Thus, it is important to distinguish between trade and pricepolicies (which can be corrected quickly), and structural flaws in the market (which take longerto correct).
For example, due to the high risks involved in exporting grains, Ukrainian traders chargedvery high margins on exports (20%) as compared to 10% in Hungary and 5% in more-developedcountries. For our analysis, a portion of the traders' commission in Ukraine (10%) equal to theprevailing commission in Hungary was treated as an implicit tax on exporters. The Ukrainiantraders' commission was a result of inefficiencies in the market structure and anti-export biasesin public policy. Such differences can occur when, for example, the government controls the
transportation system and gives priority to the transport of products purchased by state-ownedenterprises. In doing so, they create uncertainty as to the time privately exported commoditieswill actually be delivered. To compensate for this uncertainty, traders will charge higher margins.
The exchange rate is implicit in all our measures (it is used in comparing the domestic tothe border prices), therefore a misalignment in the exchange rate can significantly affect ourmeasures of the potential competitiveness of agricultural tradables. For example, in the casewhere the zloty or ruble loses against the dollar (devaluation), domestic farmers benefit as theirrevenues increase in local currency because farm trade is priced in dollars. However, if the
' Agricultural markets have been the preferred use of such indicators in part because one is dealing with commoditiesin which assuming substitutability between the domestic and foreign products is not unreasonable. This is lessrealistic for manufactured products.

4 A. Valdes
farmer has debts linked to the dollar, part of the windfall from the devaluation is lost. In thisstudy, rather than attempt to make adjustments for this misalignment, the exchange rate effect onproducer prices is captured indirectly.
Measuring government outlays is difficult since data on expenditures is usually availableonly at the sector level, not the commodity level. Furthermore using the central government'sbudget as a source for tracking government expenditures on agriculture presents severalchallenges. For example for Russia, on the one hand budgetary support to the credit-in-kindprogram appeared as a reduction in revenue, rather than an item of expenditure. Second, aportion of government support for agriculture also takes the form of mutual clearing ofobligations (swaps of enterprise debts to the budget for past loans and budget debts to theenterprises for products delivered to the federal food fund. Third, in 1995-96 there were extrabudgetary funds for agriculture (and mining) from a tax of 1.5% on gross revenues of enterprisesin all sectors of the economy. For these and other reasons, the Ministry of Agriculture, Ministryof Finance, and the National Statistical Committee report different figures on governmentsupport to agriculture.
In addition, we have data on government outlays, but are unable to differentiate whetherthese expenditures really represent income transfers to farmers, or if they in fact capture transfersto input suppliers, to the agroprocessing industry, or simply reflect the cost of an excessivebureaucracy.
In what follows, I first present a brief description of the protection indicators used at theindividual product level, and then provide a picture of the aggregate effects for the sector as awhole.
DIRECT PRICE COMPARISON OF BORDER AND FARM PRICES: NOMINAL RATE OF PROTECTION(NRP)
The nominal rate of protection (NRP) is the simplest and most widely used indicator,defined as the difference between the domestic and border prices at the prevailing nominalexchange rate, in most cases expressed as the "tariff equivalent" of tariffs and non-tariff barriers(or export taxes and subsidies)2. The NRPs were computed as follows:
(i) The selected commodities were defined as either import-competing (in whichcase c.i.f. prices were used) or exportable (f.o.b. prices used) based on actual tradestatus. Shifts in trade status (from importable to exportable, or vice versa) weretaken into account.
2One starts from the expression Pj = Pj*Eo(I +tj) where Pj, Pj*, Eo and tj represent the domestic price of good j, theborder equivalent price ofj, the nominal exchange rate, and the tariff equivalent for j, respectively. The NominalProtection Rate (NPR) for good j is NPRj = (Pj-Pj *Eo)/Pj *Eo = (Pj/Pj *Eo)- 1.

Measures ofAgricultural Support in Transition Economies: 1994-1997 5
(ii) The border price was chosen based on the prevailing price at the time of yearwhen most imports or exports of that commodity take place. This price dependson the quality and grade of the commodity analyzed, be it a product or input. Theworld price should refer to a commodity of a similar quality to that produceddomestically. For example, reference prices for Poland were derived from actualborder prices for the three main trading blocks: the European Union (westernborders), CEFTA countries (southern borders) and the Former Soviet Union(eastern borders). An average reference price, weighted by the respective shares oftrade going in each of the three trade directions, was then computed for eachproduct.
(iii) Identification of the point in the marketing channel from which domesticproducer prices and corresponding border-price equivalents can be contrasted,such as price paid at the buying agency for wheat (usually the flour mill), or at theslaughter house for pigs, or at the milk processing plant. It is seldom the farm gateprice.
(iv) After the border price has been transformed into domestic currency, all costsrelating to transport, storage, handling, loading, and marketing, as well as taxesand subsidies to trade in the commodity in question, must be subtractedfrom/added to the border price up to the point in the marketing channel wheredomestic and border prices are being compared.
(v) In addition to adjusting for quality differences with the traded commodity, themarketing channel used in the sales transaction has to be defined (i.e. private cashmarket, state-owned procurement, and barter transactions). Procurement prices bystate agencies might differ from market prices, and in some cases small farmproduction gets a different price.
Which domestic price should one use? An example from Ukraine helps us understand one
of the several reasons why different studies can generate different nominal rates of protection.The Ukrainian government played an important role in 1994-95 as the main purchaser of milling-quality wheat. Use of the state procurement price would not take into account the other qualitiesof wheat that were also produced but sold through other channels, nor could one reasonablyestimate average barter prices. Moreover, payments by state agencies might be delayed by
months while the delay in the private market would be much less. All contracts with stateagencies involved the banking system, while private and barter transactions did not. Banktransactions (at least in 1996) were at a disadvantage because private bank accounts werecontrolled by the government, and the money in the accounts could be blocked if the firm or
individual in question owed taxes or had not complied with the state agencies' contracts. Forboth reasons, the accepted price in cash or barter transactions could be significantly lower than
the procurement prices. This has to be decided on a product-by-product basis for each country.
One way of handling this would be to use a weighted average of the various prices for any onecommodity in a given year.

6 A. Valdes
MEASURING THE EFFECTS OF TRADE BARRIERS AND PRICE INTERVENTIONS ON VALUEADDED: EFFECTIVE RATE OF PROTECTION (ERP)
The effective rate of protection (ERP) measures the joint effects of trade barriers andprice interventions on product and tradable inputs on value added (returns to primary factors,including land, labor, and capital) in a particular activity.3 Tradable inputs include agrochemicals,fuel, machinery, and equipment. For example, tariffs on imports of fertilizers and farmmachinery represent implicit 'taxes' levied against the consumers of those inputs, in this case thefarm sector. Or, we may see the opposite effect, such as in the Ukraine in 1995, when fertilizerexports were permitted only on the condition that the (mainly state-owned) fertilizer industrysold fertilizer to farmers at below the border price. The credit-in-kind program in Russia isanother illustration of the complexity in determining the relevant fuel price interventions (seeChapter 1).
In the absence of any trade restrictions or price interventions, the ERPs would beapproximately equal to zero. If, as a result of domestic price and trade interventions, domesticreturns to primary factors are less than those obtained on the international market, the ERPswould be negative, and if domestic returns to primary factors are greater than those obtained onthe international market (such as for beef and sugar in western Europe), ERPs would be positive.
An important attribute of the ERP approach is that it helps to capture interactionsbetween farm activities. For example, in Germany the prevailing low level of protection offeedgrains (low NRPs) led to substantially high effective protection of meat production. TheNRP on beef in Germany in 1997 was 109%, while the corresponding ERP was nearly 300%.That is, value added per ton at domestic prices was nearly three times the value added per ton atborder price equivalents. For the same reason, the corresponding NRP for pig production in 1997was 18%, while the corresponding effective protection was 37%.
The calculation of effective rates of protection (ERPs) requires data on production costs,in order to estimate the share of the cost of inputs in producer price. Based on farm-cost data, thestandard approach is to use the domestic input shares to compute the value added per unit at bothdomestic and border prices. But of course this fixed-coefficient approach does not account for thepossibility of substitution among inputs due to price changes, and hence could overestimate thevalue added at world prices. This could happen because farmers could substitute higher- pricedinputs for lower-priced ones if trade barriers on inputs were removed or lowered. For example, inUkraine between 1991 and 1994, the price of fuel increased substantially relative to other inputs.It is not surprising therefore to observe that the share of fuel in the production cost of one ton ofwheat, for example, was lowest in 1993. The share in costs of mineral fertilizers also decreasedbetween 1991 and 1994.
3The efffective rate of protection can be defined as follows: EPRj= VAj - VAj*/VAj* = (VAj/VAj*)-l where VAjand VAj* represents value added at domestic and at border price equivalent, respectively.

Measures ofAgricultural Support in Transition Economies: 1994-1997 7
In analyzing the cost of production for some countries, one should make a distinctionbetween private small- and medium-sized farms and privatized (usually large) agriculturalenterprises. Private farms usually have to rely on non-subsidized private input suppliers (orobtain some services from the large former state farms), while the agricultural enterprises areoften better connected to the state supply system and have greater access to inputs and equipmentat subsidized prices. In most transition countries, very little is known about the cost structure ofprivate-sector small- and medium-sized farms. Moreover, the data on machinery use andestimates of the opportunity cost of machinery is not available for many activities in some of theselected countries.
ADDING THE EFFECTS OF GOVERNMENT EXPENDITURES: EFFECTIVE RATE OF ASSISTANCE(ERA)
The ERA is closely related to the effective rate of protection in that the focus is on the effect ofthe activity in question on value added, but in addition to price-related interventions, it alsocaptures the effects of government expenditures on farm income.4
The calculation of effective rates of assistance requires data on government expendituresand credit subsidies. In some countries (such as Turkey and Ukraine) credit subsidies havebecome the main vehicle of public transfers to producers. For example in the Ukraine in 1993,because the annual inflation rate had reached four digits, but the fixed annual interest rate wasless than one-tenth the inflation rate, subsidized credit resulted in substantial income transfers toborrowers. In 1994, inflation declined, but only about 33% of the real value of all loans was paidback.
One must be careful in interpreting figures on credit subsidies as they affect farmerincome. First, because most of the credit subsidies could have been allocated to the largeragricultural enterprises. Second, because the credit could have been given to input suppliers whoonly transferred part of it to farmers (estimated to be between 50-70% of the credit flows in theUkraine). In actual computation, for credit that was repaid within the years, credit subsidies weremeasured as the interest rate differential between the actual lending rate for agriculture and theaverage prevailing lending rate in the economy (multiplied by actual credit flows). Credit thatwas not repaid was treated as a grant.
A variant of the effective rate of assistance, the PSE, has been used extensively by theOECD in their monitoring programs and by GATT during the Uruguay Round of MultilateralTrade Negotiations. The PSE measures the amount of compensation that would be required tomaintain producer's income when all forms of assistance are removed. It is calculated in twosteps: first by quantifying the difference between domestic and border prices (as in the NRP
4 The effective rate of assistance, ERAj, can be defined as ERAj=(VAj-VAj*+NPSj)/VAj, where NPSj representsthe total non-price support to commodity j. Conceptually, ERA is defined with respect to the value added at borderprices, which means comparing the overall effect of current agricultural policies with a free-trade scenario.
8 A. Valdes
above), and second by summing budgetary transfers to producers. The result of the two steps isthen added together. In most cases the PSE is expressed as a ratio of the value of domesticproduction at domestic (or world) prices. The principal difference between the ERA and the PSEis that the ERA takes explicit account of the effect of trade policies on tradable inputs (as well ason output) and is expressed relative to value added rather than to the gross value of output.
Commodity Coverage and Data Sources
For each country, we selected approximately eight commodities, representative of themajor import-competing and export products. The basic data used in the analysis was obtaineddirectly from various domestic sources by the country collaborators, and presented in a standardformat for comparison. Output-price support for the selected countries was measured for aspecific basket of commodities that in most countries covered between 40-80 percent of the totalvalue of agricultural production. Credit and other government subsidies are usually not reportedon a commodity-specific basis, so we had to decide on a criterion for its allocation to the variousactivities. Net transfers are presented for the entire agricultural sector for Romania, Poland andTurkey, while for Ukraine and Bulgaria, net transfers cover only the commodities included in thestudy.
Because we were also interested in the difference in the impact of agricultural policiesamong regions and between state and private-sector farms, an analysis of agricultural support byregion and by farm size was made for Poland and Turkey (these are reported in greater detail inthe country notes presented in the full study). The distinction by type of farms (private vs. quasi-state fanns) was examined for Romania and Ukraine, since some policy transfers are linked tospecific commodities that are predominantly or exclusively produced by either state or privatefarms (for example, in Romania, pork and poultry are mainly produced by quasi-state farms andare heavily subsidized, while beef and milk, produced by small private farms, are taxed).
PATTERNS OF INTERVENTION AT THE COMMODITY LEVEL
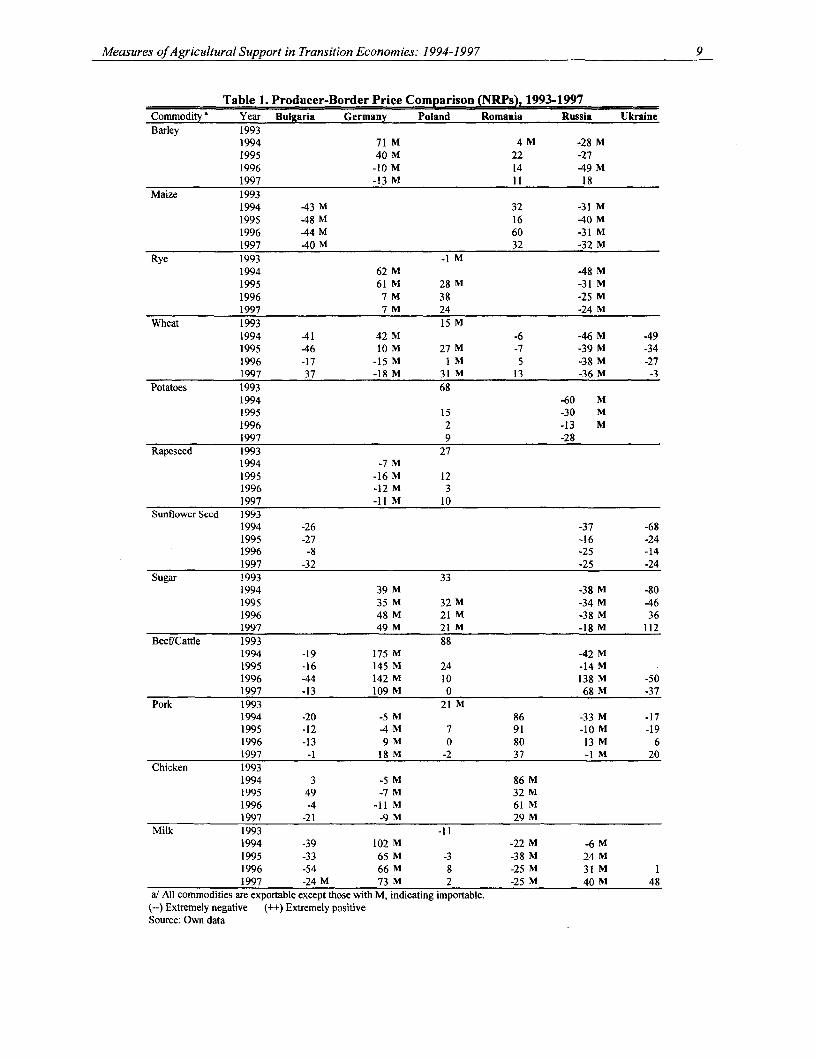
Tables 1 and 2 present nominal and effective rates of protection for the principalimportable and exportable commodities.
Two findings on the nominal protection rates should be highlighted. One is that with fewexceptions, the profile of NRPs reveals very high levels of price intervention, e.g. wide pricedifferentials between domestic and border prices. NRPs (positive or negative) of 30% or moreare common, and several commodities are subject to protection or taxation exceeding 40%.Bulgaria and Russia consistently taxed nearly all of the products analyzed. In contrast, Romaniaoffered high levels of protection to most products, except milk.
Measures ofAgricultural Support in Transition Economies: 1994-1997 9
Table 1. Producer-Border Price Comparison (NRPs), 1993-1997Commodity a Year Bulgaria Germany Poland Romania Russia UkraineBarley 1993
1994 71 M 4 M -28 M1995 40 M 22 -271996 -10 M 14 49 M1997 -13 M 11 18
Maize 19931994 -43 M 32 -31 M1995 -48 M 16 -40 M1996 44 M 60 -31 M1997 -40 M 32 -32 M
Rye 1993 -1 M1994 62 M -48 M1995 61 M 28 M -31 M1996 7 M 38 -25 M1997 7 M 24 -24 M
Wheat 1993 15 M1994 -41 42 M -6 -46 M -491995 -46 10 M 27 M -7 -39 M -341996 -17 -15 M IM 5 -38 M -271997 37 -18 M 31M 13 -36 M -3
Potatoes 1993 681994 -60 M1995 15 -30 M1996 2 -13 M1997 9 -28
Rapeseed 1993 271994 -7 M1995 -16 M 121996 -12 M 31997 -11 M 10
Sunflower Seed 19931994 -26 -37 -681995 -27 -16 -241996 -8 -25 -141997 -32 -25 -24
Sugar 1993 331994 39 M -38 M -801995 35M 32 M -34 M -461996 48 M 21M -38 M 361997 49 M 21M -18 M 112
Beef/Cattle 1993 881994 -19 175 M -42 M1995 -16 145 M 24 -14 M1996 44 142 M 10 138 M -501997 -13 109 M 0 68 M -37
Pork 1993 21 M1994 -20 -5 M 86 -33 M -171995 -12 -4 M 7 91 -10 M -191996 -13 9 M 0 80 13 M 61997 -1 18 M -2 37 -I M 20
Chicken 19931994 3 -5 M 86 M1995 49 -7 M 32 M1996 -4 -11 M 61 M1997 -21 -9 M 29 M
Milk 1993 -111994 -39 102 M -22 M -6 M1995 -33 65 M -3 -38 M 24 M1996 -54 66 M 8 -25 M 31 M 11997 -24 M 73 M 2 -25 M 40 M 48
a/ All commodities are exportable except those with M, indicating importable.(--) Extremely negative (++) Extremely positiveSource: Own data
10 A. Valdes
Table 2. Value Added at Domestic and Border Prices (ERPs)Commodity a Year Bulgaria Germany Poland Romania Russia UkraineBarley 1993
1994 143 M -29 M1995 68 M -271996 -14 M -55 M1997 -17 M 36
Maize 19931994 42 M 59 -32 M1995 48 M 28 40 M1996 44 M 96 -32 M1997 -39 M 55 -34 M
Rye 1993 -21 M1994 105 M -50 M1995 109 M 38 M -32 M1996 9 M 72 -26 M1997 9 M 21 -27 M
Wheat 1993 20 M1994 -39 67 M -6 -48 M -541995 -46 14 M 94 M 0 -40 M -471996 -14 -19 M 6M 25 -42 M -221997 44 -24 M 91M 20 -41 M 87
Potatoes 1993 +1994 -60 M1995 134 -30 M1996 -4 -13 M1997 8 -28
Rapeseed 1993 1241994 -11 M1995 -23 M 141996 -22 M 41997 -15 M 52
Sunflower Seed 19931994 -18 -39 -831995 -23 -15 -251996 2 -28 191997 -29 -31 -7
Sugar 1993 3961994 50 M -39 M -751995 44 M 71 m -34 M ++1996 61 M 28NM -41 M 881997 62 M 79M -20 M 350
Beef/Cattle 1993 961994 -10 369 M -42 M1995 12 308 M -32 -11 M1996 -- 591 M -26 211 M 341997 41 353 M -58 83 M 96
Pork 1993 26 M1994 -17 -20 M ++ -32 M 4221995 15 -14 M -8 ++ -7 M 511996 -44 19 M -47 ++ 18 M -421997 -11 37 M -53 45 I M -51
Chicken 19931994 14 -31 M 314 M1995 217 -28 M 58 M1996 16 -17 M 177 M1997 -33 -11 NM 30 M
Milk 19931994 -50 198 M -35 M -4 M1995 -29 108 M -27 -52 M 34 M1996 -- 131 M 9 -44 M 45 M 61997 -59 M 147 M 5 -35 M 51 M 164
a/ All commodities are exportable except those with M, indicating importable.(--) Extremely negative (++) Extremely positive
Source: Own data
Measures ofAgricultural Support in Transition Economies: 1994-1997 11
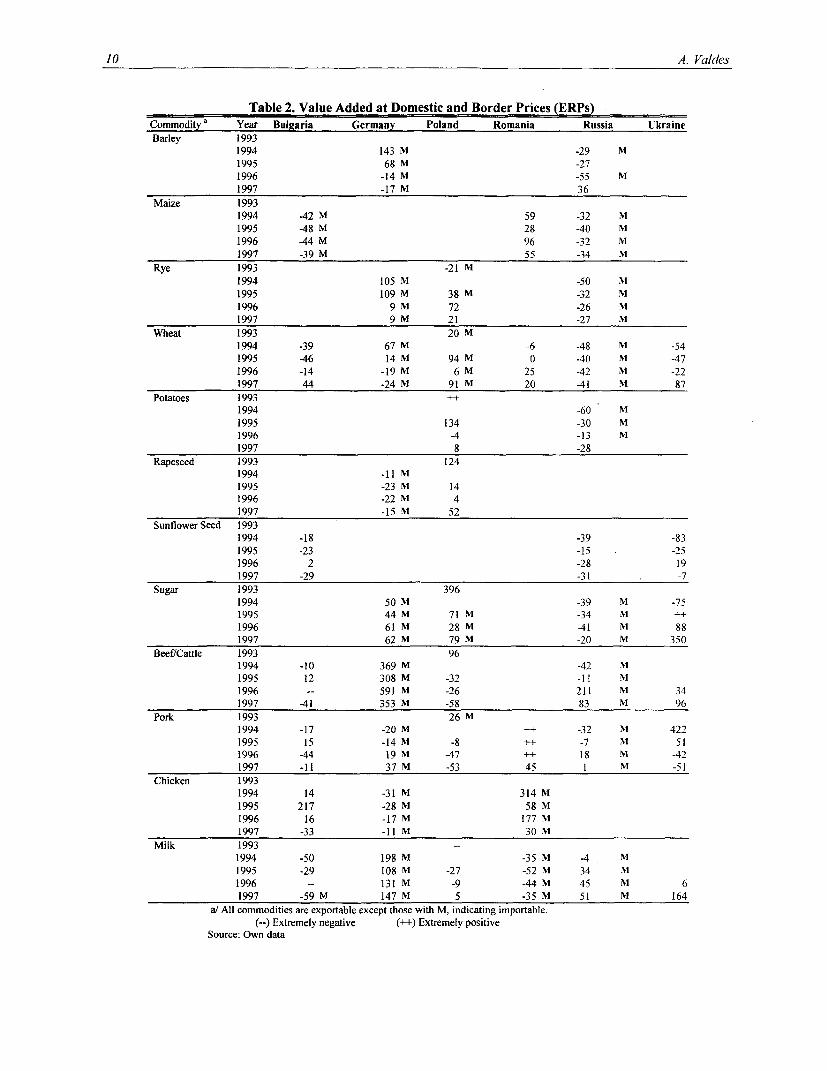
Second, the data reveal a highly selective and discretionary treatment afforded toproducers of certain products. In Poland in 1997, the NRPs ranged from a subsidy of 31% forwheat to taxation of 2% on pig meat production. In Russia, during 1997, NRPs ranged from68%, for beef cattle, to -36% for sunflower seed. In Romania during 1997, the NRPs rangedfrom a subsidy of 37% for pig production to taxation of 25% on milk. This dispersion of NRPsrepresents an extraordinarily high degree of discrimination among the various activities.
In order to determine the effect of interventions on farmer income and cropping patterns,we turn to the measure of effective rate of protection (see Table 2). One should bear in mind thatthe ERP estimates are rough approximations because the data obtained for this study, inparticular data on the cost structure and on domestic border price comparisons, were not reliableenough to yield precise estimates. By using the same cost coefficients in computing value addedat border and domestic prices, one does not adjust for the possibility of input substitution thatmight result when farmers substitute lower-priced inputs for higher-priced inputs as relativeprices change due to policy reforms.
As shown in Table 2, ERP values range from -83% to 96%, and in many cases, theyexceed +/- 50%. These are incredibly high levels of intervention compared to those of mostcountries. Negative values occurred more frequently than expected (especially in Bulgaria andUkraine before 1996). In Germany, the low NRP for feedgrains led to very high ERPs for meatproduction.
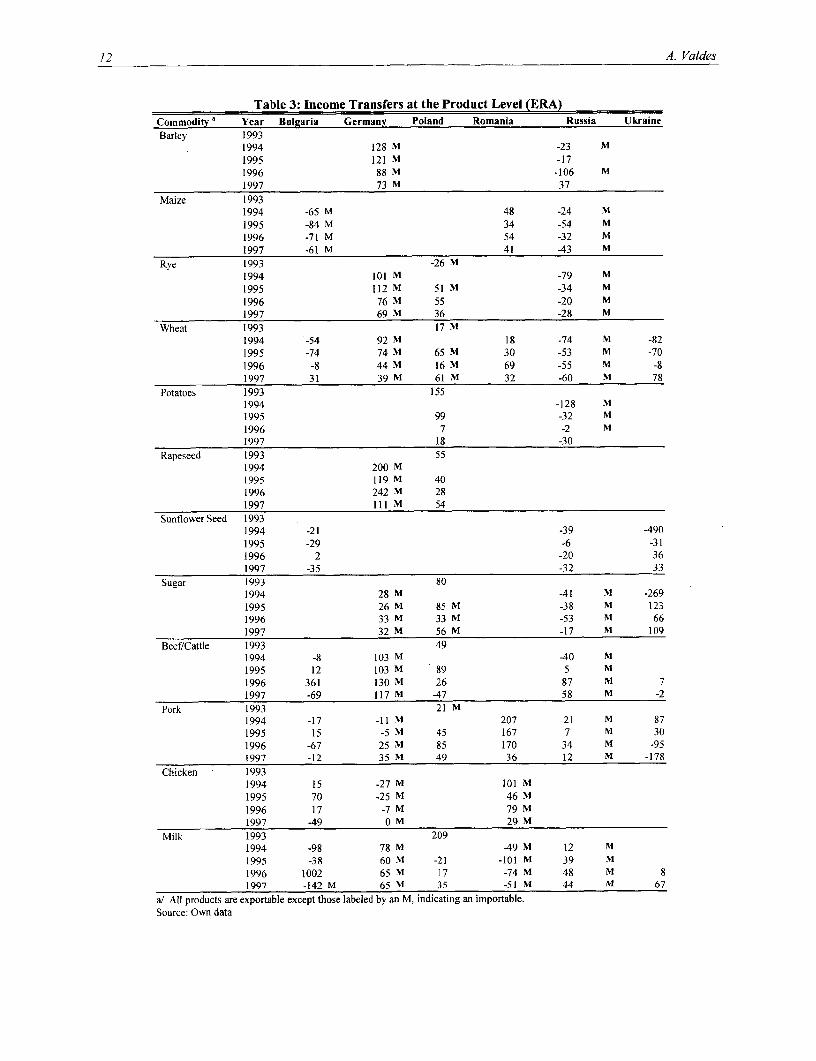
Table 3 summarizes the effective rate of assistance (ERA) calculations by commodity,expressed as a percentage of the corresponding activity's value added. Among these countries,transfers made to producers of different crops vary greatly, and there is no single story thatapplies to all of these countries.
Wheat producers in all countries received significant transfers from the government in1997, except Russia, although prior to that, both Ukraine and Bulgaria heavily taxed them. Until1995, Bulgaria and Russia were the countries that had consistently taxed mostly allcommodities. On the other hand, Germany, Poland, and Romania have been consistentlysupporting most of the commodities during the four-year period.
For example, in Germany, livestock products (in particular, pork) have been subject tomore generous support than that provided to crops. The only commodity in Germany that has notbeen systematically supported is poultry. Although taxation on chicken producers shows asignificant decreasing trend, in previous years, 25% of the value added by the poultry sector wastaxed. It is interesting to observe that in Bulgaria, the government has increasingly supported thepoultry sector, although the NRP figures show that the sector has been taxed in 1996 and 1997.In general, we observe a clear trend of increasing support for almost all commodities which usedto be taxed and decreasing support for those that used to be supported.
12 A. Valdes
Table 3: Income Transfers at the Product Level (ERA)Commodity Year Bulgaria Germany Poland Romania Russia UkraineBarley 1993
1994 128 M -23 M1995 121 M -171996 88 M -106 M1997 73 M 37
Maize 19931994 -65 M 48 -24 M1995 -84 M 34 -54 M1996 -71 M 54 -32 M1997 -61 M 41 43 M
Rye 1993 -26 M1994 101 M -79 M1995 112 M 51 M -34 M1996 76 M 55 -20 M1997 69 M 36 -28 M
Wheat 1993 17 M1994 -54 92 M 18 -74 M -821995 -74 74 M 65M 30 -53 M -701996 -8 44 M 16M 69 -55 M -81997 31 39 M 61M 32 -60 M 78
Potatoes 1993 1551994 -128 M1995 99 -32 M1996 7 -2 M1997 18 -30
Rapeseed 1993 551994 200 M1995 119 M 401996 242 M 281997 111 M 54
Sunflower Seed 19931994 -21 -39 4901995 -29 -6 -311996 2 -20 361997 -35 -32 33
Sugar 1993 801994 28 M 41 NM -2691995 26 M 85NM -38 M 1231996 33 M 33 M -53 M 661997 32 M 56NM -17 M 109
Beef/Cattle 1993 491994 -8 103 M -40 M1995 12 103M 89 5 M1996 361 130NM 26 87 M 71997 -69 117 M -47 58 M -2
Pork 1993 21 M1994 -17 -1 NM 207 -21 M 871995 15 5 M 45 167 7 M 301996 -67 25 M 85 170 34 M -951997 -12 35 M 49 36 12 M -178
Chicken 19931994 15 -27 M 101 M1995 70 -25 M 46 M1996 17 -7 M 79 M1997 -49 0M 29 M
Milk 1993 2091994 -98 78 M 49 M 12 M1995 -38 60 M -21 -101 M 39 M
1996 1002 65 M 17 -74NM 48 M 81997 -142 M 65 M 35 -51M 44 M 67
a/ All products are exportable except those labeled by an M, indicating an importable.Source: Own data
Measures ofAgricultural Support in Transition Economies: 1994-1997 13
In Romania, the period of 1994-96 was characterized by producer-price subsidies of
inefficient producers such as pig and poultry, varying taxation of cereals, and heavy taxation of
milk production (to keep consumer prices low). Near-total control over transport, storage,
processing, and finance by state agencies severely limited private-sector competition in
agriculture. In 1997, subsidies were reduced, agricultural commodity prices and trade were
liberalized. As discussed in the country note, the main causes of stagnation in production since
then have been the failure to liberalize factor markets (most notably land), the postponement of
the privatization of significant marketing chains, and the delay of privatization of state farms and
grain storage.
AGGREGATE MEASURES OF SUPPORT
Whereas the previous tables provide a picture of income transfers at the product level, we
now look at the aggregated transfers for our set of commodities, and in some cases for the whole
sector. This aggregate value is the sum of all the output and input price-related transfers and non-
price related government expenditures for that set of commodities, or for a country's agriculturalsector, in a given year, expressed as a proportion of agricultural GDP.
Total support (+) or tax (-) in output markets by country for the period 1994-97 is shown
in column 1, Table 4. The very different experience across countries is remarkable. On the one
hand, we observe consistently high (overall) protection in Turkey, Germany, and Poland, and to a
lesser extent Romania. In contrast, one observes consistently high negative protection (what we
refer to as taxation) in Bulgaria, Russia and Ukraine (except in 1997). The magnitudes of the
income transfers were very high. In Poland and Turkey in 1995-1997, output price interventions
increased gross agricultural income by between 9% and 17%, and by approximately 23%,
respectively. The dominant instruments for transferring income from Bulgarian farmers were
policies affecting output prices, typically in the form of explicit output taxation, which far
outweighed the small positive transfers provided through input price and fiscal measures. Outputprice interventions reduced gross agricultural income in Bulgaria by 27 to 34%. In Russia, farm
gate prices remain below international levels, however this price gap has been reducing over the
years as a result of the economic reforms implemented.
There are inevitable year-to-year fluctuations in these estimates due to world price
fluctuations that are exogenous to domestic policies. However, the consistently high and positive
values for Germany and Turkey (and to a lesser extent in Poland) and the high and negative
values for Bulgaria are striking, and the magnitude of these transfers is very large relative to farm
income.

14 A. Valdes
Table 4. Government Support of Selected Commodities, as % of AgriculturalGDP
Commodity Year Output Price Input Price Non-price TotalTransfers Transfers related Transfers
Transfers (ERA)Bulgaria 1994 -44.8 10.5 4.0 -30.2
1995 -34.7 13.2 3.0 -18.51996 -42.1 7.5 3. -31.51997 -29.3 -9.3 2.4 -36.1
Poland 1993 31.8 -15.5 n.a. 16.31995 16.7 -14.0 8.7 11.41996 9.1 -8.1 9.9 10.91997 10.9 -3.3 10.8 18.4
Romania 1994 10.9 -4.8 6.2 12.31995 2.2 -2.4 5.0 4.81996 15.6 -9.2 5.1 11.51997 5.3 -4.4 2.5 3.4
Russia 1994 -59.8 2.1 19.5 -38.2
1995 -16.0 3.0 11.4 -1.6
1996 -5.2 2.9 12.8 10.6
1997 -7.4 2.1 8.8 3.4Ukraine 1994 -99.8 39.4 12.4 -48.0
1995 -35.2 36.6 3.0 4.41996 -13.1 18.0 12.6 17.51997 11.6 24.9 26.1 62.6
Germany 1994 58.1 -7.6 29.0 79.41995 44.6 -5.0 28.3 67.91996 35.4 1.2 30.1 66.81997 38.5 1.6 27.8 67.9
Turkey 1994 15.0 3.0 17.0 35.01995 23.0 2.0 17.0 42.01996 24.0 3.0 7.0 34.0
Note: Commodities included for each country are as follows: Bulgaria: wheat, maize, sunflower seed, veal,pork, chicken, cow milk. Poland: wheat, rye, oilseed rape, sugar beet, potatoes, pig, cattle, and milk.Romania: wheat, feed barley and maize, pig meat, chicken, cow milk. Russia: barley, maize, rye, wheat,sunflower seeds, sugar, potatoes, beef, pork, and milk. Ukraine: wheat, sunflower seed, sugar beet, andpork. (Milk and beef added in 1996/97) Germany: wheat, barley, rye, sugar, rapeseed, beef, pork, chicken,milk.
For Bulgaria, non-price transfers correspond to credit subsidies, and others non-price transfers. ForPoland, non-price transfers correspond to credit subsidies, income tax differential treatment (grossing upfor the selected group of commodities based on the value of production), and costs of the Agency ofAgricultural Markets (AAM). For Romania and Ukraine, non-price transfers correspond to creditsubsidies. For Germany, non-price transfers correspond to National Payments (fuel and credit subsidies,income compensations, and exchange rate compensations), and EU transfers (direct payments and inputsubsidies).
Effective rate of assistance, expressed as percentage of agricultural GDP rather than as value of output,which is the standard definition in PSE calculations. The PSE usually does not adjust for input priceinterventions.n.a. Not available.source: Own data
Measures ofAgricultural Support in Transition Economies: 1994-1997 15
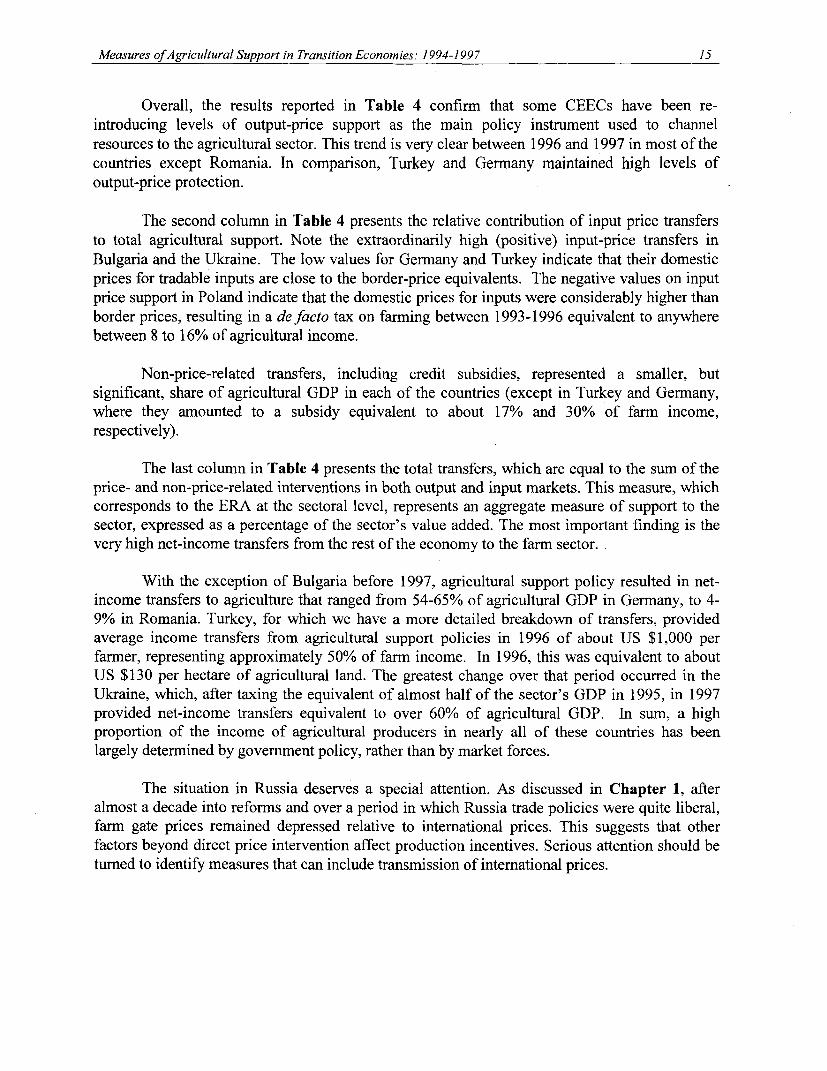
Overall, the results reported in Table 4 confirm that some CEECs have been re-introducing levels of output-price support as the main policy instrument used to channelresources to the agricultural sector. This trend is very clear between 1996 and 1997 in most of thecountries except Romania. In comparison, Turkey and Germany maintained high levels ofoutput-price protection.
The second column in Table 4 presents the relative contribution of input price transfersto total agricultural support. Note the extraordinarily high (positive) input-price transfers inBulgaria and the Ukraine. The low values for Germany and Turkey indicate that their domesticprices for tradable inputs are close to the border-price equivalents. The negative values on inputprice support in Poland indicate that the domestic prices for inputs were considerably higher thanborder prices, resulting in a defacto tax on farming between 1993-1996 equivalent to anywherebetween 8 to 16% of agricultural income.
Non-price-related transfers, including credit subsidies, represented a smaller, butsignificant, share of agricultural GDP in each of the countries (except in Turkey and Germany,where they amounted to a subsidy equivalent to about 17% and 30% of farm income,respectively).
The last column in Table 4 presents the total transfers, which are equal to the sum of theprice- and non-price-related interventions in both output and input markets. This measure, whichcorresponds to the ERA at the sectoral level, represents an aggregate measure of support to thesector, expressed as a percentage of the sector's value added. The most important finding is thevery high net-income transfers from the rest of the economy to the farm sector.
With the exception of Bulgaria before 1997, agricultural support policy resulted in net-income transfers to agriculture that ranged from 54-65% of agricultural GDP in Germany, to 4-9% in Romania. Turkey, for which we have a more detailed breakdown of transfers, providedaverage income transfers from agricultural support policies in 1996 of about US $1,000 perfarmer, representing approximately 50% of farm income. In 1996, this was equivalent to aboutUS $130 per hectare of agricultural land. The greatest change over that period occurred in theUkraine, which, after taxing the equivalent of almost half of the sector's GDP in 1995, in 1997provided net-income transfers equivalent to over 60% of agricultural GDP. In sum, a highproportion of the income of agricultural producers in nearly all of these countries has beenlargely determined by government policy, rather than by market forces.
The situation in Russia deserves a special attention. As discussed in Chapter 1, afteralmost a decade into reforms and over a period in which Russia trade policies were quite liberal,farm gate prices remained depressed relative to international prices. This suggests that otherfactors beyond direct price intervention affect production incentives. Serious attention should beturned to identify measures that can include transmission of international prices.

16 A. Valdes
WHO GAINS, WHO PAYS, FOR AGRICULTURAL SUPPORT POLICIES?
The literature of welfare economics holds that the cost of agricultural support policiesfalls into three categories. These include the transfer of income from taxpayers to farmers (thefiscal cost), the consumer welfare loss due to higher food prices, and the efficiency losses thatresult from over-production. In some countries (those with higher border protection), most of thecost of protection is shifted from the treasury to the consumers, while in those with lower borderprotection, taxpayers absorb a high share of the cost. According to this literature, transfers fromtaxpayers and consumers to farmers involve a redistribution of income but are not real economiclosses for society.
However, as Johnson has pointed out (1991), income transfers could represent a real costto society, and not merely comprise a one-for-one redistribution of transfers. Johnson concludesthat for developed countries, the cost of farm policies to consumers was considerably greater thanthe increase in return to farm resources.
Extending this analysis, economists have also attempted to account for the full effects ofagricultural protection on wages and employment, and on the cost structure and returns in thenonagricultural economy. Several such studies show that the welfare cost of agriculturalprotection is many times greater than that indicated by an approach that restricts itself to only theagricultural sector effects.5 Future analysis of transition economies should attempt to capturethese effects, giving attention to the welfare implications of current farm policies both within thesector and between agriculture and the rest of the economy. What are the effects on real incomeof the poor in urban areas and for the poorest farmers? How much does the country spend totransfer an additional $1 to a farmer? The concern is that the true cost of protection to agriculturecould be far higher than is generally thought. As an illustration, we find that European beeffarmers benefit from huge subsidies and tariff protection that costs Europeans about US $14.6billion a year (The Economist, May 22, 1999). These issues could become increasingly relevantfor transition economies today, as they increase their own levels of agricultural protection.
On the fiscal side, most price and trade interventions affect government accounts, eitherby requiring the government to spend money, or by generating revenues (such as through importtariffs). The effects of some interventions, such as subsidies to agricultural inputs and production,or revenues from explicit border taxes, are obvious. The effect of others, such as priceinterventions, on state-owned enterprises, are more complex or are hidden. Whatever the natureof the interventions, they have a fiscal impact. These fiscal impacts will, in turn, influenceagricultural policy.
In our studies, only Turkey and Germany had sufficient data for deriving a detailedexamination of the fiscal impact of agricultural support policies. In the case of Germany,aggregate transfers to agriculture represented between 30 and 37 percent of agricultural GDP
5 A brief discussion on the approach and results is presented in M. Schiff and A. Valdes (1998), "Agriculture and theMacroeconomy" World Bank Discussion Paper # 1997.

Measures ofAgricultural Support in Transition Economies: 1994-1997 17
during 1995-97. Total payments included direct payments (set-aside and per hectare/headpremiums), social policy costs, research expenditures, income compensation, and input subsidies.The interesting point here is that the government expenditure figure for agriculture is likely to beconsiderably higher than the actual additional income received by the farmer.
In the country note on Turkey, the authors present an exceptionally detailed analysis ofthe fiscal impact of agricultural interventions, including a rigorous breakdown of expendituresand revenues. Agricultural support expenditures in Turkey are borne by a complex web ofprograms and agencies that extends well beyond the Ministry of Agriculture. These include notonly the Ministry of Agriculture, but also the Ministry of Hydraulic Works, the Treasury (equityinjections and duty losses to intervention agencies), state-owned enterprises that provide generalservices to the sector, the Agricultural Bank that provides concessional loans to farmers andcooperatives, the Central Bank in the form of loans, and many others.
In the Turkish crops sector, support measures included domestic price support,augmented by restraints on imports (in the past), and high tariffs (in recent years). In the livestocksector, border measures have been the primary instrument used to support producer prices. Pricecontrols and export taxes have been employed to protect consumers, and input subsidies andcredit have been provided to farmers to improve yields and farmer income, and to counterbalancethe implicit protection given to domestic input industries through border measures. No limitshave been set on production or sales, other than some control over planted acreage of a fewselected crops.
In 1996, the total cost of transfers from Turkish consumers and taxpayers to agriculture(net of related budget revenues) amounted to approximately US $9.1 billion, or nearly 5% ofGDP (as compared to 1.5% in OECD countries). Of this, US $7.0 billion resulted from theimplicit taxation of consumers due to higher domestic prices. If one considers that agriculturalincome is not taxed in Turkey, the tax burden fell mainly on non-agricultural producers. Also,because of the significant (presumed) size of the untaxed and unrecorded economy functioning inTurkey, it could well be that the transfers to agriculture from taxpayers placed a relatively greaterburden on middle- and lower-income groups than they did on higher income groups.
It is equally important to note, however, that this US $9.1 billion of transfers overstatesthe net income received by farmers in Turkey. This is in part because not all governmentexpenditures necessarily represent additional income to producers, and also because farmers, ashouseholds and consumers, faced higher food prices due to border protection on imported food.The study estimated that in 1996, the total food bill of agricultural producers was approximately$2.0 billion higher than what it would have been in the absence of protection, and agriculturalproducers, as consumers, actually paid about one-third of the agricultural support they received.

18 A. Valdes
REAL PRICE TRENDS AND IMPLICATIONS FOR AGRICULTURALPROFITABILITY
As a proxy for tracking the evolution of agricultural profitability in the countries studied,we examined the trends in real prices faced by producers at the farm level during the period1994-97. We looked not only at estimates of the year-to-year changes in real producer prices, butwe also "decomposed" these changes in an attempt to quantify the relative impacts on thesechanges of the exchange rate, border prices, and trade and price interventions.
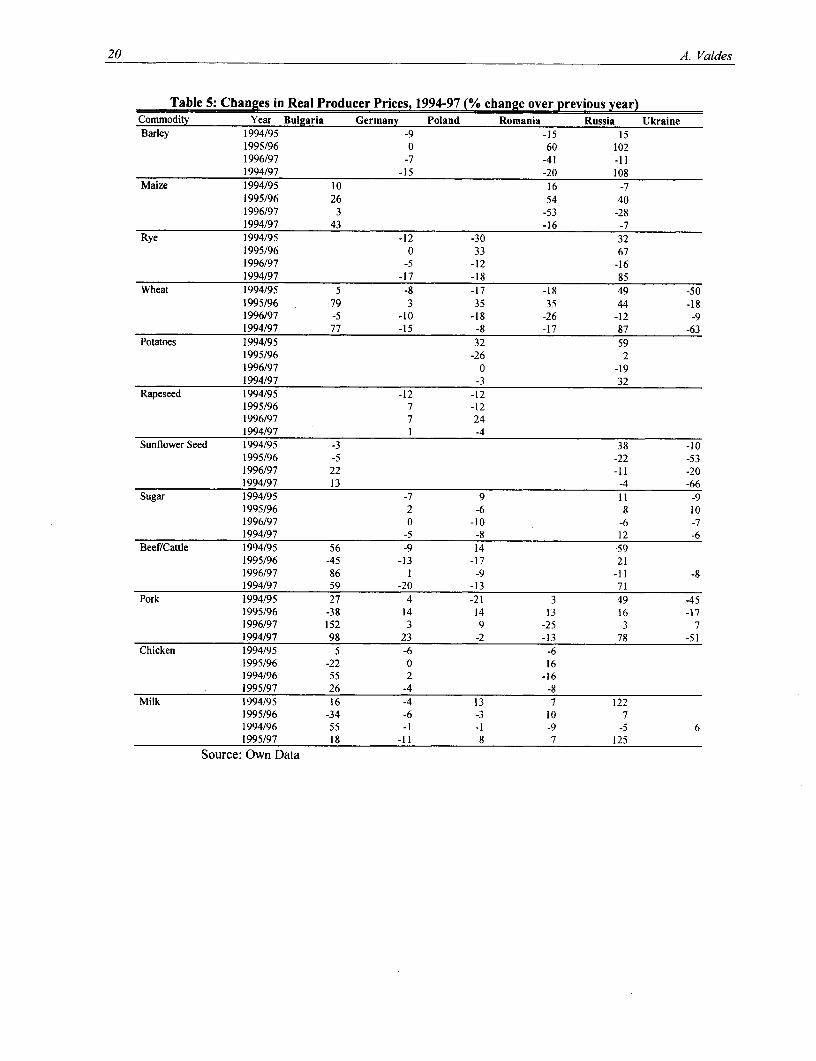
Real producer prices were defined as the current domestic farm price deflated by theconsumer price index. They represent one simple indicator that captures the evolution of thepurchasing power of the price of a ton of a commodity. Annual changes in real producer pricesare presented in Table 5.
The data shows no apparent upward or downward trend for the group of countries. Whatthe data does show, however, is the extraordinarily high year-to-year variability in real producerprices.6 In several cases a dramatic change in one year is frequently followed by a sharp change inthe opposite direction in the following year (see for example wheat in Bulgaria, or maize inRomania and Russia). Take the case of Romania. In 1996 (the year of the presidential elections),real producer prices increased for every commodity, then fell significantly in 1997. Romanianmaize producers experienced a fall in real wheat prices of 16% in 1995, followed by an increaseof 54% in 1996 and a decrease of 53% in 1997. For the growing number of first-time privatefarmers, faced as they are with an underdeveloped financial sector and a rather opaque marketingsystem, this high price instability may have been a major hindrance to the farm restructuringprocess. The data also reveal a consistent decline in real producer prices in Ukraine, Poland, andGermany.
Bulgaria, Romania, Russia and Ukraine have experienced large, year-to-year realproducer price fluctuations. Poland's real prices have become increasingly stable in recent years(except those of wheat). In comparison, real producer prices in Germany have remainedrelatively stable during the same period. The decomposition of these large producer-pricefluctuations through time allowed us to look at the relative contributions of changes in borderprice, changes in the (actual) real exchange rate, and changes in domestic price interventions (seeTables 6a and 6b). The approach (the methodology of which is discussed in Quiroz and Valdes,1993), provides rough estimates of the magnitude and direction of the impacts of each of thesefactors.
6 There are situations where this definition of real producer prices would yield results significantly different thanthose obtained by the traditional output/input price ratios. For example, for Russia between 1994-97, input pricesincreased faster than the CPI index, and hence the increase in real producer prices would have been lower than thatmeasured relative to the CPI index.

Measures ofAgricultural Support in Transition Economies: 1994-1997 19
To interpret Tables 6a and 6b, let us examine the case of wheat and pork in Romania.The observed 13% fall in the real domestic price of wheat in Romania from 1996 to 1997 is thesum of the effect of a 10% decline in the border price, a 3% appreciation of the real exchangerate, and no effect from trade policies. In pig meat, the 12% decline in the real domestic pricewas due to 1% decline in border prices, a 3% appreciation of the exchange rate, and 8%attributed to lower border protection. The results for Poland and Ukraine suggest that theappreciation of the currency was a major factor explaining the decline in real producer pricesobserved during 1993/95 (1994/95 for Ukraine), and for the entire period studied.
Declining real prices implies a reduction in competitiveness in domestic markets vis-A-visthe rest of the economy. When the phenomenon is due to exchange rate appreciation, it alsoimplies an increase in the producer-price equivalent in foreign currency and thus lowercompetitiveness in world markets. The results for most countries suggest that changes in theexchange rate played a major role in determining real domestic prices. This was especially thecase in Bulgaria, but is also evident in Poland (during the 1993-95 appreciation), the Ukraine,and Romania (during 1995-96).
Agricultural protection will raise farm prices, but it does not guarantee that farmer's realincome will not fall. The current situation of agriculture in some countries in Western Europe(such as Great Britain) shows that, in spite of the subsidies under the CAP regime in theEuropean Union, agriculture is currently going through a prolonged cyclical downturn.According to recent estimates, real farm incomes (especially in the livestock sector) in the UKdropped sharply in the last two years (75% according to some estimates). The collapse ofcommodity prices following the Asian crisis is accentuated by the rising cost of hygiene andenvironmental regulations. Furthermore, as recently stated by the British National Farmers Union"subsidies help, but the value of compensation paid in ECU and now in Euro has been eatenaway by the strong pound" (Financial Times, May 1999).
It is striking that government policies have exacerbated price instability, as shown by therelatively high values observed for the trade policy variable (TP).
20 A. Valdes
Table 5: Changes in Real Producer Prices, 1994-97 (% change over previous year)Commodity Year Bulgaria Germany Poland Romania Russia UkraineBarley 1994/95 -9 -15 15
1995/96 0 60 1021996/97 -7 -41 -111994/97 -15 -20 108
Maize 1994/95 10 16 -71995/96 26 54 401996/97 3 -53 -281994/97 43 -16 -7
Rye 1994/95 -12 -30 321995/96 0 33 671996/97 -5 -12 -161994/97 -17 -18 85
Wheat 1994/95 5 -8 -17 -18 49 -501995/96 79 3 35 35 44 -181996/97 -5 -10 -18 -26 -12 -91994/97 77 -15 -8 -17 87 -63
Potatoes 1994/95 32 591995/96 -26 21996/97 0 -191994/97 -3 32
Rapeseed 1994/95 -12 -121995/96 7 -121996/97 7 241994/97 1 4
Sunflower Seed 1994/95 -3 38 -101995/96 -5 -22 -531996/97 22 -11 -201994/97 13 -4 -66
Sugar 1994/95 -7 9 11 -91995/96 2 -6 8 101996/97 0 -10 -6 -71994/97 -5 -8 12 -6
Beef/Cattle 1994/95 56 -9 14 591995/96 -45 -13 -17 211996/97 86 1 -9 -11 -81994/97 59 -20 -13 71
Pork 1994/95 27 4 -21 3 49 -451995/96 -38 14 14 13 16 -171996/97 152 3 9 -25 3 71994/97 98 23 -2 -13 78 -51
Chicken 1994/95 5 -6 -61995/96 -22 0 161994/96 55 2 -161995/97 26 -4 -8
Milk 1994/95 16 -4 13 7 1221995/96 -34 -6 -3 10 71994/96 55 -1 -1 -9 -5 61995/97 18 -11 8 7 125
Source: Own Data
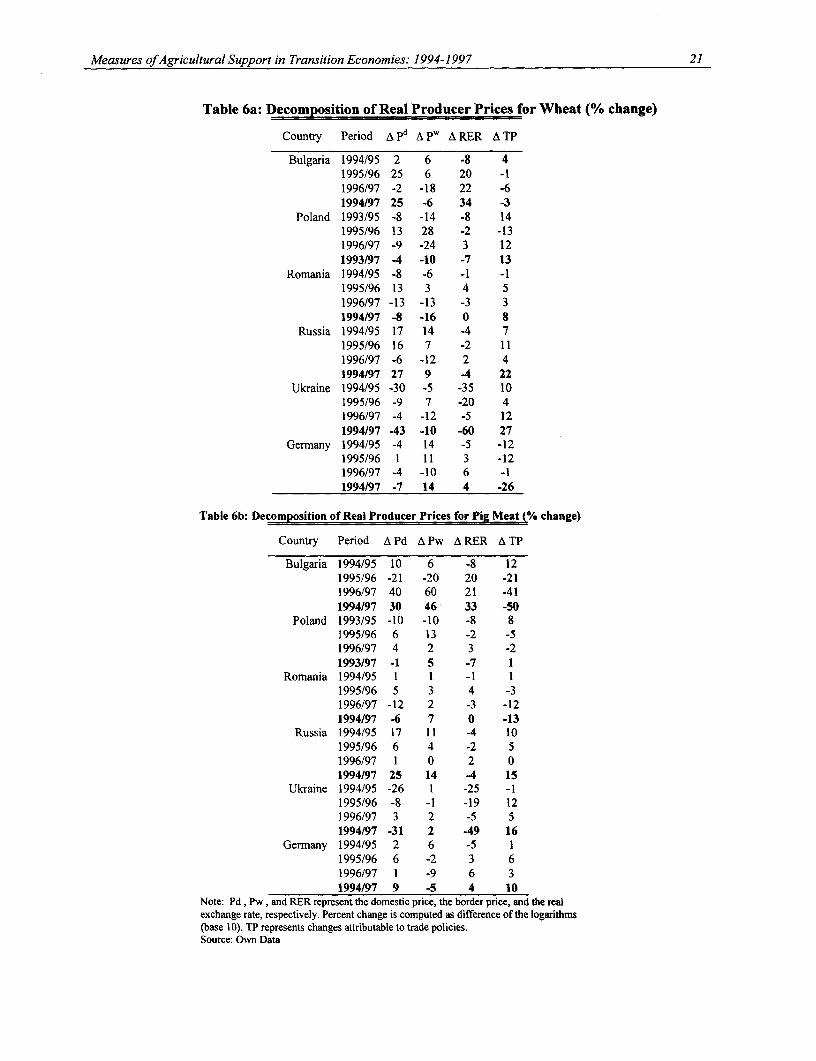
Measures ofAgricultural Support in Transition Economies: 1994-1997 21
Table 6a: Decomposition of Real Producer Prices for Wheat (% change)
Country Period A pd A PW A RER A TP
Bulgaria 1994/95 2 6 -8 41995/96 25 6 20 -I1996/97 -2 -18 22 -61994/97 25 -6 34 -3
Poland 1993/95 -8 -14 -8 141995/96 13 28 -2 -131996/97 -9 -24 3 121993/97 -4 -10 -7 13
Romania 1994/95 -8 -6 -1 -11995/96 13 3 4 51996/97 -13 -13 -3 31994/97 -8 -16 0 8
Russia 1994/95 17 14 -4 71995/96 16 7 -2 111996/97 -6 -12 2 41994/97 27 9 -4 22
Ukraine 1994/95 -30 -5 -35 101995/96 -9 7 -20 41996/97 -4 -12 -5 121994/97 43 -10 -60 27
Germany 1994/95 -4 14 -5 -121995/96 1 11 3 -121996/97 -4 -10 6 -11994/97 -7 14 4 -26
Table 6b: Decomposition of Real Producer Prices for Pig Meat (% change)
Country Period A Pd A Pw A RER A TP
Bulgaria 1994/95 10 6 -8 121995/96 -21 -20 20 -211996/97 40 60 21 -411994/97 30 46 33 -50
Poland 1993/95 -10 -10 -8 81995/96 6 13 -2 -51996/97 4 2 3 -21993/97 -1 5 -7 1
Romania 1994/95 1 1 -1 11995/96 5 3 4 -31996/97 -12 2 -3 -121994/97 -6 7 0 -13
Russia 1994/95 17 11 -4 101995/96 6 4 -2 51996/97 1 0 2 01994/97 25 14 -4 15
Ukraine 1994/95 -26 1 -25 -11995/96 -8 -1 -19 121996/97 3 2 -5 51994/97 -31 2 -49 16
Germany 1994/95 2 6 -5 11995/96 6 -2 3 61996/97 1 -9 6 31994/97 9 -5 4 10
Note: Pd, Pw, and RER represent the domestic price, the border price, and the realexchange rate, respectively. Percent change is computed as difference of the logarithms(base 10). TP represents changes attributable to trade policies.Source: Own Data

22 A. Valdes
THE BOTTOM LINE
The results reported in this study confirm that some CEECs have% been re-introducingdirect and indirect support to the agricultural sector. This trend is very clear between 1996 and1997 for all countries studied except Romania. Turkey and Germany maintained high levels ofoutput price protection over the years studied.
The net transfers from output, input, and credit subsidies indicate that, relative to the sizeof the sector (agricultural GDP), the net effect of government support policies has beenenormous. In some cases, government support has greatly increased sector income (by 63 percentin Ukraine in 1997) while in others, the transfer from agriculture has been extremely large (up to36 percent of agricultural GDP in Bulgaria in 1997). Such high levels of income transfers areincompatible with both improved market orientation, efficient resource allocation withinagriculture, and economy-wide growth. In these countries, fluctuations in the income of theagricultural sector have been largely determined by government policy, primarily through outputprice support, rather than by the sector's adjustment to market conditions.
Agricultural policy in transition economies remains unfocused and, as a result, fails tocontribute to competitiveness in the sector, or to induce an increase in the flow of privateinvestment into the sector. The significant instability of producer prices results in largefluctuations in producer income. Moreover, a large fraction of producer income is determined bygovernment policy, primarily through output price support. The profile of incentives indicates apattern of highly selective treatment, both helpful and harmful, of the various agriculturalsubsectors.
We hope this work will make a significant contribution to the better understanding of thepolicy framework as it affects the structure of producer incentives, and presents a methodologywhich can easily be applied for policy evaluation. However, its impact in the policy processwould be greatly enhanced if this work could be followed up with a periodic update of the"protection" indicators (every two years or so). Given the variability of policy that we document,the policy changes desirable in the 1994-97 period may not be applicable three to four years later.This updating is perfectly feasible and not expensive. The recent experience with one country(Bulgaria) where indicators were updated applying the same methodology and using the databasefor 1994-97 as a starting point, indicates that this could be done at a cost of less than US $3,000per country.
In interpreting the significance of the results of protection indicators to understand theactual agricultural supply response and private investment behavior, readers should consider that:(a) incentive is only one of the various determinants of supply response and, particularly fortransition economies, institutional factors and developments in the rural factor markets (such asland and financial markets) are also critical; and (b) the Effective Rate of Protection is a moreappropriate indicator than the Effective Rate of Assistance (or PSE in other studies) in that itcaptures more directly the effect of policies on the returns to farming in the various activities.
While there may be no single story that characterizes trade and price interventions intransition economies, there are several important common elements. In all cases, we observe:
Measures ofAgricultural Support in Transition Economies: 1994-1997 23
• extraordinarily high levels of price intervention;
X enormous implicit income transfers to and from farmers;
* high selectivity among different activities; and
• an extremely high year-to-year variability in real producer prices.
The statistical base for analytical work on agricultural support in transition economiesis weakand its interpretation is exceptionaly complex. That impedes real access to the information thatpolicy makers need.
While part of this instability is exogenous, the impact of government price and tradepolicy in exacerbating price instability and creating additional uncertainty about returns infarming is striking. Ultimately, this instability will have a severe and adverse effect on privateinvestment prospects in the sector. To facilitate and inform the policy debate at the country level,continuous monitoring needs to be done to document the net impact of agricultural priceinterventions on efficiency and income effects.
The benefits of a more competitive sector are indisputable, including increased farmincome, lower overall prices to consumers, a reduction in govermnent expenditures (through thereduction in subsidies), and an improved position for gaining accession to the EU. Governmentswould do well to turn their attention away from price interventions in support of agriculture, andinstead pursue programs that will increase the competitiveness of the sector, for example inproviding public goods such as research and extension services, pushing for further reform inland markets, simplifying administrative procedures, supporting the development of marketinformation systems, or devising grading systems that will improve the quality of goodsproduced. The private investment flows required to make agriculture more competitive are huge,which is why a proper incentive framework is so critical. Private investment will only beattracted to the sector if farming and agroprocessing is made profitable, guided by a credible andconsistent policy framework that more fully integrates agriculture with international markets.
24 A. Valdes
REFERENCES
Harley, Matthew. 1996. "Use of Producer Subsidy Equivalent as a Measurement of Support toAgriculture in Transition Economics," American Journal of Agriculture Economics, 78 (3):799-804.
Johnson, D. Gale. 1991. "World Agriculture in Disarray," St. Martin's Press, New York (chapter10).
OECD. 1997. Economic Surveys, Turkey, Paris.
Quiroz, Jorge and Alberto Valdes. 1993. "Agricultural Incentives and InternationalCompetitiveness in Four African Countries: Government Interventions and ExogenousShocks", in A. Valdes and K. Muir-Leresche, eds., Agricultural Policy Reforms andRegional Market Integration in Malawi, Zambia. and Zimbabwe, International Food PolicyResearch Institute.
Schiff, Maurice and Alberto Valdes. 1998. "Agriculture and the Macroeconomy." The WorldBank, Policy Research Workin,e Paper, 1967 (August).
Tangerman, Stefan. 1996. "Implications of Alternative Options for Future Levels of Support forAgriculture in Central and Eastern Europe," American Journal of Agricultural Economics,78 (3): 786-791.
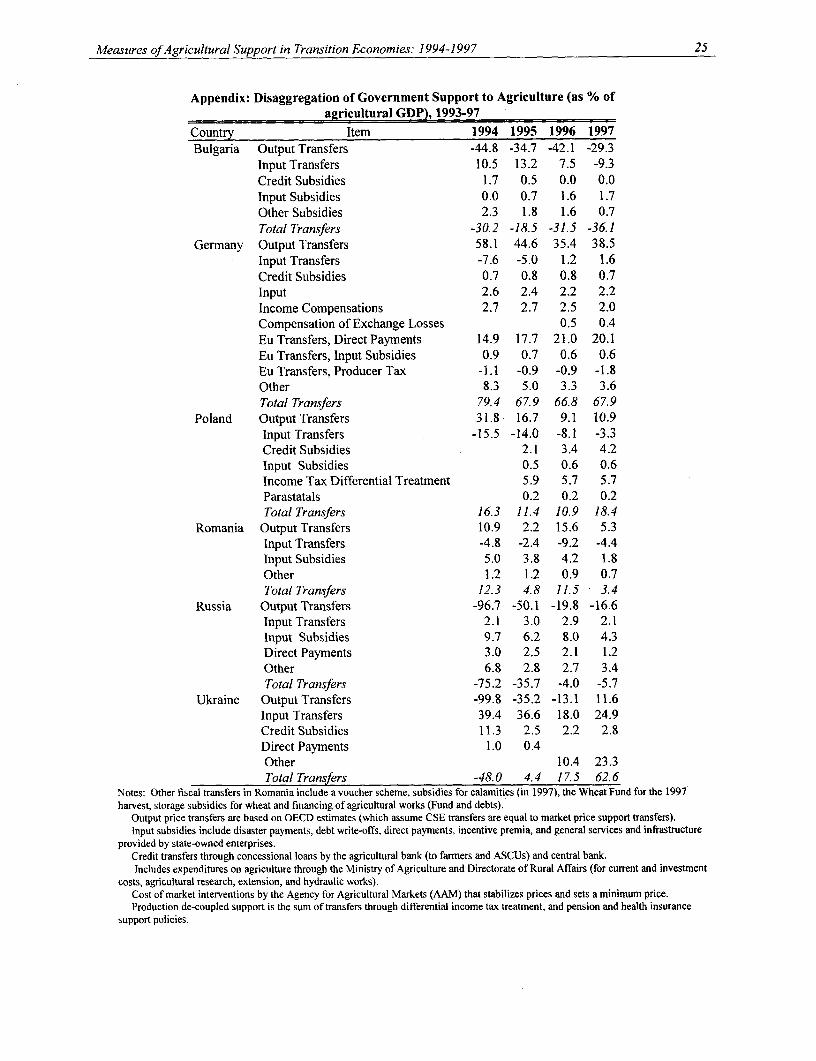
Measures ofAgricultural Support in Transition Economies: 1994-1997 25
Appendix: Disaggregation of Government Support to Agriculture (as % ofagricultural GDP), 1993-97
Country Item 1994 1995 1996 1997Bulgaria Output Transfers -44.8 -34.7 -42.1 -29.3
Input Transfers 10.5 13.2 7.5 -9.3Credit Subsidies 1.7 0.5 0.0 0.0Input Subsidies 0.0 0.7 1.6 1.7Other Subsidies 2.3 1.8 1.6 0.7Total Transfers -30.2 -18.5 -31.5 -36.1
Germany Output Transfers 58.1 44.6 35.4 38.5Input Transfers -7.6 -5.0 1.2 1.6Credit Subsidies 0.7 0.8 0.8 0.7Input 2.6 2.4 2.2 2.2Income Compensations 2.7 2.7 2.5 2.0Compensation of Exchange Losses 0.5 0.4Eu Transfers, Direct Payments 14.9 17.7 21.0 20.1Eu Transfers, Input Subsidies 0.9 0.7 0.6 0.6Eu Transfers, Producer Tax -1.1 -0.9 -0.9 -1.8Other 8.3 5.0 3.3 3.6Total Transfers 79.4 67.9 66.8 67.9
Poland Output Transfers 31.8 16.7 9.1 10.9Input Transfers -15.5 -14.0 -8.1 -3.3Credit Subsidies 2.1 3.4 4.2Input Subsidies 0.5 0.6 0.6Income Tax Differential Treatment 5.9 5.7 5.7Parastatals 0.2 0.2 0.2Total Transfers 16.3 11.4 10.9 18.4
Romania Output Transfers 10.9 2.2 15.6 5.3Input Transfers -4.8 -2.4 -9.2 -4.4Input Subsidies 5.0 3.8 4.2 1.8Other 1.2 1.2 0.9 0.7Total Transfers 12.3 4.8 11.5 3.4
Russia Output Transfers -96.7 -50.1 -19.8 -16.6Input Transfers 2.1 3.0 2.9 2.1Input Subsidies 9.7 6.2 8.0 4.3Direct Payments 3.0 2.5 2.1 1.2Other 6.8 2.8 2.7 3.4Total Transfers -75.2 -35.7 -4.0 -5.7
Ukraine Output Transfers -99.8 -35.2 -13.1 11.6Input Transfers 39.4 36.6 18.0 24.9Credit Subsidies 11.3 2.5 2.2 2.8Direct Payments 1.0 0.4Other 10.4 23.3Total Transfers -48.0 4.4 17.5 62.6
Notes: Other fiscal transfers in Romania include a voucher scheme, subsidies for calamities (in 1997), the Wheat Fund for the 1997harvest, storage subsidies for wheat and financing of agricultural works (Fund and debts).
Output price transfers are based on OECD estimates (which assume CSE transfers are equal to market price support transfers).Input subsidies include disaster payments, debt write-offs, direct payments, incentive premia, and general services and infrastructure
provided by state-owned enterprises.Credit transfers through concessional loans by the agricultural bank (to farmers and ASCUs) and central bank.Includes expenditures on agriculture through the Ministry of Agriculture and Directorate of Rural Affairs (for current and investment
costs, agricultural research, extension, and hydraulic works).Cost of market interventions by the Agency for Agricultural Markets (AAM) that stabilizes prices and sets a minimum price.Production de-coupled support is the sum of transfers through differential income tax treatment, and pension and health insurance
support policies.

Part II
Country Agricultural Policy Notes

CHAPTER 1: RUSSIA
Eugenia Serova
AGRICULTURE IN THE RUSSIAN ECONOMY
Agriculture has declined in absolute terms and as a share of the Russian economy duringthe reform period. Gross agricultural output in constant prices has fallen about 35% since 1991.The economy in aggregate has declined even more, suggesting that agriculture has not fared aspoorly as some other sectors, notably industry. Agriculture's share of GDP, however, is reportedto have declined from about 15% at the outset of reforms to about 7% at present. The GDP shareof the agricultural sector decreased mainly because relative prices changed in favor of the inputsector. With price liberalization, input prices raised drastically.
Index numbers of gross agricultural output are measured in constant prices. The indexmay be biased by distortions in the constant prices compared to a set of relative internationalprices. It will not, however, be affected in the short run by swings in domestic terms of trade foragricultural and other commodities and services. Movements in the real exchange rate or insector or commodity specific relative prices can cause a change in agriculture's share of GDPseparately from movements in an index of gross output. If agricultural prices fall relative toother prices in the economy, agriculture's share of GDP will decline even if output remainsconstant. If the shift in relative prices is sustained, it is likely to feed into production incentives,and to contribute to a decline in the index of gross output.
In Russia over the period studied (1994-97), gross output was declining, the realexchange rate varied, and agricultural prices for input and output were subject to a number ofpressures. Some of the factors influencing prices derived from imperfections in the chaoticRussian market environment. Others can be attributed to governmental policies adopted over theperiod. In this study we attempt a preliminary effort to measure the net effect of the variousinfluences on producer prices to determine whether, on balance, Russian producers were assistedor taxed by the combined effects of the policies and the market environment.
The implications of the study are important because they may provide insight into areasof priority for future policy reforms and public investment. Despite ambiguities in measurementof GDP and the contributions of various sectors, it is clear that labor productivity in agriculture islower than in other sectors. Agriculture is reported to employ about 15% of the labor force, andthis is greater than the sector's share of GDP, no matter what the precise measure of the latterturns out to be. Achievement of higher well being for rural people will depend on increasedlabor productivity in agriculture, as well as increased opportunities for employment in otherareas. The record of international experience indicates that flows of investment and new

30 E. Serova
technology needed to increase labor productivity in agriculture are impeded by factors thatsystematically depress producer prices. Thus a finding of substantial negative net protection (i.e.,taxation) of agriculture would imply that present policies and market imperfections discriminateagainst rural people and their chances to build better lives.
In contrast, a finding of positive net protection or subsidy for the sector as a whole, or forspecific products, would imply that resources are being attracted into activities that may not beeconomically sustainable over the longer run. It was precisely this sort of shock that initiated thereform period in 1992, as agriculture faced the sudden withdrawal of high levels of subsidy andsupport provided in the late Soviet period. In such a case; that is, if agricultural support werefound to have climbed back to significant positive levels after the shock of 1992, rural well-being, even if at present not particularly high, may be vulnerable to further shocks in the future.This finding would direct attention to causes of low factor productivity, and a search for remedialmeasures or programs of adjustment out of noncompetitive activities.
Finally, a finding that neither price policy nor market performance penalizes agriculture,but that labor productivity is nonetheless low, would direct attention to demographic issues thatmay not require intervention, or to public investment in rural education and agricultural researchto raise the productivity of young rural people. Thus policy makers seeking to promotesustainable growth in rural well-being can use an empirical understanding of the net impact ofpolicies and market performance on incentives in agriculture to design strategies for rural growth.
MAJOR INSTRUMENTS OF AGRICULTURAL POLICY 1994-98
A significant economic reform began in Russia in 1992 with the price liberalization.Consumer subsidies were removed, and the state monopoly on foreign trade was abolished. Adegree of price regulation was retained at the federal and later the provincial levels, but the starttoward allowing prices to influence economic decisions in agriculture was taken in 1992.Furthermore, restructuring of state and collective farms began, and measures were initiatedtoward privatization of marketing, processing, and input supply.
The liberalization of prices and concomitant changes in the economy as a whole caused asevere drop in the purchasing power of the population, with immediate implications for demandfor food, particularly livestock products. The impact of the drop in demand at the farm level wascompounded by a simultaneous change in relative prices that sharply reduced farm profitability.Farms faced rapid decapitalization. The government's first interventions for the farn sector werethus framed in an effort to address the negative profitability in the livestock sector, and higherinput costs in all sectors. These interventions took the form of direct price support for livestockbreeders, input price subsidies and credit subsidies. They have been modified over theintervening years, and their applications have been erratic enough to induce considerableuncertainty, but they still remain in some form. Later innovations in policy included the "creditin kind" programs and leasing of equipment, which is essentially a program of payment ininstallments.
As the budgetary pressure at the federal level increased over the years since 1992, stateprocurement of agricultural products at the federal level declined. Price regulation in the regions

Chapter 1: Russia 31
lasted after its abolition at the federal level. Since 1993, authorities have implemented subsidyprograms for the livestock sector, in part on a cost-sharing basis with the federal government.Regional governments tended at various time to impose restrictions on inter-regional trade,however federal government has not been able to halt this practice. Procurement at the provinciallevel is still significant, and at present the impact of regional governments on agriculturalmarkets is greater than that of federal authorities.
From the start of the reform trade policy received little attention from the agriculturalproducers or lobbyists initially. With the prevailing concern about purchasing power ofconsumers and the effort to contain the increase in food prices, import subsidies and export taxesprevailed for food items in the early period. By the end of 1993, agricultural managers began tobe concerned about competition of importers on Russian markets. Pressures toward protectionbegan, and were reflected in adoption of modest import tariffs in 1994.
BASIC POLICY INSTRUMENTS
The federal government has pursued its objectives for the agricultural sector with thefollowing instruments:
- Reductions in input cost; e.g., direct reimbursement to producers, payments for some inputson an installment basis ("leasing") with implied credit subsidies, regulated prices andsubsidies for some agricultural inputs;
- product subsidies, mainly for livestock products;- subsidized and directed credit to agricultural producers (subsidized interest rate, privileged
terms of credit, credit in kind financed by the government, debt restructuring and writing-off);
* border protection, although at modest levels;- special procedures for privatization of processing and marketing entities in an effort to
protect producers from monopsony power;* continued state procurements for food supply of certain consumers (army, northern territories,
big cities, etc.), at a reduced but still significant level;* public investments.
Interventions Affecting Farm-Gate Prices
Dairy and livestock producers were first to feel the effects of reduced demand in spring of1992. In response to their expressed difficulties, the government introduced budgetary subsidiesin the form of direct payments. In 1993 these livestock subsidies were transferred to the regionallevel, and regions adopted differential approaches, some retaining the subsidies, and somephasing them out or reducing them.
In 1995, attempts were made to establish minimum prices for grains and basic livestockproducts. Minimum prices were announced four times a year, but they remained below marketprices, and thus had little impact on the level of prices.
Prior to 1995, delays in payment were common. These delays, especially in 1992-1994,when average monthly inflation was approximately 25 percent, led to implicit taxation of

32 E. Serova
agriculture: with the total nominal revenues of agricultural enterprises in 1992 at about 1 trillionR, these loses due to delayed payments were estimated at 600-700 billion R, and for 1993 - at 5trillion R. In the following years the rate of inflation dropped and the scale of delayed paymentsalso decreased.
Wholesale Prices
Russian producers have periodically pressured the government to use administrative andregulatory measures to reduce marketing margins and to increase the producer's share of thewholesale price. After the liberalization in 1992, price-setting boards were set up in manyprovinces with the support of local authorities. The boards aimed at achieving mutual agreementon procurement prices. They had little impact, however, and most were disbanded 2-3 yearslater7.
On the federal level, the entire food-processing sector was pronounced a monopoly, andbecame subject to special procedures for privatization, according to which 51% of assets were tobe allocated to local primary producing enterprises supplying the processors with raw materials.In addition, salaries of the managers of such plants came under administrative review.Processing plants were required to report to the local authorities on any changes in their costs ofproduction. These administrative measures in aggregate appeared not to have much impact onmargins, which continued to increase. Local shortages of supply, however, did affect margins, asprocessors absorbed lower margins in order to raise producer prices to stimulate supply andthereby raise their own capacity utilization.
Retail Prices
During the first two months after price liberalization in January 1992, the federalgovernment regulated prices and mark-ups for wholesalers and retailers of milk, meat, bread,and some other foodstuffs. Prices for these products increased during the first two monthsthreefold, while the total index of consumer prices in January-February, 1992 increased morethan 500%. Regional (oblast) authorities could modify the federal list of regulated prices forfoodstuffs (within product groups) or could offer consumer subsidies from the regional budget.After March 1992, regulatory powers for food passed to the regional authorities, with the partialexception of bread. Bread prices remained under federal control till the end of 1993. The federalgovernment fixed prices for milling grain and the difference between the fixed price and actualgrain purchase price was compensated to milling enterprises from the federal budget. Accordingto estimates the flour subsidy in 1992-1993 cost as much as 900 billion R. In addition,processing margins for bread were limited to 15%. After the flour subsidies were removed in1993, there was no food price regulation at the federal level.
Regulation of food prices at the provincial level remained. Ulyanovsk and NizhnyNovgorod provinces, for example, represent two different approaches to regional food priceregulation. In the former, regulation was strict, and in the latter, essentially liberal. Intervention
7The crisis of 1998 induced efforts to control both retail and wholesale prices in all territories of the RussianFederation. These efforts were not successful and regulations were soon lifted almost everywhere.
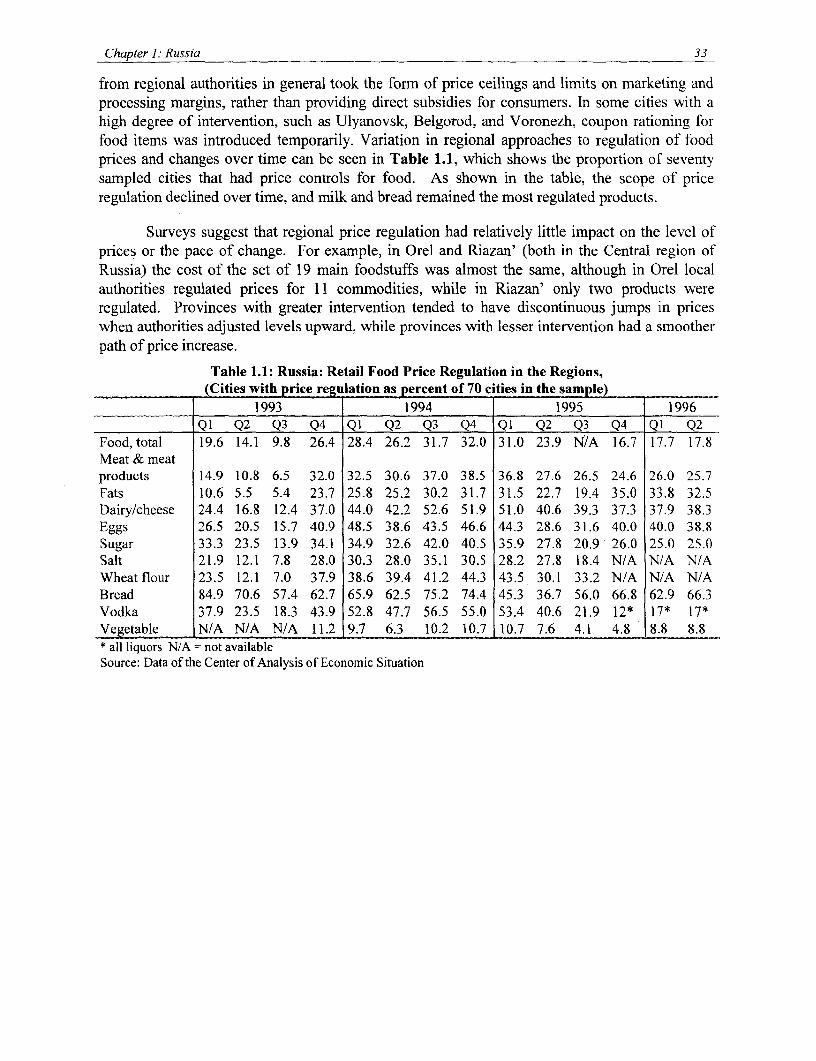
Chapter 1: Russia 33
from regional authorities in general took the form of price ceilings and limits on marketing andprocessing margins, rather than providing direct subsidies for consumers. In some cities with ahigh degree of intervention, such as Ulyanovsk, Belgorod, and Voronezh, coupon rationing forfood items was introduced temporarily. Variation in regional approaches to regulation of foodprices and changes over time can be seen in Table 1.1, which shows the proportion of seventysampled cities that had price controls for food. As shown in the table, the scope of priceregulation declined over time, and milk and bread remained the most regulated products.
Surveys suggest that regional price regulation had relatively little impact on the level ofprices or the pace of change. For example, in Orel and Riazan' (both in the Central region ofRussia) the cost of the set of 19 main foodstuffs was almost the same, although in Orel localauthorities regulated prices for 11 commodities, while in Riazan' only two products wereregulated. Provinces with greater intervention tended to have discontinuous jumps in priceswhen authorities adjusted levels upward, while provinces with lesser intervention had a smootherpath of price increase.
Table 1.1: Russia: Retail Food Price Regulation in the Regions,(Cities with price regulation as percent of 70 cities in the sample)
1993 1994 1995 1996Ql Q2 Q3 Q4 Ql Q2 Q3 Q4 QI Q2 Q3 Q4 Ql Q2
Food, total 19.6 14.1 9.8 26.4 28.4 26.2 31.7 32.0 31.0 23.9 N/A 16.7 17.7 17.8Meat & meatproducts 14.9 10.8 6.5 32.0 32.5 30.6 37.0 38.5 36.8 27.6 26.5 24.6 26.0 25.7Fats 10.6 5.5 5.4 23.7 25.8 25.2 30.2 31.7 31.5 22.7 19.4 35.0 33.8 32.5Dairy/cheese 24.4 16.8 12.4 37.0 44.0 42.2 52.6 51.9 51.0 40.6 39.3 37.3 37.9 38.3Eggs 26.5 20.5 15.7 40.9 48.5 38.6 43.5 46.6 44.3 28.6 31.6 40.0 40.0 38.8Sugar 33.3 23.5 13.9 34.1 34.9 32.6 42.0 40.5 35.9 27.8 20.9 26.0 25.0 25.0Salt 21.9 12.1 7.8 28.0 30.3 28.0 35.1 30.5 28.2 27.8 18.4 N/A N/A N/AWheat flour 23.5 12.1 7.0 37.9 38.6 39.4 41.2 44.3 43.5 30.1 33.2 N/A N/A N/ABread 84.9 70.6 57.4 62.7 65.9 62.5 75.2 74.4 45.3 36.7 56.0 66.8 62.9 66.3Vodka 37.9 23.5 18.3 43.9 52.8 47.7 56.5 55.0 53.4 40.6 21.9 12* 17* 17*Vegetable N/A N/A N/A 11.2 9.7 6.3 10.2 10.7 10.7 7.6 4.1 4.8 8.8 8.8* all liquors N/A = not availableSource: Data of the Center of Analysis of Economic Situation
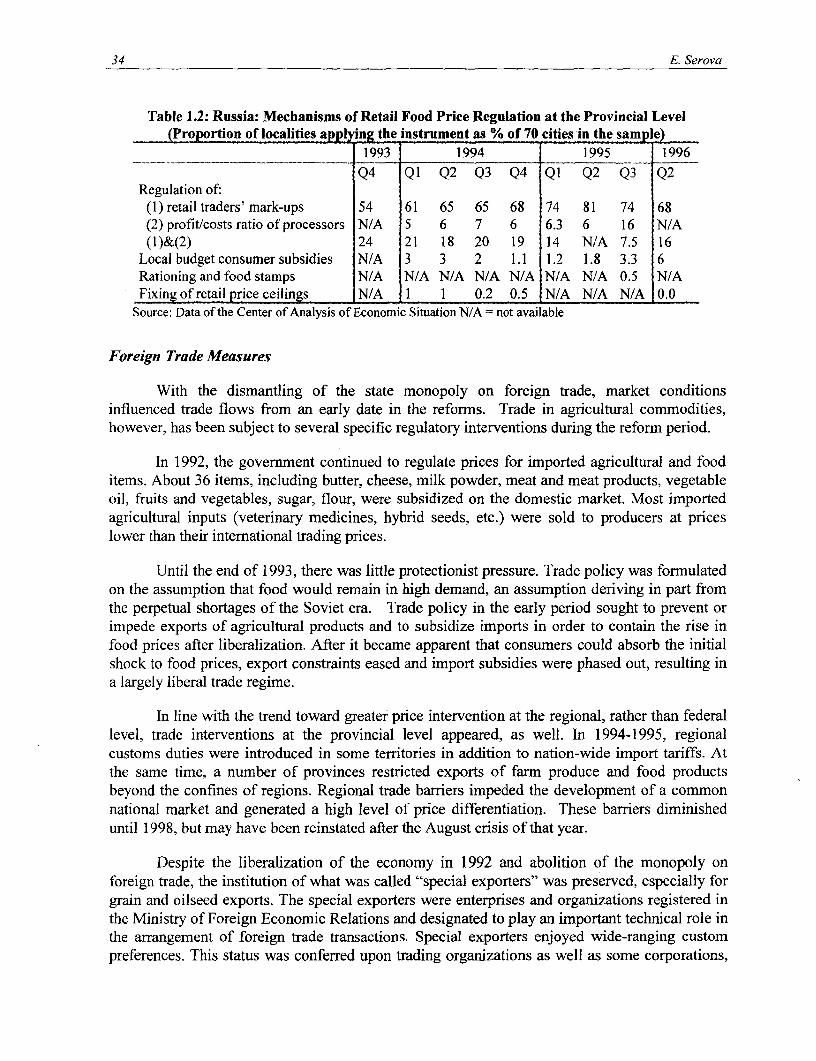
34 E. Serova
Table 1.2: Russia: Mechanisms of Retail Food Price Regulation at the Provincial Level(Pro ortion of localities app In the instrument as % of 70 cities in the sample)
1993 191994 1995 1996Q4 Ql Q2 Q3 Q4 Ql Q2 Q3 Q2
Regulation of:(I) retail traders' mark-ups 54 61 65 65 68 74 81 74 68(2) profit/costs ratio of processors N/A 5 6 7 6 6.3 6 16 N/A(1)&(2) 24 21 18 20 19 14 N/A 7.5 16
Local budget consumer subsidies N/A 3 3 2 1.1 1.2 1.8 3.3 6Rationing and food stamps N/A N/A N/A N/A N/A N/A N/A 0.5 N/AFixing of retail price ceilings N/A I 1 0.2 0.5 N/A N/A N/A 0.0
Source: Data of the Center of Analysis of Economic Situation N/A = not available
Foreign Trade Measures
With the dismantling of the state monopoly on foreign trade, market conditionsinfluenced trade flows from an early date in the reforms. Trade in agricultural commodities,however, has been subject to several specific regulatory interventions during the reform period.
In 1992, the government continued to regulate prices for imported agricultural and fooditems. About 36 items, including butter, cheese, milk powder, meat and meat products, vegetableoil, fruits and vegetables, sugar, flour, were subsidized on the domestic market. Most importedagricultural inputs (veterinary medicines, hybrid seeds, etc.) were sold to producers at priceslower than their international trading prices.
Until the end of 1993, there was little protectionist pressure. Trade policy was formulatedon the assumption that food would remain in high demand, an assumption deriving in part fromthe perpetual shortages of the Soviet era. Trade policy in the early period sought to prevent orimpede exports of agricultural products and to subsidize imports in order to contain the rise infood prices after liberalization. After it became apparent that consumers could absorb the initialshock to food prices, export constraints eased and import subsidies were phased out, resulting ina largely liberal trade regime.
In line with the trend toward greater price intervention at the regional, rather than federallevel, trade interventions at the provincial level appeared, as well. In 1994-1995, regionalcustoms duties were introduced in some territories in addition to nation-wide import tariffs. Atthe same time, a number of provinces restricted exports of farm produce and food productsbeyond the confines of regions. Regional trade barriers impeded the development of a commonnational market and generated a high level of price differentiation. These barriers diminisheduntil 1998, but may have been reinstated after the August crisis of that year.
Despite the liberalization of the economy in 1992 and abolition of the monopoly onforeign trade, the institution of what was called "special exporters" was preserved, especially forgrain and oilseed exports. The special exporters were enterprises and organizations registered inthe Ministry of Foreign Economic Relations and designated to play an important technical role inthe arrangement of foreign trade transactions. Special exporters enjoyed wide-ranging custompreferences. This status was conferred upon trading organizations as well as some corporations,

Chapter 1:- Russia 35
enterprises or regions. Thus the abolition of the state monopoly of trade can be considered tohave been gradual, and the first stage was broadening of the special status to designated agentsoutside the state. In 1995, the status of special exporter was abolished.
Export quotas and licensing remained in place in Russia until 1995, but the list ofcommodities under quotas and licensing shrank. Export duties for grain, sugar and otherfoodstuffs were removed in 1994. Export subsidies for transport of exported grain wereintroduced at that time, but they were never really applied. At the end of 1995, in response to apoor harvest, export duties for some cereals were reintroduced. Enforcement of these duties waslax because the customs union with Belorussia and Kazakhstan was established at essentially thesame time, and so grain could move across these borders duty-free (mainly through the so calledBelorussian "channel").
Pressures to restrict exports rose with the economic crisis of August 1998, and the poorharvest of that year. In the fall export licensing for sunflower seeds was re-established, and inJanuary 1999 an export tax was imposed on this commodity.
Table 1.3: Russia - Export Duties for Principal Food Items, %Date Date Date Date Date
07/01/92 11/01/93 07/25/94 09/01/95 04/01/96Meat 20 0 0 0 0Milk and dairy 20 0 0 0 0Grain, total 20 10-25 10-25 7-17 0Of which: durum wheat 20 25 25 17 0
Wheat 20 10 10 7 0Maize 20 1 5 1 5 10 0Oil seeds 20 10-15 10-15 7-10 0
Flour 20 10 10 7 0Sugar beet 20 1 5 1 5 1 0 0Vegetable oils 20 0 0 0 0Butter 20 0 0 0 0
White su~ar 20 60OECU 0 0 0Source: Corresponding Laws of the RF.
As protectionist pressures rose in late 1993 and early 1994, the government adopted 15-20% import tariffs for meat and dairy products and vegetable oil, 30% - for sugar and wool.Since that time the import duties have been changed several times. The August (1998) financialcrisis and the fear of food shortages and rising prices brought reduction of import duties andVAT (from 20% to 1 0%) for basic foodstuffs.

36 E. Serova
Table 1.4: Russia - Import Duties for Principal Food Items
Since Since Since Since Since Since03/15/94 07/01/95 05/15/96 01/01/97 02/01/98 10/10/98
Beef 8 15 15 1 5 15, but not 10, but notless than 0.2 less thanECU/kg 0.13 ECU/kg
Poultry 20 25 30, but not 30, but not 30, but not 30, but notless than 0.3 less than 0.3 less than 0.3 less than 0.3ECU/kg ECU/kg ECU/kg ECU/kg
Milk and dairy 10-15 10-15 10-15 10-15 10-15 5of which: 15 15 15 15 15, but not 15, but notcheeses less than 0.3 less than 0.3
ECU/kg ECU/kgButter 15 20 20, but not 20, but not 20, but not 15, but not
less than 0.3 less than 0.3 less than 0.3 less thanECU/kg ECU/kg ECU/kg 0.22 ECU/kg
Grain I 1 5 5 5 5Oil seeds 1 5-10 5-10 5-10 5-10 5-10Vegetable Oils 0 15 15, but not 15, but not 15, but not 5, but not
less than less than less than less than0.09ECU/kg 0.09ECU/kg 0.09ECU/kg 0.03 ECU/kg
Potatoes (not 25 25 25 25 25 25seeds)Fruits 1-10 5-10 5-10 5-10 5-10 5-10Raw sugar 1 1 1 1 IWhite sugar 20 25 25, but not 25, but not 25, but not
less than less than less than0.07 ECU/kg 0.07 ECU/kg 0.07 ECU/kg
Source: Corresponding Laws of the RF.
PRODUCTION SUBSIDIES
Credit
Nominal and real interest rates rose with the introduction of reforms after 1991.Agriculture under Soviet policies had been provided with ready access to subsidized credit anddebt write-offs, and was unprepared for a transition to commercial financial relations. With theprevailing uncertainty in the Russian economy and due to the high inflation rate, credit becameavailable only with very short repayment periods, and this further penalized the agriculturalsector. In response, the Government introduced a system of preferential centralized credit foragriculture in 1992. The subsidized interest rate was 28% for agricultural enterprises and 8% forprivate farmers, when the commercial rate varied from 180% to 230%. In 1993, the special ratefor private farners was removed, and all agricultural credit from the budget was offered at 28%.
The crisis of seasonal credit in agriculture in the spring of 1995 led to the introduction ofwhat was called credit-in-kind (tovarny credit). Firms providing fuel and lubricants were offeredthe opportunity to supply agriculture with inputs and to cancel an equivalent value of their taxobligations or other debts to the budget. Since agricultural producers were required to repay thesedebts at the end of the season, they essentially assumed the budgetary obligations of the fuel

Chapter 1: Russia 37
suppliers in exchange for delivery of inputs. Agricultural enterprises participating in theseprograms were required to deliver their products to the state food reserves. Under this program,the oil companies assigned a value to the products delivered as credit-in-kind, and the assignedprices were reported to be significantly above market prices at the time. Surveys carried out inseveral regions suggested that the interest rate implicit in these transactions was as much as 120-130% annually, which was less than the commercial interest rate at the time, but still higher thanin past programs of subsidized credit. Under this program, farm enterprises were obligated torepay the implicit interest. The fuel suppliers rather than the budget captured the value of theinterest, even though they did not finance the credit. As shown in Table 1.5, the implicit interestobligations that producers incurred through the credit-in-kind program for fuel may have been ashigh as 8 billion (redenominated) rubles.
Alternatively viewed, through this program the Government imposed on agriculturalproducers interest obligations greater in aggregate than the total volume of the subsidized creditoffered through the programs described above. Agricultural producers did benefit from thecredit-in-kind programs, however, since many subsequently defaulted on the incurredobligations. Data in Table 1.5 show a remarkable increase in use of fuel and lubricants inagriculture after introduction of the credit-in-kind program. If the data are correct, use doubledbetween 1995 and 1996, suggesting that large volumes of fuel and lubricants may have beendelivered through the program, and the subsequent disposition of these inputs is not clearlyevident. The entities that lost most through the credit-in-kind programs were the regionalgovernments (who provided guarantees for producers' obligations) and the federal budget.Regional governments subsequently defaulted on their guarantees through a process thatcontinues to unfold, and so the federal budget ultimately financed much of the credit-in-kindprogram, thereby transferring resources to the fuel companies and to agricultural producers. In1997 the credit-in-kind program was stopped at the federal level, but retained by major part ofregional governments.
Table 1.5: Russia - Fuel and Lubricants Provided Through the Credit-in-Kind Program_______ ____ _____________ ~~~1994 1995 1996 1997
Prices paid by farms OOORUR/t 242.00 962.00 1,317.00 1,573.00Average export price OOORUR/t 246.31 687.59 937.71 978.89Total costs in agriculture for fuel 000,000,000RUR 1,746.53 5,911.33 16,855.72 21,290.42Total use in agriculture 000 t 7,217.07 6,144.83 12,798.57 13,534.91Total use at export prices 000,000,000RUR 1,777.67 4,225.15 12,001.30 13,249.17Subsidy(+), or implicit interest payment(-) 000,000,OOORUR 31.14 -1,686.18 -4,854.42 -8,041.25Source: Own calculations based on Goskomstat and Customs data.
Longer term credit for investment presents problems perhaps even more severe than thoseassociated with short term credit. Initially the distribution of investment credits was handledthrough officially sanctioned programs, such as «Grain of Russia»>, «Sugar of Russia»), etc. Theeffectiveness of these programs was very low. At present, a competitive system is used toallocate governmental subsidies for medium-term investment credit. This mechanismincorporates participation of the commercial financial institutions, and hence the budget does notbear all the risk. The allocative mechanism, however, does not assure that budgetary funds go toactivities with high national returns. The federal budget sometimes supports small projects of aregional or even local significance.
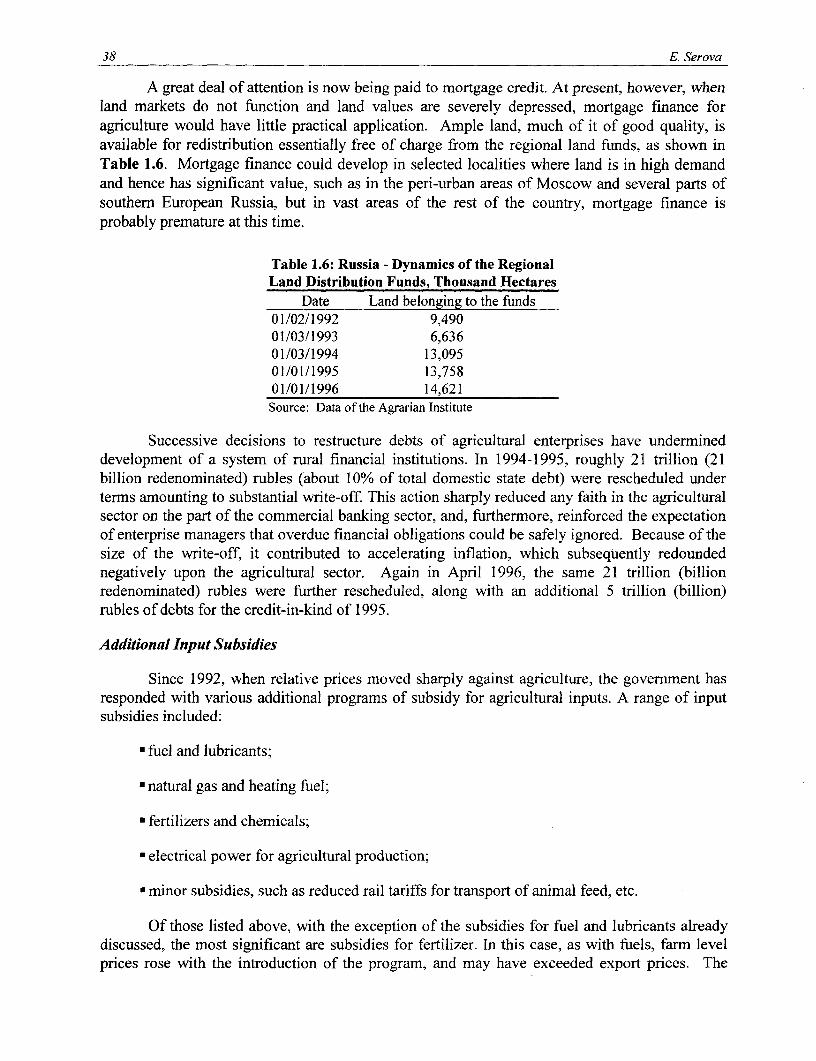
38 E. Serova
A great deal of attention is now being paid to mortgage credit. At present, however, whenland markets do not function and land values are severely depressed, mortgage finance foragriculture would have little practical application. Ample land, much of it of good quality, isavailable for redistribution essentially free of charge from the regional land funds, as shown inTable 1.6. Mortgage finance could develop in selected localities where land is in high demandand hence has significant value, such as in the peri-urban areas of Moscow and several parts ofsouthern European Russia, but in vast areas of the rest of the country, mortgage finance isprobably premature at this time.
Table 1.6: Russia - Dynamics of the RegionalLand Distribution Funds, Thousand Hectares
Date Land belonging to the funds01/02/1992 9,49001/03/1993 6,63601/03/1994 13,09501/01/1995 13,75801/01/1996 14,621Source: Data of the Agrarian Institute
Successive decisions to restructure debts of agricultural enterprises have undermineddevelopment of a system of rural financial institutions. In 1994-1995, roughly 21 trillion (21billion redenominated) rubles (about 10% of total domestic state debt) were rescheduled underterms amounting to substantial write-off. This action sharply reduced any faith in the agriculturalsector on the part of the commercial banking sector, and, furthermore, reinforced the expectationof enterprise managers that overdue financial obligations could be safely ignored. Because of thesize of the write-off, it contributed to accelerating inflation, which subsequently redoundednegatively upon the agricultural sector. Again in April 1996, the same 21 trillion (billionredenominated) rubles were further rescheduled, along with an additional 5 trillion (billion)rubles of debts for the credit-in-kind of 1995.
Additional Input Subsidies
Since 1992, when relative prices moved sharply against agriculture, the government hasresponded with various additional programs of subsidy for agricultural inputs. A range of inputsubsidies included:
* fuel and lubricants;
* natural gas and heating fuel;
* fertilizers and chemicals;
a electrical power for agricultural production;
• minor subsidies, such as reduced rail tariffs for transport of animal feed, etc.
Of those listed above, with the exception of the subsidies for fuel and lubricants alreadydiscussed, the most significant are subsidies for fertilizer. In this case, as with fuels, farm levelprices rose with the introduction of the program, and may have exceeded export prices. The
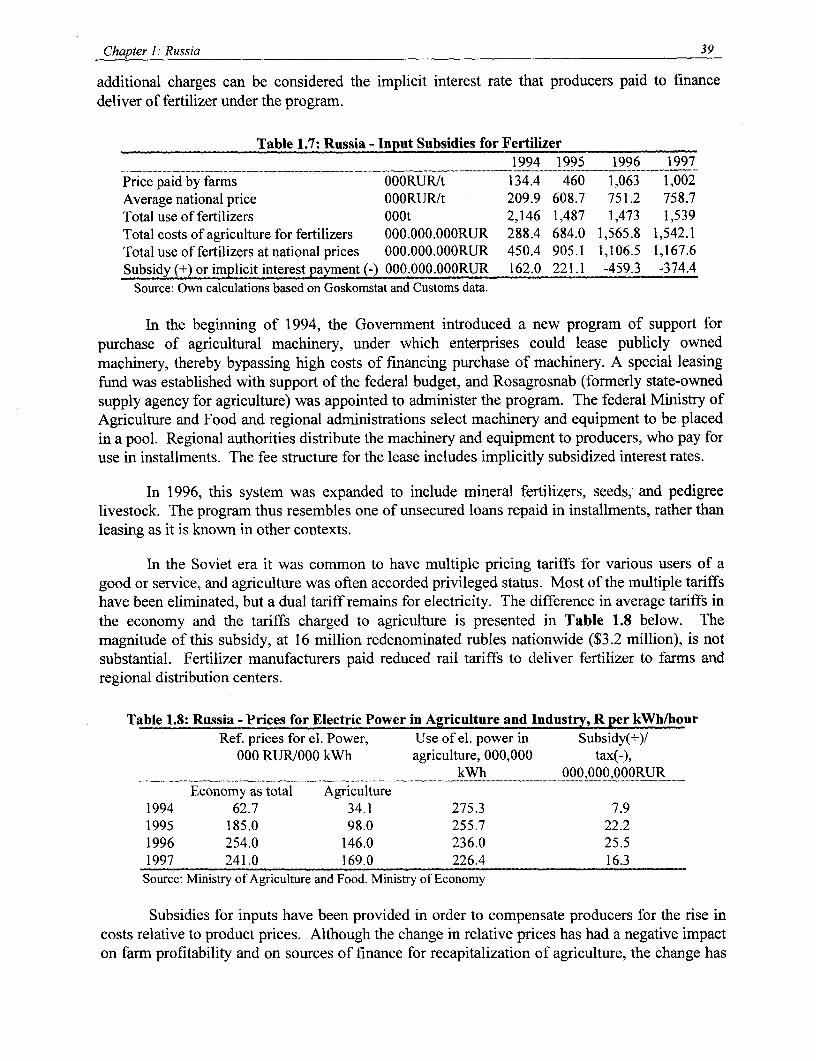
Chapter 1: Russia 39
additional charges can be considered the implicit interest rate that producers paid to financedeliver of fertilizer under the program.
Table 1.7: Russia - Input Subsidies for Fertilizer.---.----...-.....----.-.------ _ _ _ 1994 1995 1996 1997
Price paid by farms OOORUR/t 134.4 460 1,063 1,002Average national price OOORUR/t 209.9 608.7 751.2 758.7Total use of fertilizers OOOt 2,146 1,487 1,473 1,539Total costs of agriculture for fertilizers 000.000.OOORUR 288.4 684.0 1,565.8 1,542.1Total use of fertilizers at national prices 000.000.OOORUR 450.4 905.1 1,106.5 1,167.6Subsidy (+) or implicit interest ayrment (-) 000.000.OOORUR 162.0 221.1 -459.3 -374.4
Source: Own calculations based on Goskomstat and Customs data.
In the beginning of 1994, the Government introduced a new program of support forpurchase of agricultural machinery, under which enterprises could lease publicly ownedmachinery, thereby bypassing high costs of financing purchase of machinery. A special leasingfund was established with support of the federal budget, and Rosagrosnab (formerly state-ownedsupply agency for agriculture) was appointed to administer the program. The federal Ministry ofAgriculture and Food and regional administrations select machinery and equipment to be placedin a pool. Regional authorities distribute the machinery and equipment to producers, who pay foruse in installments. The fee structure for the lease includes implicitly subsidized interest rates.
In 1996, this system was expanded to include mineral fertilizers, seeds, and pedigreelivestock. The program thus resembles one of unsecured loans repaid in installments, rather thanleasing as it is known in other contexts.
In the Soviet era it was common to have multiple pricing tariffs for various users of agood or service, and agriculture was often accorded privileged status. Most of the multiple tariffshave been eliminated, but a dual tariff remains for electricity. The difference in average tariffs inthe economy and the tariffs charged to agriculture is presented in Table 1.8 below. Themagnitude of this subsidy, at 16 million redenominated rubles nationwide ($3.2 million), is notsubstantial. Fertilizer manufacturers paid reduced rail tariffs to deliver fertilizer to farms andregional distribution centers.
Table 1.8: Russia - Prices for Electric Power in Agriculture and Industry, R per kWh/hourRef. prices for el. Power, Use of el. power in Subsidy(+)/
000 RUR/O0O kWh agriculture, 000,000 tax(-),kWh 000,000,OOORUR
Economy as total Agriculture1994 62.7 34.1 275.3 7.91995 185.0 98.0 255.7 22.21996 254.0 146.0 236.0 25.51997 241.0 169.0 226.4 16.3Source: Ministry of Agriculture and Food. Ministry of Economy
Subsidies for inputs have been provided in order to compensate producers for the rise incosts relative to product prices. Although the change in relative prices has had a negative impacton farm profitability and on sources of finance for recapitalization of agriculture, the change has

40 E. Serova
also affected productivity and efficiency of input use. The former effect can be considered to benegative, but the latter is positive. It is well recognized that in the past use and maintenance ofmachinery in Russia was poor. Waste and loss of fertilizer in the Soviet period has beenestimated to be as high as 40% of the quantity supplied. With present higher prices, utilizationand management of inputs has improved. Fuel appears to be used more rationally, even takinginto account the jump in reported usage under the credit-in-kind program. Fertilizer delivered isnow reported to be used, while in the Soviet times, usage was only a portion of delivery. Eventhough agriculture still pays a reduced rate for electricity, the rise in price over time has brought amarked reduction in usage. Russian agriculture today uses fewer inputs more effectively than inthe Soviet period. Labor and land have substituted to a large degree for purchased inputs. Thesubstitutions may not be economically optimal, and yields and labor productivity remain lowerthan desirable in the long run. To some extent, the government's input subsidy programs havehad the unintended effect of inhibiting growth of markets for inputs and credit, and have thusretarded growth in yields. This is particularly true for the debt write-offs, the management of thecredit-in-kind programs, and the federal leasing program.
Tax Concessions
Tax reform was one of the important elements of economic reform in 1992. A profit taxat 23% was introduced. The value-added tax (VAT) replaced turnover and sales taxes. Excisetaxes were introduced for several commodities. Property taxes were introduced for enterpriseassets and for land. The rates of the asset tax were to be established by regional authorities not inexcess of 1%. Land tax rates were set at the federal level for every territory and weredifferentiated according to land quality. Regional authorities have the latitude to adjust land taxrates within limits set by the federal regulations. In addition to the above taxes, rental paymentswere established for the use of natural resources.
A Road Fund was established in 1992 to finance maintenance and construction of thehighway system. Revenues to the Road Fund derive from taxes on sales of fuel and lubricants,and various vehicular taxes on ownership and purchase.
Several additional extra-budgetary funds were established to finance social expenditures.The source of revenues for these funds is the payroll taxes. Payments to the Pension fund wereinitially established at 31.6%, and reduced in 1993 to 28% of payroll. Payments to the Socialfund were set at 5.4% and have subsequently remained unchanged. In 1993, a mandatory healthinsurance fund was established to which all enterprises were to pay 3.6% of payroll. Theunemployment fund was established with a 1% payroll tax in 1992, which was increased to 2%in 1993.
Agricultural producers have been granted various tax concessions since the introductionof the reforms. Primary producers were exempted from the assets and profits taxes from thebeginning. In 1994 the profit tax exemption was extended to processing activities of agriculturalenterprises utilizing their own products. The agricultural payroll tax for the pension fund is20.6%. The rate of payments to the Road fund is also reduced for agriculture.
An estimate of the total value of tax concessions to agriculture is shown in Table 1.9.The largest item is the exemption from the assets tax, but this number is derived from theunadjusted book value of assets, which is a gross overvaluation. Depreciation has much exceed

Chapter 1: Russia 41
investment in the past ten years, and the asset base of agriculture is essentially filly depleted.Therefore asset tax exemptions are overstated.
Table 1.9: Russia - Tax Privileges for Agriculture, 000,000,000 RURValue of taxes privileges: 1994 1995 1996 1997
profit tax 1,050 1,313 574 662assets tax 4,102 8,012 18,762 18,779payments to Road fund 766 919 1,015 2,826payments to Pension fund 1,046 1,312 1,960 2,420
Total ~~~~~~6,964 13,551 24,307 26,684Note: Privileges for private farmers are not included.Source: Ministry of Agriculture and Food
The present Russian tax system creates a major distortion in agricultural marketing andproduction. Profits earned by agricultural enterprises are, in theory, subject to the (reduced)enterprise profits tax. Profits earned on household plots are exempt from tax, since thehouseholds are not registered firms, and the income levels earned do not reach the thresholdrequiring payment of individual income tax. Differential tax treatment explains in part whyapproximately half of Russian agricultural product is reported now to originate in the householdsector, rather than the enterprise sector. On the other hand, agricultural enterprises apparentlyhave difficulty avoiding various local taxes levied in an ad hoc manner by local authorities.Recent tax law severely circumscribes the taxing authority of local governments, but producersreport that the level and variability of local taxes is an obstacle to sound financial management.
BACKGROUND INFORMATION ON CALCULATIONS OF SECTORALPROTECTION AND TAXATION
For the calculations of the Nominal Rates of Protection (NRP) and the Effective Rates ofProtection (ERP), each commodity is classified as an exporTable l.or importable, according tothe shares of net exports in total production (Table 1.10). Russia is clearly a net exporter ofsunflower seeds and barley (in 1995 and 1997), and a net importer of wheat, maize and pork.
Table 1.10: Russia - Trade Status of theSelected Commodities
1994 1995 1996 1997
Wheat 5 5 5 4Maize 98 14 16 11Barley 0.3 -6 3 -4Rye N/A 1 4 N/ASunflower seeds -24 -11 -64 -37Potato 0.2 0 0 -0.2Pork 10 17 18 19Beef 0.5 N/A 1 2Note: (import-export)/gross output* 100%Source: Own calculations from the Customs and Goskomstat data
42 E. Serova
The methodology of calculation requires comparison of Russian and international tradingprices, with appropriate adjustments to each to bring the commodities to a physical location ofcomparison and a roughly common physical condition, including characteristics of quality anddegree of processing. A first step is choice of international prices to serve as comparators. Table1.11 compares two available reference prices that serve as candidates for unadjusted borderprices, and also shows domestic Russian farm gate prices, in dollars converted at the prevailingofficial exchange rate. The first price shown in Table 1.11, the OECD price, is a commonbenchmark price used in many studies by the OECD and roughly capturing trading prices ofbasic commodities entering and leaving European ports. The second price listed in Table 1.11and noted as "non-OECD price" is the actual price reported in Russian customs data for productsentering and leaving Russian borders. Since these prices can vary by season and by shipment, theprices reported in Table 1.11 were calculated as an average of f.o.b. prices for the commoditiesin which Russia was a net exporter and average of c.i.f. prices for the commodities mostlyimported. In the calculations reported below, we used actual Russian customs prices for wheat,barley, rye, sunflower seeds, pork, beef, and milk, since these commodities are actually traded insignificant quantities. For potato and maize, we used the OECD reference prices, since trade inthese products is low. For example, the c.i.f. price for maize entering Russia is largely for hybridseed, and is thus not the same commodity as that priced at the farm gate. For sugar, OECD priceswere used. Table 1.11 also shows unadjusted Russian farm gate prices for the samecommodities.
Table 1.11: Russia - Two Alternative Reference Border Prices(OECD and non-OECD) and Farm Gate Prices (in $/t)
Wheat Barley Sunflower Pork Beefseeds
1994 OECD 115.29 83.98 278.61 1,360.96 1,896.57Non-OECD 99.67 57.27 202.54 1,228.92 1,061.50Farm gate 48.11 34.76 118.17 814.75 586.56
1995 OECD 163.4 128.1 284.97 1,793.52 2,389.24Non-OECD 129.7 77.18 232.39 1,472.56 n.a."Farmn gate 80.21 44.80 182.21 1,360.53 1,040.03
1996 OECD 197.89 166.67 255.52 2,008.87 2,367.72non-OECD 188.57 181.13 224.39 1,455.73 557.13Farm gate 124.88 98.19 154.50 1,711.09 1,369.48
1997 OECD 155.44 134.02 242.84 2,037.55 2,161.40non-OECD 160.18 92.32 199.64 1,679.08 694.39Farmn gate 107.49 86.36 135.58 1,725.26 1,194.68
1/ The OECD price in 1995 for beef is used instead. The OECD price isconverted into carcass weight equivalent.Source: OECD and Russia's Customs data
The next step in the calculation requires taking the border prices and the Russian fanngate prices to a common location for comparison. In our calculations, for importables, we addeda variable margin to take the product from the border to a pre-determined point of competition(or sale) (see appendix Table 1.1). For importables, a transport charge was added to the farmgate price to take the product from the Russian farm to the point of competition. This transportcharge was assumed to be 30 percent of the crop farm level prices, to transport a product fromthe farm gate to a point of competition. To avoid a great variation in the value of the
Chapter 1: Russia 43
transportation costs depending on the product, we established as a reference the value of 30percent of the farm-gate price of a ton of wheat in 1994. This value was converted into dollars atthe 1994 exchange rate, and then adjusted upward in dollar terms by 10% each year8 . Thetransport costs thus derived ranged from about $14 per ton in 1994 to about $19 per ton in 1997,and were held standard across commodities. For livestock products, the tranporatation cost wasobtained from an unpublished work of Mudahar and Shaeffer9. For exportables, the f.o.b.customs prices were adjusted back to the farm level by subtracting the transport cost (againapproximately $14 in 1994, rising to about $19 in 1997 - see appendix Table 1.1).
Nominal protection rates thus derived are displayed in appendix Table 1.2. Thecalculations suggest that in aggregate Russian agricultural producers are harmed by output pricesthat are depressed relative to international levels. The instruments that serve to depress outputprices are the combination of policies, many of which originate at the local level, and marketimperfections that impede transmission of international prices down to the farm level. Themagnitude of the net taxation through output prices was greatest in 1994 at an estimated -57%,and diminished successively over the intervening four years, until a level of -16% in 1997. Nettaxation through output prices is greatest in the crop sector, and less in the livestock sector.Selected livestock products, notably beef, had positive protection, as capture in positive NPR'sfor 1996 and 1997.
For computation of ERPs, three traded inputs were considered: gasoline and diesel,fertilizers, and electrical power. For oil products the average export prices were taken, and for thefertilizers and electrical power - domestic average price. Implicitly it is assumed that familyfarms and large-scale farms paid the same prices for the same inputs. The national Statisticsagency monitors the input prices only for the large-scale farms, and prices for the other producersare not available. As far as family farms provide quite insignificant part of the GAO and thehouseholds mostly get such inputs from the large-scale farms we consider such assumptionadmissible. The effective protection rates computed are very similar to the values found for theNRPs thus suggesting that trade barriers are uniform among inputs and outputs.
For the computation of non-price related transfers, the total budget spending had to beallocated to the products based on their share in the gross agricultural product. The bulk ofbudget expenditures for agri-food sector are not attributed to the particular product.
The federal budgetary expenditures for agriculture are not yet fully transparently evident.Parliament approves the federal budget annually, including authorized expenditures foragriculture are displayed under the categories for agriculture and fishery, and management ofland resources. Authorized expenditures broadly maintenance of institutions (Ministry ofAgriculture and Food and its bodies, Land Committee and its regional branches), federalsubsidies for agriculture, some investments, some spending for agricultural science, land
a According to table 5, the price of fuel and lubricants paid by farmers, in dollar terms, increased almost 150% from1994 to 1997, or an average of 35 percent p.a. We are being conservative assuming only a 10 percent increase intransportation costs in our estimations.
9 Mudahar, Mohinder S. and G. Barry Schaeffer. Measuring the effects of agricultural price, subsidy and transferspolicy in Russia. Agriculture, Industry and Finance Division. Country Department III, Europe and Central AsiaRegion. The World Bank, Washington, DC. June 1996 (unpublished).
44 E. Serova
engineering, and other activities. These expenditures in total are reflected in the Table 1.12 inthe last row. In addition, a portion of expenditure on agricultural education and science appearsin other chapters of the budget, and agriculture may receive a portion of investment allotted tothe real sector. The structure of the federal budget has changed from year to year and it isdifficult to trace all these expenditures. Furthermore, the budgetary support to the credit-in-kindprogram appeared in the budget as a reduction in revenue, rather than an item of expenditure.Using the budget as a source for tracking governmental expenditures on agriculture thus presentschallenges. A portion of governmental support for agriculture also takes the form of mutualclearing of obligations; e.g., swaps of payables and receivables, usually enterprise debts to thebudget for past loans and budget debts to the enterprises for products delivered to the federalfood funds (for the army and northern territories). For all of these reasons the variousgovernmental bodies (Ministry of Agriculture and Food, Ministry of Finance, National StatisticalCommittee) report different figures on state support to agriculture, and the figures areperiodically adjusted.
In addition to budgetary expenditures, in 1994-1995 there was an explicit extra-budgetaryfund for agriculture and mining, formed through a tax of 1.5% on gross revenues of enterprises inall sectors of economy. One third of this fund was retained at the federal level, and two-thirdswent to the regions. The federal part was then allocated one-third to agriculture and two-thirds tothe mining industry. The regional revenues from the special fund were also used for agricultureand mining, in proportions established by regional authorities.
Officially the decomposition of agricultural budget is not published. On the basis ofsources from the Ministries of Agriculture and Food, the Ministry of Finance, and the StateCommittee on Statistics, we estimate the following breakdown of expenditures for 1994-1997 atthe federal level.
Table 1.12: Russia - Total Expenditures for Agriculture (trillion RUR orbillion redenominated rubles)
1994 1995 1996 1997Institutions 714.20 2,132.87 2,505.57 1,358.58Subsidies 3,873.00 5,770.40 374.20 1,122.97Leasing Fund 783.00 934.10 655.30 716.70
Individual farmers support 0.00 82.60 15.40 4.01Land resources N/A N/A N/A 141.53Science 182.90 289.70 427.80 74.50Investments 786.30 768.90 576.00 92.47Special Fund for Soft Credit x x x 2,700.0
of which paid back x x x 2,005.9Restructured debts x 29,200 x xTotal (the federal budget outlay) N/A 6,200 8,500 9,900Index-deflator of the GDP, % 1455 1181Source: Own calculations and Goskomstat data N/A= not available
According to the calculations above, nominal expenditures fell between 1995 and 1997.The decline in spending at the federal level over this period was picked up in part at the regionallevel. Federal spending to agriculture equals about one third of total state expenditures for this

Chapter 1: Russia 45
sector, and the regional budgets pick up the remainder. With the worsening financial conditionof regional budgets in 1997 and particularly in 1998, however, the share of regional supportjumped up to 80% of total state support of agriculture.
The major part of subsidies from the federal budget was allocated for the compensation ofthe costs of the mineral fertilizers (up to 1/3) and support of pedigree breeding and elite seedproduction (up to 20%). The soybean and flax programs are not significant in size. Woolsubsidies in several years were large, and these served as safety net payments for depressed areasthat specialized in wool production. A key feature of the composition of federal support toagriculture is its variability over time. For example, spare parts were highly subsidized in 1994,but this subsidy was subsequently abolished. Similarly, feed subsidies were high in some yearsand low in others. Variability of subsidies exacerbated uncertainty in the economic environmentof agriculture.
A breakdown of the various items grouped under "subsidies" in 1997 is shown below.
Table 1.13: Russia - Subsid Structure in 1997 (federal budget), Percentage of TotalType of subsidy Actual spendingElite seeds 6.03Energy costs compensation of green houses 4.04Flax 2.79Soya 3.31Fertilizers 10.94Crop area insurance 1.70Pedigree breeding 11.99Wool 14.30Feed for feedlots 42.61Other 2.29Total 100.00
Source: Ministry of Agriculture and Food data and own calculations.
Although allocated expenditures as shown in the budget are not entirely clear, actualexpenditures are even less clear. In each of the years, actual expenditures deviated fromallocations because revenues fell short of projections. In general, expenditures for agriculturewere cut back less than those for other sectors, reflecting a measure of political support for thesector. Both projected and actual expenditures on agriculture in 1998, however, were cut backseverely, to the point that federal support for agriculture at present is very minor."
'o Our calculations of ERA could underestimate the true aggregate level of support for agriculture if one considers allthe support provided through regional budgets - what some analysts have referred to as "the regionalization ofagricultural policies in Russia." We did not have reliable disaggregated data at the regional level.
46 E Serova
CONCLUSIONS AND IMPLICATIONS FOR FUTURE PERFORMANCEOF THE SECTOR
The statistical basis for analytical work on Russian agriculture is still weak, and thisimpedes ready access to the information that policy makers need. The analyses attempted hereare standard for many OECD countries, and are undertaken in a number of lower and middle-income countries that are not yet members of OECD. On a routine basis, these calculationsrequire regular and reliable observations on farm gate prices, transport and processing margins,wholesale prices, input prices, input use, retail prices, and international trading prices. Althoughmany statistics are collected in Russia, there are still key gaps in data needed to monitor theperformance of a market economy.
Russian primary producers of major commodities receive prices that are lower thaninternational reference prices. Other factors besides output prices affect producers' incentivesand their well being. Nonetheless, the finding that almost a decade into reforms and over aperiod in which Russian trade policy was quite liberal, farm gate prices are depressed relative tointernational prices suggests that serious attention should be turned to identify measures that canimprove transmission of international prices. Artificially low output prices will retardreinvestment in agriculture needed to improve competitiveness and increase yields. This findingis important because it contrasts with that of a recent report undertaken by the OECD with adifferent methodology that suggests that on balance Russian producers are not taxed by priceinterventions (ref OECD). In contrast to the OECD, our calculations use Russian customs pricedata, which in general give lower international reference prices. We also take the importedcommodities into the country for a common point of comparison, and apply margins of transportand handling that are lower than the OECD assumed levels of 50%. The different findings of thetwo studies agree in the general conclusion that Russian farm gate prices, and hence producerincentives, are relatively low. The studies differ on the interpretations accorded to assumptionsabout margins, and about the actual levels of margins assumed.
The degree of implicit taxation through output prices declined over time between 1994and 1997, and was greater for crops than for livestock. Both the OECD study and our approachagree on these findings, and hence they appear to be relatively robust. The importance of thisfinding lies in its implications: the combination of policies and market imperfections arepenalizing the export products in which Russian has a present or potential comparativeadvantage, and assisting the producers of commodities that are least competitive; i.e., thelivestock sector. Overall, these effects retard the improved competitiveness of Russianagriculture as a whole.
Budgetary expenditures on agriculture at the federal level have been declining over time,and are now quite modest. Overall the amount of money spent on governmental programs foragriculture (the categories outside market support) has been rather modest for a large country (at$ 1.7 billion per year), but not insignificant. The striking finding is how little improvement in thesector has been achieved with these monies. Given the outlook for budgetary stringency in thefuture, it is even more important at present than in the past to identify institutional and regulatorylacunae that depress producer incentives and impede reinvestment by private agents. Remainingpublic funds available for agricultural intervention can be best targeted toward removing theseconstraints, since budgetary resources will clearly be inadequate to compensate producers fortheir ill effects.

Chapter 1: Russia 47
Appendix Table 1.1: Russia - Price Adjustments
Adjustments from Border to Point of Competition (expressed as %Wheat Corn Barley Rye Sugar Beet Pork Beef Milk
1994 17% 50% 20% 20% 52% 8% 8% 8%1995 17% 50% 20% 20% 52% 8% 8% 8%1996 17% 50% 20% 20% 52% 8% 8% 8%1997 17% 50% 20% 20% 52% 8% 8% 8%
Note: include unloading, storage and handling, importers margins, transportation.Source: Mudahar and Shaeffer (1996).
Appendix Table 1.2: Transportation Costs(from farm to point of competition), in U$
Grains Livestock1994 14.43 77.401995 15.88 85.141996 17.46 93.651997 19.21 103.02
Note: Transportation costs/ton for grains refers to 30%of the wheat price per ton in 1994 and a 10% annualincrease in these costs.Source: Goskomstat data
CHAPTER 2: ROMANIA
Emil Tesliuc
THE ROMANIAN AGRICULTURAL SECTOR
The agricultural sector in Romania is, after industry, the second largest in the economy,employing one third of the labor force and contributing to one fifth of GDP. It is, therefore,important for jobs and earnings. Almost one half of the population lives in rural areas, whereagriculture is the main source of employment (70%) and earnings (65%). Food expendituresrepresent more than half of the household expenditures, thus food prices and domestic foodsupply are important policy priorities. Domestic agriculture was the main source of cheapresources for food industry, thus sustaining its development in a very autarchic environment.With the increased openness of the economy, the competitive pressure on the Romanian foodindustry has also increased.
The unanimous desire of the policy-makers to help agriculture develop led to theimplementation of a wide spectrum of interventionist policies between 1994 and 1996. At thebeginning of the period, fiscal subsidies were sufficient. However, state-owned agriculture soongrew entirely dependent on public money. The accent moved in time to quasi-fiscal transfersable to escape the scrutiny of the public eye. Cumulatively, the fiscal and quasi-fiscal flows toagriculture during this period were estimated at 3% to 9% of agricultural GDP. These policiessoon proved to be unsustainable. At the end of 1996, the budget was unable to accommodate therequest for funds "needed" by the sector. The parastatals that provided quasi-fiscal support wentbankrupt. Romania was forced to reform its agricultural policy.
The collapse of the interventionist policy forced Romania to shift the accent toward thefree-market. At the beginning of 1997, a comprehensive reform agenda was developed with helpfrom the World Bank. The reform was designed to deal simultaneously with changes in theincentive franework and rapid structural adjustment via rapid privatization and downsizing ofinefficient operations. The target of the reform was to transfer the assets of the agricultural statefirms to private entrepreneurs, either as going concerns, or through liquidation of bankruptbusinesses, in order to be used more efficiently. In the short-term - one to two years -agricultural output would register a fall, to be followed by a sound recovery, led by the privatesector. The practice proved that incentives' reform was easier to implement than the neededprivatization and liquidation policy. At the middle of 1998 the new incentive framework was inplace, but because of lack of progress on privatization there was no strong private initiative tocapture the new set of incentives. The expected supply response did not happen. As a result, theanti-refornist lobby raised its voice, asking for more subsidies and border protection.

Chapter 2: Romania 49
AGRICULTURAL POLICY DURING TRANSITION
THE BEGINNING OF THE TRANSITION: 1989-1993
After the land reform of 1991, the agricultural landscape in Romania changeddramatically. At the outset of the transition", 411 state farms and 3,776 cooperatives exploitedalmost all of the country's (arable) land resources. In 1991, about 65% of the agricultural area12 -
belonging to the cooperatives- was restituted to former owners or their heirs. About 3.7 millionpeasant households, who, after repossessing their land, decided to exploit it individually or inassociations, took the place of former agricultural cooperatives. Three quarters of the area inprivate ownership is now worked by small, subsistence-based, agricultural units, of 2 to 3 haseach, sometimes divided into 3 to 5 plots. Following land reform, three new forms of privateland tenure replaced state co-operatives: a) peasant farms (small-scale farms, averaging 2.5 haeach); b) family associations (farms of 100 ha each); and c) agricultural companies (farms of 500ha each). State farms remained essentially unchanged.
Out of the total agricultural area, state farms are farming 16% of the land resources ofRomania, agricultural companies 14%, family associations 10%, and peasant farms the remaining60% (1997). The number of private farms increased dramatically compared with the pre-landreform situation: about 3,875 formal associations, 7,000 informal ones and 3.7 million smallfarms now farm private land. The contribution of the private sector in vegetal production was, in1997, 89.4%. However a large part of the production never reaches a market, due to thewidespread subsistence farmning that characterize the peasant farms. As for the marketed portionof the ouitput, the emerging private associations/companies contribute at par with the state farmsin supplying the food industry.
Agricultural structural policy developed in two streams: fast privatization of the co-operatives land, and a virtual standstill on the privatization of state-owned land, animal farms,and downstream or upstream businesses. Privatization of the land resources occurred in 1991,with the restitution of land in state cooperatives to the former owners'3 . The rest of agriculturalland was maintained with an unclear legal status - no state institution were assigned as the ownerof the remaining land and no legal ownership title issued for it. Until today, state farmprivatization has been postponed, waiting for a political solution. There is some hope that statefarm privatization may start in the second half of 1999.
Except for the large impact of land reform on ownership and land tenure, little or noprogress has occurred in trade or price liberalization. The liberalization of major macro priceswas delayed. At the beginning of the period, exchange rates and interest rates were subject tovalue or volume quotas. Multiple exchanges cohabited with directed, preferential credit schemes.Foreign and domestic trade policy was still dominated by parastatals. Land reforn broke theformer links between agriculture, its upstream suppliers, and downstream clients. In this turmoil,1992 obviously was a bad agricultural year: gross agricultural output decreased by 12%, mainly
" In 1989, figures from the Statistical Yearbook 1990.
12 73% of the arable area, respectively.
13 With the land, most of the cattle herd was transferred to the former owners as well.
50 E. Tesliuc
due to cereal production being at two thirds of its "normal" average. The change in the landownership and tenure required new solutions for input and credit distribution, as well as outputmarketing.
THE HEAVY HAND OF THE STATE
To arrest the decline in agricultural output and to reintegrate private agriculture back intothe marketing chain, the authorities implemented a new policy package in 1993. The mainfeatures of this agricultural policy were concerted, heavy, intervention in four major commoditychains (wheat, pork, poultry, and milk/dairy products), plus milder, selected interventions inother areas. For the four commodities, prices were set administratively using a pan-seasonal andpan-territorial rule. Producers that surrendered their products at fixed prices to state-mandatedagents benefited from large producer subsidies, and gained eligibility for other input subsidiesand soft credit. Commodities surrendered at the administrative price were controlleddownstream, through capped or fixed processing and marketing margins. Under this system,producer, processor, and retail prices were "under control." However, in order for such amechanism to work, one should limit import and export competition. In July 1995, the domesticmarket was insulated from foreign competition through a sharp increase in border protectionfrom 20% to 70-80% in the case of imports'4 combined with export bans or quotas.
In other sectors - sugar beet, sunflower and maize - the mildest interventionist tools suchas state procurement, soft credits and border measures were used. Investment grants wereprovided for the build-up of the cattle herd. To stimulate private investment in agriculturalmachinery, domestically produced equipment bought on credit benefited from subsidized interestrates.
All the measures listed above, required to implement a change in domestic relative pricesrather than border prices, had their cost. Producer subsidies for inputs, outputs or factors orinterest rate subsidies had a straight fiscal cost. Other costs were not so obvious. The cheapcredit that the National Bank provided to the banks, was intermediated under fixed margin totheir clients, and therefore had a cost. The revenues of the National Bank declined, the tax onprofits that should be surrendered to the budget declined, and therefore the total funds availablefor public spending declined. The National Bank, Banca Agricola and some parastatals like thegrain monopsony Romcereal/ANPA or the State Ownership Fund were used to transfer resourcesto the sector, absorbing the losses of the agricultural companies. These transfers, of quasi-fiscalnature, add to the cost of support for agriculture.
Many rationales were provided as justification for the heavy interventionist policies. Themost common was the "micro food-security" argument, to protect urban consumers fromuncontrolled price increases. Keeping staple food prices under control was seen as a device forcontrolling inflation. Leaving aside the "good-intentions" of this policy, one can measures threemajor consequences. First, the policy required private agriculture to interact solely with state
4 For the four "commodities of national importance," the "erga omnes" import tariffs were set at 236% for pork,143% for broilers, 240% for butter and to 65% for wheat.
Chapter 2: Romania 51
agencies, the latter extracting huge rents from their monopolist/monopsonist position. Second,huge sums of money were injected in agriculture, but the incidence of the subsidies wasconcentrated heavily in the remaining state sector. Third, studies on subsidy incidence showedthat most of the benefits accrued to the wealthier strata of the society.
THE 1997 SLOGAN: LIBERALIZATION AND PRIVATIZATION
Not only did these interventions not achieve their intended targets, but also their costsgrew larger and larger over the four-year period peaking in 1996. Unfortunately 1996 was a badagricultural year for Romania and the agricultural bet that the government placed with theselarger subsidies did not pay off. Part of these costly liabilities accrued to the 1997 budget. In1997, the budget was again unable to meet the demands the agricultural subsidies imposed on it.The parastatals that took over the losses of the sector were almost bankrupted by it.
Under these circumstances, in 1997 the interventionist policy was discontinued. Softcredit policy stopped in January 1997, prices were liberalized, and producer subsidies wereeliminated in February 1997. Import tariffs were reduced to around 28% (production-weightedaverage) in May 1997, and exports were fully liberalized in August 1997. A liberal economicclimate was instituted, gradually, during 1997.
MAIN POLICIES AFFECTING INCENTIVES
Under this heading, we will describe the main policy tools used by the authorities tomodify the incentives producers, processors and consumers are facing: price, subsidies, credit,trade and exchange rate (a summary of the current agricultural policies for the six commoditiesanalyzed is presented in the Annex).
Price Policy. At the beginning of the transition, administered prices were a commonpolicy tool. The gradual price liberalization recipe followed by the earlier administrations havechosen a combination of producer price liberalization combined with widespread use ofconsumer subsidies and control over the retail prices or commercial margins. Given the mistrustin markets, the chosen formula was "under control" in many respects: most of the producers werestate-owned units, were moral suasion or owner-control was used in imposing a "pricediscipline". In agriculture, where the private sector was dominant at the primary level, thecontrol was exerted through downstream and upstream parastatals used to convey "administratedprice signals" to producers. In 1992, the time of first wave of price liberalization, 80% ofagricultural budget was in consumer subsidies, and the figure decreased in 1993 to 16% and thento almost zero. Same time, 80 to 90% of the marketed output in core agricultural commoditieswas bought by state-owned marketing agents.
Starting from 1994, the administration tried a more "liberal" formula, creating a maze ofoutput and input price subsidies that producers can benefit from. The entry pass in the systemwas the respect of administratively set prices for producers, followed by the respect of marginand retail price controls for the processors and retailers buying the subsidized commodity. Ineffect, the system was trying to replicate the outcome of the former one. Commodities under thestate-controlled marketing system were intended to reach consumers at lower prices, thus

52 E. Tesliuc
eliminating the emerging private competition. The system was implemented for fourcommodities of "national importance": wheat, pork, and poultry meat and cow milk. TheAchilles' heel of the system was its fiscal cost and the constant pressure of liberalized inputindustries on farmers financial viability. When budget pressure to sustain the attached subsidieswas too high, quasi-fiscal subsidies were used. When the use of the latter form of subsidiesincreased (in 1995-96), the system went bankrupt. In February 18th, 1997, agriculturalcommodity prices were liberalized at all marketing levels.
Subsidy Policy. Throughout the transition period, agricultural sector was supplied withlarge amounts of subsidies. The aim of the policy makers was to provide cheap food to thepopulation while maintaining remunerative prices for the producers. Taxpayers would pay forthe wedge between the producers and consumers prices. Thus, budgetary support augmented thesector value added by 9 to 24 percent. Consumer subsidies dominated the period 1991 to 1992(Table 2.1). In 1993, they were replaced with a combination of producer, input and factor pricesubsidies, and concentrated in four commodities. The system was implemented between 1993 upto February 1997. Starting March 1997, the emphasis was placed on indirect interventions likeinput vouchers, storage subsidies and services of general interest.
Table 2.1: Romania - Budgeary Support for Agriculture, 1991-97.Budgetary Support for Agriculture 1991 1992 1993 1994 1995 1996 1997% of Gross Value Added in Agriculture 9 18 12 13 12 14 10Composition: 100 100 100 100 100 100 looConsumer (price) subsidies 46 80 16 0 0 0 0Producer (price) subsidies // premia 0 0 50 26 46 46 1 1Input (price) subsidies 14 4 13 32 24 23 13Factor (price) subsidies 0 0 0 10 12 14 1 1Transfers, out of which: 0 0 5 14 0 4 31Services of general interest 35 13 13 15 16 12 11Agricultural Credit (principal): 0 0 0 0 0 0 22Administrative costs 5 2 2 2 2 1 2Source: Changes in the Romanian Agricultural and Food Sector, Ministry of Agriculture and Food 1997 AnnualReport
Credit Policy. At the start of the transition, many state-owned agricultural firms werefound with little working capital, their productions cycle being dependent on the borrowed one.This was supplied, until the end of 1996, by a mono-sector bank, Banca Agricola. When theprice of credit was liberalized in 1992, the interest rate cost began to depress the financial profitmargin of the agricultural enterprises. In response of state sector lobby, the administration startedto control the credit allocation and its price, using the National Bank and the sector bank asinstruments. To deliver preferential credit to agriculture proved to be a difficult topic; theamount of interest subsidy required was a heavy weight on the budget. Starting 1993, tough, theadministration financed these transfers using central-planning tools. The standard mechanismwas for the central bank to issue directed credit lines for agriculture, bearing negative interestrates. The intermediation, taken care by Banca Agricola, was a simple distribution exercise,bankers being instructed by law to whom to lend and what margin to charge. Under thismechanism, large quasi-fiscal subsidies have been transferred to the agricultural sector. Thecentral bank renounced to a portion of its profit, and lent agricultural enterprises cheap credit.
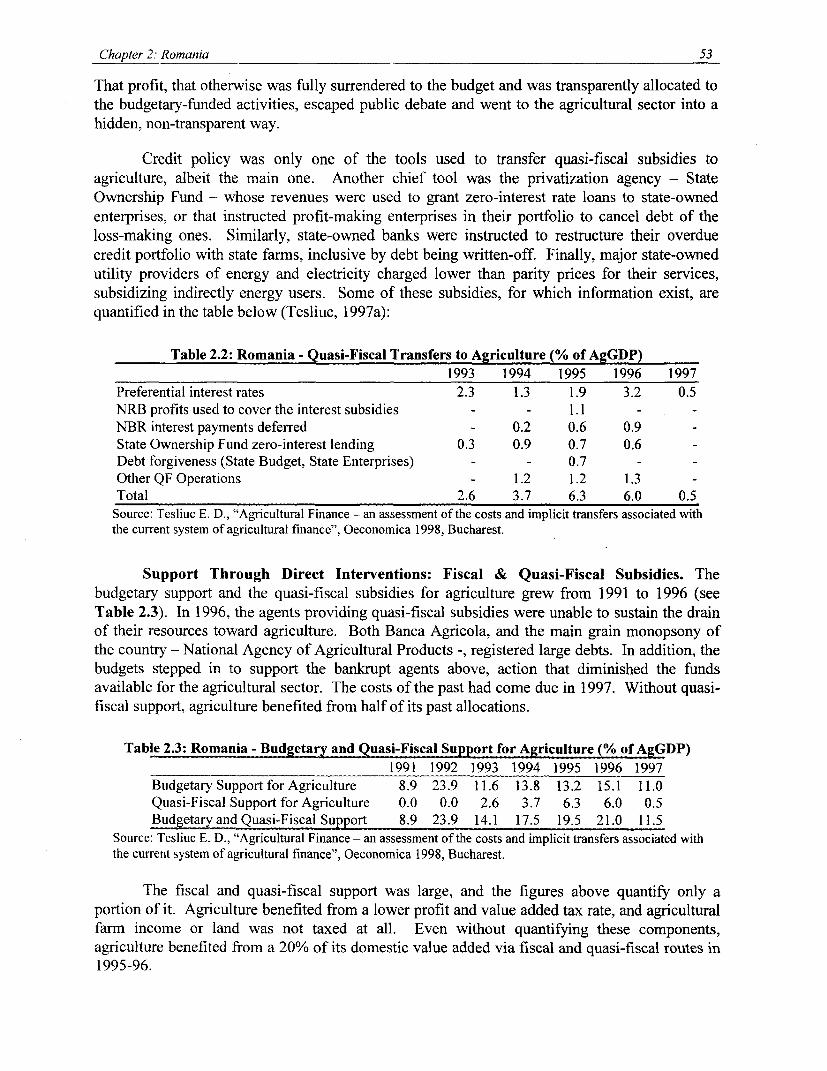
Chapter 2: Romania 53
That profit, that otherwise was fully surrendered to the budget and was transparently allocated tothe budgetary-funded activities, escaped public debate and went to the agricultural sector into ahidden, non-transparent way.
Credit policy was only one of the tools used to transfer quasi-fiscal subsidies toagriculture, albeit the main one. Another chief tool was the privatization agency - StateOwnership Fund - whose revenues were used to grant zero-interest rate loans to state-ownedenterprises, or that instructed profit-making enterprises in their portfolio to cancel debt of theloss-making ones. Similarly, state-owned banks were instructed to restructure their overduecredit portfolio with state farms, inclusive by debt being written-off. Finally, major state-ownedutility providers of energy and electricity charged lower than parity prices for their services,subsidizing indirectly energy users. Some of these subsidies, for which information exist, arequantified in the table below (Tesliuc, 1997a):
Table 2.2: Romania - Quasi-Fiscal Transfers to Agriculture (% of AgGDP)1993 1994 1995 1996 1997
Preferential interest rates 2.3 1.3 1.9 3.2 0.5NRB profits used to cover the interest subsidies - - 1.1 - -
NBR interest payments deferred - 0.2 0.6 0.9State Ownership Fund zero-interest lending 0.3 0.9 0.7 0.6Debt forgiveness (State Budget, State Enterprises) - - 0.7Other QF Operations - 1.2 1.2 1.3 -
Total 2.6 3.7 6.3 6.0 0.5Source: Tesliuc E. D., "Agricultural Finance - an assessment of the costs and implicit transfers associated withthe current system of agricultural finance", Oeconomica 1998, Bucharest.
Support Through Direct Interventions: Fiscal & Quasi-Fiscal Subsidies. Thebudgetary support and the quasi-fiscal subsidies for agriculture grew from 1991 to 1996 (seeTable 2.3). In 1996, the agents providing quasi-fiscal subsidies were unable to sustain the drainof their resources toward agriculture. Both Banca Agricola, and the main grain monopsony ofthe country - National Agency of Agricultural Products -, registered large debts. In addition, thebudgets stepped in to support the bankrupt agents above, action that diminished the fundsavailable for the agricultural sector. The costs of the past had come due in 1997. Without quasi-fiscal support, agriculture benefited from half of its past allocations.
Table 2.3: Romania - Budgeta and Quasi-Fiscal Suport for Agriculture % of A DP)1991 1992 1993 1994 1995 1996 1997
Budgetary Support for Agriculture 8.9 23.9 11.6 13.8 13.2 15.1 11.0Quasi-Fiscal Support for Agriculture 0.0 0.0 2.6 3.7 6.3 6.0 0.5Budgetary and Quasi-Fiscal Support 8.9 23.9 14.1 17.5 19.5 21.0 11.5
Source: Tesliuc E. D., "Agricultural Finance - an assessment of the costs and implicit transfers associated withthe current system of agricultural finance", Oeconomica 1998, Bucharest.
The fiscal and quasi-fiscal support was large, and the figures above quantify only aportion of it. Agriculture benefited from a lower profit and value added tax rate, and agriculturalfarm income or land was not taxed at all. Even without quantifying these components,agriculture benefited from a 20% of its domestic value added via fiscal and quasi-fiscal routes in1995-96.
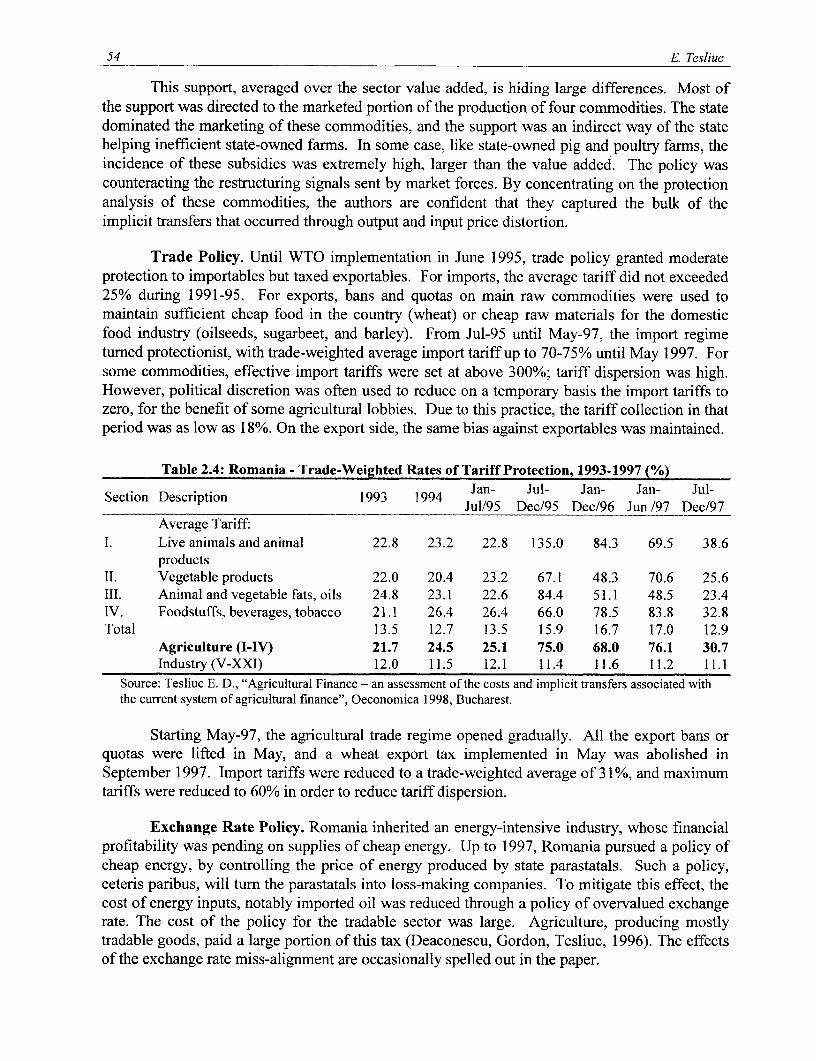
54 E Tesliuc
This support, averaged over the sector value added, is hiding large differences. Most ofthe support was directed to the marketed portion of the production of four commodities. The statedominated the marketing of these commodities, and the support was an indirect way of the statehelping inefficient state-owned farms. In some case, like state-owned pig and poultry farms, theincidence of these subsidies was extremely high, larger than the value added. The policy wascounteracting the restructuring signals sent by market forces. By concentrating on the protectionanalysis of these commodities, the authors are confident that they captured the bulk of theimplicit transfers that occurred through output and input price distortion.
Trade Policy. Until WTO implementation in June 1995, trade policy granted moderateprotection to importables but taxed exportables. For imports, the average tariff did not exceeded25% during 1991-95. For exports, bans and quotas on main raw commodities were used tomaintain sufficient cheap food in the country (wheat) or cheap raw materials for the domesticfood industry (oilseeds, sugarbeet, and barley). From Jul-95 until May-97, the import regimeturned protectionist, with trade-weighted average import tariff up to 70-75% until May 1997. Forsome commodities, effective import tariffs were set at above 300%; tariff dispersion was high.However, political discretion was often used to reduce on a temporary basis the import tariffs tozero, for the benefit of some agricultural lobbies. Due to this practice, the tariff collection in thatperiod was as low as 18%. On the export side, the same bias against exportables was maintained.
Table 2.4: Romania - Trade-Weighted Rates of Tariff Protection, 1993-1997 (%)Section Description 1993 1994 Jan- Jul- Jan- Jan- Jul-
Jul/95 Dec/95 Dec/96 Jun /97 Dec/97Average Tariff:
I. Live animals and animal 22.8 23.2 22.8 135.0 84.3 69.5 38.6products
II. Vegetable products 22.0 20.4 23.2 67.1 48.3 70.6 25.6III. Animal and vegetable fats, oils 24.8 23.1 22.6 84.4 51.1 48.5 23.4IV. Foodstuffs, beverages, tobacco 21.1 26.4 26.4 66.0 78.5 83.8 32.8Total 13.5 12.7 13.5 15.9 16.7 17.0 12.9
Agriculture (I-IV) 21.7 24.5 25.1 75.0 68.0 76.1 30.7Industry (V-XXI) 12.0 11.5 12.1 11.4 11.6 11.2 11.1
Source: Tesliuc E. D., "Agricultural Finance - an assessment of the costs and implicit transfers associated withthe current system of agricultural finance", Oeconomica 1998, Bucharest.
Starting May-97, the agricultural trade regime opened gradually. All the export bans orquotas were lifted in May, and a wheat export tax implemented in May was abolished inSeptember 1997. Import tariffs were reduced to a trade-weighted average of 31%, and maximumtariffs were reduced to 60% in order to reduce tariff dispersion.
Exchange Rate Policy. Romania inherited an energy-intensive industry, whose financialprofitability was pending on supplies of cheap energy. Up to 1997, Romania pursued a policy ofcheap energy, by controlling the price of energy produced by state parastatals. Such a policy,ceteris paribus, will turn the parastatals into loss-making companies. To mitigate this effect, thecost of energy inputs, notably imported oil was reduced through a policy of overvalued exchangerate. The cost of the policy for the tradable sector was large. Agriculture, producing mostlytradable goods, paid a large portion of this tax (Deaconescu, Gordon, Tesliuc, 1996). The effectsof the exchange rate miss-alignment are occasionally spelled out in the paper.
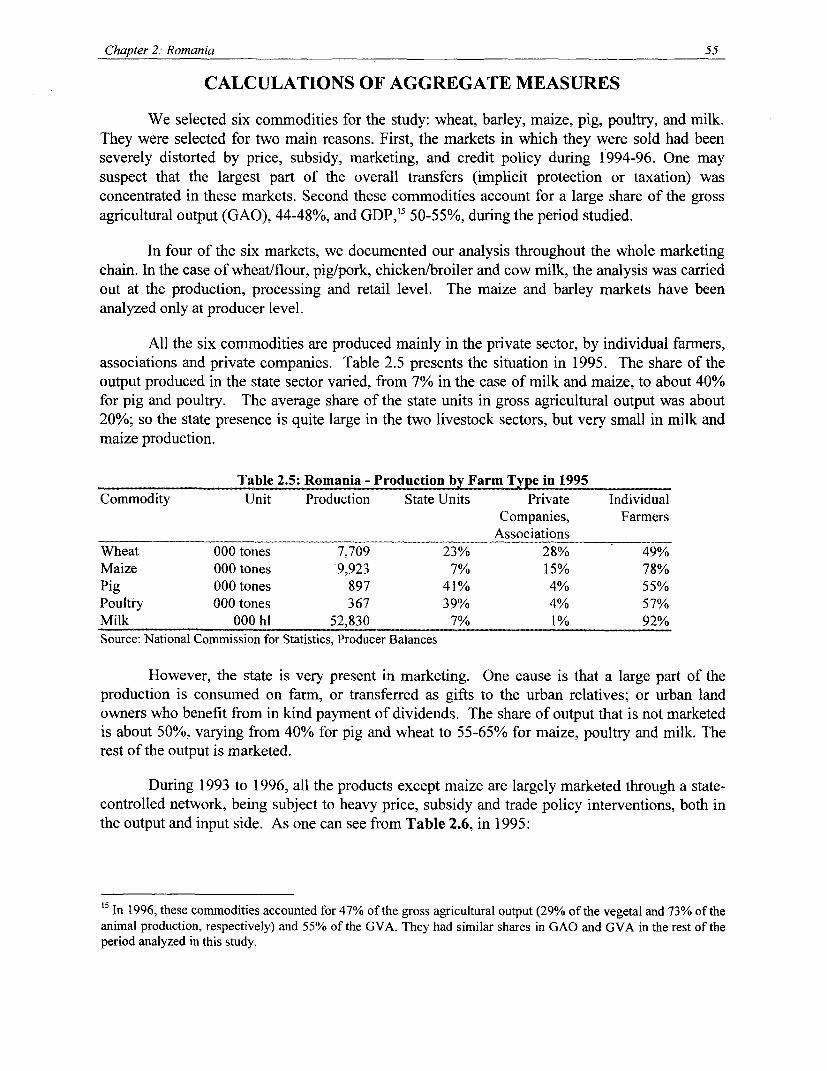
Chapter 2: Romania 55
CALCULATIONS OF AGGREGATE MEASURES
We selected six commodities for the study: wheat, barley, maize, pig, poultry, and milk.They were selected for two main reasons. First, the markets in which they were sold had beenseverely distorted by price, subsidy, marketing, and credit policy during 1994-96. One maysuspect that the largest part of the overall transfers (implicit protection or taxation) wasconcentrated in these markets. Second these commodities account for a large share of the grossagricultural output (GAO), 44-48%, and GDP,5̀ 50-55%, during the period studied.
In four of the six markets, we documented our analysis throughout the whole marketingchain. In the case of wheat/flour, pig/pork, chicken/broiler and cow milk, the analysis was carriedout at the production, processing and retail level. The maize and barley markets have beenanalyzed only at producer level.
All the six commodities are produced mainly in the private sector, by individual farmers,associations and private companies. Table 2.5 presents the situation in 1995. The share of theoutput produced in the state sector varied, from 7% in the case of milk and maize, to about 40%for pig and poultry. The average share of the state units in gross agricultural output was about20%; so the state presence is quite large in the two tivestock sectors, but very small in milk andmaize production.
Table 2.5: Romania - Production by Farm Type in 1995
Commodity Unit Production State Units Private IndividualCompanies, Farmers
AssociationsWheat 000 tones 7,709 23% 28% 49%Maize 000 tones 9,923 7% 15% 78%Pig 000 tones 897 41% 4% 55%
Poultry 000 tones 367 39% 4% 57%
Milk 000 hl 52,830 7% 1% 92%Source: National Commission for Statistics, Producer Balances
However, the state is very present in marketing. One cause is that a large part of the
production is consumed on farm, or transferred as gifts to the urban relatives; or urban land
owners who benefit from in kind payment of dividends. The share of output that is not marketedis about 50%, varying from 40% for pig and wheat to 55-65% for maize, poultry and milk. Therest of the output is marketed.
During 1993 to 1996, all the products except maize are largely marketed through a state-
controlled network, being subject to heavy price, subsidy and trade policy interventions, both in
the output and input side. As one can see from Table 2.6, in 1995:
15 In 1996, these commodities accounted for 47% of the gross agricultural output (29% of the vegetal and 73% of theanimal production, respectively) and 55% of the GVA. They had similar shares in GAO and GVA in the rest of theperiod analyzed in this study.
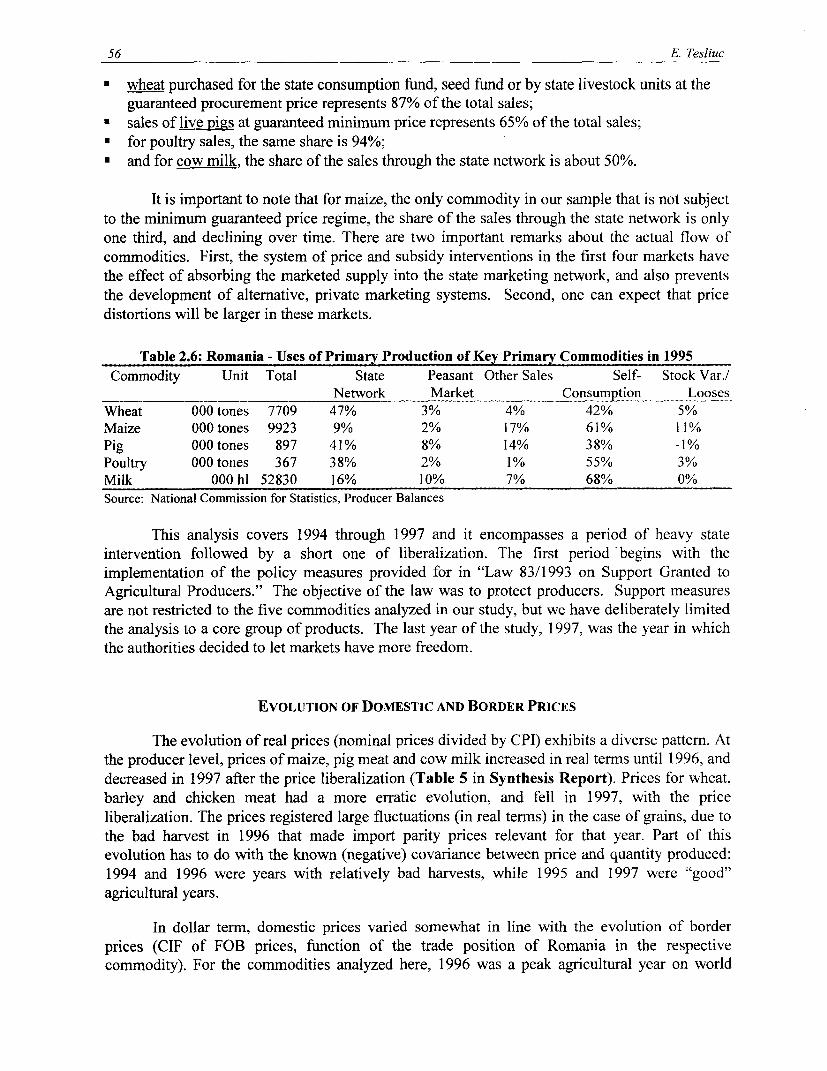
56 E. Tesliuc
* wheat purchased for the state consumption fund, seed fund or by state livestock units at theguaranteed procurement price represents 87% of the total sales;
• sales of live pigs at guaranteed minimum price represents 65% of the total sales;* for poultry sales, the same share is 94%;* and for cow milk, the share of the sales through the state network is about 50%.
It is important to note that for maize, the only commodity in our sample that is not subjectto the minimum guaranteed price regime, the share of the sales through the state network is onlyone third, and declining over time. There are two important remarks about the actual flow ofcommodities. First, the system of price and subsidy interventions in the first four markets havethe effect of absorbing the marketed supply into the state marketing network, and also preventsthe development of alternative, private marketing systems. Second, one can expect that pricedistortions will be larger in these markets.
Table 2.6: Romania - Uses of Prima Production of Ke Prima Commodities in 1995Commodity Unit Total State Peasant Other Sales Self- Stock Var./
Network Market Consumption LoosesWheat 000 tones 7709 47% 3% 4% 42% 5%Maize 000 tones 9923 9% 2% 17% 61% 11%Pig 000 tones 897 41% 8% 14% 38% -1%Poultry 000 tones 367 38% 2% 1% 55% 3%Milk 000 hl 52830 16% 10% 7% 68% 0%Source: National Commission for Statistics, Producer Balances
This analysis covers 1994 through 1997 and it encompasses a period of heavy stateintervention followed by a short one of liberalization. The first period begins with theimplementation of the policy measures provided for in "Law 83/1993 on Support Granted toAgricultural Producers." The objective of the law was to protect producers. Support measuresare not restricted to the five commodities analyzed in our study, but we have deliberately limitedthe analysis to a core group of products. The last year of the study, 1997, was the year in whichthe authorities decided to let markets have more freedom.
EVOLUTION OF DOMESTIC AND BORDER PRICES
The evolution of real prices (nominal prices divided by CPI) exhibits a diverse pattern. Atthe producer level, prices of maize, pig meat and cow milk increased in real terms until 1996, anddecreased in 1997 after the price liberalization (Table 5 in Synthesis Report). Prices for wheat,barley and chicken meat had a more erratic evolution, and fell in 1997, with the priceliberalization. The prices registered large fluctuations (in real terms) in the case of grains, due tothe bad harvest in 1996 that made import parity prices relevant for that year. Part of thisevolution has to do with the known (negative) covariance between price and quantity produced:1994 and 1996 were years with relatively bad harvests, while 1995 and 1997 were "good"agricultural years.
In dollar term, domestic prices varied somewhat in line with the evolution of borderprices (CIF of FOB prices, function of the trade position of Romania in the respectivecommodity). For the commodities analyzed here, 1996 was a peak agricultural year on world

Chapter 2: Romania 57
markets, with grain and livestock prices at their peak in the decade (Table 2.7), also disturbing
domestic prices.
Table 2.7: Romania - Border Prices at Main Import of Export Point (U$/t)Commodity Specification 1994 1995 1996 1997Wheat SRW, FOB Romania 139 167 181 146Maize Yellow, FOB Romania 108 134 137 102Barley FOB Romania 90 106 149 110Pig meat carcass, FOB Romania 1,200 1,287 1,450 1,450Chicken carcass, CIF Romania 1,038 1,491 1,378 1,600Beef carcass, FOB Romania 2,385 2,926 3,512 2,574Cow Milk Powder milk, butter fat content 28%. CIF Romania 1,500 2,150 1,825 1,800Source: National Commission for Statistics, Producer Balances
AGRICULTURAL MEASURES OF SUPPORT
The simplest indicator, the NPC, is the ratio of the domestic price to its opportunity cost.
Domestic prices are prices observed on the domestic market. To characterize prices, one needs to
specify location and date and, for the opportunity cost, the type of competition'6 . The prices used
in NPC numerator were those observed at a location where most of the trade occurs - a
representative location -, at each level of the marketing chain. For the commodities with
administratively fixed prices, the question "what prices should we use?" was very simple. Wheat,
pork and poultry meat, milk and dairy products followed, from 1994 to 1996, a pan-territorial and
pan-seasonal rule. For these commodities and years, location was not a characteristic of the price;
we used the "official", fixed price. For 1997, and for maize and barley throughout the period, we
used modal prices observed in the representative, local market. The source of information was
price reports produced by the association of producers or traders in the respective commodity.
Concerning the time dimension, the main issue was to compare like with like - domestic prices
and opportunity cost at the same moment in time.
The opportunity cost is the price the farmer, the producer, the processor can get or the
consumer would pay if there were no policy distortions. We refer to the opportunity cost as the
"border price", as it is often called in the literature. As Romania's agricultural trade is small
compared to world trade flows and cannot influence the word market price in any of thecommodity under study, the export or import prices that Romanian commodities may get
indicates the opportunity cost"7.
We have used as reference border prices the unit export or import values (CIF / FOB
prices, respectively) at the main entry and exit point, the Constantza port. To reflect the true
opportunity cost, the reference border prices were adjusted to the point of competition at
producer, processing or retail level, by taking into account transport, marketing and processing
16 Timmer P., "Getting Prices Right - The Scope and Limits of Agricultural Price Policy", Cornell University Press,
1986, p. 73-95.
17 Romania fulfills the textbook assumptions for the small-country case, where the position of the domestic trader in
the world economy is of "price-taker."
58 E. Tesliuc
costs. In the absence of any barriers - trade, price, subsidies, fiscal or quasi-fiscal, exchange ratepolicies or non-competitive market structures - markets will make these border prices prevailalso domestically. Put differently, a non-interventionist policy will leave the farmer facing theseprices.
For domestic prices -at each level on the marketing chain - we used an annual averageprice computed as ratio of total sales per quantity sold. For border prices, we used average unitvalues, computed as ratio of value of imports/exports of commodity X per quantity traded duringthat year.
Under direct payments we included programs that transferred funds to farmers based onthe assets they hold. Two schemes were included: a livestock grant program and a voucher
18scheme . Input subsidies were included under the programs that aimed at reducing the costs ofinputs paid by the farmers'9 . The policies aiming at reducing the cost of inputs that werequantified in the study are input price subsidies on fertilizer or certified seeds procurement, plusstorage and interest rate subsidies paid out of the agricultural budget. Finally, we added a part ofthe general services such as research and agricultural extension, proportional with the commodityshare in total agricultural output.
For the livestock products, we corrected the ERA with an adjustment for animal feed.This takes into account the implicit transfers that occur to the livestock sector as a result of thedifference between domestic and world market price for major animal feed items. In our case,corrections were done for maize and barley. When we aggregate all commodities ERAs together,we deduct this inter-sectoral transfer from the overall ERA figure to avoid double counting.
Finally, we warn the reader on the limitations of the approach used, due to the availabilityand quality of the data:
There is a large share of production that it is not marketed for every commodity under thestudy, ranging from 30% to 70% of total output. In computing the total transfers to/fromproducers, we used the price differential apparent on the marketed portion of the output to thewhole output. The lack of hard data on the costs and returns of the peasant farms did not allow usto compute separate protection coefficients.
The foreign trade unit values used in the analysis exhibit significant variability over time,due to the trade position of the country as marginal importer or exporter, in addition to the
i8 The livestock grants were granted for the cattle business as allotment for the acquisition of pure-breeding cows orbirth of calves and the grants for the producers that maintain into exploitation more than three milking cows over theyear for livestock breeding. The voucher scheme was implemented in the fall of 1997 and allowed landowners tobuy agricultural inputs from a list comprising gasoline, fertilizer, pesticides, certified seeds and mechanical services.Each landowner received input vouchers at a rate of one voucher per ha owned, up to maximum 10 ha.
'9 A wide range of measures had the effect of reducing the cost of input facing farmers. On the vegetal production,agricultural producers who contract their crops with the state-agents benefit from policy measures such as free-distribution of a specified quantity of fertilizers, access to subsidized seeds, free application of pesticides, free-of-charge irrigation services and interest-rate subsidy for credit used to finance agricultural production or for theacquisition of equipment. On the animal production, farmers receive free application of medicines, benefit fromfree seminal material for animal reproduction and interest-rate subsidy for their working capital needs.
Chapter 2: Romania 59
variability of some reference world market prices. In most of the agricultural commodities,
Romania is an occasional trader (see wheat, maize and dairy products). In pork, when Romania is
a systematic exporter, the unit values tend to rise over time toward international reference prices
(such as CBT hog prices).
CONCLUSION AND MAIN LESSONS
Agricultural reform in Romania during the 1990s was a series of forward and backwardsteps. The liberalization of the main production factor (land) in 1991 caused a temporary drop in
output. The reaction of the authorities was to increase intervention in the sector. The system
failed to stabilize output (livestock numbers decreased) or the volume of marketed production,
but imposed costs on the agricultural agents (losses, arrears). With subsidies, these costs werepartially covered by the taxpayers.
In 1997, when subsidies were reduced, most of the former beneficiaries of the subsidies
went into bankruptcy. The liberalization was not accompanied by sustained structural measures
(unbundling integrated firms; rapid privatization). The costs of this hesitant attitude must
eventually be paid.
Incentive reforms proved to be simpler to implement that structural reform. Opposition of
interest groups to incentive reform was large. Structural reforms were difficult to implement.There is a need for political support to implement hard measures. Strong administrative capacityto implement is required (to a greater extent than in the case of incentive measures). Optimismthat led to wrong assessment was damaging.
The lack of structural reform wiped off the potential benefits of the liberalization. First,
was no advance in the liberalization of important factor markets, like agricultural land.20 Also,privatization of significant marketing chains (grains storage, certified seed producers) was
unnecessary postponed. Thirdly, privatization in state farms and some large pig farms wasdelayed. Grain production is still blocked by lack of privatization in storage and production.
Infrastructure bottlenecks in export of grain have not been solved, but blocked by indecision. All
these "frozen" subsectors not operating under profit maximization rules were destabilizing the
intended positive outcome of the reform. Inefficient producers that keep their output levels high
and register losses while increasing output, depress prices and returns for the private operators
and restricts entry. These state owned producers should be shut down, but were not.
Summarizing, the sequencing in implementation of reform measures proved to be veryimportant. Advancing on one front (incentives) increased the difficulties in the non- restructured
sectors, making their prospects for privatization worse.
In pig and poultry production, the delay in privatization, coupled with reduction in
protection worsened the situation of the inefficient state farms, making them less attractive for
20 Land not allowed for sale in 1997; poor land lease arrangements, lack of clarity in the ownership status of the state
land.
60 E. Tesliuc
privatization. The largest pig farms have yet to be privatized. Thus pig and poultry production,already declining, will decline further.
The large peasant farmer subsistence based sector is not integrated in the formaleconomy, nor is it part of the larger Romanian social fabric. There is a need for long-termreforms that would include them in the formal, commercial economy, and boost their productionbeyond subsistence levels. This has a cost, but the additional tax revenues should partly pay forthis (the informal economy does not pay taxes, so there is an entry trap).
Reform means contraction of inefficient sectors. But a drop in output coupled with amore efficient use of resources is a positive development. However, this fuels the power ofcounter-reformist lobbies, and may endanger the reform effort. Care should be taken to avoidthis. Reliable hard evidence is crucial for the design of successful reform. Those who would bearthe brunt of reform will obviously make their voice be heard louder than to voice of those whobenefit (see the voucher scheme implementation in Romania).
The serious analysis of the incidence of the policies and their costs has brought into thepublic debate many "sacred" topics. The public has learned about the inefficiency of some stateoperators, and the skewed incidence of subsidies to some state-owned sectors, etc. There is agrowing awareness regarding the costs of past policies and the reasons of their failures. Nowthere is a growing search for solutions consistent with the market paradigm. This may prove to bea very important factor that may stop the reversal of the reforms. This opinion is now fightingwith the old state lobby, threaten to loose its former privileges. This analysis, and similar others,would help, we hope, incline the balance toward reform.
Chapter 2: Romania 61
REFERENCES
Adams D., Vogel R. 1996. "Rural Finance in Romania", World Bank paper, December 1996
Deaconescu, Gordon, Tesliuc E.D. 1996. "Producer Price Interventions and Incentives in
Romanian Agriculture", World Bank paper, November 1996
Esanu C., Lindert K. 1996. "An Analysis of Consumer Food Price and Subsidy Policies in
Romania", World Bank paper, December 1996
Esanu C., Tesliuc E.D. 1997. "Romania: Agricultural Performance and Policy in 1997"
Esanu C., Tesliuc E.D., 1998. "Romania: Labour Adjustment and Agricultural Land Reform and
FarmLand Markets"
Florian, V.; Serbanescu, C. 1997. "Food demand and rural poverty in Romania during transitionto market", Research paper; Agricultural Economics Institute, Bucharest, Romania, February
1997.
Metzel J., Salinger L. 1996. "Agricultural Effective Protection Analysis", World Bank paper,December 1996
Oprescu G. 1996. "Privatization in Agriculture", World Bank paper, July 1996
Tarhoaca C. 1996. "Food Access in Romania, Data Inventory and Analysis", World Bank paper,
January 1997
Tesliuc, ED 1996. "Agricultural Trade Regime in Romania", World Bank paper, July 1996
Tesliuc, ED 1996. "Agricultural Finance in Romania" - An Assessment of the Cost and ImplicitTransfers Associated with the Current System of Directed Credit, World Bank paper,December 1996
Tesliuc E.D. 1997b. "Romania: Recent Agricultural Policy, Trade and Market Developments"
Tesliuc E.D. 1998. "Forecasting the Dynamics of the Pork Market in Romania"
Tesliuc E.D. 1999. "Assessing the impact of governmental policies upon incentives faced byproducers - A quantification using the example of five major agricultural commodities",Ph.D. Dissertation Thesis
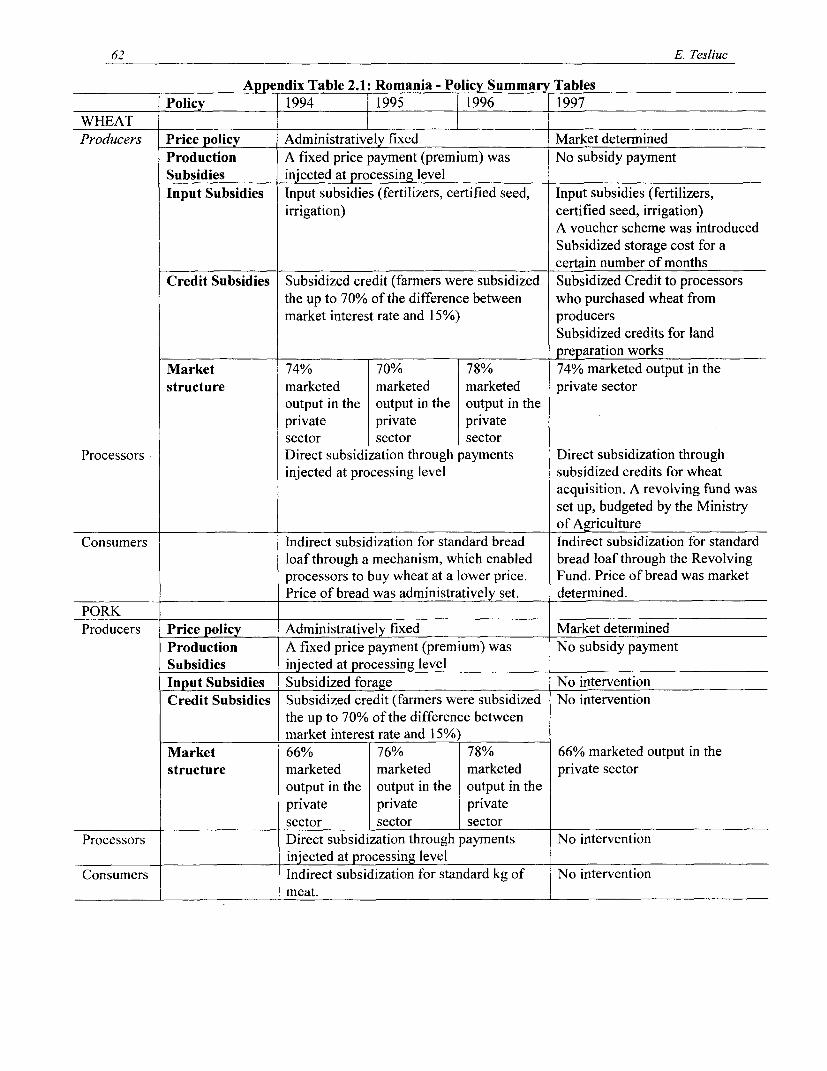
62 E. Tesliuc
A endix Table 2.1: Romania - Policy Summa TablesPolicy 1994 1995 1996 1997
WHEAT llProducers Price policy Administratively fixed Market determined
Production A fixed price payment (premium) was No subsidy paymentSubsidies injected at processing levelInput Subsidies Input subsidies (fertilizers, certified seed, Input subsidies (fertilizers,
irrigation) certified seed, irrigation)A voucher scheme was introducedSubsidized storage cost for acertain number of months
Credit Subsidies Subsidized credit (farmers were subsidized Subsidized Credit to processorsthe up to 70% of the difference between who purchased wheat frommarket interest rate and 15%) producers
Subsidized credits for landpreparation works
Market 74% 70% 78% 74% marketed output in thestructure marketed marketed marketed private sector
output in the output in the output in theprivate private privatesector sector sector
Processors Direct subsidization through payments Direct subsidization throughinjected at processing level subsidized credits for wheat
acquisition. A revolving fund wasset up, budgeted by the Ministryof Agriculture
Consumers Indirect subsidization for standard bread Indirect subsidization for standardloaf through a mechanism, which enabled bread loaf through the Revolvingprocessors to buy wheat at a lower price. Fund. Price of bread was marketPrice of bread was administratively set. determined.
PORK lProducers Price policy Administratively fixed Market determined
Production A fixed price payment (premium) was No subsidy paymentSubsidies injected at processing levelInput Subsidies Subsidized forage No interventionCredit Subsidies Subsidized credit (farmers were subsidized No intervention
the up to 70% of the difference betweenmarket interest rate and 15%)
Market 66% 76% 78% 66% marketed output in thestructure marketed marketed marketed private sector
output in the output in the output in theprivate private privatesector sector sector
Processors Direct subsidization through payments No interventioninjected at processing level
Consumers Indirect subsidization for standard kg of No interventionmeat.

Chapter 2: Romania 63
Appendix Table 2.1: Romania - Policy summary tables (cont.)Policy 1994 1995 1996 11997
MAIZEProducers Price policy Market determined
Production No InterventionSubsidiesInput Input subsidies (fertilizers, certified seed, Input subsidies (fertilizers,Subsidies irrigation) certified seed, irrigation)
A voucher scheme was introducedSubsidized storage cost for acertain number of months
Credit Subsidized credit (farmers were subsidized Subsidized credits for landPolicy Subsidies the up to 70% of the difference between preparation works
market interest rate and 15%) _Market The share produced by the private sector increased to 92% in 1997, due to landstructure restitution process
Processors No interventionConsumers No interventionPOULTRYProducers Price policy Administratively fixed Market determined
Production A fixed price payment (premium) was No subsidy paymentSubsidies injected at processing levelInput Subsidies Subsidized fo age No interventionCredit Subsidized Subsidized credit (farmers No interventionSubsidies credit were subsidized the up to
(farmers 70% of the differencewere between market interestsubsidized rate and 15%)the up to Direct transfers from State70% of the Ownership Funddifferencebetweenmarketinterest rateand 15%)
Market Share produced by the private sector was 75%, mainly for own consumptionstructure
Processors Direct subsidization through payments No interventioninjected at processing level
Consumers Indirect subsidization for standard kg of Market determined Pricemeat.
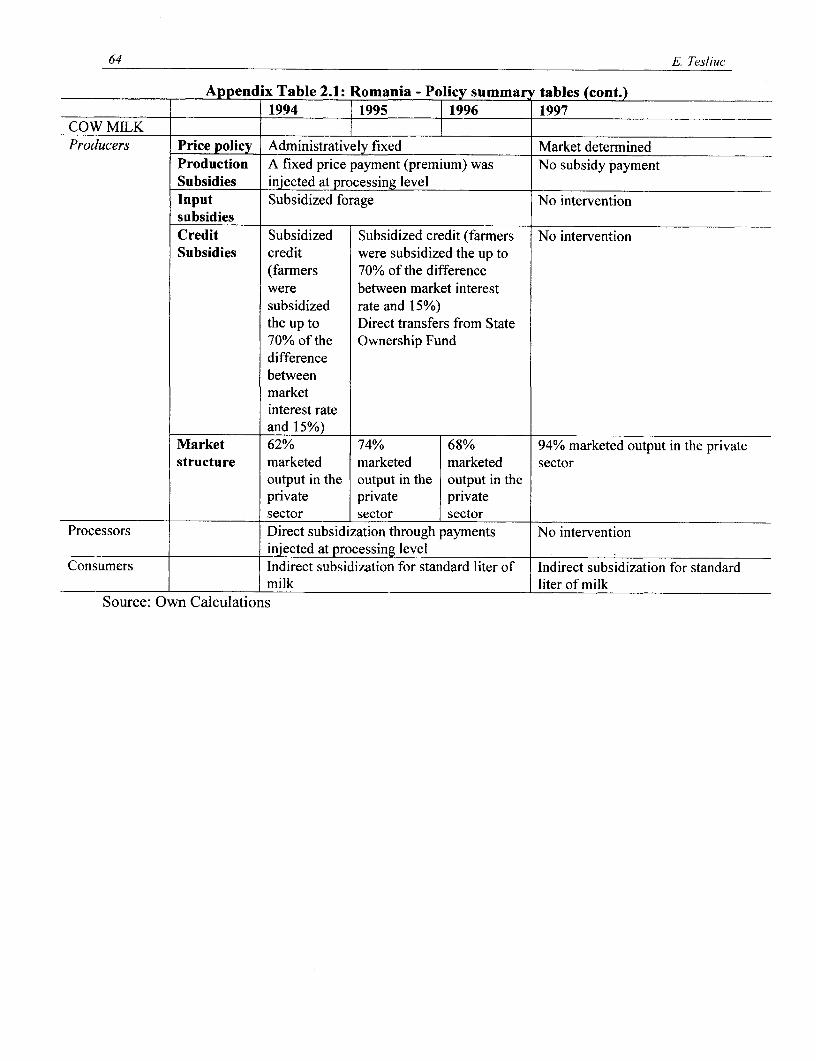
64 E. Tesliuc
Appendix Table 2.1: Romania - Policy summar tables (cont.)1994 1995 11996 1997
COW MILKProducers Price policy Administratively fixed Market determined
Production A fixed price payment (premium) was No subsidy paymentSubsidies injected at processing levelInput Subsidized forage No interventionsubsidiesCredit Subsidized Subsidized credit (farmers No interventionSubsidies credit were subsidized the up to
(farmers 70% of the differencewere between market interestsubsidized rate and 15%)the up to Direct transfers from State70% of the Ownership Funddifferencebetweenmarketinterest rateand 15%)
Market 62% 74% 68% 94% marketed output in the privatestructure marketed marketed marketed sector
output in the output in the output in theprivate private private
. sector sector sectorProcessors Direct subsidization through payments No intervention
injected at processing levelConsumers Indirect subsidization for standard liter of Indirect subsidization for standard
milk liter of milkSource: Own Calculations

CHAPTER 3: POLAND
Mariusz Safin
OVERVIEW ON THE EVOLUTION OF FARM SUPPORT POLICIES1988-199721
Until 1990, in the pre-reform period, agriculture was supported mainly from the statebudget. In 1988 and 1989, as measured by the OECD (1995), both producers and consumerswere subsidized. This system of subsidies operated in a very closed and distorted economy withtrade monopolized by the state22, a strongly overvalued exchange rate, and prices set by the state.These distortions make analysis of market transfers difficult, mainly because the question of the'right' exchange rate to use to compare domestic and world prices was not answeredsatisfactorily until now. Since 1990, price and trade liberalization and the withdrawal of statesubsidies have led to a considerable cut in support to agriculture. For the two years following thestart of these reforms, food consumers were subsidized by agricultural producers. During thisperiod of negative protection (1990-1991), strong pressure by farmers on policy makers pushedthe latter to reintroduce positive support for agriculture. The government decided to supportfarmers mainly through agricultural markets, which implied taxation on consumers (OECD1996).
As a consequence of the exchange rate phenomenon, Polish exports became increasinglyexpensive on international markets, while imports became cheaper for domestic consumers.With farmers' price international competitiveness declining, the demand for protection increased.The more liberal trade regime of 1990 and 1991 was gradually replaced by a more trade-restrictive policy in the form of higher import tariffs and import bans appearing for food safetyreasons (like BSE). On the export side, export subsidies were occasionally used; during theperiod 1995-1997 export subsidies were granted through the Agency for Agricultural Markets(ARR23) for pig carcasses and milk powder.
21 Relevant material can be found in the World Bank report (1990) and Kwiecinski (1996). These reports cover theperiod up to 1995. This note covers from 1995 to 1997.
22 Before 1990, in Poland, there were no trade barriers. However, the supply of foreign currencies was rationed and foreigntrade transactions had to be approved by the Trade Committee of State, constituting an implicit trade barrier.
23 ARR is the Polish acronym for the Agency for Agricultural Markets (Agencja Rynku Rolnego)

66 M. Safin
Trade measures were complemented by ARR intervention purchases (at a floor price) on.wheat, rye and milk. They were also applied irregularly for pork, sugar, starch potato, honey,linen and wool markets. Support for sugar is provided in an EU-shaped form of A-B-Cproduction quotas. The existence of the floor price scheme on farm products did have an upwardeffect on farmgate prices, but the fiscal cost of this scheme, in the case of sugar and pork, doesnot necessarily represent an equivalent income transfer to farmers considering the high marginsin the agro-processing industry.
The government also intervenes in the input markets. In the case of tradable inputs(agrochemicals, machinery, equipment, etc.), border protection on imports raises the domesticprice paid by farmers. To some extent this effect is compensated by input subsidies whichfarmers obtain mainly in the form of subsidized credit and a lime subsidy. Additionally, softcredits are offered for investment and for input purchases. The interest rate for these credits isabout 1/6 of the NBP24 rate, which is lower than commercial lending rates. Apart from interestrate subsidies, there are also considerable transfers to the rural financial sector which cover banklosses from non-repaid agricultural credits.
For the purpose of this paper, policies were divided into four categories: 1) commodity-specific support where the intervention can be quantified for each commodity in question; 2)non-commodity-specific policies, where it is difficult (or even impossible for methodological anddata reasons) to disentangle intervention effects on commodities (for example fuel subsidy); 3)production-coupled policies, which affect farmers' decisions to produce; and 4) production de-coupled policies (for example differential income tax treatment) which do not, in principle, affectproduction decisions but support farmers' income. Sections two and three are analyses ofproduction-coupled and de-coupled policies, and section four consists of conclusions and adiscussion of policy challenges for the future.
THE EXTENT AND IMPACT OF PRODUCTION-COUPLED POLICYINTERVENTIONS
COMMODITY-SPECIFIC POLICIES
This section presents the main findings on the effect of the various price interventions onfarm income for the sum of all products covered in this study during 1995-97. Farm income wasdefined as a gross value of output minus gross value of purchased inputs. Thus, it representsvalue added at the farm level, and does not exactly correspond to agricultural value added asdefined in the National Accounts. The price gap analysis is applied to the actual level ofproduction and consumption during these years, and therefore it does not capture either theproduction or the consumption response (elasticity effect) to price interventions.
24 NBP is the acronym for the National Bank of Poland
Chapter 3: Poland 67
Output Market Intervention
The decrease in protection of the output market in 1996 and 1997 as compared to 1995,was to some extent a result of trade liberalization, especially within the CEFTA. Commoditiesimported from the CEFTA countries have the lowest import duties. For example, the base importtariff for milk is 80%, but CEFTA countries pay less than half (37%) of the base tariff.
Nonetheless, a commodity by commodity analysis reveals that the extent of interventionis considerable. Depending on the year, the total support ranged from 3.1 to 3.9 billion PLZ,equivalent to about US $1 billion per year. This considerable support of farmer's income givesfarmers incentives for lobbying activities.
The variations of market interventions appear to be due to changes in world prices anddomestic demand and supply conditions, but also to instability in policies. Whatever the mainreason, visible instability in output market interventions forces farmers to diversify production,meaning there is little incentive to specialize. The latter is often perceived as a way to increaseincomes, so policy instability inversely affects farmers' potential income.
Input Market Intervention
Government intervention in input markets imposes implicit taxation on farmers. This taxcan be viewed as an implicit subsidy to the input sector, which to some extent is compensated tofarmers via input subsidies like soft credit (see sections below).
Support Through the Agency for Agricultural Markets
Agency for Agricultural Markets was created to stabilize agricultural prices and preventthem from falling below minimum price25 levels using market operations. From farmers' incomeperspective, the ARR should contribute to stabilizing farmers' income and preventing them fromfalling below a certain level. To achieve these objectives, two main functions of the ARRoperation have emerged: (i) contributing to market price support by making purchases at priceswhich are higher than the relevant border price equivalents, and (ii) subsidizing storage costs bymaking intervention purchases during harvest at prices which do not account for expected storagecosts.
The ARR is also responsible for maintenance of strategic food reserves in Poland, whichmakes it difficult to disentangle pure intervention effects from effects of procurement of strategicreserves. Market intervention costs of the ARR folds into the cost of price support and storagecosts. Administrative costs of the ARR make intervention relatively expensive. Appendix Table1, based on scarcely available statistics, shows that on average two thirds of the ARR budget isspent on market intervention and the rest on administrative costs, losses, insurance and VAT.Analysis of market intervention costs presented in this table does not include the financial cost ofthe ARR operation; rough estimates suggest that inclusion of this item would double the wholemarket intervention costs. This suggests that transfer of one zloty to farmers through the ARR
25 Minimum prices are negotiated every year between farmers trade union, government and the ARR for wheat, rye, sugar andmilk.
68 M Safin
market intervention costs the taxpayers about 4 zloty. In this context, the efficiency of pricesupport provided via ARR can be seriously questioned.
Trade Effects
Commodity-specific policy measures during 1995-1997 supported importables but taxedexportables. As a result, farmers' production decisions were probably biased towards importableproducts. It was anticipated that this import-substitution policy would diminish or even eliminatethe food trade deficit. However, there is a danger that in the long run, such a policy willnegatively affect competitiveness of Polish agriculture as farmers move resources from relativelycompetitive commodities which are exported, to less competitive products which are imported.Therefore, agricultural exports can be expected to fall further in the future, leading to increasedimport barriers, i.e. trade is adversely affected.
International trade and specialization in production can raise consumption considerably intrading nations without utilizing additional resources. The existence of an anti-trade policy biasultimately leads to negative effects on societal welfare.
Effects of price Support Policies on Consumer's Real Income
Agricultural policy in Poland, with considerable market transfers, understandably affectsconsumers' income. This aspect of agricultural policy is of high importance considering theaverage share of expenditure on food products in Poland in 1997 was 36%, and is fairlyrepresentative for the whole post-reform period. Poor households are usually more affected thanrich households by a system which maintains higher food prices than would be the case in theabsence of intervention. While economic development in most cases guarantees an increase inhousehold incomes, disparities between households tend to grow. Poor groups in society musttherefore spend a higher proportion of their income on food.
The effects of agricultural price support on consumer's welfare income were measured bySafin and Guba (1998). Their results suggest that during 1993-1996 price policies lowered realincome of consumers on average by 4.3%. More detailed analysis with disaggregation intoworkers, non-workers and pensioner households revealed that poor households lose more than8% of real income because of agricultural price support. A large proportion of the 'additional'income (compared to the average) spent on food in poor and large households are explained bythe policy effects. This substantial cut is difficult to justify when taking into account that about13% of the population in Poland lives below the poverty line (World Bank, 1995).
NON-COMMODITY-SPECIFIC POLICIES
Transfers through rural finance, lime and fuel subsidies are the main non-commodityspecific measures of support. These transfers have risen over the years. In zloty terms, transfersare estimated at about 0.7 billion PLZ in 1995, 1.2 billion PLZ in 1996 and 1.5 billion PLZ in1997. The largest are transfers through rural finance. They consist mainly of interest ratesubsidies and coverage of unpaid debts. A relatively small subsidy (7 million PLZ) was grantedfor the purchase of fuel in 1996. The lime subsidy aims to help farmers prevent soil from
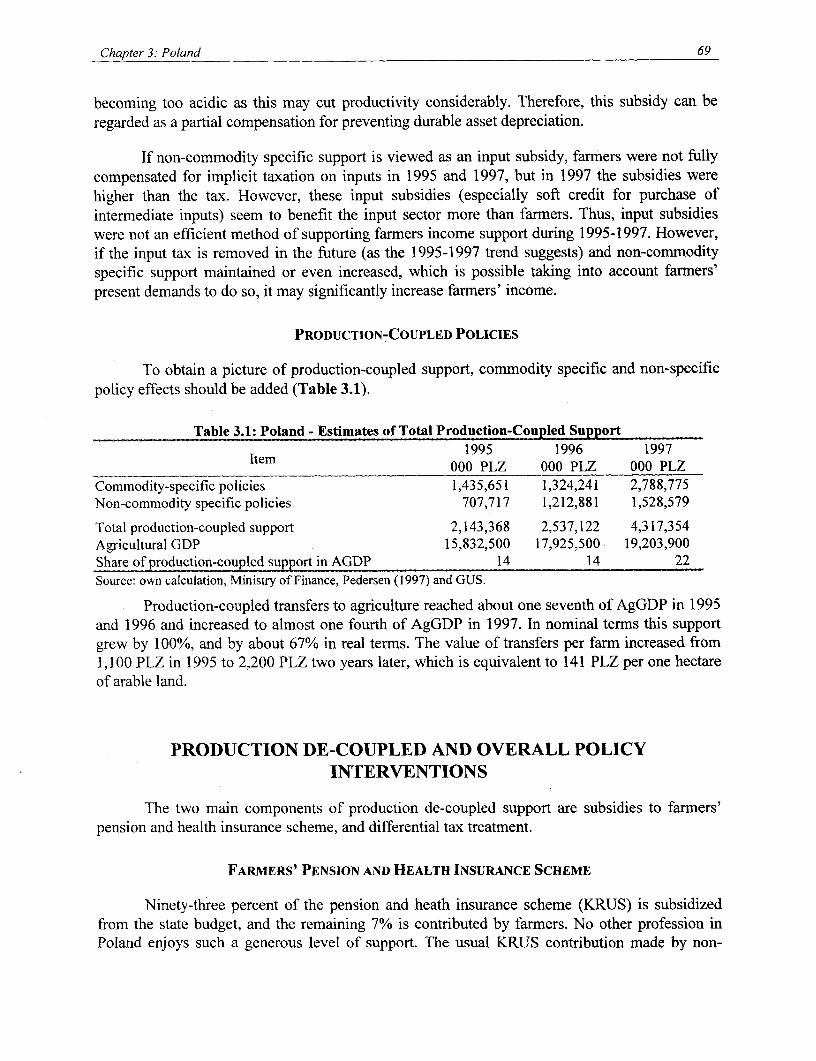
Chapter 3: Poland 69
becoming too acidic as this may cut productivity considerably. Therefore, this subsidy can beregarded as a partial compensation for preventing durable asset depreciation.
If non-commodity specific support is viewed as an input subsidy, farmners were not fullycompensated for implicit taxation on inputs in 1995 and 1997, but in 1997 the subsidies werehigher than the tax. However, these input subsidies (especially soft credit for purchase ofintermediate inputs) seem to benefit the input sector more than farmers. Thus, input subsidieswere not an efficient method of supporting farmers income support during 1995-1997. However,if the input tax is removed in the future (as the 1995-1997 trend suggests) and non-commodityspecific support maintained or even increased, which is possible taking into account farners'present demands to do so, it may significantly increase farmers' income.
PRODUCTION-COUPLED POLICIES
To obtain a picture of production-coupled support, commodity specific and non-specificpolicy effects should be added (Table 3.1).
Table 3.1: Poland - Estimates of Total Production-Coupled SupportItem 1995 1996 1997Item_ ____ 000 PLZ 000 PLZ 000 PLZ
Commodity-specific policies 1,435,651 1,324,241 2,788,775Non-commodity specific policies 707,717 1,212,881 1,528,579
Total production-coupled support 2,143,368 2,537,122 4,317,354Agricultural GDP 15,832,500 17,925,500- 19,203,900Share of production-coupled support in AGDP 14 14 22Source: own calculation, Ministry of Finance, Pedersen (1997) and GUS.
Production-coupled transfers to agriculture reached about one seventh of AgGDP in 1995and 1996 and increased to almost one fourth of AgGDP in 1997. In nominal terms this supportgrew by 100%, and by about 67% in real terms. The value of transfers per farm increased from1,100 PLZ in 1995 to 2,200 PLZ two years later, which is equivalent to 141 PLZ per one hectareof arable land.
PRODUCTION DE-COUPLED AND OVERALL POLICYINTERVENTIONS
The two main components of production de-coupled support are subsidies to farmers'pension and health insurance scheme, and differential tax treatment.
FARMERS' PENSION AND HEALTH INSURANCE SCHEME
Ninety-three percent of the pension and heath insurance scheme (KRUS) is subsidizedfrom the state budget, and the remaining 7% is contributed by farmers. No other profession inPoland enjoys such a generous level of support. The usual KRUS contribution made by non-

70 M Safin
agricultural workers is 48% of their salary, regardless of income level. In the analyzed periodthere were no alternate schemes or funds available to individuals, and all payments are paid intothe state budget. Some of the budget resources remain unspent, and contributions paid by theemployee are essentially much higher than the benefits obtained-an implicit tax on income.Because pension and health insurance benefits are the same for farmers and non-farmers, there isan implicit money transfer from an average non-farm employee to farmers.
Understandably, this arrangement attracts new entrants to agriculture. The onlyrequirement for becoming a farmer is to hold more than one hectare of land. The average cost in1996 for one hectare of average-quality land was 3,200 PLZ (equivalent to about U$1,200). Theintroduction of more stringent requirements for qualifying as a farmer could reduce the overallcosts of this type of production de-coupled support.
DIFFERENTIAL TREATMENT OF INCOME TAX
Polish farmers do not pay income or company taxes. Although the minimum income taxrate was 21% in 1995 and 1996, and 20% in 1997, many tax concessions translated into aneffective average rate of income tax for farmers of about 17%. This suggests that 17% of theagricultural value-added (assuming AVA to be a proxy of farmer income) should have been paidby farmers. Instead, tax concessions to farners during 1995-1997 cost about 2.5 billion PLZ, 2.8billion PLZ, and 3.7 billion PLZ, respectively (Appendix Table 3.2.). Farmers pay a 'land tax'that is intended to substitute for income tax. It is a tax paid on the basis of land owned, and is setat a zloty rate equivalent to the procurement price of 0.25 tons of rye in the last three months ofthe previous year. This tax is considerably lower than the unpaid income tax. The differenceamounted to roughly 1.6 billion PLZ in 1995, 1.7 billion PLZ in 1996, and 1.8 billion PLZ in1997.
TOTAL PRODUCTION DE-COUPLED SUPPORT
Total production de-coupled support (the sum of the pension and health insurance subsidyand the net money transfer from differential income tax treatment) is estimated at 8 billion PLZin 1995, 9.6 billion PLZ in 1996, and 10.8 billion PLZ in 1997 (Table 3.2). The pension andhealth insurance subsidy accounts for about 80 percent of this total.
Table 3.2: Poland - Estimates of Total Production De-Coupled SupportYear '000 PLZ
Income tax differential 1995 1,639,023Treatment 1996 1,723,509
1997 1,805,560Pension and health 1995 6,355,606Insurance policy 1996 7,868,611
1997 9,010,697Total production 1995 7,994,629De-coupled support 1996 9,592,120
1997 10,816,257Source: own calculation and Ministry of Finance (pension and health)
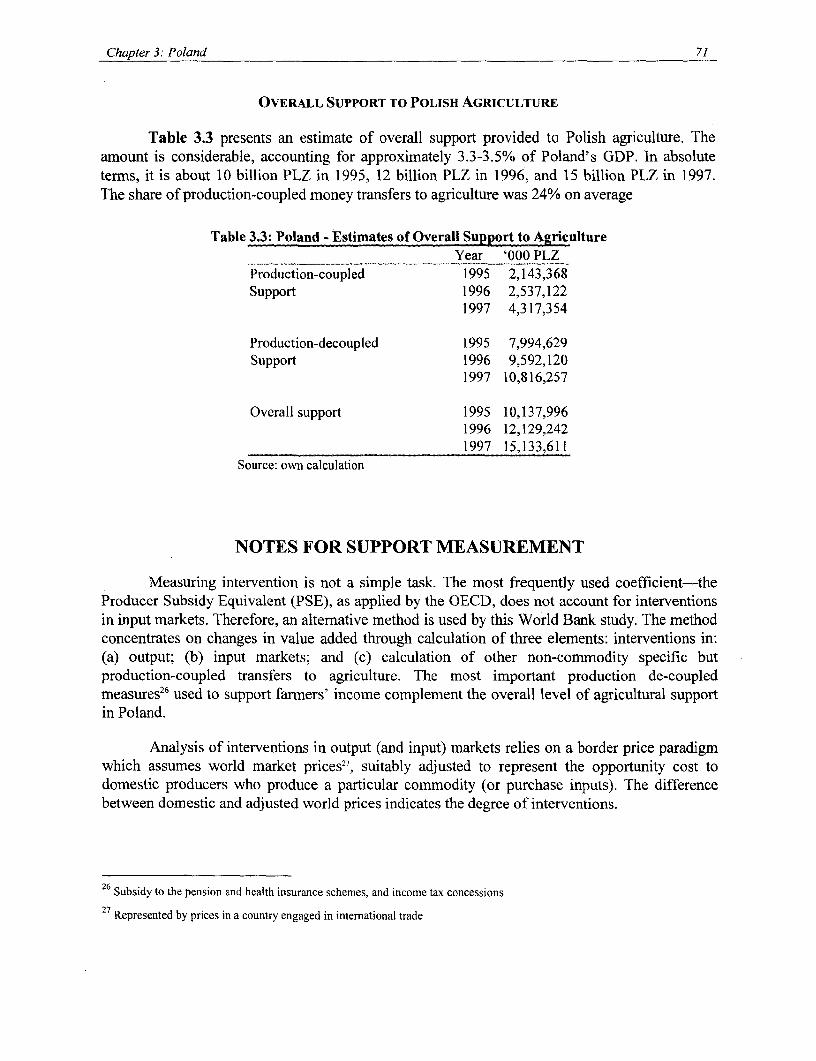
Chapter 3: Poland 71
OVERALL SUPPORT TO POLISH AGRICULTURE
Table 3.3 presents an estimate of overall support provided to Polish agriculture. Theamount is considerable, accounting for approximately 3.3-3.5% of Poland's GDP. In absoluteterms, it is about 10 billion PLZ in 1995, 12 billion PLZ in 1996, and 15 billion PLZ in 1997.The share of production-coupled money transfers to agriculture was 24% on average
Table 3.3: Poland - Estimates of Overall Support to AgricultureYear '000 PLZ
Production-coupled 1995 2,143,368Support 1996 2,537,122
1997 4,317,354
Production-decoupled 1995 7,994,629Support 1996 9,592,120
1997 10,816,257
Overall support 1995 10,137,9961996 12,129,2421997 15,133,611
Source: own calculation
NOTES FOR SUPPORT MEASUREMENT
Measuring intervention is not a simple task. The most frequently used coefficient-theProducer Subsidy Equivalent (PSE), as applied by the OECD, does not account for interventionsin input markets. Therefore, an alternative method is used by this World Bank study. The methodconcentrates on changes in value added through calculation of three elements: interventions in:(a) output; (b) input markets; and (c) calculation of other non-commodity specific butproduction-coupled transfers to agriculture. The most important production de-coupledmeasures26 used to support farmers' income complement the overall level of agricultural supportin Poland.
Analysis of interventions in output (and input) markets relies on a border price paradigmwhich assumes world market prices2", suitably adjusted to represent the opportunity cost todomestic producers who produce a particular commodity (or purchase inputs). The differencebetween domestic and adjusted world prices indicates the degree of interventions.
26 Subsidy to the pension and health insurance schemes, and income tax concessions
27 Represented by prices in a country engaged in international trade

72 M Safin
Intervention effects of commodity-specific policies were measured in a three stepprocedure. First, the quantity domestically produced (in the case of an output) or purchased (inthe case of an input), was multiplied by the domestic price and given a domestic price value.Second, the same procedure replaced domestic prices with adjusted world prices from Safin andGuba (1998) for the period 1995-1996 and statistics from the Institute for Prices and Situation inForeign Trade for 1997. World prices in the referenced paper were derived from border prices forthe three main trade areas: European Union, CEFTA countries, and Former Soviet Unioncountries. World prices and domestic prices were compared by adjusting the relevant price(depending on whether the commodity or input was exportable or importable) for transactioncosts, transport, eventual processing costs (sugar beet) and also for quality differences. Aweighted average of the adjusted world prices from the three trade areas provided a referenceprice which was used in calculations presented in this paper. Subtraction of the output or inputvalue at reference prices from the output or input value at domestic prices gave an estimate ofmarket support (if the difference was positive) or tax (if the difference was negative). Third, allother commodity-specific support or tax was added to the estimates of money transfers via inputand output markets.
Simple addition of the total value of commodity specific transfers to non-commodityspecific transfers gives the value of production-coupled support. This in turn, when added toproduction de-coupled support (farmers pension scheme, differential tax treatment), provides anestimate of overall agricultural support.
LOOKING AHEAD
Polish agriculture has been facing the daunting challenge of restructuring underincreasing macroeconomic pressure from the exchange rate, reduction of public expenditures andrelatively high interest rates. However, it is likely that in the short to medium term, some relieffrom macroeconomic pressure will come from the economic crisis which began in 1998. Thedifficult economic situation in the countries of the Former Soviet Union, which are traditionalPolish export markets, had an adverse effect on Polish trade, resulting in economic decelerationand inflation 8.6% in 1998-one percent lower than predicted by the government. These twofactors encouraged the Monetary Council, responsible for monetary policy, to cut interest rateseight times in 1998. These cuts considerably lowered real interest rates and are expected to notonly stimulate consumption and contribute to lower production costs, but also weaken the realvalue of the Polish zloty, thereby relieving competitive pressure.
Obligations under the WTO and regional trade agreements severely limit agriculturalpolicy options, including protecting domestic producers from international competition2 8. Thebest policy is to work towards the creation of a sound and competitive agricultural sector. Thismeans putting aside the objective of achieving self-sufficiency in every commodity, instead
28 Obviously, protection can be increased, but international repercussions would be serious.

Chapter 3: Poland 73
concentrating on export-led production. Gradual trade liberalization should aim to remove anti-trade and import-substituting effects, while market interventions should be limited to those that
focus on improvement of market efficiency. These should include the creation of marketinformation systems, the introduction of clear and consistent legislation, and the simplification of
administrative procedures. These must be accompanied by a reform of institutions, such as the
ARR, operating in the agricultural sector. Market interventions should be separated from
measures intended to assure some level of strategic food reserves.
Working towards the opening of foreign markets for Polish exports should be one of thetop priorities on the agenda of government diplomatic actions. The government should also
protect farmers from unfair competition like dumping. In practice, it is difficult to identify fair
and unfair competition. Nevertheless, there are international antidumping procedures, howeverimperfect, that provide the government with a means to protect Polish farmers from harmful
competition.
The whole system of income taxation, pension and heath insurance scheme, andunemployment benefits eligibility for farmers should be harmonized with the rest of the labor
force. The current system provides an incentive to stay in farming because of income taxconcessions and the pension subsidy. Consequently, labor outflows from agriculture arecurtailed, and new entrants are attracted to this already over-employed sector. On the other hand,unemployment benefits eligibility discriminate against farmers29.
It is likely that such a transformation of Polish agriculture will push many farmers out offarming. Policies that attempt to prevent the outflow would be ill advised, as they would impedethe process of restructuring the sector. Hidden unemployment in Polish agriculture is estimated at25% of the labor force (Agricultural Census in 1997), which is equivalent to about one millionworkers. If the average farm size is to become comparable to an average EU farm, outflow fromagriculture should be at least twice this number. Additionally, in the context of growingimportance of capital-intensive farming in developed countries, considerable labor outflow fromagriculture is desirable. Although Poland is a particularly radical case because of a large numberof small farms, this phenomenon is not peculiar to Poland and is well documented in literature(e.g., Johnson, 1991). Implementation of the policies recommended in this paper should be
accompanied by production de-coupled measures that provide a safety net to farmers forced toleave agriculture. These policies, however, should be targeted and granted for only a limitedperiod of time.
Displaced farmers must have acceptable job alternatives, and there must be good optionsfor non-agricultural use of farms. Training can be provided to farmers who decide to give upagricultural production as their main source of income. Training should take into account specificfeatures of the Polish farming population, with an emphasis on non-agricultural activities likeagro-tourism and leisure. There are potentially many job opportunities in rural areas for farmerswho decide to completely change professions. The most obvious need is to create a modern
physical and social infrastructure in order to attract investment to rural areas. The government's
29 Farmers with more than 2 hectares of land are not eligible for unemployment benefits in Poland, even if they do not produce.
74 M. Safin
role in this cannot be overstated, i.e. to provide high quality administration and simpleprocedures for potential investors in rural areas. It also seems reasonable to institute taxconcessions (one year for example) for investors in rural areas, which could compensate higherentry costs in these areas.
From this analysis, it should be clear that the government cannot increase Polishagricultural competitiveness through production-coupled support. However, it can stimulate andpromote rural development where agriculture is one of many viable investment and careeropportunities. The government should withdraw from agricultural markets, concentrate its effortson rural development, and allow the free play of market forces in the trade of agriculturalproducts.
REFERENCES
IER, ARR, MR. 1996. Handel zagraniczny produktami rolno-spozywczymi. Stan i perspektywy.Raporty rynkowe Nr 4. IERGZ: ARR: MRGZ. Pazdziemik 1996.
IER, ARR, MR. 1996. Rynek miesa. Stan i perspektywy. Raporty rynkowe Nr 1 1
IER, ARR, MR. 1996. Rynek mleka. Stan i perspektywy. Raporty rynkowe Nr 11
Johnson D. Gale. 1991 World Agriculture in Disarray, Saint Martins Press, New York and GreatBritain
Kwiecinski A. 1996. Chapter on Poland in 'Long term agricultural policies for central Europe'edited by Gale Johnson. International Center for Economic Growth, San Francisco.
OECD. 1996. Agricultural Policies, Markets and Trade in Transition Economies. Monitoring andEvaluation.
Pederson G. 1997. Rural finance policy in Poland. Consultant report for the World Bank.Washington, DC.
Polish-European Community-World Bank Task Force. 1990 An agricultural strategy for Poland,The International Bank for Reconstruction and Development/ The World Bank, Washington.
Safin M., Guba W. 1998. Agricultural price policy impacts in Poland. Regional and incomedistribution perspective. ECSRE Rural Development and Environment Sector, WorkingPaper No 7, The World Bank.
The World Bank. 1995. Understanding poverty in Poland. A World Bank Country Study.Washington, DC

Chapter 3: Poland 75
A_endix Table 3.1: Pland - Cost of Price Suport b A enl for Agricultural MarketsCommodity Year Purchase price Sale price Quantity sold Cost of price support Storage costs of Total costs of
(PLZ/t) (PLZ/t) (t) (000 PLZ) the Agency for marketAgricultural interventionMarkets (000 (000 PLZ)
PLZ)Wheat 1995 1 912 1 912
1996 719 643 158 869 12 172 20 188 32 3601997 529 0 0 0 41 864 41 864
Rye 1995 1 714 1 7141996 407 0 0 0 6 61997 370 0 0 0 3 085 3 085
Sugar beet 1995 8 81996 0 01997 0 0
Potatoes 1995 01996 270 2701997 43i
Pork 1995 26 839 26 8391996 4 005 4 0051997 0 0
SMP 1995 2 21996 4 900 4 571 5 252 1 727 1 645 3 3721997 5 400 4 630 19 398 468 468
Butter 19951996 5 037 7 07S1997 0 0
Total for the 1995 0 30 475 30 475aboveCommodities 1996 13 899 26114 40 013
1997 0 45 417 45 848Total reported 1995 49 277Costs 1996 44 712
1997 92 211Notes: 1. Storage cost of the Agency covers rental of warehouse, insurance, and physical losses but not financial losses. A
rough estimate of the latter (based on opportunity cost of capital) gives the amount of money comparable to the cost ofprice support.
2. Share of the reported ARR intervention costs in total costs of the ARR is not large - only about 20%, and theremaining 80% is cost of maintaining strategic reserves.
Source: Ministry of Agriculture

76 M. Safin
Appendix Table 3.2: Poland - Cost of Production De-Coupled Support1995 1996 1997
(000 PLZ) (000 PLZ) (000 PLZ)INCOME TAX SUBSIDY1. VA - approximation of agriculture income 14,900,200 16,687,500 21,497,0002. Unpaid income tax (Polish effective rate: 17%) 2,533,034 2,836,875 3,654,490
LAND TAX (introduced to substitute for income tax)1. Arable land (ha) 18,622,000 18,474,000 18,457,0002. Rye price PLZ/t (last three month of previous year) 192 241 4013. Tax in PLZ per ha (equivalent to price for 0.25 t of 48 60 100rye)4. Land tax paid 000 PLZ 894,011 1,113,366 1,848,930
BALANCE (subsidy if(+) or tax if(-)) 1,639,023 1,723,509 1,805,560Source: own estimation

CHAPTER 4: BULGARIA
Henry Gordon, Nedka Ivanova, and Nikolay Nikolov
EARLY TRANSITION YEARS
Bulgaria is generally recognized to have very good agricultural potential. The countryhas a mild climate and rainfall is generally adequate except for some summer crops, whichbenefit from irrigation. Fertile soils exist in the Danube plain, in the north, and the Maritsavalley, in the center of the country. In the years before the Second World War Bulgaria had adiversified export-oriented agricultural sector that produced a wide range of cereals, livestockand horticultural products. The sector's one million farms were privately owned with an averagesize of about four hectares. During the communist period, farms were consolidated into stateproduction cooperatives and subsequently into huge integrated agro-industrial complexes. Onlyabout 10 percent of the land area remained in the control of private households, mainly forprivate gardens. Private ownership of livestock was only a little more widespread, ranging from18 percent of cattle in private hands to 38 percent for poultry. External trade was dominated by amonopoly-trading agency and tightly integrated into the CMEA.
During the early 1990s only limited economic reform occurred, while general economicdecline lowered domestic demand for food and agriculture products. The breakup of the CMEAreduced agricultural exports, which had been a significant source of sector income. After 1991,and despite early liberalization, non-tariff trade measures were frequently employed tocompensate for perceived imbalances in commodity supply and demand. In the early transitionperiod, profitability of field crop production was squeezed by partial price liberalization in theindustrial sector, which increased prices for some inputs such as fertilizer, while crop pricesremained low due to the combined effect of trade and price policies.
The most important policy initiative in the years immediately following communism'scollapse was not in the area of trade or incentives policies, but rather the reform of stateenterprises. A demonopolization program broke up the production complexes into 849 state-owned "commercial companies", for which privatization nonetheless proceeded very slowly.Holdovers from the old system also persisted in the form of holding companies under theMinistry of Agriculture, including the state grain marketing agency Zarneni Hrani, whichoperated grain storage and milling facilities, Sortovi Semena, a national seed organization, thenational irrigation company, and others.
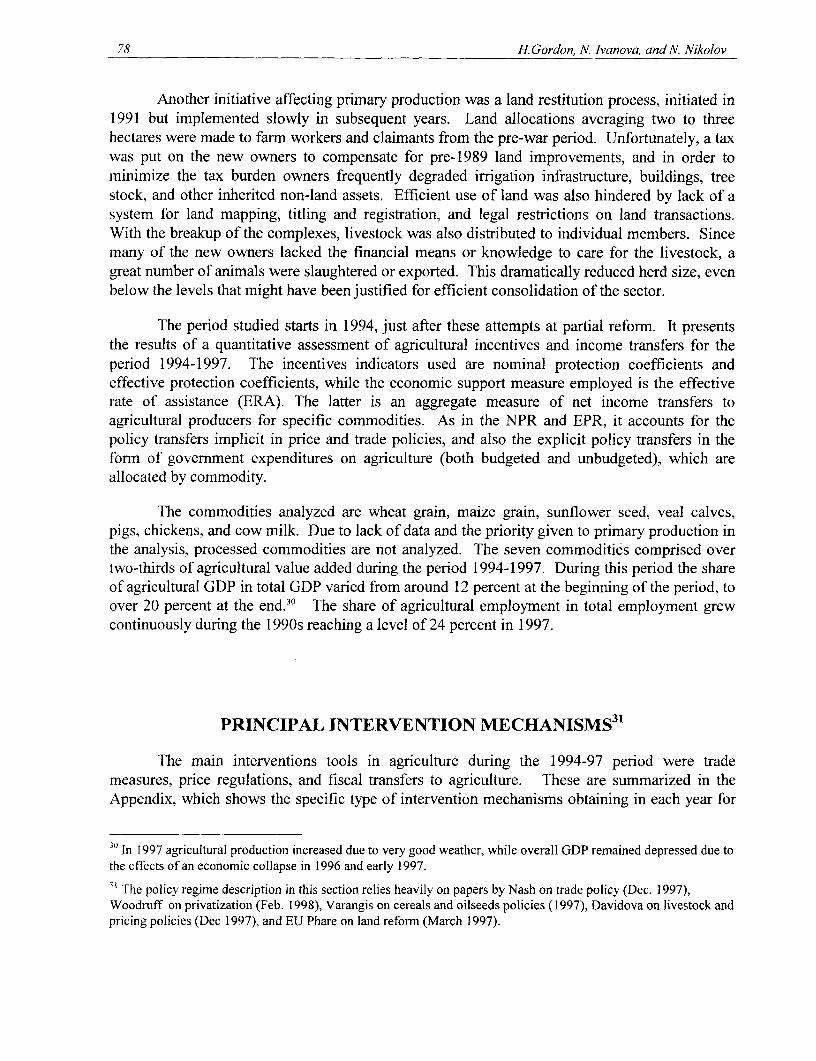
78 H. Gordon, N. Ivanova, and N. Nikolov
Another initiative affecting primary production was a land restitution process, initiated in1991 but implemented slowly in subsequent years. Land allocations averaging two to threehectares were made to farm workers and claimants from the pre-war period. Unfortunately, a taxwas put on the new owners to compensate for pre-1989 land improvements, and in order tominimize the tax burden owners frequently degraded irrigation infrastructure, buildings, treestock, and other inherited non-land assets. Efficient use of land was also hindered by lack of asystem for land mapping, titling and registration, and legal restrictions on land transactions.With the breakup of the complexes, livestock was also distributed to individual members. Sincemany of the new owners lacked the financial means or knowledge to care for the livestock, agreat number of animals were slaughtered or exported. This dramatically reduced herd size, evenbelow the levels that might have been justified for efficient consolidation of the sector.
The period studied starts in 1994, just after these attempts at partial reform. It presentsthe results of a quantitative assessment of agricultural incentives and income transfers for theperiod 1994-1997. The incentives indicators used are nominal protection coefficients andeffective protection coefficients, while the economic support measure employed is the effectiverate of assistance (ERA). The latter is an aggregate measure of net income transfers toagricultural producers for specific commodities. As in the NPR and EPR, it accounts for thepolicy transfers implicit in price and trade policies, and also the explicit policy transfers in theform of government expenditures on agriculture (both budgeted and unbudgeted), which areallocated by commodity.
The commodities analyzed are wheat grain, maize grain, sunflower seed, veal calves,pigs, chickens, and cow milk. Due to lack of data and the priority given to primary production inthe analysis, processed commodities are not analyzed. The seven commodities comprised overtwo-thirds of agricultural value added during the period 1994-1997. During this period the shareof agricultural GDP in total GDP varied from around 12 percent at the beginning of the period, toover 20 percent at the end.30 The share of agricultural employment in total employment grewcontinuously during the 1 990s reaching a level of 24 percent in 1997.
PRINCIPAL INTERVENTION MECHANISMS 3 1
The main interventions tools in agriculture during the 1994-97 period were trademeasures, price regulations, and fiscal transfers to agriculture. These are summarized in theAppendix, which shows the specific type of intervention mechanisms obtaining in each year for
30 In 1997 agricultural production increased due to very good weather, while overall GDP remained depressed due tothe effects of an economic collapse in 1996 and early 1997.
3 The policy regime description in this section relies heavily on papers by Nash on trade policy (Dec. 1997),Woodruff on privatization (Feb. 1998), Varangis on cereals and oilseeds policies (1997), Davidova on livestock andpricing policies (Dec 1997), and EU Phare on land reform (March 1997).
Chapter 4: Bulgaria 79
each commodity. It should be emphasized that the table covers policies affecting outputs.Inputs are only covered to the extent that grains are considered as the primary input to livestockproduction. Further work is needed to specify input use for field crops and to the policies thataffected these inputs. This will assist explanation of policy factors affecting EPRs and ERAs forwheat, maize and sunflower.
Trade. Trade policy exhibited a very heavy reliance on discretionary trade policies,including automatic and non-automatic licenses for imports and exports, export quotas, taxes andbans, and import duty exemptions. The products most severely affected by the export measureswere grains, oilseeds and cattle. Import tariff exemptions were heavily used for all commodities,with tariff levels generally higher (around 40 percent) for pork and chicken, and lower (around20 percent) for grains, oilseeds and beef. A key problem was the instability of the trade regime.One analyst has documented 25 amendments in the regime from the end of 1995 to mid 1997.These changes tended to take place whenever material commodity balances showed animpending deficit (in which case import exemptions were used), or a surplus (in which caseexport restrictions were employed). The trade licensing system was used as a tool for ex antemonitoring of trade flows under this regime, enhancing the ability of government to intervenefrequently in response to perceived market imbalances. This created great uncertainty in thedecision-making process of primary producers, processors and traders who were not able predictwhat the trade regime would be, even in the near future.
Pricing. In 1994 a system of retail ceiling prices was in force. The system aiming atcontrolling the prices of goods and services of special importance including, among others, flour,bread, sunflower oil, veal, pork, and chicken, and a wide range of dairy products. Ceiling priceswere formed on the basis of an allowed markup of 12 percent over production cost. The ceilingprice system was superceded in 1995 by the Price Law, which essentially used the same markupapproach to set ceiling prices for a similar basket of goods, but increased the allowed margins.There was no mechanism for direct intervention on the market foreseen during 1994-1997, buttwo indirect interventions were allowed that could in principal affect returns to primaryproducers. First, transactions outside the allowed margins were illegal, and this type of controlcould reduce prices at lower levels of the marketing chain, filtering all the way down toproducers. Second, the foreign trade regime was used to respond to monitored price changes thatwere considered excessive, and this could also affect general supplies and farm level prices. Theforeign trade regime thus played the role of price regulator, which provides another explanationfor the frequent changes in trade policies that occurred over the period.
In 1997 ceiling prices were replaced by a system of contracted prices, a tool for implicitcontrol of profit margins in the food chain. As with the previous system, it was targeted tosupport consumers at the expense of producers and distributors. The number of commoditiescovered was reduced but still included processed versions of the seven commodities consideredin this analysis. While the new system eliminated direct controls on margins, but kept in place asystem for monitoring wholesale and retail prices and margins. This continued to have a chillingeffect on market participants, who feared that their markups were still being scrutinized againstgovernment benchmarks. For example, dairy processors complained that the Price Committeedid not accept their costs and margins on the grounds that their technical coefficients fortransformation of milk into cheese did not adhere to 'the norm.' On the basis of this information,
80 H. Gordon, N. Ivanova, and N. Nikolov
and following the decision that margins were unacceptable, new temporary zero import dutyquotas were opened for white cheese.
Wheat pricing during the period presented a special case for which direct producer levelintervention was more pronounced (Appendix Table 1). From 1994 to 1997 various decrees, aswell as the 1995 Price Law, set minimum producer prices. Transactions below the prescribedlevel were prohibited. These prices were updated once a year until the economic crisis of 1996(which was also considered a crisis in the wheat market). In that year, several revisions occurred.By 1997, minimum producer prices were enforced in three ways. First, in order for mills toobtain loans from the State Savings Bank and other banks they needed to produce evidence thatthe minimum prices had been used in their contracts; second, in order for farmers to receivecredit from the State Fund Agriculture (SFA) under either a forward contract scheme or asubsidized interest rate scheme they needed to sell to the government at these prices; third,exporters needed to verify purchase at the minimum price in order to obtain an export licensefrom the Ministry of Trade.
Fiscal Transfers. During 1994-97 total fiscal support to agriculture ranged from 4 to 9percent of agricultural GDP, with no discernible trend over the period (Appendix Table 2).32The transfers included allocations for specific commodities (especially grains/oilseeds andtobacco), as well as more general support for research, irrigation, land reform and veterinaryservices. In dollar terms, aggregate transfers ranged from $62 to $94 million (Table 1 andAppendix Table 2). For the seven commodities in question, this study has attempted to allocatetransfers by commodity, adding some portion of the general transfers to the commodity-specificallocations. The method used for allocating general transfers is to assign a portion of eachgeneral allocation to a commodity based on the computed share of that commodity in the totalvalue of production. Table 1 also shows that allocations to the seven commodities were lessthan the overall allocation level, ranging from $49 to $18 million and declining substantially inthe last two years.
Privatization of Agricultural Enterprises. The privatization process for bothagricultural and industrial enterprises was slow during the period. From the time of PrivatizationLaw adoption in April 1992 until the end of August 1997, only about 18 percent of long termassets of all enterprises originally under state ownership were privatized (privatization as definedhere includes liquidation).33 The performance for agriculture and food industry (AFI) enterpriseswas somewhat better, but still low. By the end of August 1997, 337 of the 849 AFI enterpriseshad been privatized, accounting for 26 percent of total AFI long term assets. In the case ofZarneni Hrani, the state grains enterprise, by 1997 only around one-third of its grain storagecapacity (two-grain bases and seven silos) had been privatized. As for the seed enterprise SortoviSemena. only about 7 percent of its long-tern assets had been privatized.
32 Appendix Table 3 was prepared to include both budgeted allocation for agriculture as well as expenditure fundedfrom earmarked revenues, which are typically not budgeted but are nonetheless funds at the disposal of MAFAR thatare allocated to specific activities.
33 The operational measure of privatization employed is the transfer of at least 67 percent of enterprise shares toprivate investors, or at least 51 percent of shares to a strategic investor.
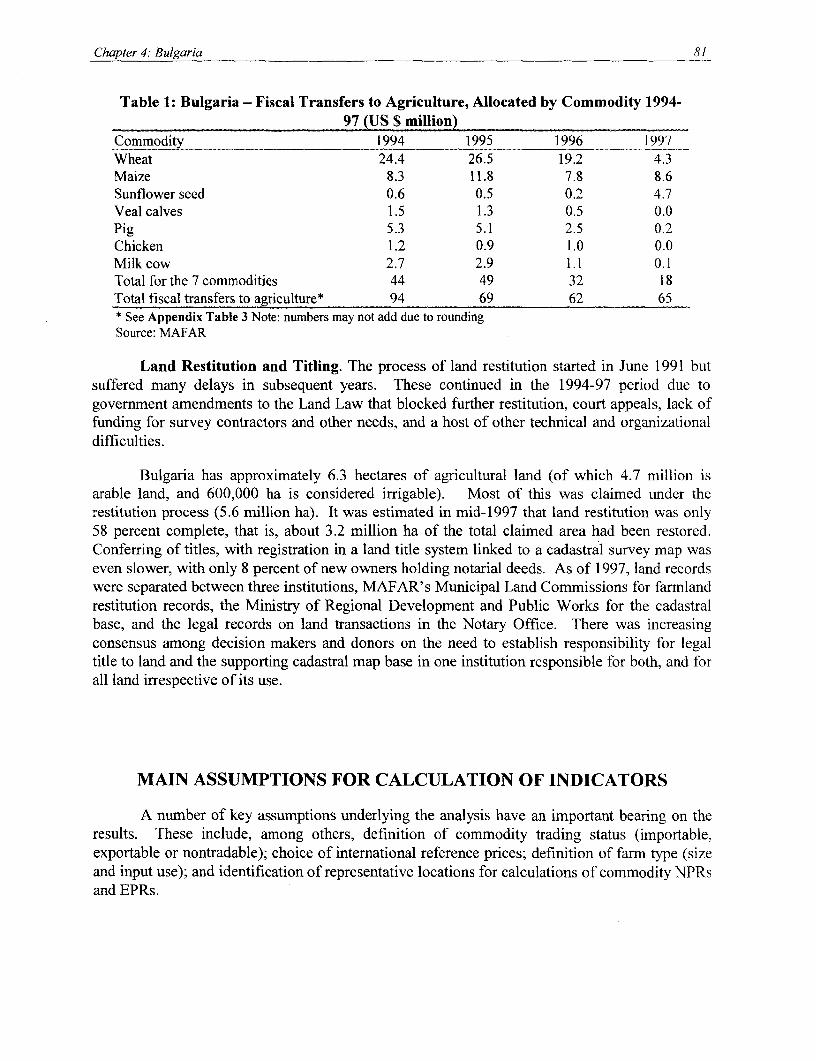
Chapter 4: Bulgaria 81
Table 1: Bulgaria - Fiscal Transfers to Agriculture, Allocated by Commodity 1994-97 (US $ million)
Commodity 1994 1995 1996 1997Wheat 24.4 26.5 19.2 4.3Maize 8.3 11.8 7.8 8.6Sunflower seed 0.6 0.5 0.2 4.7Veal calves 1.5 1.3 0.5 0.0Pig 5.3 5.1 2.5 0.2Chicken 1.2 0.9 1.0 0.0Milk cow 2.7 2.9 1.1 0.1Total for the 7 commodities 44 49 32 18Total fiscal transfers to agriculture* 94 69 62 65* See Appendix Table 3 Note: numbers may not add due to roundingSource: MAFAR
Land Restitution and Titling. The process of land restitution started in June 1991 butsuffered many delays in subsequent years. These continued in the 1994-97 period due togovernment amendments to the Land Law that blocked further restitution, court appeals, lack offunding for survey contractors and other needs, and a host of other technical and organizationaldifficulties.
Bulgaria has approximately 6.3 hectares of agricultural land (of which 4.7 million isarable land, and 600,000 ha is considered irrigable). Most of this was claimed under therestitution process (5.6 million ha). It was estimated in mid-1997 that land restitution was only58 percent complete, that is, about 3.2 million ha of the total claimed area had been restored.Conferring of titles, with registration in a land title system linked to a cadastral survey map waseven slower, with only 8 percent of new owners holding notarial deeds. As of 1997, land recordswere separated between three institutions, MAFAR's Municipal Land Commissions for farmlandrestitution records, the Ministry of Regional Development and Public Works for the cadastralbase, and the legal records on land transactions in the Notary Office. There was increasingconsensus among decision makers and donors on the need to establish responsibility for legaltitle to land and the supporting cadastral map base in one institution responsible for both, and forall land irrespective of its use.
MAIN ASSUMPTIONS FOR CALCULATION OF INDICATORS
A number of key assumptions underlying the analysis have an important bearing on theresults. These include, among others, definition of commodity trading status (importable,exportable or nontradable); choice of international reference prices; definition of farm type (sizeand input use); and identification of representative locations for calculations of commodity NPRsand EPRs.
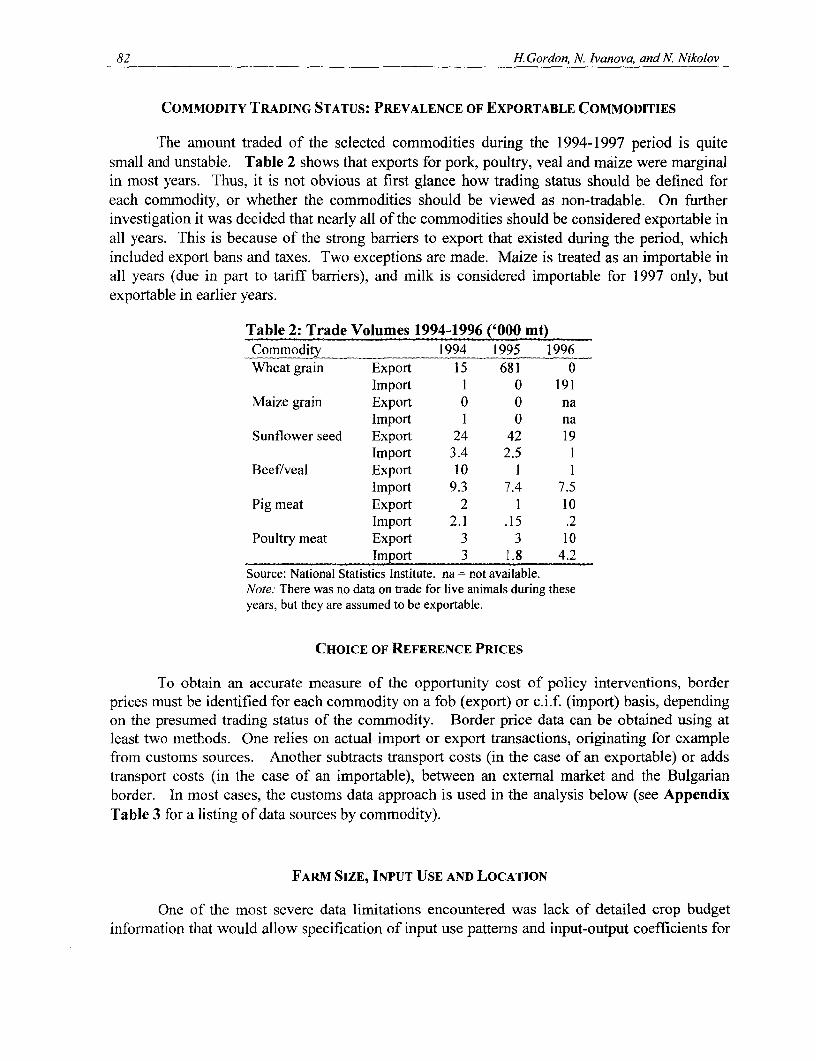
82 H. Gordon, N. Ivanova, and N. Nikolov
COMMODITY TRADING STATUS: PREVALENCE OF EXPORTABLE COMMODITIES
The amount traded of the selected commodities during the 1994-1997 period is quitesmall and unstable. Table 2 shows that exports for pork, poultry, veal and maize were marginalin most years. Thus, it is not obvious at first glance how trading status should be defined foreach commodity, or whether the commodities should be viewed as non-tradable. On furtherinvestigation it was decided that nearly all of the commodities should be considered exportable inall years. This is because of the strong barriers to export that existed during the period, whichincluded export bans and taxes. Two exceptions are made. Maize is treated as an importable inall years (due in part to tariff barriers), and milk is considered importable for 1997 only, butexportable in earlier years.
Table 2: Trade Volumes 1994-1996 ('000 mt)Commodity 1994 1995 1996Wheat grain Export 15 681 0
Import 1 0 191Maize grain Export 0 0 na
Import 1 0 naSunflower seed Export 24 42 19
Import 3.4 2.5 1Beef/veal Export 10 1 l
Import 9.3 7.4 7.5Pig meat Export 2 1 10
Import 2.1 .15 .2Poultry meat Export 3 3 10
Import 3 1.8 4.2Source: National Statistics Institute. na = not available.Note: There was no data on trade for live animals during theseyears, but they are assumed to be exportable.
CHOICE OF REFERENCE PRICES
To obtain an accurate measure of the opportunity cost of policy interventions, borderprices must be identified for each commodity on a fob (export) or c.i.f. (import) basis, dependingon the presumed trading status of the commodity. Border price data can be obtained using atleast two methods. One relies on actual import or export transactions, originating for examplefrom customs sources. Another subtracts transport costs (in the case of an exportable) or addstransport costs (in the case of an importable), between an external market and the Bulgarianborder. In most cases, the customs data approach is used in the analysis below (see AppendixTable 3 for a listing of data sources by commodity).
FARM SIZE, INPUT USE AND LOCATION
One of the most severe data limitations encountered was lack of detailed crop budgetinformation that would allow specification of input use patterns and input-output coefficients for
Chapter 4: Bulgaria 83
different farm types and sizes.34 This, along with lack of information on farm size distribution,made it difficult to develop an accurate representative farm typology, which is useful forestimation of NPCs and particularly EPCs. Due to this limitation, very simple farm types wereassumed, and inputs were allocated to different commodities based on information supplied byknowledgeable market participants and staff of the Ministry of Agriculture, Forestry andAgrarian Reform (MAFAR). This was supplemented by information from secondary sources onthe share of specific commodities in the overall value of commodity output, which was used toallocate inputs to different commodities.
The chief purchased inputs for field crops are machinery services and fertilizer, and forsome farm types pesticides and purchased seed are important. Unfortunately, due to datalimitations only fertilizer could be considered as an input for field crops in the EPC and PSEcalculations, which undoubtedly understates input use - and overstates value added - for mostfarm types growing these crops. Wheat, maize and sunflower production is assumed to occur onprivate, medium-to-large scale, capital intensive units in Dobrudja plains. The main producingareas are in the Northeast of the country and in particular the areas of Varna, Ruse, Dobrich (inthe region of Dobrudja) and further south, in Burgas. About 50 percent of wheat production and70 percent of maize and sunflower seed production comes from these regions. Adjustments ofborder prices to producing locations takes these distances into account.3 5
Livestock production is assumed to occur on small labor intensive units that are privatelyowned. The chief input is animal feed, and feedgrain is the only input taken into account in theEPC and PSE calculations. This is much less of a distortion than the simple use of fertilizer inthe case of field crops, since feed typically accounts for two-thirds to three quarters of the costsof livestock production. The representative production area defined for livestock is Plovdiv,located in central Bulgaria.
SUMMARY AND IMPLICATIONS OF MAIN RESULTS
Results of the support measures at the commodity level are presented in Tables 2, 3 and 4in the synthesis report. The yearly weighted average (Table 3, below) provides an initialoverview of the overall trend in indicators over the period. Deviations from this average can thenbe examined for individual commodities.
34 Recently, the FAO has begun to develop crop budgets, but the data was not available in final form at the time ofthis analysis.
35 See footnotes in the spreadsheet "Final NPCs.xls" for specific assumptions regarding distances for producing areasand associated transport cost adjustments.
84 H. Gordon, N. Ivanova, and N. Nikolov
The yearly weighted average for NPRs shows that on average, substantial taxationoccurred through negative output price transfers from 1994 to 1996, with no clear trend over theperiod. In 1997, the weighted average NPR rose to -3 percent, indicating that on average theimpact of policies on output prices was approximately neutral. This masks significant deviationsfrom neutrality in 1997. For wheat, there existed a substantial subsidy due to a policy ofproducer price support, which raised domestic price 37 percent above adjusted border prices. Forall other commodities except pigs, high levels of taxation occurred. Specifically, NPRs rangedfrom -40 percent (maize) to -13 percent (veal). The reasons for this pattern vary by commoditygroup. Grains and oilseeds suffered from export bans or taxes combined with restrictivelicensing during the year, and milk/livestock producers evidently suffered the upstream effects ofretail price restrictions, embodied in the contract price system. For two commodities, sunflowerseed and chickens, the level of taxation in 1997 actually increased from previous years. Thus,the improvement in incentives in 1997, summarized in a weighted average NPR of -3 percent, ismore apparent than real. This improvement resulted almost solely from an extremely high levelof support for wheat, while all other commodities (except pigs) were taxed at levels equal to ormore than previous years.
Weighted average EPRs follow the same pattern from 1994 to 1996 as for NPRs, rising,the falling, but with year to year fluctuations more pronounced. The EPR of -12 percent for1997 shows a moderate average level of taxation. As with NPRs, this result is influenced greatlyby a very high wheat EPR of 44 percent, while other EPRs in 1997 show moderate to severetaxation, ranging from a low of-59 percent for milk to -1I percent for pigs. In 1997 policiesaffecting inputs prices evidently reinforced the taxation that occurred through policies affectingoutput prices. As with NPRs, sunflower seed and chicken EPRs show markedly increasedtaxation in 1997 compared to previous years.
The results for NPRs and EPRs can best be summarized by the observation that policiesshowed instability across years and commodities. This is consistent with the description of tradeand pricing policy above. To the extent that general patterns exist, they show a tendency towardmoderate to severe implicit taxation in all years, for both crops and livestock/milk.
Average net income transfers to farmers, as embodied in the weighted average ERAindicator (bottom row of Table 3), shows a trend toward reduction in income transfers over theperiod. The aggregate ERA is expressed as a percentage of agricultural GDP, and in the 1994-96 period its ranges from 3 to 6 percent, while in 1997 it falls to 2 percent. Here against, the highlevel of support to wheat masks a general pattern of negative income transfers, with taxationlevels as high or higher than in previous years.
In Table 4, ERAs are decomposed into their three elements - implicit output pricetransfers, implicit input price transfers, and fiscal transfers (see Appendix 1 for an explanation ofeach type). This shows quite clearly that the dominant instruments for transferring income fromfarmers were policies affecting output prices. For wheat, maize and sunflower, such negativetransfers far outweighed the small positive transfers through input price and fiscal measures. Inthe case of livestock, the story is a little more complicated, since implicit output taxation ofmaize and wheat producers results in an implicit subsidy to livestock producers, who were ableto use feedgrain at reduced prices. The only commodity for which positive input price and fiscal
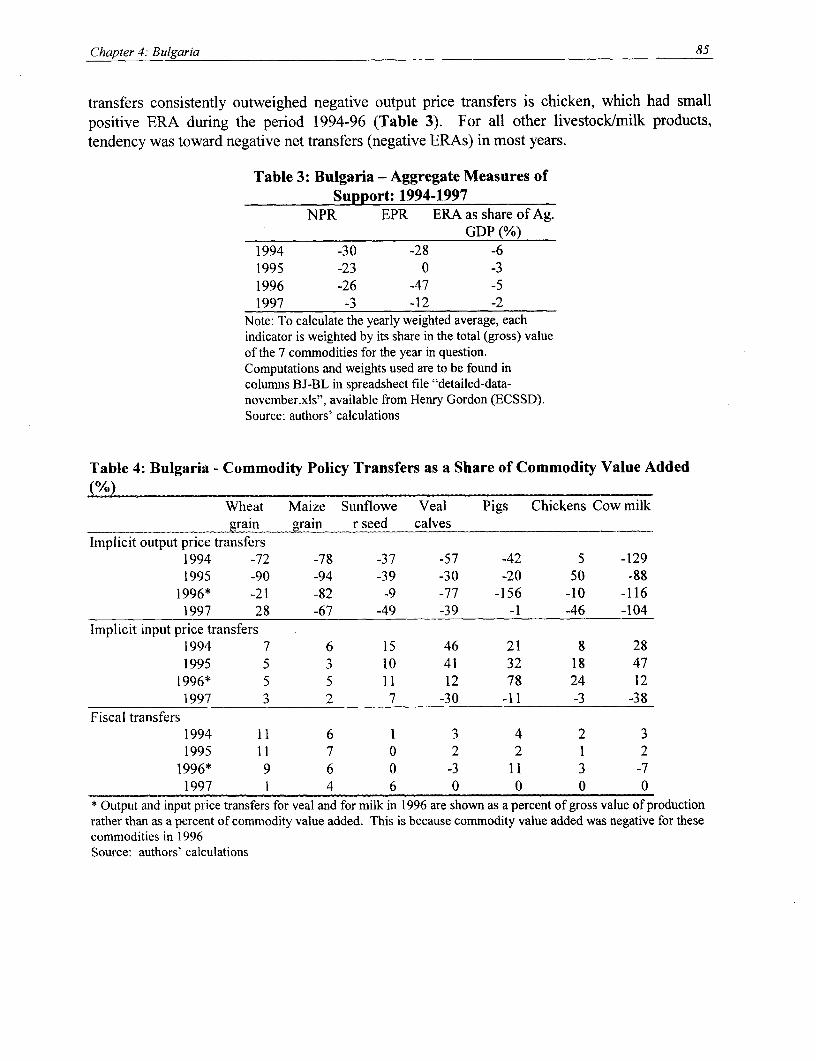
Chapter 4: Bulgaria 85
transfers consistently outweighed negative output price transfers is chicken, which had smallpositive ERA during the period 1994-96 (Table 3). For all other livestock/milk products,tendency was toward negative net transfers (negative ERAs) in most years.
Table 3: Bulgaria - Aggregate Measures ofSupport: 1994-1997
NPR EPR ERA as share of Ag.GDP (%)
1994 -30 -28 -61995 -23 0 -31996 -26 -47 -51997 -3 -12 -2
Note: To calculate the yearly weighted average, eachindicator is weighted by its share in the total (gross) valueof the 7 commodities for the year in question.Computations and weights used are to be found incolumns BJ-BL in spreadsheet file "detailed-data-november.xls", available from Henry Gordon (ECSSD).Source: authors' calculations
Table 4: Bulgaria - Commodity Policy Transfers as a Share of Commodity Value Added
Wheat Maize Sunflowe Veal Pigs Chickens Cow milkgrain grain r seed calves
Implicit output price transfers1994 -72 -78 -37 -57 -42 5 -1291995 -90 -94 -39 -30 -20 50 -88
1996* -21 -82 -9 -77 -156 -10 -1161997 28 -67 -49 -39 -1 -46 -104
Implicit input price transfers1994 7 6 15 46 21 8 281995 5 3 10 41 32 18 47
1996* 5 5 11 12 78 24 121997 3 2 7 -30 -11 -3 -38
Fiscal transfers1994 11 6 1 3 4 2 31995 11 7 0 2 2 1 2
1996* 9 6 0 -3 11 3 -71997 1 4 6 0 0 0 0
* Output and input price transfers for veal and for milk in 1996 are shown as a percent of gross value of productionrather than as a percent of commodity value added. This is because commodity value added was negative for thesecommodities in 1996Source: authors' calculations
86 H. Gordon, N. Ivanova, and N. Nikolov
REFERENCES
The following six background studies, based on fieldwork carried out in September 1997,were used as references in writing this note. These can be consulted for more detailedinformation on the agricultural policy regime as of mid- 1997 and sector policies and performancein preceding years. The studies were commissioned by the World Bank for the BulgariaAgriculture Sector Review and provided the basis for a set of reforms under an ongoingagricultural sector adjustment loan, ASAL I. The reports were summarized in a set of shortpolicy notes that were discussed in agricultural policy workshops in January 1998 withinBulgaria.
Jan H. Bakker, "The State of Land Restitution and Development of the Land Market in Bulgaria"(October 1997)
Sophia Davidova, "Bulgaria, Livestock Chain" (December 16 1997)
David Gisselquist "Production and Availability of Agricultural Inputs" (December 24 1997)
John D. Nash "Report on Agricultural Trade Policy" (December 1997)
Panayotis Varangis, "Cereal & Oilseed Marketing and Performnance in Bulgaria CurrentSituation, Major Constraints and Recommendations" (n.d.)
Charles Woodruff, "Privatization of Agriculture and Food Industries Enterprises: Current Statusand Recommendations" (February 1998)
In addition to the above, the following EU-Phare document was consulted for useful backgroundinformation on land restitution and titling progress as of early 1997:
EU Phare, "Identification Mission on the Progress of Land Restitution and Future EU PhareAssistance" (March, 1997)

Appendix Table 1: Inventory of Agricultural Support Mechanisms 1994-1997(note: blank indicates no recorded intervention)Commodity Policy 1994 1995 1996 1997Wheat grain Export Export ban for Exports allowed Export ban Export ban until end
most of year under quota with June, 1997 whentax (which varied export allowed withthrough year); tax under licensingLicensing regime regime
Import 40% general 40% general 15% general import 15% general importimport duty; import duty; duty; licensing duty; licensingduty free licensing regime; regime; duty free regime; duty freeimport within duty free import import within quota import within quotaquota within quota
Price Controlled Controlled Controlled minimum Controlled minimumminimum price minimum price for price for grain and price for grain andfor grain and grain and ceiling ceiling prices and contract priceceiling prices prices and margins controls for regime for processedand margins margins controls processed wheat wheat productscontrols for for processed productsprocessed wheat productswheat products
Fiscal Directed credit Directed credit Directed credit and Directed credit andand subsidies and subsidies subsidies subsidies
Maize grain Export Export ban Export ban Export ban Export ban;removed in 6/97after which exportsallowed underlicensing and exporttax regime (10% taxfrom 10/97)
Import 20% general 25% general 25% general import 25% general importimport duty; import duty; duty; duty free duty until 7/97 whenduty free import within quota duty removed; dutyimport within free import withinuota quota
PriceFiscal Directed credit Directed credit Directed credit and Directed credit and
and subsidies and subsidies subsidies subsidiesSunflower Export Heavy taxes - Heavy taxes - up Export ban Export ban;seed up to $200/ mt, to $200/ mt, along removed in 6/97 and
along with with licensing export taxeslicensing regime reintroducedregime ($80/mt as of 6/97)
Import 15-20% 15% general 15% general import 15% general importgeneral import import duty with duty with licensing duty with licensingduty; duty free licensing; duty until 6/97 when dutyimport within free import within removedquota quota
Price Ceiling prices Ceiling prices and Ceiling prices and Contract priceand margins margins controls margins controls for regime for sunflowercontrols for for sunflower oil sunflower oil oilsunflower oil
Fiscal Directed credit Directed credit Directed credit and Directed credit andand subsidies and subsidies subsidies subsidies

88 H. Gordon, N. Ivanova, and N. Nikolov
Live pig Export Licensing Licensing regime Licensing regime Licensing regimeregime
Import 40% general 40% general General tariff 241 ECU/mt importimport duty; import duty; duty replaced by 241 duty; licensingduty free free import within ECU/mt import regimeimport within quota duty; licensingquota regime; duty free
import within quotaPrice Ceiling prices Ceiling prices and Ceiling prices and Contract price
and margins margins controls margins controls for regime porkcontrols for for pork products pork products productspork products
Fiscal Directed credit Directed credit Directed credit and Directed credit andand subsidies and subsidies subsidies subsidies
Commodity Policy 1994 1995 1996 1997Live chicken Export Licensing regime Licensing regime Licensing regime
Import 40% general 40% general 15% general import 15% general importimport duty; import duty; duty duty; licensing duty; licensingduty free free import within, regime; duty free regime; duty freeimport within quota import within quota import within quotaquota
Price Ceiling prices Ceiling prices and Ceiling prices and Contract regime forand margins margins controls margins controls for chicken productscontrols for for chicken chicken productschicken productsproducts
Fiscal Directed credit Directed credit Directed credit and Directed credit andand subsidies and subsidies subsidies subsidies
Live calves Export Ban on cow Cattle and cow Cow export allowed Cow export allowedand milk export from exports allowed under license regime under license regimecows 4/94; cattle under licensing with export tax of with export tax of
exports under regime with $500/mt $500/mtlicensing export tax ofregime $500/mt
Import 15% general General duty General duty 5% General duty 5%import duty reduced to 5% and and additional duty and additional duty
additional duty amounting to 140 amounting to 140amounting to 140 ECU/mt introduced; ECU/mt introduced;ECU/mt duty free import licensing regimeintroduced; duty within quota forfree import within breeding stock;quota for breeding licensing regimestock
Price Ceiling prices Ceiling prices and Ceiling prices and Contract priceand margins margin controls margin controls for regime for veal andcontrols for for veal and dairy veal and dairy dairy productsveal and dairy products productsproducts
Fiscal Directed credit Directed credit Directed credit and Directed credit andand subsidies and subsidies subsidies subsidies

Chapter 4: Bulgaria 89
Apendix Table 2: Agricultural Suport Allocations, 1994-1997 (millin leva) _
1994 1995 1996 1997Directed Credit and Fund for the Protection of Agricultural 1,195
Subsidies Production (FPAP)*(mainly cereals) FPAP subsidized interest rate 1,000 568
State Fund Agriculture (includes directed credit, 4,383 48,177interest subsidies, and direct subsidies)
Wheat Market Support Wheat import from Poland and forward 12,000purchases from farmers
Tobacco Prod. Support One-time budgetary contribution for tobacco 100Contribution accord. To artl. para2 item 1.9 of 300 3501995 budgetContribution accord. To artl. para2 item 5.5 of 5001997 budgetDirect subsidy for tobacco producers 500Budgetary contribution to the Tobacco Fund 100
Tobacco Fund 192 449 1,300 8,802
Irrigation Support Melioration Fund** 522 966 1,765 8,220Land Law on Ownership and Use of Ag. Lands (land 868 725 825
restitution)1997 budget structural reform support (land 11,000restitution)National Fund for Land Productivity 132
Other Other off-budget allocations to the MFAR 1,916 353 2,437 18,887Total support (min leva, 5,098 4,656 11,060 107,718nominal)Total support (mln dollars, nominal) 94 69 62 65
Total support as Share of Ag. GDP 9% 4% 6% 9%Exchange rate (leva/$, yearly avg.) 54 67 178 1,668Ag GDP (in nominal. Lei) 59,014 108,913 183,732 1,220,186Note: no entry indicates a zero allocation.* Operated as State Fund Agriculture from 1996** Irrigation support to Irrigation Systems CompanySource: MAFAR

90 H. Gordon, N. Ivanova, and N. Nikolov
Appendix Table 3: International Reference Prices for Outputs - Data SourcesCommodity Price used SourceWheat grain Avg. wheat grain export price (1997) Sofia Commodity Exchange
and international price adjusted to (1997) and OECD (1994-96)border (1994-1996)
Maize grain Avg. maize grain export price (1997) Sofia Commodity Exchangeand international price adjusted to (1997) and OECD (1994-96)border (1994-1996)
Sunflower Avg. unit export price for sunflower Sofia Commodity Exchangeseed seed and international price adjusted to (1997) and OECD (1994-96)
border (1994-96)Veal calves Avg. unit export price for live calves CustomsPigs Avg. unit export price for fresh chilled Customs
pork meat (1997) and live pigs (1994-96)
Chickens Avg. unit export price for frozen Customschicken
Cow milk Avg. unit export price white cheese Customs (1997) and Min. of Ag.(1997) and N. Zealand milk price (1994-96)(1994-96)

CHAPTER 5: TURKEY36
Haluk Kasnakoolu and Erol H. Qakmak
INTRODUCTION
In this chapter we examine the fiscal burden and distribution of costs and benefits ofagricultural policies in Turkey. We begin with a brief review of existing agricultural policyinstruments employed in Turkey. Next, we analyze the costs and benefits of these policies basedon calculations by OECD, and revised estimates we have made, of the producer subsidyequivalent (PSE), consumer subsidy equivalent (CSE) and total transfers. In the third section, weestimate the transmission efficiency of agricultural support policies and their net income effects.Finally, we provide an analysis of the distribution of the costs and benefits of agricultural policiesin Turkey by commodity, region, farm size, and income group.
INSTRUMENTS OF AGRICULTURAL POLICY IN TURKEY
The Turkish goverm-nent has implemented a wide variety of measures to meet itsobjectives in the agricultural sector. In the crops sector, these measures have primarily includeddomestic price support, augmented by restraints on imports (in the past) and high tariffs (inrecent years). In the livestock sector, border measures have been the main mechanism used tosupport producer prices. Price controls and export taxes have been employed to protectconsumers, and input subsidies and credit are provided to farmers to improve yields and farmerincome, and to counterbalance the implicit protection given to domestic input industries throughborder measures. No limits are set on production or sale other than some control over plantedacreage of a few selected crops. The instruments of Turkey's agricultural policy are describedbelow.
36 Based on the original paper from Haluk KASNAKODLU and Erol H. QAKMAK, on The Fiscal Burden andDistribution of Costs and Benefits of Agricultural Support Policies in Turkey. Middle East Technical University,Department of Economics, 06530 Ankara, Turkey.

92 H.Kasnakodlu and E. Cakmak
Output Price Support. This has been the most widely used instrument of agriculturalpolicy in Turkey. It has always been at the center of policy discussions and gained popularityamong other instruments well beyond its relative significance. Output price support began in1932 with wheat. Until the 1960s, agricultural support was limited to 8-10 cereal grains, opium,tobacco, and sugarbeet. By the end of the 1960s, the number of commodities supported equaled17, a number that increased in the 1970s to 22. The number of products covered started todecline in 1981, and by 1990 only 10 products received support. In 1992, however, there was asharp increase to 26 commodities, followed by a decline. Since 1994, support purchases havebeen limited to cereals, tobacco, tea and sugarbeet.37
Prior to 1992, output support prices were announced by government decree each year.Related state economic enterprises (SEEs) and agricultural sales cooperatives (ASCUs) werecommissioned to buy at floor prices set by the government. With the exception of sugarbeet,these crops could also be sold to independent buyers. From 1993 on, private companies were alsoallowed to contract for sugarbeet. In August 1993, a new system was outlined for crops coveredby ASCUs. Instead of floor prices, a system similar to deficiency payments was introduced,whereby a target price was announced, together with a low intervention price based on the worldprice. Farmers selling their crop to ASCUs or commodity exchanges were paid a deficiencypayment equal to the difference between the price obtained and the target price. The payment wasmade by the Agricultural Bank and reimbursed by the Treasury. Deficiency payments wereimplemented initially for cotton in 1993, with the intention of expanding the benefit tosunflower, tobacco, tea and hazelnut production. Due to budgetary problems in 1994, thedeficiency payment system was abandoned, but the government is considering institutingpayments for wheat, cotton, and sunflower.
Livestock products seldom receive price support, but instead rely mainly on bordermeasures for their protection. Since 1986, a limited incentive premium program has beenadministered for milk, and some support purchases existed for livestock in 1979 and again in1989. Wool and mohair have received both price supports and border protection since the 1970s.
Trade Policies. Prior to 1980, the imports of agricultural commodities were highlyrestricted. Those allowed to be imported could only be imported by SEEs. Imports of fertilizersand pesticides were also controlled by SEEs and were given special treatment. Prior to 1980,export restrictions in the form of licensing and registration requirements existed for the export ofseveral agricultural products and inputs. Export levies were applied on relatively high-valueproducts to raise revenue and on certain cereals to regulate domestic supplies. Subsidies alsoexisted to promote exports of horticultural and livestock products, fresh and processedvegetables, citrus fruits, some cereals, and sugar. Since 1980, many licenses and monopolieshave been eliminated, and export duties reduced or replaced by special fund taxes.
37We gratefully acknowledge the help of Mr. Rahim Yeni from the Ministry of Agriculture and Rural Affairs(MARA) for providing the data and informnation for the total budgetary transfer tables for Turkey, presented in theAnnex.
Chapter 5: Turkey 93
Supply Control Measures. Limited use has been made of supply controls in agriculturalpolicy. Only tobacco (since June 1986), hazelnut (since June 1983) and tea (since June 1987)production are subject to cultivated-area control. Sugarbeet output is indirectly controlled byTurkish Sugar Factories Inc. (TSF) through contracts.
Direct Payments. Direct payments constitute a minor form of output price support inTurkey. Payments intended as relief from the effects of natural disasters, the return of sugarbeetpulp to producers after processing, and incentive premiums for livestock farmers are someexamples of direct payments observed in Turkey. Area and headage payments or diversionpayments are not employed as tools of agricultural policy. Since 1983, under the Fallow LandReduction Program, cereal producers have been indirectly supported through access to cheapercredit, extension, and demonstration projects. Sugarbeet producers have been encouraged toexpand into livestock. Milk and meat production incentive premiums were introduced in 1987and 1990, respectively.
Reduction in Input Costs. Input subsidies constitute the second most importantcomponent of agricultural support policies. The most important forms of input subsidies are:
(i) Capital grants, that include reductions in customs duties, incentive credits,income tax reductions, and Resource Utilization Support Premia.
(ii) Interest concessions, whereby short-term and investment credit is provided atinterest rates well below the rate of inflation and commercial interest rates.
(iii) Fertilizer subsidies to both the domestic manufacture and consumption offertilizers since 1961. Prices for all types of chemical fertilizers were set bygovernment decree. In 1997, the government decided to fix the fertilizer subsidyin nominal TL per kilogram, a shift in policy that, if sustained, will reduce thefertilizer subsidy substantially.
(iv) Seed Subsidies, consisting of state-controlled seed production and distribution,subsidies on imported seed purchased by the Soil Products Office (SPO), andsupport of hybrid seed producers through refund payments in 1985.
(v) Pesticide Subsidies, including free protection measures offered by the state incase of epidemic disease or pest infestations, and subsidies on services performedby private contractors after 1985.
(vi) Cultivation Services. TSF sows seed beet and pays for the maintenance ofmachinery and other capital equipment that belongs to contracted sugarbeetproducers.
(vii) Irrigation Subsidies. All water rights are, with minor exceptions, vested in thestate. They charge only for the costs of operation and maintenance, and nothingfor the imputed value of water. Even this, however, is covered to the extent thatelectricity charges for pumping are subsidized.

94 H. Kasnakodlu and E. (7akmak
(viii) Feed Subsidies and Improvement of Breeding Stock, including animal feedpurchase rebates (1985-89), industrial feed price support (1988-89), and free orsubsidized access to artificial insemination by breeding bulls and sheep.
General Services. The general services provided to agricultural producers either free or atsubsidized cost include:
(i) Research, training and extension services.
(ii) Inspection services, including inspections of imports and abattoirs, food andfeed factories, and monitoring and supervising animal movements.
(iii) Pest and disease control services, including free or subsidized tests, vaccines,drugs, and chemicals provided to producers.
(iv) Infrastructure services, including state investments in irrigation, landimprovement, soil and water conservation, roads, electricity, water, and pastureland improvement.
Income Taxes. Only the largest farmers are required to pay income tax, although awithholding tax of 5% is applied on sales of production.
Consumer Subsidies: No direct subsidy is given to consumers, but they are indirectlyprotected through price controls and market interventions.
MEASUREMENT OF SUPPORT TO AGRICULTURE
The PSE is an indicator of the value of the monetary transfers to agriculture resultingfrom agricultural policies in a given year. Five types of agricultural policy measures comprisethis indicator, including:
(i) Market price support, that transfer money to producers through their affectson producer and consumer prices. For a given product, this is calculated bymultiplying domestic production by the difference between domestic farmgateprice and a reference price (usually the world price at the border).
(ii) Direct payments, that transfer money directly from taxpayers to producerswithout raising prices to consumers.
(iii) Reduction of input costs, that transfer money to producers through thelowering of input costs.

Chapter 5: Turkey 95
(iv) General services, which reduce costs to the agricultural sector as a whole butare not directly, received by the producers.
(v) Other support, such as that provided by state or provincial governments andcertain tax concessions.
The CSE is an indicator of the value of monetary transfers to consumers resulting fromagricultural policies in a given year. Two types of agricultural policy measures included in thecalculation of CSEs are:
(i) Market transfers, that are transfers to (if positive), or more commonly from(if negative), consumers due to market-price support policies. For a given product,it is measured by multiplying domestic consumption by the difference betweendomestic consumer price and world price, evaluated at the farmgate level (andapproximated by the difference between domestic farmgate price and world priceat the border as in the case of PSE calculations).
(ii) Other transfers, including budgetary transfers to consumers resulting fromagricultural policies (consumer subsidies).
PSE AND CSE COVERAGE AND TOTAL TRANSFERS
PSE and CSE calculations by OECD cover 13 agricultural commodities, including wheat,maize, other grains, rice, oilseeds, sugar, milk, beef and veal, pigmeat, poultry, sheepmeat, wool,and eggs. The percentage of these commodities in total value of Turkish agricultural productionwas the lowest among OECD countries. To obtain total producer and consumer subsidies, OECDassumes that the average rate of transfers calculated from the 13 commodities can be applied tothe rest of the commodities. For most OECD countries, the likely bias from this generalizationwould be small. The bias could be significant for Turkey, however, since less than one-half of thetotal value of agricultural production is represented by these commodities.
Total transfers are a broader indicator than the PSE. They are defined as the sum of alltransfers from taxpayers and all transfers from consumers resulting from agricultural policies,less transfers to the budget or budget revenues from imports. They include an extrapolation ofmarket-price support to all agricultural production, as measured by the PSE, and they alsoinclude budgetary transfers additional to those included in the PSE, such as those to other parts ofthe agro-food sector and rural areas (e.g. subsidies to food processing and distribution industriesand rural infrastructure outlays), to social welfare recipients (e.g. domestic consumer food aidprogrammes), and for stockholding of agricultural commodities (financing costs, storage costs,and storage losses).
Very often, large budgetary expenditures result from measures that must be undertaken inorder to regulate markets in the face of policy intervention. These expenditures can exceed thetransfers that producers receive from consumers through domestic prices that exceed world

96 H. Kasnako6lu and E. (7akmak
prices, or from taxpayers through deficiency payments. Such policies often requirecomplementary programmes such as export subsidies, subsidies to support the stockpile ofcommodities for which production exceeds consumption, subsidies aimed at limiting the level ofproduction (quotas, set-asides, conservation programmes), as well as subsidies provided in orderto increase demand (consumer subsidies, including processing and food aid). The expendituresincurred in the implementation of such programmes may represent very high transfers toeconomic groups other than farmers. Thus, the value of calculating total transfers is to show thatin many cases the total transfers resulting from agricultural policies are much larger than thosethat are estimated as being received by farmers or by the sector as a whole.
REVISIONS ON OECD ESTIMATES OF PSE, CSE AND TOTAL TRANSFERS
In this section we examine the PSE, CSE and total transfer computations for Turkey asmade by OECD, and we offer modified estimates of transfers to the agricultural sector, and thefiscal costs associated with them. Our modifications will be carried out at three levels. First, wewill examine the grossing-up procedure from 13 commodities to all the commodities for PSE andCSE calculations. Secondly, we will examine the total budgetary transfers (i.e. taxpayers'contribution) generated by agricultural policy and the subset that comprises total budgetarytransfers going to farmers directly. From these, we obtain revised estimates of PSEs andassociated total transfers from taxpayers and consumers.
REVISED GROSSING-UP OF PSES AND CSES
We have pointed out above that PSE and CSE calculations by OECD are carried out forthe same basket of 13 commodities in all countries. In PSE calculations, market-price support iscomputed for each of the commodities separately. Non-market price support, which in general isnot commodity-specific, is ascribed to individual commodities using various estimationprocedures. In the computation of total transfers, non-market price supports or the budgetaryoutlay aggregates for all commodities are employed. The implicit tax to consumers (CSE) isadded to arrive at total transfers related to agricultural policy.
In the case of Turkey, PSE and CSE calculations are based on 12 of OECD's 13commodities, since rice is excluded from the computations. The 12 commodities constituted 34-43% of the total value of agricultural output in Turkey over the last 10 years. For the grossing-upto be unbiased, composition of the included commodities must be similar to the composition ofthe excluded commodities. When we examine Table 5.1, we observe that this condition is notmet for Turkey.
In 1995, crop production constituted 74% of the total value of Turkey's agriculturalproduction, and livestock production the remaining 26%. In OECD calculations, the share inoutput value of crops is 42%, and that of livestock is 58%. Using the inflation rate of 43% forboth crops and livestock results in a bias in favor of PSEs for livestock products. To correct forthis bias, we have recalculated PSEs and CSEs for 1993-1996 using two different inflationfactors for crops (25% inflation) and livestock products (95%).
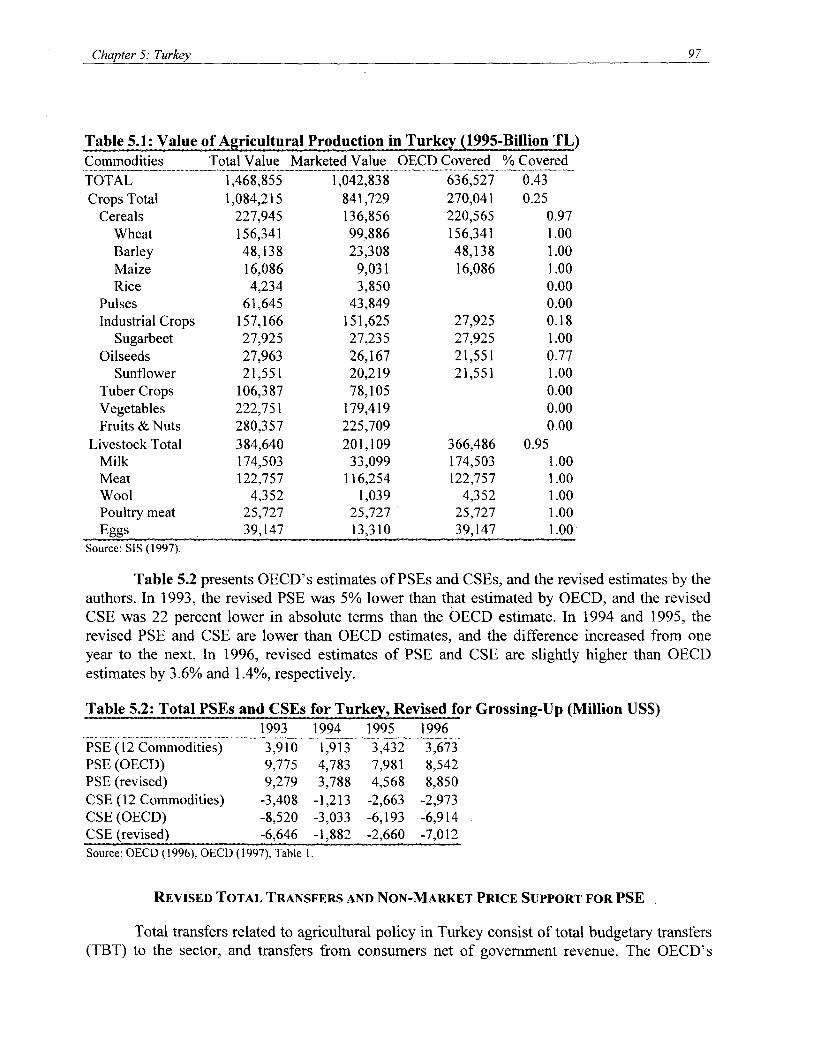
Chapter 5: Turkey 97
Table 5.1: Value of Agricultural Production in Turke 1995-Billion Tb)Commodities Total Value Marketed Value OECD Covered % CoveredTOTAL 1,468,855 1,042,838 636,527 0.43Crops Total 1,084,215 841,729 270,041 0.25
Cereals 227,945 136,856 220,565 0.97Wheat 156,341 99,886 156,341 1.00Barley 48,138 23,308 48,138 1.00Maize 16,086 9,031 16,086 1.00Rice 4,234 3,850 0.00
Pulses 61,645 43,849 0.00Industrial Crops 157,166 151,625 27,925 0.18
Sugarbeet 27,925 27,235 27,925 1.00Oilseeds 27,963 26,167 21,551 0.77
Sunflower 21,551 20,219 21,551 1.00Tuber Crops 106,387 78,105 0.00Vegetables 222,751 179,419 0.00Fruits & Nuts 280,357 225,709 0.00
Livestock Total 384,640 201,109 366,486 0.95Milk 174,503 33,099 174,503 1.00Meat 122,757 116,254 122,757 1.00Wool 4,352 1,039 4,352 1.00Poultry meat 25,727 25,727 25,727 1.00Eggs 39,147 13,310 39,147 1.00
Source: SIS (1997).
Table 5.2 presents OECD's estimates of PSEs and CSEs, and the revised estimates by theauthors. In 1993, the revised PSE was 5% lower than that estimated by OECD, and the revisedCSE was 22 percent lower in absolute terms than the OECD estimate. In 1994 and 1995, therevised PSE and CSE are lower than OECD estimates, and the difference increased from oneyear to the next. In 1996, revised estimates of PSE and CSE are slightly higher than OECDestimates by 3.6% and 1.4%, respectively.
Table 5.2: Total PSEs and CSEs for Turkey, Revised for Grossing-Up (Million US$)1993 1994 1995 1996
PSE (12 Commodities) 3,910 1,913 3,432 3,673PSE (OECD) 9,775 4,783 7,981 8,542PSE (revised) 9,279 3,788 4,568 8,850CSE (12 Commodities) -3,408 -1,213 -2,663 -2,973CSE (OECD) -8,520 -3,033 -6,193 -6,914CSE (revised) -6,646 -1,882 -2,660 -7,012Source: OECD (1996). OECD (1997), Table 1.
REVISED TOTAL TRANSFERS AND NON-MARKET PRICE SUPPORT FOR PSE
Total transfers related to agricultural policy in Turkey consist of total budgetary transfers(TBT) to the sector, and transfers from consumers net of government revenue. The OECD's
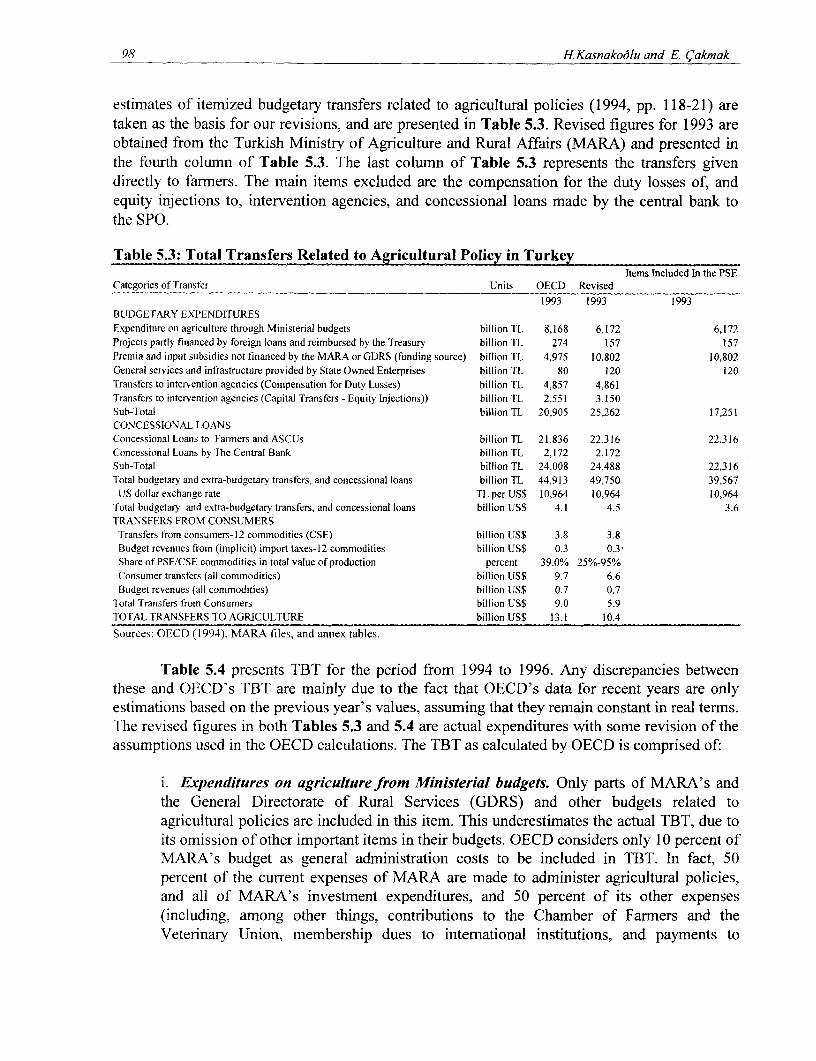
98 H.Kasnakodlu and E Cakmak
estimates of itemized budgetary transfers related to agricultural policies (1994, pp. 118-21) aretaken as the basis for our revisions, and are presented in Table 5.3. Revised figures for 1993 areobtained from the Turkish Ministry of Agriculture and Rural Affairs (MARA) and presented inthe fourth column of Table 5.3. The last column of Table 5.3 represents the transfers givendirectly to farmers. The main items excluded are the compensation for the duty losses of, andequity injections to, intervention agencies, and concessional loans made by the central bank tothe SPO.
Table 5.3: Total Transfers Related to Agricultural Policy in TurkeyItems Included In the PSE
Categories of Transfer Units OECD Revised
1993 1993 1993BUDGETARY EXPENDITURESExpenditure on agriculture through Ministerial budgets billion TL 8,168 6,172 6,172Projects partly financed by foreign loans and reimbursed by the Treasury billion TL 274 157 157Premia and input subsidies not financed by the MARA or GDRS (finding source) billion TL 4,975 10,802 10,802General services and infrastructure provided by State Owned Enterprises billion TL 80 120 120Transfers to intervention agencies (Compensation for Duty Losses) billion TL 4,857 4,861Transfers to intervention agencies (Capital Transfers - Equity Injections)) billion TL 2,551 3,150Sub-Total billion TL 20,905 25,262 17,251CONCESSIONAL LOANSConcessional Loans to Farmers and ASCUs billion TL 21,836 22,316 22,316Concessional Loans by The Central Bank billion TL 2,172 2,172Sub-Total billion TL 24,008 24,488 22,316Total budgetary and extra-budgetarv transfers, and concessional loans billion TL 44,913 49,750 39,567US dollar exchange rate TL per US$ 10,964 10,964 10,964
Total budgetary and extra-budgetary transfers, and concessional loans billion US$ 4.1 4.5 3.6TRANSFERS FROM CONSUMERSTransfers from consumers-]2 commodities (CSE) billion US$ 3.8 3.8Budget revenues from (implicit) import taxes-12 commodities billion US$ 0.3 0.3-Share of PSE/CSE commodities in total value of production percent 39.0% 25%-95%Consumer transfers (all commodities) billion US$ 9.7 6.6Budget revenues (all commodities) billion US$ 0.7 0.7
Total Transfers from Consumers billion US$ 9.0 5.9TOTAL TRANSFERS TO AGRICULTURE billion US$ 13.1 10.4
Sources: OECD (1994), MARA files, and annex tables.
Table 5.4 presents TBT for the period from 1994 to 1996. Any discrepancies betweenthese and OECD's TBT are mainly due to the fact that OECD's data for recent years are onlyestimations based on the previous year's values, assuming that they remain constant in real terms.The revised figures in both Tables 5.3 and 5.4 are actual expenditures with some revision of theassumptions used in the OECD calculations. The TBT as calculated by OECD is comprised of:
i. Expenditures on agriculture from Ministerial budgets. Only parts of MARA's andthe General Directorate of Rural Services (GDRS) and other budgets related toagricultural policies are included in this item. This underestimates the actual TBT, due toits omission of other important items in their budgets. OECD considers only 10 percent ofMARA's budget as general administration costs to be included in TBT. In fact, 50percent of the current expenses of MARA are made to administer agricultural policies,and all of MARA's investment expenditures, and 50 percent of its other expenses(including, among other things, contributions to the Chamber of Farmers and theVeterinary Union, membership dues to international institutions, and payments to
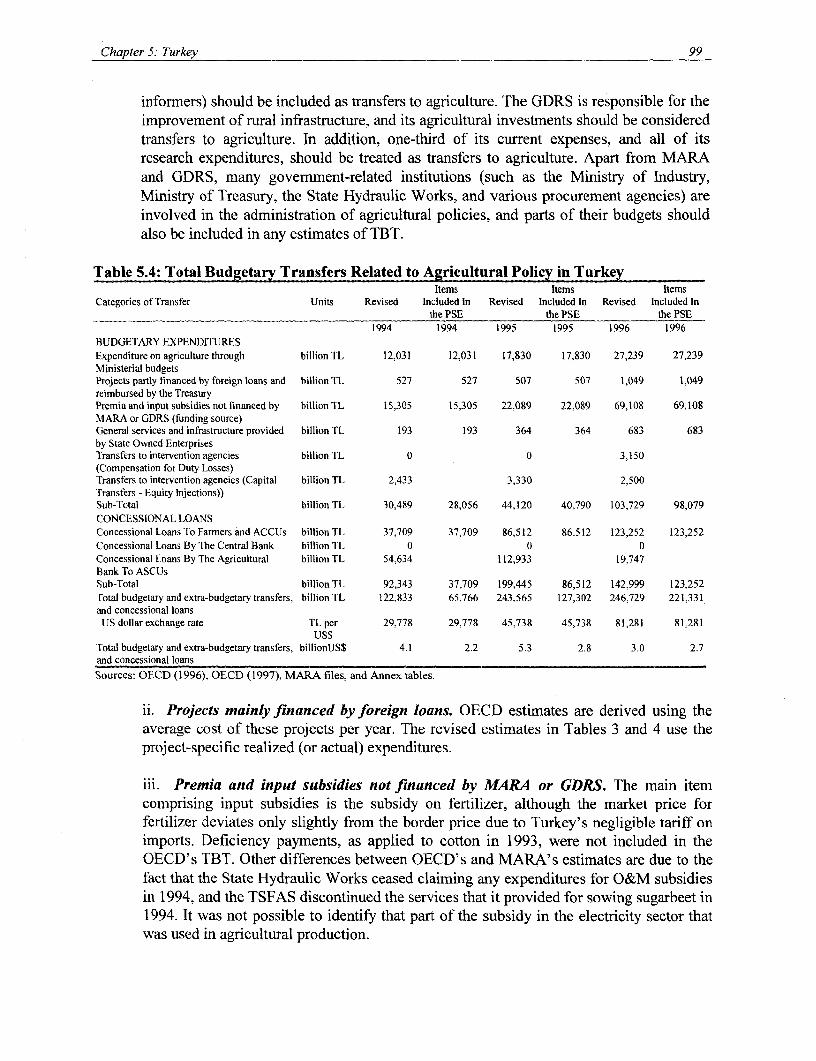
Chapter 5: Turkey 99
informers) should be included as transfers to agriculture. The GDRS is responsible for theimprovement of rural infrastructure, and its agricultural investments should be consideredtransfers to agriculture. In addition, one-third of its current expenses, and all of itsresearch expenditures, should be treated as transfers to agriculture. Apart from MARAand GDRS, many goverrnent-related institutions (such as the Ministry of Industry,Ministry of Treasury, the State Hydraulic Works, and various procurement agencies) areinvolved in the administration of agricultural policies, and parts of their budgets shouldalso be included in any estimates of TBT.
Table 5.4: Total Budgetary Transfers Related to Agricultural Policy in Turk eyItems Items Items
Categories of Transfer Units Revised Included In Revised Included In Revised Included Inthe PSE the PSE the PSE
1994 1994 1995 1995 1996 1996BUDGETARY EXPENDITURESExpenditure on agriculture through billion TL 12,031 12,031 17,830 17,830 27,239 27,239Ministerial budgetsProjects partly financed by foreign loans and billion TL 527 527 507 507 1,049 1,049reimbursed by the TreasuryPremia and input subsidies not financed by billion TL 15,305 15,305 22,089 22,089 69,108 69,108MARA or GDRS (funding source)General services and infrastructure provided billion TL 193 193 364 364 683 683by State Owned EnterprisesTransfers to intervention agencies billion IL 0 0 3,150(Compensation for Duty Losses)Transfers to intervention agencies (Capital billion TL 2,433 3,330 2,500Transfers - Equity Injections))Sub-Total billion TL 30,489 28,056 44,120 40,790 103,729 98,079CONCESSIONAL LOANSConcessional Loans To Farmers and ACCUs billion TL 37,709 37,709 86,512 86,512 123,252 123,252Concessional Loans By The Central Bank billion TL 0 0 0Concessional Loans By The Agricultural billion TL 54,634 112,933 19,747Bank To ASCUsSub-Total billionTL 92,343 37,709 199,445 86,512 142,999 123,252Total budgetary and extra-budgetary transfers, billion TL 122,833 65,766 243,565 127,302 246,729 221,331and concessional loanstJS dollar exchange rate TL per 29,778 29,778 45,738 45,738 81,281 81,281
USSTotal budgetary and extra-budgetary transfers, billionUS$ 4.1 2.2 5.3 2.8 3.0 2.7and concessional loans
Sources: OECD (1996), OECD (1997), MARA files, and Annex tables.
ii. Projects mainly financed by foreign loans. OECD estimates are derived using theaverage cost of these projects per year. The revised estimates in Tables 3 and 4 use theproject-specific realized (or actual) expenditures.
iii. Premia and input subsidies not financed by MARA or GDRS. The main itemcomprising input subsidies is the subsidy on fertilizer, although the market price forfertilizer deviates only slightly from the border price due to Turkey's negligible tariff onimports. Deficiency payments, as applied to cotton in 1993, were not included in theOECD's TBT. Other differences between OECD's and MARA's estimates are due to thefact that the State Hydraulic Works ceased claiming any expenditures for O&M subsidiesin 1994, and the TSFAS discontinued the services that it provided for sowing sugarbeet in1994. It was not possible to identify that part of the subsidy in the electricity sector thatwas used in agricultural production.

100 H. Kasnakoflu and E. (7akmak
iv. General services and infrastructure provided by SEEs. The OECD's estimate forthis item is the same as that employed by MARA.
v. Duty losses and equity transfers to intervention agencies. We use the actualexpenditures, while OECD estimates are usually based on previous years.
vi. Concessional loans. The four types of concessional loans include loans from theAgricultural Bank (AB) to farmers, loans from the AB to agricultural credit cooperativesassociations (ACCUs) that are transferred to farmers (and reported as loans to farmers),loans from the AB to agricultural sales cooperative unions (ASCUs), and loans from theCentral Bank to the SPO. Interest concessions on the loans to farmers and ACCUs arealso considered transfers to farners. Concessional loans to ASCUs and to SPO aretransfers from taxpayers to agriculture for support purchases, and they are separated fromthe interest concessions directly accruing to the farmers in Table 4.
THE MARKET-PRICE SUPPORT COMPONENTS OF PSE AND CSE
The market-price support component constitutes a significant part of the subsidies toproducers and implicit taxes on consumers (in this study we have not attempted to revise themarket-price support component of OECD estimates). In 1996, over 70% of the PSE and nearlyall of the CSE came from this component. Furthermnore, the relative magnitudes of thiscomponent showed important variations from one year to the next. From 1993 to 1996, theshares of market-price support in total support to producers were 0.89, 0.35, 0.63 and 0.72. Theselection of the appropriate reference prices and scaling them to farmgate level to compare withdomestic prices is probably the most critical and yet the weakest part of the OECD methodology.We did not attempt to resolve this problem in our study.
REVISED PSE, CSE AND TOTAL TRANSFERS
Throughout the remainder of this chapter, we will use the revised PSE, CSE, and totaltransfer estimates calculated as follows.
i. Revised CSE= From Table 5.2
ii. Revised PSE = OECD market price support for 12 commodities x (% share of Cropsin CSE) / 0.25 + OECD market price support for 12 commodities x (% share oflivestock in CSE) / 0.95 - feed adjustment for 12 commodities / 0.95 + total budgetarytransfers included in PSE (from Tables 5.3 and 5.4).
iii. Revised Total Transfers - revised total budgetary transfers (from Tables 5.3 and5.4) + revised CSE (from Table 5.2) - budget revenues (from Tables 5.2, 5.3 and5.4).
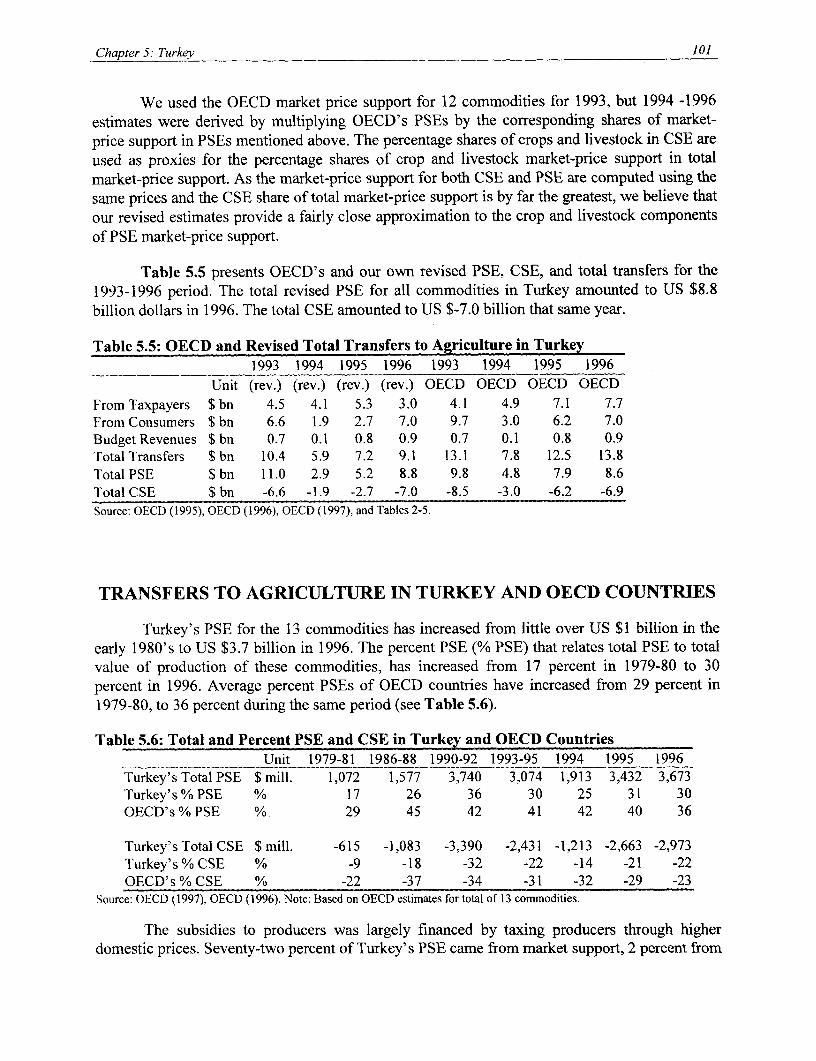
Chapter 5: Turkey 101
We used the OECD market price support for 12 commodities for 1993, but 1994 -1996estimates were derived by multiplying OECD's PSEs by the corresponding shares of market-price support in PSEs mentioned above. The percentage shares of crops and livestock in CSE areused as proxies for the percentage shares of crop and livestock market-price support in totalmarket-price support. As the market-price support for both CSE and PSE are computed using thesame prices and the CSE share of total market-price support is by far the greatest, we believe thatour revised estimates provide a fairly close approximation to the crop and livestock componentsof PSE market-price support.
Table 5.5 presents OECD's and our own revised PSE, CSE, and total transfers for the1993-1996 period. The total revised PSE for all commodities in Turkey amounted to US $8.8billion dollars in 1996. The total CSE amounted to US $-7.0 billion that same year.
Table 5.5: OECD and Revised Total Transfers to Agriculture in Turkey1993 1994 1995 1996 1993 1994 1995 1996
Unit (rev.) (rev.) (rev.) (rev.) OECD OECD OECD OECDFrom Taxpayers $ bn 4.5 4.1 5.3 3.0 4.1 4.9 7.1 7.7From Consumers $ bn 6.6 1.9 2.7 7.0 9.7 3.0 6.2 7.0Budget Revenues $ bn 0.7 0.1 0.8 0.9 0.7 0.1 0.8 0.9Total Transfers $ bn 10.4 5.9 7.2 9.1 13.1 7.8 12.5 13.8Total PSE $ bn 11.0 2.9 5.2 8.8 9.8 4.8 7.9 8.6Total CSE $ bn -6.6 -1.9 -2.7 -7.0 -8.5 -3.0 -6.2 -6.9Source: OECD (1995), OECD (1996), OECD (1997), and Tables 2-5.
TRANSFERS TO AGRICULTURE IN TURKEY AND OECD COUNTRIES
Turkey's PSE for the 13 commodities has increased from little over US $1 billion in theearly 1980's to US $3.7 billion in 1996. The percent PSE (% PSE) that relates total PSE to totalvalue of production of these commodities, has increased from 17 percent in 1979-80 to 30percent in 1996. Average percent PSEs of OECD countries have increased from 29 percent in1979-80, to 36 percent during the same period (see Table 5.6).
Table 5.6: Total and Percent PSE and CSE in Turkey and OECD CountriesUnit 1979-81 1986-88 1990-92 1993-95 1994 1995 1996
Turkey's Total PSE $ mill. 1,072 1,577 3,740 3,074 1,913 3,432 3,673Turkey's% PSE % 17 26 36 30 25 31 30OECD's % PSE % 29 45 42 41 42 40 36
Turkey's Total CSE $ mill. -615 -1,083 -3,390 -2,431 -1,213 -2,663 -2,973Turkey's % CSE % -9 -18 -32 -22 -14 -21 -22OECD's % CSE % -22 -37 -34 -31 -32 -29 -23
Source: OECD (1997), OECD (1996). Note: Based on OECD estimates for total of 13 commodities.
The subsidies to producers was largely financed by taxing producers through higherdomestic prices. Seventy-two percent of Turkey's PSE came from market support, 2 percent from
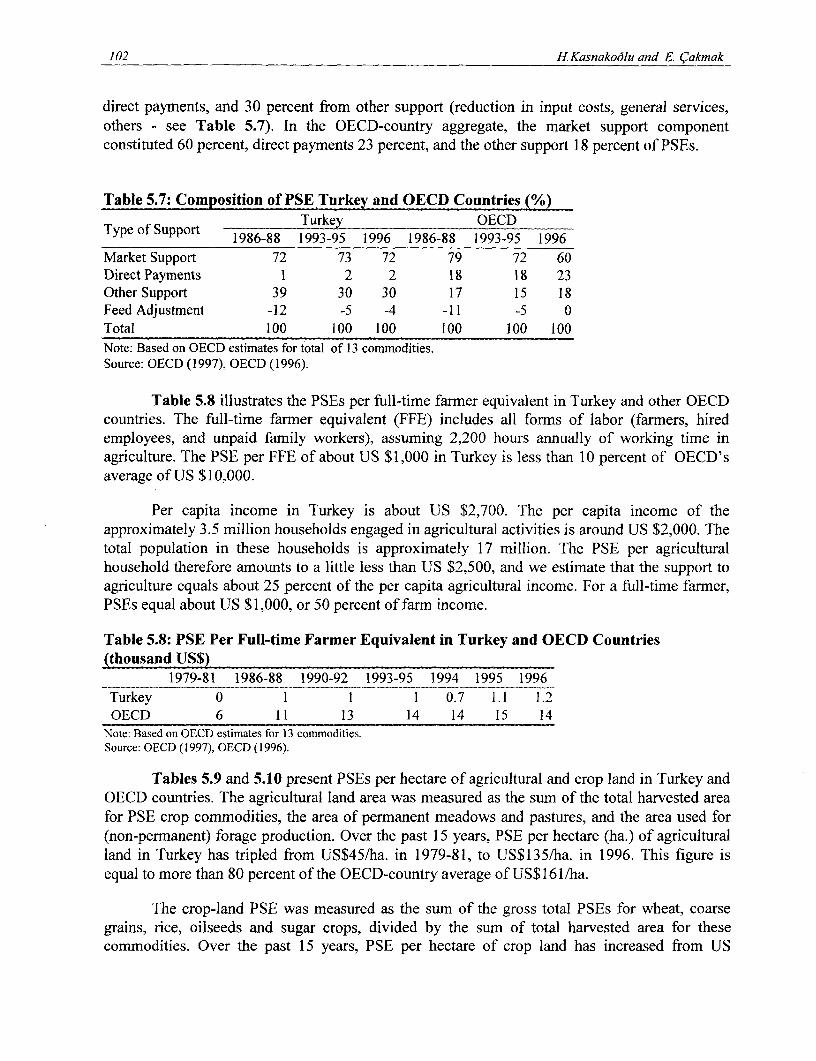
102 H.Kasnakodlu and E. 9akmak
direct payments, and 30 percent from other support (reduction in input costs, general services,others - see Table 5.7). In the OECD-country aggregate, the market support componentconstituted 60 percent, direct payments 23 percent, and the other support 18 percent of PSEs.
Tabe .7:Copoitin f SE ureyand OECD Countries,(%)
Type of Support Turkey OECD1986-88 1993-95 1996 1986-88 1993-95 1996
Market Support 72 73 72 79 72 60Direct Payments 1 2 2 18 18 23Other Support 39 30 30 17 15 18Feed Adjustment -12 -5 -4 -11 -5 0Total 100 100 100 100 100 100Note: Based on OECD estimates for total of 13 commodities.Source: OECD (1997), OECD (1996).
Table 5.8 illustrates the PSEs per full-time farmer equivalent in Turkey and other OECDcountries. The full-time farmer equivalent (FFE) includes all forms of labor (farmers, hiredemployees, and unpaid family workers), assuming 2,200 hours annually of working time inagriculture. The PSE per FFE of about US $1,000 in Turkey is less than 10 percent of OECD'saverage of US $10,000.
Per capita income in Turkey is about US $2,700. The per capita income of theapproximately 3.5 million households engaged in agricultural activities is around US $2,000. Thetotal population in these households is approximately 17 million. The PSE per agriculturalhousehold therefore amounts to a little less than US $2,500, and we estimate that the support toagriculture equals about 25 percent of the per capita agricultural income. For a full-time farmer,PSEs equal about US $ 1,000, or 50 percent of farm income.
Table 5.8: PSE Per Full-time Farmer Equivalent in Turkey and OECD Countries(thousand US$)
1979-81 1986-88 1990-92 1993-95 1994 1995 1996Turkey 0 1 1 1 0.7 1.1 1.2
OECD 6 11 13 14 14 15 14Note: Based on OECD estimates for 13 commodities.Source: OECD (1997), OECD (1996).
Tables 5.9 and 5.10 present PSEs per hectare of agricultural and crop land in Turkey andOECD countries. The agricultural land area was measured as the sum of the total harvested areafor PSE crop commodities, the area of permanent meadows and pastures, and the area used for(non-permanent) forage production. Over the past 15 years, PSE per hectare (ha.) of agriculturalland in Turkey has tripled from US$45/ha. in 1979-81, to US$135/ha. in 1996. This figure isequal to more than 80 percent of the OECD-country average of US$161/ha.
The crop-land PSE was measured as the sum of the gross total PSEs for wheat, coarsegrains, rice, oilseeds and sugar crops, divided by the sum of total harvested area for thesecomrnodities. Over the past 15 years, PSE per hectare of crop land has increased from US

Chapter 5: Turkey 103
$28/ha. in 1979-81, to US$124/ha. in 1996. Nevertheless, it is little more than one-third of theaverage PSE of $355/ha in OECD countries.
Table 5.9: PSE Per Hectare of Agricultural Land in Turkey and OECD Countries(US$/hectare)
1979-81 1986-88 1990-92 1993-95 1994 1995 1996Turkey 45 62 137 114 71 127 135OECD 86 153 168 170 171 176 161
Note: Based on OECD estimates for total of 13 commhoditiesSource: OECD (1997), OECD (1996).
Table 5.10: PSE Per Hectare of Crop Land,in Turkey and OECD Countries (US$/hectare)1979-81 1986-88 1990-92 1993-95 1994 1995 1996
Turkey 28 82 147 64 44 24 124OECD 170 410 398 417 431 418 355Note: Based on OECD estimates for total of 13 commoditiesSource: OECD (1997), OECD (1996).
TOTAL TRANSFERS IN TURKEY AND OECD COUNTRIES
The expenditures incurred in the implementation of agricultural support programmes mayrepresent very high transfers to economic groups other than farmers. Comparing total transferswith PSEs permits us to compare the total costs of agricultural policies with the benefits receivedby farmers or the sector as a whole.
Table 5.11 presents the magnitude and sources of total transfers to agriculture in Turkeyand OECD countries. The transfers from taxpayers include all the budgetary outlays used for PSEcalculations, plus those mentioned in Section 3. The total transfer from consumers is equal to theCSE grossed-up by the percentage share of production covered by the PSE calculations. Budgetrevenues arising from border policy measures exist only for those commodities for which it is anet importer. They are calculated for individual commodities as the product of the tariff (or theprice differential) and the difference between the consumption and production levels for thesecommodities. These estimates are also grossed up to include all production using PSEpercentages.
In 1996, total transfers from consumers and taxpayers to agriculture net of related budgetrevenues amounted to US $9.1 billion in Turkey, US $7.0 billion of which came from implicittaxation of the consumers due to higher domestic prices. The remainder consisted of budgetaryoutlays from the taxpayers, US $0.9 billion of which was recovered from border measures. Thetotal PSE received by the agricultural producers in the same year was US$8.8 billion.
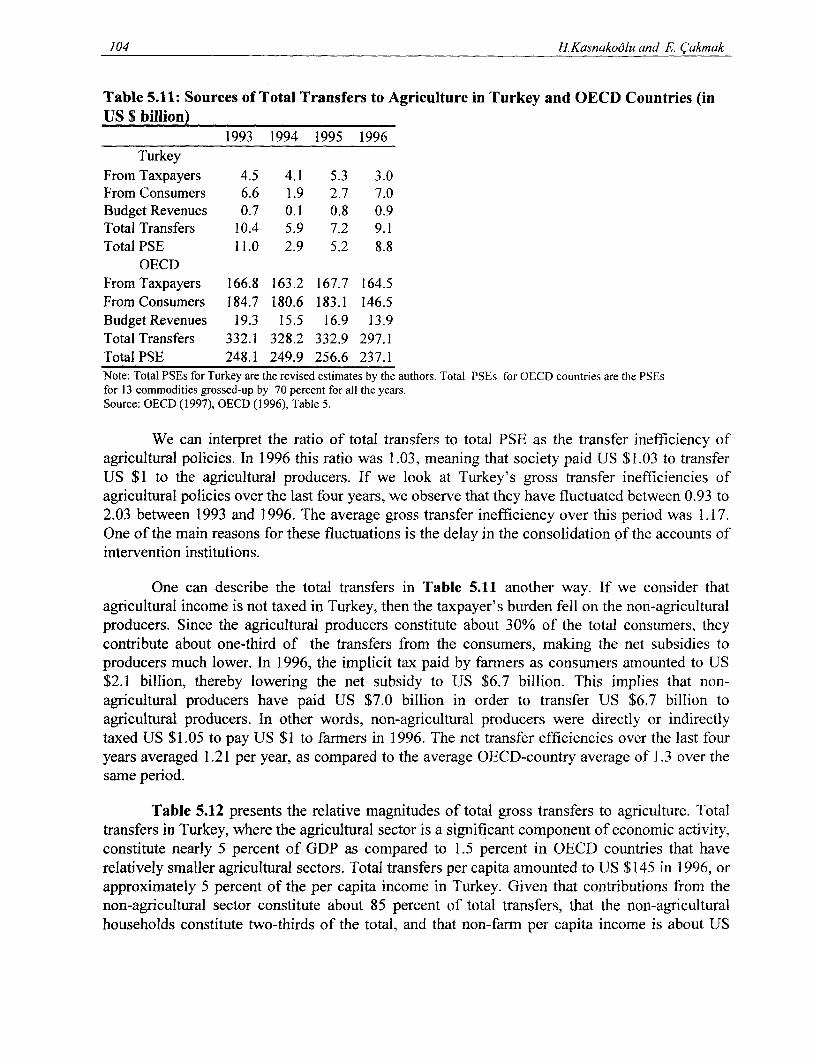
104 H.Kasnakoclu and E. (7akmak
Table 5.11: Sources of Total Transfers to Agriculture in Turkey and OECD Countries (inUS $ billion)
1993 1994 1995 1996Turkey
From Taxpayers 4.5 4.1 5.3 3.0From Consumers 6.6 1.9 2.7 7.0Budget Revenues 0.7 0.1 0.8 0.9Total Transfers 10.4 5.9 7.2 9.1Total PSE 11.0 2.9 5.2 8.8
OECDFrom Taxpayers 166.8 163.2 167.7 164.5From Consumers 184.7 180.6 183.1 146.5Budget Revenues 19.3 15.5 16.9 13.9Total Transfers 332.1 328.2 332.9 297.1Total PSE 248.1 249.9 256.6 237.1Note: Total PSEs for Turkey are the revised estimates by the authors. Total PSEs for OECD countries are the PSEsfor 13 commodities grossed-up by 70 percent for all the years.Source: OECD (1997), OECD (1996), Table 5.
We can interpret the ratio of total transfers to total PSE as the transfer inefficiency ofagricultural policies. In 1996 this ratio was 1.03, meaning that society paid US $1.03 to transferUS $1 to the agricultural producers. If we look at Turkey's gross transfer inefficiencies ofagricultural policies over the last four years, we observe that they have fluctuated between 0.93 to2.03 between 1993 and 1996. The average gross transfer inefficiency over this period was 1.17.One of the main reasons for these fluctuations is the delay in the consolidation of the accounts ofintervention institutions.
One can describe the total transfers in Table 5.11 another way. If we consider thatagricultural income is not taxed in Turkey, then the taxpayer's burden fell on the non-agriculturalproducers. Since the agricultural producers constitute about 30% of the total consumers, theycontribute about one-third of the transfers from the consumers, making the net subsidies toproducers much lower. In 1996, the implicit tax paid by farmers as consumers amounted to US$2.1 billion, thereby lowering the net subsidy to US $6.7 billion. This implies that non-agricultural producers have paid US $7.0 billion in order to transfer US $6.7 billion toagricultural producers. In other words, non-agricultural producers were directly or indirectlytaxed US $1.05 to pay US $1 to farmers in 1996. The net transfer efficiencies over the last fouryears averaged 1.21 per year, as compared to the average OECD-country average of 1.3 over thesame period.
Table 5.12 presents the relative magnitudes of total gross transfers to agriculture. Totaltransfers in Turkey, where the agricultural sector is a significant component of economic activity,constitute nearly 5 percent of GDP as compared to 1.5 percent in OECD countries that haverelatively smaller agricultural sectors. Total transfers per capita amounted to US $145 in 1996, orapproximately 5 percent of the per capita income in Turkey. Given that contributions from thenon-agricultural sector constitute about 85 percent of total transfers, that the non-agriculturalhouseholds constitute two-thirds of the total, and that non-farm per capita income is about US
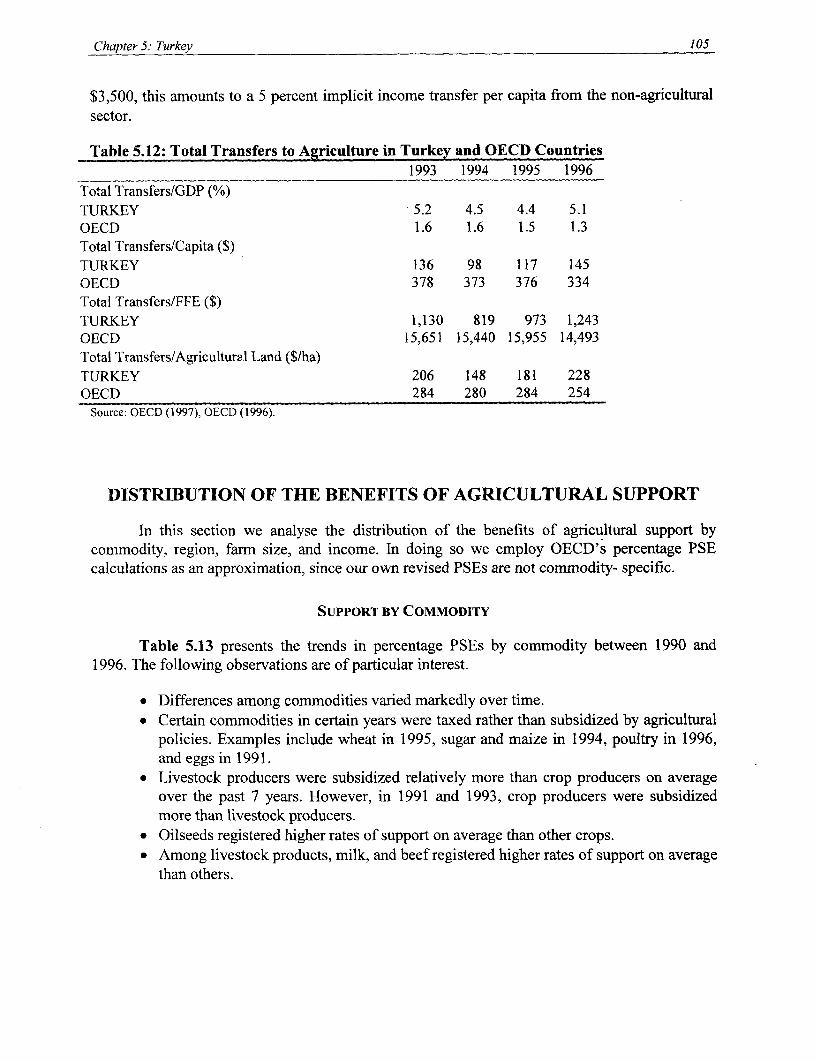
Chapter 5: Turkey 105
$3,500, this amounts to a 5 percent implicit income transfer per capita from the non-agriculturalsector.
Table 5.12: Total Transfers to Agriculture in Turkey and OECD Countries1993 1994 1995 1996
Total Transfers/GDP (%)TURKEY 5.2 4.5 4.4 5.1OECD 1.6 1.6 1.5 1.3Total Transfers/Capita ($)TURKEY 136 98 117 145OECD 378 373 376 334Total Transfers/FFE ($)TURKEY 1,130 819 973 1,243OECD 15,651 15,440 15,955 14,493Total Transfers/Agricultural Land ($/ha)TURKEY 206 148 181 228
OECD ~~~~~~~284 280 284 254Source: OECD (1997), OECD (1996).
DISTRIBUTION OF THE BENEFITS OF AGRICULTURAL SUPPORT
In this section we analyse the distribution of the benefits of agricultural support bycommodity, region, farm size, and income. In doing so we employ OECD's percentage PSEcalculations as an approximation, since our own revised PSEs are not commodity- specific.
SUPPORT BY COMMODITY
Table 5.13 presents the trends in percentage PSEs by commodity between 1990 and1996. The following observations are of particular interest.
* Differences among commodities varied markedly over time.* Certain commodities in certain years were taxed rather than subsidized by agricultural
policies. Examples include wheat in 1995, sugar and maize in 1994, poultry in 1996,and eggs in 1991.
. Livestock producers were subsidized relatively more than crop producers on averageover the past 7 years. However, in 1991 and 1993, crop producers were subsidizedmore than livestock producers.
* Oilseeds registered higher rates of support on average than other crops.* Among livestock products, milk, and beef registered higher rates of support on average
than others.
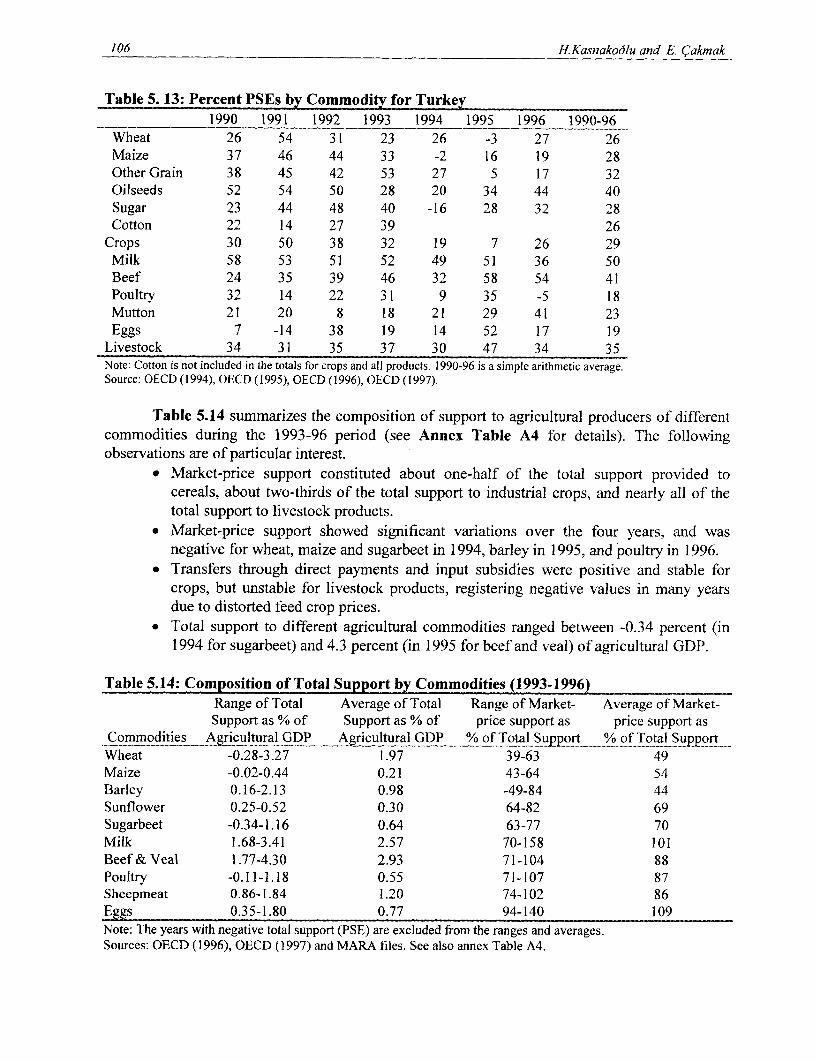
106 H.KasnakoeJlu and E. Cakmak
Table 5. 13: Percent PSEs by Commodi for Turkey1990 1991 1992 1993 1994 1995 1996 1990-96
Wheat 26 54 31 23 26 -3 27 26Maize 37 46 44 33 -2 16 19 28Other Grain 38 45 42 53 27 5 17 32Oilseeds 52 54 50 28 20 34 44 40Sugar 23 44 48 40 -16 28 32 28Cotton 22 14 27 39 26
Crops 30 50 38 32 19 7 26 29Milk 58 53 51 52 49 51 36 50Beef 24 35 39 46 32 58 54 41Poultry 32 14 22 31 9 35 -5 18Mutton 21 20 8 18 21 29 41 23Eggs 7 -14 38 19 14 52 17 19
Livestock 34 31 35 37 30 47 34 35Note: Cotton is not included in the totals for crops and all products. 1990-96 is a simple arithmetic average.Source: OECD (1994), OECD (1995), OECD (1996), OECD (1997).
Table 5.14 summarizes the composition of support to agricultural producers of differentcommodities during the 1993-96 period (see Annex Table A4 for details). The followingobservations are of particular interest.
* Market-price support constituted about one-half of the total support provided tocereals, about two-thirds of the total support to industrial crops, and nearly all of thetotal support to livestock products.
* Market-price support showed significant variations over the four years, and wasnegative for wheat, maize and sugarbeet in 1994, barley in 1995, and poultry in 1996.
- Transfers through direct payments and input subsidies were positive and stable forcrops, but unstable for livestock products, registering negative values in many yearsdue to distorted feed crop prices.
* Total support to different agricultural commodities ranged between -0.34 percent (in1994 for sugarbeet) and 4.3 percent (in 1995 for beef and veal) of agricultural GDP.
Table 5.14: Composition of Total Support by Commodities (1993-1996)Range of Total Average of Total Range of Market- Average of Market-Support as % of Support as % of price support as price support as
Commodities Agricultural GDP Agricultural GDP % of Total Support _% of Total SupportWheat -0.28-3.27 1.97 39-63 49Maize -0.02-0.44 0.21 43-64 54Barley 0.16-2.13 0.98 -49-84 44Sunflower 0.25-0.52 0.30 64-82 69Sugarbeet -0.34-1.16 0.64 63-77 70Milk 1.68-3.41 2.57 70-158 101Beef & Veal 1.77-4.30 2.93 71-104 88Poultry -0.11-1.18 0.55 71-107 87Sheepmeat 0.86-1.84 1.20 74-102 86Eggs 0.35-1.80 0.77 94-140 109Note: The years with negative total support (PSE) are excluded from the ranges and averages.Sources: OECD (1996), OECD (1997) and MARA files. See also annex Table A4.

Chapter 5: Turkey 107
We can therefore conclude that the distribution of agricultural support between theproducers of different agricultural commodities was neither stable nor equal over the past sevenyears. The support had distributional effects on the relative incomes of farmers that variedaccording to the production activities in which the farmner was engaged.
SUPPORT BY REGION
The regional distribution of agricultural subsidies depends on the distribution ofagricultural production value in the region (see Table 2.15), the commodity composition of eachregion's agricultural production value (see Table 2.16), each region's subsidized input-useintensity (see Table 2.17), the composition of a region's agricultural support by commodity, andthe input subsidies it receives. Since the percentage PSEs calculated by OECD. cover only alimited number of commodities, we must extrapolate from those estimates in order to arrive atthe magnitude of total PSE. For this analysis, we assume that the percentage PSEs are ranked,from the highest to the lowest, as follows: milk, beef and veal, oilseeds, industrial crops, cerealsand pulses, mutton, poultry and eggs, fruits, vegetables.
Based on the information provided in Tables 5.10 - 5.17, we can make the followingobservations regarding the regional distribution of agricultural support.
. The western and southern coastal regions, which are also the (relatively) higher-income regions in Turkey, account for about 50 percent of the value of agriculturalproduction, and hence receive about 50 percent of the subsidies.
* The eastern and southeastern Anatolian regions, which are the (relatively) lower-income regions in Turkey, account for less than 20% of the value of production, andreceive about 20 percent of the subsidies. These regions benefit from relatively highersubsidies for livestock products due to their specialization in livestock activities, butcentral Anatolia (with a herd composition favoring cattle) and the Aegean and Thraceregions (specialized in processing of animal products, especially milk) also share thisadvantage.
* The central Anatolian regions receive slightly over 25 percent of the total agriculturalsubsidies.
* The Aegean, Thrace and Mediterranean regions account for 35 percent of thecultivated land but nearly 45% of the irrigated land, and more importantly, over one-half of the land irrigated from dams and artificial lakes (hence, they benefit more fromsubsidised water). Similarly, these high-income regions own about one-half of theagricultural machinery, and use fertilizers and pesticides more intensively, hence theybenefit more from the related input subsidies of fuel, electricity, and credit. Althoughthey own only one-third of the livestock, these regions own more than half of thehighly subsidized culture breed cattle, and are more likely to benefit from agriculturalsupport in general, due to the fact that about 80 percent of the cooperatives that carryout agricultural policies are based in these regions.
We can conclude that the market price component of agricultural support policies did notsignificantly alter the relative regional distribution of income (according to their Gini

108 H.Kasnakodlu and E. Cakmak
coefficients) due to product differentials among regions. It is clear, however, that this componentof agricultural support policies has contributed significantly to the widening of absolute incomedifferentials among the regions of Turkey, since most of the benefits went to the higher-incomeregions. As far as the input cost-reducing component is concerned, we can conclude thatagricultural policies have contributed to the widening of relative as well as absolute incomeinequality, as the higher-income regions use subsidized inputs relatively more intensively thanthe lower-income regions.
Table 5.15: Regional Distribution of Agricultural Production Value percenTurkey Aegean and Mediter- Central Black Sea East and
Commodities Thrace ranean Anatolia SoutheastCrops 100 32 21 24 8 14Field Crops 100 24 15 33 9 20Fruits 100 39 25 16 9 11Vegetables 100 38 28 18 8 9
Live Animals 100 19 11 31 9 31Cattle 100 20 9 29 13 29Sheep and Goats 100 14 12 26 4 44Poultry 100 22 14 51 5 7
Animal Products 100 26 11 24 14 25Total 100 29 19 26 9 18Source: SIS (1995)
Table 5.16: Cornposition of Agricultural Production Value by Region (ercent)Turkey Aegean and Mediter- Central Black Sea East and
Commodities Thrace ranean Anatolia SoutheastCrops 57 67 72 55 79 39Field Crops 28 23 26 36 77 26Fruits 14 21 20 9 84 7Vegetables 16 22 26 11 78 6
Live Animals 30 21 19 33 32 44Cattle 19 14 11 21 31 26Sheep and Goats 8 5 6 8 35 17Poultry 2 2 2 4 59 1
Animal Products 13 13 9 11 24 17Total 100 100 100 100 100 100Source: SIS (1995)

Chapter 5: Turkey 109
Table 5.17: Selected Resional Indicators% of % of Total % of % of % of % of Sett. % of % of
Regions Farmers Cultivated Irrigated Irfigation Tractors Using Chem Settlements CultureArea Cult. from Fertilizer with Co-op Cattle
Area DamsNorth Central 11.9 17.1 10.5 9.3 18.2 99.0 21.1 15.2Aegean 19.6 13.9 18.1 16.8 21.6 98.7 29.7 32.7Thrace 8.3 8.9 6.2 6.9 15.7 98.8 29.8 14.4Mediterranean 11.7 11.7 19.0 31.7 10.7 98.5 20.6 5.8North East 5.9 4.6 7.1 4.6 2.3 77.6 7.9 4.6Southeast 9.0 14.0 8.8 5.0 3.4 76.7 1.7 1.8Black Sea 15.7 8.1 3.7 1.7 7.3 98.0 19.6 8.8East Central 7.8 7.7 10.3 10.4 7.1 95.2 8.8 7.0South Central 10.2 14.0 16.3 13.7 13.6 98.4 27.1 9.7Turkey 100.0 100.0 100.0 100.0 100.0 93.6 18.0 100.0Source: SIS (1992)
SUPPORT By LAND SIZE
In this section we examine the distribution of the benefits of agricultural support policiesto different income groups in agriculture. Although the data available do not permit acomprehensive treatmnent of this subject, we can obtain some clues about these indicators bylooking at some of the evidence available from the last 1991 Agricultural Census.
First of all, we take the farm size distribution as an approximation of income distributionin agriculture. Table 5.18 presents the distribution of agricultural land and livestock owned byfarm size. In Turkey, the mode farm size is 2-5 hectares, and nearly 70 percent of the agriculturalholdings are less than 5 hectares. Land and livestock owned are also distributed unequally. Smallfarmns (less than 5 ha.) comprise 70 percent of the farms, accounting for a little over 20 percent ofthe land, less than 45 percent of the sheep, and little over 50 percent of the cattle. The largerfarms (5 or more hectares) constitute 5 percent of the holdings, 35 percent of the land, 17 percentof the sheep, and 10 percent of the cattle.

110 H. Kasnako6lu and E. Cakmak
Table 5.18: Land and Livestock Distribution by Farm Size (1991)Farm Size Number of Land Owned Sheep Stock Cattle Stock
Ho_i ngso
ha ('000) % (mill.ha.) % ('000) % ('000) %Landless 101.6 2.5 0.0 2,254.8 4.5 298.2 2.6
< 0.5 251.7 6.2 0.07 0.3 1,425.2 2.8 331.4 2.90.5 - 0.9 381.3 9.4 0.25 1.1 1,728.8 3.4 628.2 5.61.0- 1.9 752.2 18.5 1.00 4.3 4,607.5 9.2 1,512.6 13.42.0 - 4.9 1274.6 31.3 3.87 16.5 12,224.6 24.4 3,454.3 30.55.0 - 9.9 713.1 17.5 4.68 20.0 11,298.4 22.5 2,481.4 21.9
10.0 - 19.9 383.3 9.4 4.92 21.0 8,037.8 16.0 1,516.4 13.420.0 - 49.9 173.8 4.3 4.65 19.8 5,835.9 11.6 845.8 7.550.0 - 99.9 24.2 0.6 1.50 6.4 1,444.9 2.9 153.4 1.4
100.0 - 249.9 10.3 0.3 1.39 5.9 1,043.7 2.1 56.8 0.5250.0 - 499.9 1.9 0.1 0.65 2.8 177.9 0.4 32.1 0.3
500.0 + 0.4 neg. 0.48 2.1 131.8 0.3 14.9 0.1Total 4,068.40 100.0 23.45 100.0 50,211.3 100.0 11,320.4 100.0Source: SIS (1994).
We have seen the unequal distribution of land, but how is the quality of the landdistributed among farrners? Table 5.19 presents the distribution of rainfed land and irrigated landby farm size. Sixty-seven percent of the farmers, specifically those who own less than 5 hectaresof land, cultivate only 22 percent of the rainfed land and 30 percent of the irrigated land. The onepercent of the farmers who own more than 50 hectares of land cultivate more than 15 percent ofrainfed land, and nearly 15 percent of the irrigated land. The share of irrigated land in total areasown decreases with farm size, due to the fact that irrigation on small farms is generally confinedto small vegetable gardens. Larger landholdings tend to be irrigated by dams and artificial lakesconstructed and subsidized by government, whereas smaller lands are more likely to be irrigatedfrom wells constructed at the farmer's expense.
Table 5.19: Distribution of Total and Irrigated Area by Farm Size (1991)Farm Size Number of Cultivated Land Irrigated Irrigated/
Holdings Land Sown Areaha ('000) % ('000 ha) % ('000 ha) %
< 0.5 251.7 6.4 62.57 0.3 267.4 0.9 0.430.5 - 0.9 381.3 9.6 231.1.3 1.1 650.7 2.1 0.281.0- 1.9 752.2 19.0 917.15 4.3 1939.2 6.3 0.212.0 - 4.9 1274.6 32.1 3,492.99 16.3 6265.5 20.3 0.185.0 - 9.9 713.1 18.0 4,246.56 19.8 6356.9 20.6 0.15
10.0- 19.9 383.3 9.7 4,549.25 21.2 6375.9 20.6 0.1420.0 - 49.9 173.8 4.4 4,338.32 20.2 5052 16.3 0.1250.0 - 99.9 24.2 0.6 1,392.32 6.5 1585.9 5.1 0.11
100.0 - 249.9 10.3 0.3 1,207.97 5.6 1617.4 5.2 0.13250.0 - 499.9 1.9 0.1 617.69 2.9 464.6 1.5 0.08
500.0 + 0.4 neg. 393.53 1.8 359.7 1.2 0.09Total 3,966.8 100.0 21,449.48 100.0 30935.4 100.0 0.14Source: SIS (1994).

Chapter 5: Turkey 111
Table 5.20 presents the yields for selected field crops by farm size. We observe thatbarley, maize, and sunflower yields increase significantly with farm size, whereas wheat,chickpea, lentil and potato yields increase by farm size up to 50 hectares and then decrease.
Table 5.20: Yields of Selected Crops by Farm Size in Turkey (1991)Farm Size Wheat Barley Maize Chickpea Green Lentil Sunflower Potato
Ha Kg/ha Kg/ha Kg/ha Kg/ha Kg/ha Kg/ha Kg/ha< 0.5 213 185 244 94 77 161 1370
0.5 - 0.9 208 180 251 102 172 14401.0- 1.9 209 190 242 118 89 170 16572.0 - 4.9 218 198 270 113 99 132 19785.0 - 9.9 226 201 287 107 99 132 2060
10.0- 19.9 232 214 311 105 101 130 299420.0 - 49.9 227 213 426 107 87 132 247050.0 - 99.9 222 200 617 85 93 140 1994
100.0 - 249.9 211 211 970 82 98 151 713250.0 - 499.9 188 244 797 97 93 136 800
500.0 + 252 267 497 118 98 139 1000Total 224 211 305 105 95 133 2193Source: SIS (1994).
Tables 5.21 - 5.23 present the use of subsidized inputs by farm size. Unfortunately, theinformation provided in these tables only differentiates between farmers using these inputs andthose which are not using them, and not by farm size. Except in the case of chickpeas, we can saythat the percentage of farmers not using chemical fertilizers is larger for smaller farm sizes thanfor larger farm sizes, but the differences are not great. The picture is similar for pesticides,insecticides, and herbicides. Farms with less than 5 hectares of land (nearly 70% of the farms)own 35 percent of the tractors, 8 percent of the harvesters, and 47 percent of the water pumps, allof which imply additional subsidies in the form of electricity, fuel, and credit.
In summary, we have seen that a large number of farmers own and cultivate a smallportion of the land, and that the quality of land owned by small farms is poorer than the quality oflarger farms, since larger farms cultivate a higher proportion of irrigated land. Furthermore, theyields on larger farms are higher than on smaller farms, at least in part because the larger farmsbenefit more from input subsidies than the smaller farms. These findings imply that the largerfarms produce most of the value of production and hence receive most of the benefits of market-price supports. Therefore, agricultural policies are likely to have contributed to income inequalityand to the widening of absolute income differentials in the rural sector.
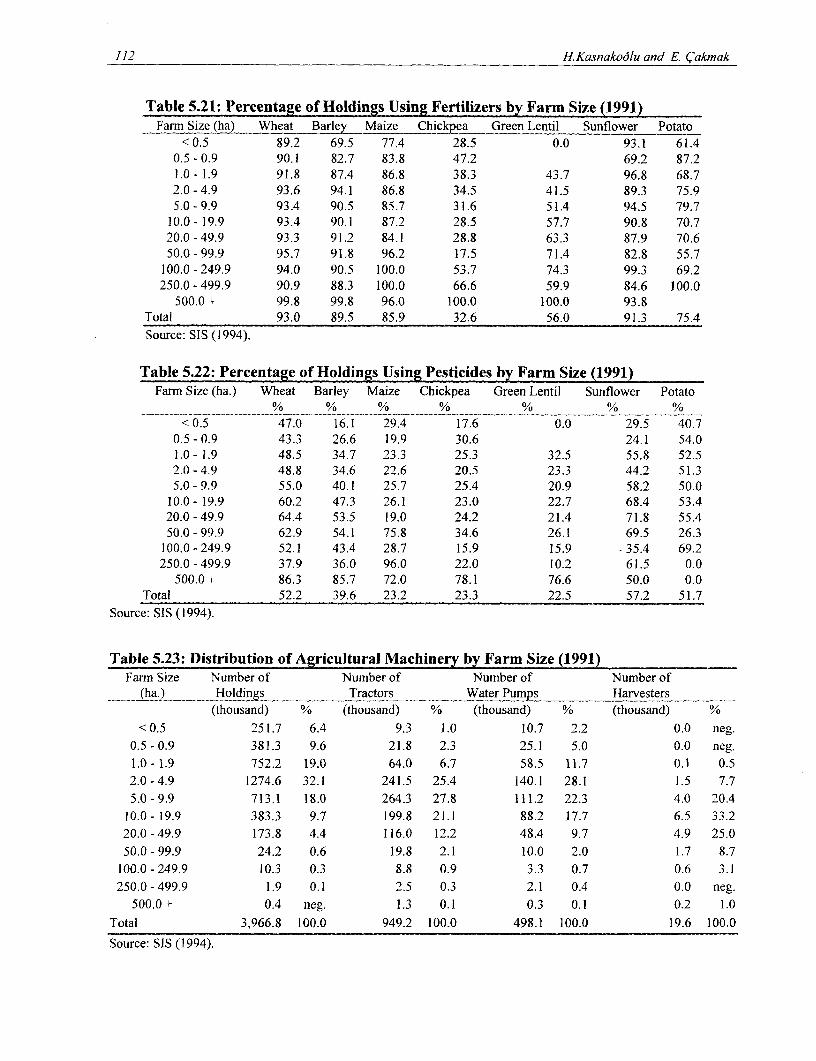
112 H.Kasnakodlu and E. (7akmak
Table 5.21: Percentage of Holdings Using Fertilizers by Farm Size (1991)Farm Size (ha) Wheat Barley Maize Chickpea Green Lentil Sunflower Potato
< 0.5 89.2 69.5 77.4 28.5 0.0 93.1 61.40.5 - 0.9 90.1 82.7 83.8 47.2 69.2 87.21.0 - 1.9 91.8 87.4 86.8 38.3 43.7 96.8 68.72.0 -4.9 93.6 94.1 86.8 34.5 41.5 89.3 75.95.0 -9.9 93.4 90.5 85.7 31.6 51.4 94.5 79.7
10.0 - 19.9 93.4 90.1 87.2 28.5 57.7 90.8 70.720.0 -49.9 93.3 91.2 84.1 28.8 63.3 87.9 70.650.0 -99.9 95.7 91.8 96.2 17.5 71.4 82.8 55.7
100.0 - 249.9 94.0 90.5 100.0 53.7 74.3 99.3 69.2250.0 -499.9 90.9 88.3 100.0 66.6 59.9 84.6 100.0
500.0 + 99.8 99.8 96.0 100.0 100.0 93.8Total ~~93.0 89.5 85.9 32.6 56.0 91.3 75.4
Source: 515 (1994).
Table 5.22: Percentage of Holdings Using Pesticides by Farm Size (1991)Fanm Size (ha.) Wheat Barley Maize Chickpea Green Lentil Sunflower Potato
< 0.5 47.0 16.1 29.4 17.6 0.0 29.5 40.70.5 -0.9 43.3 ) 26.6 19.9 30.6 24.1 54.01.0 - 1.9 48.5 34.7 23.3 25.3 32.5 55.8 52.52.0 -4.9 48.8 34.6 22.6 20.5 23.3 44.2 51.35.0 - 9.9 55.0 40.1 25.7 25.4 20.9 58.2 50.0
10.0 - 19.9 60.2 47.3 26.1 23.0 22.7 68.4 53.420.0 -49.9 64.4 53.5 19.0 24.2 21.4 71.8 55.450.0 - 99.9 62.9 54.1 75.8 34.6 26.1 69.5 26.3
100.0 -249.9 52.1 43.4 28.7 15.9 15.9 - 35.4 69.2250.0 -499.9 37.9 36.0 96.0 22.0 10.2 61.5 0.0
500.0 + 86.3 85.7 72.0 78.1 76.6 50.0 0.0Total 52.2 39.6 23.2 23.3 22.5 57.2 51.7
Source: SIS (1 994).
Table 5.23: Distribution of Agricultural Machinery by Farm Size (1991)Farm Size Number of Number of Number of Number of
(ha.) Holdings Tractors Water Pup Harvesters
(thousand) % (thousand) % (thousand) % (thousand) < 0.5 251.7 6.4 9.3 1.0 10.7 2.2 0.0 neg.
0.5 - 0.9 381.3 9.6 21.8 2.3 25.1 5.0 0.0 neg.1.0 - 1.9 752.2 19.0 64.0 6.7 58.5 11.7 0.1 0.52.0 -4.9 1274.6 32.1 241.5 25.4 140.1 28.1 1.5 7.75.0 -9.9 713.1 18.0 264.3 27.8 111.2 22.3 4.0 20.4
10.0 - 19.9 '383.3 9.7 199.8 21.1 88.2 17.7 6.5 33.220.0 - 49.9 173.8 4.4 116.0 12.2 48.4 9.7 4.9 25.050.0 -99.9 24.2 0.6 19.8 2.1 10.0 2.0 1.7 8.7
100.0 -249.9 10.3 0.3 8.8 0.9 3.3 0.7 0.6 3.1250.0 -499.9 1.9 0.1 2.5 0.3 2.1 0.4 0.0 neg.
500.0 + 0.4 neg. 1.3 0.1 0.3 0.1 0.2 1.0Total 3,966.8 100.0 949.2 100.0 498.1 100.0 19.6 100.0
Source: SIS (1994).

Chapter 5: Turkey 113
DISTRIBUTION OF THE BURDEN OF AGRICULTURAL SUPPORT
In this section we examine the distribution of the burden of agricultural support byincome groups. In previous sections, we separated taxpayer and consumer transfers toagriculture. We observed that almost all of the transfers from taxpayers come from the non-agricultural urban consumers, but that transfers from consumers are divided between urban andrural consumers. Agricultural producers, as consumers, actually paid about one-third of theagricultural support they received.
It is very difficult to know how transfers from taxpayers are distributed to differentincome groups in Turkey, as only a limited number of studies exist on the burden of differenttypes of taxes by income groups and the types of taxes imposed to finance agricultural transfers.In this respect we can only point out that the tax system in Turkey is believed to be veryinefficient, limited in its coverage, full of leakages, and critically dependent on indirect taxes andincome taxes collected from fixed- income wage and salary earners. Various estimates show thatthe size of the untaxed and unrecorded economy in Turkey equals anywhere between 30 to 50percent of total GNP. It is therefore not unrealistic to expect that the transfers to agriculture fromtaxpayers place a relatively greater burden on middle- and lower-income groups than the higher-income groups.
Concerning the distribution of the burden of transfers from consumers, we can say a littlebit more. Table 5.24 shows the shares of expenditures by income level on food, beverages, andtobacco, and on clothing and footwear. These comprise the categories of transfers from Turkishconsumers out of total consumption expenditures.
Total agro-based expenditures on average constitute 45 percent of the total consumptionexpenditures in Turkey, 40 percent of consumption expenditures in the urban areas, and 52percent of the total consumption expenditures in the rural areas. The share of agro-basedexpenditures decreases by income for urban and rural consumers alike. In the lowest incomegroup, agro-based expenditures constitute 58 percent of total expenditures, although this variesmarkedly between urban (53 percent) and rural (62 percent) consumers.
Table 5.24: Shares of Agro-based Expenditure by Income Quintile (%)TURKEY Total Lowest Income Quintile 2nd Quintile 3rd Quintile 4th Quintile Highest Income
................ . ........ ........... .... .......... _._ . ..-QuintileFood-Beverage-Tobacco 0.36 0.51 0.47 0.42 0.37 0.26
Clothing-Footwear 0.09 0.07 0.08 0.09 0.10 0.09
Total Agro-Based Expen. 0.45 0.58 0.55 0.51 0.46 0.35
URBANFood-Beverage-Tobacco 0.31 0.45 0.41 0.36 0.32 0.22
Clothing-Footwear 0.09 0.08 0.09 0.09 0.10 0.09
Total Agro-Based Expen. 0.40 0.53 0.49 0.45 0.42 0.31
RURALFood-Beverage-Tobacco 0.45 0.56 0.52 0.51 0.47 0.36
Clothing-Footwear 0.09 0.06 0.07 0.08 0.09 0.10
Total Agro-Based Expen. 0.54 0.62 0.60 0.60 0.56 0.46
Source: SIS (1997a).

114 H.Kasnakodlu and E. Qakmak
On the basis of the observations above and the fact that lower-income groups have alower average propensity to save from income, we can conclude that the lower-income groupspay a relatively higher portion of their incomes as transfers to agriculture than the higher incomegroups and thus the relative negative real-income effects of agricultural support on lower-incomegroups are greater.
REFERENCES
Organization for Economic Cooperation and Development. 1994. National Policies andAgricultural Trade-Country Study. Turkey, Paris.
.1995. Agricultural Policies, Markets and Trade in OECD Countries, Paris..1 996. Agricultural Policies, Markets and Trade in OECD Countries, Paris.. 1997. Agricultural Policies, Markets and Trade in OECD Countries, Paris.
SIS. 1992. 1991 General Agricultural Census. Results of Village Information Survey,Ankara.
1 1994. 1991 General Agricultural Census: Results of the Agricultural Holdings, Ankara.. 1995. 1993 Agricultural Products (Quantity, Price Value), Ankara.. 1997b. 1995 Agricultural Structure (Production, Price, Value), Ankara.. 1 997a. Household Consumption Expenditures Survey Results 1994, Ankara.

Chapter 5: Turkey 115
CHAPTER FIVE ANNEX
Table 1: Payments to Agricultural Support (TL billion)1993 1994 1995 1996 1997
Budgetary Expenditures for Agricultural 8011 2433 3330 5650 28830SOEs
Duty Loss 4861 0 0 3150 0Equity Injection 3150 2433 3330 2500 28830
Compensation payments 0 4426 4997 12524 23828Tobacco (quota) 4028 2947 4500 2800Tea (pruning project) 398 2050 8024 21028
Support Purchases 30920 36842 46544 89981 380088Cereals by TMO 8231 7801 2370 29500 188241Tobacco by TEKEL 6441 9395 7026 6324 23847Sugar beet by TSFAS 16248 19466 37148 54157 168000
Input subsidy payments (from budget) 3456 8771 12264 52575 99750Fertilizer 3311 7923 9231 44983 84733Agricultural Pesticide & Medicaments 105 177 1138 2573 5633Seeds and plant 35 62 70 194 874Milk premium 96 609 1824 4825 8510
Livestock incentive payments (from 457 883 584 118 1658abudget)
Meat premium 0 129 146 0 12Animal husbandry based on projects 99 590 205 46 59Artificial insemination 0.145 0.006 0.003 0 0Contractual animal husbandry 348 78 0 0 0Imported breeding stock 2 60 215 40 1546Certified animal husbandry 9 26 18 32 40
Total Payments to Agricultural Sector 42934 53355 67718 160848 534153
Share in GNP (%) 2.2 1.4 0.9 1.1 1.8
Agricultural Credits 23100 39330 108020 281499 590570Farmers 12612 19605 57772 148174 266570Agricultural Credit Cooperatives Union 10488 19725 47521 91107 200000From SPSF (from budget-credit - - 2727 42218 124000
repayments)a/ Actual January-SeptemberSource: Undersecretariat of Treasury

116 H.Kasnakodlu and E. Cakmak
Table 2: Budgets of MARA and GDRS (TL million)Investments
Year Current Internal External Transfers Total
1990 601675 182014 27048 32266 8433631991 1231250 282470 47280 545700 21067001992 2694000 417046 62054 90651 32637511993 3950500 693000 125400 144746 49136461994 7450000 814800 441800 204492 89110921995 10606000 1762230 422370 402102 131927021996 17380300 4082965 545035 916502 229248021997 33391000 7158989 1093311 2159102 438024021998 70249000 9491000 270000 2423603 82433603Source: MARA
Table 3: Agricultural Credits by the Turkish Agricultural Bank (TL million)Type, 1994 1995 1996
Crop production C 7848 18913 41864Livestock production L 8141 28817 77780Fertilizer C 1650 4601 10125Agricultural equipment C 1771 4846 16687Aquaculture L 135 531 1672Agricultural Credit Cooperatives 19725 47522 91107
Crop C 7306 17306 30290Livestock L 4041 9940 19246Fertilizer C 6419 15393 31781Equipment C 1959 4883 9790
Agricultural Sales Cooperatives 59579 141166 40301State Owned Enterprisesb 24345 86560 404345Agro-Industry 63 66 46Total 123257 333022 683927Total Crop (C) 26593 65942 140537Total Livestock (L) 12317 39288 98698Notes: a C = Crop, L=Livestock
b Credits to TIGEM, TEKEL, TSFAS etc. at the commercial rates.Source: Turkish Agricultural Bank.
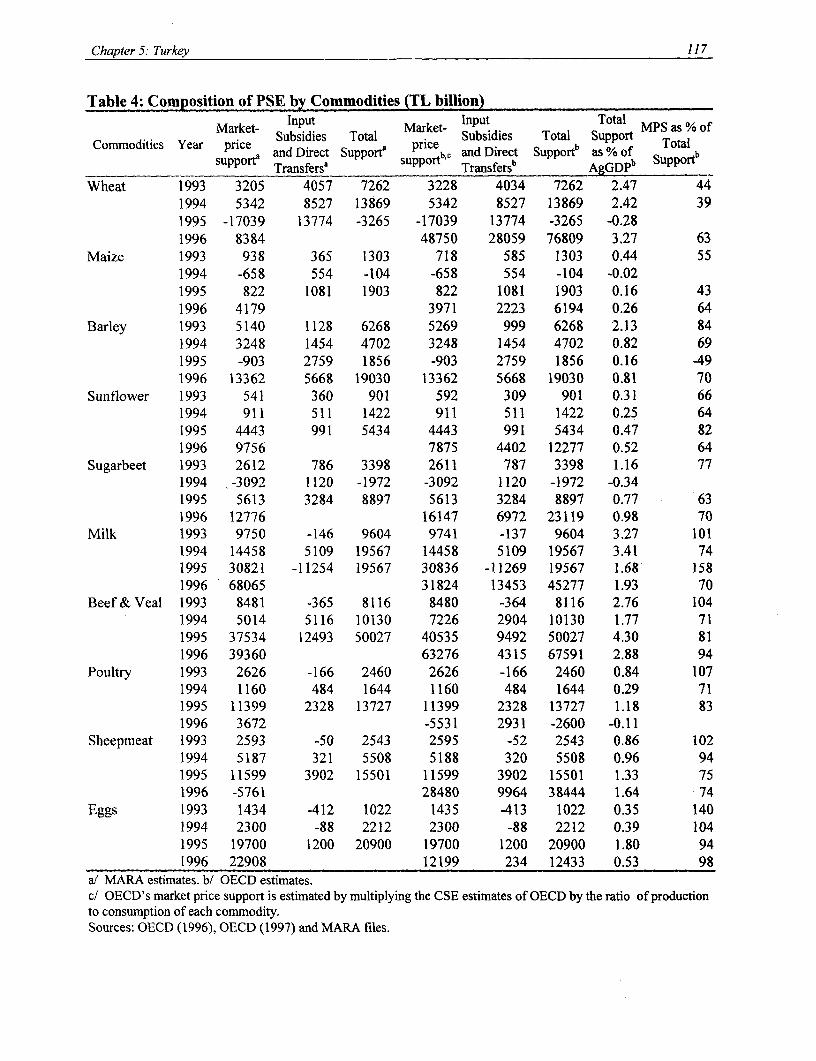
Chapter 5: Turkey 117
Table 4: Composition of PSE by Commodities (TL billion)
Market- Input Market- Input Total MPS as % ofCommodities Year price Subsidies Total price Subsidies Total Support Total
supporti and Direct Support' P c and Direct Support" as % of otb_.__._______Transfers' Transfer AgGDe
Wheat 1993 3205 4057 7262 3228 4034 7262 2.47 441994 5342 8527 13869 5342 8527 13869 2.42 391995 -17039 13774 -3265 -17039 13774 -3265 -0.281996 8384 48750 28059 76809 3.27 63
Maize 1993 938 365 1303 718 585 1303 0.44 551994 -658 554 -104 -658 554 -104 -0.021995 822 1081 1903 822 1081 1903 0.16 431996 4179 3971 2223 6194 0.26 64
Barley 1993 5140 1128 6268 5269 999 6268 2.13 841994 3248 1454 4702 3248 1454 4702 0.82 691995 -903 2759 1856 -903 2759 1856 0.16 -491996 13362 5668 19030 13362 5668 19030 0.81 70
Sunflower 1993 541 360 901 592 309 901 0.31 661994 911 511 1422 911 511 1422 0.25 641995 4443 991 5434 4443 991 5434 0.47 821996 9756 7875 4402 12277 0.52 64
Sugarbeet 1993 2612 786 3398 2611 787 3398 1.16 771994 -3092 1120 -1972 -3092 1120 -1972 -0.341995 5613 3284 8897 5613 3284 8897 0.77 631996 12776 16147 6972 23119 0.98 70
Milk 1993 9750 -146 9604 9741 -137 9604 3.27 1011994 14458 5109 19567 14458 5109 19567 3.41 741995 30821 -11254 19567 30836 -11269 19567 1.68 1581996 68065 31824 13453 45277 1.93 70
Beef & Veal 1993 8481 -365 8116 8480 -364 8116 2.76 1041994 5014 5116 10130 7226 2904 10130 1.77 711995 37534 12493 50027 40535 9492 50027 4.30 811996 39360 63276 4315 67591 2.88 94
Poultry 1993 2626 -166 2460 2626 -166 2460 0.84 1071994 1160 484 1644 1160 484 1644 0.29 711995 11399 2328 13727 11399 2328 13727 1.18 831996 3672 -5531 2931 -2600 -0.11
Sheepmeat 1993 2593 -50 2543 2595 -52 2543 0.86 1021994 5187 321 5508 5188 320 5508 0.96 941995 11599 3902 15501 11599 3902 15501 1.33 751996 -5761 28480 9964 38444 1.64 74
Eggs 1993 1434 -412 1022 1435 -413 1022 0.35 1401994 2300 -88 2212 2300 -88 2212 0.39 1041995 19700 1200 20900 19700 1200 20900 1.80 941996 22908 12199 234 12433 0.53 98
a/ MARA estimates. b/ OECD estimates.c/ OECD's market price support is estimated by multiplying the CSE estimates of OECD by the ratio of productionto consumption of each commodity.Sources: OECD (1996), OECD (1997) and MARA files.

118 H.Kasnako4lu and E. (7akmak
Table 5: Total Transfers Related to Agricultural Policy in Turkeyitems included
OECD revised in the PSECategory of Transfer Units 1993 1993 1993BUDGETARY EXPENDITURESExpenditure on agriculture through Ministerial budgetsMinistry of Agriculture (MARA) million TL 4878896 4913646- less general administration million TL -487890
Itemized: Current expenses million TL 3950500Investment million TL 818400Other expenses million TL 144746
revised contribution from MARA (50% of current+inv) million TL 2866023 2866023Gen. Directorate of Rural Affairs (GDRS) million TL 3777000
itemized agricultural budget: research million TL 165280 165280investment million TL 1057790 10577901/3rd of current exp. budget million TL 2082520 2082520
revised contribution from GDRS million TL 3305590 3305590State Hydraulic Works, research and extension million TL n.a. n.a. n.a.
Sub-total million TL 8168006 6171613 6171613
Projects partly financed by foreign loans that are reimbursed by the TreasuryAgricultural Extension & Applied Research Project I million US$ 8 4 4Agricultural Extension & Applied Research Project 11 million US$ 8 7 7Mus-Bingol Rural Development Project (TUGEM) million US$ I 1 1Yozgat Rural Development Project (TUGEM) million US$ 1 2 2Agricultural Research Project million US$ 7 0 0
US dollar exchange rate TLperUS$ 10964 10964 10964Sub-total million TL 274100 156577 156577
Premia and input subsidies not financed by the MARA or GDRS (funding source)Input subsidies not financed by MARA or GDRSFertilizer subsidy (SPSF) million TL 3311109 3311000 3311000Sugarbeet fertilizer subsidy (TSFAS) million TL 186940 224328 224328Hybrid seed subsidy (SPSF) million TL 44200 35000 35000Beet seed provided in kind (TSFAS) million TL 70000 146278 146278Sowing of sugarbeet: operation costs (TSFAS) million TL 65000 107206 107206Maintenance of beet cultivation equip. (TSFAS) million TL 100000 0 0Pesticides and vet. medicine subsidy (SPSF) million TL 160453 105000 105000Animal feed subsidy (SPSF) million TL 0 0Livestock capital grant (RUSF) million TL 419790 95710 95710Imported breeding stock subsidy (RUSF) million TL 13466 15977 15977Artificial insemination subsidy (SPSF) million TL 1 15 15Electricity subsidy (TEK) million TL 304782 0 0State Hydraulic Works O&M costs (Treasury) million TL 0 0 0Premia and other input subsidies not financed by MARA or GDRSPayments to compensate forgiveness of farmer debt (Treasury)Debt write-offs million TL n.a. n.a. n.a.Interest free deferrals million TL n.a. n.a. n.a.
Disaster payments for seed (tr. via Agricultural Bank) million TL 94955 80532 80532Sugarbeet pulp return (TSFAS) million TL 55000 121896 121896Deficiency payments for cotton (Agricultural Bank) million TL 6300000 6300000Direct payments for pruning tea plants (CAYKUR) million TLTobacco Premium (Agricultural. Bank) million TLMilk incentive premium (RUSF) million TL 149400 96000 96000Meat incentive premium (RUSF) million TL
Sub-total million TL 4975096 10638942 10638942General services and infrastructure provided by state-owned enterprises
Sugarbeet: Turkish Sugar Factories (TSFAS) million TL 53305 81544 81544Tobacco: State Monopoly (TEKEL) million TL 24759 37876 37876Tea: CAYKUR million TL 1473 822 822
Sub-total million TL 79537 120242 120242

Chapter 5: Turkey 119
Table 5: (continued)items included
OECD revised in the PSE
Category of Transfer Units 1993 1993 1993
Transfers to intervention agencies*Compensation for "duty losses"Grains: Soil Products Office (TMO) million TL 2420293 2424000
Sugar: Turkish Sugar Factories (TSFAS) million TL 997000 997000Tobacco: State Monopoly (TEKEL) million TL 1440000 1440000
Tea: CAYKUR million TL n.a. 0
Other crops: ASCUs million TL n.a. 0Special livestock purchase (EBK) million TL - 0
Sub-total million TL 4857293 4861000
Capital transfers ("equity injections")Soil Products Office (TMO) million TL 345750 946000
Turkish Sugar Factories (TSFAS) million TL 1591700 1591000State Monopoly (TEKEL) million TL 0 0Tea Company (CAYKUR) million TL 613100 613000
Sub-total million TL 2550550 3150000
CONCESSIONAL LOANS TO FARMERS AND ASCUSLoans by Agricultural Bank (end-year balance)Loans for crop production million TL 49036000 49036000 49036000
Commercial interest rate percent 85.0%/0 85.0% 85.0%
Actual interest rate percent 46.5% 46.5% 46.5%
Difference percent 38.5% 38.5% 38.5%Interest concession million TL 18878860 18878860 18878860
Loans for livestock production million TL 6333000 7349838 7349838
Commercial interest rate percent 85.0% 85.0% 85.0%
Actual interest rate percent 38.5% 38.5% 38.5%Difference percent 46.5% 46.5% 46.5%Interest concession million TL 2944845 3417675 3417674.67
Loans for sugarbeet production million TL 50000 77236 77236
Commercial interest rate percent 85.0% 85.0% 85.0%Actual interest rate percent 60.0% 60.0% 60.0%
Difference percent 25.0% 25.0% 25.0%
Interest concession million TL 12500 19309 19309
Sub-total million TL 21836205 22315844 22315843.67
CONCESSIONAL LOANS BY THE CENTRAL BANK*Loans to TMO million TL 6205540 6205540Commercial interest rate percent 85.0% 85.0%Actual interest rate percent 50.0% 50.0%
Difference percent 35.0% 35.0%
Interest concession million TL 2171939 2171939
Total budgetary and extra-budgetary transfers, and concessional loans million TL 44912726 49586157 39403218
US dollar exchange rate TLperUS$ 10964 10964 10964
Total budgetary transfers in US dollars million USS 4096 4523 3594
Consumer transfersTransfers from consumers (CSE) million US$ 3779Budget revenues from (implicit) import taxes million US$ 272
Share of PSE commodities in total value of production percent 39.0%Consumer transfers (all commodities) million US$ 9701Budget revenues (all commodities) million US$ 698
Total transfers million US$ 13099

Part III
Data File
Selected Tables from Own Calculations(Full database available on CD-ROM)

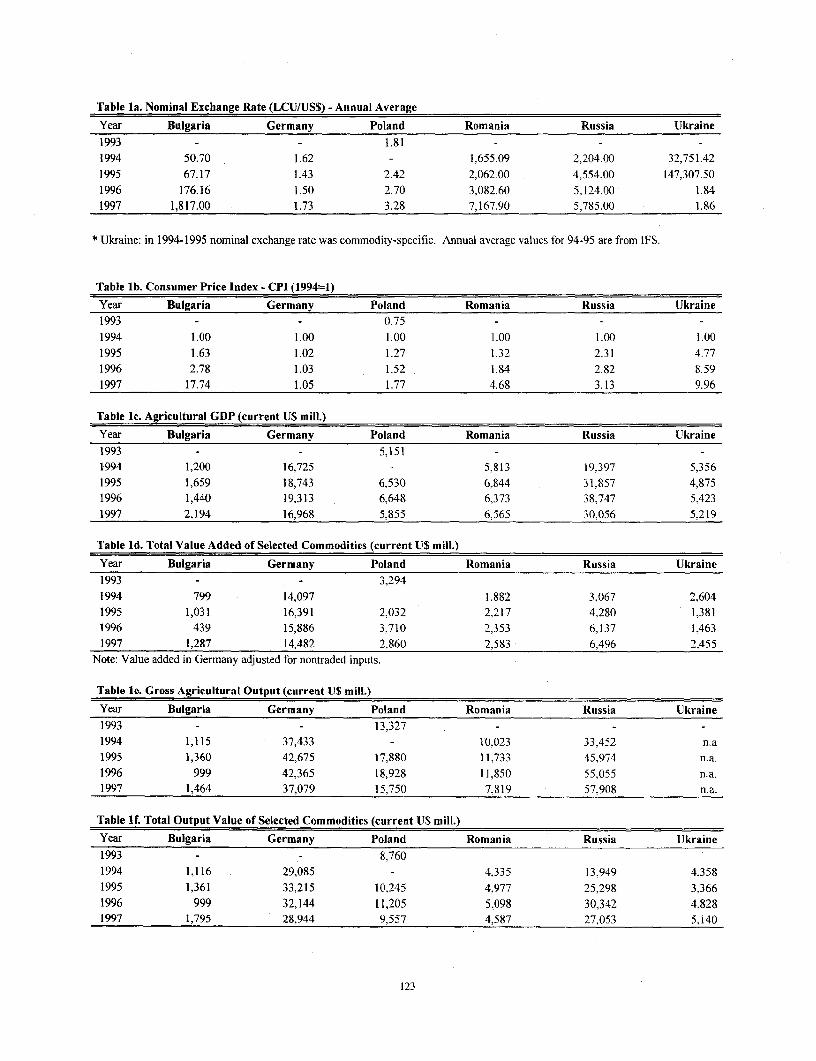
Table la. Nominal Exchange Rate (LCUIUS$) - Annual Average
Year Bulgaria Germany Poland Romania Russia Ukraine1993 - - 1.81 - - -
1994 50.70 1.62 - 1.655.09 2,204.00 32,751.421995 67.17 1.43 2.42 2,062.00 4,554.00 147,307.501996 176.16 1.50 2.70 3,082.60 5,124.00 1.841997 1,817.00 1.73 3.28 7,167.90 5,785.00 1.86
* Ukraine: in 1994-1995 nominal exchange rate was commodity-specific. Annual average values for 94-95 are from IFS.
Table lb. Consumer Price Index - CPI (1994=1)
Year Bulgaria Germany Poland Romania Russia Ukraine1993 - - 0.75 - - -
1994 1.00 1.00 1.00 1.00 1.00 1.001995 1.63 1.02 1.27 1.32 231 4.771996 2.78 1.03 1.52 1.84 2.82 8.591997 17.74 1.05 1.77 4.68 3.13 9.96
Table lc. Agricultural GDP (current US mill.)
Year Bulgaria Germany Poland Romania Russia Ukraine1993 - - 5,151 -
1994 1,200 16,725 - 5,813 19,397 5,3561995 1,659 18,743 6,530 6,844 31,857 4,8751996 1,440 19,313 6,648 6,373 38,747 5,4231997 2,194 16,968 5,855 6.565 30,056 5,219
Table Id. Total Value Added of Selected Commodities (current U$ mill.)
Year Bulgaria Germany Poland Romania Russia Ukraine1993 - - 3,294
1994 799 14.097 1.882 3.067 2.6041995 1,031 16,391 2,032 2,217 4,280 1,3811996 439 15,886 3,710 2,353 6,137 1,4631997 1,287 14,482 2,860 2,583 6,496 2,455
Note: Value added in Germany adjusted for nontraded inputs.
Table le. Gross Agricultural Output (current U$ mill.)
Year Bulgaria Germany Poland Romania Russia Ukraine1993 - - 13,327 -
1994 1,115 37,433 - 10.023 33.452 n.a1995 1,360 42,675 17,880 11,733 45,974 n.a.1996 999 42,365 18,928 11,850 55,055 n.a.1997 1,464 37,079 15,750 7,819 57.908 n.a.
Table If. Total Output Value of Selected Commodities (current U$ mill.)
Year Bulgaria Germany Poland Romania Russia Ukraine1993 - - 8,760
1994 1,116 29,085 - 4,335 13,949 4,358
1995 1,361 33,215 10,245 4.977 25.298 3.3661996 999 32,144 11,205 5.098 30,342 4,8281997 1,795 28,944 9,557 4,587 27,053 5,140
123

Table 2. Quantity Produced (ton)
Commodity Year Bulgaria Germany Poland Romania Russia Ukraine
Barley 1993 - - -
1994 - 10,902,516 - 2,133,600 27,054,000
1995 - 11,891,143 - 1,816,300 15,786,000
1996 - 12,074,050 - 1,107,500 15,933,000
1997 - 13,398,820 - 1,891,300 20,774,000 -
Maize 1993 - -
1994 1,711,000 - - 9,343,200 892,000
1995 1,817,000 - - 9,923,132 1,738,000 -
1996 1,034,000 - - 9,607,900 1,088,000 -
1997 1,696,000 - - 12,679,000 2,671,000 -
Rye 1993 - - 4,992,000 - -
1994 - 3,450,605 - - 5,989,000 -
1995 - 4,521,270 6,288,000 - 4,098,000
1996 - 4,213,855 5,653,000 - 5,934,000
1997 - 4,580,140 5,299,000 - 7,480,000
Wheat 1993 - 8,243,000 -
1994 3,896,000 16,422,407 - 6,186,500 32,129,000 13,857,000
1995 3,435,000 17,725,506 8,668,000 7,709,300 30,119,000 16,273,000
1996 1,786,000 18,875,006 8,576,000 3,164,100 34,917,000 13,547,110
1997 3,556,000 19,793,233 8,193,000 7,185,600 44,188,000 18,403,900
Potatoes 1993 - - 36,270,000 -
1994 - 9,668,572 - - 33,828,000 -
1995 - 9,897,933 24,891,000 - 39,909,000 -
1996 1 13,099,568 27,217,000 - 38,652,000
1997 - 11,659,284 20,776,000 - 37,015,000
Rapeseed 1993 - - 594,000 -
1994 - 2,736,894 - - -
1995 - 3,024,027 1,377,000
1996 1 I,835,676 449,000 - -
1997 - 2,759,916 595,000
Sunflower Seed 1993 . . -
1994 602,000 - - - 2,553,000 1,569,000
1995 767,000 - - - 4,200,000 2,289,000
1996 530,000 - - 2,765,000 2,122,980
1997 446,000 2,824,000 2,308,360
Sugar 1993 - - 15,621,000
1994 - 24,293,000 - - 13,946,000 19,612,000
1995 - 26,149,000 13,309,000 1 I9,072,000 29,650,000
1996 - 26,064,000 17,846,000 - 16,166,000 17,462,067
1997 - 25,769,000 15,886,000 - 13.841,000 13,404,822
Beef/Cattle 1993 - - 408,946
1994 185,000 1,058,406 - - 3,240,000
1995 127,000 1,053,666 373,000 2,733,000 -
1996 153,000 1,062,019 388,000 - 2,630,000 987,479
1997 128,000 1,117,756 402,000 - 2,338,000 740,007
Pork 1993 - - 1,974,468 - -
1994 314,000 3,461,500 - 892,600 2,103,000 1,245,000
1995 388,000 3,429,600 2,008,000 897,400 1,865,000 1,163,000
1996 382,000 3,440,100 2,072,000 914,000 1,705,000 478,693
1997 339,000 3,475,000 1,895,000 925,000 1,565,000 343,515
Chicken 1993 . - - - -
1994 114,000 639,200 - 324,600
1995 128,000 663,900 - 366,800 -
1996 138,000 692,800 - 373,200 -
1997 131,000 734,000 - 231,000
Milk 1993 - - 12,635,326 - -
1994 1,162,000 25,861,000 - 5,065,800 42,176,000
1995 1,129,000 26,774,000 11,638,586 5,424,200 39,241,000 -
1996 1,126,000 26,991,000 11,692,130 5,487,400 35,819,000 15,821,200
1997 1,161,000 26,986,000 11,888,000 5,504,100 34,066,000 13,717,500
Notes: Bulgaria: Beef/Cattle figures are for veal; milk expressed in hectoliters
Romania: figures for Maize and barley are from feed maize and feed barley
Russia: pork and beef carcass weight
124

Table3 Out3 tPrices (US/ton)
Commodity Year Bulgaria Germany Poland Romania Russia Ukraine
Barley 1993 - - -
1994 - 157.10 - 96.67 49.20 -
1995 - 164.22 - 87.29 44 801996 158.91 - 129.76 110,10 -
1997 - 130.15 - 83.71 86.36
Maize 1993 - - -
1994 8418 - - 84.59 128.201995 95.51 - - 104.27 131.16 -
1996 123.81 - - 149.22 191 331997 130.10 - - 76.73 138.44 -
Rye 1993 - - 105.81 -
1994 - 159.61 - 60.53 -
1995 - 161.55 93.22 - 81.071996 - 155.95 134.25 - 135.351997 - 130.35 113.11 - 113.76 -
Wheat 1993 - - 138.33 - -
1994 65.68 165.54 - 132.92 62.54 59.331995 70.99 174.74 145.19 116.39 93.12 68.291996 130.53 173.69 212.13 145.98 136.78 91.841997 126.34 138.34 165.03 118.58 119.60 95.52
Potatoes 1993 - - 65.47 - -
1994 - - - 112.13 -
1995 - - 109.31 - 199 821996 - 86.78 - 221.45 -
1997 - - 82.62 - 176.45 -
Rapeseed 1993 - - 210.971994 - 25 1.14 - - -
1995 - 255.17 234.281996 - 264.41 222 51 - -
1997 - 249.31 263.72 - -
Sunflower Seed 1993 - -
1994 138.27 - - - 118.17 63.331995 138.04 - - - 182.21 172.101996 134.81 - - - 154.50 144.161997 168.83 - - - 135.58 132.37
Sugar 1993 - - 24.25 - -
1994 - 61 20 - - 26.48 15.871995 - 65.56 33.41 - 32.50 26.401996 - 64.49 33.75 - 38.22 46.321997 - 57.10 28.96 - 35.03 49.43
Beef/Cattle 1993 - - 1,236.59 -
1994 660.32 3,327.12 - - 663,96 -
1995 1,058.30 3,492 82 1,785.42 - 1,109.26 -
1996 599.51 2,932.77 1,604.08 - 1,433.33 452.621997 1,140.68 2,621.63 1,393.73 - 1,259.63 474.70
Pork 1993 - - 1,066.52 - -
1994 759.48 1,767.01 - 1,329.23 892.15 586.231995 990.28 2,118.91 1.065.42 1,454.90 1,429.76 591.341996 632.23 2,346.59 1,310.59 1,524.69 1,774.94 781.451997 1,631.36 2,128 01 1.363.48 1,255.60 1.790 20 954.41
Chicken 1993 - - - -
1994 696.87 1,317.19 - 1,268.811995 753.78 1,416.24 - 1,260.91 -
1996 602 60 1,369.42 - 1,362.49 - -
1997 954.40 1,236.45 - 1,255.60 -
Milk 1993 - - 126.76 - -
1994 165.75 442.70 - 181.26 149.081995 197.06 487.83 181.02 206.11 246.86 -
1996 133.57 444.11 190.29 210.86 27009 104.131997 211.54 38806 178.96 20927 256.74 126.46
125
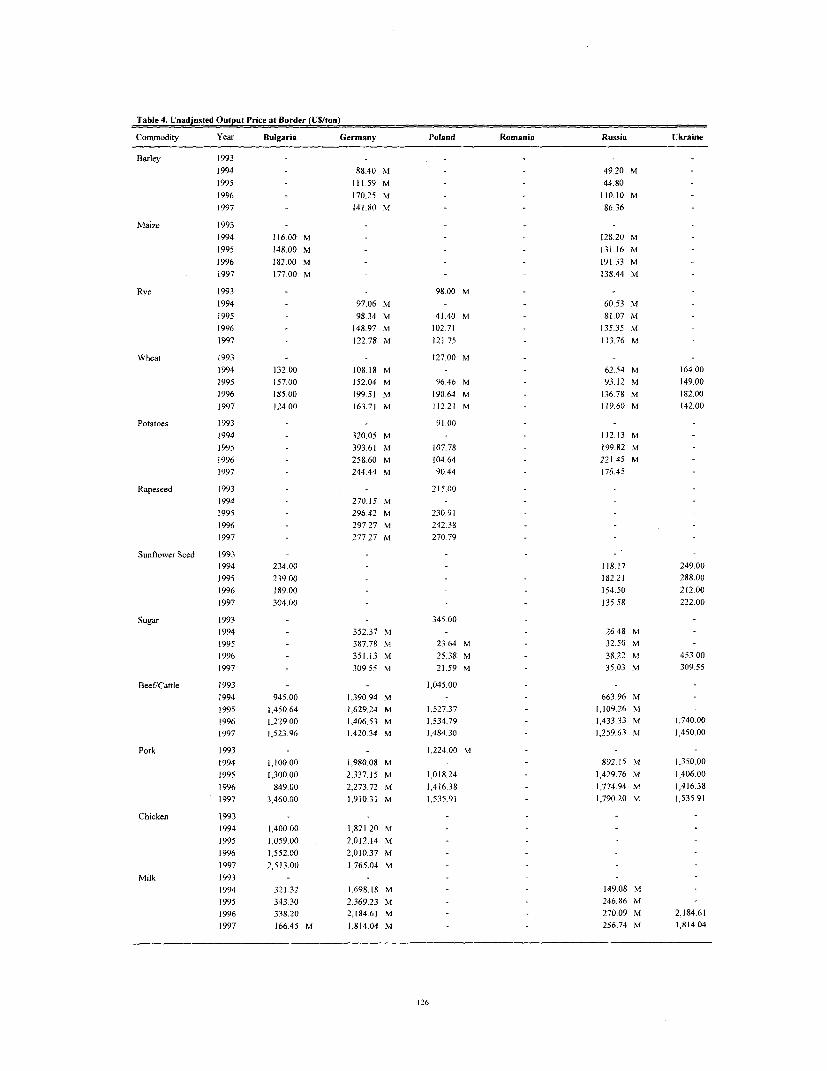
Table 4. Unadjusted Output Price at Border (US/ton)
Commodity Year Bulgaria Germany Poland Romania Russia Ukraine
Barley 1993 - -1994 - 88.40 .M - - 4920 M1995 - 111.59 M - - 44.801996 - 170.25 M - - 110.10 M -
1997 - 141.80 M - - 86.36
Maize 1993 - - -
1994 116.00 M - - 128.20 m -
1995 148.00 M - - - 131.16 M1996 182.00 M - - - 191.33 M -
1997 177.00 M - - - 138.44 M
Rye 1993 - - 98.00 M -
1994 - 97.06 M - - 60.53 M
1995 - 98.34 M 41.40 M - 81.07 M -
1996 - 148.97 Nt 102.71 - 135.35 M
1997 122.78 M 121.75 - 113.76 M -
Wheat 1993 - - 127.00 M - -1994 132.00 108.18 M - - 62.54 M 164.001995 157.00 152.04 M 96.46 m - 93.12 M 149.001996 185.00 199.51 M 190.64 M - 136.78 M 182.001997 124.00 163.71 NI 112.21 M - 119.60 M 142.00
Potatoes 1993 - - 91.00 - -1994 - 320.05 M - - 112.13 M -
1995 - 393.61 M 107.78 - 199.82 M1996 - 258.60 M 104.64 - 221.45 M -
1997 - 244.44 Nt 90.44 - 176.45
Rapeseed 1993 - - 215.00 -
1994 270.15 m - - -
1995 - 296.42 M 230.91
1996 - 297.27 M 242.38 - -
1997 - 277.27 M 270.79 -
Sunflower Seed 1993 - -
1994 234.00 - - - 118 17 249.001995 239.00 - - - 182.21 288.001996 189.00 - - - 154.50 212.001997 304.00 - - - 135.58 222.00
Sugar 1993 345.00 - -1994 352.37 NI - 26.48 M1995 - 387.78 M 23.64 M - 32.50 M -1996 351.13 M 25.38 NI - 38.22 M 453.001997 - 309.55 M 21L59 M - 35.03 M 309.55
Beef/Cattle 1993 - - 1,045.001994 945.00 1,390.94 m - - 663.96 M -
1995 1,450.64 1,629.24 M 1,527.37 - 1,109.26 M -1996 1,229.00 1,406.53 M 1,534.79 - 1,433.33 M 1,740.001997 1,523.96 1,420.34 N 1,484.30 - 1,259.63 M 1,450.00
Pork 1993 - - 1,224.00 M - -
1994 1,100.00 1,980.08 M - - 892.15 NM 1,350.001995 1,300.00 2,337.15 M 1,018.24 - 1,429.76 M 1,406.001996 849.00 2,273.72 M 1,416.38 - 1,774.94 M 1,416.381997 3,460.00 1,910.31 M 1,535.91 - 1,790.20 M 1,535.91
Chicken 1993 - - - -1994 1,400.00 1,821.20 m - - -
1995 1,059.00 2,012.14 M - -
1996 1,552.00 2,010.37 M - - -
1997 2,513.00 1,765.04 M - -
Milk 1993 - -
1994 321.32 1,698.18 M - - 149.08 M1995 343.30 2,369.23 m - - 246.86 M -1996 338.20 2,184.61 M - - 270.09 M 2,184.611997 166.45 M 1,814.04 M - - 256.74 Ni 1,814.04
126

Table 5. Adjusted Output Price at Border (US/ton)
Commodity Year Bulgaria Germany Poland Romania Russia Ukraine
Barley 1993 -1994 - 91.87 M - 93.35 M 68.72 M1995 - 117.44 M - 7130 61301996 176.82 M - 114.05 217.36 M1997 - 149.25 M - 75.50 73.11 -
Maize 1993 - - - -
1994 14713 M - - 63.84 186.11 M -
1995 183.35 M - - 90.02 217.06 M1996 22183 M - - 93.31 275 89 M -
1997 216.17 M - - 58.26 203 26 M
Rye 1993 - - 107 00 M -
1994 - 98.61 M - - 115 87 M -
1995 100.16 M 73.00 M 118 07 M1996 - 146.24 M 97 00 - 179 33 M -
1997 - 12216 M 90.85 - 150.26 M -
Wheat 1993 - - 120 00 M - - -
1994 110.58 116.49 M - 140.84 116 61 M 116.331995 13238 15918 M 11400 M 125.71 151.75 M 103.481996 156.81 204.26 M 210.17 M 139.64 220.63 M 126.401997 92.07 169 46 M 126.06 M 104 82 187 41 M 98.62
Potatoes 1993 - - 39 00 -
1994 - - - 278.61 M -
1995 - - 95.10 284.97 M1996 - - 85 24 - 255 52 M -
1997 - - 76.00 - 242.84
Rapeseed 1993 - - 166 00 -
1994 270 50 M -1995 - 302.74 M 210 00 - -
1996 - 302 01 M 217.00 - -
1997 - 279.74 M 239 64
Sunflower Seed 1993 - - - - - '1994 185 77 - - - 18811 197 891995 190.11 - - - 216.51 226451996 146.71 - - - 206 93 166.691997 246.53 - - 180.43 174 56
Sugar 1993 - - 18 30 -
1994 - 43.91 M - 42.96 M 79 361995 - 48 49 M 25 30 M - 49.03 M 48.901996 - 43.66 M 27.90 M - 61.89 M 34141997 38 33 M 23 99 M - 42 91 M 23 33
Beef/Cattle 1993 - - 659.00 -
1994 815.79 1,210.63 M - - 1,14642 M1995 1,254.69 1,425 81 M 1,445 00 - 1,290.19 M1996 1,062.31 1,212 56 M 1,458.31 60170 M 903 481997 1,318 33 1,252.21 M 1,400.28 - 749.94 M 752 90
Pork 1993 - - 879.00 M - - -
1994 947.28 1,868.80 M - 715 28 1,327.23 M 706 301995 1,120.88 2,211 61 M 995.44 761.26 1,590.36 M 730.051996 72941 2.154 02 M 1,306.00 84740 1,572.19 M 735441997 1,647.06 1,806 55 M 1,396.28 915.75 1,813 41 M 797.51
Chicken 1993 - - - - -
1994 674.41 1,388 47 m - 683.55 M - -
1995 507 16 1,523 92 M - 957 36 M - -
1996 625.17 1,544.86 M - 847.35 M - -
1997 1,215 08 1,361 54 M - 97506 MMilk 1993 - - 142.00 -
1994 273.23 219.35 M - 232,38 M 159 21 M -
1995 292.33 295.45 M 187.00 33118 M 198.74 M -
1996 287.90 267.89 M 176.20 281.89 M 206.12 M 103.121997 278 99 M 224.35 M 176 02 278 34 M 184.03 M 85 63
127
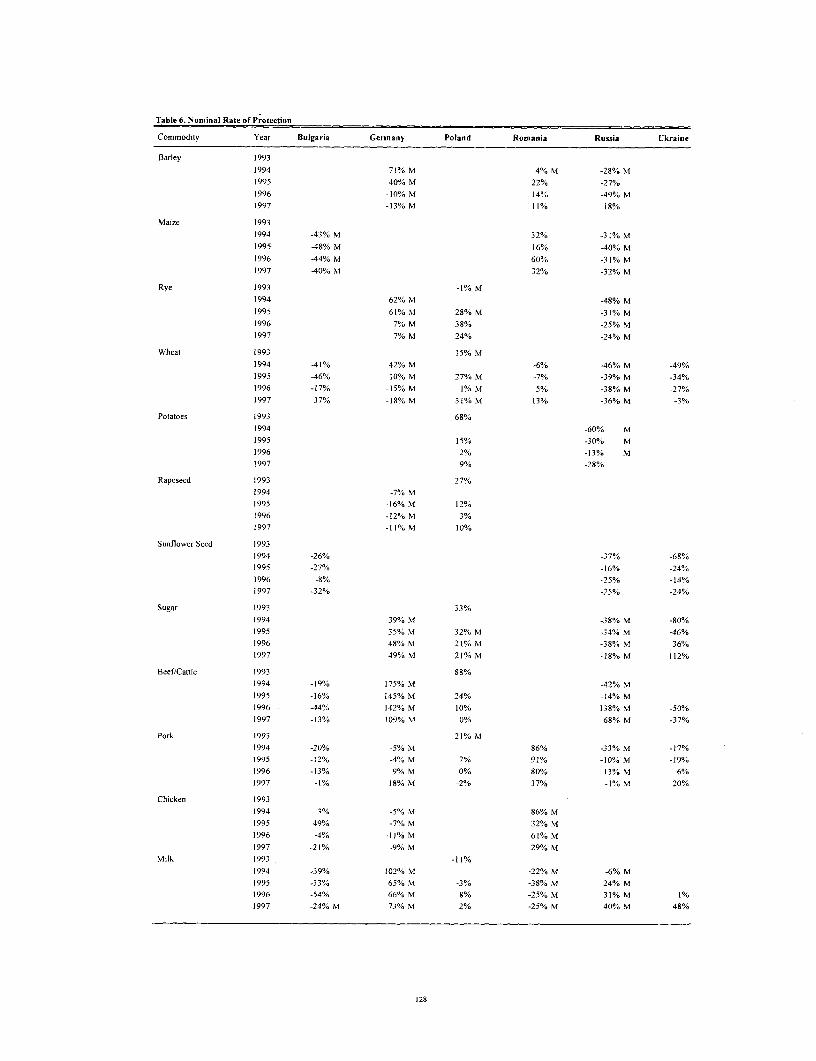
Table 6. Nominal Rate of Protection
Commodity Year Bulgaria Germany Poland Romania Russia Ukraine
Barley 1993
1994 71% M 4% M -28% M
1995 40% M 22% -27%
1996 -10% M 14% -49% M
1997 -13% M 11% 18%
Maize 1993
1994 -43% M 32% -31% M
1995 -48% M 16% -40% Ni
1996 -44% MI 60% -31% M
1997 -40% M 32% -32% M
Rye 1993 -1% NI
1994 62% NI -48% M
1995 61% M 28% M -31% M
1996 7% M 38% -25% M
1997 7% M 24% -24% M
Wheat 1993 15% NI
1994 -41% 42% NI -6% -46% M -49%
1995 46% 10% M 27% M -7% -39% M -34%1996 -17% -15% M 1% M 5% -38% M -27%1997 37% -18% M 31% M 13% -36% M -3%
Potatoes 1993 68%
1994 -60% M1995 15% -30% M
1996 2% -13% M1997 9% -28%
Rapeseed 1993 27%
1994 -7% M1995 -16% M 12%
1996 -12% M 3%
1997 -11% M 10%
Sunflower Seed 1993
1994 -26% -37% -68%
1995 -27% -16% -24%
1996 -8% -25% -14%1997 -32% -25% -24%
Sugar 1993 33%
1994 39% .M -38% M -80%1995 35% NI 32% M -34% M -46%1996 48% NI 21% M -38% M 36%1997 49%M 21%M -18% M 112%
Beef/Cattle 1993 88%
1994 -19% 175% M -42% M
1995 -16% 145% M 24% -14% M
1996 -44% 142% NI 10% 138% NI -50%1997 -13% 109% .M 0% 68% M -37%
Pork 1993 21% M
1994 -20% -5% M 86% -33% M -17%1995 -12% -4% M 7% 91% -10% M -19%1996 -13% 9% NI 0% 80% 13% M 6%1997 -1% 18% M -2% 37% -1% M 20%
Chicken 1993
1994 3% -5% M 86% NI
1995 49% -7% M 32% M
1996 -4% -11% M 61% M
1997 -21% -9% M 29% M
Milk 1993 -11%
1994 -39% 102% M -22% M -6% M1995 -33% 65% M -3% -38% M 24% M1996 -54% 66% M 8% -25% M 31%M 1%1997 -24% M 73% NM 2% -25% M 40% M 48%
128
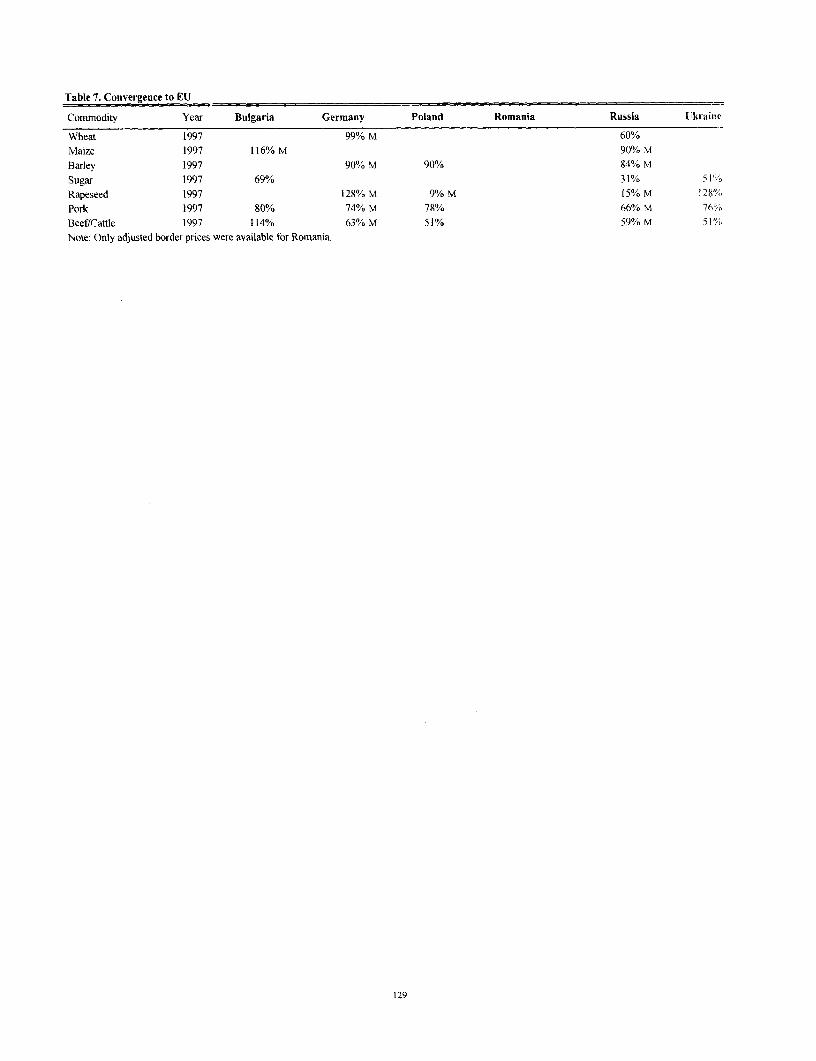
Table 7. Convergence to EU
Commodity Year Bulgaria Germany Poland Romania Russia Ukraine
Wheat 1997 99% M 60%
Maize 1997 116% M 90% M
Barley 1997 90% M 90% 84% M
Sugar 1997 69% 31% /
Rapeseed 1997 128% M 9% M 15% M 128%
Pork 1997 80% 74% M 78% 66% M 76%
Beef/Cattle 1997 114% 63% M 51% 59% M 51%
Note: Only adjusted border prices were available for Romania.
129
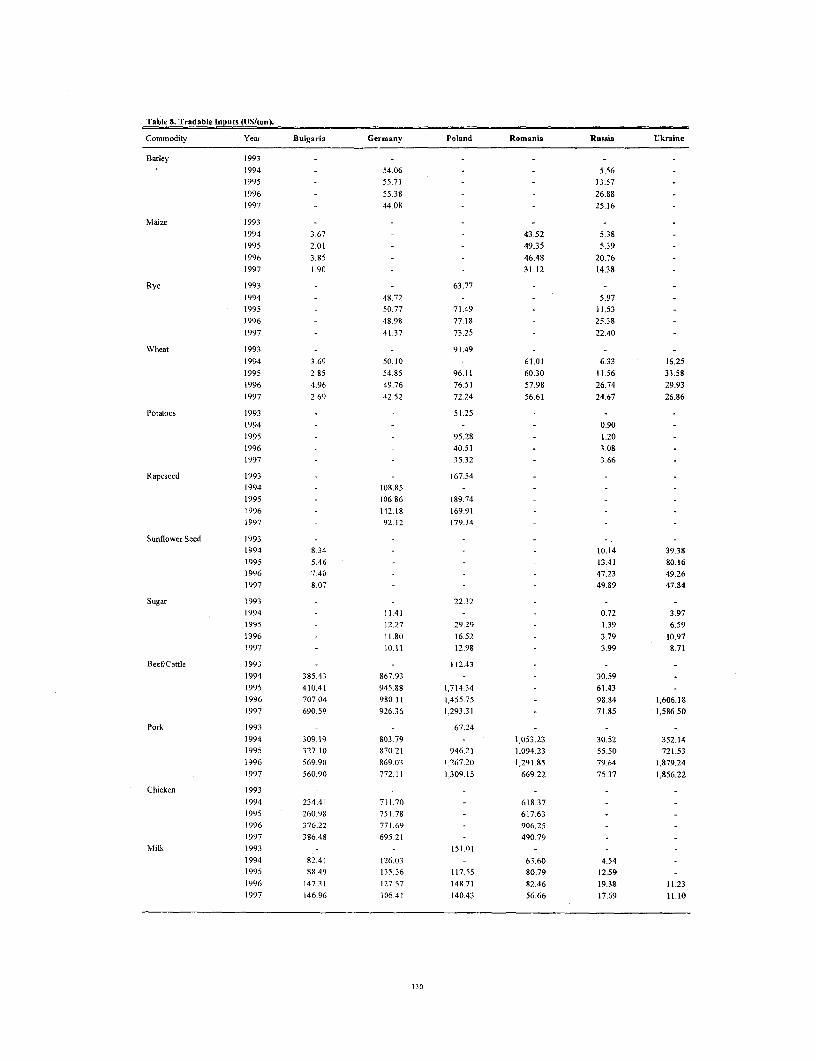
Table 8. Tradable Inputs (U$/ton).
Commodity Year Bulgaria Germany Poland Romania Russia Ukraine
Barley 1993 - -1994 - 54.06 - - 5.561995 - 55.71 - - 13.57 -
1996 - 55.38 - - 26.88 -
1997 44.08 - - 25.16 -
Maize 1993 - - - - - -
1994 3.67 - - 43.52 5.38 -
1995 2.01 - - 49.35 5.39 -
1996 3.85 - - 46.48 20.761997 1.90 - - 31.12 14.38 -
Rye 1993 - - 63.77 - -1994 - 48.72 - - 5.97 -1995 50.77 71.49 - 11.53 -
1996 - 48.98 77.18 - 25.38 -
1997 - 41.37 73.25 - 22.40 -
Wheat 1993 - - 91.49 - - -
1994 3.69 50.10 - 61.01 6.33 16.25
1995 2.85 54.85 96.11 60.30 11.56 33.58
1996 4.96 49.76 76.51 57.98 26.74 29.93
1997 2.69 42.52 72.24 56.61 24.67 26.86
Potatoes 1993 - - 51.25 -
t994 - - - - 0.90 -
1995 - - 95.28 - 1.20 -
1996 - - 40.51 - 3.08 -
1997 - - 35.32 - 3.66 -
Rapeseed 1993 - - 167.54
1994 - 198.85 - - - -
1995 - 106.86 189.74 - - -
1996 - 142.18 169.91 - -
1997 - 92.12 179.34 - -
Sunflower Seed 1993 - - - - - .
1994 8.34 - - - 10.14 39.381995 5.46 - - 13.41 80.16
1996 7.40 - - 47.23 49.261997 8.07 - - - 49.89 47.84
Sugar 1993 - - 22.32 - -
1994 - 11.41 - - 0.72 3.971995 - 12.27 29.29 - 1.39 6.59
1996 - 11.80 16.52 - 3.79 10.97
1997 - 10.11 12.98 - 3.99 8.71
Beef/Cattle 1993 - - 112.43 - -
1994 385.43 867.93 - - 30.59
1995 410.41 945.88 1,714.34 - 61.43 -
1996 707.04 980.11 1,455.75 - 98.84 1,606.181997 690.59 926.36 1,293.31 - 71.85 1,586.50
Pork 1993 - - 67.24 - - -
1994 309.19 803.79 - 1,053.23 30.52 352.141995 327.10 870.21 946.21 1,094.23 55.50 721.53
1996 569.90 869.03 1,267.20 1,291.85 79.64 1,879.241997 560.90 772.11 1,309.15 669.22 75.37 1,856.22
Chicken 1993 - - - - - -
1994 234.41 711.70 - 618.37 - -
1995 260.98 751.78 - 617.63 -
1996 376.22 771.69 906.25 - -
1997 386.48 695.21 - 490.79 - -
Milk 1993 - 151.01 - - -
1994 82.41 126.03 - 63.60 4.54 -
1995 88.49 135.36 117.55 80.79 12.59 -
1996 147.31 127.57 148.71 82.46 19.38 11.23
1997 146.96 106.41 140.43 56.66 17.69 11.10
130

Table 9. Unadjusted Input Prices at Border (U$iton)
Commodity Year Bulgaria Germany Poland Romania Russia Ukraine
Barley 1993 . - - . - -
1994 - 49.44 - - 6.87 -
1995 - 52.66 - - 18.791996 - 56.34 - - 31.831997 - 45.07 - - 28.03 -
Maize 1993 - - -1994 8.82 - - 38.03 6 66
1995 5.15 - - 47.13 746 -
1996 9.43 - - 40.84 24.59
1997 4.72 - - 28.75 16.02
Rye 1993 - - 54.04 - -
1994 - 44.56 - - 7.38 -
1995 47.07 57.26 - 15.981996 - 48.37 63.75 - 30.06 -
1997 - 40.87 57 93 - 24.96 -
Wheat 1993 - - 81.01 -
1994 8.19 47.55 - 64.09 7.83 23.53
1995 6.01 54.06 88.68 69.45 16.01 38.021996 10.87 51.23 82.03 69.41 31.67 47.461997 6.25 44.02 77.44 53.27 27.48 61.90
Potatoes 1993 - - 46.84 -
1994 . - 1.11 -
1995 - - 89.09 - 1.67 -
1996 37.10 3.701997 - - 32.01 - 4.13
Rapeseed 1993 - - 146.601994 - 110.54 -
1995 - 110.55 17076 - - -
1996 146.19 166.43 - - -
1997 - 94.50 184.15 - - -
Sunflower Seed 1993 - - - -
1994 28.05 - - - 12.17 56.07
1995 18.56 - - - 18.64 104.221996 21.79 - - - 57.6S S6.661997 19.01 - - - 56.75 83.99
Sugar t993 - - 17.91 - .. -
1994 - 10.75 - - 0.88 31.89
1995 - 11.56 22.89 - 1.89 53.031996 - 10.95 14.41 - 3.82 15.36
1997 - 9.37 15.08 - 4.03 14.29
BeefDCattle 1993 - - 85.42 - -
1994 510.69 685.91 - 56.25 -
1995 675.41 802.01 1,340.54 - 115.96 -
1996 778.12 929.80 1,256.65 - 171.96 1,761.30
1997 555.36 878.14 1,162.35 - 102.47 1,320.38
Pork 1993 - - 85.97 - - -
1994 404.01 658.47 - 882.11 56.13 661.421995 541.73 766.01 866.19 946.88 104.77 816.091996 618.48 908.93 1,223.44 943.40 138.55 2,624.071997 447.32 814.64 1,280.49 512.12 107.48 2,645.92
Chicken 1993 - - - .
1994 269.12 508.72 - 526.361995 351.66 606.23 - 549.231996 429.91 827.41 682.47 -
1997 370.06 754.62 - 388.54Milk 1993 - - 115.46 - - -
1994 105 80 113.20 - 51.25 8.35
1995 140.00 126.09 100.64 70.60 23.77 -
1996 162.84 131.04 130.54 51.58 33.71 15.711997 122.46 110.12 139.33 45.17 25.22 41.85
131

Table 10. Value Added at Domestic Prices in US/ton).
Commodity Year Bulgaria Germany Poland Romania Russia Ukraine
Barley 19931994 103.04 43.641995 108.51 31.241996 103.54 83.221997 86.08 61.20
Maize 1 9931994 80.52 41.07 122.821995 93.50 54.91 125.771996 119.95 102.75 170.571997 128.20 45,61 124.06
Rye 1993 42.041994 110.88 54.561995 110.78 21.73 69.531996 106.97 57.07 109.971997 88.98 39.86 91.36
Wheat 1993 46.841994 62.00 115.43 71.91 56.21 43.071995 68.14 119.89 49.08 56.10 81.56 34.721996 125.58 123.94 135.62 88.00 1 10.05 61.911997 123.65 95.82 92.79 61.97 94.93 68.66
Potatoes 1993 14.221994 111.231995 14.02 198.621996 46.27 218.381997 47.30 172.79
Rapeseed 1993 43.431994 142.291995 148.32 44.551996 122.23 52.601997 157.19 84.38
Sunflower Seed 19931994 129.93 108.04 23.941995 132.58 168.79 91.941996 127.40 107.27 94.911997 160.76 85.68 84.53
Sugar 1993 1.931994 49.79 25.76 11.911995 53.29 4.12 31.11 19.8S1996 52.70 17.23 34.43 35.351997 46.99 15.98 31.04 40.72
Beef/Cattle 1993 1,124.171994 274.89 2,459.19 633.371995 647.89 2,546.94 71.08 1,047.831996 -107.54 1,952.66 148.33 1,334.49 -1,153.561997 450.09 1,695.27 100.42 1,187.77 -1,111.81
Pork 1993 999.281994 450.29 963.22 276.00 861.62 234.091995 663.18 1,248.70 119.20 360.67 1,374.27 -130.181996 62.33 1,477.56 43.39 232.84 1,695.30 -1,097.791997 1,070.46 1,355.90 54.33 586.38 1,714.84 -901.82
Chicken 19931994 462.47 605.49 650.441995 492.80 664.46 643.281996 226.38 597.73 456.231997 567.93 541.24 764.80
Milk 1993 -24.251994 83.33 316.67 117.66 144.541995 108.57 352.47 63.46 125,32 234.271996 .13.75 316.54 41.58 128.40 250.71 92.901997 64.58 281.66 38.54 152.60 239.05 115.36
132
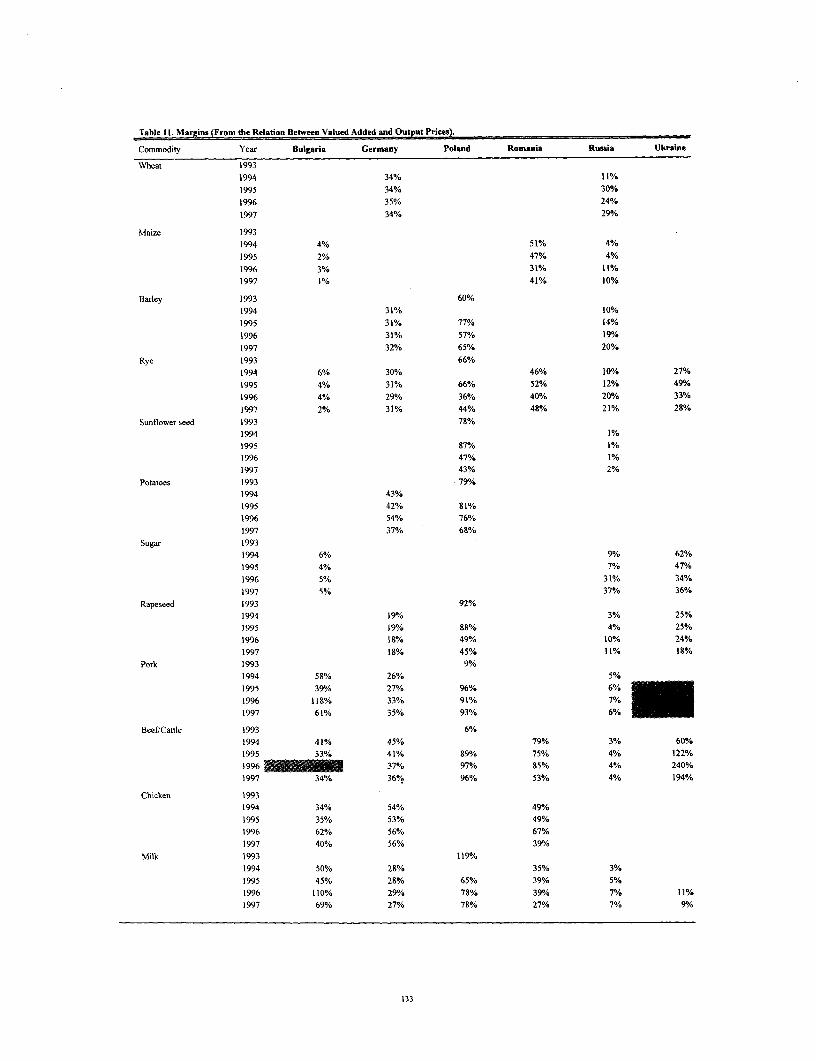
Table 11. Margins (From the Relation Between Valued Added and Output Prices.
Commodity Year Bulgaria Germany Poland Romania Russia Ukraine
Wheat 19931994 34% 11%1995 34% 30%1996 35% 24%1997 34% 29%
Maize 19931994 4% 51% 4%1995 2% 47% 4%1996 3% 31% 11%1997 1% 41% 10%
Barley 1993 60%1994 31% 10%1995 31% 77% 14%1996 31% 57% 19%1997 32% 65% 20%
Rye 1993 66%1994 6% 30% 46% 10% 27%
1995 4% 31% 66% 52% 12% 49%1996 4% 29% 36% 400/a 20% 33%
1997 2% 31% 44% 48% 21% 28%Sunflower seed 1993 78%
1994 1%1995 87% 1%1996 47% 1%1997 43% 2%
Potatoes 1993 79%1994 43%1995 42% 81%1996 54% 76%1997 37% 68%
Sugar 19931994 6% 9% 62%1995 4% 7% 47%1996 5% 31% 34%1997 5% 37% 36%
Rapeseed 1993 92%1994 19%/o 3% 25%1995 19% 88% 4%
25 %1996 IS% 49% 10% 24%1997 18% 45% 11% 18%
Pork 1993 9%1994 58% 26% 5%1995 39%/ 27% 96% 6%1996 118% 33% 91% 7%1997 61% 35% 93% 6%
Beef/Cattle 1993 6%1994 41% 45% 79% 3% 60%1995 33% 41% S9% 75% 4% 122%
1996 _ _ 37% 97% 85% 4% 240%1997 34% 36% 96% 53% 4% 194%
Chicken 19931994 34% 54% 49%1995 35% 53% 49%1996 62% 56% 67%1997 40% 56% 39%/o
Milk 1993 119%1994 50% 28% 35% 3%1995 45% 28% 65% 39% 5%1996 110% 29% 78% 39% 7% 11%1997 69% 27% 78% 27% 7% 9/D
133
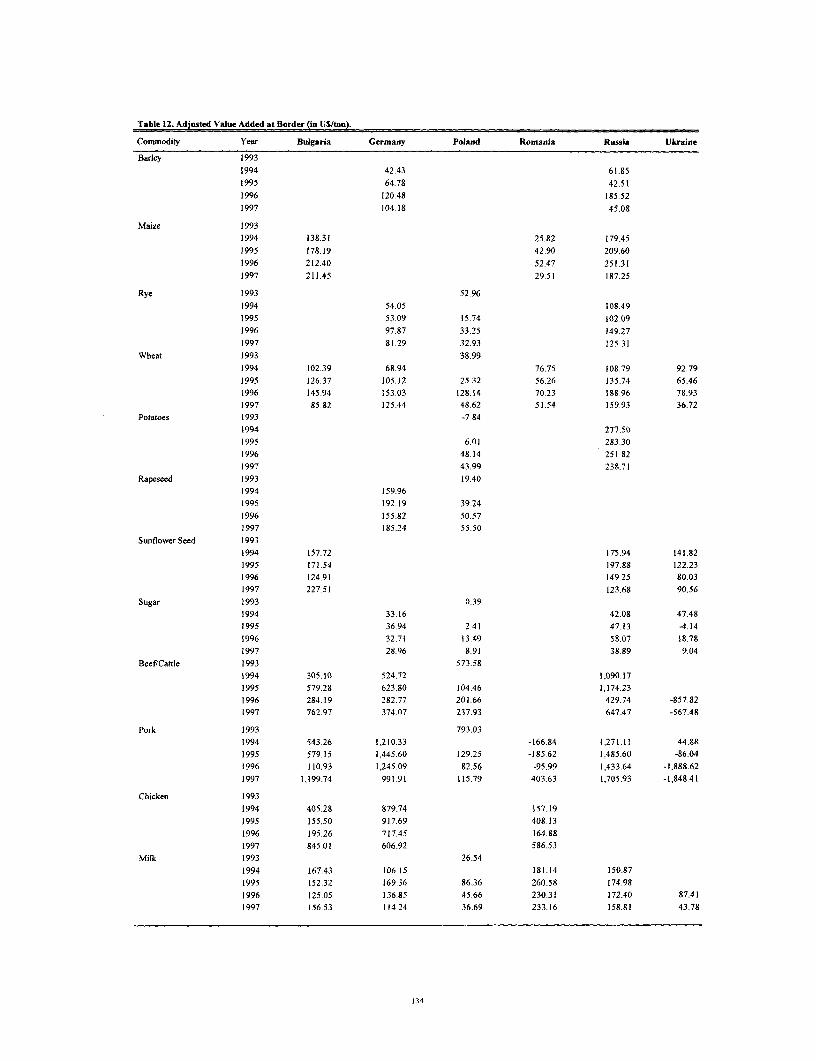
Table 12. Adjusted Value Added at Border (in US/ton).
Commodity Year Bulgaria Germany Poland Romania Russia Ukraine
Barley 19931994 42.43 61.851995 64.78 42.511996 120.48 185.521997 104.18 45.08
Maize 19931994 138.31 25.82 179.451995 178.19 42.90 209.601996 212.40 52.47 251.311997 211.45 29.51 187.25
Rye 1993 52.961994 54.05 108.491995 53.09 15.74 102.091996 97.87 33.25 149.271997 81.29 32.93 125.31
Wheat 1993 38.991994 102.39 68.94 76.75 108.79 92.791995 126.37 105.12 25.32 56.26 135.74 65.461996 145.94 153.03 128.14 70.23 18S.96 78.931997 85.82 125.44 48.62 51.54 159.93 36.72
Potatoes 1993 -7. 841994 277.501995 6.01 283.301996 48.14 251.821997 43.99 238.71
Rapeseed 1993 19.401994 159.961995 192.19 39.241996 155.82 50.571997 185.24 55.50
Sunflower Seed 19931994 157.72 175.94 141.821995 171.54 197.88 122.231996 124.91 149.25 80.031997 227.51 123.68 90.56
Sugar 1993 0.391994 33.16 42.08 47.481995 36.94 2.41 47.13 -4.141996 32.71 13.49 58.07 18.781997 28.96 8.91 38.89 9.04
Beef/Cattle 1993 573.581994 305.10 524.72 1,090.171995 579.28 623.80 104.46 1,174.231996 284.19 282.77 201.66 429.74 -857.821997 762.97 374.07 237.93 647.47 -567.48
Pork 1993 793.031994 543.26 1,210.33 -166.84 1,271 11 44.881995 579.15 1,445.60 129.25 -185.62 1,485.60 -86.041996 110.93 1,245.09 82.56 -95.99 1,433,64 -1,888.621997 1,199.74 991.91 115.79 403.63 1,705.93 -1,848.41
Chicken 19931994 405.28 879.74 157.191995 155.50 917.69 408.131996 195.26 717.45 164.881997 845.01 606.92 586.53
Milk 1993 26.541994 167.43 106.15 181.14 150.871995 152.32 169.36 86.36 260.58 174.981996 125.05 136.85 45.66 230.31 172.40 87.411997 156.53 114.24 36.69 233.16 158.81 43.78
134
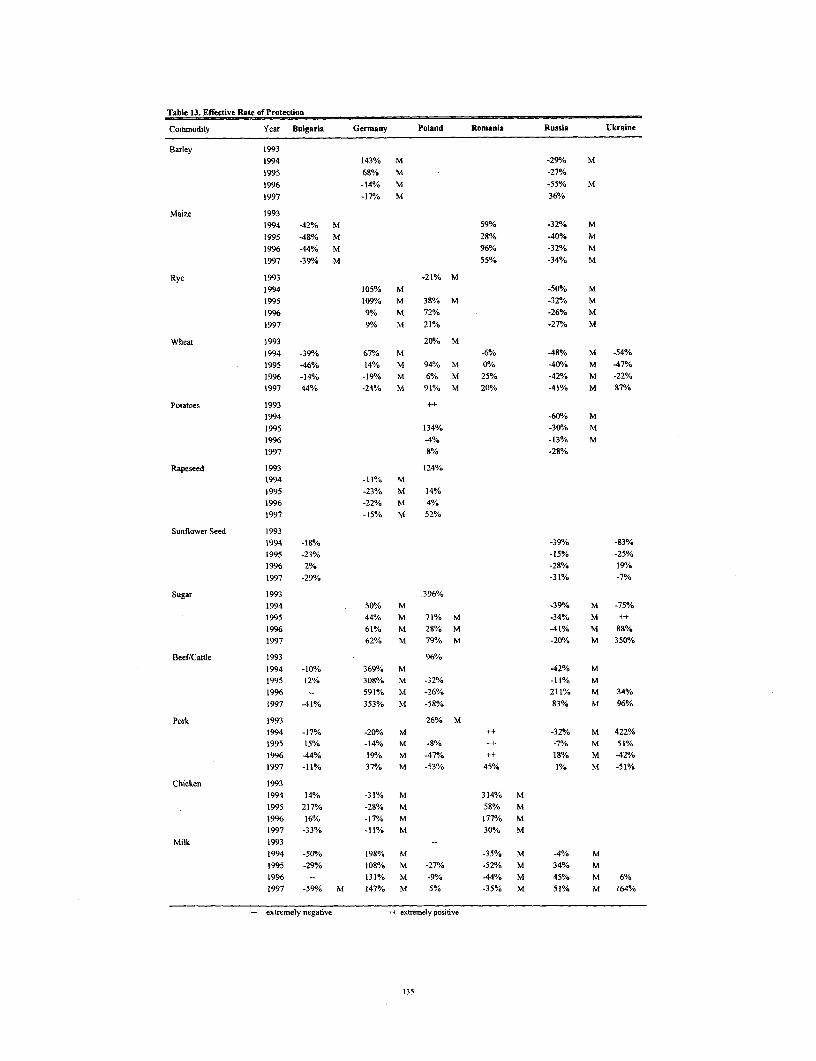
Table 13. Effective Rate of Protection
Commodity Year Bulgaria Germany Poland Romania Russia Ukraine
Barley 1993
1994 143% M -29%/. M
1995 68% M -27%
1996 -14% M -55% M
1997 -17/. M 36%
Maize 1993
1994 -42% M 59% -32% M
1995 48% M 28% -40% M
1996 -44% M 96% -32% M
1997 -39% M 55% -34% M
Rye 1993 -21% M
1994 105% M -50% M
1995 109% M 38% M -32% M
19% 9% M 72% -26% M
1997 9% M 21% -27%/ M
Wheat 1993 20%/6 M
1994 -39% 670/. M -6% -48% M -54%
1995 -46% 14% M 94% M 0% -40%/6 M -47%
1996 -14% -19% M 6% M 25% -42% M -22%
1997 44% -24% M 91% M 20% -41% M 870/,
Potatoes 1993 ++1994 -60% M
1995 134% -30%/6 M
1996 -4%/ -13% M
1997 8% -28%
Rapeseed 1993 124%1994 -11% M
1995 -23% M 14%1996 -22% M 4%
1997 -15% M 52%
Sunflower Seed 1993
1994 -18% -39%/6 -83%
1995 -23% -15% -25%
1996 2% -28% 19%
1997 -29% /-31% -7%
Sugar 1993 .396%
1994 50% M -390/ M -75%
1995 44% lM 71% M -34% M ++
1996 61% M 28% M -41% M 8g%
1997 62% M 79%/0 M -20% M 350%
Beef/Cattle 1993 96%
1994 -10% 369% M -42% M
1995 12% 308% M -32% -11% M
1996 -- 591% M -26% 211% M 34%
1997 -41% 353% M -58% 83% M 96%
Pork 1993 26% M
1994 -17% -20% M ++ -32% M 422%
1995 15% -14% M -8% ++ -7% M 51%
1996 -44% 19%/6 M -47% ++ 18% M 42%
1997 -11% 37% M -53% 45% 1% M -51%
Chicken 1993
1994 14% -31% M 314% M
1995 217% -28% M 58% M
1996 16% -170/. M 1770/, M
1997 -33% -11% M 30% M
Milk 1993 --
1994 -50% 198% M -35% M -4% M
1995 -29% 108% M -27% -52% M 34% M
19% -- 131% M -9/o -44% M 45% M 6%
1997 -591/% M 147% M 5% -35% M 51% M 164%
-- extremely negative ++ extremely posirive
135
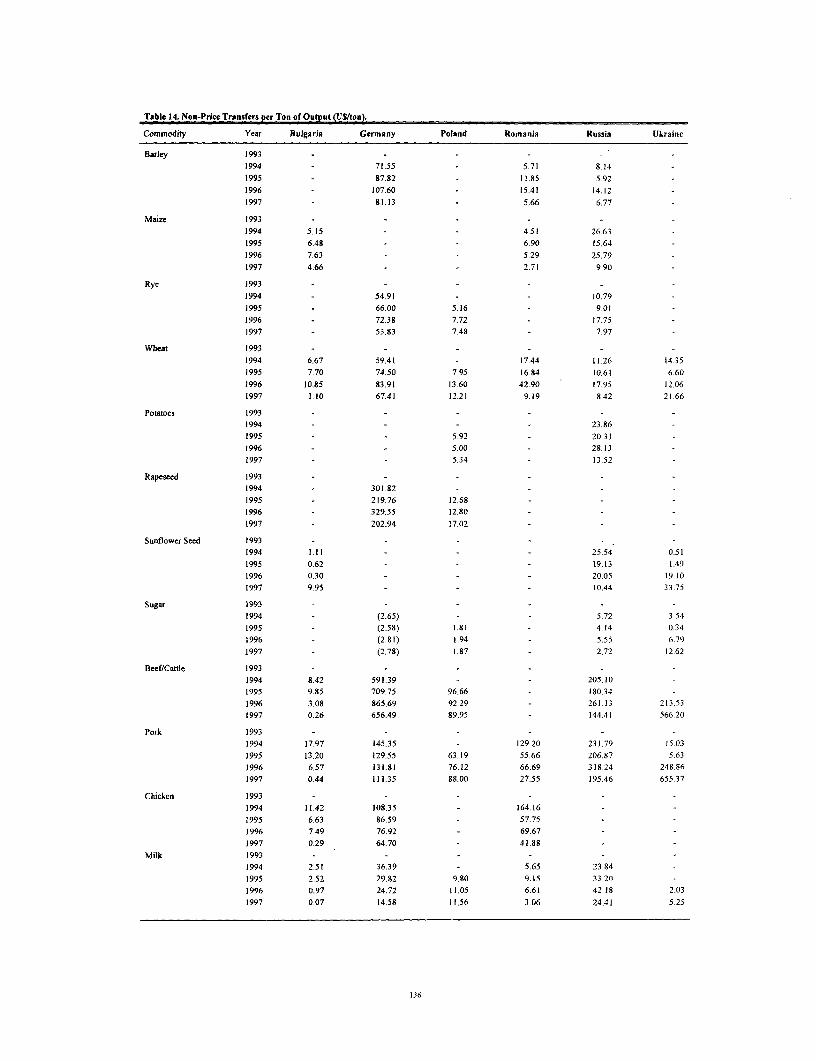
Table 14. Non-Price Transfers per Ton of Output (US/ton).
Commodity Year Bulgaria Gernany Poland Romania Russia Ukraine
Barley 1993 - -
1994 - 71.55 5.71 8.141995 - 87.82 - 11.85 5.921996 - 107.60 - 15.41 14.12 -
1997 - 81.13 - 566 6.77
Maize 1993 - - - - -
1994 5.15 - - 4.51 26.631995 6.48 - - 6.90 15.641996 7.63 - - 5.29 25.791997 4.66 - 2.71 9.90 -
Rye 1993 - - -- -1994 - 54.91 - 10.79 -
1995 - 66.00 5.16 - 9.011996 - 72.38 7.72 - 17.751997 53.83 7.48 . 7.97
Wheat 1993 - - - - - -1994 6.67 59.41 - 17.44 11.26 14.351995 7.70 74.50 7.95 16.84 10.61 6.601996 10.85 83.91 13.60 42.90 17.95 12.061997 1.10 67.41 12.21 9.19 8.42 21.66
Potatoes 1993 - - - - - -1994 - - - - 23.861995 - - 5.92 - 20.31 -
1996 - - 5.00 - 28.13 -1997 - - 5.34 - 13.52
Rapeseed 1993 - - -
1994 - 301.82 - - - -
1995 - 219.76 12.68 - - -
1996 - 329.55 12.80 - - -
1997 - 202.94 17.02 - -
Sunflower Seed 1993 - - -1994 1.11 - - - 25.54 0.511995 0.62 - - - 19.13 1.491996 0.30 - - - 20.05 19.101997 9.95 - - - 10.44 33.75
Sugar 1993 -1994 - (2.65) - - 5.72 3.541995 - (258) 1.81 - 4.14 0.341996 - (2.81) 1.94 - 5.55 6.791997 - (2.78) 1.87 - 2.72 12.62
Beef/Cattle 1993 - - -
1994 8.42 591.39 - - 205.101995 9.85 709.75 96.66 - 180.34 -
1996 3.08 865.69 92.29 - 261.13 213.531997 0.26 656.49 89.95 - 144.41 566.20
Pork 1993 - - - - - -1994 17.97 145.35 - 129.20 231.79 15.031995 13.20 129.55 63.19 55.66 206.87 5.631996 6.57 131.81 76.12 66.69 318.24 248.861997 0.44 111.35 88.00 27.55 195.46 655.37
Chicken 1993 - - - - -1994 11.42 108.35 - 164.16 -
1995 6.63 86.59 - 57.751996 7.49 76.92 - 69.67 - -
1997 0.29 64.70 - 41.88Milk 1993 - - - - - -
1994 2.51 36.39 - 5.65 23.841995 2.52 29.82 9.80 9.15 33.201996 0.97 24.72 11.05 6.61 42.18 2.031997 0.07 14.58 11.56 3.06 24.41 5.25
136

Table IS. Total Transfers per Ton of Output (U/ton).
Commodity Year Bulgaria Germany Poland Romania Russia Ukraine
Barley 1993
1994 132.16 9.03 -10.0S
1995 131.55 27.84 -5.35
1996 90.66 31.12 -S8.19
1997 63.03 13.87 22.89
Maize 1993
1994 -52.64 19.77 -30.00
1995 -78,21 18.92 -68.19
1996 -84.82 55.56 -54.95
1997 -78.58 18.S1 -53.28
Rye 1993 -10.92
1994 111.74 -43.14
1995 123.69 11.14 -23.54
1996 81.48 31.54 -21.55
1997 61.53 14.41 -25.98
Wheat 1993 7.86
1994 -33.72 105.90 12.60 41.32 -35.37
1995 -50.53 89.26 31.72 16.67 43.58 -24.14
1996 -9.51 54.82 21.07 60.67 -60.97 4.96
1997 38.94 37.79 56,38 19.61 -56.57 53.60
Potatoes 1993 22.06
1994 -142.42
1995 13.94 -64.37
1996 3.12 -5.31
1997 8.65 -52.40
Rapeseed 1993 24.02
1994 284.15
1995 175.88 17.99
1996 295.96 14.82
1997 174.89 45.90
Sunflower Seed 1993
1994 -26.68 42.36 -117.37
1995 -38.34 -9.96 -28.81
1996 2.79 -21.93 33.97
1997 -56.80 -27.56 27.72
Sugar 1993 1.54
1994 13.98 -10.59 -32.03
1995 13.77 3.53 -11.88 24.29
1996 17.18 5.68 -18.09 23.35
1997 15.24 8.94 -5.13 44.31
Beef/Cattle 1993 550.59
1994 -21.79 2,525.87 -251.70
1995 78.46 2,632.89 63.27 53.94
1996 -388.65 2,535.58 38.95 1,165.87 .82.21
1997 -312.62 1,977.69 -47.57 684.71 21.87
Pork 1993 206.26
1994 -75.01 -101.76 572.05 -177.69 204.25
1995 97.23 -67.35 53.15 601.95 95.54 -38.51
1996 42.03 364.27 36.94 395.52 579.90 1,039.69
1997 -128.84 475.34 26.54 210.30 204.37 1,601.96
Chicken 1993
1994 68.60 -165.90 657.42
1995 343.93 -166.64 292.90
1996 38.61 -42.79 361.02
1997 -276.79 -0.98 220.15
Mill: 1993 -50.79
1994 -81.58 246.92 -57.83 17.52
1995 41.24 212.93 -13,09 -126.12 92.49
1996 -137.83 204.41 6.97 -95.30 120.49 7.52
1997 -91.89 182.00 13.41 -77.50 104.66 76.83
137

Table 16. Effective Rate of Assitance (in Terms of the Value of Output of Selected Commodities).
Commodity Year Bulgaria Germany Poland Romania Russia Ukraine
Barley 19931994 50% M 0% M -2% M1995 4.7/ M 1% 0%1996 3.4% M 1% .5% M1997 29% M 1% 2%
Maize 19931994 -s% M 4% 0% M1995 -I M% M 4% 0%'o M1996 -9%/. M 10% 0% M1997 -7% M 5% -1% M
Rye 1993 -1% M1994 1.3% M -2% M1995 1 7°/O M I%M 0% M1996 1 1% M 2% 0% M1997 1.0% M 1% -1% M
Wheat 1993 1% M1994 -12% 6.09/ M 2% -100/o M -11%1995 -13% 4.8% M 3% M 3% -5% .M -12%1996 -2% 3 2% M 2% M 4% -7% M -1%1997 8% 26% M 5% M 3% -9% M 19%
Potatoes 1993 9%1994 -35% M1995 3% -10% M1996 1% -1% M1997 2% -7%
Rapeseed 1993 0%1994 2.7% M1995 1.6% M 0%1996 1.7% M 0%1997 1.7% M 0%/f
Sunflower Seed 19931994 -1% -1% -4%1995 -2% 0% -2%1996 01/ M/o 1%1997 -1% 0% 1%
Sugar 1993 0%1994 12% M -1% M -14%1995 11% M 0% M -1% M 21%1996 1.4% M 1%M -1% M 8%1997 14% M 1%M 0% M 12%
Beef/Cattle 1993 3%1994 0%/. 9 2% M -6% M1995 1% 8.4% M 0% 1%M1996 -6% 84% M 0% 10% M -2%1997 -2% 7.6% M 0% 6% M 0%
Pork 1993 5% M1994 -2% -1.2% M 12% -3% M 6%1995 3% -0.7% M 1% 11% I% M -1%1996 -2% 3.9% M 1% 7% 3% M 10/.1997 -2% 57% M 1% 4% I%M 11%
Chicken 19931994 1% -04% M 5% M1995 3% -0.3% M 2% M1996 1% -0.1% M 3% M1997 -2% 0.0% M 1% M
Milk 1993 -7%1994 -8% 22.0% M -7% M 5% M1995 -3% 172% M -1% -14% M 14% M1996 -16% 17.2% M 1% -10% M 14% M 2%1997 -6% M 17 0% 0M 2% -9% M 13% M 21%
138
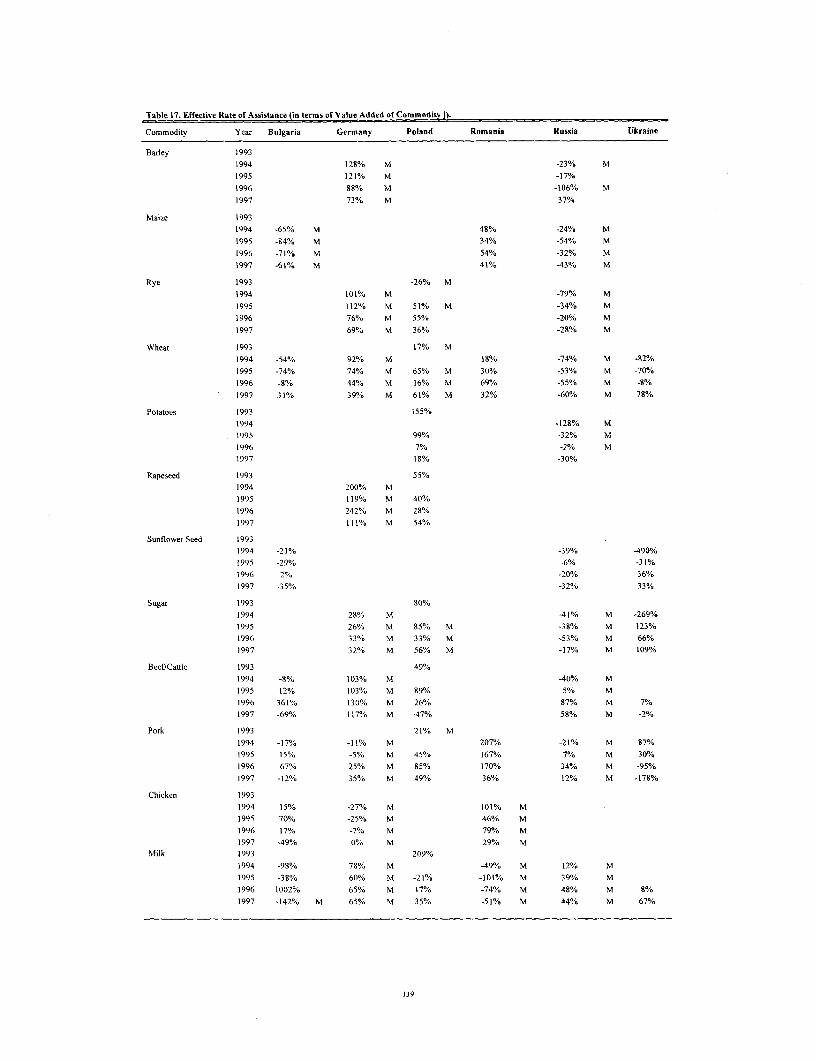
Table 17. Effective Rate of Assistance (in terms of Value Added of Commodi )
Commodity Year Bulgaria Germany Poland Romania Russia Ukraine
Barley 1993
1994 128% M -23% M
1995 121% M -17%
1996 S8% M -106% M
1997 73% M 37%
Maize 19931994 -65% M 48% -24% M
1995 -84% M 34% -40/. M
1996 -71% M 54% -32% M
1997 -61% M 41% -43% M
Rye 1993 -26% M
1994 101% M -79% M
1995 112% M 51% M -34% M
1996 76% M 55% -20% M
1997 69% M 36% -28% M
Wheat 1993 17% M
1994 -54% 92% M 18% -74% M -S2%/
1995 -74% 74% M 65% M 30% -53% M -70%
1996 -8% 44% M 16% M 69%/o -55% M -8%
1997 31% 39% M 61% M 32% -60% M 78%
Potatoes 1993 155%
1994 -128% M
1995 99% -32% M
1996 7% -2% M
1997 18% -30%
Rapeseed 1993 55%
1994 200% M
1995 119% M 40%
1996 242% M 28%
1997 111% M 54%
Sunflov,er Seed 1993
1994 -2/% -39% -490%1995 -29% -6% -31%
1996 2% -20% 36%/o
1997 -35% -32% 33%
Sugar 1993 80%
1994 28%. M -41% M -269%
1995 26% M 85% M -38% M 123%
1996 33% M 33% M -53% M 66%
1997 32% M 56% M -17% M 109%
Beef/Cattle 1993 49%
1994 -80/o 103% M -40% M
1995 120/o 103% M 89% 5% M
1996 361% 130% M 26% 87% M 7%
1997 -69% 117% M -47% 58% M -2%
Pork 1993 21% M
1994 -17% -1/1% M 207% -21% M 87%
1995 15% -5% M 45% 167% 7% M 30%
1996 -67% 25% M 85% 170% 34% M -95%
1997 -12% 35% M 49% 36% 12
% M -178%
Chicken 1993
1994 15% -27% M 101% M
1995 70%/o -25% M 46% M
1996 17% -7% M 79%/ M
1997 -49% 0% 4M 29% M
Milk 1993 209%
1994 -98% 78% M -49% M 12% M
1995 -38% 60% M -21% -101% M 39% M
1996 1002% 65% M 17% -74% M 48% M 8%
1997 -142% M 65% M 35% -51% M 44% M 67%
139

Table 18. Decomposition of Government Support to Agriculture, for Selected Commodities, as %of Ag.GDP.
Output Price Input Price Non-price related Total TransfersCommrnodity Year Transfers Transfers Transfers (ERA)
Bulgaria 1994 -43.4% 10.2% 3.9% -29.3%
1995 -33.9% 12.9% 2.9% -18.1%1996 -30.5% 5.4% 2.3% -22.8%
1997 -9.0% -2.9% 0.7% -11.1%Poland 1993 31.8% -15.5% n.a. 16.3%
1995 16.7% -14.0% 8.7% 11.4%1996 9.1% -8.1% 9.9% 10.9%
1997 10.9% -3.3% 10.8% 18.4%
Romania 1994 10.9% -4.8% 6.2% 12.3%
1995 2.2% -2.4% 5.0% 4.8%1996 15.6% -9.2% 5.1% 11.5%1997 5.3% -4.4% 2.5% 3.4%
Russia 1994 -59.8% 2.1% 19.5% -38.2%1995 -16.0% 3.0% 11.4% -1.6%1996 -5.2% 2.9% 12.8% 10.6%1997 -7.4% 2.1% 8.8% 3.4%
Ukraine 1994 -99.8% 39.4% 12.4% -48.0%1995 -35.2% 36.6% 3.0% 4.4%1996 -13.1% 18.0% 12.6% 17.5%1997 1L.6% 24.9% 26.1% 62.6%
Giermanv 1994 58.1% -7.6% 29.0% 79.4%
1995 44.6% -5.0% 28.3% 67.9%1996 35.4% 1.2% 30.1% 66.8%1997 38.5% 1.6% 27.8% 67.9%
Turkey 1994 15.0% 3.0% 17.0% 35.0%
1995 23.0% 2.0% 17.0% 42.0%1996 24.0% 3.0% 7.0% 34.0%
al Commodities included for each country are as follows: Bulgaria: wheat, maize, sunflower seed, veal, pork,chicken, and cow milk. Poland: wheat, rye, oilseed rape, sugar beet, potatoes, pig, cattle, milk. Romania: wheat,food barley, food maize, pig meat, chicken, cow milk. Russia: wheat, maize, barley, rye, sunflower seed,potatoes, sugarbeet, pork. milk and beef Ukraine wheat, sunflower seed, sugar beet, pork. Germany: wheat,barley, re, sugar, rape seed, beef, pork, chicken, milk.b/ For Bulgaria, nca-price transfers correspond to credit subsidies, and others non-price transfers. For Poland,non-price transfers correspond to credit subsidies, income tax differential treatment (grossing up for the selectedgroup of commodities based on the value of production), and costs of the Agency of Agricultural Markets(AAM). For Romania and Ukraine, non-price transfers correspond to credit subsidies. For Germany, non-pricetransfers correspond to National Payments (fuel and credit subsidies, income compensations, and exchange ratecompensations), and EU transfers (direct payments and input subsidies).ci Effective Rate of Assistance, expressed as percentage of agricultural GDP rather than as value of output, whichis the standard definition in PSE calculations.n a Not available
140
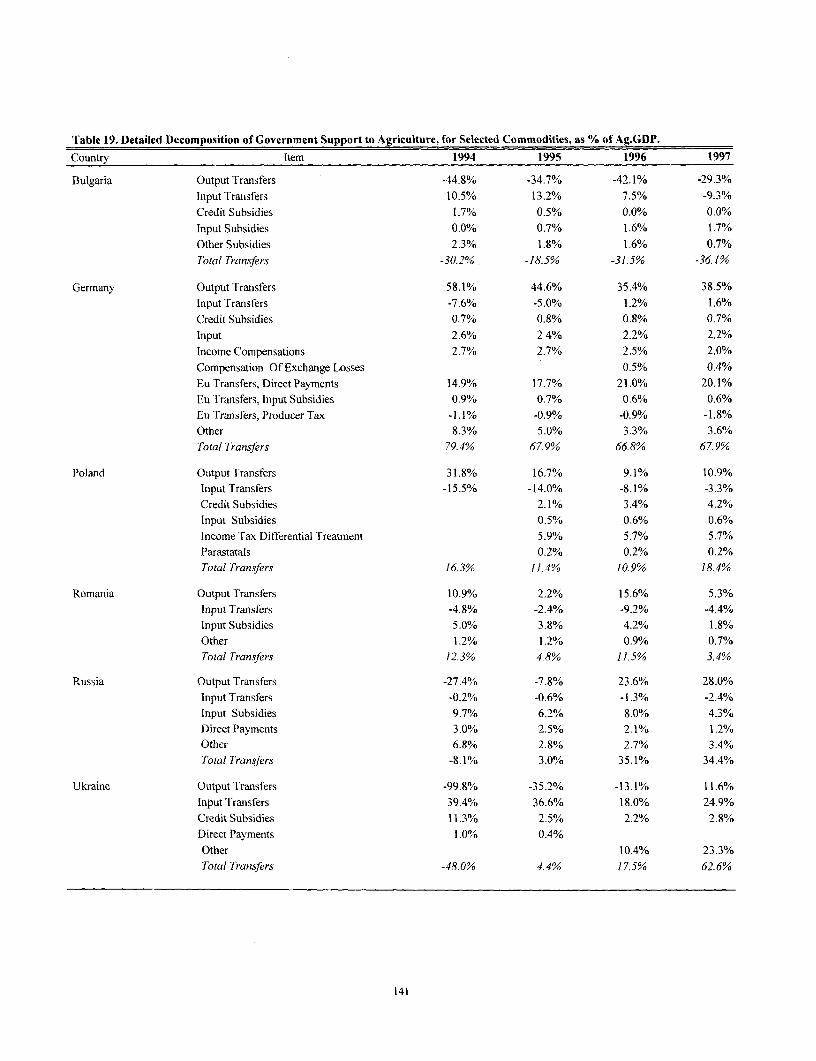
Table 19. Detailed Decomposition of Government Support to Agriculture, for Selected Commodities, as % of Ag.GDP.
Country Item 1994 1995 1996 1997
Bulgaria Output Transfers -44.8% -34.7% -42.1% -29.3%Input Transfers 10.5% 13.2% 7.5% -9.3%Credit Subsidies 1.7% 0.5% 0.0% 0.0%Input Subsidies 0.0% 0.7% 1.6% 1.7%Other Subsidies 2.3% 1.8% 1.6% 0.7%Total Transfers -30.2%. -18.5% -31.5% -36.1%
Germany Output Transfers 58.1% 44.6% 35.4% 38.5%Input Transfers -7.6% -5.0% 1.2% 1.6%
Credit Subsidies 0.7% 0.8% 0.8% 0.7%Input 2.6% 2,4% 2.2% 2.2%Income Compensations 2.7% 2.7% 2.5% 2.0%Compensation Of Exchange Losses 0.5% 0.4%Eu Transfers, Direct Payments 14.9% 17.7% 21.0% 20.1%Eu Transfers, Input Subsidies 0.9% 0.7% 0.6% 0.6%Eu Transfers, Producer Tax -1.1% -0.9% -0.9% -1.8%Other 8.3% 5.0% 3.3% 3.6%Total Transfers 79.4% 67.9% 66.8% 67.9%
Poland Output Transfers 31.8% 16.7% 9.1% 10.9%Input Transfers -15.5% -14.0% -8.1% -3.3%Credit Subsidies 2.1% 3.4% 4.2%Input Subsidies 0.5% 0.6% 0.6%Income Tax Differential Treatment 5.9% 5.7% 5.7%Parastatals 0.2% 0.2% 0.2%Total Transfers 16.3% 11.4% 10.9% 18.4%
Romania Output Transfers 10.9% 2.2% 15.6% 5.3%Input Transfers -4.8% -2.4% -9.2% -4.4%Input Subsidies 5.0% 3.8% 4.2% 1.8%Other 1.2% 1.2% 0.9% 0.7%Total Transfers 12.3% 4.8% 11.5% 3.4%
Russia Output Transfers -27.4°%D -7.8% 23.6% 28.0%Input Transfers -0.2% -0.6% -1.3% -2.4%Input Subsidies 9.7% 6.2% 8.0% 4.3%Direct Payments 3.0% 2.5% 2.1% 1.2%Other 6.8% 2.8% 2.7% 3.4%Total Transfers -8.1% 3.0% 35.1% 34.4%
Ukraine Output Transfers -99.8% -35.2% -13.1% 11.6%Input Transfers 39.4% 36.6% 18.0% 24.9%Credit Subsidies 11.3% 2.5% 2.2% 2.8%Direct Payments 1.0% 0.4%Other 10.4% 23.3%Total Transfers -48.0% 4.4% 17.5% 62.6%
141
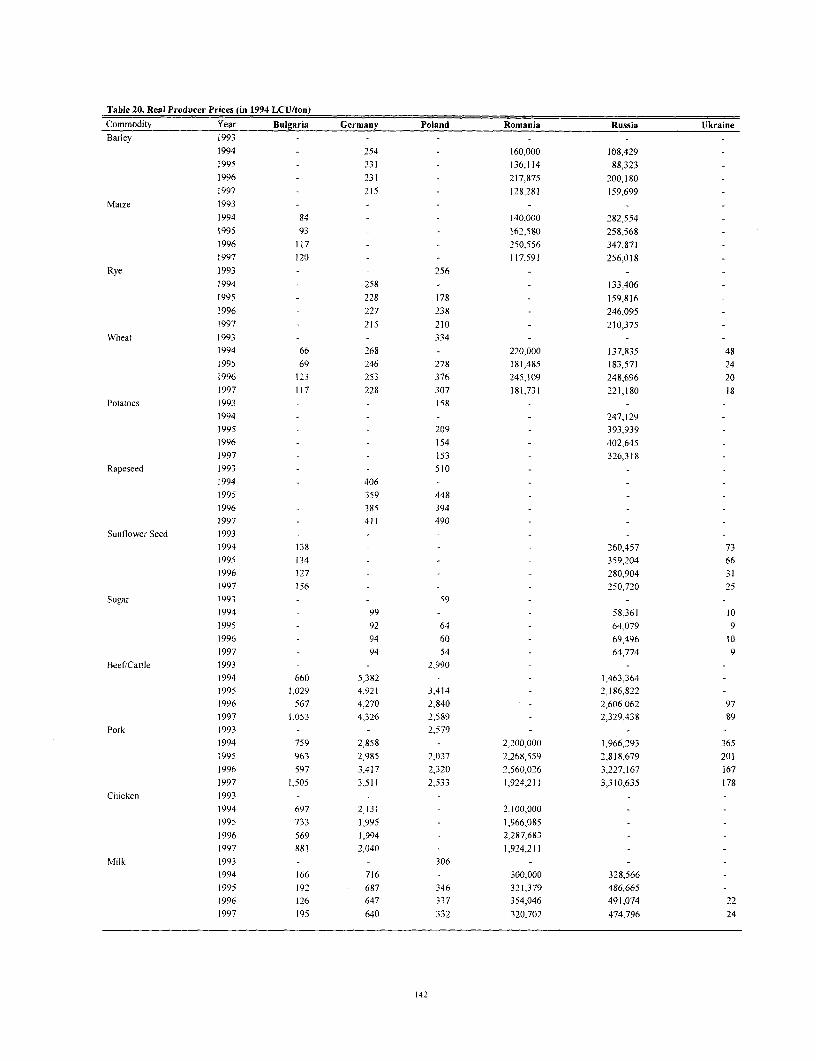
Table 20. Real Producer Prices (in 1994 LCU/ton)
Commodity Year Bulgaria Germany Poland Romania Russia UkraineBarley 1993 - -
1994 - 254 160,000 108,429
1995 - 231 - 136,114 88,323
1996 - 231 - 217,875 200,180
1997 - 215 - 128,281 159,699Maize 1993 - - -- -
1994 84 - 140,000 282,554
1995 93 162,580 258,568
1996 117 - - 250,556 347,871
1997 120 - - 117,591 256,018Rye 1993 - - 256 - -
1994 - 258 - - 133,406
1995 - 228 178 - 159,816
1996 - 227 238 - 246,095
1997 - 215 210 - 210,375Wheat 1993 - - 334 - -
1994 66 268 - 220,000 137,835 48
1995 69 246 278 181,485 183,571 24
1996 123 253 376 245,109 248,696 201997 117 228 307 181,731 221,180 18
Potatoes 1993 - - 158 - -
1994 - 247,129
1995 - - 209 - 393,939
1996 - - 154 - 402,645
1997 - - 153 - 326,318Rapeseed 1993 - - 510 -
1994 - 406 - - -
1995 - 359 448
1996 - 385 394 - -
1997 - 411 490 -
Sunflower Seed 1993 - - - -
1994 138 - - 260,457 73
1995 134 - - - 359,204 661996 127 - - 280,904 31
1997 156 - - - 250,720 25Sugar 1993 - 59 -
1994 - 99 - - 58,361 10
1995 - 92 64 - 64,079 91996 - 94 60 - 69,496 101997 - 94 54 - 64,774 9
BeefS'Cattle 1993 - - 2,990 -
1994 660 5,382 - - 1,463,3641995 1,029 4,921 3,414 - 2,186,8221996 567 4,270 2,840 - 2,606,062 97
1997 1,053 4,326 2,589 - 2,329,438 89Pork 1993 - - 2,579 -
1994 759 2,858 - 2,200,000 1,966,293 365
1995 963 2,985 2,037 2,268,559 2,818,679 201
1996 597 3,417 2,320 2,560,026 3,227,167 167
1997 1,505 3,511 2,533 1,924,211 3,310,635 178Chicken 1993 - - - - -
1994 697 2,131 - 2,100,000
1995 733 1,995 - 1,S66,085
1996 569 1,994 - 2,287,683 -
1997 881 2,040 - 1,924,211 -
Milk 1993 - - 306 - -
1994 166 716 - 300,000 328,566
1995 192 687 346 321,379 486,6651996 126 647 337 354,046 491,074 22
1997 195 640 332 320,702 474,796 24
142
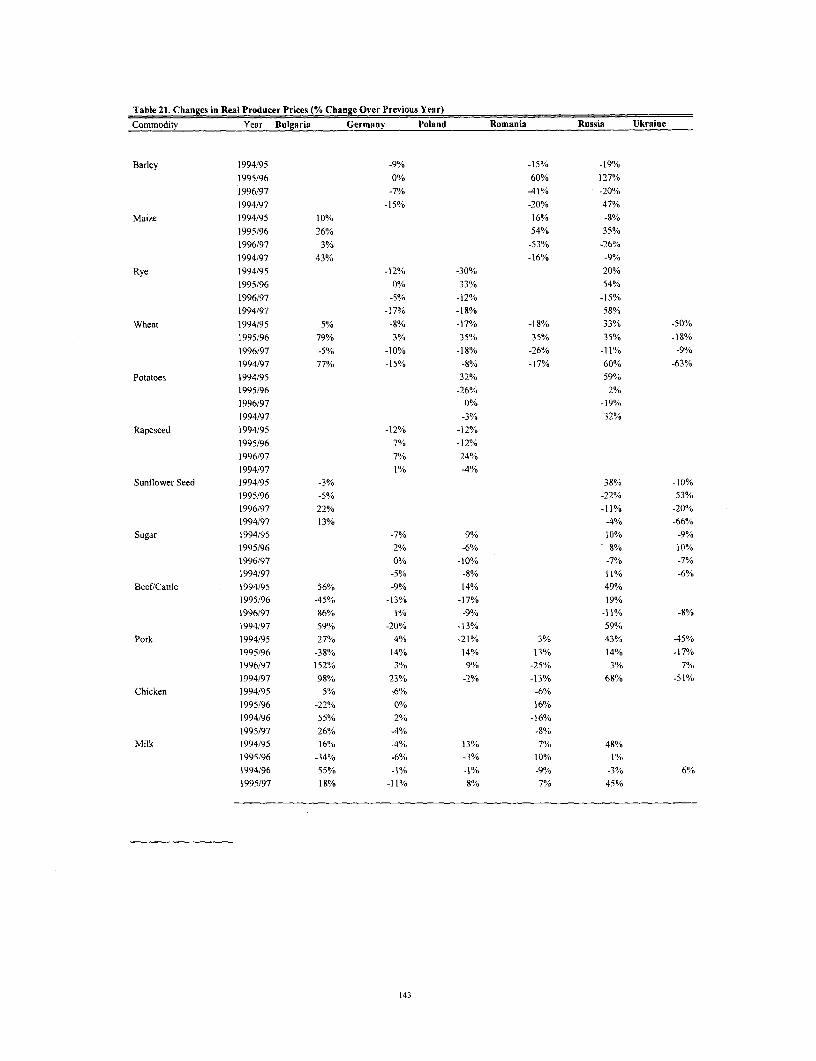
Table 21. Changes in Real Producer Prices (% Change Over Previous Year)
Commodity Year Bulgaria Germany Poland Romania Russia Ukraine
Barley 1994/95 -9% -15% -19%
1995/96 0% 60% 127%
1996/97 -7% -41% -20%
1994/97 -15% -20% 47%
Maize 1994/95 10% 16% -8%
1995/96 26% 54% 35%
1996/97 3% -53% -26%
1994/97 43% -16% -9%
Rye 1994/95 -12% -30% 20%
1995/96 0% 33% 54%
1996/97 -5% -12% -15%
1994/97 -17% -18% 58%
Wheat 1994/95 5% -8% -17% -1 8% 33% -50%
1995/96 79% 3% 35% 35% 35% -18%
1996/97 -5% -10% -18% -26% -11%o9
1994/97 77% -15% -8% -17% 60% -63%
Potatoes 1994/95 32% 59%
1995/96 -26% 2%
1996/97 0% -19%
t994/97 -3% 32%
Rapeseed 1994/95 -12% -12%
1995/96 7% -12%
1996/97 7% 24%
1994/97 1% -4%Sunflower Seed 1994/95 -3% 38% -10%
1995/96 -5% -22% -53%
1996/97 22% -11% -20%
1994/97 13% -4%/ -66%Sugar 1994/95 -7% 9% 10% -9%
1995/96 2% -6% 8%0/ 10%
1996/97 0% -10% -7% -7%
1994/97 -5% -8% 1 1% -6%
Beef/Cattle 1994/95 56% -9% 14% 49%
1995/96 -45% -13% -17% 19%
1996/97 g6% 1/o -99/ -11% -8%
1994/97 59% -20% -13% 59%
Pork 1994/95 27% 4% -21% 3% 43% -45%
1995/96 -38% 14% 14% 13% 14% -17%
1996/97 152% 3% 9% -25% 3% 7%
1994/97 98% 23% -2% -13% 68% -51%
Chicken 1994/95 5% -6% -6%
1995/96 -22% 0% 16%
1994/96 55% 2% -16%
1995/97 26% -4% -8%Milk 1994/95 16% -4% 13% 7% 48%
1995/96 -34% -6% -3% 10% 1%
1994/96 55% -1% -1% -9% -3% 6%/o
1995/97 18% -11% 8% 7% 45%
143
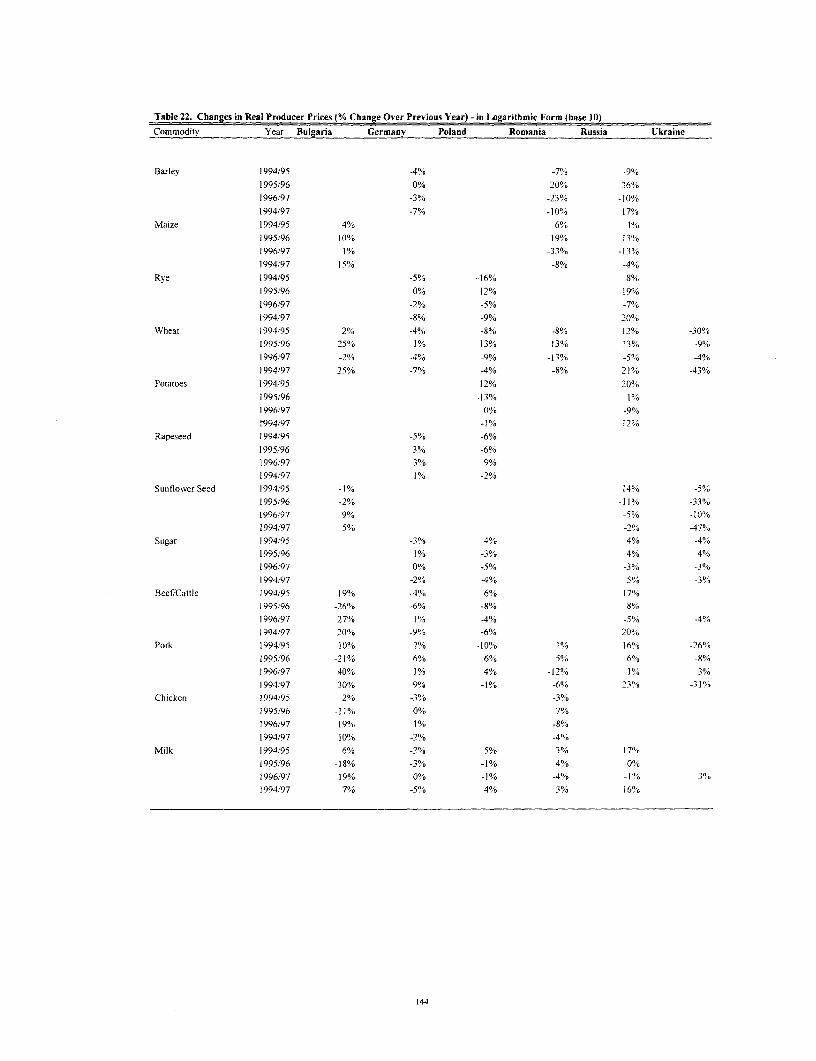
Table 22. Changes in Real Producer Prices (% Change Over Previous Year) - in Logarithmic Form (base 10)
Commodity Year Bulgaria Germany Poland Romania Russia Ukraine
Barley 1994/95 -4% -7% -9%
1995/96 0% 20% 36%
1996,'97 -3% -23% -10%
1994/97 -7% -10% 17%
Maize 1994/95 4% 6% -4%
1995/96 10% 19% 13%1996/97 1% -33% -13%
1994/97 15% -8% -4%
Rye 1994/95 -5% -16% 8%1995/96 0% 12% 19%
1996/97 -2% -5% -7%1994/97 -8% -9% 20%
Wheat 1994/95 2% -4% -8% -8% 12% -30%
1995/96 25% 1% 13% 13% 13% -9%
1996/97 -2% -4% -9% -13% -5% -4%
1994/97 25% -7% -4% -8% 21% -43%
Potatoes 1994/95 12% 20%
1995/96 -13% 1%
1996/97 0% -9%
.994/97 -1% 12%Rapeseed 1994/95 -5% -6%
1995/96 3% -6%1996/97 3% 9%
1994/97 1% -2%Sunflower Seed 1994/95 -1% 14% -5%
1995/96 -2% -11% -33%1996/97 9% -5% -10%
1994/97 5% -2% -47%Sugar 1994/95 -3% 4% 4% -4%
1995/96 1% -3% 4% 4%1996/97 0% -5% -3% -3%
1994/97 -2% -4% 5% -3%
Beef/Cattle 1994/95 19% -40 6% 17%1995/96 -26% -6% -8% 8%
1996,97 27% 1% -4% -5% -4%1994/97 20% -9% -6% 20%
Pork 1994/95 10% 2% -10% 1% 16% -26%
1995/96 -21% 6% 6% 5% 6% -8%1996/97 40% 1% 4% -12% 1% 3%
1994/97 30% 9% -1% -6% 23% -310%Chicken 1994/95 2% -3% -3%
1995/96 -11% 0% 7%
1996/97 19% 1% -8%
1994/97 10% -2% -4%
Milk 1994/95 6% -2% 5% 3% 17%
1995/96 -18% -3% -1% 4% 0%1996/97 19% 0% -]% -4% -1% 3%1994/97 7% -5% 4% 3% 16%
144

Table 23. Real Output Border Prices (in US'94/ton).Commodity Year Bulgaria Germany Poland Romania Russia Ukraine
Barley 1993 - -
1994 - 88 - 93 49 -
1995 - 109 - 69 44 -
1996 - 161 108 104
1997 - 131 - 70 80 -
Maize 1993 - - - -
1994 116 - - 64 128
1995 144 - - 88 128
1996 172 - - 88 181
1997 163 - - 54 128
Rye 1993 - 100 -
1994 - 97 - - 61 -
1995 - 96 40 - 79
1996 - 141 97 - 128
1997 - 113 112 - 105
Wheat 1993 - - 130 - -
1994 132 108 - 141 63 1641995 153 148 94 122 91 145
1996 175 189 180 132 129 172
1997 114 151 104 97 110 131
Potatoes 1993 - - 93 - - -
1994 - 320 - - 112 -
1995 - 383 105 - 194
1996 - 244 99 - 209
1997 - 226 83 - 163 -
Rapeseed 1993 - - 220 -
1994 - 270 -1995 - 288 225 -
1996 - 281 229 -
1997 - 256 250 - - -
Sunflower Seed 1993 - -
1994 234 - - - 1-18 2491995 232 - - - 177 2801996 179 - - - 46 2001997 281 - - - 125 205
Sugar 1993 - - 354 - -
1994 - 352 - - 26
1995 - 377 23 - 32 -1996 - 332 24 - 36 42S
1997 - 286 20 - 32 286
Beef/Cattle 1993 - - 1,071 - -
1994 945 1,391 - - 664
1995 1,411 1,585 1,485 - 1,079 -
1996 1,161 1,329 1,450 - 1,355 1.644
1997 1,406 1,311 1,370 - 162 1, 3 8Pork 1993 - - 1,255 - -
1994 1,100 1,980 - 715 892 1,3s0
1995 1,264 2,273 990 740 1,391 1.367
1996 802 2,149 1,338 801 1,677 1,338
1997 3,193 1,763 1.417 845 1,652 1,417Chicken 1993 - - - - - -
1994 1,400 1,821 - 684
1995 1,030 1,957 - 931
1996 1,467 1,900 - 801 -
1997 2,319 1,629 - 900Milk 1993 - - - - -
1994 321 1,698 - 232 149
1995 334 2,304 - 322 240 -
1996 320 2,064 - 266 255 2.064
1997 154 1,674 - 257 237 1.674
145

Table 24. Changes in Real Output Border Prices (% Change Over Previous Year)
Commodity Year Bulgaria Germany Poland Romania Russia Ukraine
Barley 1994/95 23% -26% -11%
1995/96 48% 55% 139%
1996/97 -19% -35% -23%
1994/97 48% -25% 62%
Maize 1994/95 24% 37% -1%
1995/96 19% 1% 42%1996/97 -5% -39% -29%
1994/97 41% -16% 0%
Rye 1994/95 -1% -60% 30%
1995,/96 47% 141% 62%
1996/97 -20% 16% -18%
1994/97 17% 12% 73%
Wheat 1994/95 16% 37% -28% -13% 45% -12%
1995/96 14% 27% 92% 8% 43% 19%
1996/97 -35% -20% -43% -27% -15% -24%
1994/97 -13% 40% -20% -31% 76% -20%
Potatoes 1994/95 20% 12% 73%
1995/96 -36% -6% 8%1996/97 -8% -16% -22%
1994/97 -30% -11% 45%
Rapeseed 1994/95 7% 2%
1995/96 -3% 2%
1996/97 -9% 9%
1 994/97 -5% 13%
Sunflower Seed 1994/95 -1% 50% 12%1995/96 -23% -18% -28%
1996/97 57% -14% 2%
1994/97 20% 6% -18%
Sugar 1994/95 7% -94% 19%
1995/96 -12% 4% 144%1996/97 -14% -17% -11% -33%1994/97 -19% -94% 22%
Beef/Cattle 1994/95 49% 14% 39% 62%
1995/96 -18% -16% -2% 26%1996/97 21% -1% -6% -14% -19%
1994/97 49% -6% 28% 75%
Pork 1994/95 15% 15% -21% 4% 56% 1%
1995/96 -37% -5% 35% 8% 21% -2%
1996/97 298% -18% 6% 6% -2% 6%
1994/97 190% -11% 13% 18% 85% 5%
Chicken 1994/95 -26% 7% 36%1995/96 42% -3% -14%
1994/96 58% -14% 12%
1995/97 66% -11% 322%
Milk 1994/95 4% 36% 39% 61%
1995/96 -4% -10% -17% 6%
1994/96 -52% -19% -4% -7% -19%
1995/97 -52% -1% 11% 59%
146

Table 25. Changes in Real Output Border Prices (% Change Over Previous Year) - in Logarithmic Form (base 10)Commodity Year Bulgaria Germany Poland Romania Russia Ukraine
Barley 1994/95 9% -13% -5%1995/96 17% 19% 38%1996/97 -9% -19% -12%1994/97 170/. -13% 21%
Maize 1994/95 9% 14% 0%1995/96 8% 0% 15%1996/97 -2% -21% -15%1994/97 15% -r/o 0%
Rye 1994/95 -1% -40% 11%1995/96 17% 38% 21%1996/97 -9% 6%/o -9%1994/97 7% 5% 24%
Wheat 1994/95 6% 14% -14% -6% 16% -5%1995/96 6% 11% 28% 3% 15% 70/01996/97 -18% -10%/o -24% -13% -7% -12%1994/97 -6% 14% -10% -16% 25% -10%
Potatoes 1994/95 8% 5% 24%1995/96 -19% -3% 3%1996/97 -3% -7% -11%1994/97 -15% -5% 16%
Rapeseed 1994/95 3% 1%1995/96 -1% 1%1996/97 -4% 4%1994/97 -2% 5%
Sunflower Seed 1994/95 0% 18% 5%1995/96 -11% -8% -15%1996/97 20% -7% 1%1994/97 8% 2% -8%
Sugar 1994/95 3% -119% 8%1995/96 -6% 2% 6%
1996/97 -7% -8% -5% -18%1994/97 -9% -125% 9%
Beef/Cattle 1994/95 17% 6% 14% 21%1995/96 -8% -8% -1% 10%1996/97 8% -1% -2% -7% -9%1994/97 17% -3% 11% 24%
Pork 1994/95 6% 6% -10% 1% 19% 1%1995/96 -20% -2% 13% 3% 8% -1%1996/97 60% -9% 2% 2% -1% 2%1994/97 46% -5% 5% 7% 27% 2%
Chicken 1994/95 -13% 3% 13%1995/96 15% -1% -7%1996/97 20% -7% 5%1994/97 22% -5% 12%
Milk 1994/95 2% 13% 14% 21%1995/96 -2% -5% -8% 3%1996/97 -32% -9% -2% -3% -90/1994/97 -32% -1% 4% 20%
147

Table 26. Real Exchange Rate (LCU/JUSs)
Commodity Year Bulgaria Germany Poland Romania Russia UkrraineBarley 1993 - - - - -
1994 - 1.6 - 1,655 2,204
1995 - 1.4 - 1,603 2,0271996 - 1.5 1,777 1,924 -
1997 - 1.8 - 1,661 2,004Maize 1993 - - -
1994 51 - - 1,655 2,2041995 42 - - 1,603 2,0271996 67 - - 1,777 1,924 -
1997 III - - 1,661 2,004 -
Rye 1993 - - 2.4 -
1994 - 1.6 - - 2,204 -
1995 - 1.4 2.0 - 2,027 -
1996 - 1.5 1.9 - 1,924 -
1997 - 1.8 2.0 - 2,004 -
Wheat 1993 - 2.4 - -
1994 51 1.6 - 1,655 2,204 0.811995 42 1.4 2.0 1,603 2,027 0.361996 67 1.5 1.9 1,777 1,924 0.231997 III 1.8 2.0 1,661 2,004 0.20
Potatoes 1993 - - 2.4 -
1994 * 1.6 - - 2,204 -
1995 - 1.6 2.0 - 2,0271996 - 1.7 1.9 - 1,924 -
1997 - 1.7 2.0 - 2,004 -
Rapeseed 1993 - - 2.4 -
1994 - 1.6 - . -
1995 - 1.4 2.0 - -
1996 - 1.5 1.91997 - 1.8 2.0 - - -
Sunflower Seed 1993 - - -
1994 51 - - - 2,204 1.151995 42 - - - 2,027 0.391996 67 - - - 1,924 0.231997 109 - - - 2,004 0.20
Sugar 1993 - - 2.4 - -
1994 - 1.6 - - 2,204 0.62
1995 - 1.4 2.0 - 2,027 0.351996 - 1.5 1.9 - 1,924 0.231997 - 1.8 2.0 - 2,004 0.20
Beef/Cattle 1993 - - 2.4 - -
1994 5 1 1.6 - - 2,204 -
1995 42 1.4 2.0 - 2,027 -
1996 67 1.5 1.9 - 1,924 0.23
1997 110 1.8 2.0 - 2,004 0.20Pork 1993 - - 2.4 - -
1994 51 1.6 - 1,655 2,204 0.621995 42 1.4 2.0 1,603 2,027 0.35
1996 67 1.5 1.9 1,777 1,924 0.231997 109 1.8 2.0 1,661 2,004 0.20
Chicken 1993 - - -
1994 51 1.6 - 1,655 -
1995 42 1.4 - 1,603 - -
1996 67 1.5 - 1,7771997 110 1.8 - 1,661 -
Milk 1993 - - 2.4 - - -
1994 51 16 - 1,655 2,204
1995 42 1.4 2.0 1,603 2,027 -
1996 67 1.5 1.9 1,777 1,924 0.231997 109 1.8 2.0 1,661 2,004 0.20
148

Table 27. Changes in Real Exchange Rate (% Change Over Previous Year)
Commodity Year Bulgaria Germany Poland Romania Russia Ukraine
Barley 1994/95 -10% -3% -S%1995/96 6% 11% -5%
1996/97 16% -7% 4%1994/97 11% 0% -9%
Maize 1994/95 -16% -3% -8%1995/96 58% 11% -5%1996/97 65% -7% 4%1994/97 119% 0% -9%
Rye 1994/95 -10% -17% -8%1995/96 6% -5% -5%1996/97 16% 7% 4%1994/97 11% -15% -9%
Wheat 1994/95 -16% -10% -17% -3% -8% -55%1995/96 5S% 6% -5% 11% -5% -37%1996/97 65% 16% 7% -7% 4% -11%1994/97 119% 11% -15% 0% -9% -75%
Potatoes 1994/95 1% -17% -8%1995/96 1% -5% -5%1996/97 1% 7% 4%1994/97 3% -15% -9%
Rapeseed 1994/95 -10% -17%1995/96 6% -5%1996/97 16% 7%1994/97 11% -15%
Sunflower Seed 1994/95 -16% -8% -66%1995/96 58% -5% -42%1996/97 62% 4% -11%1994/97 114% -9% -82%
Sugar 1994/95 -10% -17% -8% -44%1995/96 6% -5% -5% -35%1996/97 16% 7% 4% -11%1994/97 11% -15% -9% -67%
Beef/Cattle 1994/95 -16% -10% -17% -8%1995/96 58% 6% -5% -5%1996/97 64% 16% 7% 4% -11%1994/97 117% 11% -15% -9%
Pork 1994/95 -16% -10% -17% -3% -8% -44%1995/96 58% 6% -5% 11% -5% -35%1996/97 62% 16% 7% -7% 4% -11%1994/97 115% 11% -15% 0% -9% -67%
Chicken 1994/95 -16% -10% -3%1995/96 58% 6% 11%1994/96 64% 16% -7%1995/97 117% 11% 0%
Milk 1994/95 -16% -10% -17% -3% -8%1995/96 58% 6% -5% 11% -5%1994/96 62% 16% 7% -7% 4% -11%1995/97 115% 11% -15% 0% -9%
149
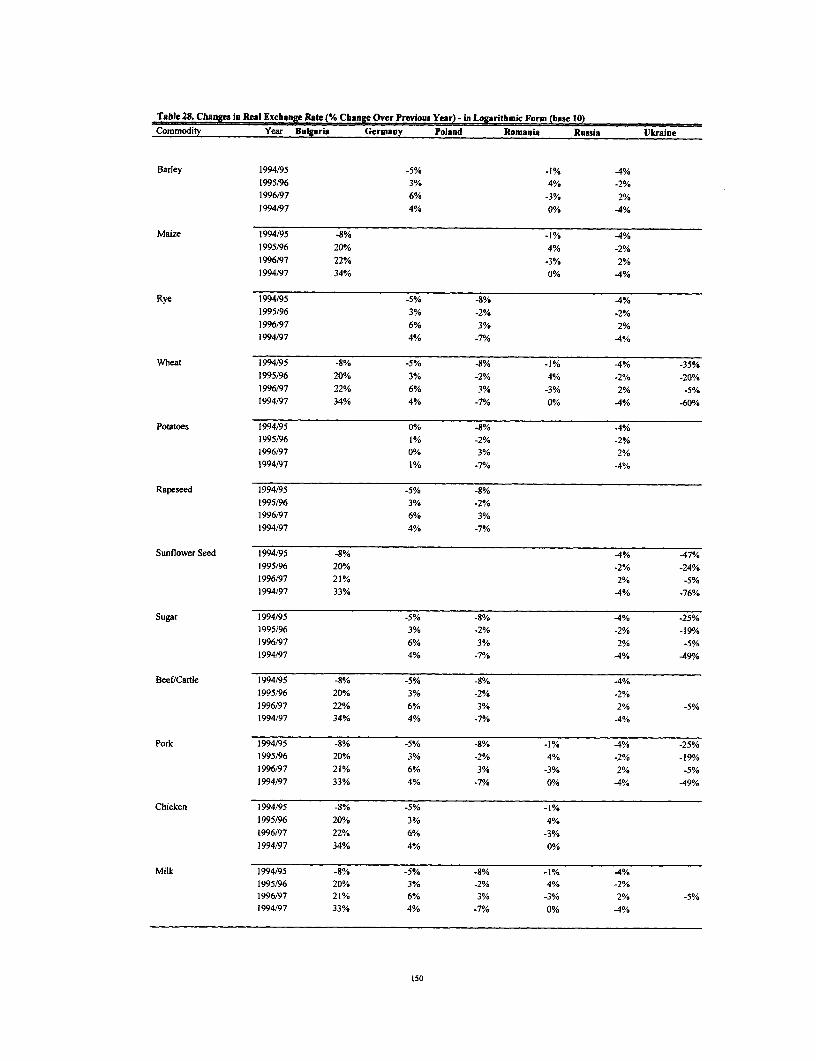
Table 2. Changes in Real Exchange Rate (% Change Over Previous Year) - in Logarithmic Form (base 10)Commodity Year Bulgaria Germany Poland Romania Russia Ukraine
Barley 1994/95 -5% -1% -4%1995/96 3% 4% -2%1996/97 6% -3% 2%1994/97 4% 0% -4%
Maize 1994/95 -8% -1% 4%1995/96 20% 4% -2%1996/97 22% -3% 2%1994/97 34% 0% 44%
Rye 1994/95 -5% -8% 4%1995/96 3% -2% -2%1996/97 6% 3% 2%1994/97 4% -7% -4%
Wheat 1994/95 -8% -5% -8% -1% -4% -35%1995/96 20% 3% -2% 4% -2% -20%1996/97 22% 6% 3% -3% 2% -5%1994/97 34% 4% -7/o 0% 4% -60%
Potatoes 1994/95 0% -8% 4%1995/96 1% -2% -2%1996/97 0% 3% 2%1994/97 1% -7% -4%
Rapeseed 1994/95 -5% -8%1995/96 3% -2%/e1996/97 6% 3%1994/97 4% -7%
Sunflower Seed 1994/95 -8% -4% 47%1995/96 20% -2% -24%1996/97 21% 2% -5%1994/97 33% 4% -76%
Sugar 1994/95 -5% -8% 4% -25%1995/96 3% -2% -2% -19%1996/97 6% 3% 2% -5%1994/97 4% 7O/, 4% 49%
BeeflCattle 1994/95 -8% -5% -8% 4%1995/96 20% 3% -2% -2%1996/97 22% 6% 3% 2% -5%1994/97 34% 4% -7% 4%
Pork 1994/95 -8% -5% -8% -1% 4% -25%1995/96 20% 3% -2% 4% -2% -190/1996/97 21% 6% 3% -3% 2% -5%1994/97 33% 4% -7% 0% -4% -49%
Chicken 1994/95 -8% -5% -1%1995/96 20% 3% 4%t996/97 22% 6% -3%1994/97 34% 4% 00/D
Milk 1994/95 -8% -5% -8% -1% -4%1995/96 20% 3% -2% 4% -2%1996/97 21% 6% 3% -3% 2% -5%1994/97 33% 4% -7% 0% 4%
150

Table 29a. Decomposition of Real Producer Prices for Wheat (percent change) a/
Country Period Real Domestic Real Exchange Attributable toPrices Border Prices Rate Trade Policies
Bulgaria 1994/95 2% 6% -8% 4%1995/96 25% 6% 20% -1%1996/97 -2% -18% 22% -6%1994/97 25% -6% 34% -3%
Poland b/ 1993/95 -8% -14% -8% 14%1995/96 13% 28% -2% -13%1996/97 -9% -24% 3% 12%1993/97 -4% -10% -7% 13%
Romania 1994/95 -8% -6% -1% -1%1995/96 13% 3% 4% 5%1996/97 -13% -13% -3% 3%1994/97 -8% -16% 0% 8%
Russia 1994/95 12% 16% -4% 0%1995/96 13% 15% -2% 0%1996/97 -5% -7% 2% 0%1994/97 21% 25% -4% 0%
Ukraine 1994/95 -30%/o -5% -35% 10%1995/96 -9% 7% -20% 4%1996/97 -4% -12% -5% 12%1994/97 -43% -10% -60% 27%
Germany 1994/95 -4% 14% -5% -12%1995/96 1% 11% 3% -12%1996/97 -4% -10% 6% -1%1994/97 _7/ 14% 4% -26%
Table 29b: Decomposition of Real Producer Prices for Pigmeat (percent change) at
Country Period Real Domestic Real Exchange Attributable toPrices Border Prices Rate Trade Policies
Bulgaria 1994/95 10% 6% -8% 12%1995/96 -21% -20% 20% -21%1996/97 40% 60% 21% -41%1994/97 30% 46% 33% -50%
Poland b/ 1993/95 -10% -10% -8% 8%1995/96 6% 13% -2% -5%1996197 4% 2% 3% -2%1993/97 -1% 5% -7% 1%
Romania 1994/95 1% 1% -1% 1%1995196 5% 3% 4% -3%1996/97 -12% 2% -3% -12%1994197 -6% 7% 0% -13%1994/95 16% 19% -4% 0%1995/96 6% 8% -2% 0%1996197 1% -1% 2%1994/97 23% 27% 4%
Ukraine 1994/95 -26% 1% -25% -1%1995/96 -8% -1% -19% 12%1996/97 3% 2% -5% 5%1994/97 -31% 2% 49% 16%
Germany 1994/95 2% 6% -5% 1%1995/96 6% -2% 3% 6%1996/97 1% -9% 6% 3%1994/97 9% -5% 4% 10%/.
Note: Pd , Pw, and RER represent the domestic price, the border price, and thereal exchange rate, respectively. Percent change is computed as difference ofthe logarithms (base 10). TP represents changes attributable to trade policies.
151

Table 30. Trade Status
Conunodity Year Bulgaria Germany Poland Romania Russia Ukraine
Barley 1993 - -
1994 - M - M M -
1995 - M - X X1996 - M - X M -
1997 - M - X X
Maize 1993
1994 M - - X M -
1995 M - - X M1996 M - - X M1997 M - X M
Rye 1993 - M1994 - M - - M1995 - M M M
1996 - M X - M1997 . M X M M
\1Vheat 1993 - - M1994 X M - X M X
1995 X M M X M X
1996 X M M X M X
1997 X M M X M X
Potatoes 1993 X
1994 - M - - M1995 - M X - M
1996 - M X - M -
1997 - M X - X
Rapeseed 1993 - - X
1994 - M - - -
1995 - M X - -
1996 - M X - - -
1997 M X - - -
Sunflower Seed 1993
1994 X - - - X X
1995 X - - - X X1996 X - - - X X
1997 X - - - X X
Sugar 1993 - - X
1994 - M - - M X
1995 - M M - M X
1996 - M M - M X1997 - M M - M X
Beef/Cattle 1993 - - X1994 X M - - M X
1995 X M X - M X
1996 X M X - M X
1997 X M X - M X
Pork 1993 - - M1994 X M - X M X
1995 X M X X M X
1996 X M X X M X
1997 X M X X M X
Chicken 1993
1994 X M - M -
1995 X M - M1996 X M - M -
1997 X M - MMilk 1993 - - X -
1994 X M - M M X
1995 X M X M M X
1996 X M X M M X
1997 M M X M M X
152

Distributors of World Bank Group Publications
Prices and credit terms vary from CZECH REPUBLIC INDIA Euyo rulihn CLd. PERU SEEcountry ryConsult your S, NS Prodena Allied Publishers Ltd E4u61ySooSusongng Co, LA Editorial Desarrollo SA Wennergren-Williams ABlocal distributor betore placing an Havelkova 22 751 Mount Road Jongro-Gu Apartado 3824, Ica 242 OF 106 P. 0 Es 1305order 130 00 Prague 3 Madras - 600 002 Seoul Lima 1 S-1t 25 Snlna
Tel: (420 2) 2423 1486 Tel. (91 441852-3938 Tel: (82 2) 734-3515 Tel: (5t t41 285360 Tel: (46 8 705-97-50
ARGENTINA Fax: (4202 2423 11t4 Fax: (91 44) 852-0649 Fax: (822) 732-9154 Fan: (51 14)286628 Fax:0(4 rD27i.s7
World Publications SA URL: ht :/1www.nis.cz/ INDNESIA LEBANOE-mail: mailwi.
An. Cordoba 1877 DENMARK Pt. Indira Limited Librairie du Liban International Booksource Center Inc. SWITZERLAND1120 Ciudad de Buenos Aires SamfundsLitteratur Jalan Borobudur20 PO. Box 11-9232 1127-A Antipolo St, Barangay, Librairie PayotService InstitutionnelTel: (5411) 4815-81565 Rosenoerns AMi 11 PO. Box 181 Beirut Venezuela C120)Lusunne 30
FE-mail: [email protected] DK-1970 Frederiksberg C Jaata 1&'6l013)2390 Tel: (961 9) 217 9434 TMea.k(atji32 ; City 12o fOLausanneE-mail: [email protected] Tel: (45 351 351943 Tel: (62 211 390-4290 Fax: (961 9) 217 434 Tel: (63216896 6501; 6505: 6507 Tel: (41 211 341-3229
AUSTRALIA, FIJI, PAPUA NEW Fax: (45 351357822 Fax: (82 2f) 390-4289 E-mail: hsayegh@librairie-du- Fax: (63 2) 896 1741 Fax: (41 21) 341-3235
GUINEA, SDLOMON ISLANDS, URL: htnp:/Anww.sL.cbs.dk IRAN liban.com.lb POLAND ADECO Van Diermen
VANUATU, AND SAMA ECUADOR KbSa URL: tpJ/w brairie-du- International Publishing Service EditionsTechniquesD.A. tnformation Services LibADRiod Ketabe ESaamG.PbaliAshe,8hSree liban.com.lb Ul. Piekna 31/37 Cli. de Lacuez 41
848 Whitehorse Road Lihreria Internacionoal Delatrooz Alley No. 8 MALAYSIA 00-677 Warzawa 061807 Blornad.Mitcham 3132, Victoria RO, Boo 17-01 -3029 R.O. Boo 15745-733 University ot Malaya Cooperative Tel: (48 21628-6088 Tel: (41 21( 943 2673
Tel- (6) 3 920 7777Juan Leon Mona 951 Tehran 15117 Bookshop, Limited Pus: (48)621-7255 Pus: (41 21) 943 3605
Fax: (61) 3 9210 7788 Quito Tel: (98 211 8717819; 8716104 PO. Box 1127 E-mal: books%[email protected] THAILANDE-mail. [email protected] Tel: 593 2) 521-606; (593 2) 544- Fax: (98 21) 8712479 Jalan Pantal Baru URL: Central Bookt Distribution
URL: hotp://www.dadirect.corn.au tos, E-mail: [email protected] 69700 Kuala Lampor Oittp:/)va .impscg.maw.tddips/exopt 308 Silom Road
AUSTRIA Fax: (593 2) 504-209 Kowkab Publishers Tel: (60 3) 756-5000 PORTUGAL Bangkok 10500
Gerold andCo E-mail: [email protected] PO Box 19575-511 Pus:(6)755424Lirria Portugal Tel: (66 2)2336930-9Weihburg s 26E-mail: [email protected] TernE-mail: [email protected] my Apanlado 2881, Rua Do Carm Fan: (6621237-0321
A-Tell Wren CDDEU Tel: (98 211 258-3723 MEXICO S 70-74 . TRINIDAD ATOBAGOTel: (43 1) 512-47-31-0 Ruz de Castlla 763, Edit. Expocolor Fax: (98 2 258-3723 INFOTEC 1200 Lisbon AND THE CARRIBBEAN
URL htp:fwwwgeoIdC0/t-Dfi Primer pito, Dl. #2 IRELAND As. San Fernando No,.37 Tel: (1) 347-4982 Systemafics Studies Ltd.UR:http://arsaogerold.co/at.05line Quito P Col. Toriello Guerra Fax: (1) 347-0264 St. Augustine Shopping Center
BANGLADESH Tel/Fax: (593 2) 507-303~ 253-091 Government Supplies Agency 14050 Meoico, D.FCatr Mi oa St. Augustine Sopn etr
Micro Industries Development E 0al oluIrpa.e 4-is an tSol rairo Tel: (5251 624-2800 haTerinia Mu Robado, Wst. AInuoivesAssistance Society (MIDAS) EGPTRA5RPBLCHFarourtRa E-ail: i$2 824-2922 ROMAN4IA Trinda &86 Tobgo,WesInie
House 5, Road 1EGYPT, ARAB REPUBLIC OF Dublin 2 E-mati: [email protected] Compani De Librarii Bucureoti S.A. Fax:1)86d) 845-8467
Dhameond RoArd 1CA Ahram Distribution Agency Tel: 13531) 681-3111 URL, *htp:/rtn.netn.m Str. Lipscani no. 26, sector 3 EOhanmondi li/Area ~~~Al Galaa Street Pus: (353 1) 475-2670 Emi:twtiia.e
Ohaka 1209 Cairo ISALMundi-Prensa Mexico SA. do CV. BucharestTel: ( 2322)53S-08427 ISRAEL 2i393-9732POBox13056Ec/Rio Panuco, 141-CoIrnaionalrv Tel: (40 1)3139845 UGANDAubliFax. e Tecnicas Internacion FTel: (20 2)i578-6083 Yomot Literature Ltd. C ( 3 Fan: (40 F) 312 4000 4GusNro Ltd.
01409SaoPaulo,SPFax: (356 2) 57B-68335 UtRD BcPD Boo 9997, Madheani BuildingBELGIUM Foe:.(202) 578-6330oo00 Mexico, 5.E RUSSIAN FEDERATIONPlt1/JiaRd
Jean Do Lannoy The Middle East Obserer 3 Yoaana asandar Street Tel: (52 5 na533-5858 lsdatelotaS <Ves Mir> Po pa 1. c RAv. do Rol 202 41, Shefd Street Tel Avis 61560 a: e52 5)514-6799 9a, Kolpachii Pereulok Kampala
Cairo Tot::(9723) 5285-397 Mso1031Tel: (256 411251 4671060 BmusselsTel: (20( 2 393-9732 :Fax (972 3) 5285-397 NEPAL MaxoscowarsP: (25841) 251 460Otel:wajOnbarioK1J9J3 Fa (20 2) 393-9732 EverestaCommissinariaSansoniSPAvices Tel: 17 095)917 07 49 E-mail: gusswiftuguanda.comFa) 538-5418 RGOMY. International E tr .M e Fax: (7 090) 917 92 59Faa: [email protected] (32pei4d538-0941eeSSFINLAND PD Boo 13058 JPLtd.x5443 ozinmanaringlasnetrvu UNiTED KINGDOM
BRAZIL Gr o 43Micrainfo Ltd.
PRL ettp://wwweouicas boternaioksais 5Ateemioen Kiriakauppa Tel Avis 61130 Kathmandu SINGAPORE; TAIWAN, CHINA o. Boxd3, ODinea Park, aron,;blishienicas FnternacionaisoPR. Boa 128 Tel: (9723 3499469 Tel: ( 4 026MYAnMAR; BRUNEIfiLl GHANAa206 Old Fax: Road, K n 6 (977 OasisQfficialVasco9oulevard,Goodwood) ZHampshire A 23
Ltda. 209 P16~~~~FI-00101 Helsinki Pu:(92148 6039 Fa i7 (224 431 Hemisphiere Publication ServicesRia Peixoto Gomide, 209 Tel: EpBo s E-mail: royPnelve7iion.netAI a: 9 7 41 Boxt2an 9,Pud inRd403 U England
0149 aoPalo S. 1 alan PddngRod- 5403 Tel: (44 1420 986840Fax (358 P o 121-443 URL: http://www.royint.co.il NETHERLANDS Golden Wheel BuildingFaa
China Book Impor 2 entre E4-maCl3 E-ai. [email protected](sgs4tockmann.fiax (7 )S9 43 Fax *4 14o 89379
Fax: (55 O 1) 258-6990 eil: ia n Palestinian AutBority/Middle East De Liodeboom/nternationalz Singapore 349316 E-mail: (a2 mi5 rint.c.9kh-mail. [email protected] URL: http://wo.uleateemiseo.com ndex Intormahon Services Publication ho.- Tel: (65) 741-5168 U
URiL hiOp:/t%vww.uoI hr FRANCE R.OB. 19502 Jerusalem RDO. Boo 202, 7480 AE Haaksbergon Faa: (65) 742-93506dL tp/w.iril.ouCANAA H iEditions ( aio DBJ Tel:(972 21 6271219 Tel: (31 53) 574-0004 E-mail: [email protected] The Stationery otfice
EANADA6 4 Fax(301)364-82448 rae Gay Lussac Fax: (9722(a6271634 Faa: (31 53)(572-9296 SLOVENIA 51 Nine Elms LaneRenotf Publishing Co. Ltd 75005 Paris ALY, BERIA E-mail: lindebooWworldonline.ril Gbros, London SWF 2 7R5389 Canotek Rood TTALY ,CLL: t/wdIA 27lltHue fnalin- Gosprearsk vestik Puhcisyi ng T 1
awaf do otar D 9Tel (3 ) 2 9260 Licosa Commissioa Sansoni SPA 0Group P: (44 171 873-824
Otaa, (57 i Kl) 2S79,8 Fax: (33-1) 4329-91567 Fax:o Fax: (44 173 873-8242242)57336°1 -m(i ibeamndirenns
Tel: (813) 745-2665 deVia Dura Di Calabria, 1H1 debnunae cesta S URL: http://wnwsw.the-stafionery-Pu. (63 1745-7666 GERMANY CaselSa Postale 552 NEW ZE aLaNeb s office.co.ukB e
E-mail: UND-Verlag 50125 Firenze NEC ZEALtND Tel: (3066111338347; 1321230sider [email protected] Poppelsdotter Allee 55 Tel: (39 55)645-415 PriSute Mai Bug. 991an: (386861)133 8030 VENEZUELA
URL hltp:// w-ww.renoutbookso.com 53115 Boon Fan: (39 51 8 41-257 New Market E-alCeaok@ssnki Tentr-Cuiesci Libercis, SamacCYPRUS Tel: (49 228s 949220 E-mail: [email protected] Auckland SOUTH AFRICA BOTSWANA GAentr2, iadariTChina Fnnil&Eooi Pan: (49 228) 217492 dRL: httply/wwm.bbcc.allicosa Tel: (849) 524-8119 For single titles: NTel:5 C2, Caracas 503;01
Publishing HousAppliedRes8ar URLe htp:llww asia2Kde8. Da Fo Si Dong Jie E-loIan Rundle Publiobers Ltd AricaaBeijing GHANA 206 Osld Hope Road, Kingston 6 Oasis official Vasos Boulevard, Goodwood ZAMBIATel. (061018401-7385 Epy Books Services Tel:976-927-2085 RD. Boo 3627 P.O. Boo 12119,61 City 7463 University Book2hop, University at
Pus. (86106401-7365 PO. Boo 44 Fan 876-977-0243 Wellington Cape Tows ZambiaTUxC E-mail. irpl6coli.com Tel: (6 4 499 1551 Tel: (27 211 5954400 Groat East Road Campus
Cb.na 9Bok 2m8 st2Ce JAAN Fa: i(44(4991972 Pus: (27 21595 4430 PD. Boo 3237983 Cm ima: oasisactrix.geo.z E-mail: ofordpoup.co.za Lusaka
Beijing Tel: 223 21 77884 Eastem Book Service ~~~URL: htop:l/wwwsa.asisboooks.co.nzf Parsuscrpton2rdrs ~ %1? 252576Boi(iog Pus~~~~~~Fa: 223 21 779099 3-13 Hongo 3-chosie, Bunkyo-ku Intrnabsritional rdSrb:cripti26n Sorvic95
Chinese Corporation fsr Promotios GREECE Tokyo 113 NIGERIA ItrD.tBooa 41095 itio ZIMBABWE
ot HumanitiesPaaoiiuSATe:(1331081UiestPrsLiieP..Bx49 ZM BW
02. You Pang Hul Tong,35 PpSotioumr StA. Tat: (81 3(318-0861 Unreert Presns uimditgedih Craighall Academic and Baobab Books (Pvt.)
Xuan Nei Da Joe 35.8 Atohmar SIr.maa: (81 e3(3818-0884 .o Th revae Crown Buidig Jerich Johannesburg 2024 Ltd.BeijingTl3 106 826Athens h-maL: rdrWseb.op PiaoMlBg500Tel (27 11) 880-1449 4 Cosald Road, GranitesideTel (866101660 72 484 Te:3134-96L badan Fax: (27 11) 880-6248 RD Boo 567Pus: (06 101)660 72 494 Fax. (30 1(364-0254 hItp://www.bekkonrno.or.ipl-svt- Tel (234 22141-1356 E-mal: Ws.co,za Harare
COLOMBIA ~~~~~~~~HAITI ebs Pus: (23422) 41-2056 Tel: 263 4755635COLOMBIA Ctilture Diffusion KENYA ~~~~~~~~~~~~~~SPAIN Fas: 2634 701913
Cnonarrer 6LN.d5-2 5. Rue Capois Atdcra Book Servico (ECA.) Ltd. PAKISTAN Mundi-Prensa Libros, S.A.Carrera 6No. 51-21C.R. 257 Duaran House, Mtangano Street Mirza Book Agescy Castelon 37
Apadtado Aereo 34270 Port-au-Prince RDO. Boo 45245 65. Shahrah-e-Quaid-e-AZamn 28001 Madridaattdd ogl,.CTel: (509123 9260 Naimobi Lahore 54000 Tel. (34 911 4 303700
Tal (57 1(28S-2798 Pus: (500) 23 4858 Tel: (254 2) 223 641 Tel. (92 42~ 735 3601 PFas. (34 91 (5753998Fax j57 1)285-2798BONG KONG, CHINA; MACAD Fas: (254 2) 330 272 Tao: (92 4 (676 3714 E-mail: [email protected]
COTE D'IBOIRE UROL: hftp://ww.nmundiprensa.corniCenter d'Edibson et do Diffusion Asia 2000 Ltd. Legacy Banks DOxord University Press Muodi-Pressa BarcelonaAtricainos (CEDA) Soles & Circulation Department Loita House 5 Bangalore Town Conseil de Cent, 391
04 8.P 541 302 Seahird House Mezzanine 1 Sharae Faisal080BaclnAbidjan 04 22-28 Wyndham Street. Central RDO. Boo 68077 PO Boo 13033 08909 Barcelona349
Tel:(225 246510 24 511 Hong Kong, China NairobiKach750Tel: (225( 24 6510 46 51 Te:852) 2530-1409 Tel: (2541 2-330853, 221426 Tea,ac9h21-75307 Tel: (34 3 400-34592
Pus: )325( 25 0567 ~~Fax: (5) 2526-1107 Fax: (254)3084 5681654 Te. 9214430maal: (34 elon407-7659 ns.e
CYPRUS E-mail: [email protected] E-mail: PeayDointo an: (9202114847840E-albtcon@udiroSeCenter tor Applied Research URL http:/Legacy@iarm-necocomkE-mail: [email protected] SRI LANKA, THE MALDIVES
Centru Corlpliede Reerh UThp/m ai20.o.k KOREA, REPUBLIC OF Lake House BDokshopCyprus College - ~~~HUNGARY Dayasg Books Trading Co. Pak Book Corporation 100, Sir Chittampalam Gardiner
B, Diogenes Street, Engomni Euro Into Service Intemnational Division Adoz Chambers 21, Queen's Road MawathaR.O. Boo 2006 Margitszoeti Europa Haz 783-20. Pangba Bon-Dong, Lahore Colombo 2
Teli(37250-73 H-1138 audapest SDchDs-ku Tel: (92 42 636 3222; 636 0805 Tel: (94 t) 32105Pan: 357 2I66-2051 Te:(6 5 02.308 5 Seoul Faa: (924 ()636 2328 Fa:41 432059-0730 Telas '36 1350 90324 Td.E-ai: bchrin25.p
Fa Fax (36 ~~~) 350 go 32 Tel: ~(822 536-00555Emi:ltcbane.i E-mail ALULsri.lanka.oetE-mail [email protected] Fan.(2~ 5602
E-mail: [email protected]


Recent World Bank Technical Papers (continued)
No. 432 Luiz Gabriel Azevedo, Musa Asad, and Larry D. Simpson, Management of Water Resources: Bulk WaterPricing in Brazil
No. 433 Malcolm Rowat and Jose Astigarraga, Latin American Insolvency Systems: A Comparative Assessment
No. 434 Csaba Csaki and John Nash, eds., Regional and International Trade Policy: Lessonsfor the EU Accession in theRural Sector-World Bank/FAO Workshop, June 20-23, 1998
No. 435 lain Begg, EU Investrnent Grants Review
No. 436 Roy Prosterman and Tim Hanstad, ed., Legal Impediments to Effective Rural Land Relations in Eastern Europeand Central Asia: A Comparative Perspective
No. 437 Csaba Csaki, Michel Dabatisse, and Oskar Honisch, Food and Agriculture in thie Czech Republic: From a"Velvet" Transition to the Challenges of EU Accession
No. 438 George J. Borjas, Economic Research on the Determinants of Immigration: Lessonsfor the European Union
No. 439 Mustapha Nabli, Financial Integration, Vulnerabilities to Crisis, and EU Accession in Five Central EuropeanCountries
No. 440 Robert Bruce, loannis Kessides, and Lothar Kneifel, Overcoming Obstacles to Liberalization of the TelecomSector in Estonia, Poland, the Czech Republic, Slovenia, and Hungary: An Overview of Key Policy Concerns andPotential Initiatives to Facilitate the Transition Process
No. 441 Bartlomiej Kaminski, Hungary: Foreign Trade Issues in the Context of Accession to the EU
No. 442 Bartlomiej Kaminski, The Role of Foreign Direct Investment and Trade Policy in Poland's Accession to theEuropean Union
No. 443 Luc Lecuit, John Elder, Christian Hurtado, Francois Rantrua, Kamal Siblini, and Maurizia Tovo,DeMIStifying MIS: Guidelines for Management Informat iotn Systems in Social Funlds
No. 444 Robert F. Townsend, Agricultural Incentives in Sub-Saharan Africa: Policy Challenges
No. 445 Ian Hill, Forest Management in Nepal: Economics of Ecology
No. 446 Gordon Hughes and Magda Lovei, Economic Reform and Environmental Performance in Transition Economies
No. 447 R. Maria Saleth and Ariel Dinar, Evaluating Water Institutions and Water Sector Performance
No. 449 Keith Oblitas and J. Raymond Peter in association with Gautam Pingle, Halla M. Qaddumi, and JayanthaPerera, Transferring Irrigation Management to Farmers in Andhra Pradesh, India
No. 450 Andres Rigo Sureda and Waleed Haider Malik, eds., Judicial Challenges in the New Millennium: Proceedingsof the Second Summit of the Ibero-American Supreme Courts
No. 451 World Bank, Privatization of the Power and Natural Gas Industries in Hungary and Kazakhstan
No. 452 Lev Freinkman, Daniel Treisman, and Stephen Titov, Subnational Budgeting in Russia: Preempting aPotential Crisis
No. 453 Bartlomiej Kaminski and Michelle Riboud, Foreign Investment and Restructuring: The Evidencefrom Hungary
No. 454 Gordon Hughes and Julia Bucknall, Poland: Complying with EU Environmental Legislature
No. 455 Dale F. Gray, Assessment of Corporate Sector Value and Vulnerability: Links to Exchange Rate and FinancialCrises
No. 456 Salman M.A. Salman, ed., Groundwater: Legal and Policy Perspectives: Proceedings of a World Bank Seminar
No. 457 Mary Canning, Peter Moock, and Timothy Heleniak, Reforming Education in the Regions of Russia
No. 458 John Gray, Kazakhstan: A Review of Farm Restructuring
No. 459 Zvi Lerman and Csaba Csaki, Ukraine: Review of Farm Restructuring Experiences
No. 460 Gloria La Cava and Rafaella Y. Nanetti, Albaniia: Fillizg the Vulnerability Gap
No. 461 Ayse Kudat, Stan Peabody, and Caglar Keyder, eds., Social Assessment and Agricuiltural Reform in CentralAsia and Turkey
No. 463 Stephen Foster, John Chilton, Marcus Moench, Franklin Cardy, and Manuel Schiffler, Groundwater inRural Development: Facing the Challenges of Supply and Resource Sustainability
No. 465 Csaba Csaki and Zvi Lerman, eds., Structural Change in the Farming Sectors in Central and Eastern Europe:Lessonsfor EU Accession-Second World Bank/FAO Workshop, June 27-29, 1999
No. 466 Barbara Nunberg, Readyfor Europe: Public Administration Reform and Europeani Union Accession in Centraland Eastern Europe
No. 469 Laurian Unnevehr and Nancy Hirschhorn, Food Safety Issues in the Dezveloping World
THE WORLD BANK
1818 H Street, N.W.
Washington, 1).C. 20433 U.S.A.
Telephone: 202-477-1234
Facsimile: 202-477-6391
Telex: MCI 64145 WORLD13ANK
MCI 248423 WORI-DBANK
Internet: www.worldbank.org
E-mail: books(etworldbank.org
ISBN 0-8213-4771-3