
policentrometer - icspconference.files.wordpress.com file18/12/2016 · Problem definition (by...
34
policentrometer Lorenzo Gabrielli Daniele Fadda • Giulio Rossetti Mirco Nanni • Fosca Giannotti Dino Pedreschi • Leonardo Piccini
Transcript of policentrometer - icspconference.files.wordpress.com file18/12/2016 · Problem definition (by...

policentrometer
Lorenzo GabrielliDaniele Fadda • Giulio RossettiMirco Nanni • Fosca Giannotti
Dino Pedreschi • Leonardo Piccini

State of the art
Morphological analysis Functional analysis

A big data proposal
Example of individual mobility observation
Tuscany municipalitiesCoverage space
150KNumber of Vehicles
February March 2014Time
12 mlnTrips
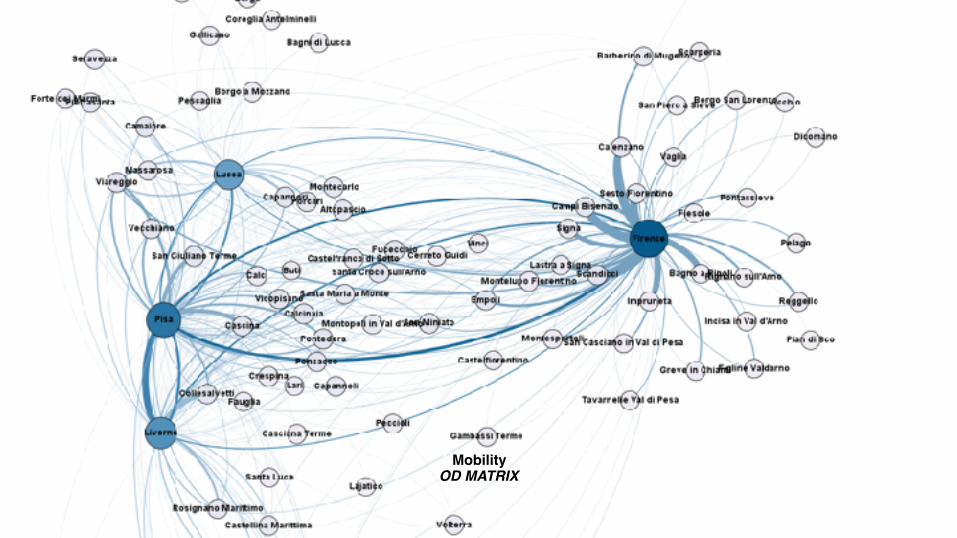
MobilityOD MATRIX
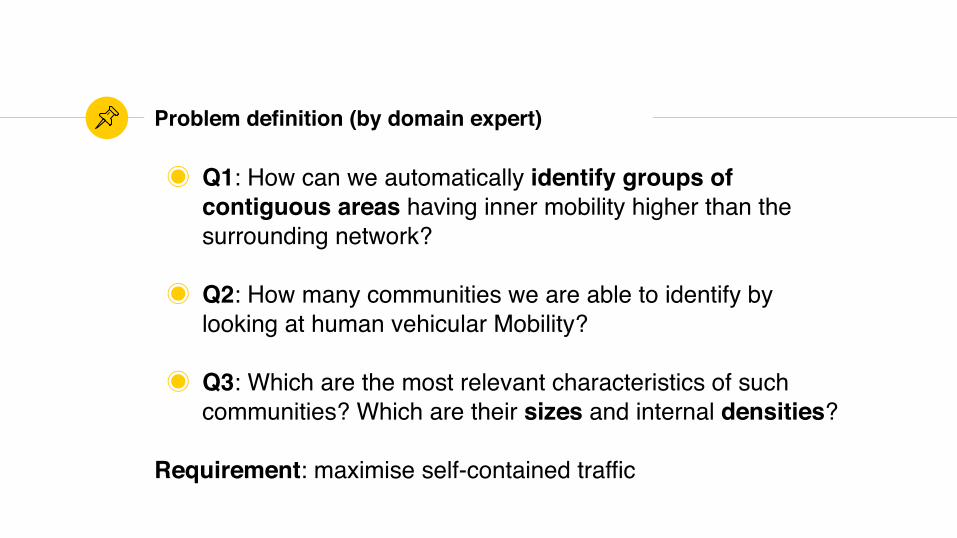
Problem definition (by domain expert)
◉ Q1: How can we automatically identify groups of contiguous areas having inner mobility higher than the surrounding network?
◉ Q2: How many communities we are able to identify by looking at human vehicular Mobility?
◉ Q3: Which are the most relevant characteristics of such communities? Which are their sizes and internal densities?
Requirement: maximise self-contained traffic

i=1 i=10 i=20
Our proposal: Agglomerative process
Red Communities/Regions created in the last iterationGrey Communities/Regions created in previous iterations
Iteration n
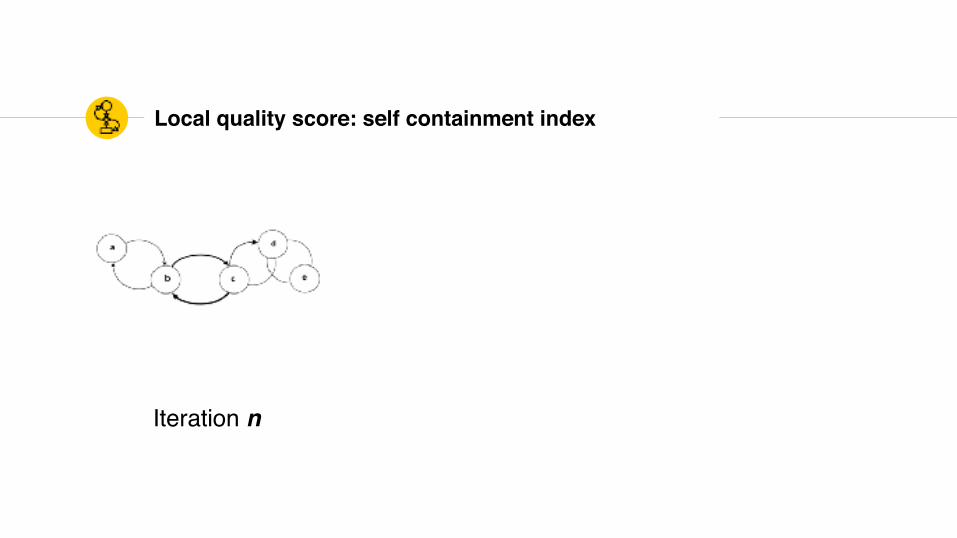
Local quality score: self containment index

Iteration n
Local quality score: self containment index
Evaluationn (t,z)= tUz/(t*+*z)
Iteration n
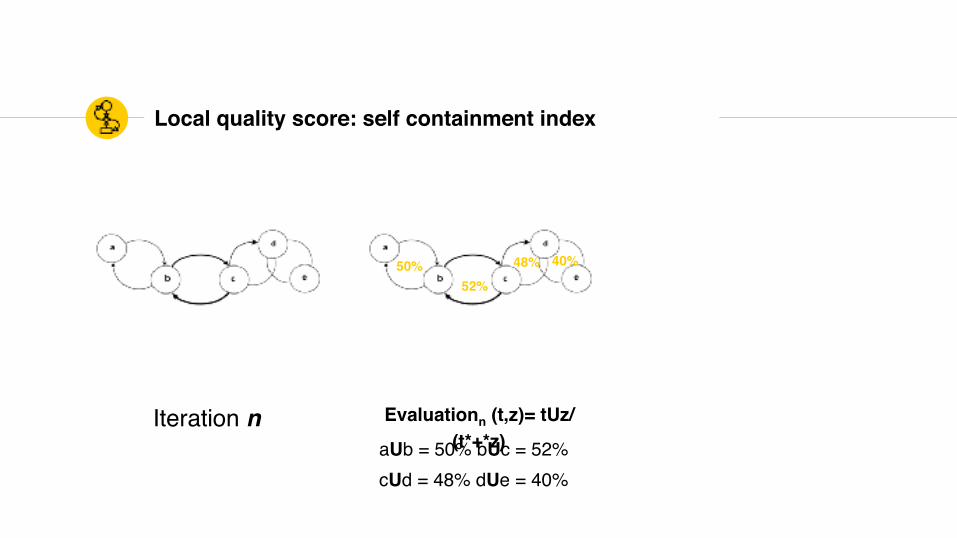
Local quality score: self containment index
Evaluationn (t,z)= tUz/(t*+*z)
50%52%
48% 40%
aUb = 50% bUc = 52% cUd = 48% dUe = 40%

Iteration n
Local quality score: self containment index
Evaluationn (t,z)= tUz/(t*+*z)
Iteration n+1
50%52%
48% 40%
aUb = 50% bUc = 52% cUd = 48% dUe = 40%

Cut criteria: maximise global quality scoreOptimum iteration to end the algorithm is suggested by the first local maximum of S
Real Expected
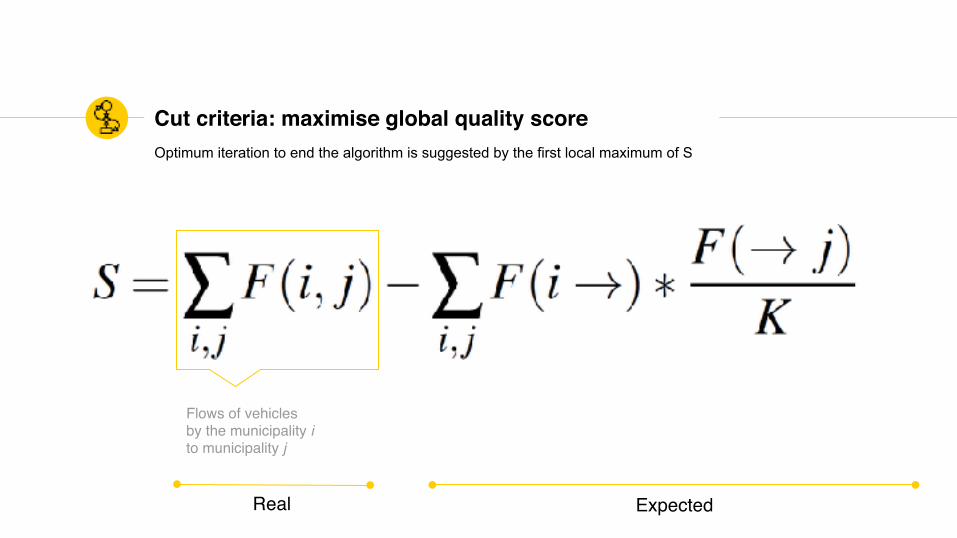
Flows of vehicles by the municipality i to municipality j
Cut criteria: maximise global quality scoreOptimum iteration to end the algorithm is suggested by the first local maximum of S
Real Expected

Flows of vehicles by the municipality i to municipality j
Cut criteria: maximise global quality score
Total outgoing flows starting from Municipality i
Optimum iteration to end the algorithm is suggested by the first local maximum of S
Real Expected

Flows of vehicles by the municipality i to municipality j
Cut criteria: maximise global quality score
Total outgoing flows starting from Municipality i
incoming flows in Municipality j
Optimum iteration to end the algorithm is suggested by the first local maximum of S
Real Expected
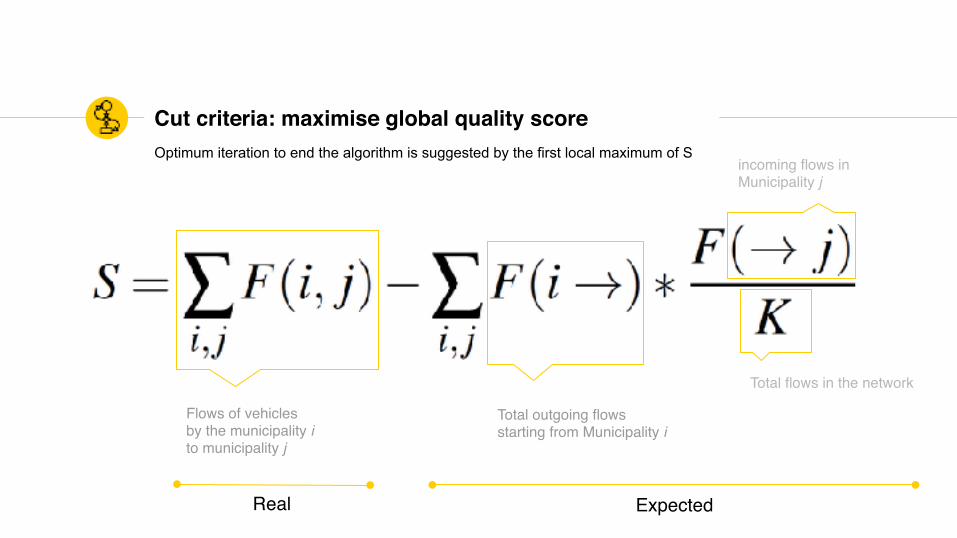
Flows of vehicles by the municipality i to municipality j
Cut criteria: maximise global quality score
Total outgoing flows starting from Municipality i
incoming flows in Municipality j
Total flows in the network
Optimum iteration to end the algorithm is suggested by the first local maximum of S
Real Expected
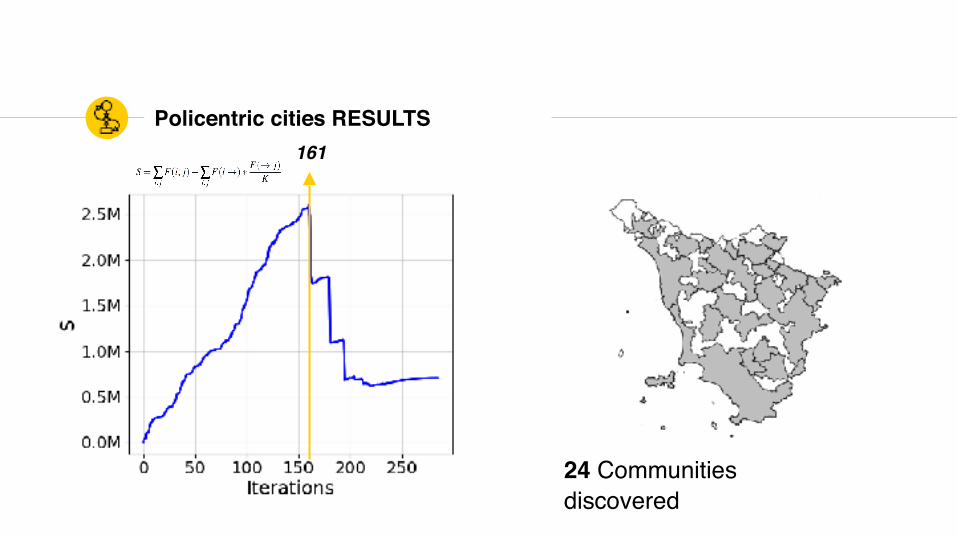
Policentric cities RESULTS161
24 Communities discovered

State-of-the-art
◉ Clustering problem similarity using Distance Matrix
◉ Community detection problem Network built using trips [OD Matrix]
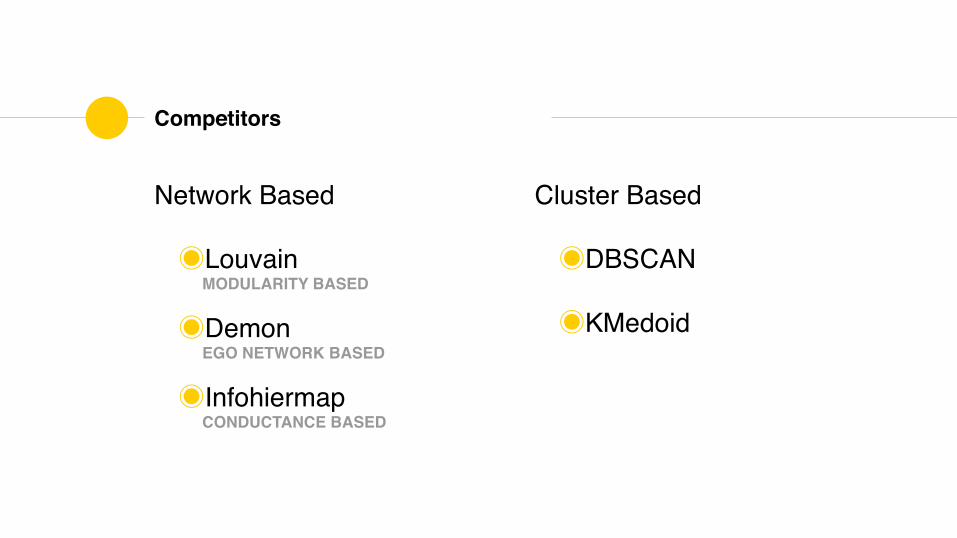
Competitors
Network Based
◉Louvain MODULARITY BASED
◉Demon EGO NETWORK BASED
◉Infohiermap CONDUCTANCE BASED
Cluster Based
◉DBSCAN
◉KMedoid

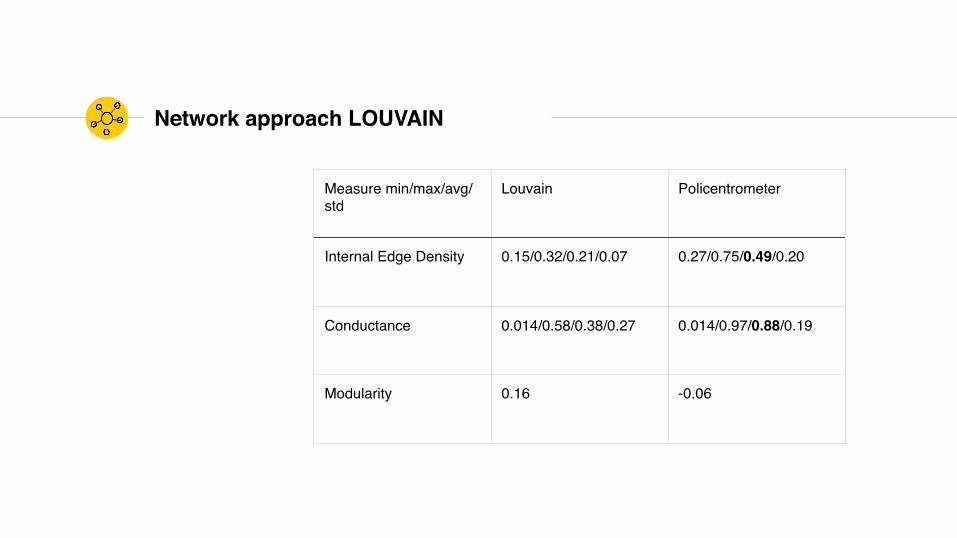
NETWORK approachIn order to compare our approach with the state of art we observe those measures: internal density conductance modularity
Measure min/max/avg/std
Louvain Policentrometer
Internal Edge Density 0.15/0.32/0.21/0.07 0.27/0.75/0.49/0.20
Conductance 0.014/0.58/0.38/0.27 0.014/0.97/0.88/0.19
Modularity 0.16 -0.06
Network approach LOUVAIN
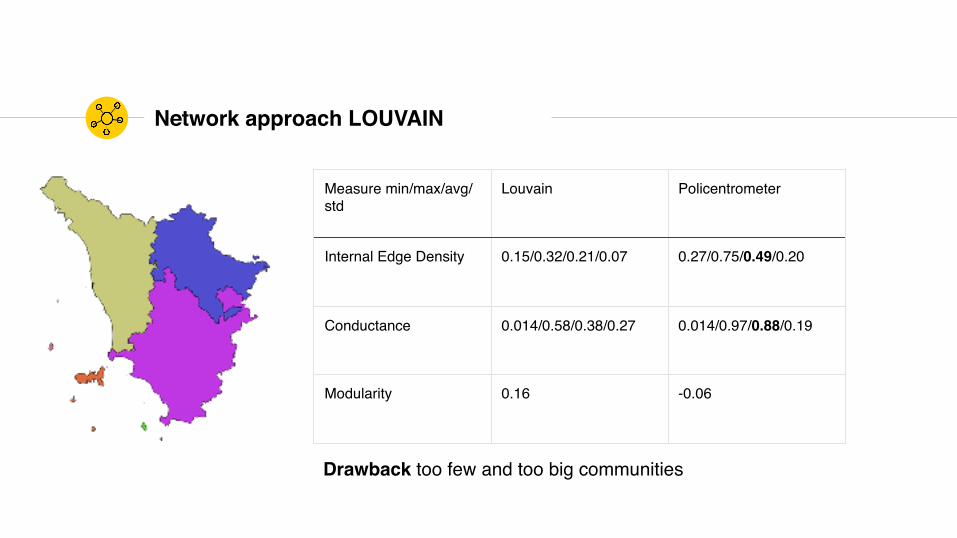
Drawback too few and too big communities
Measure min/max/avg/std
Louvain Policentrometer
Internal Edge Density 0.15/0.32/0.21/0.07 0.27/0.75/0.49/0.20
Conductance 0.014/0.58/0.38/0.27 0.014/0.97/0.88/0.19
Modularity 0.16 -0.06
Network approach LOUVAIN
Measure min/max/avg/std
Demon Policentrometer
Internal Edge Density 0.12/0.50/0.28/0.18 0.27/0.75/0.49/0.20
Conductance 0.37/0.90/0.50/0.17 0.014/0.97/0.88/0.19
Modularity -0.38 -0.06
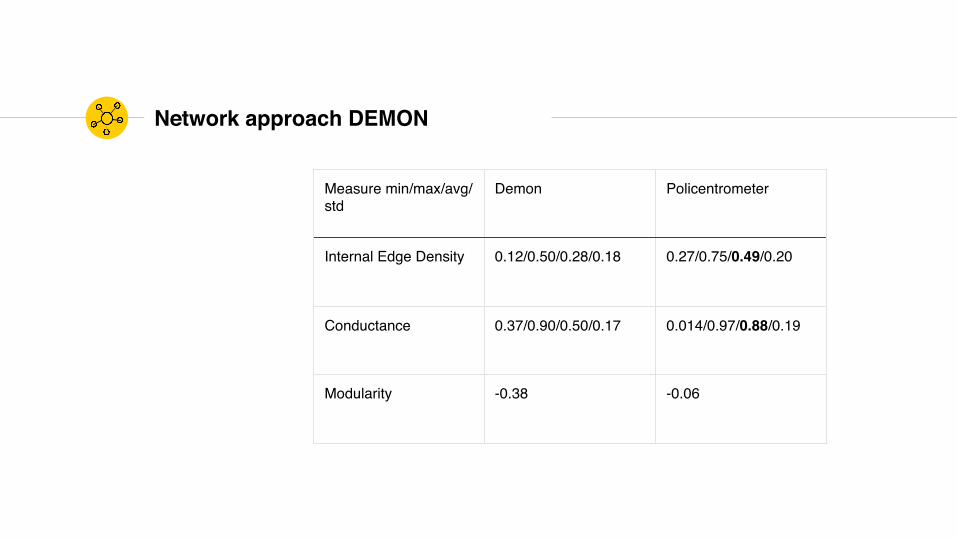
Network approach DEMON

Drawback too overlapping communities
Measure min/max/avg/std
Demon Policentrometer
Internal Edge Density 0.12/0.50/0.28/0.18 0.27/0.75/0.49/0.20
Conductance 0.37/0.90/0.50/0.17 0.014/0.97/0.88/0.19
Modularity -0.38 -0.06
Network approach DEMON

Measure min/max/avg/std
INFOHIERMAP Policentrometer
Internal Edge Density
0.09/0.50/0.18/0.10 0.27/0.75/0.49/0.20
Conductance 0.90/0.98/0.95/0.24 0.014/0.97/0.88/0.19
Modularity 0.006 -0.06
Network approach INFOHIERMAP

Drawback non contiguous communities
Measure min/max/avg/std
INFOHIERMAP Policentrometer
Internal Edge Density
0.09/0.50/0.18/0.10 0.27/0.75/0.49/0.20
Conductance 0.90/0.98/0.95/0.24 0.014/0.97/0.88/0.19
Modularity 0.006 -0.06
Network approach INFOHIERMAP

Lesson Learned
Comparison with network algorithms:
◉ Too few communities
◉ Too big
◉ Not contiguos

CLUSTERING approachpartitions obtained with K-medoid and DBSCAN cluster methods

K MEDOIDDrawback non contiguous communities
k=2 k=3 k=6

DBSCAN
dbscan communities
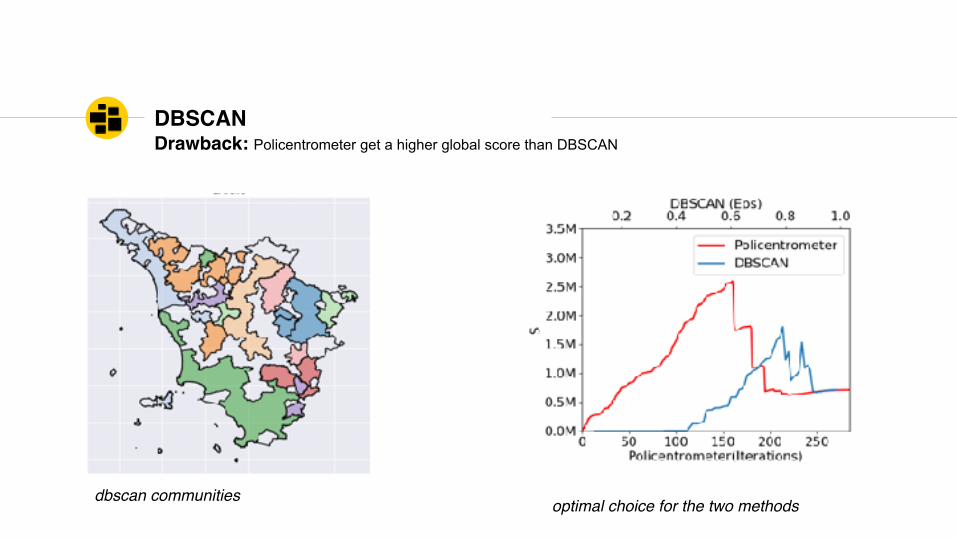
DBSCAN
optimal choice for the two methods
Drawback: Policentrometer get a higher global score than DBSCAN
dbscan communities

◉ Flow inclusion based problem definition
◉ Ad hoc algorithm that outperforms state-of-the-art methods
◉ Preliminary evaluation of results
Conclusion

Ongoing work: validation24 communities
Population density systematic Non systematic

ADDITIONS◉ Comparison with optimization methods◉ Seeding using municipalities with more than 50.000 people
INTEGRATIONS
NEW APPLICATIONS
◉ Public transport system data
◉ Domain indipendent◉ All Geo OD Matrix can be used

Any questions ?
Thanks!


![NON-CONTIGUOUS MEMORY REGISTRATION€¦ · 14th ANNUAL WORKSHOP 2018 NON-CONTIGUOUS MEMORY REGISTRATION Tzahi Oved Mellanox Technologies [ April, 2018 ]](https://static.fdocuments.in/doc/165x107/600cb458bfe0bf3e60638855/non-contiguous-memory-registration-14th-annual-workshop-2018-non-contiguous-memory.jpg)