Police reform evidence for change Why a single service? JAS Stats User Day Police and Fire Reform...
29
Police reform evidence for change Why a single service? JAS Stats User Day Police and Fire Reform Implications for data and analysis Neil Grant Kirsty Bosley 5/3/12
-
Upload
lindsay-spencer -
Category
Documents
-
view
214 -
download
1
Transcript of Police reform evidence for change Why a single service? JAS Stats User Day Police and Fire Reform...

Police reform evidence for
change
Why a single service?
JAS Stats User Day Police and Fire Reform
Implications for data and analysis
Neil GrantKirsty Bosley
5/3/12
What we’ll talk about
• Why reform• What stage are the
reforms at• What are JAS doing –
past/present• The future for data
and analysis?

Performing wellNo. of recorded crimes
0
100,000
200,000
300,000
400,000
500,000
600,000
700,000
1971
1976
1981
1986
1991
1996
-97
2001
-02
2006
-07
down 46% since 1991
All Fires in Scotland
0
10,000
20,000
30,000
40,000
50,000
60,000
70,000
2001
-02
2002
-03
2003
-04
2004
-05
2005
-06
2006
-07
2007
-08
2008
-09
2009
-10
2010
-11
Year
To
tal
nu
mb
er
of
fire
s
Est. Scottish DEL 2009-10 to 2026-27

Why reform?• Protect and improve local services, the
jewel in the crown, despite financial cuts; by stopping duplication of support services eight times over and not cutting the front line
• Create more equal access to specialist support and national capacity – like murder investigation teams, firearms teams and fire investigations - where and when they are needed
• Strengthen the connection between services and communities; by creating a new formal relationship with all 32 local authorities; involving many more locally elected members and better integrating with community planning partnerships.
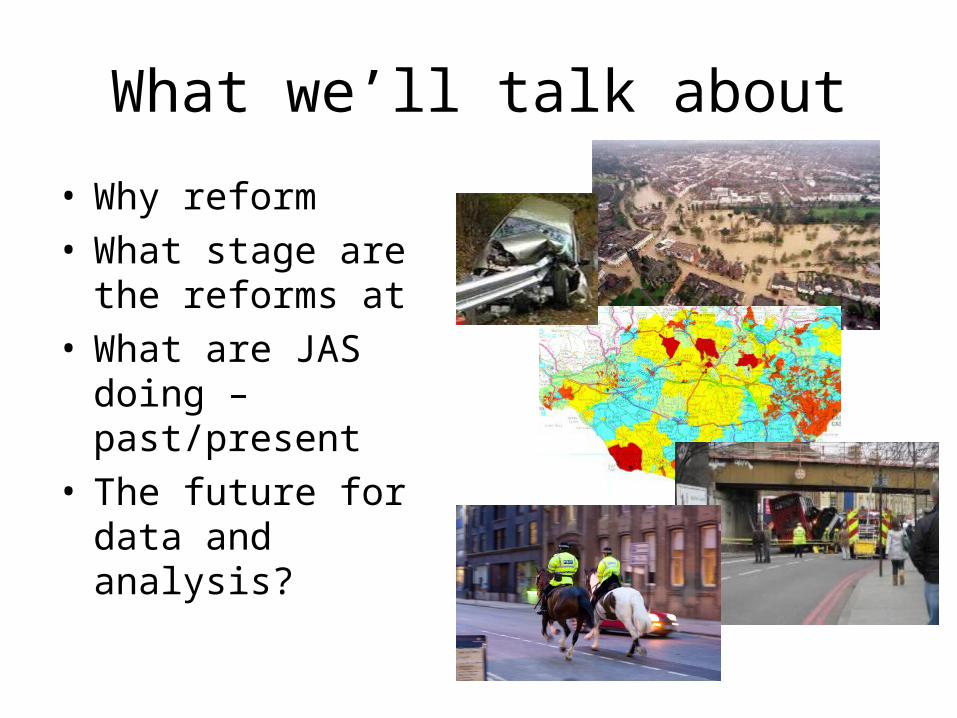
Structure
• 8 Forces• 1 Parliament
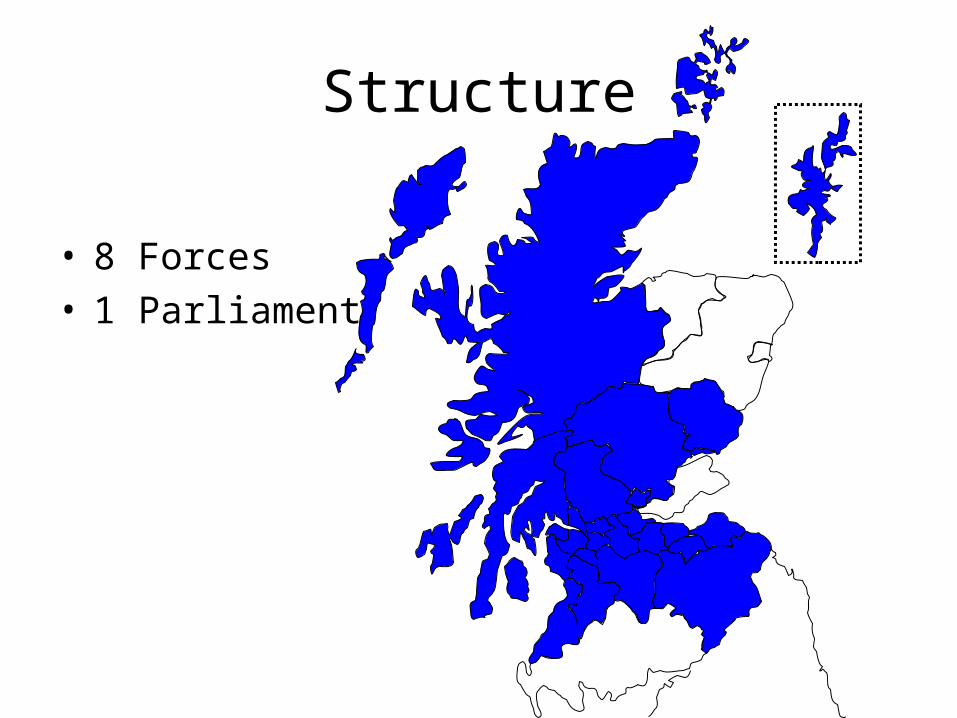
Structure
• 8 Forces• 1 Parliament• 32 LAs
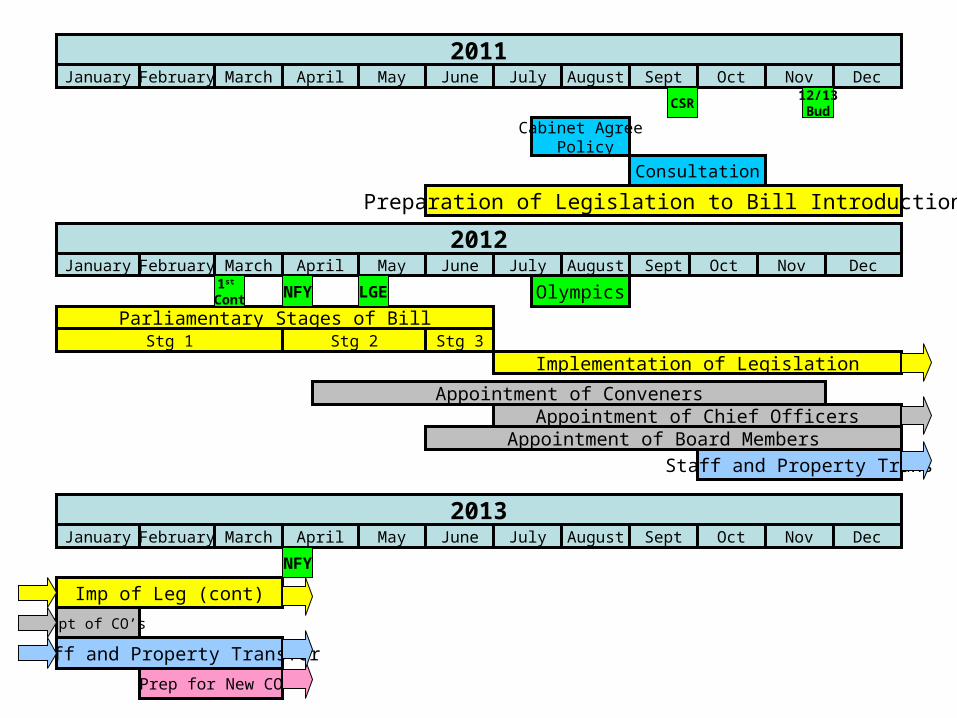
2011January February March April May June July August Sept Oct Nov Dec
Cabinet Agree Policy
Consultation
Preparation of Legislation to Bill Introduction
2012
2013
January
January
February
February
March
March
April
April
May
May
June
June
July
July
August
August
Sept
Sept
Oct
Oct
Nov
Nov
Dec
Dec
Parliamentary Stages of Bill
Implementation of Legislation
Appointment of ConvenersAppointment of Chief Officers
Imp of Leg (cont)
Apt of CO’s
Prep for New CO
Staff and Property Transfer
CSR12/13Bud
1st Cont NFY LGE
NFY
Stg 1 Stg 2 Stg 3
Olympics
Appointment of Board Members
Staff and Property Trans
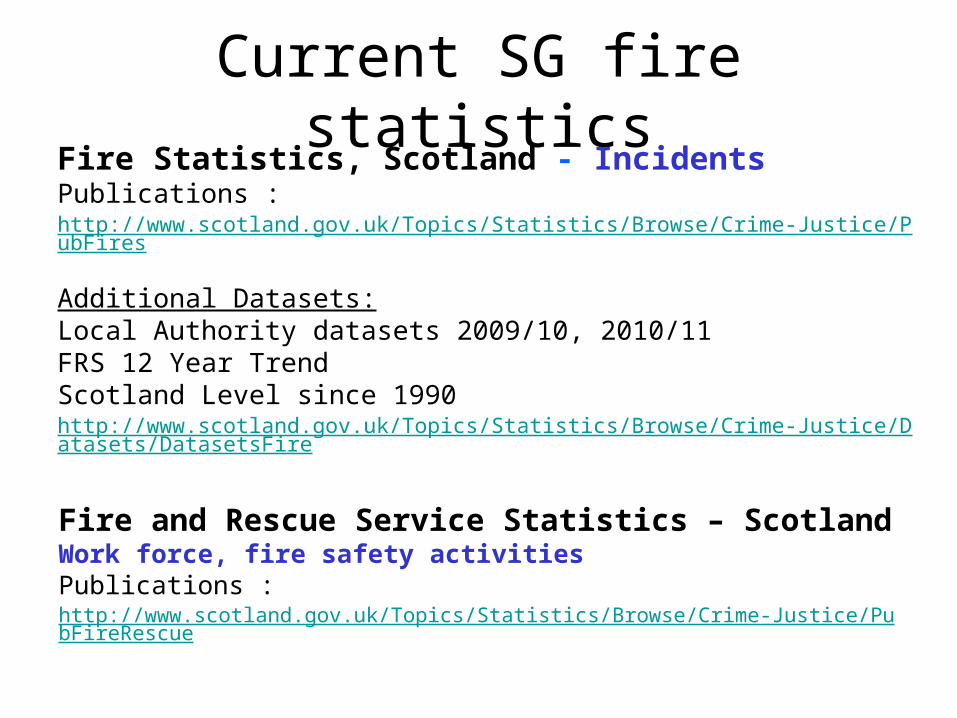
Current SG fire statisticsFire Statistics, Scotland - IncidentsPublications :http://www.scotland.gov.uk/Topics/Statistics/Browse/Crime-Justice/PubFires
Additional Datasets:Local Authority datasets 2009/10, 2010/11FRS 12 Year TrendScotland Level since 1990http://www.scotland.gov.uk/Topics/Statistics/Browse/Crime-Justice/Datasets/DatasetsFire
Fire and Rescue Service Statistics – ScotlandWork force, fire safety activitiesPublications :http://www.scotland.gov.uk/Topics/Statistics/Browse/Crime-Justice/PubFireRescue

What have JAS been doing?
Statistics publications
Reform analysis
• Research
• OBC
• Legislation, Financial Memo
• Consultations

We told people what the current picture looks like
0
20
40
60
80
100
120
Financial Year
Nu
mb
er
of
Fa
tal C
as
ua
ltie
s
Numbers of fire fatalities
0
10,000
20,000
30,000
40,000
50,000
60,000
70,000
Financial Year
Nu
mb
er
of
fire
s
44
P3
Dwellings
Other buildings
Road Vehicles
Other primary fires
Secondary fires
Chimney fires
Where the fires occurred
3
Fires and fire fatalities are falling… 1999 to 2010 (provisional)

We told people how Scottish FRSs compare with other parts of the UK
Expenditure per 1,000 population excluding firefighter pensions
-
10,000
20,000
30,000
40,000
50,000
60,000
Shire A
reas
Met
ropolit
an
England
Wal
es
England a
nd Wal
es
Scotla
nd
All Auth
oritie
s
£
5CIPFA 2009-10
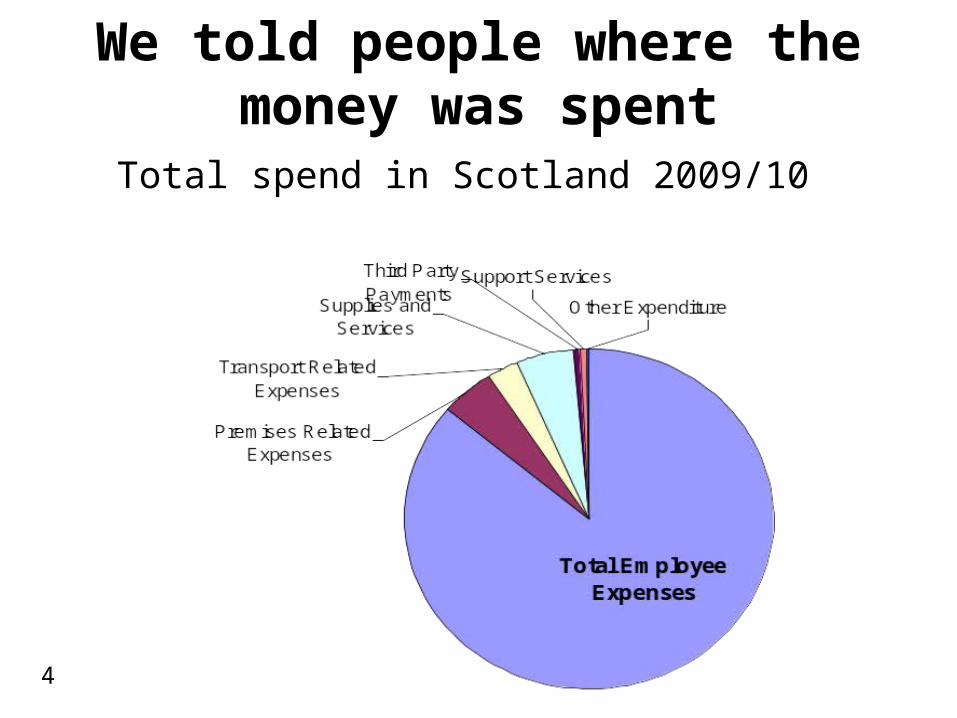
We told people where the money was spent
Total spend in Scotland 2009/10
4
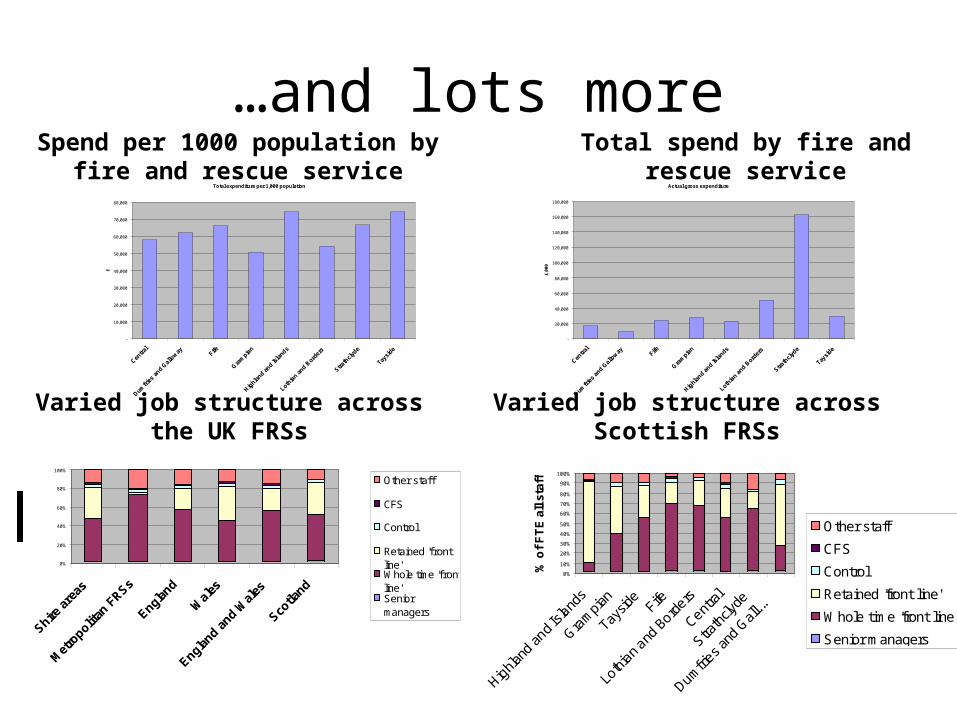
…and lots moreTotal expenditure per 1,000 population
-
10,000
20,000
30,000
40,000
50,000
60,000
70,000
80,000
Centra
l
Dumfri
es a
nd Gal
low
ay Fife
Gra
mpi
an
Highl
and
and
Isla
nds
Lothi
an a
nd Bor
ders
Strath
clyd
e
Taysi
de
£
Actual gross expenditure
-
20,000
40,000
60,000
80,000
100,000
120,000
140,000
160,000
180,000
Centra
l
Dumfri
es a
nd Gal
low
ay Fife
Gra
mpi
an
Highl
and
and
Isla
nds
Lothi
an a
nd Bor
ders
Strath
clyd
e
Taysi
de
£,0
00
0%
20%
40%
60%
80%
100%
Shire ar
eas
Met
ropolit
an F
RSs
England
Wales
England a
nd Wal
es
Scotla
nd
Other staff
CFS
Control
Retained 'frontline'Whole time 'frontline'Seniormanagers
Spend per 1000 population by fire and rescue service
Total spend by fire and rescue service
Varied job structure across the UK FRSs
0%
10%
20%
30%
40%
50%
60%
70%
80%
90%
100%
Highla
nd a
nd Isla
nds
Gram
pian
Taysid
eFife
Lothi
an and
Bord
ers
Centra
l
Strath
clyde
Dumfries a
nd G
all...
% o
f F
TE
all
staf
fOther staff
CFS
Control
Retained 'front line'
Whole time 'front line'
Senior managers
Varied job structure across Scottish FRSs
Current SG police statistics• Recorded Crime in Scotland
• Homicide in Scotland
• Domestic Abuse Recorded by the Police in Scotland
• Racist Incidents Recorded by the Police in Scotland
• Recorded Crimes and Offences Involving Firearms
• Firearm Certificate Statistics
• Drug Seizures by Scottish Police Forces
• Scottish Index of Multiple Deprivation 2009
• Scottish Neighbourhood Statistics • Police Officer Quarterly Strength Statistics• Scottish Policing Performance Framework Main Justice Statistics Publication Webpage
http://www.scotland.gov.uk/Topics/Statistics/Browse/Crime-Justice/Publications
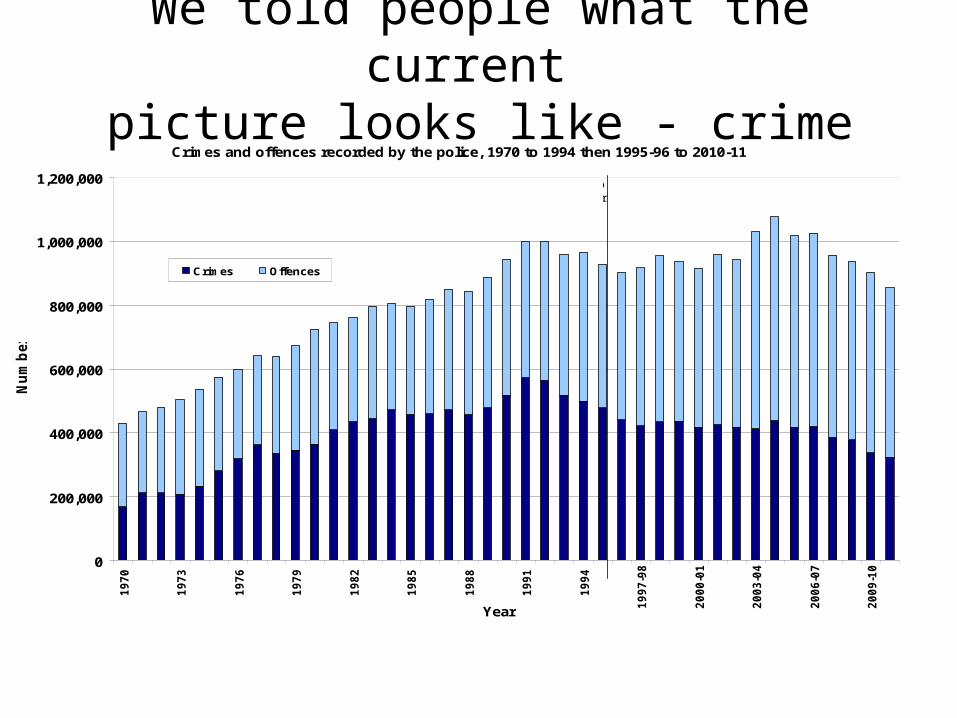
We told people what the current picture looks like - crime
Crimes and offences recorded by the police, 1970 to 1994 then 1995-96 to 2010-11
0
200,000
400,000
600,000
800,000
1,000,000
1,200,000
19
70
19
73
19
76
19
79
19
82
19
85
19
88
19
91
19
94
19
97
-98
20
00
-01
20
03
-04
20
06
-07
20
09
-10
Year
Nu
mb
er
Crimes Offences
Change to Financial year
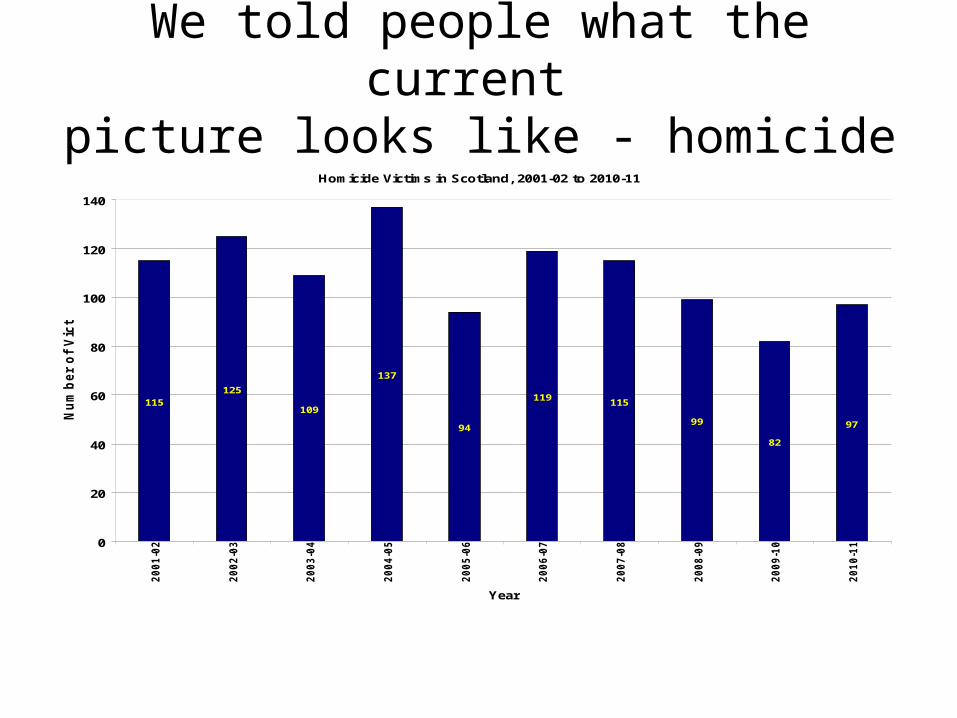
We told people what the current picture looks like - homicide
Homicide Victims in Scotland, 2001-02 to 2010-11
115125
109
137
94
119115
99
82
97
0
20
40
60
80
100
120
140
20
01
-02
20
02
-03
20
03
-04
20
04
-05
20
05
-06
20
06
-07
20
07
-08
20
08
-09
20
09
-10
20
10
-11
Year
Nu
mb
er
of
Vic
tim
s
We’ve looked at service variation 1
• Performance variation– Public satisfaction 75% to 89%– Spend per resident £147-200– Absence rates 3.0% to 4.3%
• Standardised best practice – potential savings– Overtime £6.5m p.a.– HR £9m p.a.– Press & media £1.2 p.a.– Sickness absence – 120 FTE officers
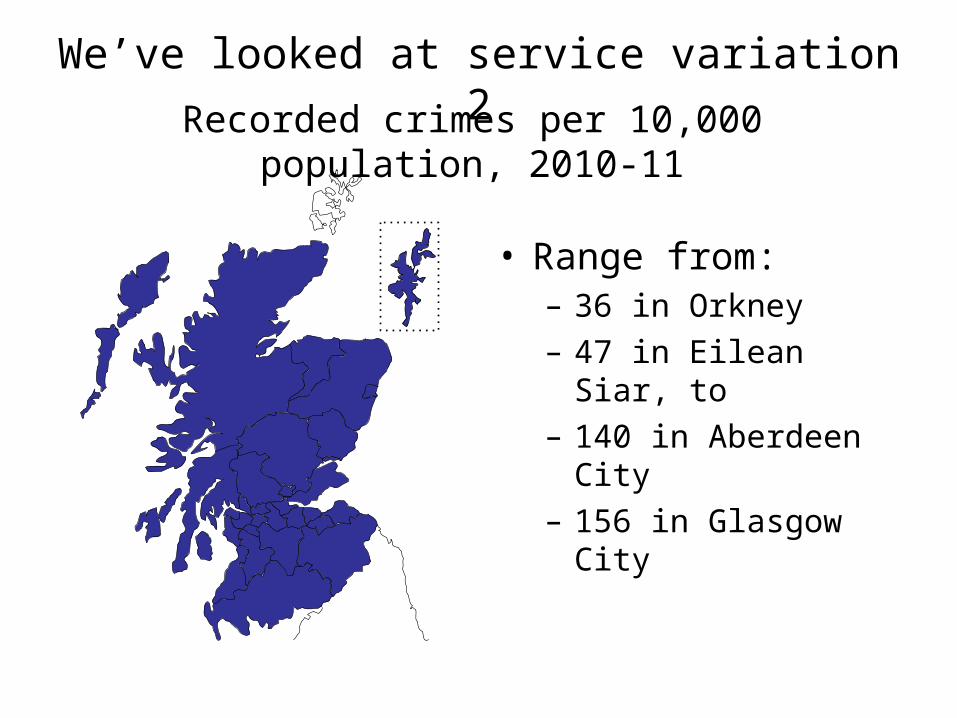
Recorded crimes per 10,000 population, 2010-11
• Range from:– 36 in Orkney – 47 in Eilean Siar, to– 140 in Aberdeen City– 156 in Glasgow City
We’ve looked at service variation 2

Percentage of recorded crimes cleared up 2010-11
• Range from:– 70 in Eilean Siar– 69 in D&G, to– 36 in East
Dunbartonshire and East Renfrewshire
We’ve looked at service variation 3
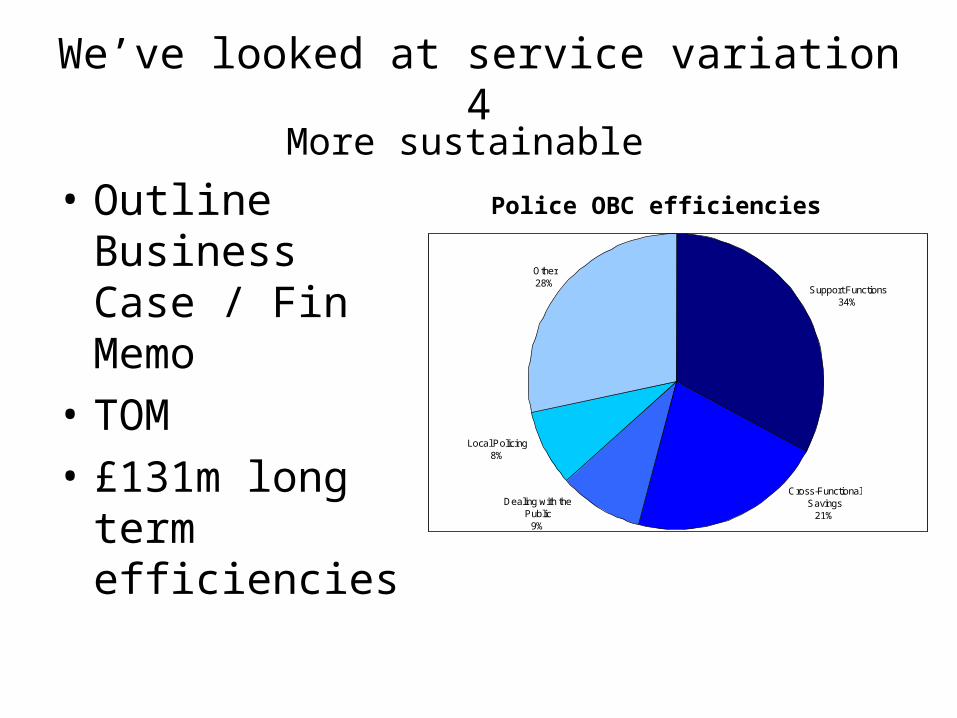
More sustainable
• Outline Business Case / Fin Memo
• TOM
• £131m long term efficiencies
Support Functions34%
Other28%
Cross-Functional Savings
21%
Dealing with the Public
9%
Local Policing8%
Police OBC efficiencies
We’ve looked at service variation 4
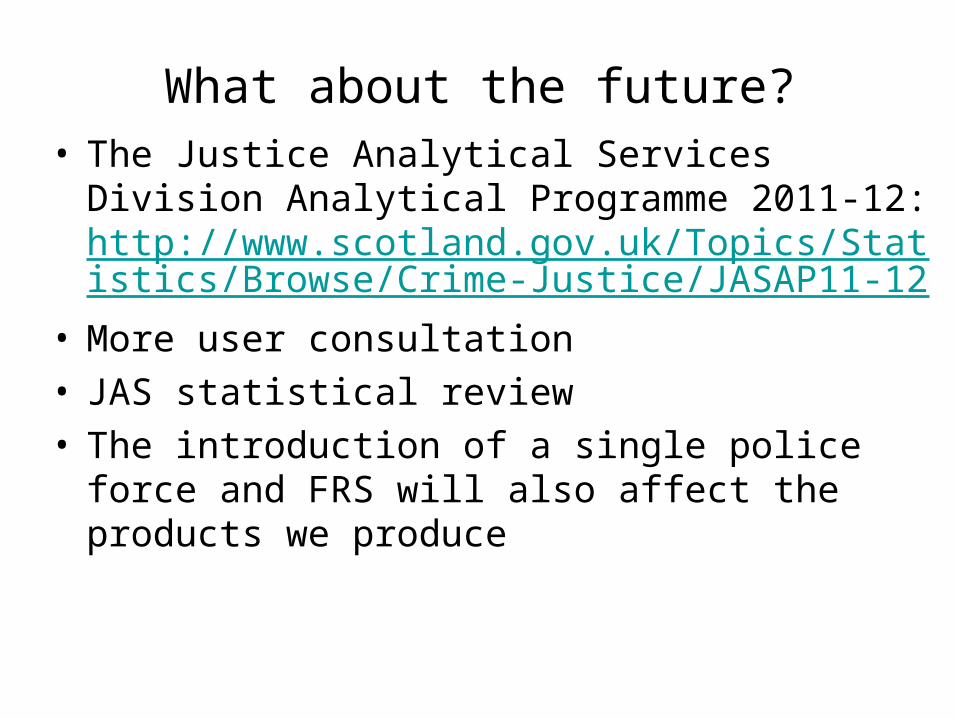
What about the future?• The Justice Analytical Services Division Analytical
Programme 2011-12: http://www.scotland.gov.uk/Topics/Statistics/Browse/Crime-Justice/JASAP11-12
• More user consultation• JAS statistical review• The introduction of a single police force and FRS
will also affect the products we produce

Fire statistics in the future
• Single service
• New Geography for publications – Scotland and Local Authority
• Work with the Reform workstreams – Performance Management project – many interdependancies
• Developing work – FSEC, SIMD and SNS
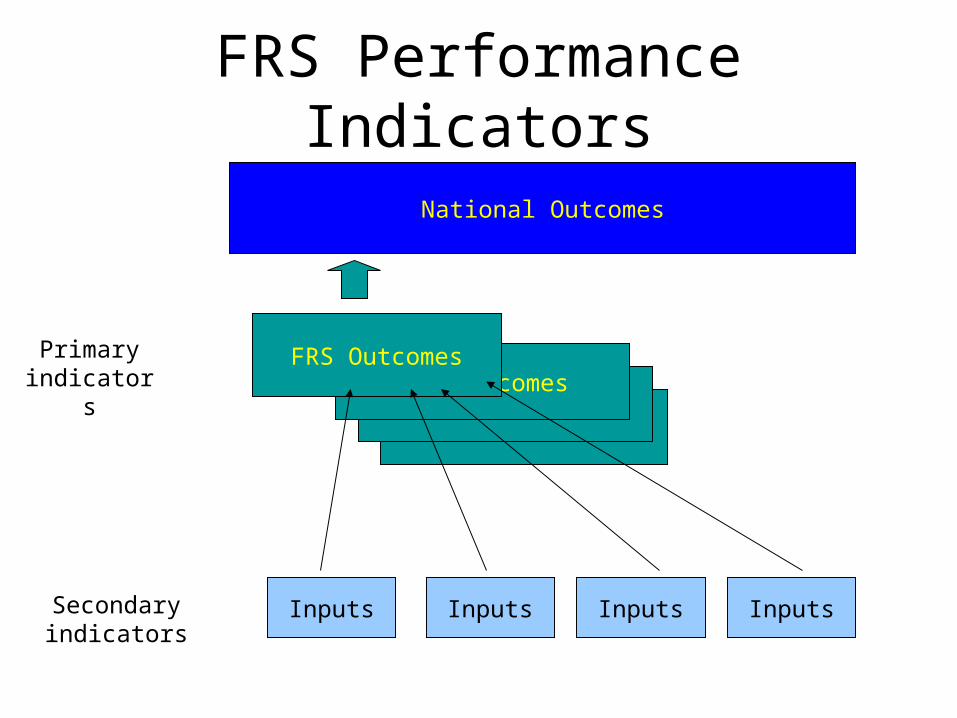
FRS Outcomes
FRS Performance Indicators
National Outcomes
FRS OutcomesFRS Outcomes
FRS Outcomes
Inputs Inputs Inputs Inputs
Primary indicators
Secondary indicators

Dw fires
Improved service
outcomes
Protecting frontline services
Simplification of the delivery
landscape
Ability to respond
quickly to future
challenges
Improved National
resilience and interoperability
Close engagement with local
communities and other stakeholders
Reduced harm to, and greater resilience of, public, property, economy and environment from fires and other emergencies through improved
outcomes.
Greater ability to respond to, and mitigate social, economic and
environmental effects from, national emergencies
Improved use of public money, generating greater public satisfaction, by
reducing costs through efficiently and effectively applying risk based
management of resources and promote increased flexibility.
Greater investment in the right skills and attitudes to deliver high quality, value for
moneyservices in a positive environment for
everyone.
Improved Prevention
Improved Protection
Emergency Response Public Value People
Reduced num
ber of fires and otherem
ergency incidents.
Reduced num
ber of deaths and injuries from
fires and other emergencies.
Greater influence and regulation of the built environm
ent to protect people, property and the environm
ent from harm
.
Better education of, and
engagement w
ith, public
Higher quality response to
emergencies.
Improved state of preparedness for em
ergencies, with m
ore effective em
ergency cover arrangem
ents.
Improved resilience during peak activity levels and business
disruption.
More econom
ic growth.
Better designed, high value for
money services.
Improved quality of life outcom
es for com
munities.
Higher perform
ing, better trained enabled and com
mitted w
orkforce w
orking in a positive environment.
Com
petent and capable leaders and m
anagers.
Lower levels of ill discipline,
absenteeism and staff turnover.
All fires
Fire cas
Vehicle fires (accidental)
RTC cas
OB fires
Dw firesDelib/acc
Fire casAll firesSpecia
l service
sOB fires
Rate and size of OB
fires
Delib other
primary fires
Secondary fires Dw
fires
Vehicle fires Fire
cas
RTC cas
Fire cas
RTC cas
Fire cas
Spec Serv incs
attended
Fire cas
Delib other
primary fires
OB fires
Rate and size of OB
fires
All fires
Fire cas
RTC cas
Rate and size of OB
fires
All fires
Fire cas
All fires
Fire cas
Performance indicators against Intermediate BenefitsE
nd
ben
efit
sIn
teri
m b
enef
its
Fire safety audit
CFS activit
y
CFS activit
y
Fire safety audit
CFS activit
y
Fire safety auditFalse alarm
- equip
Attacks on ff
CFS activit
y
FA malicious
Work force monitoring
– E&D
Fire safety audit
Costs
CFS activit
y
Attacks on ff
RIDDOR inj rate
Work force monitoring
– E&D
RIDDOR inj rateWork
force monitoring – E&D
RIDDOR inj rate
Work force monitoring
– E&D
Attacks on ff
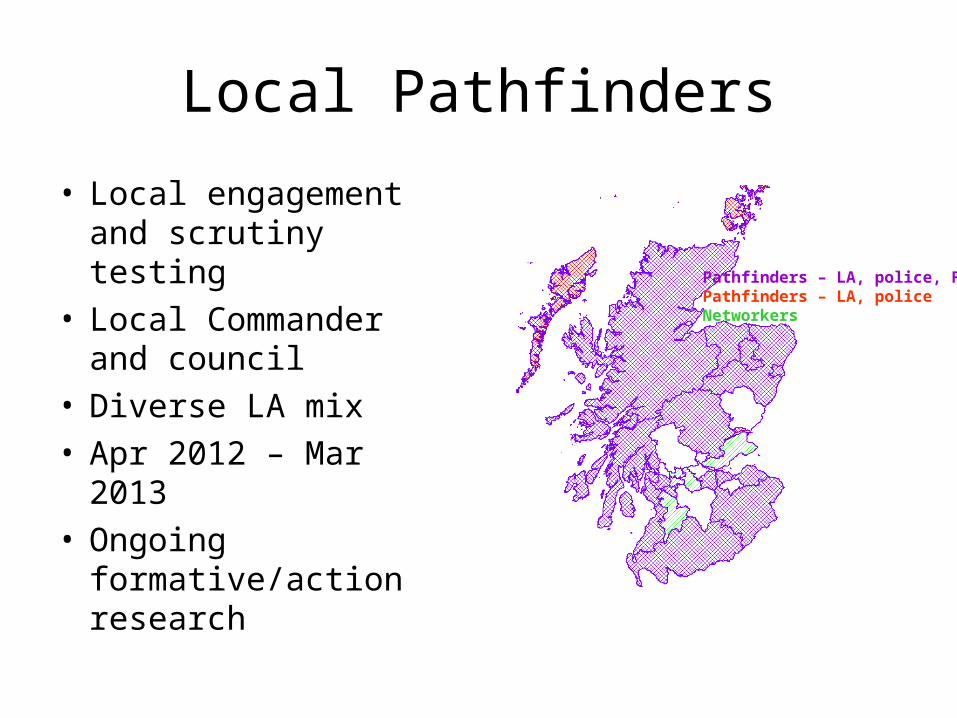
Local Pathfinders
• Local engagement and scrutiny testing
• Local Commander and council
• Diverse LA mix• Apr 2012 – Mar 2013• Ongoing
formative/action research
Pathfinders – LA, police, FRSPathfinders – LA, policeNetworkers

Police statistics in the ‘future’
• Single service
• New geographies - LA not PFA
• Future analytical functions of the services?
• Government role?– Adding ‘value’– Professional Expertise – Stats Code– Contextual and policy interpretation– Independence
Police Performance Indicators• Review of SPPF• HMICS lead, JAS support• Draft PIs within 4 HMICS scrutiny areas
– Outcomes– Specialist Policing– Local Policing– Corporate and Support Services
• Pre-reform baseline• Local level indicators

Reform Programme Evaluation
• Why evaluate?
• Requirements – process and impact
• Benefits Realisation / Programme Evaluation
• Partnership working
• Timing

Questions?