Polak 2009 Teg
24
NTNU Department of Petroleum Engineering and Applied Geophysics Modelling absorption drying of natural gas Luká Polák May 2009 Trondheim
-
Upload
wilfredo-suarez-torres -
Category
Documents
-
view
22 -
download
1
Transcript of Polak 2009 Teg
NTNU
Department of Petroleum Engineering and Applied Geophysics
Modelling absorption drying of natural gas
Luká Polák
May 2009
Trondheim
ii
Summary
This report deals with dehydration of natural gas. Possibilities and different ways of drying
natural gas are described theoretically. The main focus is on absorption drying using
triethylene glycol, its benefits and disadvantages.
Then, the dehydration is simulated with Aspen Hysys software. The minimum glycol mass
flow and specific glycol circulation rate is calculated. Currently Hysys is used to obtain TEG-
water equilibrium data. Further, the graphical solution and analytical solution (Kremser-
Brown equation) are used to estimate the number of theoretical stages in a absorption column.
iii
List of Content
1 Introduction ................................................................................................................... - 6 - 2 Dehydration of natural gas ............................................................................................ - 7 -
2.1 Direct cooling ........................................................................................................ - 7 - 2.2 Indirect cooling...................................................................................................... - 7 - 2.3 Adsorption ............................................................................................................. - 7 - 2.4 Absorption ............................................................................................................. - 8 -
3 TEG Dehydration unit ................................................................................................... - 9 - 3.1 Dehydration process .............................................................................................. - 9 - 3.2 Regeneration process............................................................................................. - 9 -
4 Hysys modelling of dehydration process..................................................................... - 10 - 4.1 Equations of state................................................................................................. - 10 - 4.2 Conditions and compositions of inlet streams..................................................... - 11 - 4.3 TEG-water equilibrium........................................................................................ - 11 -
5 Results ......................................................................................................................... - 12 - 5.1 Hysys simulation ................................................................................................. - 12 - 5.2 Graphical solution of absorption process ............................................................ - 14 - 5.3 Analytical solution of absorption process ........................................................... - 14 -
6 Conclusion ................................................................................................................... - 16 - 7 References ................................................................................................................... - 17 -
iv
List of Tables
Table 1: TEG-water equilibrium data, mole fraction x in liquid phase and mole fraction y in
vapour phase. X and Y are relative mole fractions......................................................................I
List of Figures
Figure 1: Diagram of water content of natural gas [2] .............................................................. II
Figure 2: Process flow diagram for glycol dehydration unit ....................................................III
Figure 3: Flow sheet of drying process ....................................................................................III
Figure 4: Flow sheet of case for obtaining equilibrium data....................................................IV
Figure 5: Conditions of all streams from the case obtaining equilibrium data.........................IV
Figure 6: Composition of all streams from first step obtaining equilibrium data .....................V
Figure 7: Conditions of inlet and outlet streams used in absorption drying process.................V
Figure 8: Composition of inlet and outlet streams calculated for minimum TEG flow rate ....VI
Figure 9: Estimation of theoretical stages of absorption column by using graphical solution.VI
Figure 10: Trendline through the equilibrium data for obtaining constant k ...................... VII
v
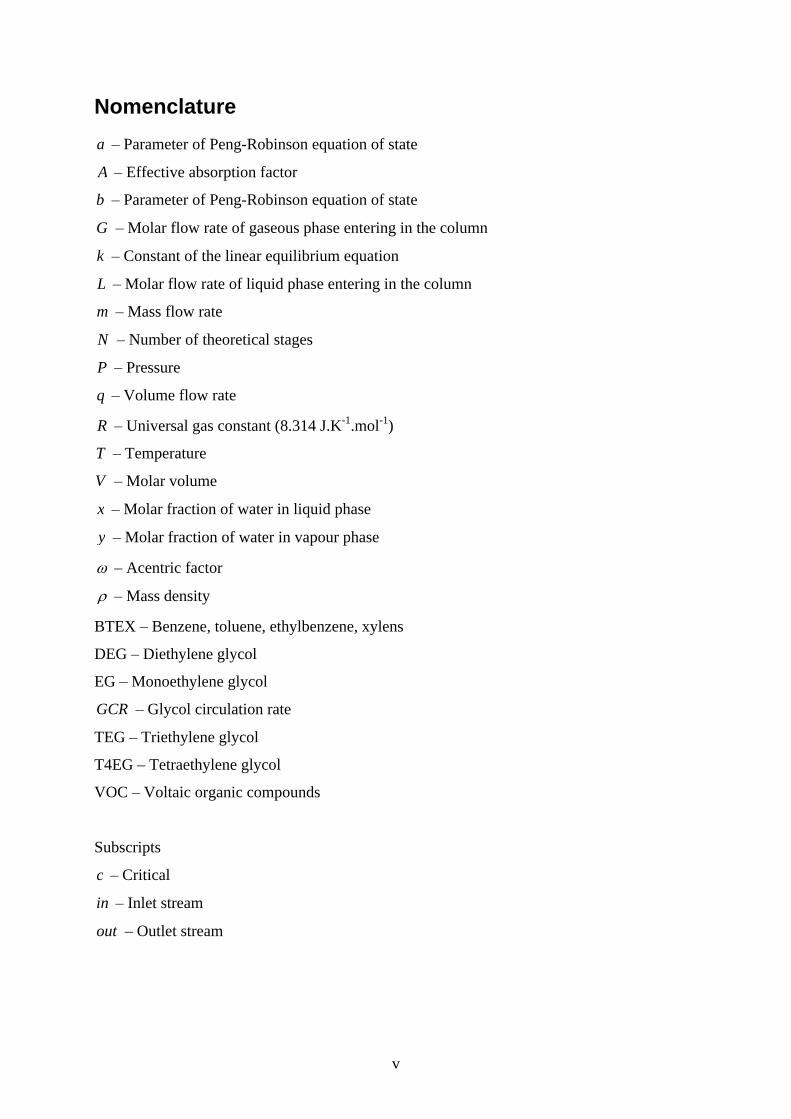
Nomenclature
a
Parameter of Peng-Robinson equation of state
A
Effective absorption factor
b Parameter of Peng-Robinson equation of state
G Molar flow rate of gaseous phase entering in the column
k Constant of the linear equilibrium equation
L
Molar flow rate of liquid phase entering in the column
m
Mass flow rate
N Number of theoretical stages
P
Pressure
q
Volume flow rate
R
Universal gas constant (8.314 J.K-1.mol-1)
T
Temperature
V Molar volume
x
Molar fraction of water in liquid phase
y
Molar fraction of water in vapour phase
Acentric factor
Mass density
BTEX Benzene, toluene, ethylbenzene, xylens
DEG Diethylene glycol
EG Monoethylene glycol
GCR Glycol circulation rate
TEG Triethylene glycol
T4EG Tetraethylene glycol
VOC Voltaic organic compounds
Subscripts
c
Critical
in
Inlet stream
out
Outlet stream
- 6 -
1 Introduction
Natural gas to be transported by pipeline must meet certain specifications. In addition to
specifications regarding delivery pressure, rate, and possibly temperature, other specifications
include maximum water content (water dew point), maximum condensable hydrocarbon
content (hydrocarbon dew point) and allowable concentrations of contaminants such as H2S,
CO2, mercaptans, minimum heating value, and cleanliness (allowable solids content). This
report focuses on basic principles of removing water from natural gas and modelling of this
process.
Water vapor is probably the most common undesirable component found in untreated natural
gas. The main reason for removing water vapor from natural gas is that water vapor becomes
liquid water under low temperature and/or high-pressure conditions. Specifically, water
content can affect long-distance transmission of natural gas due to the following facts:
Liquid water and natural gas can form hydrates that may plug the pipeline and other
equipment.
Natural gas containing CO2 and/or H2S is corrosive when liquid water is present.
Liquid water in a natural gas pipeline potentially causes slugging flow conditions
resulting in lower flow efficiency of the pipeline.
Water content decreases the heating value of natural gas being transported [1].
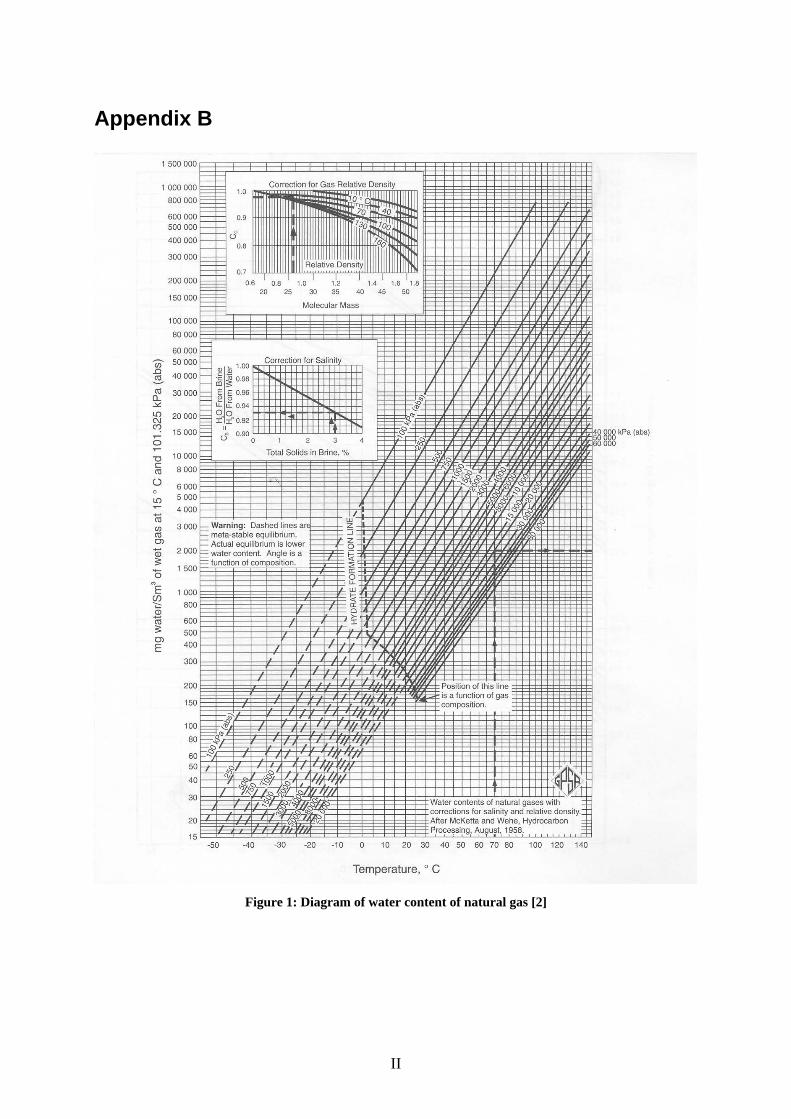
Solubility of water in natural gas increases with temperature and decreases with pressure. The
water content of natural gas is shown in Figure 1. The diagram covers saturation conditions
for temperatures from -50 °C to 200 °C, and pressures from 0.1 MPa to 80 MPa [2].
Water content of untreated natural gases generally is in the order of a few grams of water per
standard cubic meter of gas (hundreds lbm/MMscf); while gas pipelines normally require
water content to be in the range of 90
120 mg/Sm3 (6 8 lbm/MMscf). The water content in
deep water pipelines must be even lower than the previous requirement. The water content of
natural gas is indirectly indicated by the dew point, defined as the temperature where the
natural gas is saturated with water vapor at a given pressure [1, 3].
- 7 -
2 Dehydration of natural gas
Dehydration systems used in the natural gas industry fall into four categories in principle:
Direct cooling
Indirect cooling (Expander or Joule-Thomson valve)
Adsorption
Absorption
2.1 Direct cooling
The ability of natural gas to contain water vapor decreases as the temperature is lowered at
constant pressure. During the cooling process, the excess water in the vapor state becomes
liquid and is removed from the system. Natural gas containing less water vapor at low
temperature is output from the cooling unit. The gas dehydrated by cooling is still at its water
dew point unless the temperature is raised again or the pressure is decreased. It is often a good
practice that cooling is used in conjunction with other dehydration processes. Glycol may be
injected into the gas stream ahead of the heat exchanger for instance to reach lower
temperatures before expansion into a low temperature separator [1].
2.2 Indirect cooling
Expansion is a second way of natural gas cooling. It can be achieved by the expander or
Joule-Thomson valve. These processes are characterized by a temperature drop to remove
condensed water to yield dehydrated natural gas. The principal is the similar to the removal of
humidity from outside air as a result of air conditioning. Gas is forced through a constriction
called an expansion valve into space with a lower pressure. As a gas expands, the average
distance between molecules grows. Because of intermolecular attractive forces, expansion
causes an increase in the potential energy of the gas. If no external work is extracted in the
process and no heat is transferred, the total energy of the gas remains the same. The increase
in potential energy thus implies a decrease in kinetic energy and therefore in temperature [4].
2.3 Adsorption
Solid desiccant dehydration, also known as solid bed, utilizes the adsorption principles for
removing water vapor. Adsorbents used include silica gel (most commonly used), molecular
- 8 -
sieve (common in natural gas vehicle dryers), activated alumina and activated carbon. The
wet gas enters into an inlet separator to ensure removal of contaminants and free water. The
gas stream is then directed into an adsorption tower where the water is adsorbed by the
desiccant. When the adsorption tower approaches maximum loading, the gas stream is
automatically switched to another tower allowing the first tower to be regenerated.
Heating a portion of the mainstream gas flow and passing it through the desiccant bed
regenerates the loaded adsorbent bed. The regeneration gas is typically heated in an indirect
heater. The undersaturated regeneration gas is then passed through the bed removing water
and liquid hydrocarbons. These liquid components have to be removing from gas for two
main reasons. First reason is present the water can allow natural gas hydrates forming. Second
reason is a lot of corrosive and aggressive compounds (H2S, CO2) can be absorbed in this
liquid phase. The regeneration gas exits the top of the tower and is cooled most commonly
with an air-cooled heat exchanger. Condensed water and hydrocarbons are separated and the
gas is recycled back into the wet gas inlet for processing [4].
2.4 Absorption
The fourth method of dehydration utilizes liquid desiccant and it is the most commonly used
for dehydrating natural gas moved through transmission lines. Method removes water from
the gas stream by counter current contact, in a tray type contactor tower, with tri-ethylene
glycol (TEG). Natural gas enters the unit at the bottom of the adsorber tower and rises through
the tower where it contacted with the TEG solution flowing downward across bubble trays.
Through the contact, the gas gives up its water vapor to the TEG. The water laden TEG is
circulated in a closed system, where the water is boiled from the TEG. The regenerated TEG
then is recirculated to the contacting tower [1, 5].
Water vapor is removed from the gas by intensive contact with a hygroscopic liquid desiccant
in absorption dehydration. The contact is usually achieved in packed or trayed towers. Glycols
have been widely used as effective liquid desiccants. Dehydration by absorption with glycol is
usually more attractive economically than dehydration by solid desiccant when both processes
are capable of meeting the required dew point. Glycols used for dehydrating natural gas are
ethylene glycol (EG), diethylene glycol (DEG), triethylene glycol (TEG), and tetraethylene
glycol (T4EG). Normally a single type of pure glycol is used in a dehydrator, but sometimes a
- 9 -
glycol blend is economically attractive. TEG has gained nearly universal acceptance as the
most cost effective of the glycols, due to its superior dew point depression, operating cost, and
operation reliability [1, 2, 6].
3 TEG Dehydration unit
Triethylene glycol has been successfully used to dehydrate sweet and sour natural gases over
wide ranges of operating conditions. Dew point depression of the order of 30 °C to 70 °C can
be reached at gas pressures ranging from 0.25 to 17 MPa and gas temperatures between 4 °C
and 70 °C [2]. The dew point depression obtained depends on the equilibrium dew point
temperature, for a given TEG concentration and contact temperature. Increased glycol
viscosity may cause problems at lower contact temperature. Thus, heating of the natural gas
may be desirable. Very hot gas streams are often cooled prior to dehydration to prevent
vaporization of TEG.
3.1 Dehydration process
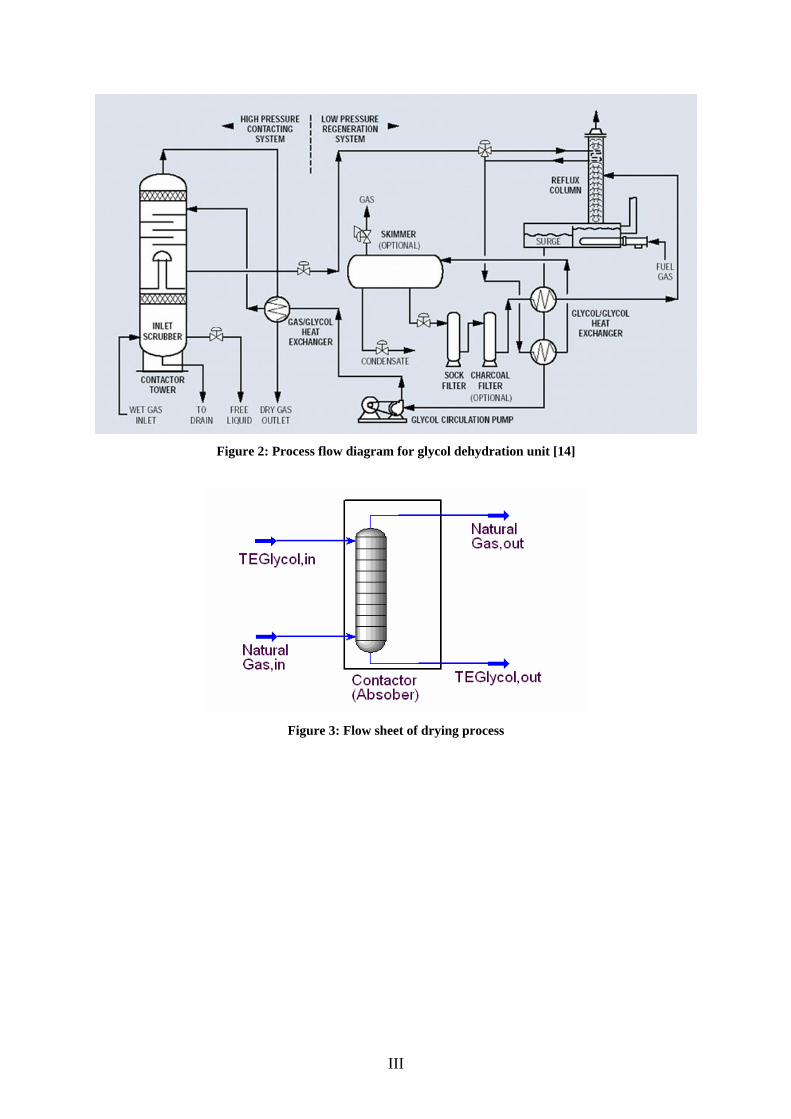
A typical glycol dehydration unit is shown in Figure 2. The feed gas must be cleaned to
remove all liquid water and hydrocarbons, wax, sand, drilling muds, and other impurities.
These impurities can be removed using an efficient scrubber, separator, or even a filter
separator for very contaminated gases. Integral separators at the bottom of the contactor are
common. The regenerated glycol is pumped to the top tray of the contactor. The glycol
absorbs water as it flows down through the contactor, countercurrent to the gas flow [1].
Dried gas is exiting from the top of the contactor. This gas required the water concentration
specification. Water-rich glycol is removed from the bottom of the contactor (absorber),
passes through the reflux condenser coil and flashes off most of the soluble gas (VOC,
BTEX) in the flash tank. Then the water-rich glycol flows through the rich-lean
(glycol/glycol) heat exchanger to the regenerator. In some cases, cloth and charcoal filters are
added in between the flash tank and the regenerator.
3.2 Regeneration process
In the regenerator, absorbed water is distilled from the glycol at near atmospheric pressure by
application of heat. The regeneration heat is provided by a natural gas burner. The common
temperature of regeneration process is under 204 °C. The regenerated lean glycol exiting the
- 10 -
surge drum, is first partly cooled in the lean-rich exchanger then is pumped through the glycol
cooler before being recirculated to the contactor.
4 Hysys modelling of dehydration process
Aspen Hysys software was used for modelling of a dehydration process. Aspen Hysys is used
for steady state simulation, design, performance monitoring and optimization of oil and gas
production, gas processing and petroleum refining industries.
4.1 Equations of state
In the present work, thermodynamic behavior of the TEG water system was represented by
means of the Peng-Robinson equation of state. Models based on a cubic equation of state
generally guarantee good phase equilibrium predictions over a wide range of temperature and
pressure. This is important in view of modelling the multicomponent system in the natural gas
dehydration units, where it is necessary to account for the presence of gases and for the high
operating pressure of the absorption column [7].
The Peng-Robinson equation is written as [7]:
)()(
.
)( bVbbVV
a
bV
RTP
(1)
The parameters are given by [7]:
c
c
P
TRa
22
45724.0
(2)
c
c
P
RTb 07780.0
(3)
where P
is the pressure, V the molar volume, T
the temperature, R
the universal gas
constant (8.314 J·K-1·mol-1), cT the critical temperature, cP the critical pressure and alpha
function, , is a function of reduced temperature cr TTT /
and acentric factor
defined by
[8]:
25.0
2 126992.054226.137464.01cT
T
(4)
1logcP
P
(5)
- 11 -
The mixing rules, [7], are used to calculate mixture parameters. The Peng-Robinson equation
is widely used for hydrocarbons and related components over broad ranges of temperature and
pressure. It is accurate enough for calculating enthalpy and entropy departures, vapor-liquid
equilibrium, liquid densities and vapor density in natural gas processing and many petroleum-
related operations. The Peng-Robinson equation is accurate in the critical region.
4.2 Conditions and compositions of inlet streams
An absorption column with 3 trays was used for the natural gas drying process simulation.
The process flow sheet is shown in Figure 3. Triethylene Glycol (TEG) was used as the
absorption medium. The TEG contained 0.5 wt. % of water, which is typical amount for
industrial drying units. The stream of TEG flowed down from the top of the column through
the contactor countercurrent to the natural gas stream and absorbed water.
An inlet gas stream was used, whose composition is similar to that of the Kristin field, [9],
located in the south-western part of the Halten Bank, in the Norwegian Sea. Natural gas
conditions were 30 °C temperature and 8000 kPa pressure, which are typical for industrial
drying units. A 9.15·10-6 Sm3/day molar flow of natural gas stream was used, which
corresponded to half of the gas rate on the Kristin platform. The standard volume (conditions
15 °C temperature and 101.325 kPa pressure) corresponded to 8.67·10-6 Nm3/day (conditions
0 °C and 101.325 kPa). The flow rate of TEG depended on the required water dew point
specification of outlet pipeline gas.
4.3 TEG-water equilibrium
Data describing the equilibrium between TEG and water are important for graphical
(McCabe-Thiel) solution of absorption drying process. Numerous data on the TEG-water (and
natural gas) system have been reported [11, 12]. However, there are severe discrepancies in
reported equilibrium values and the computing methods are very complicated.
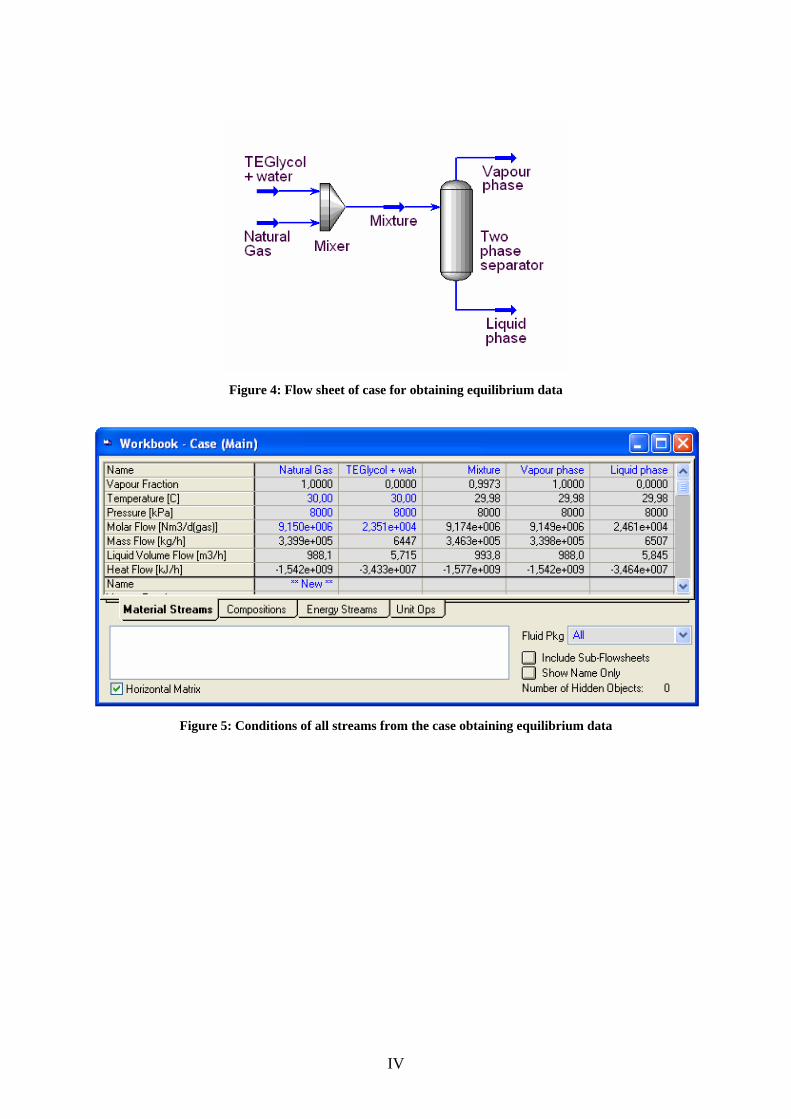
Equilibrium data were obtained from one simple case created in Hysys. Figure 6 shows this
case. Natural gas stream and triethylene glycol stream were mixed and then were separated in
two streams in the two phase separator. The composition of natural gas stream was similar to
the composition of the absorption drying process (composition of Kristin natural gas). The
conditions were also similar (30 °C temperature and 8000 kPa pressure). Conditions of all
streams are shown in Figure 5.
- 12 -
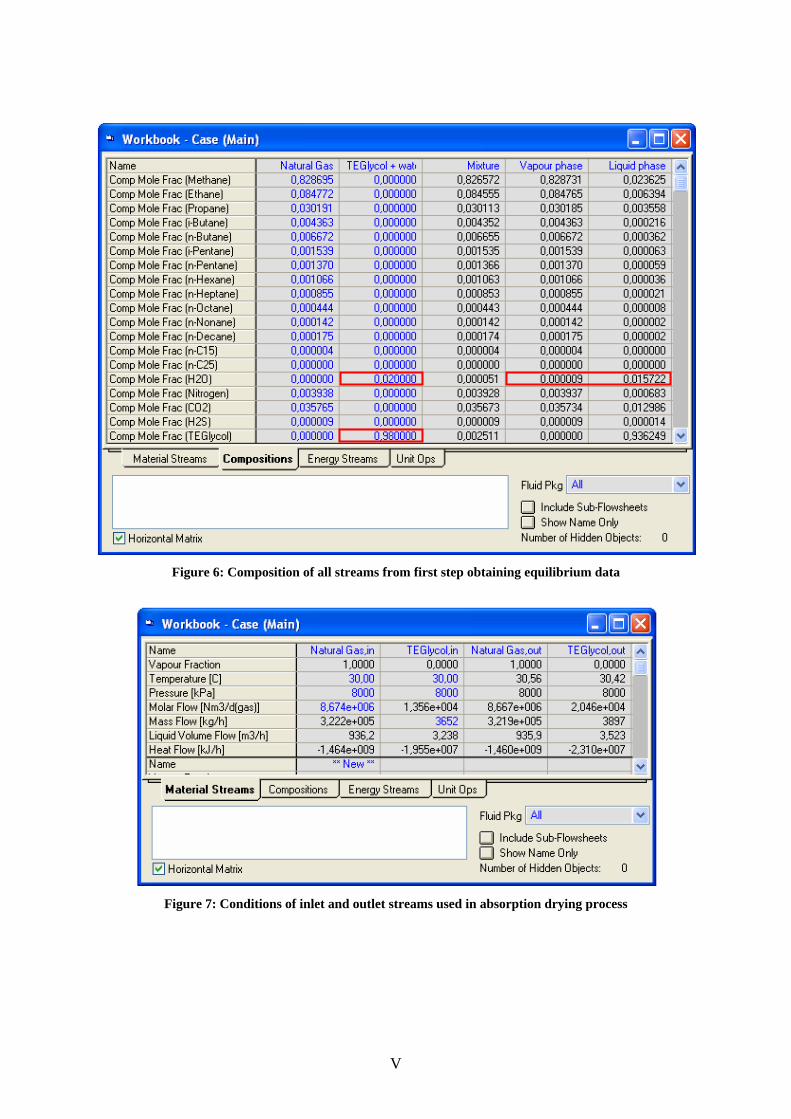
Triethylene glycol stream had the same conditions as the natural gas stream and had variable
content of water (molar fraction from 0.02 to 0.36). First example (0.98 molar fraction of
TEG and 0.02 molar fraction of water) is shown in the Figure 6. The equilibrium molar
fractions of water for vapour and liquid phase calculated by Hysys are 9·10-6 and 15722·10-6
respectively. Equilibrium data necessary for graphical solution were obtained in the same way
and are reported in Table 1.
5 Results
5.1 Hysys simulation
The absorption drying process flow sheet is shown in Figure 3. Beyond the flow rate of TEG
stream, the composition and conditions of both inlet streams were described. The flow rate of
absorption medium depends on the required water dew point specification of outlet pipeline
gas. The required dew point specification was -18 °C temperature at 7000 kPa pressure in this
work [9]. The required specification corresponds to water vapour content of 40.66·10-6 mole
fraction.
A 3653 kg/h minimum flow rate of TEG with 0.5 wt. % of water was calculated. Mass flow
rate calculations are shown in Figure 7 and Figure 8.
Glycol circulation rate is preferably used instead of mass or volume flow rate. Glycol
circulation rate means volume of circulating glycol per kilogram of absorbed water. The
minimum mass flow rate of TEG (3653 kg/h) corresponds to 15.6 L L TEG/kg H2O absorbed.
Most economical industrial designs utilize circulation rates of about 15 40 L L TEG/kg H2O
absorbed. Common circulation rate design is 25 L TEG/kg H2O absorbed [1]. Glycol
circulation rate calculated by Hysys provides agreement with this data.
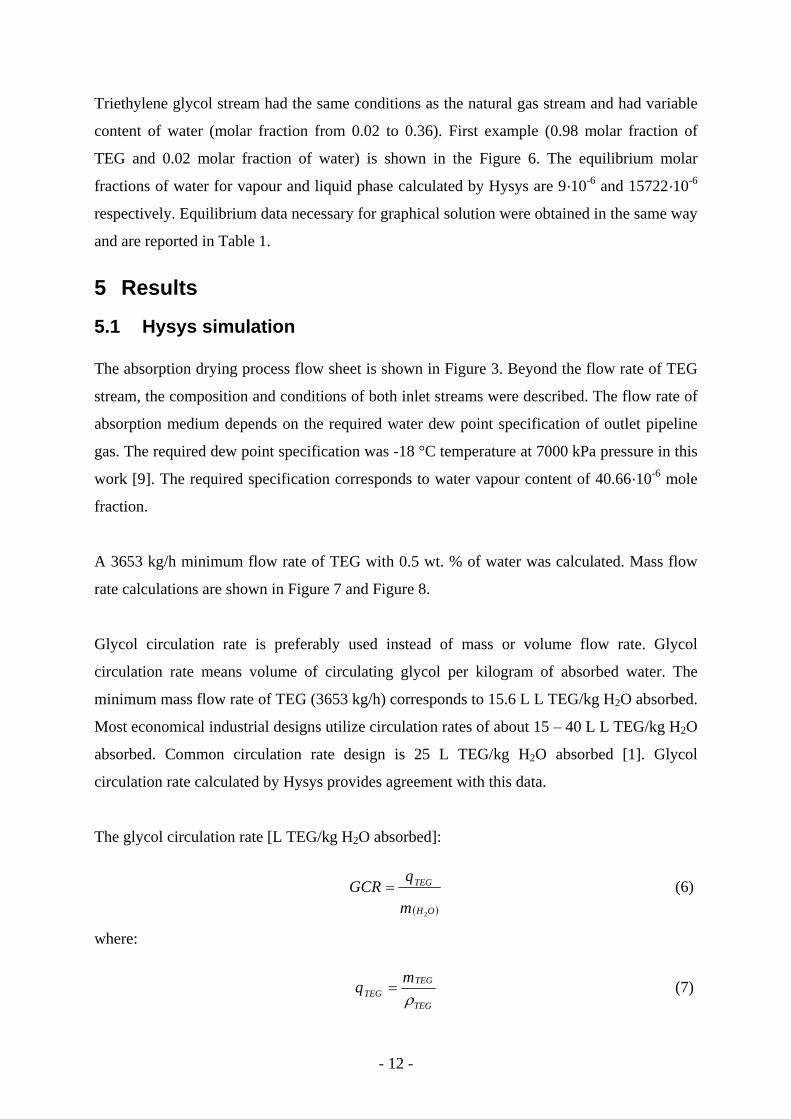
The glycol circulation rate [L TEG/kg H2O absorbed]:
OH
TEG
m
qGCR
2
(6)
where:
TEG
TEG
TEG
mq
(7)
- 13 -
outOHinOHOH mmm 222
(8)
...TEGq volume flow rate of TEG [L/h]
...TEGm mass flow rate of TEG [kg/h]
...TEG mass density of TEG (calculated by Hysys: 1127.44 kg/m3)
...2OHm flow rate of absorber water [kg/h]
...2 inOHm flow rate of water in the inlet stream of gas (from Hysys: 219.72 kg/h)
...2 outOHm flow rate of water in the outlet stream of gas (from Hysys: 11.80 kg/h)
Then the glycol circulation rate is:
absorbedOHkgTEGLGCR 23 /58.1510
80.1172.21944.1127
3653
For most common glycol circulation rate ( absorbedOHkgTEGLGCRMC 2/25 ), the mass
flow rate of TEG is 5860.5 kg/h.
From (6) and (7):
TEGOHMCTEG mGCRm 2 (9)
Because the mass of absorbed water is constant, (molar fractions of water in both gas streams
are constant) and mass density of TEG is constant, (temperature and pressure are constant) the
mass flow rate of TEG is:
hkgmTEG /54.586044.112780.1172.21925
For this mass flow of TEG and 3 theoretical stages, Hysys calculates a molar fraction of water
in the outlet gas of 28.78·10-6 mol/mol, which is well within the required water content
specification (40.66·10-6 mol/mol).
- 14 -
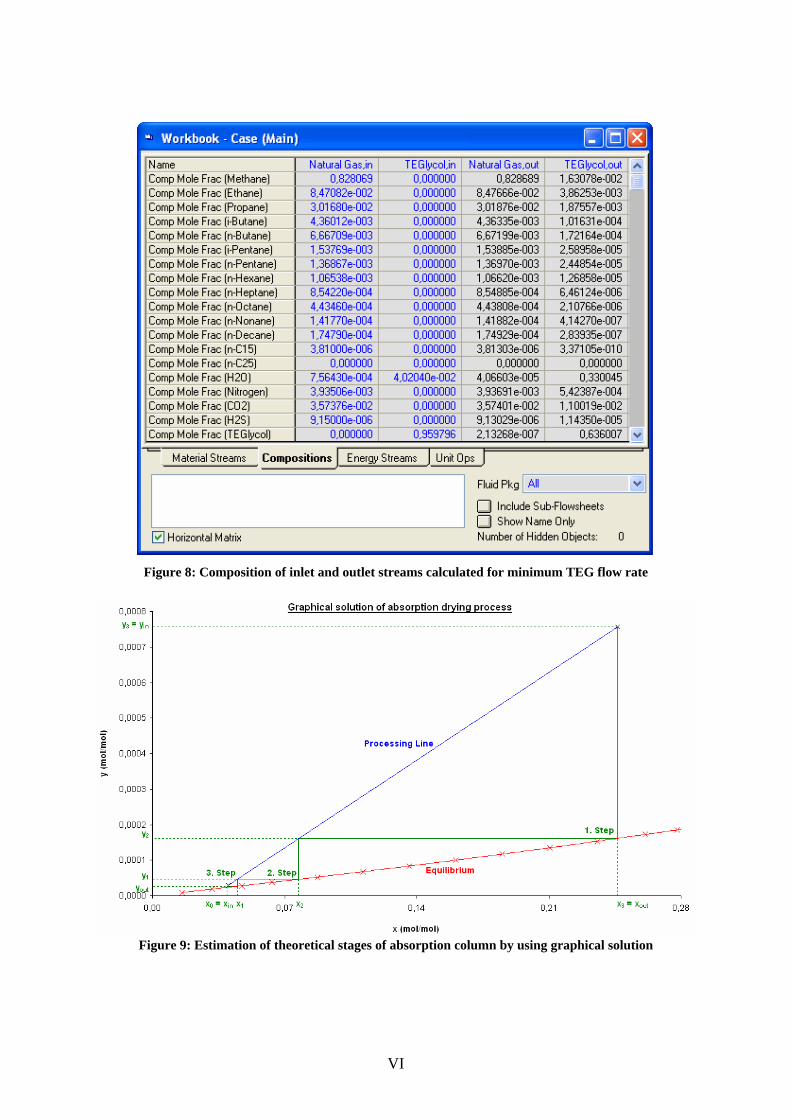
5.2 Graphical solution of absorption process
One way to estimate the number of theoretical stages for absorption column is a graphical
solution as shown in Figure 9. The equilibrium curve is created from equilibrium data
obtained in chapter 4.3. The processing curve is created like a linear line from two points. The
first point [xin, yout] represents the top of the column. The value xin is the water fraction in the
inlet glycol stream and the value yout is the water fraction in the outlet gas stream. The second
point of processing line [xout, yin] represents the bottom of the column and values xout, yin are
the fractions of water in the outlet glycol stream respectively in the inlet gas stream [13].
It was necessary to accomplish three equilibrium steps between processing line and
equilibrium curve for achieve the required water content specification. These three steps are
corresponding to three theoretical stages of the absorption column.
5.3 Analytical solution of absorption process
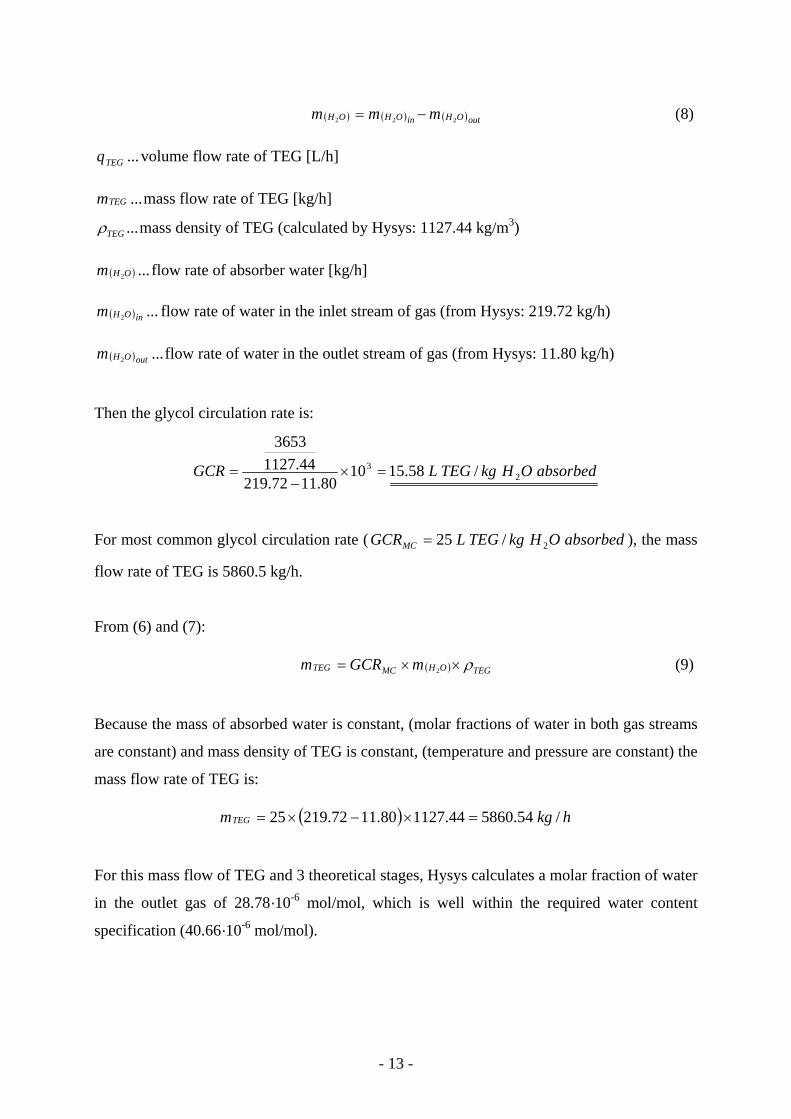
Analytical solution is another way to estimate the number of theoretical stages of absorption
column. It is given by the following equation, often referred to as the Kremser (or Kremser-
Brown) equation [13]:
AAAyy
yyN N
ln
1111ln
01
01
(10)
where:
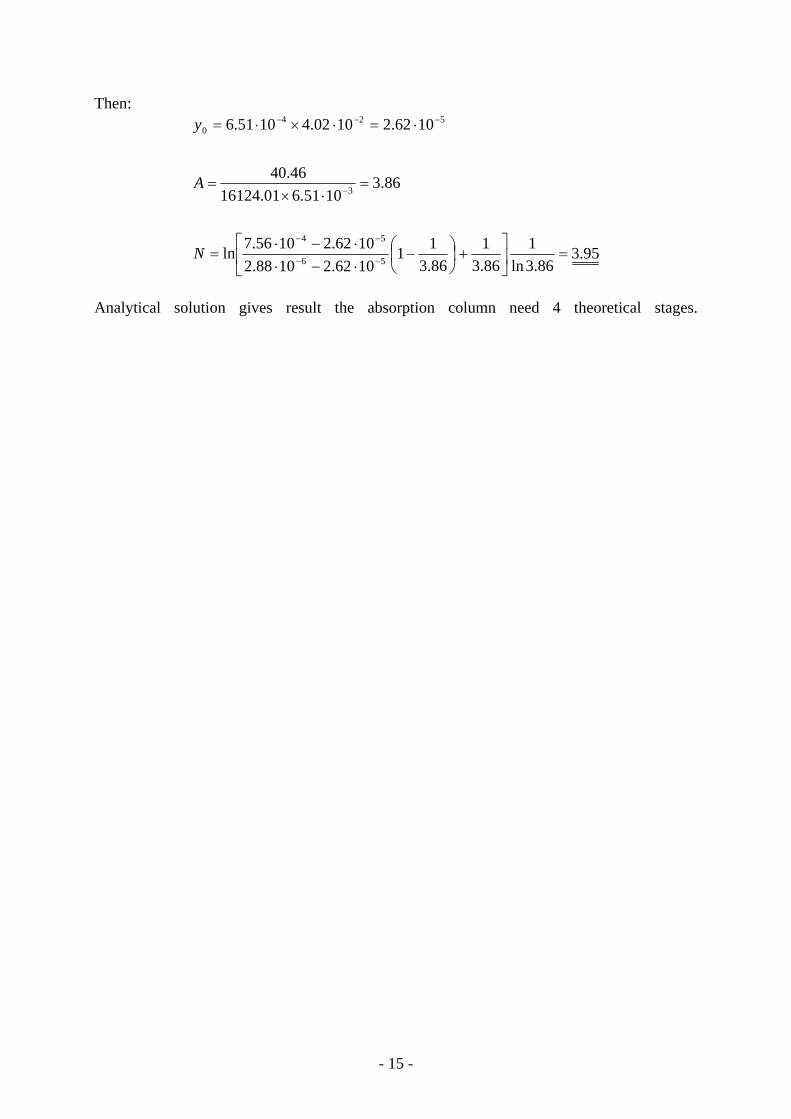
...N number of theoretical stages ...1Ny molar fraction of water in inlet gas stream (calculated by Hysys: 7.56·10-4)
...1y molar fraction of water in outlet gas stream (calculated by Hysys: 2.88·10-6)
...0y molar fraction of water in vapour phase in equilibrium with 00 xky
...0x molar fraction of water in inlet TEG stream (calculated by Hysys: 4.02·10-2)
The value A is called effective absorption factor and is calculated by [13]:
kG
LA
(11)
where: ...L molar flow of liquid phase entering in the column (calculated by Hysys: 40.46 kmol/h) ...G molar flow of gaseous phase entering in the column (calculated by Hysys: 16124 kmol/h)
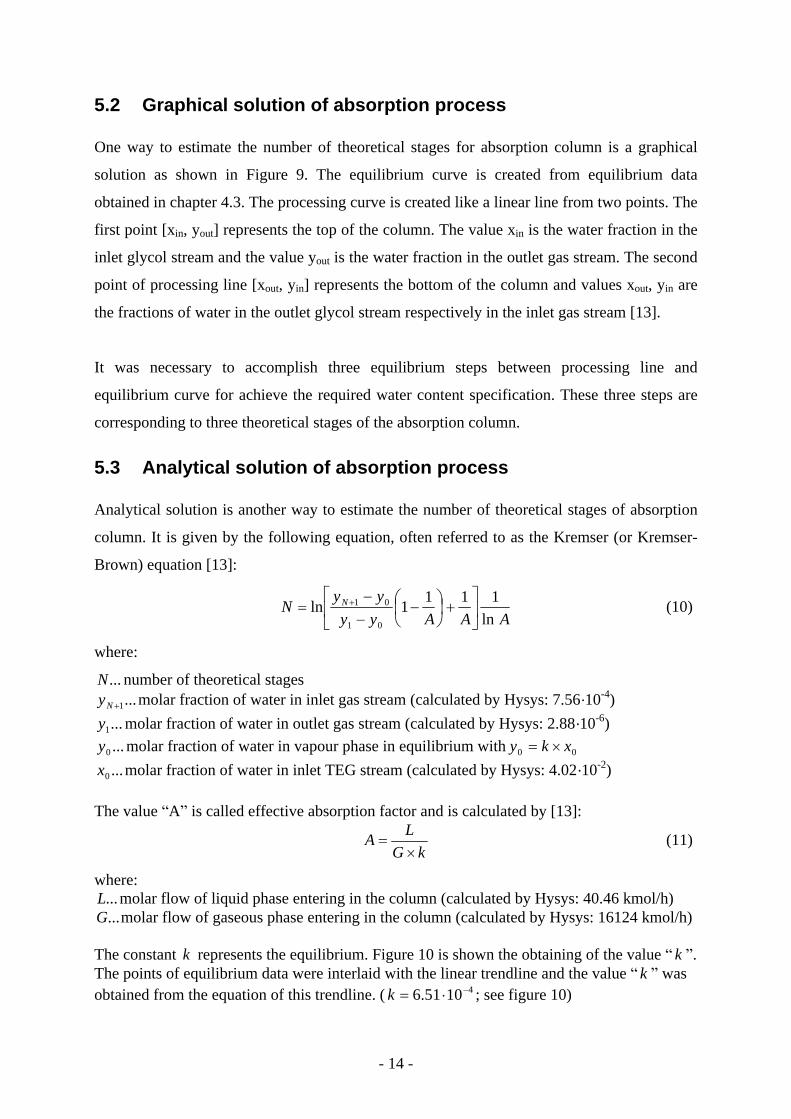
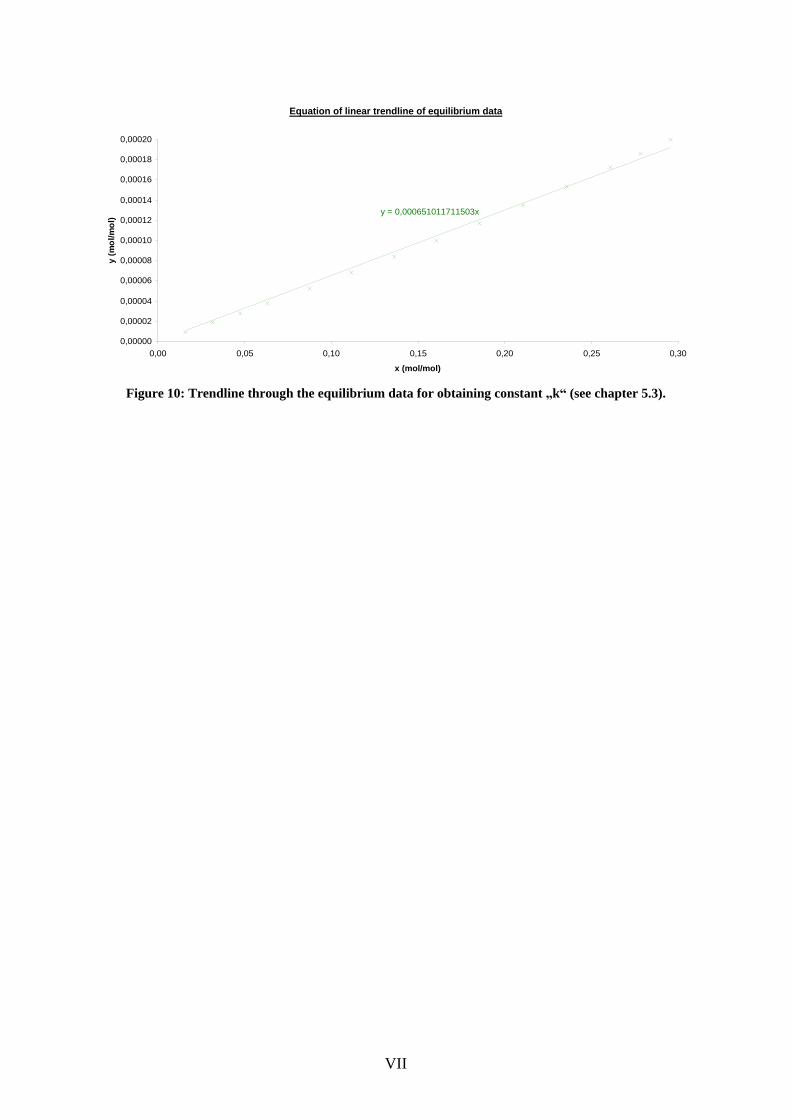
The constant k represents the equilibrium. Figure 10 is shown the obtaining of the value k . The points of equilibrium data were interlaid with the linear trendline and the value k was obtained from the equation of this trendline. ( 41051.6k ; see figure 10)
- 15 -
Then:
95.386.3ln
1
86.3
1
86.3
11
1062.21088.2
1062.21056.7ln
86.31051.601.16124
46.40
1062.21002.41051.6
56
54
3
5240
N
A
y
Analytical solution gives result the absorption column need 4 theoretical stages.
- 16 -
6 Conclusion
Hysys model, based on cubic Peng-Robinson equation of state, provides satisfactory
agreement with industrial data. The Hysys process simulation offers a suitable tool to
determine many operating parameters, such as mass flow rates, molar flow rates and glycol
circulation rate.
A 3653 kg/h triethylene glycol minimum mass flow rate was determined for a three stages
absorption column, where the outlet gas required water content was specified. It corresponds
to 15.6 L TEG/kg H2O absorbed specific circulation rate (Most economical industrial designs
employ circulation rates of about 15-40 L TEG/kg H2O absorbed). For most common glycol
circulation rate (25 L TEG/kg H2O absorbed) and three theoretical stages the required water
content specification was reached. Four theoretical stages were then calculated.
Graphical solution of the same absorption process was built on the equilibrium data obtained
from simple Hysys case. This solution estimated three theoretical stages for absorption
column.
The number of theoretical stages was also estimated by the analytical calculation. Kremser-
Brown equation for this method was used. This equation gave as result of 4 theoretical stages.
- 17 -
7 References
[1] Guo, B., Ghalambork, A., (2005): Natural Gas Engineering Handbook, Gulf Publishing
Company, p. 123 147.
[2] Gas Processors Suppliers Association (2004): GPSA Engineeering Data Book, 12th
Edition, p. 20-23 20-29.
[3] Gironi, F., et al, (2007): Modelling triethylene glycol
water system for natural gas
dehydration, 8th International Conference on Chemical and Process Engineering, Chemical
Engineering Transactions, ISBN 88-95608-00-6, p. 881
886.
[4] Kittel, C., Kroemer, H., (1980): Thermal Physics, W. H. Freeman. ISBN 0-7167-1088-9,
p. 336 337.
[5] Lyons, W., C., Plisga, G., J., (2005): Standard Handbook of Petroleum and Natural Gas
[6] Speight, J., G., (2007): Natural Gas: A Basic Handbook, Gulf Publishing Company
Engineering (2nd Edition), Elsevier
[7] Peng, D., Y., Robinson, D., B., (1976): A New Two-Constant Equation of State, Ind. Eng.
Chem., Fundam., 15(1), p. 59-65
[8] Twu, H., C., et al, (2005): Advanced equation of state method for modeling TEG-water
for glycol gas dehydration, Fluid Phase Equilibria, 228-229, p. 213-221
[9] Gudmundsson, J., S., Private communication, (NTNU), 11. 2. 2009
[10] Oi, L., E., (2003): Estimation of tray efficiency in dehydration absorbers, Chem. Eng.
Pr., 42, p. 867-878
[11] Herskowitz, M., Gottlieb, M., (1984): Vapor-liquid equilibrium in aqueous solutions of
various glycols and poly(ethylene glycols), J. Chem. Eng. Data, 24, p. 173-175
[12] Bestani, B., Shing, K., S., (1989): Infinite-dilution activity coefficients of water in TEG,
PEG, glycerol and their mixtures in the temperature range of 50
140 °C, Fluid Phase
Equilib., 50, p. 209-221.
[13] Gudmundsson, J., S., (2009): Prosessering av petroleum, Department of Petroleum
Engineering and Applied Geophysics, Norwegian University of Science and Technology,
p. 89 95.
[14] ISEE
International Sustainable Energy Exchange, http://www.hart-isee.com/,
24.6.2009
I
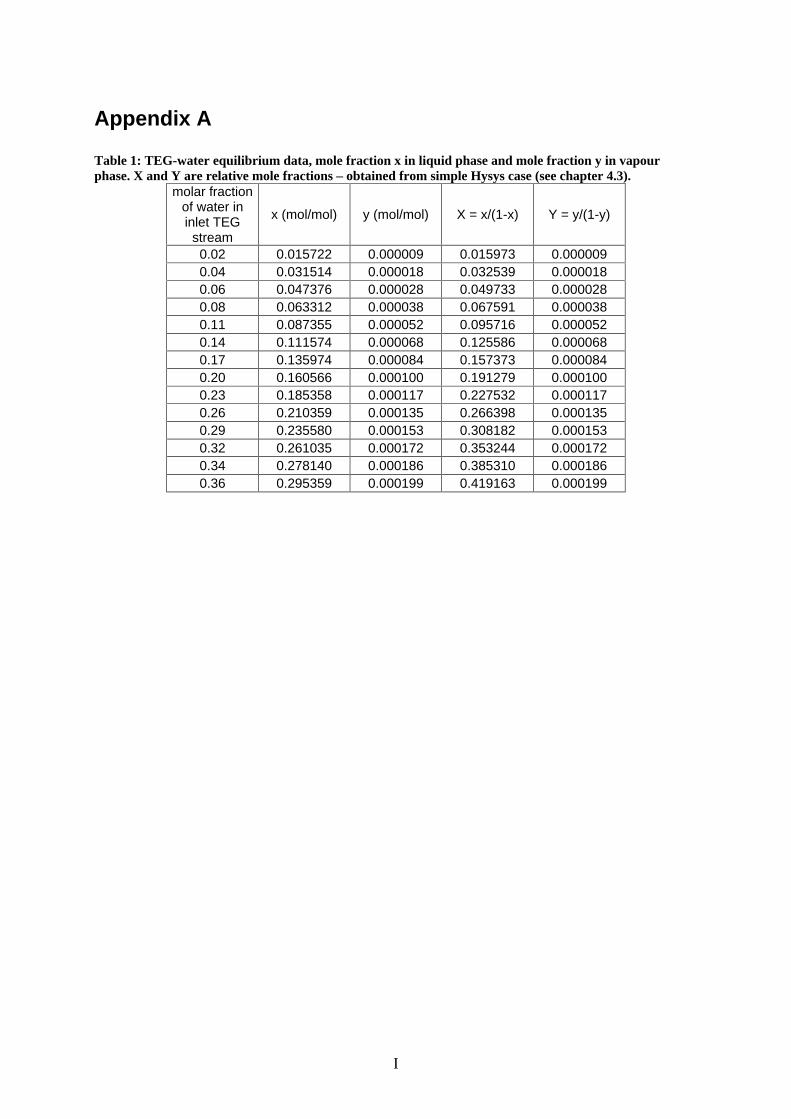
Appendix A
Table 1: TEG-water equilibrium data, mole fraction x in liquid phase and mole fraction y in vapour phase. X and Y are relative mole fractions obtained from simple Hysys case (see chapter 4.3).
molar fraction of water in inlet TEG
stream
x (mol/mol) y (mol/mol) X = x/(1-x) Y = y/(1-y)
0.02 0.015722 0.000009 0.015973 0.000009 0.04 0.031514 0.000018 0.032539 0.000018 0.06 0.047376 0.000028 0.049733 0.000028 0.08 0.063312 0.000038 0.067591 0.000038 0.11 0.087355 0.000052 0.095716 0.000052 0.14 0.111574 0.000068 0.125586 0.000068 0.17 0.135974 0.000084 0.157373 0.000084 0.20 0.160566 0.000100 0.191279 0.000100 0.23 0.185358 0.000117 0.227532 0.000117 0.26 0.210359 0.000135 0.266398 0.000135 0.29 0.235580 0.000153 0.308182 0.000153 0.32 0.261035 0.000172 0.353244 0.000172 0.34 0.278140 0.000186 0.385310 0.000186 0.36 0.295359 0.000199 0.419163 0.000199
II
Appendix B
Figure 1: Diagram of water content of natural gas [2]
III
Figure 2: Process flow diagram for glycol dehydration unit [14]
Figure 3: Flow sheet of drying process
IV
Figure 4: Flow sheet of case for obtaining equilibrium data
Figure 5: Conditions of all streams from the case obtaining equilibrium data
V
Figure 6: Composition of all streams from first step obtaining equilibrium data
Figure 7: Conditions of inlet and outlet streams used in absorption drying process
VI
Figure 8: Composition of inlet and outlet streams calculated for minimum TEG flow rate
Figure 9: Estimation of theoretical stages of absorption column by using graphical solution
VII
Equation of linear trendline of equilibrium data
y = 0,000651011711503x
0,00000
0,00002
0,00004
0,00006
0,00008
0,00010
0,00012
0,00014
0,00016
0,00018
0,00020
0,00 0,05 0,10 0,15 0,20 0,25 0,30
x (mol/mol)
y (m
ol/m
ol)
Figure 10: Trendline through the equilibrium data for obtaining constant k (see chapter 5.3).