POL 466 Capstone
92
Family Health and Nutrition Policy Analysis Spring 2015 POL 466 Public Policy Analysis Capstone Miami University John Hawkins, Lee Hollis, Jennifer Martin, Paige Melton, Nomsa Mzozoyana, and Anna Swanson
-
Upload
nomsa-mzozoyana -
Category
Documents
-
view
67 -
download
3
Transcript of POL 466 Capstone
Family Health and Nutrition Policy Analysis
Spring 2015
POL 466 Public Policy Analysis Capstone
Miami University
John Hawkins, Lee Hollis, Jennifer Martin, Paige Melton, Nomsa Mzozoyana, and Anna
Swanson
Executive Summary
This policy research report gives an overview of food insecurity, health, and nutrition in America today. There has been an attitudinal shift throughout the country and people are now more cognizant about the production, consumption, and whereabouts of their food and by extension their health and well being. A small minority however must deal with food insecurity. Food insecurity, or not being able to purchase or acquire enough to eat, is something which has vexed Congress and governmental agencies throughout the last century.
The brief begins with chapter one by discussing common concepts, themes, and logistics of food insecurity, as well as the challenges it poses and its general presence throughout America. It will discuss why family health and nutrition is currently at a crossroad, and more specifically, why it is a public problem.
Chapter two will focus on the historical context of food insecurity and in particular the corresponding network of food assistance programs that have come about, their inherent differences and commonalities, and their targeted stakeholders and recipients.
Chapter three is an attempt to comb the preexisting literature in order to show the positive results and implications of these food assistance programs. For example, the Supplemental Nutrition Assistance Program (SNAP), arguably the cornerstone of domestic food policy today, has been shown not only to work, but to work well and be able to lift many out of poverty.
Chapter four delves into possible tweaks and alternatives that could be implemented concurrently with pre existing food assistance programs like SNAP in an effort to not only make food more accessible but to make nutrient dense food more accessible.. Chapter four also looks to some lesser known alternatives that have been attempted at the state and local level as well as some non-governmental implementation opportunities.
Lastly in chapter five, the policy team offers up a specific course of action and borrows from both chapters three and four in an attempt to give food policy a needed face lift. The recommendations in question attempt to shift the focus of food insecurity from providing a higher quantity of food to a higher quality of food. This can be best addressed by working in tandem with preexisting pieces of federal food policy as well as working with local communities and local actors. The aforementioned alternatives are both politically and economically feasible and thus worthy of attention.
Whatever one’s take away is, it goes without saying that evaluating the current trends, trajectory, and agenda related to food insecurity in our nation is critical. Regardless of ideology, gender, race, or socioeconomic status, everyone is in agreement that no one should be denied of food.
Table of Contents
Acronyms and Definitions……………………………………………………………..pg.
5
Chapter 1: Policy Problem…………………………………………………………......pg. 6 Definition of the Problem……………………………………………………...pg. 6 Food Insecurity and Definitions……………………………………………….pg. 7 Food Insecurity and Federal Actors…………………………………………...pg. 8 Why a Public Problem?......................................................................................pg. 8 Market of Imperfections—Examining the Private and Public Markets…….....pg. 8 Marketplace Failure Warrants Government Action…………………...........…pg. 11 The USDA, SNAP, and WIC…………………………………………..….......pg. 12 Program Design and Use……………………………………………..………..pg. 15 Program Objectives………………………………………………………..…..pg. 16 Chapter 2: Policy Background and Environment……………………….………….…...pg. 20 Origination..…………………………………………………..…....…...…..…...pg. 20 Food Stamp Program 1961-64…………………………………………….…… pg. 22 The Food Stamp Act of 1964………………………………………….….….….pg. 23 Broadening the Scope to Women, Infants, and Children………………..……....pg. 27 Food Stamp Program Changes of the 1970’s…………………………..………..pg. 28 The Modern Food Stamp Program, SNAP………………………………….…..pg. 32 National School Lunch Program …………………………………………..……pg. 33 Chapter 3: Research and Literature Findings……..………………………….…...…....pg. 35
WIC Findings………………………………………………………….……….pg. 37
Issues with WIC……………………………………………………….……….pg. 41
SNAP Findings………………………………………………………….……..pg. 43 Empirical Research Policy Efficiency………………………………….….…..pg. 49
Chapter 4: Policy Alternatives and Impacts…………………………………….….…..pg. 55 Alternatives and Remedying at the Federal, State, and Local Level…….….....pg. 56 Incremental Changes to preexisting SNAP and WIC Policy More Frequent SNAP Payments…………………………………..…...pg. 57 Providing Monetary Incentives for Healthy Food Choices………...….pg. 58 Strengthening SNAP and WIC Vendor Standards………………..…...pg. 58 Increase Food and Choice for WIC recipients ……………………..…pg. 59 State and Local Food Policy Initiatives: Examples and Ideas Food Community Councils……………………………………….…...pg. 60 Increasing Amount and Type of Food Vendor Available……….…….pg. 60 Reducing Transportation Barriers……………………………….…….pg. 62 Using SNAP and WIC EBT Cards in Farmers’ Markets…………......pg. 62 Non-Governmental Alternatives Community Gardening…………………………………………….....pg. 63 Farmers’ Markets……………………………………………….…….pg. 64 Farm-to-school Initiatives…………………………………….……...pg. 64 Costs and Benefits of the Alternatives………………………………….…....pg. 65 WIC Funding and Costs……………………………………………….….….pg. 66 New Technology Costs…………………………………………………..…..pg. 67
Policy Alternatives Have Much Potential …………………………….….….pg. 70 Chapter 5: Policy Recommendations………………………………………………….pg. 71 Incorporating EBT Technology Into Farmers’ Markets……………………....pg. 71 Economic Feasibility and Benefits of EBT…………………………………...pg. 72 Political Feasibility and Benefits of EBT……………………………………..pg. 73 Encouraging Stricter Vendor Requirements……………………………….….pg. 75
Economic Feasibility………………………………………………………….pg. 75 Political Feasibility…………………………………………………………....pg. 76 References………………………………………………………………….………….pg.
80
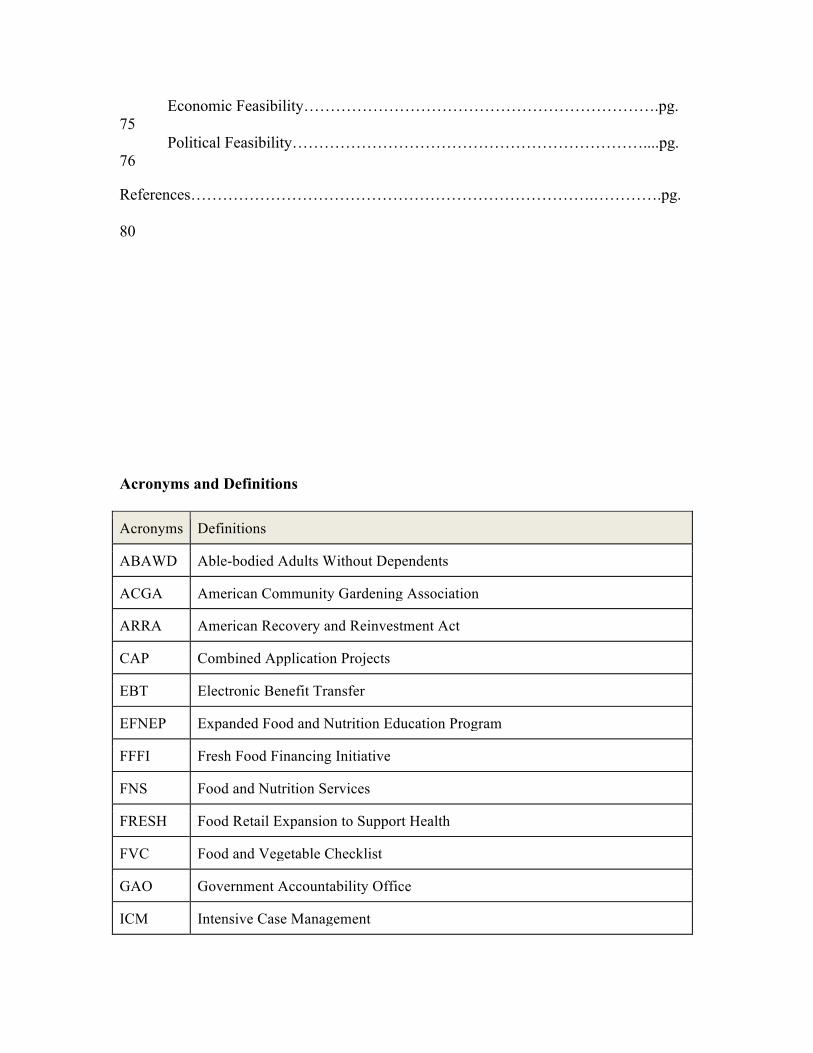
Acronyms and Definitions
Acronyms Definitions
ABAWD Able-bodied Adults Without Dependents
ACGA American Community Gardening Association
ARRA American Recovery and Reinvestment Act
CAP Combined Application Projects
EBT Electronic Benefit Transfer
EFNEP Expanded Food and Nutrition Education Program
FFFI Fresh Food Financing Initiative
FNS Food and Nutrition Services
FRESH Food Retail Expansion to Support Health
FVC Food and Vegetable Checklist
GAO Government Accountability Office
ICM Intensive Case Management
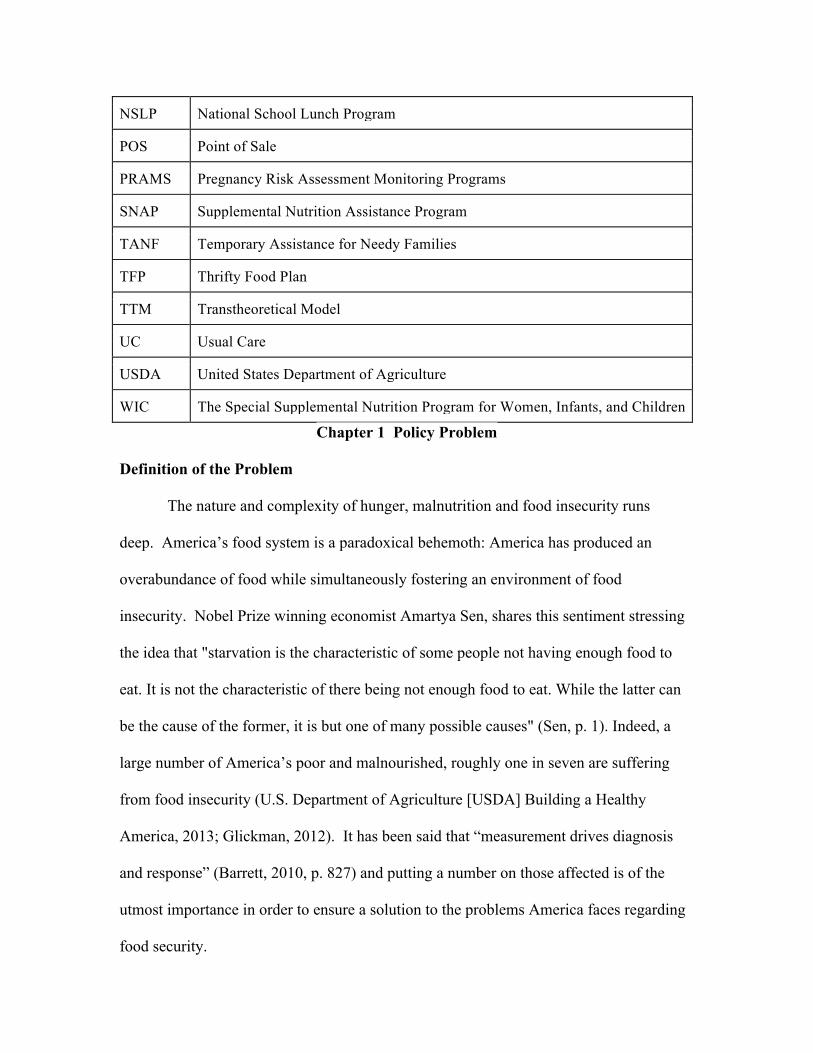
NSLP National School Lunch Program
POS Point of Sale
PRAMS Pregnancy Risk Assessment Monitoring Programs
SNAP Supplemental Nutrition Assistance Program
TANF Temporary Assistance for Needy Families
TFP Thrifty Food Plan
TTM Transtheoretical Model
UC Usual Care
USDA United States Department of Agriculture
WIC The Special Supplemental Nutrition Program for Women, Infants, and Children
Chapter 1 Policy Problem
Definition of the Problem
The nature and complexity of hunger, malnutrition and food insecurity runs
deep. America’s food system is a paradoxical behemoth: America has produced an
overabundance of food while simultaneously fostering an environment of food
insecurity. Nobel Prize winning economist Amartya Sen, shares this sentiment stressing
the idea that "starvation is the characteristic of some people not having enough food to
eat. It is not the characteristic of there being not enough food to eat. While the latter can
be the cause of the former, it is but one of many possible causes" (Sen, p. 1). Indeed, a
large number of America’s poor and malnourished, roughly one in seven are suffering
from food insecurity (U.S. Department of Agriculture [USDA] Building a Healthy
America, 2013; Glickman, 2012). It has been said that “measurement drives diagnosis
and response” (Barrett, 2010, p. 827) and putting a number on those affected is of the
utmost importance in order to ensure a solution to the problems America faces regarding
food security.
In the proceeding text, we will attempt to show why food insecurity is an issue in
need of the public’s attention and government action. Arguably, the public’s attitudes on
health are shifting, as now more than ever, people are more cognizant of their overall
health and well-being. By addressing the multi-faceted causes of hunger and
malnutrition, those affected will in fact benefit and stand to gain in other areas of their
lives. From a public health standpoint, access to food, high-quality food, is imperative,
for the burden of diet-related diseases is disproportionately high,among those with low
socioeconomic status. Research shows that access to food, especially healthy food,
greatly impacts cognitive development and academic achievement in young children
(Jackson, 2015). Less obvious benefits to one’s diet, include being better able to perform
in a work environment, school, and having a sense of agency that was not felt before
(Jackson, 2015).
Food Insecurity and Definitions
Approximately 85.7 percent of U.S. households experienced food security in
2013, which means 14.3 percent of U.S. household experienced food insecurity (USDA,
Key Statistics & Graphics, 2015).
It is important to preface the remainder of this text by noting that “food
insecurity” and “hunger” are not one in the same. Looking to the former, “food
insecurity”, and by extension, ‘food security,’ “focus[es] on those economic and other
access-related reasons associated with an individual’s ability to purchase or otherwise
obtain enough to eat.” (Aussenberg & Colello, 2015 p. 2). The United States Department
of Agriculture defines food security as “access by all people at all times to enough food
for an active, healthy lifestyle,” (USDA Overview). Food insecurity is broken down into
two categories: low food security and very low food security. Low food security is
defined as “reports of reduced quality, variety, or desirability of diet,” with “little or no
indication of reduced food intake;” formerly defined as “food insecurity without hunger.”
(USDA Definitions). Very low food security is defined as “reports of multiple
indications of disrupted eating patterns and reduced food intake;” formerly defined as
“food insecurity with hunger.
According to a 2006 panel convened by the National Research Council, at the
request of the USDA, reviewed by USDA measurements related to food adequacy, the
panel discussed how hunger as opposed to food insecurity “is an individual-level
physiological condition that is not feasible to measure...” (Aussenberg & Colello, 2015).
Henceforth, we will be using the terms “food insecurity” and “food security” as opposed
to “hunger,” as they are both more objective and better able to be quantified. Leading
scholars on the subject of food policy also use these definitions.
Food Insecurity Federal Actors
In the United States, while several organizations are concerned with monitoring
and regulating food insecurity, the official agency tasked with alleviating the issue is the
United States Department of Agriculture. The Economic Research Service within the
Department of Agriculture monitors food security impact as “the well-being of children,
adults, families, and communities,” and “food security’s relationship to public policies,
public assistance programs, and the economy,” (USDA Overview). Also within the
USDA is the Food and Nutrition Services (FNS) agency, which administers the current
policies addressing food security and health.
Food Insecurity: What Makes it a Public Problem?
When trying to solve the issue of food insecurity and malnutrition, it is imperative
that we establish a basis for why the problem has occurred. Viewing the issue of food
insecurity and food security from an economic standpoint allows for us to be able to both
conceptualize the issues at hand and allows for us to ascribe certain remedies to the
issue. Being able to consider the characteristics of the political economy, public and
private markets, gives us the fundamental tools we need to solve the issue of food
insecurity and food security.
Market of Imperfections—Examining the Private and Public Markets
The collaboration of both the public and private market, can be referred to as the
political economy. Within this framework, we understand that as both consumers and
citizens, we are able to seek an outlet for our needs, wants, and demands. Our
participation in the political economy allows us the opportunity to be able to decide
through which market we are better able to evaluate which market aligns with our wants
and needs.
The private market is most efficient in being able to respond to the distribution of
goods and services that are based on individual wants and demands, like a vehicle or a
computer. The private market is rooted in the ideas of self-interest and individual pursuit
as it is an efficient outlet for allocating resources. However, due to its inherent
characteristics, the private market falls short of being able to consistently deliver goods
and services with the utmost equity and efficiency. As a result, the private market proves
to be ineffectual at ensuring that all are able to receive the needs, wants and demands
they desire.
The private market is solely responsible for individual pursuit and profit-
maximizing endeavors, thus it cannot and should not be held responsible for being able to
solve what economists call the “problem of externalities.” (Weimer & Vining 2014 pg.
92) Externalities arise when the actions one party make another party worse or better off,
yet the first party neither bears the costs nor receives the benefits.
The problem of externalities is a reason why the public market exists. As actors in
the private market, we have become less tolerant and more cognizant of market
failure. Therefore we bring our needs to the attention of those elected officials within the
public market, who work within its confines to adequately and effectively manage our
needs, wants and demands that are unable to be satisfied within the private market.
The public market was developed in order to solve the inefficiencies that arise due
to the existence of private market failures. In the development of the public interest, we
understand or expect, as citizens that there are certain needs, wants, and demands that
must be properly addressed within the confines of the public market. Government exists
to promote equity, fairness and justice for all--guided by the fundamental belief in the
public interest, it is the duty of government to effectively and efficiently, respond to
deficiencies within the political economy. As a result, the public market is responsible
for providing its citizens the access to public goods and services, such as safety, clean air,
etc. Acting as both consumers and citizens, when our needs are not being met, we turn to
the public market to alleviate issues and injustices at hand.
To understand the totality of the food crisis is to understand market failure. As
understood by Weimer and Vining (2014), a market failure is “a circumstance in which
the pursuit of the private interest does not lead to an efficient use of society’s resources or
fair distribution of society’s goods” (p. 37).
Those most affected by food insecurity are low-income individuals and families.
These are the most vulnerable and socially marginalized groups in society, as they are
most affected by the consequences of private market failure. Unable to compete within
the private market in obtaining resources necessary for survival, low income families are
affected by food insecurity leading to malnutrition malnutrition, with the most damage
being experienced by developing fetuses, infants, and small children. As a result, young
children and disadvantaged adults, do not receive sufficient nutritious food and stand to
face the negative effects from this later in life, experiencing a lack of health and poor
development (Jackson, 2015). Studies have found that steady access to healthy foods
strongly influences “cognitive development and socioeconomic inequality,” showing that
food security “enable[s] productive functioning across multiple social institutions over
the life course” (Jackson, 2015, np).
Solving such imperfections and market failures has shown us that government
intervention is not only necessary but proper, as government is charged with the duty to
correct private wrongs and ensure that all have an equal and fair opportunity to compete
and survive within the political economy—government intervention is in this sense vital
for not only economic survival, but also for the social welfare of consumers and citizens.
Marketplace Failure Warrants Government Action
As discussed, the private market cannot accommodate issues of equity and
fairness, for it operates solely under pareto efficiency. Pareto efficiency is the idea that it
is impossible to make one individual better off without making at least one individual
worse off. With pareto efficiency, equality or fairness is not guaranteed. Whatever is
yielded under this idea may not be socially desirable--thus resources may be distributed
unevenly. In regards to food security, trying to solving this issue is useless within the
private market for socially desirable goals are better solved within the public
market. Government must be at the center of these issues, for it is within the interest of
government to create “ a more perfect union,” one that is based on equity and fairness.
As citizens, acting within these two different markets, we become increasingly
aware of the deficiencies, shortcomings, and inabilities that these markets
possess. Consumers within the private market that are unable to provide for themselves
and their families must turn to the public market for assistance. The task of providing
nutrition assistance is not profitable in the private sector, as there is little to no incentive
for private companies, the private market, to invest such resources to others.
Furthermore, food insecurity affects those families and individuals who are low-
income. This portion of the population is comprised of those individuals who have a
difficult time being able to fend for themselves as a lack of education and income
prevents them from being able to efficiently compete within the private
marketplace. Viewing this issue “from an anti-hunger perspective... food is a basic
human right and if that right cannot be guaranteed by the market economy, it is the duty
of the state to fulfill that” (Allen, 1999, np). As previously mentioned, the public market
is designed to alleviate societal woes and economic failures, as it is the duty of
government to correct wrongs created by the private market. Food security and food
insecurity are major and complex issues. Finding a way to alleviate, and eventually to
eliminate, these issue falls under the responsibility of the USDA.
The USDA, SNAP, and WIC
The United States Department of Agriculture (USDA) is the federal agency
responsible for developing and executing federal policy for farming, agriculture, forestry,
and food. According to the agency’s mission statement, it is their duty to “expand
economic opportunity through innovation, helping rural America to thrive; promote
agriculture production sustainability that better nourishes Americans while also helping
feed others throughout the world...” (USDA Vision Statement, 2015). The USDA’s
programs are targeted at helping food insecure and low-income families and individuals
survive. The major programs are the Supplemental Nutrition Assistance Program
(SNAP), the Special Supplemental Nutrition Program for Women, Infants and Children
(WIC), and child nutrition programs such as the School Lunch Program. These programs
are federally funded and administered through state agencies. SNAP is funded under the
Farm Bill. Every five years, the Farm Bill is reauthorized by Congress, at which time the
structure, eligibility and program access is evaluated or adjusted (Food Research and
Action Center [FRAC], SNAP/Food Stamps, 2010). Those who lack the necessary
resources to afford staple food items qualify as being food insecure. In the United States,
this translates to roughly 44.7 million individuals and 21.1 million households are
receiving benefits from SNAP (USDA Building a Healthy America,
2012). Economically or financially challenged individuals including but not limited to,
women, infants, children, and the disabled are those who are most affected by food
insecurity. Those with “little cash income…[for during the] fiscal year 2010, more than
43 percent of SNAP households had gross incomes at or below 50% of the poverty
line,” (USDA Building a Healthy America, 2012, p. 18).
These programs have benefitted individuals, especially in times of economic
distress. As “the number of unemployed persons and families living in poverty grew in
the last few years, so did SNAP participation,” (USDA Building a Healthy America,
2012, p. 3). Food assistance programs work as a stabilizing measure for many
households. They have been known to lift many families and individuals out of
poverty. According to the Census Bureau, “about 3.9 million Americans—including 1.7
million children” would be lifted out of poverty through participation in food assistance
programs (USDA Building a Healthy America, 2012, p. 1). These individuals and
households that rely on food assistance programs tend to be those that fall at or below the
poverty line.
The Government Accountability Office (GAO) found that for every dollar spent
on prenatal WIC services there is in return a $3 savings in Medicaid (USDA WIC Report,
2015, p. 23). Promoting programs like these create positive change and less challenging
economic times to those who need it, as these and other food assistance programs seek to
provide the most vulnerable of our population with access to basic and necessary goods
that the private market has excluded them from.
For many Americans SNAP, WIC and other food assistance programs act as
a safety net, ensuring that millions of children and low-income adults will have access to
food. SNAP benefit levels and participation are inversely coordinated to the economic
state of the country. When the economy is doing well, fewer people require the
assistance offered by food and nutrition programs - and participation falls. When the
economy is poor, more people require the assistance offered by food and nutrition
programs - and participation rises. In this sense, SNAP especially is considered to
automatically adjust in light of the economic environment (USDA Building a Healthy
America, 2012). In chapter two, we will discuss the recent recession of 2008, and how
the economic concerns were addressed by altering SNAP benefit levels and other
eligibility requirements.
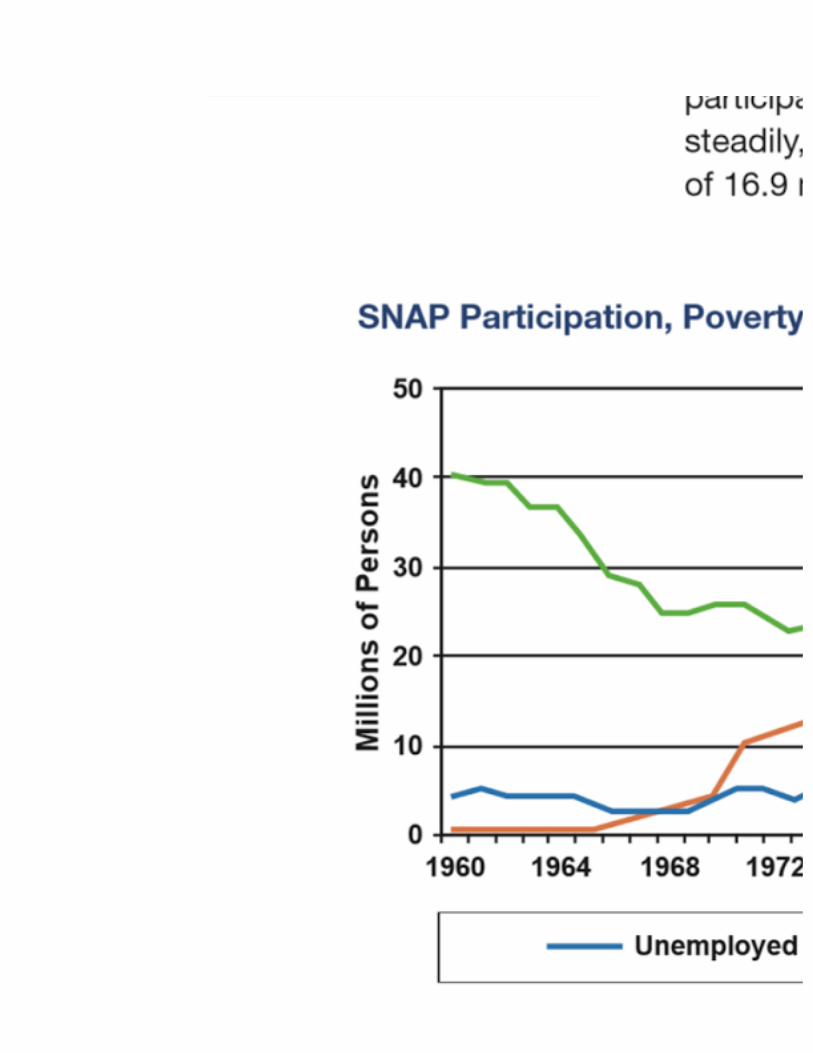
As the economic situation of the United States declines or worsens, Americans do
not have the same access to enough food for an active, healthy lifestyle, thereby food
insecurity increases (USDA Building a Healthy America, 2012). Drawing upon the
graph below, we are able to see a direct correlation between the years prior and during
the Great Recession and the participation rate of SNAP (USDA, Building a Healthy
America, 2012). There is a direct correlation between the years prior to and during the
Great Recession and participation of SNAP, as it is “one of the Nation’s primary
countercyclical programs, expanding during economic downturns and contracting during
period of economic growth,” (Hanson & Oliveira, 2012, np) With the recent recession,
many families have had lower incomes than they are used to causing a strain on their
personal budgets. While some families have been able to recover as the economic
situation improves, there are still many individuals and families that remain at or below
the poverty line even with government assistance. (Oliveira, 2014)
Program Design and Use
SNAP benefits are distributed via electronic benefit cards, through the electronic
benefit transfer systems, (EBT) (FRAC, SNAP/Food Stamps, 2010). Using the EBT
system, the beneficiary “[authorizes the] transfer of their government benefits from a
federal account to a retailer account to pay for products received,” (USDA EBT, 2015,
np) as opposed to using food stamps (FRAC, SNAP/Food Stamps, 2010, np). As of 2004,
all states utilize the EBT system as the sole SNAP benefit delivery system (USDA EBT,
2015, np). WIC resources on the other hand are often distributed via checks or vouchers
to purchase pre-approved foods (USDA, WIC Nutrition Program Facts, 2014). Some
states use EBT cards to distribute these resources, rather than the checks or vouchers
(USDA, WIC Nutrition Program Facts, 2014). Even fewer states distribute the food
through warehouses, or directly deliver the food to homes (USDA, WIC Nutrition
Program Facts, 2014). By 2020, all states will be expected to deliver WIC resources
through EBT cards (USDA, WIC Nutrition Program Facts, 2014).
Using electronic benefit transfers helps to streamline access and delivery of goods
(USDA, EBT, 2015). Using electronic benefit transfers for SNAP and WIC delivery
allows benefit recipients more freedom and flexibility to purchase desired goods by
replacing the paper check or voucher with a card (USDA, EBT, 2015). Some think paper
food stamps and vouchers impose stigmas upon participants of the programs (Goodridge
& DeParle, 2012). This consideration for stigmas was a contributing factor for the shift of
SNAP benefits to be delivered with EBT cards rather than traditional Food Stamps
(USDA, EBT, 2015).
Program Objectives
Nutrition and food assistance programs are nearly 70 percent of the USDA’s
budget (USDA, FY 2016 Budget, 2015) . As understood by program agendas, the
programs initially began in order to ensure that fiscally challenged individuals are
receiving the recommended amount of nutritional value in order to maintain a healthy
lifestyle. Food insecurity perpetuates malnutrition. Since food assistance programs have
been in existence, major restructuring around the goals and objectives have occurred. As
a result, food insecurity has been joined by a plethora of other issues that surround this
major and complex problem. Being cognizant of those affected and the typical climate
that food insecurity thrives in highlights how SNAP and WIC have had to restructure
themselves in order to alleviate the issues and consequences of food insecurity. The
economic, social, and cultural issues that arise from food insecurity are extensive.
From an economic standpoint, we understand that SNAP participation is directly
affected by the unemployment rate of the United States. Programmatic restructuring has
occurred in order to include improved measures such as “enhanced employment and
training activities,” (USDA, Agricultural Act of 2014 Highlights, 2014, np). To help
ensure that those using such programs are able to have a smoother transition in looking
for, acquiring, and maintaining their employment. The Agricultural Act of 2014 has
stipulated that several states can be “selected by the USDA to launch SNAP Employment
& Training Program pilot projects,” (USDA, Agricultural Act of 2014 Highlights, 2014,
np). The Employment & Training Program was designed to increase the employment
rates and thereby income for SNAP participants (USDA, Agricultural Act of 2014
Highlights, 2014). The pilot projects were allocated $200 million in the 2014 Farm
Bill and “are expected to establish and evaluate a range of training and employment
strategies in various geographic areas,” (USDA, Agricultural Act of 2014 Highlights,
2014, np). Promoting such independence allows for program participation to decrease,
and allows for our nation’s citizens to become more self-sufficient.
Allowing for individuals to have access to more nutritionally rich foods, gives
SNAP participants the access to better nutritional health, while also promoting
independence. One problem for many participants is finding nutritionally rich food for
the right price and quality. Research has shown that participants in SNAP have gone out
of their way to find a store where the prices are low enough to purchase quality fruits and
vegetables (Lin, Ver Ploeg, & Yen, 2014). The nutritional needs of these families are
being met without them spending most of their income, which can help them overcome
poverty easier. With more of the beneficiaries income going to expenses other than food,
families are able to save money, lessening the pressure of economic forces. All these
responsibilities help promote self-reliance among individuals, which can help them lead a
healthier lifestyle in the future. This push towards increased nutritional education and
healthy purchases has the potential to equal a healthier society that will benefit the entire
political economy.
It’s also important to delve into the less obvious costs, direct and indirect, of food
insecurity, and the negative effects these costs have on society -- hungry or otherwise.
Food insecurity is related to a myriad of harmful health, social, growth and development
outcomes in both children and adults. Looking to former, children stand to suffer in
educational attainment, which will set the pace for their future career prospects. Looking
to the latter, adults, most of which already fall under the poverty line, will be unable to
perform well in their jobs, support their families, and by extension, will be unable to
provide their families with nutrient dense meals which only intensifies the adverse effects
of household food insecurity.
The obvious immediate costs are those incurred by the implementation of food
assistance programs or the medical related expenditures that arise thanks to an influx of
obesity, chronic illnesses, and medication resulting from the very proliferation of food
insecurity. The indirect costs of food insecurity, many of which are cultural in scope
ultimately stand to reduce America’s human capital capacity and many American’s sense
of agency as well. Food insecurity has been associated with low birth weight deliveries
(Borders, Grobman, Amsden et. al, 2010). Low birth weight is associated with poor long-
term outcomes in areas including height, IQ, educational attainment, and employment
prospects (Black et. al. 2005; Cutler & Liernas-Muney,2006). Low birth weight also
indirectly negatively impacts employment opportunities for parents: Mothers of preterm
or low birth weight babies took a longer maternity leave, reduced their hours at work, or
left the workforce altogether to care for their child (Petrou, Sach, & Davidson, 2001).
Another negative externality than can arise from food insecurity is an influx of both
children and adults suffering from obesity. While the direct costs of obesity on the
healthcare system are obvious, more internal and indirect costs can also arise. Young
children who are overweight or obese typically become overweight adolescents, and body
image is often a major focus at this time of life, leading to poor self-esteem, emotional
health problems, an overall increase of stress, and issues with social adjustment
(Lobstein, Baur, & Uay, 2004). Once more, obese employees and those suffering from
general long term chronic diseases, stand to lose potential earnings (Cawley, 2004).
Evidently, obesity is an offshoot of food insecurity, which has the potential to usher in
long-term economic insecurity of those affected.
Of course, not all the costs associated with food security whether direct or
indirect, are negative. Our team will attempt to show that the costs incurred from
implementing programs like SNAP or WIC are dwarfed by the indirect costs that are not
immediately seen. Indeed, the ultimate indirect cost incurred by society from food
insecurity is the loss or reduction of human capital in the overall workforce. Food
insecurity has emerged into America’s policy agenda and if not adequately dealt with, has
the capacity to stunt the potential of America’s poor families and those not poor as well.
Chapter 2: Policy Background and Environment
SNAP was formerly known as the Food Stamp Program (Goodridge & DeParle,
2012). This program provided then as it provides now, for individuals with low or no
income to have the opportunity and access to purchasing power to buy food.
Administered by the USDA, benefits are distributed by each state through the each state’s
own Division of Social Services or Children and Family Services (USDA, Building a
Healthy America, 2012). Since the creation of the Food Stamp Program, there have been
several policy and legislative changes that have occurred, shaping our current food and
nutrition policy programs.
Policy Origination
The Food Stamp Program originated in 1939, as a way to address growing food
surpluses with a cornerstone mission for providing for the impoverished and needy as a
result from the economic downturn of the Great Depression (Caswell and Yaktine, 2013).

During this time, there was not a federal institution established to provide such benefits to
the poor. Instead, the burden of food relief was provided to the poor by local charities
and churches. Farmers during this time were pleading to Congress for assistance in
regulating agricultural prices, however; Presidents Calvin Coolidge and Herbert Hoover
vetoed such bills relating to agricultural reform, believing that assistance to farmers may
weaken the work ethic spirit of farmers that are underemployed. Farmers continued to
push through reform and even though there were several attempts to block agricultural
change, the Farm Board was created in 1930 (Poppendieck, 1986).
Due to agricultural surpluses, unemployment rose and there was a widespread
reduction in consumer buying power (USDA, Legislative Timeline, 2014). The Farm
Board, then became responsible for assuming farmer surpluses and purchasing crops
from farmers that they could not sell. However, crops that were being assumed by the
Farm Board began to increase, as did the rate of hunger and malnutrition. When Franklin
Roosevelt assumed office in 1933, he radically changed the role of government in this
area of social welfare (Goodridge & DeParle, 2012). Understanding that the hunger
problem was caused due to private market failure, Roosevelt made it a priority of his
administration to alleviate the farmer surplus and hunger problem, as he authorized
legislation that would help both farmers and those who were hungry. The Federal
Surplus Relief Corporation was created to “expand markets for agricultural products, and
to purchase, store and process surplus agricultural products so as to relieve the hardship
and suffering by unemployment,” (Poppendieck, 1986, p. 130). The goal was to solve the
plights facing the unemployed and the farmers - using the surplus foods to feed the needy
and food insecure.
The establishment of the FSRC was radical as this was the first time that
government subsidized purchases were used to feed the hungry. While the FSRC worked
for a period of time, in 1939 an official modern federal food assistance program was
created (Poppendieck, 1986). Consisting of paper stamps or vouchers, people could buy
orange stamps or blue stamps. For every $1 spent on an orange stamp, the beneficiary
received 50 cents worth of blue stamps (USDA, Short History, 2014). With an orange
stamp, one could buy any food (USDA, Short History, 2014). With a blue stamp, one
could buy only food determined by the Department of Agriculture as a surplus, thereby
attempting to help the needy and problems surrounding the food surplus (USDA, Short
History, 2014).
The original Food Stamp Program was intended to and designed as temporary
means to alleviate agricultural concerns, as the program ended in 1943. The conclusion
of the program was due to the economic boom induced by World War II (USDA, Short
History, 2014; Snap to Health, 2011). By March 1943 there was scarcity of surplus
commodities, which also contributed to the termination of the program (USDA,
Legislative Timeline, 2014).
Subsequent to the termination of the 1939 Food Stamp program, there was a
period of eighteen years that were “filled with legislative proposals, studies, and reports,”
that sought to evaluate the success of Food Stamp Program (USDA, Legislative Timeline,
2014, np). In September 1959, Public Law 86-341 was passed; which authorized another
temporary Food Stamp Program to “promote the purchase of surplus commodities
(USDA, Legislative Timeline, 2014, np). However, this 1959 law was never
implemented as President Eisenhower’s administration decided against it (USDA,
Legislative Timeline, 2014).
Food Stamp Program 1961-1964
The Food Stamp Program was finally revived, or a version of it was, in 1961
under President Kennedy (Goodridge & DeParle, 2012). In January 1961, President
Kennedy issued Executive Order 10914, which was known as the 1961 Food Stamps
Pilot Program (Federal Register, 1961). Aimed at improving nutrition levels of the low-
to no income individuals of the United States, the act was initiated “to promote the
general welfare that the nation’s abundance of food should be utilized cooperatively by
the State, the Federal Government, and local government units to the maximum extent
practicable to safeguard the health and raise the levels of nutrition among low-income
households,” (USDA, The Food Stamp Act of 1964, 1964).
Under this pilot program, participants purchased “coupons of a higher value than
their cash contribution and used the coupons to purchase food at retail stores,” (USDA,
Legislative Timeline, 2014, p. 2). This pilot program retained the use of paper food
stamps like the original program, however the concept of special stamps for surplus foods
was removed (USDA, Short History, 2014). Instead of having an emphasis on surplus
foods, emphasis was placed on perishable food items (USDA, Short History, 2014). In
January of 1963, President Kennedy asked for legislation to make the Food Stamp
Program permanent (USDA, Legislative Timeline, 2014).
Subsequent to the assassination of President Kennedy, President Lyndon B.
Johnson took up the issue of food insecurity for low-income Americans. In January
1964, one year after President Kennedy asked for the Food Stamp Program to become
permanent, President Johnson renewed the request for a permanent Food Stamp Program
(USDA, Legislative Timeline, 2014). President Johnson has been known and recognized
for declaring “War on Poverty” in his 1964 State of the Union (Rector & Sheffield,
2014). As the United States entered a time of economic prosperity, with the Vietnam
War ending and industrialization booming, there was more opportunity for social and
economic prosperity. Johnson aimed at redistributive policies for poor and disadvantaged
for his “The Great Society” legislation and policies.
The Food Stamp Act of 1964
Under President Johnson, the Food Stamp Act of 1964 was passed (Urban
Institute, 2014). Aimed at improving the nutrition levels of the nation’s poor, as each
state shared the responsibility of administering benefits through state agencies and the
Food and Nutrition Service an agency with the USDA. Using federal funds,
authorization from food stamps comes from Congress, as agricultural committees
determine national standards and responsibilities for the USDA. The difference between
the face value of the stamps and the price paid by each recipient is the food stamp
“bonus”, which is paid through federal funds. Furthermore, the Food Stamp program
administers its program on a county level, ensuring that all who are in are able to receive
benefits. When determining who is eligible for such benefits, policy analysts use stamp
allotments, purchasing prices and certain incomes to determine who is eligible for
assistance.
Under the 1964 legislation, participants purchased food stamps, paying an amount
consistent with their normal food expenditures and receiving enough food stamps for a
“low-cost nutritionally adequate diet,” (Urban Institute, 2014, np). The purpose behind
this push was to turn what was formerly utilized as a temporary program into a
permanent social program (USDA, Short History, 2014). Official purposes also cited for
this move was to “strengthen the agricultural economy” and to provide “improved levels
of nutrition among low-income households,” (USDA, Short History, 2014,
np). However, the reasons given are scrutinized as masking the true motives – and that
was to bring the program under congressional control (USDA, Short History, 2014).
Specific items within the 1964 legislation included a provision that through State
agencies, “eligible households within the State shall be provided with an opportunity to
more nearly obtain a nutritionally adequate diet through the issuance to them of a coupon
allotment which shall have a greater monetary values than their normal expenditures for
food,” (USDA, Legislative Timeline, 2014, p. 2). The coupons received could only be
used at retail stores that were pre-approved to collect Food Stamp Program funds (USDA,
Legislative Timeline, 2014). It was the responsibility of State agencies to monitor the
use,maintain records, against fraud, and create feedback for the program (USDA,
Legislative Timeline, 2014). Also in regards to fraud, States were “liable to the Federal
Government for the cost of gross negligence or fraud in the certification of applicant
households,” (USDA, Legislative Timeline, 2014, p. 3). While the goals of the program,
first the “utilization of the nation’s food; and second the promotion of the nutritional
well-being of low income persons,” seem to go hand-in-hand, the Food Stamp Program
did not work well as it was characterized, and was criticized as being a program that has
“low participation, high administrative costs and undesirable incentive effects,”
(MacDonald, 1977, 647). The Food Stamp Program relied on state agencies to establish
program stipulations and distribute benefits to the needy.
Several participants were unaware of their eligibility requirements, as some state
agencies “decide[d] not to offer the program” based on conservative Congressmen, after
a Senate committee concluded that “nationally only 21.6 percent of the poor living in
counties with food stamp programs participate in the program,” (MacDonald, 1977 p.
648). Secondly, high administrative costs hindered programmatic success; the federal
government was responsible for “100 percent of food stamp benefits,” while the cost of
administering the program was divided between the states and the federal
government. States and counties paid for about 70% of administrative costs as a
result. Through determining eligibility standards, states were able to determine
beneficiaries “purchase requirement,” thus beneficiaries were able to purchase a certain
amount of stamps to buy food. When low-income beneficiaries spent money on food
using their own income, “an amount equivalent to their normal food purchases as
(indicated by consumption surveys) and the Food Stamp program would supplement that
by giving a monthly allotment which was larger by the extent to which normal
expenditures fell below the dollar amount determined to be adequate for a minimally
nutritious diet,” (Richardson, 1979, p. 1). Purchase requirements were fixed and did not
change over time, even if the beneficiary household benefits may have changed. As
participation grew and programs increased, major reform had to be done to the Food
Stamp Program to allow for it to be more economically viable as well as more efficient
and effective at solving the food insecurity crisis
The Child Nutrition Act of 1966 was signed in October 1966 (USDA, Legislative
Timeline, 2014). This was the first piece of legislation aimed at the issue of food
insecurity as it impacts children. The Child Nutrition Act of 1966 “excluded the value of
assistance to children under this act from income and resources for food stamp purposes
(USDA, Legislative Timeline, 2014, p. 4). Written into this legislation is the
“recognition” of the “relationship between food and good nutrition and the capacity of
children to develop and learn,” (Gunderson, 2014, np). Through “grants-in-aid and other
means” the Secretary of Agriculture was to encourage the “domestic consumption of
agricultural and other foods” in children (Gunderson, 2014, np). On May 27, 1969, the
Food and Nutrition Service “formed to coordinate child and adult food programs,”
(USDA, Legislative Timeline, 2014, p. 4).
Amendments were made to the 1964 legislation in 1971 (Urban, 2014; USDA,
Legislative Timeline, 2014). One of the changes involved setting uniform eligibility and
work requirements, including distributive allotments and purchase requirements (Urban
Institute, 2014). The amendments also added legally adopted children and legally
assigned foster children, and non-related individuals over age 60 as members of a
household (USDA, Legislative Timeline, 2014, p. 5). Also amended were the procedures
of food distribution in the wake of natural disasters and other emergencies (USDA,
Legislative Timeline, 2014).
The 1971 amendments also bring into the picture for the first time to idea of able-
bodied adults aged 18 to 65 without children. Under the 1971 amendments, those that are
able-bodied adults that fail to register for employment at a state or federal employment
office, have refused to accept employment for no less than minimum wage is not eligible
for food stamp benefits (USDA, Legislative Timeline, 2014). Furthermore eligibility
requirements were changed during this time. Eligibility was dependent on three different
tests, income, assets and work registration. In trying to effectively manage food
insecurity, it is important to understand this within the context that an “eligible
household’s anticipated ‘net’ monthly income fall under certain guidelines.” When
testing for income assets, federal guidelines set the households at $1500 except those
with elderly member for which there was more leeway, assets were based on the “liquid”
or flowing cash readily available to beneficiaries. As before, all rulemaking power was
under the USDA. The federal government paid its own administrative costs and half of
the costs incurred by state and local agencies. Then state and local agencies were left to
pay for the rest of their expenses. More responsibilities were given to states and localities
as they were set to have a more direct impact on programmatic activity (Richardson,
1979 ). As the Food Stamp program began to run more effectively, there was continued
growth in participation.
Broadening the Scope to Women, Infants, and Children
Food policy became more of a public concern, gaining more focus and
attention as there was an attitudinal shift in providing nutritious food to low-income
Americans. At the 1969 White House Conference on Food, Nutrition, and Health,
recommendations “stated in the conference report was that special attention be given to
the nutritional needs of low-income pregnant women and preschool children,” (White
House Conference on Food, Nutrition, and Health, 1970, p. 38). It was determined that
the Food Stamp Program was not able to meet the needs of women and infants. The
program did prove to be effective in that it increased beneficiary’s cash income, as in-
kind transfers that were provided to the needy focused on increasing spending power, as
opposed to increasing both spending power and nutrition awareness. Lawmakers and
program administrators were simply giving access into the market, as opposed to giving
both access and increasing nutrition education and awareness.
Under the Food Stamp Program, doctors found that pregnant women and infants
were at a nutritional disadvantage, for education regarding food purchases was
lacking. Medical research was conducted and concluded that birth weight is most
closely related to gestational length and “nutritional changes affecting the third trimester
of pregnancy,” (White House Conference on Food, Nutrition, Health, 1977 p. 39).
Therefore, new policy and programs focusing on maternal and pediatric health was
essential; policymakers needed to posit programs that would focus on the such
issues.
Thus 1972, WIC was “piloted as a supplemental program aimed at improving the
health of pregnant mothers, infants, and children,” (National WIC Association, nd,
np). This program was designed in response to “growing concern[s] over malnutrition”
in low-income mothers and young children (National WIC Association, nd, np). The first
WIC site opened in Kentucky in January of 1974, and by the end of the year, the program
was operating in 45 states (National WIC Association, nd, np). Created under the Child
Nutrition Act of 1966, the program focused on extending benefits to mothers, infant, and
children up the age of four with nutritional assistance. Based on four eligibility
requirements, of being nutritionally at risk and inadequate income. With the passage of
Public Law 94-105, WIC was established as a permanent program (National WIC
Association, nd, np). Those who were eligible for WIC must have ‘incomes less than 185
percent of the federal poverty line,” (USDA, WIC, 2014).
Food Stamps Program Changes of the 1970’s
The Agriculture and Consumer Protection Act of 1973 was signed into effect on
August 10, 1973 (USDA, Legislative Timeline, 2014). This act did a number of things;
including an amended definition of household to include any “narcotics addict or
alcoholic” in treatment or rehabilitation programs, specifically addressing eligibility of
seniors also receiving Social Security benefits, and amended the definition of “food” to
be “any food or food product for home consumption except alcoholic beverages and
tobacco and shall include seeds and plants for use in gardens to produce food for the
personal consumption of the household,” (USDA, Legislative Timeline, 2014).
In 1974, the Food Stamps Program was implemented nationwide, raising
participation across the nation (Goodridge and DeParle, 2012). Also in 1974, the
Disaster Relief Act Amendments were passed (USDA, Legislative Timeline,
2014). Under this legislation, the President could determine and direct distributions of
food to low-income households after major disasters (USDA, Legislative Timeline, 2014;
Urban Institute, 2014).
On September 29, 1977 the Food and Agriculture Act of 1977 was signed into
law (USDA, Legislative Timeline, 2014). Under the 1977 legislation, the purchase
requirement for Food Stamp benefits was removed (Urban Institute, 2014). This act
“stressed targeting benefits to the neediest,” and did so by “simplifying” administration,
and “tightening controls on the program,” (USDA, Legislative Timeline, 2014, p.
10). By working to become more efficient, there could be increased access to benefits as
the “cumbersome process” had delayed benefit (USDA, Legislative Timeline, 2014). The
two major sponsors of this legislation, Senators Bob Dole and George McGovern are
credited with the successful shifts in policy – namely removing the purchasing
requirement, but also the expanded participation (Partners for a Hunger-Free Oregon,
2015). The removal of the purchasing requirement, was “believed to discourage
participation by adding to the application burden which is the cost in terms of time and
effort needed by the applicant to take part in the program,” (Brown, 1988, p. 14). In
1978, amendments to the WIC program were passed (National WIC Association, nd,
np). Included in the amendments were provisions incorporate nutrition education, and
that foods should contain certain nutrition-related elements, and that states needed to
“coordinate referrals to social services including immunization, alcohol and drug abuse
prevention, child abuse counseling, and family planning,” (National WIC Association,
nd, np).
In the late 1970’s partisan politics began to play a role in the food assistance
debate. Ronald Reagan in particular used the example to Americans of a “strapping
young buck” using food stamps to buy a “t-bone steak,” (Goodridge and DeParle, 2012,
np). This illustration, and others like it, spurred many critics of the Food Stamp program
in the conservative party. These attacks still reverberate in public opinion.
The House Agriculture Committee during the 1970’s was comprised heavily of
“conservative southern Democrats and “their Republican counterparts,” (Rosenfeld,
2010, p. 474). According to one member of the committee, their notion was “viewing
food as a spur for people to work,” (Rosenfeld, 2010, p. 474). Due to social structure of
Congress, the member that held the most influence were the “autonomous committee
chairmen” resulting from “seniority rules and the Democrats’ long tenure in the
majority,” (Rosenfeld, 2010, p. 475). The members of Congress “with formal control
over the policy regarded it with hostility while concerning themselves with the
constituency politics of agricultural producers,” (Rosenfeld, 2010, p. 475). Essentially,
southern Democrats imposed “bottlenecks” on legislation that was supported by more
liberal members of Congress (Rosenfeld, 2010, p. 475).
More amendments to the Food Stamp Act were passed in 1980 (USDA,
Legislative Timeline, 2014). One amendment was to allow women and children that
were temporarily living in shelters to be eligible for food stamps (USDA, Legislative
Timeline, 2014). Other amendments included: using the Consumer Price Index to be
used in all Food Stamp Program calculations, medical costs deductions, and a semi-
annual adjustment of the TFP (USDA, Legislative Timeline, 2014).
Despite waning conservative support, in 1988 the Hunger Prevention Act was
passed, and in 1989 the Hunger Relief Act was passed (Urban Institute, 2014). Between
these two pieces of legislation, the Food Stamp Program grew even more in response to
food insecurity problems, “increased benefits and allowed for periodic adjustment of
minimum benefit, excluded advance earned income tax credit from income tests, set up
nutrition education grants,” and established EBT cards (Urban Institute, 2014, np). The
EBT system is set up via use of benefit cards, like credit cards, that allows a recipient “to
authorize transfer of their government benefits from a Federal account to a retailer
account to pay for products received,” (USDA, Electronic Benefits Transfer, np).
President Bill Clinton campaigned on “ending welfare as we know it” and early in
his presidency, signed a restrictive law regarding the Food Stamps Program (Goodridge
& DeParle, 2012). In 1996 the Personal Responsibility and Work Opportunity
Reconciliation Act was passed (Urban Institute, 2014). Under this legislation, the options
available to the states increased and the use of EBT cards expanded (Urban Institute,
2014). The 1996 legislation also introduced more controversial provisions – including
“setting new work rules and time limits for Able-Bodied Adults Without Dependents
(ABAWD), barring eligibility for most legally resident non-citizens, and reducing
benefits,” (Urban Institute, 2014, np). Also at this time, Congressional Republicans
formally define food stamps as “welfare,” (Goodridge & DeParle, 2012).
This piece of legislation has been heavily criticized because many lost their
benefits (Partners for a Hunger-Free Oregon, 2015). The “major, unintended, adverse
effects on the Food Stamp Program,” (FRAC, Historic Trends, 2010, np). In fact, most
legal immigrants lost their benefits by August 1997 (FRAC, Historic Trends, 2010,
np). By March 1997, many childless, jobless adults lost their benefits (FRAC, Historic
Trends, 2010).
The Modern Food Stamps Program, SNAP
Following the more restrictive 1996 act, the next major pieces of legislation
pertaining to the Food Stamps Program are the Balanced Budget Act of 1997 and the
Agricultural Research, Extension, and Education Act of 1998 (Urban Institute,
2014). Under these acts, eligibility was restored to some residents, lawful immigrants
present in 1996 and exempted some people that were classified as Able-Bodied Adults
Without Dependents (Urban Institute, 2014).
In 1997, the USDA implemented a new campaign for the WIC program – the
Loving Support Makes Breastfeeding Work Campaign (National WIC Association,
nd). This campaign was designed to increase breastfeeding rates and improve public
support of breastfeeding practices (National WIC Association, nd).
In 2002, the Farm Security and Rural Investment Act was passed (Urban Institute,
2014). This act restored eligibility to qualified non-citizens that are disabled and under
the age of 18 extended options for state discretion, regarding eligibility, deductions,
reporting, and addressed quality control (Urban Institute, 2014). This bill sought to
return benefits to the large number of legal immigrants that had lost their benefits in the
1996 Farm Bill legislation (FRAC, Historical Trends, 2010).
In 2008, the Food, Conservation, and Energy Act was passed (Urban Institute,
2014). This act changed the program’s name from the Food Stamp Program to the
moniker it is known as today - the Supplemental Nutrition Assistance Program (SNAP)
(Urban Institute, 2014).
In 2009, the American Recovery and Reinvestment Act (ARRA), also known as
the economic recovery act, was passed (Urban Institute, 2014). This piece of legislation
temporarily allowed states to suspend time limits for benefits placed on ABAWDs and
increased benefit levels for all beneficiaries (Urban Institute, 2014).
In 2009, the USDA introduced new policies for the WIC program (National WIC
Association, nd). Based on medical recommendations, new food packages with
nutritious foods recommended for children and infants (National WIC Association,
nd). Also, mothers that breastfeed were eligible to receive more WIC benefits (National
WIC Association, nd).
National School Lunch Program (NSLP)
The National School Lunch Program (NSLP) is considered to be the second
largest food and nutrition assistance program (Ralston, Newman, Clauson, Guthrie &
Buzby, 2008). Operating in a majority of public and nonprofit private schools, the

program has been successful in providing free to low-cost meals to children who meet its
eligibility requirements. Operating under the National School Lunch Act (NSLA) of
1946, NSLP has had high participations rates. Using federal guidelines for nutrition, there
are tighter and stricter restriction on the types of food that schools are receiving and
serving. The goal, similar to other nutrition assistance programs, is to promote a healthy
lifestyle along with healthy eating habits. For a majority of children the NSLP is the only
means that they may have to receive a nutritious meal. Overtime even more extensions to
the program have been added like breakfast programs as well as summer programs for
when schools are not in session.
Throughout the past 76 years, food and nutrition policy and programs have
developed to solve the changing attitudes surrounding food insecurity and hunger. We
understand that policy is a purposive pathway, as it responds to changing social,
economic and political dynamics. As a result, food and nutrition policy has followed a
pathway, with policy consequences and attitudes changing the way that government
actors, policymakers and administrators have worked together to implement policies that
are aimed at solving the food security crisis. In its inception, food policy was solely
created out of an economic need, aiding farmers. However, now food policy has vastly
changed in nature, as the focus has shifted from simply providing the hungry with access
to food, to ensuring that those who are affected by food insecurity have access to
nutritionally sound foods. We now shift our focus from the policy landscape to analyzing
and evaluating the success or failure of food policy and programmatic activity in aiding
the food insecurity crisis.
Chapter 3: Research and Literature Review Findings
Policy evaluation is an important step toward measuring the overall success of a
program. With every policy initiative, there are certain goals and objectives that policy
makers and public administrators strive to accomplish in order to gauge the overall
viability of a program. Evaluation of various health and nutrition programs, especially
require concrete results spelled out in policy making that adequately target and assist
public recipients in a positive way. Statistics, for example, provide ample criteria by
which policies, for example the SNAP and the TANF, are effective or ineffective in
nature. For this chapter, it is important to analyze the results of each specific policy based
on a calculus of evaluation, which include the following criteria: effectiveness,
efficiency, and adequacy. Effectiveness involves trying to measure a valued outcome of
policy action by measuring objectives and whether measurable results move towards or
away from a goal. Efficiency involves determining the amount of effort required to
produce any given level of effectiveness by analyzing the relationship between outputs
and inputs in terms of monetary cost. Adequacy measures the extent to which any given
level of effectiveness satisfies the needs, values, and opportunities that give rise to a
public policy problem by studying the grounds of public policy based off costs and
effectiveness. Moreover to study these evaluative tools, it is important to understand
program evaluation and utilization concepts as well as political feasibility and cost-
benefit analysis as conceptual theories.
Program evaluation and utilization is broken down into three purposive uses: to
learn about the programs operations and effects, to control the behavior of those
responsible for implementation, and to influence the responses of outsiders in the
program’s political environment. Learning characteristically falls into two distinct
groups: those who generate knowledge about the programs overall effects and those who
use management practices as a support system for assessing and improving the
operational efficiency of government programs. Program managers want to know how a
program can be made to work; they use action-oriented replicators of success. They rely
on feedback to implement quick changes before large trends become solidified in action.
To do this, they use evaluative sampling of programs to learn about the details of a
program in a specific, non-academic fashion. Organizational control, more or less, is
focused at understanding the impact of problems (Meltzner, 1972). However, different
groups with an agency have different objectives and focal points. It is argued that these
discrepancies should be managed through hierarchical structure and the existence of
superiors and subordinates. Furthermore, it is important to understand and interact with
the outside political environment to limit instances of personnel abuse being confused as
reform program failure (Meltzner, 1972). Researchers and political entities have different
outlooks on program evaluation as well as which goals are to be achieved. Tensions arise
and program results can become distorted or mishandled. Maintaining objectivity and
credibility is important for evaluators to analyze and interpret program results properly in
order to gauge success or failure on a consensual basis. In sum, is imperative for agencies
to utilize these concepts of evaluation. Failure to do so results in starting evaluations too
late, improper assignment of responsibilities, and distortion or suppression of evaluation
findings.
Goals and objectives for health and nutrition programs and policies are of high
priority for the public sphere. Supplying healthy eating options and even allowing
citizens to meet basic nutritional needs are important for policies to get right. Therefore,
proper policy evaluation is essential to ensure that various government initiatives are up
to standard. Various evaluation criteria have been used to measure outcomes for the
programs food and nutrition-related programs, some vary in scope, yet they all serve to
meet the effectiveness, efficiency, and adequacy evaluative criteria.
WIC And Findings
Through the WIC program, certain foods are provided in order to help one reach
the essential daily nutritional value. Based on the category a participant might fall in, they
will be able to purchase a specific food. WIC foods include infant cereal, iron-fortified
adult cereal, vitamin C-rich fruit or vegetable juice, eggs, milk, cheese, peanut butter,
dried and canned beans/peas, and canned fish (USDA, WIC, 2014). Soy-based beverages,
tofu, fruits and vegetables, baby foods, whole wheat bread, and other whole-grain options
were recently added to better meet the nutritional needs of WIC participants (Frazao &
Oliveira, 2015, p.14). WIC seeks to educate and advocate the idea that new mothers
breastfeed rather than use formula. For those women who decide not to breastfeed, they
receive iron-enhanced formula. In high health risk situation, doctors can enforce one to
join WIC to get these necessities. In most WIC state agencies, WIC participants receive
cash value vouchers while some states issue an electronic benefit transfer card (EBT) to
participants instead of paper checks or vouchers (Frazao & Oliveira, 2015).
If WIC cannot serve all the eligible persons that are in need of the benefits, a
priority system has been set in place in order to accommodate those who are in more need
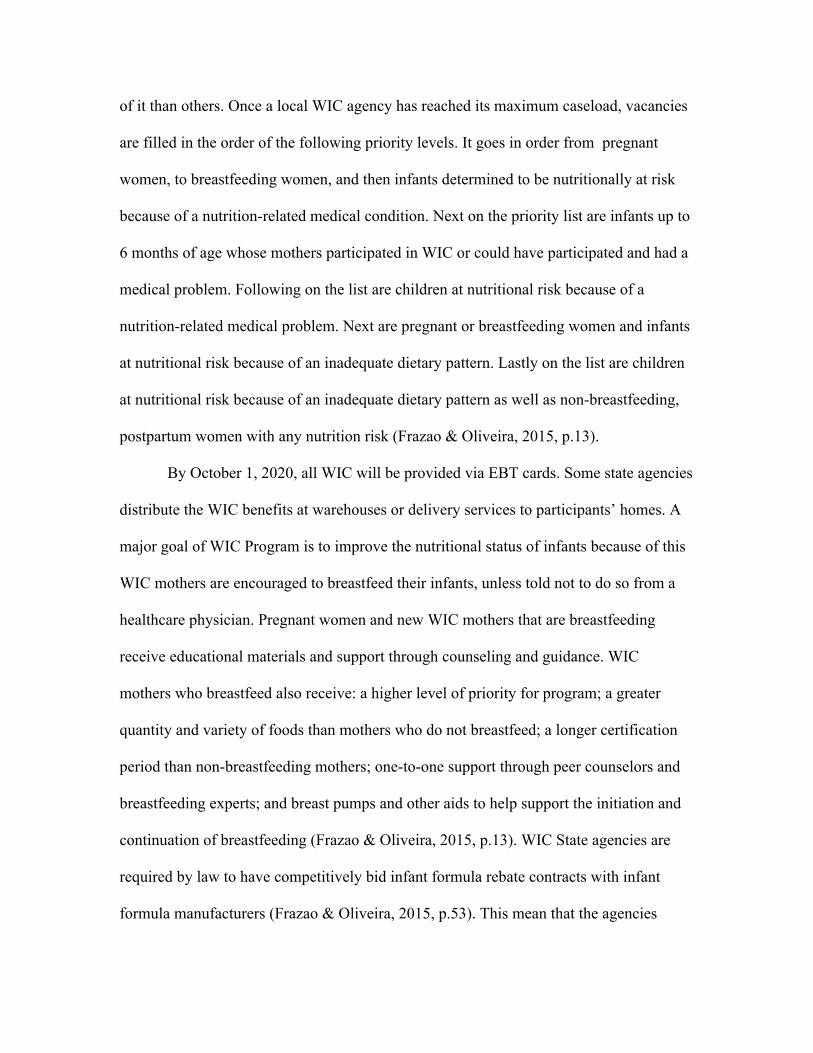
of it than others. Once a local WIC agency has reached its maximum caseload, vacancies
are filled in the order of the following priority levels. It goes in order from pregnant
women, to breastfeeding women, and then infants determined to be nutritionally at risk
because of a nutrition-related medical condition. Next on the priority list are infants up to
6 months of age whose mothers participated in WIC or could have participated and had a
medical problem. Following on the list are children at nutritional risk because of a
nutrition-related medical problem. Next are pregnant or breastfeeding women and infants
at nutritional risk because of an inadequate dietary pattern. Lastly on the list are children
at nutritional risk because of an inadequate dietary pattern as well as non-breastfeeding,
postpartum women with any nutrition risk (Frazao & Oliveira, 2015, p.13).
By October 1, 2020, all WIC will be provided via EBT cards. Some state agencies
distribute the WIC benefits at warehouses or delivery services to participants’ homes. A
major goal of WIC Program is to improve the nutritional status of infants because of this
WIC mothers are encouraged to breastfeed their infants, unless told not to do so from a
healthcare physician. Pregnant women and new WIC mothers that are breastfeeding
receive educational materials and support through counseling and guidance. WIC
mothers who breastfeed also receive: a higher level of priority for program; a greater
quantity and variety of foods than mothers who do not breastfeed; a longer certification
period than non-breastfeeding mothers; one-to-one support through peer counselors and
breastfeeding experts; and breast pumps and other aids to help support the initiation and
continuation of breastfeeding (Frazao & Oliveira, 2015, p.13). WIC State agencies are
required by law to have competitively bid infant formula rebate contracts with infant
formula manufacturers (Frazao & Oliveira, 2015, p.53). This mean that the agencies
contract out with only one company but with every bottle sold the agency will receive a
rebate. The brand that each state uses varies state by state. Negotiating rebates with
formula manufacturers, helps states to serve more people; for FY 2013, rebate savings
were $1.88 billion, supporting an average of 1.97 million participants each month, or
about 23 percent of the estimated average monthly caseload (Frazao & Oliveira, 2015,
p.54).
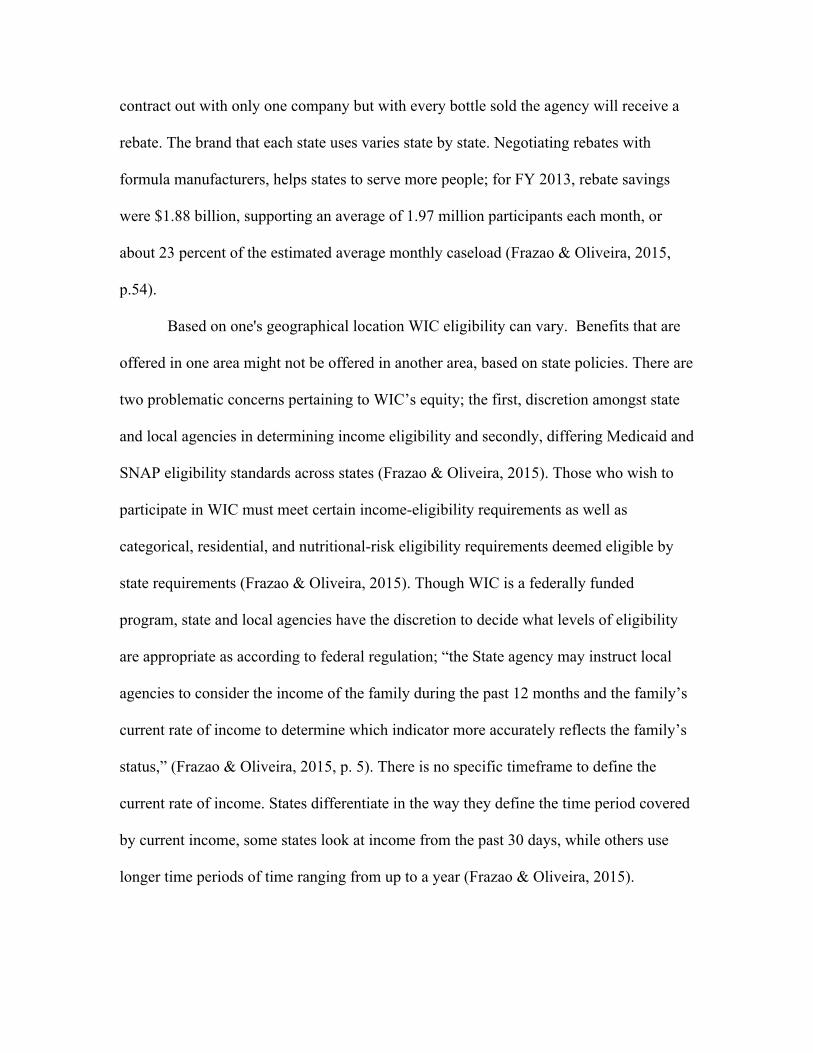
Based on one's geographical location WIC eligibility can vary. Benefits that are
offered in one area might not be offered in another area, based on state policies. There are
two problematic concerns pertaining to WIC’s equity; the first, discretion amongst state
and local agencies in determining income eligibility and secondly, differing Medicaid and
SNAP eligibility standards across states (Frazao & Oliveira, 2015). Those who wish to
participate in WIC must meet certain income-eligibility requirements as well as
categorical, residential, and nutritional-risk eligibility requirements deemed eligible by
state requirements (Frazao & Oliveira, 2015). Though WIC is a federally funded
program, state and local agencies have the discretion to decide what levels of eligibility
are appropriate as according to federal regulation; “the State agency may instruct local
agencies to consider the income of the family during the past 12 months and the family’s
current rate of income to determine which indicator more accurately reflects the family’s
status,” (Frazao & Oliveira, 2015, p. 5). There is no specific timeframe to define the
current rate of income. States differentiate in the way they define the time period covered
by current income, some states look at income from the past 30 days, while others use
longer time periods of time ranging from up to a year (Frazao & Oliveira, 2015).
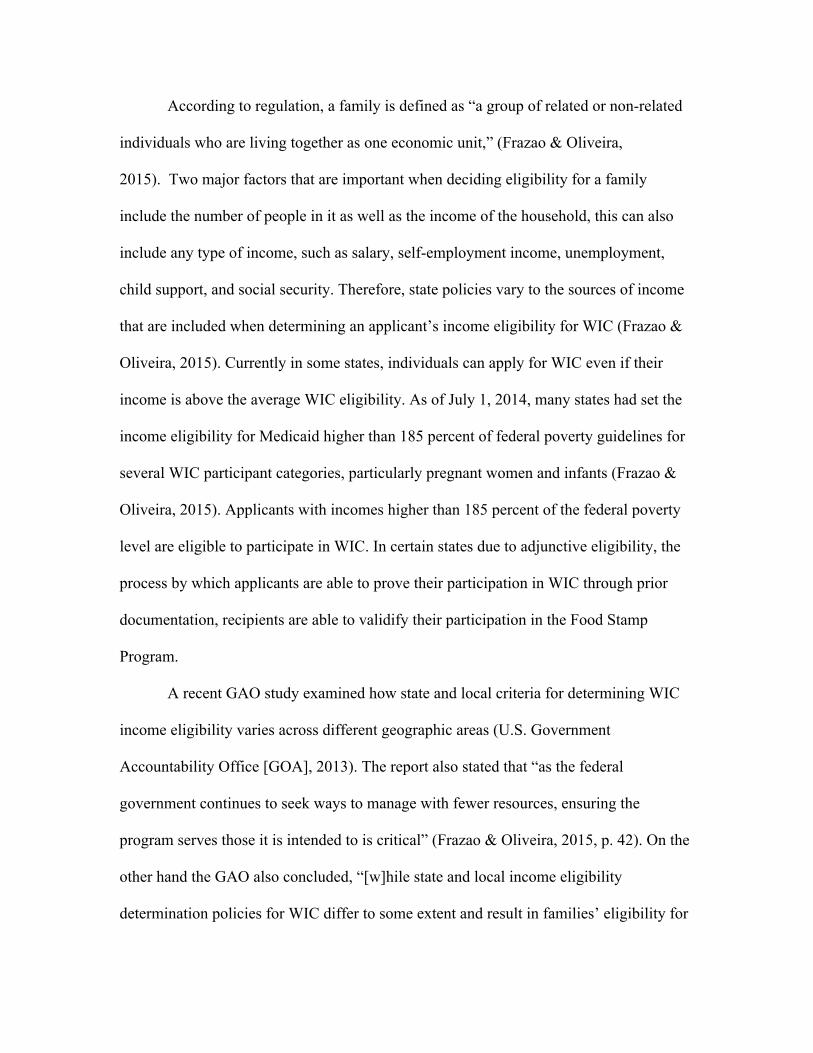
According to regulation, a family is defined as “a group of related or non-related
individuals who are living together as one economic unit,” (Frazao & Oliveira,
2015). Two major factors that are important when deciding eligibility for a family
include the number of people in it as well as the income of the household, this can also
include any type of income, such as salary, self-employment income, unemployment,
child support, and social security. Therefore, state policies vary to the sources of income
that are included when determining an applicant’s income eligibility for WIC (Frazao &
Oliveira, 2015). Currently in some states, individuals can apply for WIC even if their
income is above the average WIC eligibility. As of July 1, 2014, many states had set the
income eligibility for Medicaid higher than 185 percent of federal poverty guidelines for
several WIC participant categories, particularly pregnant women and infants (Frazao &
Oliveira, 2015). Applicants with incomes higher than 185 percent of the federal poverty
level are eligible to participate in WIC. In certain states due to adjunctive eligibility, the
process by which applicants are able to prove their participation in WIC through prior
documentation, recipients are able to validify their participation in the Food Stamp
Program.
A recent GAO study examined how state and local criteria for determining WIC
income eligibility varies across different geographic areas (U.S. Government
Accountability Office [GOA], 2013). The report also stated that “as the federal
government continues to seek ways to manage with fewer resources, ensuring the
program serves those it is intended to is critical” (Frazao & Oliveira, 2015, p. 42). On the
other hand the GAO also concluded, “[w]hile state and local income eligibility
determination policies for WIC differ to some extent and result in families’ eligibility for
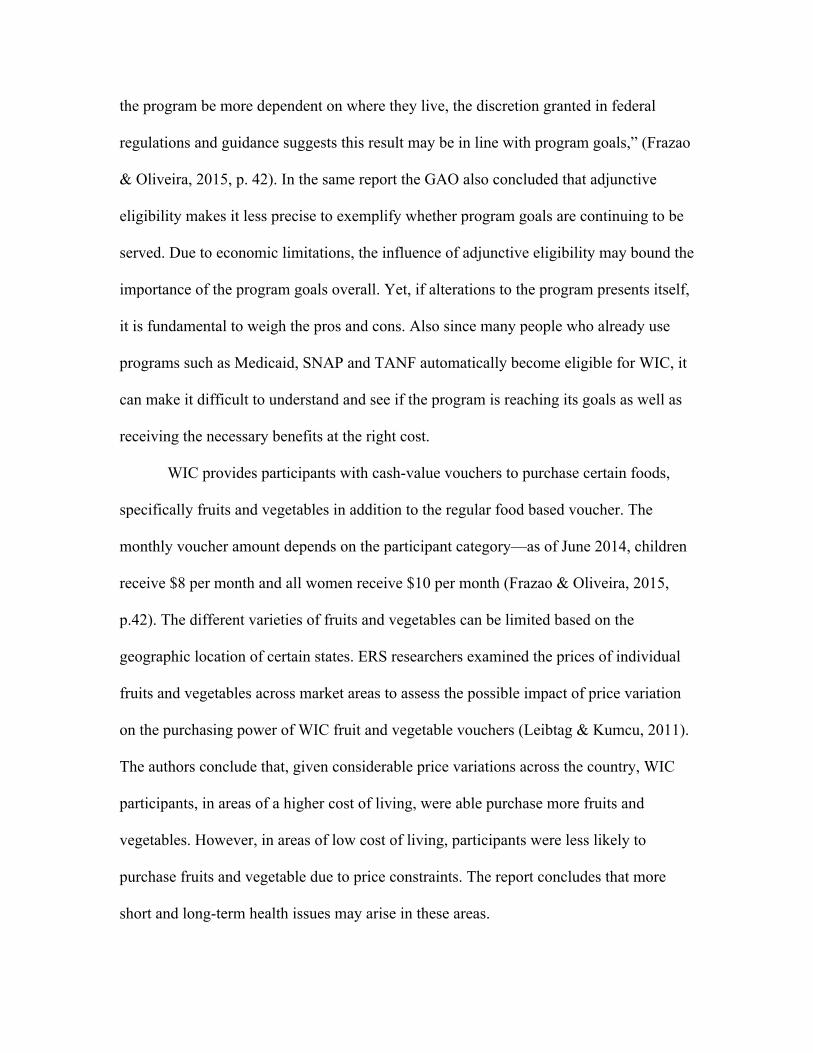
the program be more dependent on where they live, the discretion granted in federal
regulations and guidance suggests this result may be in line with program goals,” (Frazao
& Oliveira, 2015, p. 42). In the same report the GAO also concluded that adjunctive
eligibility makes it less precise to exemplify whether program goals are continuing to be
served. Due to economic limitations, the influence of adjunctive eligibility may bound the
importance of the program goals overall. Yet, if alterations to the program presents itself,
it is fundamental to weigh the pros and cons. Also since many people who already use
programs such as Medicaid, SNAP and TANF automatically become eligible for WIC, it
can make it difficult to understand and see if the program is reaching its goals as well as
receiving the necessary benefits at the right cost.
WIC provides participants with cash-value vouchers to purchase certain foods,
specifically fruits and vegetables in addition to the regular food based voucher. The
monthly voucher amount depends on the participant category—as of June 2014, children
receive $8 per month and all women receive $10 per month (Frazao & Oliveira, 2015,
p.42). The different varieties of fruits and vegetables can be limited based on the
geographic location of certain states. ERS researchers examined the prices of individual
fruits and vegetables across market areas to assess the possible impact of price variation
on the purchasing power of WIC fruit and vegetable vouchers (Leibtag & Kumcu, 2011).
The authors conclude that, given considerable price variations across the country, WIC
participants, in areas of a higher cost of living, were able purchase more fruits and
vegetables. However, in areas of low cost of living, participants were less likely to
purchase fruits and vegetable due to price constraints. The report concludes that more
short and long-term health issues may arise in these areas.
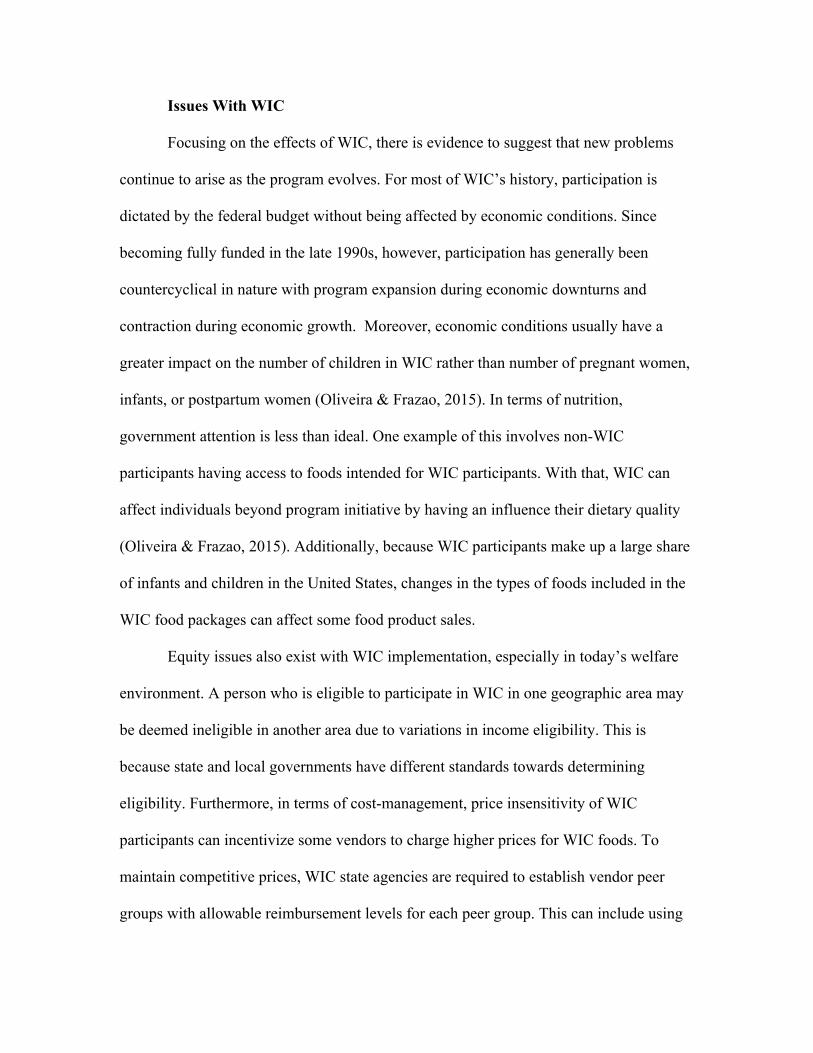
Issues With WIC
Focusing on the effects of WIC, there is evidence to suggest that new problems
continue to arise as the program evolves. For most of WIC’s history, participation is
dictated by the federal budget without being affected by economic conditions. Since
becoming fully funded in the late 1990s, however, participation has generally been
countercyclical in nature with program expansion during economic downturns and
contraction during economic growth. Moreover, economic conditions usually have a
greater impact on the number of children in WIC rather than number of pregnant women,
infants, or postpartum women (Oliveira & Frazao, 2015). In terms of nutrition,
government attention is less than ideal. One example of this involves non-WIC
participants having access to foods intended for WIC participants. With that, WIC can
affect individuals beyond program initiative by having an influence their dietary quality
(Oliveira & Frazao, 2015). Additionally, because WIC participants make up a large share
of infants and children in the United States, changes in the types of foods included in the
WIC food packages can affect some food product sales.
Equity issues also exist with WIC implementation, especially in today’s welfare
environment. A person who is eligible to participate in WIC in one geographic area may
be deemed ineligible in another area due to variations in income eligibility. This is
because state and local governments have different standards towards determining
eligibility. Furthermore, in terms of cost-management, price insensitivity of WIC
participants can incentivize some vendors to charge higher prices for WIC foods. To
maintain competitive prices, WIC state agencies are required to establish vendor peer
groups with allowable reimbursement levels for each peer group. This can include using
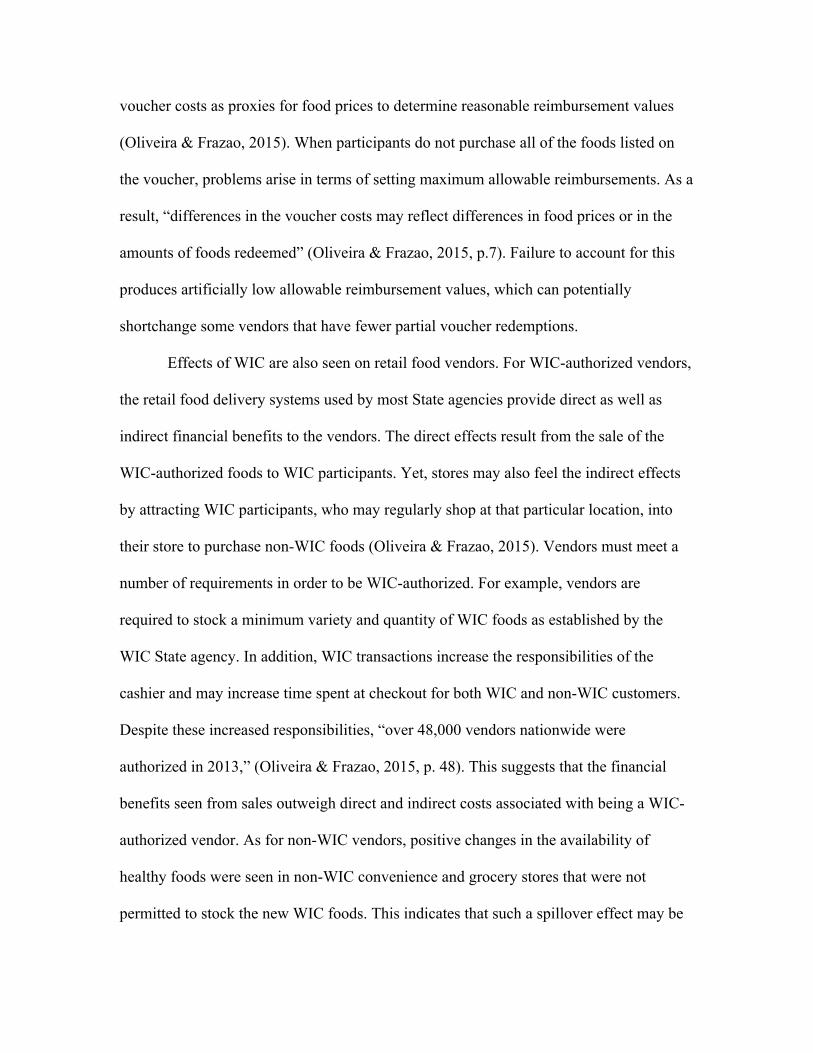
voucher costs as proxies for food prices to determine reasonable reimbursement values
(Oliveira & Frazao, 2015). When participants do not purchase all of the foods listed on
the voucher, problems arise in terms of setting maximum allowable reimbursements. As a
result, “differences in the voucher costs may reflect differences in food prices or in the
amounts of foods redeemed” (Oliveira & Frazao, 2015, p.7). Failure to account for this
produces artificially low allowable reimbursement values, which can potentially
shortchange some vendors that have fewer partial voucher redemptions.
Effects of WIC are also seen on retail food vendors. For WIC-authorized vendors,
the retail food delivery systems used by most State agencies provide direct as well as
indirect financial benefits to the vendors. The direct effects result from the sale of the
WIC-authorized foods to WIC participants. Yet, stores may also feel the indirect effects
by attracting WIC participants, who may regularly shop at that particular location, into
their store to purchase non-WIC foods (Oliveira & Frazao, 2015). Vendors must meet a
number of requirements in order to be WIC-authorized. For example, vendors are
required to stock a minimum variety and quantity of WIC foods as established by the
WIC State agency. In addition, WIC transactions increase the responsibilities of the
cashier and may increase time spent at checkout for both WIC and non-WIC customers.
Despite these increased responsibilities, “over 48,000 vendors nationwide were
authorized in 2013,” (Oliveira & Frazao, 2015, p. 48). This suggests that the financial
benefits seen from sales outweigh direct and indirect costs associated with being a WIC-
authorized vendor. As for non-WIC vendors, positive changes in the availability of
healthy foods were seen in non-WIC convenience and grocery stores that were not
permitted to stock the new WIC foods. This indicates that such a spillover effect may be
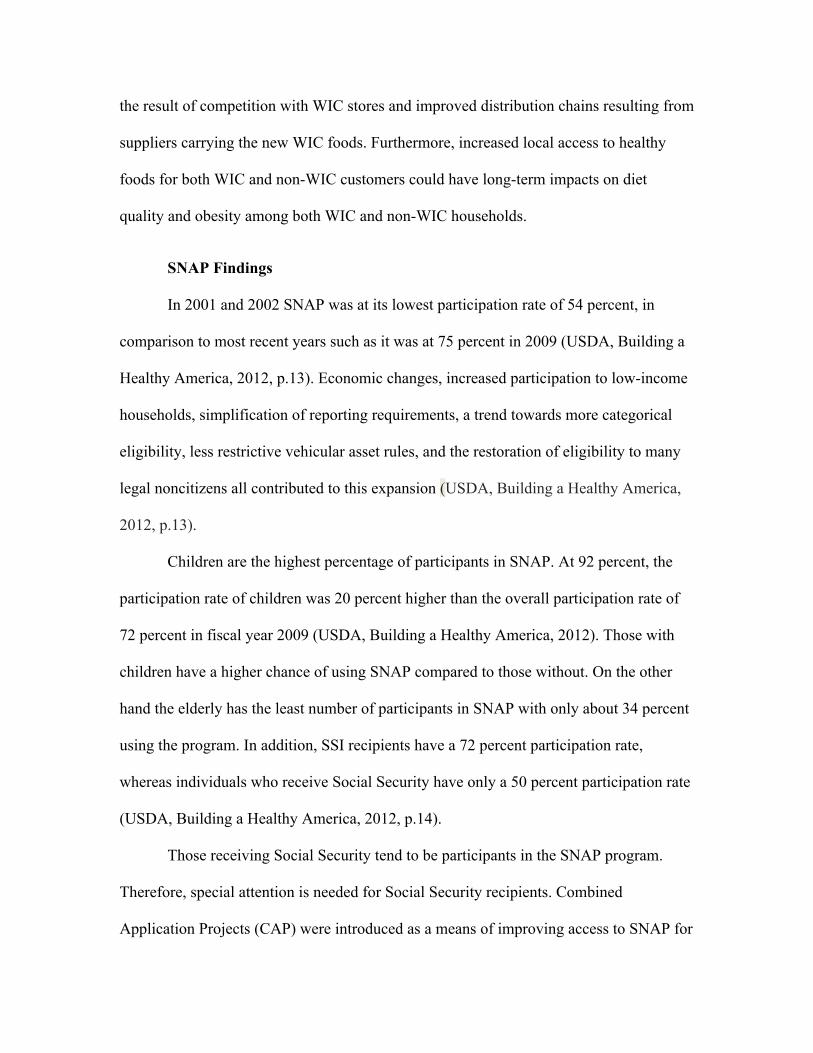
the result of competition with WIC stores and improved distribution chains resulting from
suppliers carrying the new WIC foods. Furthermore, increased local access to healthy
foods for both WIC and non-WIC customers could have long-term impacts on diet
quality and obesity among both WIC and non-WIC households.
SNAP Findings
In 2001 and 2002 SNAP was at its lowest participation rate of 54 percent, in
comparison to most recent years such as it was at 75 percent in 2009 (USDA, Building a
Healthy America, 2012, p.13). Economic changes, increased participation to low-income
households, simplification of reporting requirements, a trend towards more categorical
eligibility, less restrictive vehicular asset rules, and the restoration of eligibility to many
legal noncitizens all contributed to this expansion (USDA, Building a Healthy America,
2012, p.13).
Children are the highest percentage of participants in SNAP. At 92 percent, the
participation rate of children was 20 percent higher than the overall participation rate of
72 percent in fiscal year 2009 (USDA, Building a Healthy America, 2012). Those with
children have a higher chance of using SNAP compared to those without. On the other
hand the elderly has the least number of participants in SNAP with only about 34 percent
using the program. In addition, SSI recipients have a 72 percent participation rate,
whereas individuals who receive Social Security have only a 50 percent participation rate
(USDA, Building a Healthy America, 2012, p.14).
Those receiving Social Security tend to be participants in the SNAP program.
Therefore, special attention is needed for Social Security recipients. Combined
Application Projects (CAP) were introduced as a means of improving access to SNAP for
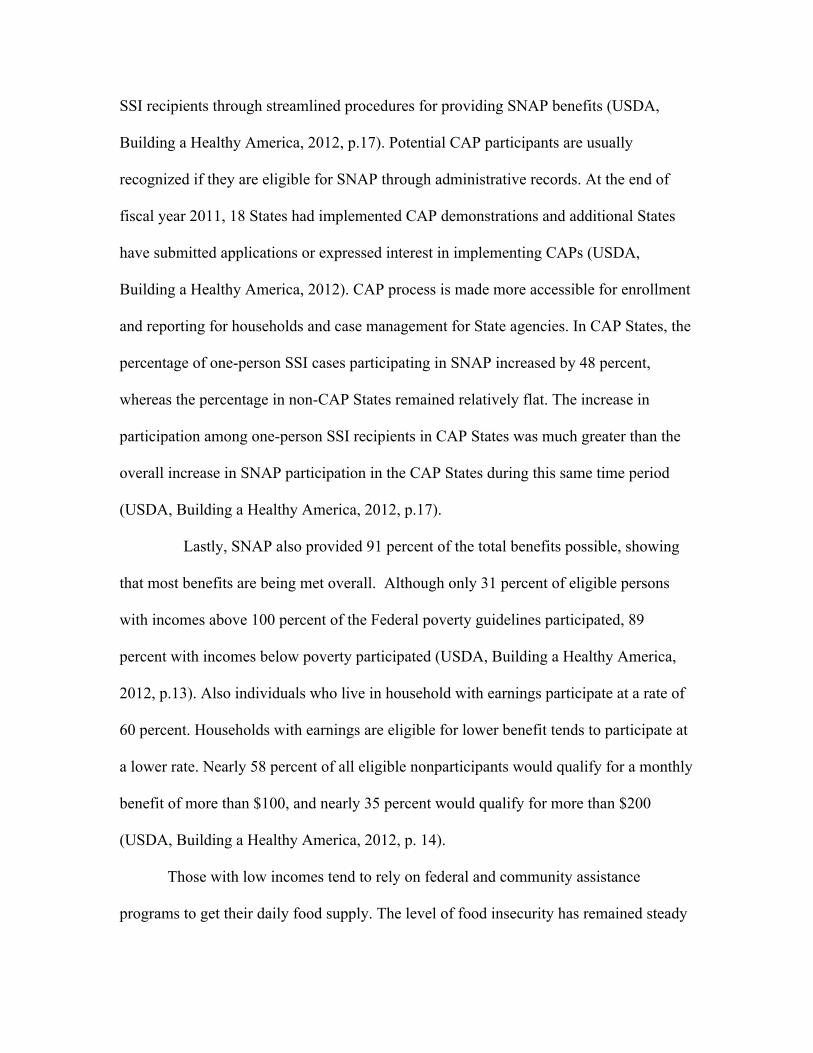
SSI recipients through streamlined procedures for providing SNAP benefits (USDA,
Building a Healthy America, 2012, p.17). Potential CAP participants are usually
recognized if they are eligible for SNAP through administrative records. At the end of
fiscal year 2011, 18 States had implemented CAP demonstrations and additional States
have submitted applications or expressed interest in implementing CAPs (USDA,
Building a Healthy America, 2012). CAP process is made more accessible for enrollment
and reporting for households and case management for State agencies. In CAP States, the
percentage of one-person SSI cases participating in SNAP increased by 48 percent,
whereas the percentage in non-CAP States remained relatively flat. The increase in
participation among one-person SSI recipients in CAP States was much greater than the
overall increase in SNAP participation in the CAP States during this same time period
(USDA, Building a Healthy America, 2012, p.17).
Lastly, SNAP also provided 91 percent of the total benefits possible, showing
that most benefits are being met overall. Although only 31 percent of eligible persons
with incomes above 100 percent of the Federal poverty guidelines participated, 89
percent with incomes below poverty participated (USDA, Building a Healthy America,
2012, p.13). Also individuals who live in household with earnings participate at a rate of
60 percent. Households with earnings are eligible for lower benefit tends to participate at
a lower rate. Nearly 58 percent of all eligible nonparticipants would qualify for a monthly
benefit of more than $100, and nearly 35 percent would qualify for more than $200
(USDA, Building a Healthy America, 2012, p. 14).
Those with low incomes tend to rely on federal and community assistance
programs to get their daily food supply. The level of food insecurity has remained steady
during the last three years, despite a significant increase in the rate of poverty in the
United States, underscoring the important role of Federal nutrition assistance programs in
helping to prevent food insecurity (USDA, Building a Healthy America, 2012, p. 18).
During the month before the December 2010 food security survey was administered,
approximately 41 percent of food-insecure households and 42 percent of households with
very low food security received SNAP (USDA, Building a Healthy America, 2012, p.18).
When households become highly food insecure they revert back to the SNAP program.
The prevalence of very low food security among households increases from around 8
percent one year prior to entering SNAP to nearly 20 percent in the four to six months
prior to entry while another study has found that SNAP receipt reduces the likelihood of
being food insecure by roughly 30 percent and reduces the likelihood of being very food
insecure by 20 percent (USDA, Building a Healthy America, 2012). Through the
Recovery Act many participants have high been able to become more food secure due to
the increase in benefits. A recent study indicates that food expenditures by low-income
households increased by more than 5 percent and food security improved by more than 2
percent between 2008 and 2009 (USDA, Building a Healthy America, 2012). This
change was noticeably beneficial for those in low-income homes in comparison to those
who have enough funds to be food secure. SNAP participants received a monthly benefit
of about $134, on average, per person in fiscal year 2010 (USDA, Building a Healthy
America, 2012, p. 19). These SNAP benefit amounts are based on the Thrifty Food Plan
(TFP), a nutritious, minimal cost food plan that reflects current nutrition standards and
guidance (USDA, Building a Healthy America, 2012, p.18). In order to receive the
maximum amount families must have no type of monetary income for the household.
Most SNAP households have income and receive a benefit equal to the difference
between the maximum allotment and 30 percent of their net income (USDA, Building a
Healthy America, 2012, p.19). The maximum benefit for a family of four in fiscal year
2012 is $668, or less than $1.90 per person per meal, while the minimum benefit,
available only to one- and two-person households, is $16 in fiscal year 2012 (USDA,
Building a Healthy America, 2012, p.19). The program is intended to decrease the
number of people that are hungry by increasing their power of purchasing food but those
who need the program the most are those who do tend to use it. More than half, 54
percent, of food pantry users report SNAP participation in the last month and about 58
percent of emergency kitchen users report SNAP participation in the same timeframe
(USDA, Building a Healthy America, 2012, p.19).
Several studies, including Rosenbaum’s research within the Center on Budget and
Policy Priorities, conclude that SNAP is effective and efficient in terms of meeting the
needs of low-income Americans while maintaining strong program integrity and payment
accuracy (2013). Foremost, SNAP is not contributing to the Nation’s long term fiscal
problems. While spending for SNAP has substantially increased since the recession of
2008, these increases are expected to be temporary. The Congressional Budget Office
predicts that the number of people receiving SNAP will begin to fall, and it has, from
47.7 million recipients in fiscal year 2013 to 47.6 million in 2014 (Rosenbaum, SNAP,
2013). Based off of these statistics, future participation is projected to decrease from 46.5
million recipients in 2015 to 34.3 million by 2023. Moreover, by 2019, SNAP spending
will return to 1995 recession levels as a share of GDP (Rosenbaum, SNAP, 2013).
Critics of SNAP perhaps suggest that changes in eligibility will spur increased
SNAP growth. This, however, is not the case as SNAP caseloads grew primarily because
of the recession. The CBO has confirmed that “the primary reason for the increase in the
number of participants was the deep recession and subsequent slow recovery; there were
no significant legislative expansions of eligibility” (Rosenbaum, SNAP, 2013, p.4).
Long-term unemployment as a result of the extraordinary deep and prolonged nature of
the recession has played an important role in record-setting SNAP participation levels.
Rosenbaum (2013) suggests, “workers who are unemployed for a long period of time are
more likely to deplete their assets, exhaust unemployment insurance, and turn to SNAP
for help, as it is one of the only safety net programs available for many long-term
unemployed workers” (p. 5). Other safety net programs, such as cash assistance under
TANF and state General Assistance programs, have, in most states, not been responsive
to rising need during the recession and its aftermath. Therefore, recent changes to SNAP
eligibility, which are feared to target higher-income households, do not compare to other
factors cited above. A state option known as broad-based categorical eligibility allows
states to extend SNAP eligibility to certain low-income households whose gross income
is above 130 percent of poverty, but generally with disposable income that is below the
poverty line, or who have modest assets (Rosenbaum, SNAP, 2013). The state option
makes SNAP available primarily to low-income working families with children or
seniors, but the option does not result in substantial SNAP benefits going to non-needy
families. In 2011, only 2 percent of SNAP households had monthly disposable income
above the poverty line (Rosenbaum, SNAP, 2013).
Moreover, error rates and program abuse is a major concern during the evaluation
process. SNAP has one of the most rigorous payment error measurement systems of any
public benefit program. Each year states pull a representative sample (totaling about
50,000 cases nationally) and thoroughly review the accuracy of their eligibility and
benefit decisions. Federal officials re-review a subsample of the cases to ensure accuracy
in the error rates. States are subject to fiscal penalties if their error rates are persistently
higher than the national average. Despite the recent rapid caseload growth, USDA reports
that states achieved a record-low SNAP error rate in fiscal year 2011. Only 3 percent of
all SNAP benefits represented overpayments, meaning they either went to ineligible
households or went to eligible households but in excessive amounts, and more than 98
percent of SNAP benefits were issued to eligible households (Rosenbaum, SNAP, 2013).
In terms of program abuses, efforts have been extensive and effective. The USDA has cut
"trafficking" -- the sale of SNAP benefits for cash, which violates federal law -- by three-
quarters over the past 15 years (USDA, Building a Healthy America, 2012). Only 1
percent, or $1 in every $100 of SNAP benefits, is trafficked. USDA has also permanently
disqualified thousands of retail stores from the program for not following federal
requirements. In fiscal year 2012, USDA's retailer fraud investigations resulted in 342
convictions and $57.7 million in recoveries. When cases of SNAP fraud are reported in
the news, it is because the offenders have been caught, evidence that states and USDA
are aggressively combating fraud.
Empirical Research On Policy Efficiency And Effectiveness
SNAP, with its varying aspects, serves to meet specific objectives, which are
measured with several criteria standards and research methods. Wyker, Jordan, and
Quigley (2012) offer an evaluation of SNAP based off of behavioral theory and survey
evaluation. They state, “the purpose of SNAP... is to provide food and quality nutrition
habits to individuals with low incomes (p.10). A large goal of these initiatives is
education. is the application of the Supplemental Nutrition Assistance Program Education
(SNAP-Ed), which allows eligible recipients to better educate themselves on the
importance of dietary quality, food safety, and food resource management. To address
concerns about evaluation of SNAP-Ed, FNS and state-level leaders have worked
together with the Society of Nutrition Education and Behavior to identify specific
evaluation needs of SNAP-Ed programs and to find the best and most efficient strategies
to meet evaluation needs.
The objective describes the application of the Transtheoretical Model (TTM) to
SNAP-Ed evaluation and development and validation of an evaluation tool used to
measure TTM constructs. Methods for this evaluative study include recruitment of
participants in a survey study. Nine SFSP sites were selected for the study where
participants were asked to complete an easy-to-read survey in which low-literacy
audiences could read. Items in the survey were selected from decisional balance scales
that measured low-income individuals’ perceived benefits and barriers to eating fruits and
vegetables (Wyker, Jordan & Quigley, 2012). Three items were selected to measure
benefits and barriers in which participants were asked how much they agree with each
item. To test the hypothesized linkage between the TTM mediators and dietary behavior,
the Food Stamp Program Fruit and Vegetable Checklist (FVC) was used to measure
behaviors related to fruit and vegetable consumption. In terms of measurement and
structural model assessment, results from a model fit assessment suggest that the
theoretical framework applied is appropriate and the domains in the model explained a
fair amount of the variance in fruit and vegetable consumption (Wyker et al., 2012).
Moreover, an association was not found between perceived benefits of eating fruits and
vegetables and consumption behaviors even though there is a significant association
between perceived barriers and self-efficacy and consumption behaviors. However,
limitations were found in the structure of the survey, exclusion of certain demographics
such as hispanics and males was a glaring aspect. Nonetheless, this study provided
researchers with information on how to develop validated tools to assess the relative
constructs of behavioral theory in their own programs. Wyker, Jordan, and Quigley
applied, in the presence of evaluative literature, a quality process of measuring
effectiveness of SNAP and one of its particular components.
Another education aspect of SNAP requires the need to measure the efficiency of
program implementation as it relates to cost-benefit analysis. Burney and Haughton
(2002) questioned the economic value of nutrition education programs such as SNAP and
an education component called the Expanded Food and Nutrition Education Program
(EFNEP). They surveyed participants in order to determine if their savings in food
expenditures exceeded program implementation costs. Costs were collected over a six
month period using expenditure reports as well as other monetary records. Benefits were
determined using data from 371 women enrolled in EFNEP who completed a 24-hour
food recall and behavior survey, and recorded the amount of money spent monthly on
food at program entry and exit. Treatment groups received the nutritional education and
one control group did not. Results from the study found that family food expenditures
decreased on average by $10 to $20 per month or $124 to $234 over a year, however they
did receive improved nutritional benefit after participating in the program. Nonetheless,
researchers concluded that EFNEP is cost-beneficial; the magnitude of the savings in
food expenditures is sensitive to the method of food expenditure reporting and
assumptions about how long participants will retain the behaviors they learn (Burney &
Haughton, 2002). Given that policy makers are constantly asking if limited resources are
spent for programs that have the greatest potential for achieving desired outcomes, this
study provides a quality evaluation of comprehensive efficiency criteria.
Along with measures of effectiveness and efficiency within SNAP, other studies
try to conclude if this particular policy implementation is adequate, meaning that the
given level of effectiveness satisfies the needs, values, and opportunities that give rise to
a public policy problem. Nguyen, Shuval, Nijike, and Katz’s (2014) journal examines
U.S. nationally representative data from 4211 low-income adults participating in SNAP
was used to examine the association of SNAP and diet quality among low-income adults.
Results of the study found that, compared to nonparticipants, SNAP participants had low
dietary quality scores overall including for fruits and vegetables, seafood and plant
proteins. The authors conclude that although SNAP has an important role in providing
nutrition to eligible low-income individuals, interventions are warranted to improve the
dietary quality of participants (Nguyen, Shuval, Nijike, & Katz, 2014) . Therefore, it is
imperative that adjustments to SNAP and its supplementary programs within government
implementation improve the adequacy for its participants. Moreover, with subpar
adequacy, effectiveness and its measurable qualities also suffers.
SNAP is also joined with the Temporary Assistance for Needy Families program
in terms of its questioned ability to present efficiency, effectiveness, and adequacy to
recipients as well as relating to government processes. Morganstern, Blanchard, and
MCCrady (2005) provide a measure of TANF’s effectiveness in their study,
“Effectiveness of Intensive Case Management for Substance-Dependent Women
Receiving Temporary Assistance for Needy Families.” Objectively, they tested the
effectiveness of a long-term coordinated care strategy, intensive case management (ICM),
compared with usual care (UC) among a group of substance-dependent women receiving
TANF. These women, recruited from welfare offices, were assessed and randomly
assigned to ICM or UC. Results conclude that ICM clients had significantly higher levels
of substance abuse treatment initiation, engagement, and retention compared with UC
clients as well as abstinence at the 15 month follow-up compared to UC clients. The
authors conclude that ICM is a promising intervention for managing the chronic nature of
substance dependence among women receiving TANF (Morganstern, Blanchard, &
McCrady, 2005). This aspect of TANF and its empirical research into it suggest that
effectiveness is being met at the implementation level.
As one can see, WIC is a highly used program and it is vital to be effective in
regards to solving the problem. In a study with the Pregnancy Risk Assessment
Monitoring System (PRAMS), researchers have concluded that WIC actually works.
Information is gathered from the Centers for Disease Control in order to track maternal
behaviors and experiences associated with maternal and healthcare outcomes. The results
of the research concluded that mothers who are black or Hispanic are much more likely
to participate, contingent on age, education, and marital status. Those mothers who are
high school dropouts have a higher chance to participate than college graduates, while
women over 20 are much less likely to participate than younger women. Also obese
women are also more likely to participate as well. Lastly, mothers who report father's
information on the birth certificate are more likely to participate (Bitler & Currie,
2005).
The research also concluded that though WIC mothers have observable
characteristics that are predictive of poorer infant health outcomes, they could
conceivably have unobserved characteristics that cause them to have better outcomes,
with or without WIC, but this not likely the case (Bitler & Currie, 2005). If the selections
of those who participate are not properly accounted for then the study will be imperfect.
This study adds to a large body of work suggesting that WIC mothers are negatively
selected from the population of eligible and that the WIC program helps these women to
have healthier infants (Bitler & Currie, 2005). However the information provided from
the PRAMS data informs one that the benefits of WIC used by women who are pregnant
offset the costs of the program benefits. On average a food package consist of about $35
monthly for a participant. A limitation of PRAMS is that we do not know the month in
which a woman began receiving benefits but a conservative estimate is that the typical
woman begins in the second month of pregnancy and continues through the ninth month
(Bitler & Currie, 2005).
With WIC, the issues of having health care issues during the cognitive developing
years are eliminated. For example, the average education of almost one night's hospital
stay per infant, and a quarter of a night's stay in hospital per woman, would be enough to
repay the cost of the WIC benefits by itself, but the WIC infants are also 14 percent less
likely to end up in an intensive care unit, at a cost of thousands of dollars per day (Bitler
& Currie, 2005). It is here that one seen how WIC saves the government money by
economizing on the costs of treating mothers and infants under the Medicaid program.
Amongst the mothers on Medicaid, each dollar spent on WIC saved the state at least
$1.77 to $3.13 in health care costs (Bitler & Currie, 2005).
The calculation of cost savings highly underestimates the value of the WIC
program for the fact it does not inform one of the social benefits of producing babies that
are healthier at birth and the first 5 years of their lives. This estimate propose that WIC
reduces the probability that an infant is low birth weight by 29 percent, and reduces the
probability that an infant is very low birth weight by more than half (Bitler & Currie,
2005). This is vital for the fact that low birth weights can increase the chances of death as
well as long-term detrimental health issues for infants. Overall, WIC improve birth
outcomes and ensures that the participants are receiving the necessary nutrients in order
to sustain a healthy life, specifically in the developing years.
Chapter 4 Understanding the Present Policy Issue at Hand: Prospective
Alternatives
As shown in the aforementioned chapters, America’s federal food system is
complex. Maneuvering through the network and engendering collaboration among a
number of stakeholders is imperative if policy actors and analysts hope to adequately
improve the lives of those suffering from malnourishment and food insecurity. This is
easier said than done since the food policy realm is multi-faceted and polarized
(Wegener, Raine, & Hanning 2012; Harden, Ashwood, Band et al 2013). It seems that
particular actors have different interests and agendas and thus vary drastically regarding
their sentiments about the implementation of better and more health cognizant food
policy. With different types of thinking styles, diverging interpretive frames, and

competing policy implementation paradigms, “agricultural commodity groups and food
processors on one side and organic and sustainable food advocates on the other” (Dover,
Dybsetter, Harden, 2014 np). Once more, structural barriers stand in the way of
successful implementation whether due to an influx of food deserts or a lack of usable
transportation in order to commute to grocers and supermarkets. These barriers, while
large in scope, don’t have to be debilitating. Headway can be made and success can be
achieved if one is to look to other policy alternatives and solutions not already in place.
Indeed, when trying to decide which policy alternatives to highlight, one
consideration is the quality of food and not just the quantity made available to those
under the SNAP and WIC programs. Another consideration policy analysts ought to
consider is intervening throughout multiple levels of government. One could look to and
ultimately borrow from some examples of policy changes at the state level. State-level
interventions take into account that federal policies can only get so much done; on its
own, federal action cannot provide action and response at a local level (Centers for
Disease Control and Prevention, 2012). There are also some non-governmental ideas that
have already been implemented in order to increase the quantity, quality, and ease of
obtaining adequate food for rural and local constituents as well.
Alternatives and Remedying at the Federal, State, and Local Level
In the proceeding text, the authors will attempt to showcase more feasible and
desirable alternatives towards achieving food security and access to healthy nutrient
dense foods. Borrowing from Currie (2003), and parts of chapter three, historically, most
government food and nutrition programs (FANPs) had three goals: one, making sure that
there was enough food for those that were in most need of it. Second, to better the
nutritional options and understandings of the recipients of these programs via improving
the nutritional choices of recipients through educational endeavors. Lastly, FANPs were
cultivated in an effort to provide a “uniform, minimum, nationwide threshold below
which assistance cannot fall” (p. 200). Especially when looking to the latter, the inherent
safety net role of FANPs will become increasingly necessary. States and localities are
being forced to do more with less, “as states cut back on cash assistance and FANP
benefits form an increasing proportion of the total aid provided to low-income families”
(p. 200).
In order to continue achieving the previously mentioned goals, policymakers must
take a step back and comprehensively look at these FANPs through a whole new lens, in
an effort to make sure that they continue to provide for those that stand to benefit most
from such programs. This can be done in a number of ways whether tweaking preexisting
policy programs like SNAP and WIC, or through working in tandem with a number of
different actors across different sectors both state and local (Johnson, Cheadle, Podrabsky
et al., 2013). Federal initiatives like SNAP and WIC have had their fair share of criticism.
(Ratcliffe, McKernan, Zhang, 2011; Bittler & Currie, 2005) The food being supplied to
beneficiaries is often not nutrient dense. If one is to stay true to Currie and make sure that
those in most need of foods, specifically healthier foods are well fed, then change is
needed in order to keep pace with the changing society.
The prospective incremental changes to pre-existing federal food policy below
were selected based on the best available evidence, as well as whether or not the policy in
question was both politically and economically feasible. Both SNAP and WIC would
benefit from a reform in how each program’s benefits were delivered. This type of
overhaul could help to simultaneously improve nutrition and the overall well-being of
lower-income individuals that use these food and nutrition programs.
Incremental Changes to SNAP and WIC Policy
More Frequent SNAP Payments
One option is to distribute SNAP monies more often as opposed to once a month
as this is currently being done (Bhargava, 2004). More frequent payments of SNAP
benefits would ultimately help smooth food consumption and improve dietary quality.
Specifically, more frequent shopping could increase purchases of produce, since
groceries would be less likely to spoil between grocery trips. SNAP consumers are often
pressured to stretch their food items under the current monthly system, and thus opt to
instead by cheaper and less healthful food items (Richards and Sindelar, 2013). This
approach would also reduce in store stressors such as cognitive overload, cues and
displays of food that would elicit temptation to buy unhealthy food products, and present
bias or too great a focus on the present. For example, often times a SNAP recipient will
prioritize present prices, a time discount, instead of the down the road costs that may
incur in light of those present choices (Richards & Sindelar 2011; Sweller 1988; Laibson;
Thaler and Sunstein, 2008).
Providing Monetary Incentives for Healthier Food Choices
Good dietary choices are particularly low among the American population. The
previously mentioned diet quality however is particularly low among low-income
Americans (Lin, 2005). It’s even been shown by Fox and Cole (2004), that SNAP
beneficiaries consumed less fruits and vegetables than both those that were eligible for
SNAP benefits that either chose not to participate in SNAP or than those that were
income ineligible to begin with. One economic intervention strategy that could be
implemented under SNAP is to subsidize the consumption of healthy foods such as fruits,
vegetables, and dairy products and taxes the consumption of less healthy foods such as
salty snacks (Kuchler, Tegene, and Harris, 2005; Guthrie et al., 2007). These subsidies
have the power to essentially expand a beneficiary's food budget; studies have shown that
subsidizing healthy foods correlates with increased consumption of said healthy food
items (Epstein et. al 2006, 2010, 2012). The subsidies would be applied towards the EBT
card the following month. This timing shift would allow for funds to rollover thereby
increasing subsequent monthly payments. Ultimately, this process would then allow for
more continuous healthful food purchases (Richards & Sindelar, 2011).
Strengthening SNAP and WIC Vendor Standards
One untapped resource to change the food environment is the SNAP retail
network. SNAP already regulates the product offerings of participating retail stores to a
limited extent. Altering current standards to include more healthful options may increase
the accessibility of healthier foods in communities that lack supermarkets. This need for
more stringent standards applies more to SNAP than it does WIC, as a result, WIC
already needing to comply for vendor standards. In particular, “in 2008, the updated
regulations mandated that state agencies require authorized WIC vendors to stock at least
two varieties of fruits, two varieties of vegetables, and one whole grain cereal” (Kennely,
Neff & Rutkow, 2013, p. 155). Likewise, SNAP ought to consider adopting more
stringent policy tweaks as well so to become more aligned with WIC nutrition
requirements. For example, some changes to SNAPs vendor policies would include
making “fruits and vegetables independent and distinct categories of staple foods, thus
creating five categories of staple foods; require one whole grain bread option; and require
a skim or one-percent milk option in the dairy products category” (Kennely et al.,
2013, p. 157).
Increase Food and Choice Variety for WIC Recipients.
As stated previously, WIC is a program intended to help poor pregnant and
postpartum women supplement their diets with more nutritious foods as well as providing
vouchers for both baby formula and food. Unlike SNAP however, WIC operates under an
allowed quantity model, providing beneficiaries with vouchers that may be redeemed for
a particular good regardless of its price, so long as the voucher is presented at a
participating retailer. The administration of WIC is fundamentally different from SNAP
in two ways. First, WIC food benefits are intended to merely enhance rather than replace
their current diet. Second, eligible persons accepted into the WIC program are assigned a
“food package” (Oliveria, 2002; Cole, McKnees & Kinney, 2013) that they must adhere
to in order to continue receiving benefits. Currently, the list for pre and post-partum
women includes; juice, milk, breakfast cereals, cheese, eggs, fruits and vegetables, whole
wheat bread, canned fish, canned and dried beans, and peanut butter. While WIC-
approved foods aren’t hard to find, in order for them to qualify under WIC, the foods
discussed above must be bought in certain amounts and fall under WIC’s purview. It is
our view that these stringent requirements would benefit from streamlining and review.
State and Local Food Policy Initiatives: Examples and Ideas
Sometimes local governments are better suited in trying to increase better access
to better food. Local entities are better able to identify and attend to the needs of their
constituents and in doing so, are better able to craft long lasting and well working piece
of policy and community partnerships. While the federal government has attempted to
achieve just this, it often times falls short simply because there is cultural and community
mismatch making it difficult to work directly with the affected communities in question
(Broad Leib, 2013).
Food Community Councils
Indeed, local governments have made a lot of headway regarding the
implementation of local food policy and initiatives: thirteen cities in North America now
have a paid local food policy director or coordinator (Hatfield, 2012), and more than 130
cities and counties in the United States and Canada have local food policy councils. Local
food policy councils or task forces, are made up of a number of different stakeholders,
from different sectors, and actors whom all have a vested interest in and desire to
improve the way food is consumed and distributed in their region. An environment where
healthy actions and ideas are fostered, tend to do well. (Martinez, 2010; Ahem, Brown,
Ducas 2011). Many localities as of late have made specific efforts towards increasing the
ease to which healthy foods can be obtained. Successful examples of implementation
state and city wide are discussed below.
Increasing the Amount and Type of Food Vendor Available
Many cities and municipalities simply don’t have the necessary resources or
infrastructure to encourage more health focused supermarkets in deserving areas. Local
entities often times have the capacity to push zoning and financial projects onto an
agenda which would incentivize and bring about more healthy retailers to a deserving
area. For example, The Food Trust, a nonprofit organization in Philadelphia, encouraged
state and local policy makers to fund the Pennsylvania Fresh Food Financing Initiative
(FFFI), “a public-private partnership with The Reinvestment Fund, which provides grants
and loans to finance supermarkets and other food retailers in neighborhoods lacking
healthy food access” (Broad-Leib 2013 pg 334; Food Trust, 2013). In New York City, the
Food Retail Expansion to Support Health (FRESH) Program, uses “financial and zoning
incentives to promote grocery development in underserved areas” (Broad-Leib 2013 pg
334; Kareem and Thornton, 2009). Lastly, Baltimore created the “Baltimarket” virtual
grocery store, a public-private partnership in which the city works with a local grocery
chain to “deliver groceries to public libraries in underserved communities. Customers can
place orders from the free library computers, pay with SNAP, cash, credit, or debit, and
return to the local library to pick up their food deliveries” (Broad-Leib, 2013 pg 334;
Barrington, 2011).
As state above, local governments also have the capacity to require that stores
provide healthy options, encouraging them to stock particular produce and
goods. Minneapolis requires grocers to stock certain amounts of “staple foods,” such as
fruits, vegetables, meat, poultry, fish, bread, and dairy (Broad-Lieb, 2013) This ordinance
in Minneapolis makes it so that local grocers in impoverished neighborhoods have
enough access to healthy fruits and vegetables which can sometimes be scarce.
There are some other more unorthodox approaches that local governments have
taken to increase access to more healthy foods. For example, in Boston, an ordinance
made it so that food trucks offered at least a healthy food option with minimal frying,
processing, and high fructose corn syrup (Broad-Leib 2013; Boston Press Release, 2011).
Reducing Transportation Barriers
Arguably, one of the biggest barriers parts of the population when trying to obtain
food, is simply not having the necessary transportation to get from point A to point B.
Local communities have tried to lessen this barrier through a number of creative fixes.
For example, in 1983, Knoxville Area Transit expanded its bus routes to connect low-
income areas with grocery stores and “also ran a “grocery bus line” that connected
residents to food outlets for one dollar round trip. They installed racks in buses for
passengers commuting to grocery stores to address the community concern that shoppers
had nowhere to place their groceries” (Centers for Disease Control and Prevention,
2011). Similarly, the Austin/Travis County Food Policy Council worked with Austin
Capital Metro Transit to start a grocery bus line, in order to make it so that low income
neighborhoods were in reach of otherwise faraway supermarkets (Broad-Leib 2013;
Zodrow, 2005).
Streamlining Use of SNAP and WIC EBT Cards in Farmers Markets
Another state lead idea, is to universally streamline and subsidize the use of and
equipment necessary of EBT cards allowing them to be used both in regular grocery
stores as well as farmers’ markets. As was noted in chapter one, EBT cards replace paper
food checks or vouchers with a card for food benefit issuance and redemption. Much like
a credit card, nationally, the use of EBT for SNAP benefits in stores has made much
progress towards bettering both the program administration itself and fostering a better
dynamic between store owners and program beneficiaries.
However, as it stands, the government only supplies EBT cards and equipment for
retailers free of charge for those that allow SNAP participants; WIC participants are
unable to currently redeem their benefits via an EBT transaction where most are done via
vouchers instead (Cole, McKnees & Kinney 2013). Once more, while the federal
government currently subsidizes the cost of EBT equipment for retailers that already
participate, the aforesaid technology is not subsidized towards, and thus not offered as
much throughout farmers market, which arguably have a larger supply of fruits and
vegetables which are capable of proving health. Wisconsin has successfully been able to
implement this approach. (Hood, Martinez-Donate, Meinen, 2012). Other states
including California, Indiana, and Massachusetts had passed similar legislation
mandating EBT use in farmers markets. (Broad-Leib 2013; National Conference of State
Legislatures, 2014)
Non-Governmental Alternatives
Community Gardening
Many communities have sought to improve households’ access to fresh fruits and
vegetables through community gardening. The American Community Gardening
Association (ACGA), a national nonprofit organization that supports the development of
community gardens, defines a community garden as “any place where two or more
people garden together” (Director, 2001). Community gardens are commonly established
on vacant lots in both small and large central cities where land that could otherwise be
used towards gardening is scarce. The type of garden implemented in question can also
vary; they can include school-based gardens, therapeutic gardens for seniors and disabled
people, and youth training gardens (Director, 2001). Few studies have quantified the
impact of community gardens on food and nutrient intakes by low income households. A
1991 study undertaken by Pennsylvania State University showcased however some direct
benefits, and upon examining fruit and vegetable consumption among 144 community
gardeners throughout the city of Philadelphia, found that community gardeners consumed
more vegetables than non-gardening people (Ford et al., 1991). Once more, Armstrong
(2000) was able to show that community gardens in impoverished areas throughout
upstate “were four times as likely as non low-income gardens to lead to other issues in
the neighborhood being addressed; reportedly due to organizing facilitated through the
community gardens” (p. 321). In layman terms, community gardens spurred spillover
effects in other areas needing attention.
Farmers’ Markets
Farmers markets have gained traction in both small and rural communities as well
as big city metropolises. In particular, throughout 1994–2011, farmers markets increased
drastically in the United States from 1,755 to 7,175 (US Department of Agriculture,
2009). Once more, a number of important stakeholders can benefit from farmers markets:
those that consume the literal fruits of the farmer’s labor, as well as the regional
producers and farmers of the produce themselves. In addition, FANP programs like
SNAP and WIC have slowly started to extend benefits to include farmers’ market
purchases (U.S. Department of Agriculture, 2009; U.S. Department of Agriculture,
2014). The prevalence of and inclusion of farmers markets in FANP programs, can
encourage more healthful food choices within reach for those that need it.
Farm-to-School Initiatives
Farm-to-school initiatives encourage small farmers to sell fresh produce to
schools and encourage schools to buy fresh produce from small farmers, usually from the
local community. Schools may be able to lower food costs by purchasing fresh fruits and
vegetables from local producers while students are provided with the opportunity to learn
where their food comes from, interact with farmers who grow their food, and learn about
the importance of fruits and vegetables in a healthful diet. Some local initiatives include
the Oklahoma Farm to School Program. This program “funds a full-time farm-to-school
program coordinator in the Oklahoma Department of Agriculture who creates, fosters,
and manages farm and school connections throughout the state” (Centers for Disease
Control, 2011 np). Once more, in Pennsylvania, they have established a program entitled
the Kindergarten Initiative whereby parents and local farmers, provide educational tools
and foods in order to teach the students about proper and healthy eating habits (Director,
2001).
Costs and Benefits
When thinking of the potential policy alternatives it is also important to keep in
mind the potential costs and benefits that come along with them. There would be no use
to implement an alternative idea if the overall cost of implementation outweighs the
overall potential benefits. The problem nutritional programs like SNAP and WIC mainly
face is not having enough funding to expand and improve their services. These types of
programs are more vulnerable to cuts in funding because their “products” of success are
not completely visible (Baral, Davis,Serrano, Wen, &Blake 2013). It is hard to have solid
data showing the improvement in health and food security of participants even though the
programs are very vital to a number of families.
Another problem these programs face is how hard it is to predict demand and
supply conditions in the public market. In the public market it is extremely easy to de-
couple the benefits and burdens of the programs. SNAP and WIC face the problem of
micro de-coupling because the programs benefit a specific population while the costs of
the program are spread out amounts a larger group of people. Those receiving the
benefits are usually the ones who inflate the demand and push for the continuation of the
program but the recipients of these programs are often lower class and do not have much
political influence. The people not receiving the program will most often try to make the
demand for the programs look smaller and push for elimination of the programs based on
them saying there is little to no demand for them. Another issue is with high time
discount making it easier to focus on present rewards rather than the long-term benefits
the program would provide. Policymakers will make small changes to the program so
they can receive the credit while they are still in office. This could be a problem because
these decisions are often made without taking the long-term effects into account.
WIC Funding and Costs
The funding of WIC differs from the other programs because the funding is
completely covered by the federal government with little to no state support. This way of
funding may be the reason for the large increase in WIC participants over the past years
(Oliveira and Frazao, 2009). Since the states have no involvement in the funding this
gives them no incentive to monitor or control participation in the program. With no
responsibility for funding the states will begin to show moral hazard meaning since they
do not face the consequences they will take no action to help prevent problems like over
enrollment (Oliveira and Frazao, 2009). The problem behind over enrollment is there
needs to be supporting funds available to support the increase in participants and it is the
responsibility of the federal government to fund the gap.
Another possible problem brought up by only having federal funding is the
increase in WIC-only stores. The transactions that occur in WIC-only stores are through
voucher redemption and because of this the price of the food is not a main concern
(Oliveira and Frazao, 2009). The store owners then realize that since the prices do not
sway the consumer’s decision they are able to mark up the prices higher to gain them
more profit. This potential for profit maximization makes becoming a WIC-only vendor
an appealing choice compared to trying to compete with other regular food stores off of
price competition. Instead of through prices the stores make sure to provide excellent
customer service to recipients to win over their business. The numbers of WIC-only
stores has had a steady increase over time and since the states have no reason to control
the growth the opening of stores will only increase. Even though there is a high trend of
states not taking action there a few states that have taken it upon themselves to limit the
number of WIC-only stores (Oliveira, Racine, Olmsted, & Ghelfi, 2002). While it is
important to keep the number of stores under control the limiting could end up making
things harder on the participants. With limitations on the number of stores participants in
rural or lower-income areas could lose easy access to a close store. With limited access
the recipients may turn to alternative food sources that are of lower nutrition and stray
from the recommended food packages. This ties into the issue mentioned before of
recipients making poor food choices just so they can stretch out how long it is before they
have to make a trip back to the store.
New Technology
Another way programs often cut costs is through utilizing improvements in
technology. Earlier the idea of SNAP and WIC EBT cards being accepted at farmer’s
markets was proposed as a useful policy alternative but most of the participating markets
only have access to one point of sale (POS) terminal. Even just owning one of these
terminals can cost a vender around $1255 yearly (Hood, Martinez-Donate, Meinen,
2012). One way the vendors combated this cost problem was by only operating one EBT
terminal at the market, which would reduce costs and increase the amount of SNAP/WIC
redemptions. This condition of being able to save in costs along with increasing the level
of production or sales is referred to economies of scale. The states have the incentive to
try and increase the SNAP/WIC redemptions because it has the potential to greatly help
their economy. Past research has shown “that every SNAP dollar spent generates $1.73
in real GDP increase and that expanding food stamps is the most effective way to prime
the economy’s pump” (Hood, et. al., 2012, p.285). This boosting of the local economy
can also help benefit the local vendors by increasing their sales and creating a stronger
economy.
The Academy of Nutrition and Dietetics proposed that there would be an even
bigger increase in the use of SNAP benefits if the vendors had access to more than one
POS machine (2012). To test this theory a pilot program was set up at The Clark Park
farmers’ market in Philadelphia, where multiple vendors were provided POS terminals at
no extra charge to them. After about nine months of data collection the results showed
that after the introduction of the new POS terminals there was a 38% increase in SNAP
and WIC EBT card use than the months before the program. (Buttenheim, Havassy,
Fang, & Glyn, 2012). Even though the increase in redemption shows that the
implementation of more machines would be useful it does not mean that it is the right
choice for every market. The costs of the terminals are very high and include the rental of
the machine as well as various additional fees. If the vendors were expected to cover a
portion of the cost they would have to have high sales to help them break even and not
lose profit. This could be hard for many vendors since most of them bring in a lower
profit and are located at smaller markets. The Clark Park farmers’ market is on the larger
side doing majority of the business in Philadelphia and only two of their twenty vendors
brought in enough funds to breakeven on the costs (Buttenheim, et. al., 2012). This shows
that while the implementation of more POS terminals would be very beneficial to
SNAP/WIC and their participants, the expansion of added technology would prove too
costly. A solution to this problem would be to find a way to lower the price of the
technology. Improvements to technology have been happening rapidly over the years and
the more progress being made mean the cheaper it can become. The wireless POS
terminal expansion in farmers’ markets will become an option once the vendors find a
cost effective way to break even on sales and technology expenditures.
When new alternatives are implemented one of the initial barriers could be the
problem of high implementation costs. For example an online e-WIC program is being
developed for multiple states, more specifically Kentucky has been looking to make in-
house processing available for recipients (VDH, 2008). A program like this would prove
useful because it would make redemption vouchers more readily available to participants
but there is a start up cost barrier that could make the program too costly. For the
program to be truly beneficial the benefit it gives has to outweigh the costs to keep the
program going. The idea of switching the voucher system to be online sounds like it
would save a lot of money since the costs of printing paper coupons and distribution have
been eliminated but the actual switch and startup can be extremely costly to the states.
The main costs of implementation of a program like this include labor, hardware,
software, and contractor costs (VDH, 2008). An alternative many states turn to is
outsourcing the program so that the initial start up costs is lower due to not creating an
entire new program setup. When compared to the other alternative that included the on-
line redemption the use of contracting saves about $2,000,000 (VDH, 2008) These
savings more specifically fall under labor costs, materials, services, and retailer costs.
After the implementation phase operational costs will also be lowered since less training
time will be required for the outside companies. The use of e-WIC as an alternative to the
current use of paper vouches present high start up costs but in the end could save enough
costs to make the change worth it.
Policy Alternatives Have Much Potential
The potential policy alternatives discussed provide needed discussion about
possible ways to reform both SNAP and WIC, as well as discussion regarding state, local,
and non-governmental alternatives to alleviate food insecurity as well as promote healthy
eating among individuals. Both SNAP and WIC are critical as they enhance the
purchasing power of some 44 million people. However, because of the way both
programs currently operate, both policy programs are unable to fully improve the well-
being of its participants. Aligning SNAP and WIC with national public health priorities
is a matter of urgency as well as the implementation of newer state, local and non-
governmental initiatives so in order to ensure a healthier future for low-income
beneficiaries.
Chapter 5: Policy Recommendations
Incorporating EBT Technology into Farmer’s Markets
In light of the turbulent economic and political climate in which all federal
programs currently operate under, the need for streamlining and updating today’s food
assistance programs has never been more important. The aforementioned policy
alternatives, whether, incorporating EBT technology into local farmers markets or
implementing stricter vendor food requirements, we feel as a policy team are the most
economically and politically feasible in today’s food culture. Both are less burdensome
‘nudges,’ (Thaeler and Sunstein, 2008) which have the appeal of not being overtly
paternalistic but still very much capable of promoting long lasting change for the
beneficiaries as well as the community.
Implementing EBT technology throughout farmers’ markets via food assistance
programs like WIC and SNAP is one strategy that has been widely touted by other policy
analysts to attract low-income customers. In addition, this intervention has the potential
for leveraging existing federal nutrition benefits to increase access to nutritious food
resources as well as opportunities for state and local partnerships across trans-
jurisdictional boundaries.
Due to their rapid proliferation and mobile nature, farmers markets offer a
relatively new and unique way of offering easier access to nutrient dense fruits and
vegetables that are more scarce within impoverished areas. Accepting SNAP at a farmers
markets is a win-win-win situation. It gives farmers direct access to new customers, and
allows SNAP recipients easier access to healthy food, and encourages consumption of
locally-grown produce. EBT Technology helps make this exchange happen, whereby
electronic payment machines offer vendors and beneficiaries an alternative payment
method which can increase farmers markets’ sales and customer base.
Economic Feasibility and Benefits
As it stands, Farmers markets can be and are increasingly becoming certified to
accept benefits from food assistance programs such as SNAP (Shenkin and Jacobson,
2010). However, there are technological barriers that inhibit farmers markets from
interacting with and exchanging their fruits of labor with SNAP recipients. First, since
SNAP largely operates using EBT debit cards, farmers markets need the corresponding
card based transaction technology in order for an exchange to take place; many farmers
markets operate in locations that lack electricity, making EBT transactions requiring
plug-in terminals difficult (Sage, McCracken & Sage, 2013). We hypothesize that the
implementation of wireless terminals will increase SNAP redemption and overall sales at
these markets. Taking this into account, it would cost roughly to purchase and operate “a
wireless terminal for 1 year, with the farmers' market operating for 6 months, about
$1,255” (USDA Report to Congress,2010). This cost effective method would support
those farmers looking for quick transactions, but would require market organizations to
find additional staff resources to support the demands of issuing and reconciling the
tokens. (USDA Report to Congress,2010))
Farmers markets when equipped with EBT technology have the potential to
promote a myriad of positive economic change for not just the consumer but for the
farmer in question. Today, farmers markets are critical for agricultural producers and
their livelihood. These markets help smaller and mid size farms, who use these markets
as an outlet for capturing higher returns (Detre et al. 2011). Once more, Brown and Miller
(2008) shows how farmers markets account for a large amount of a farmer’s income. In
particular, Payne (2002) found that average vendor’s sales were $11,773 per year, and
28% of farmers used farmers markets as their sole marketing outlet.
Looking to the SNAP recipient, farmers markets have not only been shown to
reduce food costs for households but also to influence the affordability of healthier foods
in food deserts (Gilliand, 2009). Other indirect advantages include less expensive
produce, lower barriers to entry, and enhanced social capital and community
development in the areas where they are located (Sharp and Smith, 2003; Pitts et al.,
2014).
While there is little scholarly research about the effects of these wireless terminals
and their implementation within farmers markets, Bertmann, Vachaspati, and Buman
(2011) were able to show that sales increased significantly at farmers’ markets in Arizona
after implementation of the terminals, and that “overall sales increased above and beyond
SNAP redemption alone” (pg. 53). In addition, states including Iowa and California, as it
stands subsidize the costs of wireless terminals at their farmers’ markets aiding in the
proliferation and access towards healthy and affordable foods (Briggs, Fisher, Lott, et al.
2010). We believe that a sound policy alternative would then be to provide free or at least
partially subsidized access to these wireless terminals in order to ease access to healthful
foods for the low income population but also to bolster the economic success of farmers’
markets and their farmer stakeholders.
Political Feasibility
Arguably, farmers’ markets are not the panacea for improving diet and health.
Indeed, successful incorporation of farmers markets and EBT technology involves a
complex multi-actor commitment in order to ensure their proper upkeep and continuation.
We are however confident that while complex, the political feasibility of farmers markets
and EBT terminal technology should not be ignored but embraced by policy analysts and
stakeholders alike.
One important stakeholder to look at are the farmers that sell the literal fruits and
vegetables of their labor at these markets. In particular, farmers have expressed a positive
attitude toward central terminal model EBT programs at farmers’ markets and agree that
accepting food assistance benefits attracted new customers to the farmers market thus
expanding their customer base (Montri et al 2013).
Another stakeholder would be politicians themselves who collectively have been
shown to view farmers’ markets as “an easy and popular political symbol that signifies
commitment to communities, local food systems, and healthy eating” Farmers’ markets
are also businesses and can function as an economic engine supporting both farmer
livelihoods and community development.
Lastly, the consumers themselves of varying socioeconomic backgrounds have
been shown to purchase local farmers’ market food (Gumirakiza, Curtis & Bosworth 2014)..
Once more, while farmers’ markets have in the past been synonymous with more affluent
consumers, there are increasingly more instances where communities have successfully
brought markets to low-income neighborhoods as shown in Chapter 4. Recent reports
also show that SNAP redemption rates at markets have increased exponentially in the last
few years (Briggs, Fisher, Lott, 2010). Evidently, income or stigma associated with being
a SNAP beneficiary does not deter people from buying fresh and local produce; instead,
variables like ease, availability, and transaction costs associated with obtaining local
foods, especially in low-income areas, can deter their purchase. Such efforts to
implement the necessary EBT wireless terminal technology can simultaneously lessen
these negative variables as well as enable SNAP users to redeem their benefits and enjoy
the more healthful options at farmers markets more easily.
Encouraging Stricter Vendor Requirements
In the current shrinking fiscal environment, programs such as SNAP and WIC
need to operate more efficiently while still achieving the goals of improving access to
healthy foods among low-income individuals and families. As it stands, the USDA does
not require qualifying WIC and SNAP vendors to carry items that meet standard nutrient
criteria, or items specifically designated to be healthy within the staple categories.
Adopting the policy of stricter SNAP and WIC vendor requirements would enable it so
that whole grains and soy products, as well as modifications in types and amounts of
fruits, vegetables, milk, cheese, eggs, and juice would be provided.
In order for things to be successfully changed in the administrative context of
SNAP, there are two mechanisms (Ohri-Vachaspati, Wharton, DeWeese, & Tucker,
2011). The first is changing the policy at the state level, which does not impact the
federal requirements (Ohri-Vachaspati et. al 2011). The second mechanism is “applying
for, and receiving, a waiver related to federal SNAP rules,” (Ohri-Vachaspati, et. al,
2011, pg 7). In regards to this suggestion, we believe it would be advisable to utilize the
second mechanism. The Food and Nutrition Service under the USDA grant waivers if
the proposed change will result in more efficient administration of the program (Ohri-
Vachaspati et. al, 2011). The Food and Nutrition Service has not granted policies related
to food choice or environment, but we believe it to be a feasible route by which to create
healthier food environments (Ohri-Vachaspati et. al, 2011).
Economic Feasibility
Adopting this policy approach is economically feasible insofar that although the
long-term health and social effects of new WIC and SNAP vendor food requirements
foods may not be seen for years, these long term economic savings would be massive and
bolstered by the adoption of this policy approach. SNAP and WIC participation been
associated with an increased likelihood of being overweight and obese (Mendoza,
Drewnowski, Cheadle et al, 2006; Gibson, 2003; Gibson, 2004, Meyerhoefer and
Pylypchuk, 2008). The influx of weight among society has also been shown to put undue
stress on our healthcare system (Oster et al., 2000; Arteburn et al 2005; Olshansky et al.,
2005; Bhattacharya and Bundorf, 2009; Rosamond et al. 2008; Finkelstein et al. 2005;
Behan and Cox, 2010). When all is said and done, overweight and obese individuals have
the potential to exacerbate unemployment and shift the healthcare burden if not
adequately dealt with. Providing healthier vendor food fare is a good place to start and
has been shown to be adopted by those that have the option to do so when given the
opportunity.
Political Feasibility
Requiring stricter vendor requirements is inherently politically feasible for both
the SNAP and WIC beneficiaries as well the vendor at hand. Looking to the former, our
proposed policy alternative is less paternalistic because while the healthier options are
available to the SNAP and WIC beneficiary, they, the recipient, are by no means
obligated to opt for the healthier option. Casework has shown that when a SNAP and
WIC recipient are in a healthier environment, that they will indeed make the healthier
“default” choice. Looking to the latter, if vendors weren’t to comply with the newly
reinstated requirements, they would lose their SNAP and WIC vending eligibility and a
large amount of their customers and income. As shown in the proceeding text, most small
convenience store and grocery owners overcame any initial implementation challenges
and reported an increased sense of efficacy and can do attitude for their community with
the supply of these new healthy foods (WIC Food Package Evaluation Symposium,
2010).
A precedent is already in place for encouraging healthier food default options. For
example, approved vendors for WIC must carry a number of items considered healthy for
consumption to maintain their certification as a WIC store. In addition, under current
USDA guidelines, to be a SNAP vendor, a retail store must sell at least three varieties of
qualifying foods in each of the four staple food categories: meat, poultry, or fish; bread or
cereal; vegetables or fruit; and dairy products (USDA SNAP Store Eligibility
Requirements, 2011). However, both WIC and SNAP programs under the USDA are not
required to carry items specifically designated to be healthy within the aforesaid staple
categories (eg. wheat bread versus white bread; chocolate milk versus soy milk).
Requiring SNAP vendors to carry healthier options will improve the food environment
but also the community at large. Currently, municipalities and states are taking on the
challenge of implementing stricter vendor eligibility requirements. New York, Texas,
California, Illinois, Wisconsin, New Hampshire, and Pennsylvania have shown that not
only are vendors quick to make the change, but that they are happy to make the change.
Looking to the SNAP and WIC consumer, they are indeed purchasing things like more
fruits and vegetables, brown rice, whole grain bread, and lower in fat dairy products. In
addition, women are opting to breast feed rather than supplement with baby formula
(WIC Food Package Evaluation Symposium, 2010; Nord, Andrews, Collin 2009).
Conclusions
Our research and study concerning food and nutrition policy has allowed for us to
adequately understand, evaluate and produce recommendations for the future of this
particular policy area. As aforementioned, food insecurity exists when people have
insufficient economic and physical access to safe and nutritious food to meet both their
dietary needs and access to a healthy life. We understand that food insecurity is an issue
that comes out of an economic disadvantage, a private market failure and that the private
market is unable or ill equipped to handle issues of equity and distribution; thus the
public market has had to intervene in order to protect its citizens against the dangers and
the threat of food insecurity. The private market has proven itself to be an efficient outlet
for allocating various resources, however unlike the public market, it lacks in being able
to ensure distributional equity, as certain groups within the political economy are unable
to provide for themselves. It is the duty of government to protect its citizens from this
private market failure in order to ensure that all citizens have equal and fair access to
food, for without it, government would not be completing its job of protecting its
citizens. The interests of the public would not be honored and as a result, government
would fail in its mission to protect its citizens. As citizens and consumers we are entitled
to our wants, needs and demands being met, for it is the duty of government to do so.
Viewing food and nutrition policy from a historical context has allowed for us to
evaluate the policy and programs from a historical context, assessing the attitudes,
policies and programs that have come as a result of the initial problem recognition. Public
policy is a purposive decision, a path, a practice. Since its inception, food and nutrition
policy has evolved and shifted, adequately responding to changing social, economic and
political conditions. Its focus has transformed dramatically, as policy has shifted its
focus and landscape, originally concerning itself with access and opportunity, to now
recognizing the importance and the need for quality food. While currently 14 percent of
Americans continue to suffer from food insecurity, it is important to note and understand
that 86 percent of US households are food secure. We have made significant strides in
eliminating this issue as we have proven that both SNAP and WIC are effective in being
able to adequately solve the food insecurity crisis, however through study and analysis
we understand that there is still work to accomplish. Our analysis has led us to our policy
alternatives, which only seek to enhance policy and programs that currently exist. By
further developing and marginally expanding scope and eligibility, we believe our
recommendations has the critical components of political and economic feasibility.
As said by Dan Glickman, Chairman of Food Research and Action Center: “it is
worth noting that the US has the most extensive anti-hunger and government supported
nutrition and feeding programs in the world—which is certainly not a bad legacy for our
country,” (2012). Food and nutrition policy is vital to the well-being and safety of our
nation for without access to quality food we as a nation would cease to exist. We hope
that our policy recommendations, and those to come in the future, are taken seriously, so
that the threat of food insecurity is addressed and related policies are consistently and
effectively guided to protect the economy and citizens of our nation.
References
Ahern, M., Brown, C., & Dukas, S. (2011). A National Study of the Association Between Food Environments and County-‐‑Level Health Outcomes. The Journal of Rural Health, 27(4), 367-379.
Armstrong, D. (2000). A survey of community gardens in upstate New York: Implications for health promotion and community development. Health & Place,6(4), 319-327.
Arterburn, D. E., M. L. Maciejewski, and J. Tsevat. 2005. Impact of morbid obesity on medical expenditures in adults. International Journal of Obesity 29(3):334–339.
Barrett, C. B. (2010). Measuring food insecurity. Science, 327(5967), 825-828. Barrington, V., (2011). Baltimore’s Can-Do Approach to Food Justice,
GRISThttp://grist.org/urban-agriculture/2011-11-21-baltimores-can-do-approach-tofood-justice
Baum, C. (2012). The effects of food stamp receipt on weight gained by expectant mothers. Journal Of Population Economics, 25(4), 1307-1340. doi:10.1007/s00148-011-0391-7
Behan D, Cox S. Obesity and its Relation to Mortality and Morbidity Costs. Society of Actuaries 2010.
Bertmann, F. M., Ohri-Vachaspati, P., Buman, M. P., & Wharton, C. M. (2012). Implementation of Wireless Terminals at Farmers' Markets: Impact on SNAP Redemption and Overall Sales. American Journal Of Public Health,102(7), e53-e55. doi:10.2105/AJPH.2012.300727
Bhargava, A. (2004). Socio-economic and behavioural factors are predictors of food use in the National Food Stamp Program Survey. British Journal of Nutrition, 92(03), 497-506.
Bhattacharya, Jay, and M. Kate Bundorf. 2009. The incidence of the health care costs of obesity. Journal of Health Economics 28(3):649–658.
Bitler, M. P., & Currie, J. (2005). Does WIC work? The effects of WIC on pregnancy and birth outcomes. Journal of Policy Analysis and Management, 1, 73-91. doi:10.1002/pam.20070
Black, S. E., Devereux, P. J., & Salvanes, K. (2005). From the cradle to the labor
market? The effect of birth weight on adult outcomes (No. w11796). National Bureau of Economic Research.
Borders, A., Grobman, W., Amsden, L., McDade, T., Sharp, L., & Holl, J. (2010). The relationship between self-report and biomarkers of stress in low-income reproductive-age women. American Journal of Obstetrics Gynecology, 203(6), 1-577. Retrieved from http://www.ajog.org/article/S0002-9378(10)00980-4/abstract
Briggs, S.; Fisher, A.; Lott, M; Miller, S.; and Tessman, N. (2010). Real food, real
choice: Connecting SNAP recipients with farmers’ markets. Community Food Security Coalition. Portland, OR.
Broad Leib, E. M. (2013). All (Food) Politics is Local: Increasing Food Access Through Local Government Action. Harvard Law & Policy Review, 7(321).
Brown, C., and S. Miller. 2008. The Impacts of Local Markets: A Review of Research on Farmers markets and Community Supported Agriculture (CSA). American Journal of Agricultural Economics 90(5): 1296-1302
Burney, J., & Haughton, B. (2002). EFNEP: a nutrition education program that demonstrates cost-benefit. Journal of the American Dietetic Association, 102(1), 39-45.
Buttenheim, A. M., Havassy, J., Fang, M., Glyn, J., & Karpyn, A. E. (2012). Increasing Supplemental Nutrition Assistance Program/Electronic Benefits Transfer Sales at Farmers' Markets with Vendor-Operated Wireless Point- of-Sale Terminals. Journal Of The Academy Of Nutrition & Dietetics, 112(5), 636-641. doi:10.1016/j.jand.2011.12.021
Caswell, J.A. & Yaktine, A.L. (2013). Supplemental Nutrition Assistance Program: Examining the Evidence to Define Benefit Adequacy. Washington (DC): National Academies Press. Retrieved from http://www.ncbi.nlm.nih.gov/books/NBK206907/
Cawley, J., (2004). The impact of obesity on wages. J. Hum. Resour. 39 (2), 451–474. Centers for Disease Control and Prevention. (2011). Strategies to Prevent Obesity and
Other Chronic Diseases: The CDC Guide to Strategies to Increase the Consumption of Fruits and Vegetables. Atlanta: U.S. Department of Health and Human Services
Cole, K., McNees, M., Kinney, K., Fisher, K., & Krieger, J. W. (2013). Peer Reviewed:
Increasing Access to Farmers Markets for Beneficiaries of Nutrition Assistance: Evaluation of the Farmers Market Access Project. Preventing chronic disease, 10.
Currie, J. (2003). US food and nutrition programs. In Means-tested transfer programs in the United States (pp. 199-290). University of Chicago Press.
Cutler, D. M., & Lleras-Muney, A. (2006). Education and health: evaluating theories
and evidence (No. w12352). National Bureau of Economic Research. Detre, J., T. B. Mark, A. M. Mishra, and A. Adhiraki. 2011. Linkage between Direct
Marketing and Farm Income: A Double-Hurdle Approach. Agribusiness 27(1): 19–33.
Director, A. (2001). Food Assistance and Welfare Reform. Food Review, 24(1). Dover, S., Dybsetter, A., & Harden, N. (2014, August 1). Statewide Food Policy
Councils: Considerations for Minnesota Policymakers. Retrieved March 14, 2015, from https://www.foodpolicy.umn.edu/sites/foodpolicy.umn.edu/files/statewide-food-policy-councils.pdf
Epstein, L. H., Dearing, K. K., Roba, L. G., & Finkelstein, E. (2010). The influence of taxes and subsidies on energy purchased in an experimental purchasing study. Psychological Science, 21(3), 406-414.
Epstein, L. H., Handley, E. A., Dearing, K. K., Cho, D. D., Roemmich, J. N., Paluch, R. A et al. (2006). Purchases of Food in Youth Influence of Price and Income. Psychological Science, 17(1), 82-89.
Epstein, L. H., Jankowiak, N., Nederkoorn, C., Raynor, H. A., French, S. A., & Finkelstein, E. (2012). Experimental research on the relation between food price changes and food-purchasing patterns: a targeted review. The American journal of clinical nutrition, 95(4), 789-809.
Federal Register. Executive orders disposition tables: John F. Kennedy – 1961. Washington, D.C.:The National Archives. Retrieved from http://www.archives.gov/federal-register/executive-orders/1961-kennedy.html
Finkelstein EA, Trogdon JG, Cohen JW, Dietz W. Annual medical spending attributable to obesity: payer-and service-specific estimates. Health Aff (Millwood) 2009;28(5):w822-31.
Finkelstein, Eric A., C. J. Ruhm, and K. M. Kosa. 2005. Economic causes and conse- quences of obesity. Annual Review of Public Health 26:239–257.
Fleeter, H. (2014). 2007-2013 Hunger Factors Index. Ohio Association of Foodbanks. Food Research Action Center. (2010). SNAP/Food Stamp Historic Trends: 1998-2010.
Retrieved from http://frac.org/federal-foodnutrition-programs/snapfood-stamps/historic-trends-1998-2008/
Food Research and Action Center (FRAC). (2010). SNAP/Food Stamps. Retrieved from
http://frac.org/federal-foodnutrition-programs/snapfood-stamps/ Ford, E.S., Merritt, R.K., Heath, G.W., Powell, K.E., Washburn, R.A., Kriska, A., Haile,
G., 1991. Physical activity behaviors in lower and higher socioeconomic status populations. American J. Epidemiology 133 (12), 1246± 1256.
Fox, M. K., and Cole, N. (2004). Nutrition and Health Characteristics of Low-Income Population. Volume 1, Food Stamp Program Participants and Nonparticipants. Washington, DC: U.S. Department of Agriculture, Economic Research Service
Gibson D. Food stamp program participation is positively related to obesity in low income women. J Nutr 2003;133(7):2225-31. 24.
Glickman, D. (2012, Oct 1). The SNAP program: A review and history. The Aspen Institute. Retrieved from http://www.aspeninstitute.org/about/blog/snap-program-review-history
Goldberg, R. L. (2013). No such thing as a free lunch: paternalism, poverty, and food
justice. Stanford Law & Policy Review, 24(1), 35-98. Retrieved from http://proxy.lib.miamioh.edu/login?url=http://search.ebscohost.com/login.aspx?direct=true&db=a9h&AN=88954105&scope=site
Goodridge E. & DeParle J. (2012, February 11). A History of Food Stamps Use and Policy. The New York Times. Retrieved from http://www.nytimes.com/interactive/2010/02/11/us/FOODSTAMPS.html?_r=0
Gumirakiza, J. D., Curtis, K. R., & Bosworth, R. (2014). Who Attends Farmers’ Markets
and Why? Understanding Consumers and their Motivations.International Food and Agribusiness Management Review, 17(2), 65.
Gunderson, G.W. (2014). National School Lunch Program (NSLP): Child Nutrition Act
of 1966. Washington, D.C.: United States Department of Agriculture, Food and Nutrition Service. Retrieved from http://www.fns.usda.gov/nslp/history_6
Hanson, K., Oliveira, V. (2012, September). How economic conditions affect participation in USDA nutrition assistance programs. Economic Information Bulletin No. (EIB-100). Washington, D.C.: U.S. Department of Agriculture Economic Research Service. Retrieved from http://www.ers.usda.gov/publications/eib-economic-information-bulletin/eib100.aspx
Harden, N. M., Ashwood, L. L., Bland, W. L., & Bell, M. M. (2013). For the public good: Weaving a multifunctional landscape in the corn belt. Agriculture and Human Values 30(4), 525-537.
Harper, A., Shattuck, A., Holt-Giménez, E., Alkon, A., & Lambrick, F. (2009). Food policy councils: Lessons learned. Institute for Food and Development Policy, 1-63.
Hood C., M. P. A., Martinez-Donate, A., & Meinen, A. (2012). Promoting healthy food consumption: a review of state-level policies to improve access to fruits and vegetables. WMJ, 111(6), 283-6.
Jackson, M. I. (2015). Early childhood WIC participation, cognitive development and
academic achievement. Social Science & Medicine, 126, 145-153. doi:10.1016/j.socscimed.2014.12.018
Johnson, D. B., Cheadle, A., Podrabsky, M., Quinn, E., MacDougall, E., Cechovic, K., ... & Allen, D. (2013). Advancing nutrition and obesity policy through cross-sector collaboration: The local farms–healthy kids initiative in Washington state. Journal of Hunger & Environmental Nutrition, 8(2), 171-186.
Jones, R. (2014). Increase Sales In A SNAP. American Vegetable Grower, 62(9), 18-19. Kantor, L. S. (2001). Community food security programs improve food access.FOOD
REVIEW-WASHINGTON DC-, 24(1), 20-26. Kennelly, M. E., Neff R., & Rutkow L., (2013). Strengthening Vendor Standards in the
Supplemental Nutrition Assistance Program: Are Healthier Foods Within Reach?, 16 J. HealthCare L. & Pol'y 141 Available at:http://digitalcommons.law.umaryland.edu/jhclp/vol16/iss1/6
Landers, P. S. (2007). The Food Stamp Program: History, Nutrition Education, and Impact. Journal Of The American Dietetic Association, 107(11), 1945- 1951. doi:10.1016/j.jada.2007.08.009
Lin, B. H. (2005). Diet quality usually varies by income status. Amber Waves. LIN, B. H., Yen, S. T., Dong, D., & Smallwood, D. M. (2010). Economic incentives for
dietary improvement among food stamp recipients. Contemporary Economic Policy, 28(4), 524-536.
Lin, B., Ver Ploeg, M., Kasteridis, P., & Yen, S. T. (2014). The roles of food prices and food access in determining food purchases of low-income households. Journal Of Policy Modeling, 36(5), 938-952. doi:10.1016/j.jpolmod.2014.07.002
Lobstein, T., Baur, L., & Uauy, R. (2004). Obesity in children and young people: a crisis
in public health. Obesity reviews, 5(s1), 4-85. MacDonald, Maurice. Food, Stamps and Income Maintenance. Institute for Research on
Poverty. Academic Press, New York, NY. 1977. Martinez, S. (2010). Local food systems; concepts, impacts, and issues. Diane Publishing.
Mary E. Kennelly, Roni Neff, & Lainie Rutkow, Strengthening Vendor Standards in the
Supplemental Nutrition Assistance Program: Are Healthier Foods Within Reach?, 16 J. Health Care L. & Pol'y 141 (2013).
Meltzner, A. J. (1972). Political Feasibility and Policy Analysis. Public Administration Review, 32(6): 859-867.
Mendoza JA, Drewnowski A, Cheadle A, Christakis DA. Dietary energy density is associated with selected predictors of obesity in U.S. Children. J Nutr 2006;136(5):1318-22.
Meyerhoefer C, Pylypchuk Y. Does participation in the food stamp program increase the prevalence of obesity and health care spending? American Journal Agricultural Economics 2008;90(2):287-305.
Meyerhoefer C, Pylypchuk Y. Does participation in the food stamp program increase the
prevalence of obesity and health care spending? American Journal Agricultural Economics 2008;90(2):287-305. 28.
Montri, D. N., Behe, B. K., & Chung, K. (2013). Using a Case Approach to Assess
Farmers’ Attitudes Regarding Central Terminal Model Electronic Benefits Transfer (EBT) Programs at Selected Michigan Farmers Markets.HortTechnology, 23(1), 38-43.
Moran, R. L. (2011). Consuming Relief: Food Stamps and the New Welfare of the New Deal. Journal Of American History, 97(4), 1001-1022. doi:10.1093/jahist/jaq067
Morgenstern, J., Blanchard, K. A., McCrady, B. S., McVeigh, K. H., Morgan, T. J., & Pandina, R. J. (2006). Effectiveness of intensive case management for substance-dependent women receiving temporary assistance for needy families. American Journal of Public Health, 96(11), 2016-2023.
National Conference of State Legislatures (2014). http://www.ncsl.org/issues-research. aspx.
National WIC Association. (n.d.). WIC Program Overview and History. Retrieved from
https://www.nwica.org/overview-and-history Nguyen, B. T., Shuval, K., Njike, V. Y., & Katz, D. L. (2014). The Supplemental
Nutrition Assistance Program and dietary quality among US adults: findings from a nationally representative survey. Mayo Clinic Proceedings, 89(9), 1211-1219. doi:10.1016/j.mayocp.2014.05.010
Nord M, Andrews M, Carlson S. (2009). Household Food Security in the United States. Economic Research Service
Office of Research and Analysis (2012) Building a Healthy America: A profile of the Supplemental Nutrition Assistance Program. United States Department of Agriculture.
Ohri-Vachaspati, P., Wharton, R. C., DeWeese, R., & Tucker, W. (2011). Policy Considerations for Improving the Supplemetal Nutrition Assistance Program: Making a Case for Decreasing the Burden of Obesity.
Oliveira, V. (2014, February). Food assistance landscape: FY 2013 annual report. (EIB-120). Washington, D.C.: U.S. Department of Agriculture, Economic Research
Service. Retrieved from www.ers.usda.gov/publications/eib-economic-information-bulletin/eib-120.aspx
Oliveira, V., & Frazao, E. (2009). The WIC Program: Background, Trends, and Economic Issues, 2009 Edition. Economic Research Report Number 73. US Department of Agriculture.
Oliveira, V., & Frazao, E. (2015). The WIC Program: Background, Trends, and Economic Issues, 2015 Edition. Economic Information Bulletin Number 134. United States Department of Agriculture.
Oliveira, V., Racine, E., Olmsted, J., & Ghelfi, L. M. (2002). The WIC Program: Background, trends, and issues (No. 33847). United States Department of Agriculture, Economic Research Service.
Olshansky, S. Jay, Douglas J. Passaro, Ronald C. Hershow, Jennifer Layden, Bruce A.
Carnes, Jacob Brody, Leonard Hayflick, Robert N. Butler, David B. Allison, and David S. Ludwig. (2005). A potential decline in life expectancy in the United States in the 21st century. New England Journal of Medicine 352(11):1138–1145
Oster, G., J. Edelsberg, A. K. O’Sullivan, and D. Thompson. 2000. The clinical and economic burden of obesity in a managed care setting. American Journal of Managed Care 6(6):681–689.
Owen, A. L., & Owen, G. M. (1997). Twenty years of WIC: A review of some effects of the program. Journal Of The American Dietetic Association, 97(7), 777.
Partners for a Hunger-Free Oregon. (2015). History of food stamps and SNAP. Retrieved from https://oregonhunger.org/history-food-stamps-and-snap
Petrou, S., Sach, T., & Davidson, L. (2001). The long-term costs of preterm birth and low
birth weight: Results of a systematic review. Child: Care, Health and Development Child Care Health Dev, 27(2), 97-115.
Payne, Tim. (2002). U.S. Farmers Markets – 2000: A Study of Emerging Trends. United
States Department of Agriculture: Marketing and Regulatory Programs, Agricultural Marketing Service, Transportation and Marketing Programs, Marketing Services Branch.
Pilkauskas, N. V., Currie, J. M., & Garfinkel, I. (2012). The Great Recession, Public Transfers, and Material Hardship. Social Service Review, 86(3), 401-427. Retrieved from http://proxy.lib.miamioh.edu/login?url=http://search.ebscohost.com/login.aspx?direct=true&db=a9h&AN=82571651&scope=site
Pitts, S. B. J., Gustafson, A., Wu, Q., Mayo, M. L., Ward, R. K., McGuirt, J. T., ... &
Ammerman, A. S. (2014). Farmers’ market use is associated with fruit and vegetable consumption in diverse southern rural communities. Nutrition journal, 13(1), 1.
Poppendieck, Janet. Breadlines Knee Deep in Wheat: Food Assistance in the Great Depression. Rutgers University Press, New Brunswick, NJ. 1986.
Press Release, Mayor’s Office, Mayor Menino Announces New Food Trucks Set to Serve Up Tasty Treats on Boston’s Streets
Ralston, K., Newman, C., Clauson, A., Guthrie, J., & Buzby, J. (2008). The National School Lunch Program: Background, Trends, and Issues. Economic Research Report Number 61. US Department of Agriculture
Ratcliffe, C., McKernan, S. M., & Zhang, S. (2011). How much does the Supplemental Nutrition Assistance Program reduce food insecurity?. American Journal of Agricultural Economics
Rector, R. & Sheffield R. (2014, September 15). The War on Poverty After 50 Years. The Heritage Foundation. Retrieved from http://www.heritage.org/research/reports/2014/09/the-war-on-poverty-after-50-years
Richards, M. R., & Sindelar, J. L. (2013). Rewarding healthy food choices in SNAP:
behavioral economic applications. Milbank Quarterly, 91(2), 395-412. Richardson, J. (1979). A Concise History of the Food Stamp Program. Retrieved from
http://digital.library.unt.edu/ark:/67531/metacrs8857/m1/1/high_res_d/79-244EPW_1979Nov16.pdf
Rosamond, W., K. Flegal, K. Furie, A. Go, K. Greenlund, N. Haase, S. M. Hailpern, M. Ho, V. Howard, B. Kissela, S. Kittner, D. Lloyd-Jones, M. McDermott, J. Meigs, C. Moy, G. Nichol, C. O’Donnell, V. Roger, P. Sorlie, J. Steinberger, T. Thom, M. Wil- son, and Y. Hong. 2008. Heart disease and stroke statistics – 2008 update: a report from the American Heart Association Statistics Committee and Stroke Statistics Sub- committee. Circulation 117(4):e25–146.
Rosenbaum, D. (2013, Jan 13). The Relationship Between SNAP and Work Among Low-Income Households. Center on Budget and Policy Priorities. Retrieved from http://www.cbpp.org/files/1-29-13fa.pdf
Rosenbaum, D. (2013, March 11). SNAP is Effective and Efficient. Center on Budget
and Policy Priorities. Retrieved from http://www.cbpp.org/research/snap-is-effective-and-efficient
Rosenfeld, S. (2010). Fed by Reform: Congressional Politics, Partisan Change, and the
Food Stamp Program, 1961-1981. Journal Of Policy History, 22(4), 474-507. doi:10.1017/S0898030610000230
Roth, D. (2006). Food Stamps, 1932-1977: From Provisional and Pilot Programs to Permanent Policy. Rural Information Center, National Agricultural Library.
Rush, D., Leighton, J., Sloan, N. L., Alvir, J. M., Horvitz, D. G., Seaver, W.B.,& Devore, J. W. (1988). The National WIC Evaluation: evaluation of the Special Supplemental Food Program for Women, Infants, and Children. VI. Study of infants and children. The American journal of clinical nutrition, 48(2), 484-511.
Sage, J. L., McCracken, V. A., & Sage, R. A. (2013). Bridging the Gap: Do Farmers’
Markets Help Alleviate Impacts of Food Deserts?. American Journal of Agricultural Economics, aat031.
Sen, A. (1983). Poverty and famines: an essay on entitlement and deprivation. Oxford University Press.
Sharp, J., Smith, M., 2003. Social capital and farming at the rural-urban interface: the importance of nonfarmer and farmer relations. Agricultural Systems 76 (3), 913-927
Shenkin, J. D., & Jacobson, M. F. (2010). Using the Food Stamp Program and other
methods to promote healthy diets for low-income consumers. American Journal of Public Health, 100(9), 1562.
Snap to Health. (2011). SNAP: The history of SNAP. Retrieved from http://www.snaptohealth.org/snap/the-history-of-snap/
Thaler, R. H., & Sunstein, C. R. (2008). Nudge. Yale University Press. The Urban Institute. (2014). SNAP Legislative History. The Safety Net Almanac.
Retrieved from http://www.urban.org/safety-net-almanac/snap/legislative-history.cfm
U.S. Department of Agriculture, Agricultural Marketing Service. Farmers market growth:
1994–2011. U.S. Department of Agriculture; 2009. Available at http://www.ams.usda.gov/ AMSv1.0/FARMERSMARKETS.
U.S. Department of Agriculture, Food & Nutrition Service. Senior Farmers’ Market Nutrition Program. U.S. Department of Agriculture; 2009. Available at http://www.fns. usda.gov/wic/SeniorFMNP/SFMNPmenu.htm.
U.S. Department of Agriculture, Food & Nutrition Service. Supplemental Nutrition
Assistance Program. 2014 Available at http://www.fns.usda.gov/snap. U.S. Department of Agriculture, Food & Nutrition Service (2009). WIC Farmers’ Market
Nutrition Program. U.S. Department of Agriculture. Available at http://www.fns. usda.gov/WIC/FMNP/FMNPfaqs.htm.
US Department of Agriculture, (2010). Food and Nutrition Service. Supplemental
Nutrition Assistance Program. Feasibility of Implementing Electronic Benefit Transfer System in Farmers’ Markets. Report to Congress. http://www.fns.usda.gov/ snap/ebt/pdfs/Kohl—Feasibility.pdf
U.S. Department of Agriculture. (2012). Building a healthy America: A profile of the Supplemental Nutrition Assistance Program. Washington, D.C.: Food and Nutrition Service. Retrieved from file:///C:/Users/Paige/Downloads/Profile%20of%20SNAP-FNS.pdf
U.S. Department of Agriculture. (2014). A Short History of SNAP. Washington DC: U.S. Department of Agriculture, Food and Nutrition Service. Retrieved from http://www.fns.usda.gov/snap/short-history-snap
U.S. Department of Agriculture. (2014). Definitions of food security. Retrieved from
http://www.ers.usda.gov/topics/food-nutrition-assistance/food-security-in-the-us/definitions-of-food-security.aspx
U.S. Department of Agriculture. (2014). Supplemental Nutrition Assistance Program
legislation timeline. Washington DC; U.S. Department of Agriculture, Food and Nutrition Service Retrieved from http://www.fns.usda.gov/snap/legislation
U.S. Department of Agriculture. (2014). Supplemental Nutrition Assistance Program (SNAP): A Short History of SNAP. Retrieved from http://www.fns.usda.gov/snap/short-history-snap
U.S. Department of Agriculture. (2014). WIC -- The Special Supplemental Nutrition
Program for Women, Infants, and Children. Nutrition Program Facts. Washington, D.C.: Food and Nutrition Service. Retrieved from http://www.fns.usda.gov/sites/default/files/WIC-Fact-Sheet.pdf
U.S. Department of Agriculture. (2014, April 11). Agricultural Act of 2014 highlights
and implications: Nutrition. Retrieved from http://www.ers.usda.gov/agricultural-act-of-2014-highlights-and-implications/nutrition.aspx
U.S. Department of Agriculture. (2014, March). 2014 Farm Bill Highlights. Retrieved from http://www.usda.gov/documents/usda-2014-farm-bill-highlights.pdf
U.S. Department of Agriculture. (2015). EBT: General Electronic Benefit Transfer (EBT) Information. Retrieved from http://www.fns.usda.gov/ebt/general-electronic-benefit-transfer-ebt-information
U.S. Department of Agriculture. (2015, Feb 6). USDA FY 2016 budget highlights.
Retrieved from http://www.obpa.usda.gov/budsum/2016budgethighlights.pdf U.S. Department of Agriculture. (2015, Jan 12). Key Statistics & Graphics. Retrieved
from http://www.ers.usda.gov/topics/food-nutrition-assistance/food-security-in-the-us/key-statistics-graphics.aspx
U.S. Department of Agriculture. (2015, March 11). Food security in the U.S.: Overview. Retrieved from http://www.ers.usda.gov/topics/food-nutrition-assistance/food-security-in-the-us.aspx
U.S. Department of Agriculture. Electronic Benefits Transfer (EBT). Retrieved from
http://www.fns.usda.gov/apd/electronic-benefits-transfer-ebt USDA (1964, August 31) The Food Stamp Act of 1964. Retrieved from
http://www.fns.usda.gov/sites/default/files/PL_88-525.pdf USDA SNAP Store Eligibility Requirements. 2011. (Accessed at
http://www.fns.usda.gov/snap/retailers/store-eligibility.htm.) Weaver, R. D., & Hackman, R. L. (2009). A New Era for Legal Immigrants?: Rethinking
Title IV of The Personal Responsibility and Work Opportunity Reconciliation Act. Journal Of Policy Practice, 8(1), 54-68. doi:10.1080/15588740802282490
Wegener J, Manning R. and Raine K. (2012). Generating change: Multisectoral
perspectives of key facilitators and barriers to food system policy making. Journal of Hunger and Environmental Nutrition 7 (2-3): 137-148
Wegener, J., Raine, K. D., & Hanning, R. M. (2012). Insights into the Government’s
Role in Food System Policy Making: Improving Access to Healthy, Local Food Alongside Other Priorities. International journal of environmental research and public health, 9(11), 4103-4121.
Weimer, D.L. & Vining, A.R. (2011). Policy Analysis. (5th Ed.). London, UK: Pearson.
What We Do: With Supermarkets, FOOD TRUST (last visited May 23, 2013), http:// thefoodtrust.org/what-we-do/supermarkets
WIC Food Package Evaluation Symposium. In; 2010; Washington, DC; 2010. Wyker, Brett A.; Jordan, Patricia; Quigley, Danielle L. Journal of Nutrition Education
and Behavior vol. 44 issue 4 July - August, 2012. p. 360-364 Yen, S. T. (2010). The Effects of SNAP and WIC Programs on Nutrient Intakes of
Children. Food Policy, 35(6), 576-583. Zedlewski, S., Waxman, E., & Gundersen, C. (2012, Jul 12). SNAP’s Role in the Great
Recession and Beyond. The Urban Institute. Retrieved from http://www.urban.org/research/publication/snaps-role-great-recession-and-beyond
Zodrow, D. S. (2005). Food Security Begins at Home: Creating community food
coalitions in the south 51.