Pointing Stability of Hinode and Requirements for SOLAR-C ... · Pointing Stability of Hinode and...
56
Pointing Stability of Hinode and Requirements for SOLAR-C (Option-B) Y. Masada, Y. Katsukawa (NAOJ)、 Solar-C Science Definition Meeting 2 @ISAS/JAXA, 2010, March 10 T. Shimizu (ISAS/JAXA), K. Ichimoto (Kyoto U.)
Transcript of Pointing Stability of Hinode and Requirements for SOLAR-C ... · Pointing Stability of Hinode and...

Pointing Stability of Hinode and Requirements for SOLAR-C (Option-B)
Y. Masada, Y. Katsukawa (NAOJ)、
Solar-C Science Definition Meeting 2 @ISAS/JAXA, 2010, March 10
T. Shimizu (ISAS/JAXA), K. Ichimoto (Kyoto U.)

Contents:1. Analysis on jitter ambient in the telemetry data of UFSS and IRU [low frequency regime (10-4 Hz < f < 10-1 Hz)]2. Analysis on the jitter ambient from SOT with CT servo on/off [high frequency regime (10-2 Hz < f < 200 Hz)]
3. Requirements for Solar-C V.S. Performance of Hinode on-orbit
Purpose:
- Identify major sources for disturbances
Report “on-orbit” performance of image stabilizing
- Raise Issues in realizing Solar-C (Option-B)
Toward next Solar-C satellite with higher pointing-stability,
system on-board Hinode satellite
- Asses the achievement of Hinode Satellite

UFSS-ACT
IRU-A
IRU-B1
UFSS-B
Y
XZ
Image Stabilizing System on-board Hinode Position Control Sensors and Correlation Tracker on board Hinode
・Ultra Fine Sun Sensor [UFSS (-A,-B)], (10-5 Hz < f < 10-1 Hz)・Inertia Reference Unit [IRU (-A, -B1)], (10-2 Hz < f < 10-1 Hz)・Correlation Tracker [SOT/CT], (10-2 Hz < f < 290 Hz)
IRU-A : FRIG floated rate integrating ※)
IRU-B1: TDG tuned dry gyro (made by MPC)
gyro (made by JAE)
・Specify the dominant disturbances in the jitter by Fourier Analysis ・Evaluate the amplitude of major disturbances (= Pointing Error)
1. Diagnostic data of UFSS/IRU

Time Profile: Telemetry data of UFSS and IRU
Start Time (20-Apr-09 08:41:05)
00:00 02:00 04:00 06:00Start Time (17-Dec-07 22:41:03)
10:00 12:00 14:00 16:00
3
2
1
0
-1
-2
-3
20
10
0
-10
-20
UFSS-A+B
IRU-A
Amplitude (arcsec)
Amplitude (arcsec)
X-axisY-axis
Y
X
Z
X-axisY-axis
orbital modulations
5x10⁻³ Hz = 200 sec
0.1 Hz
Y-axis
X-axis
UFSS-A UFSS-B
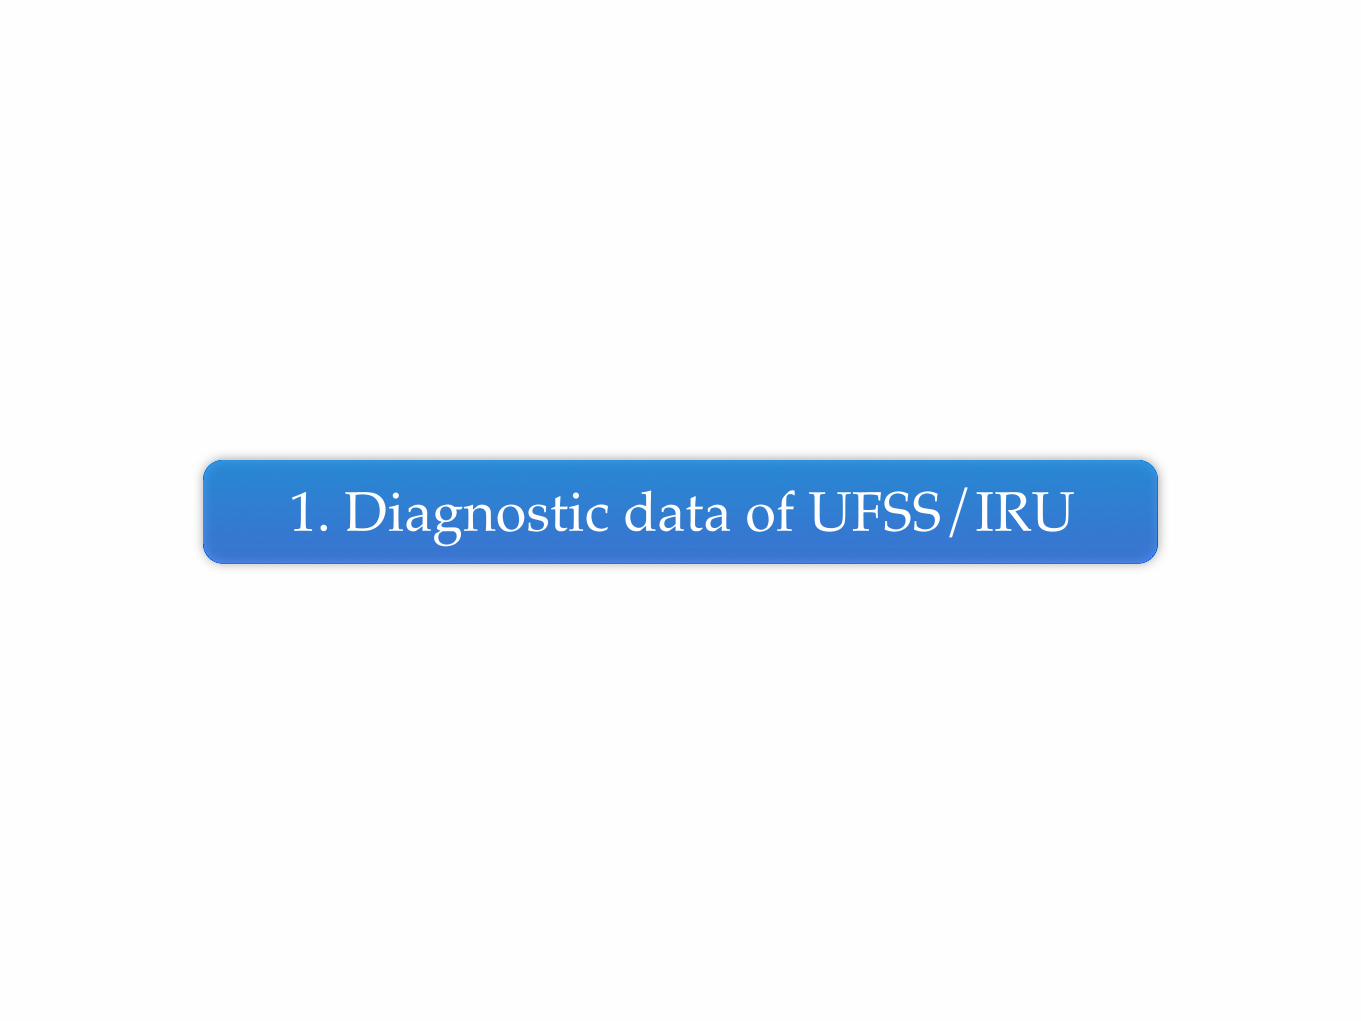
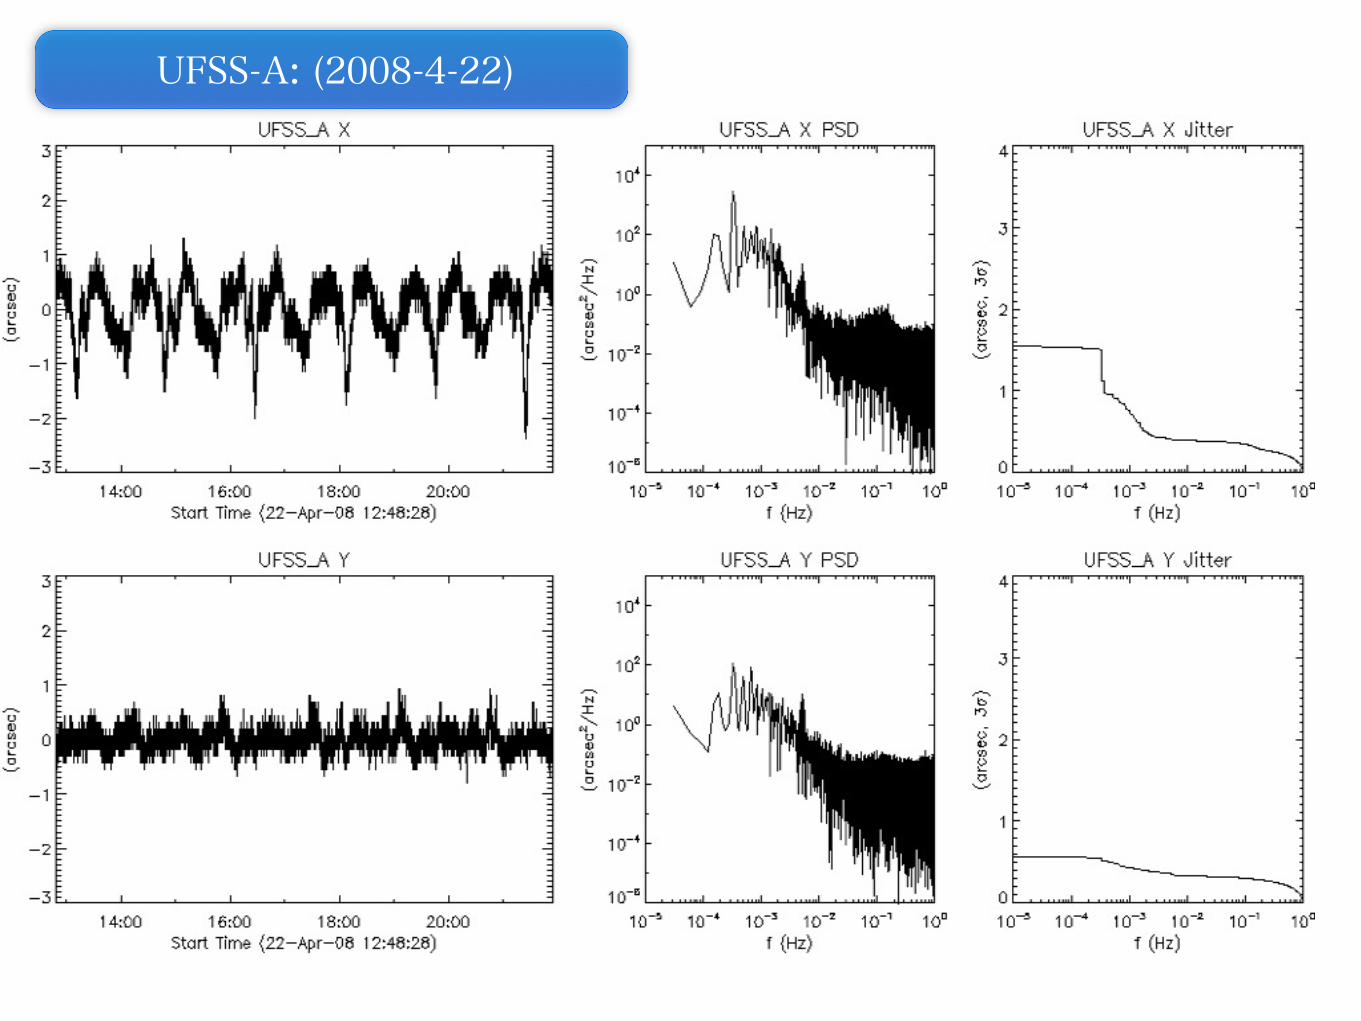
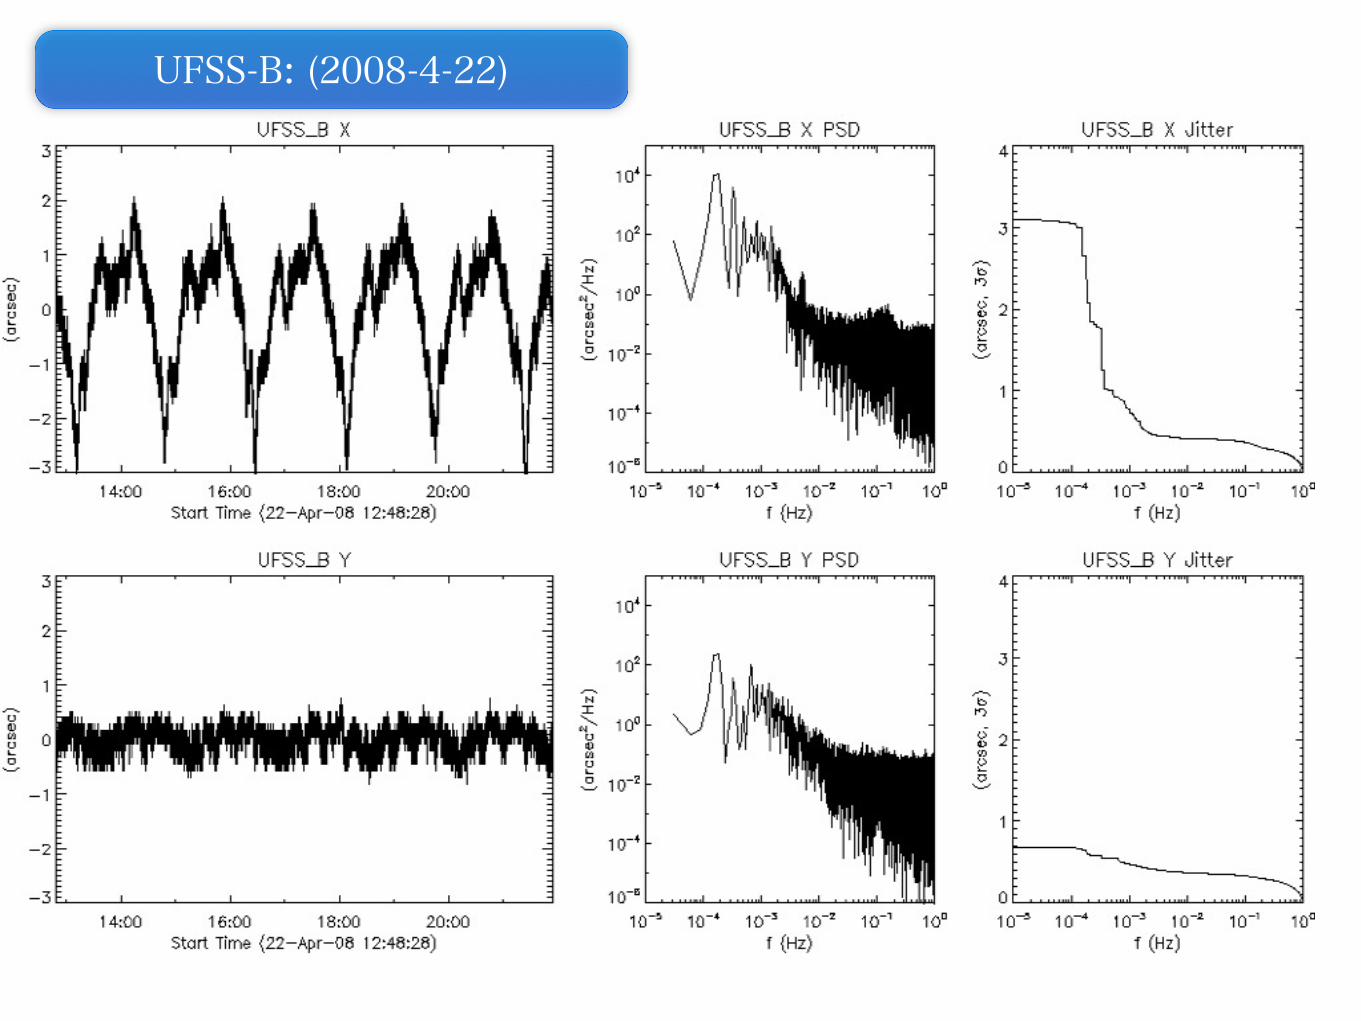
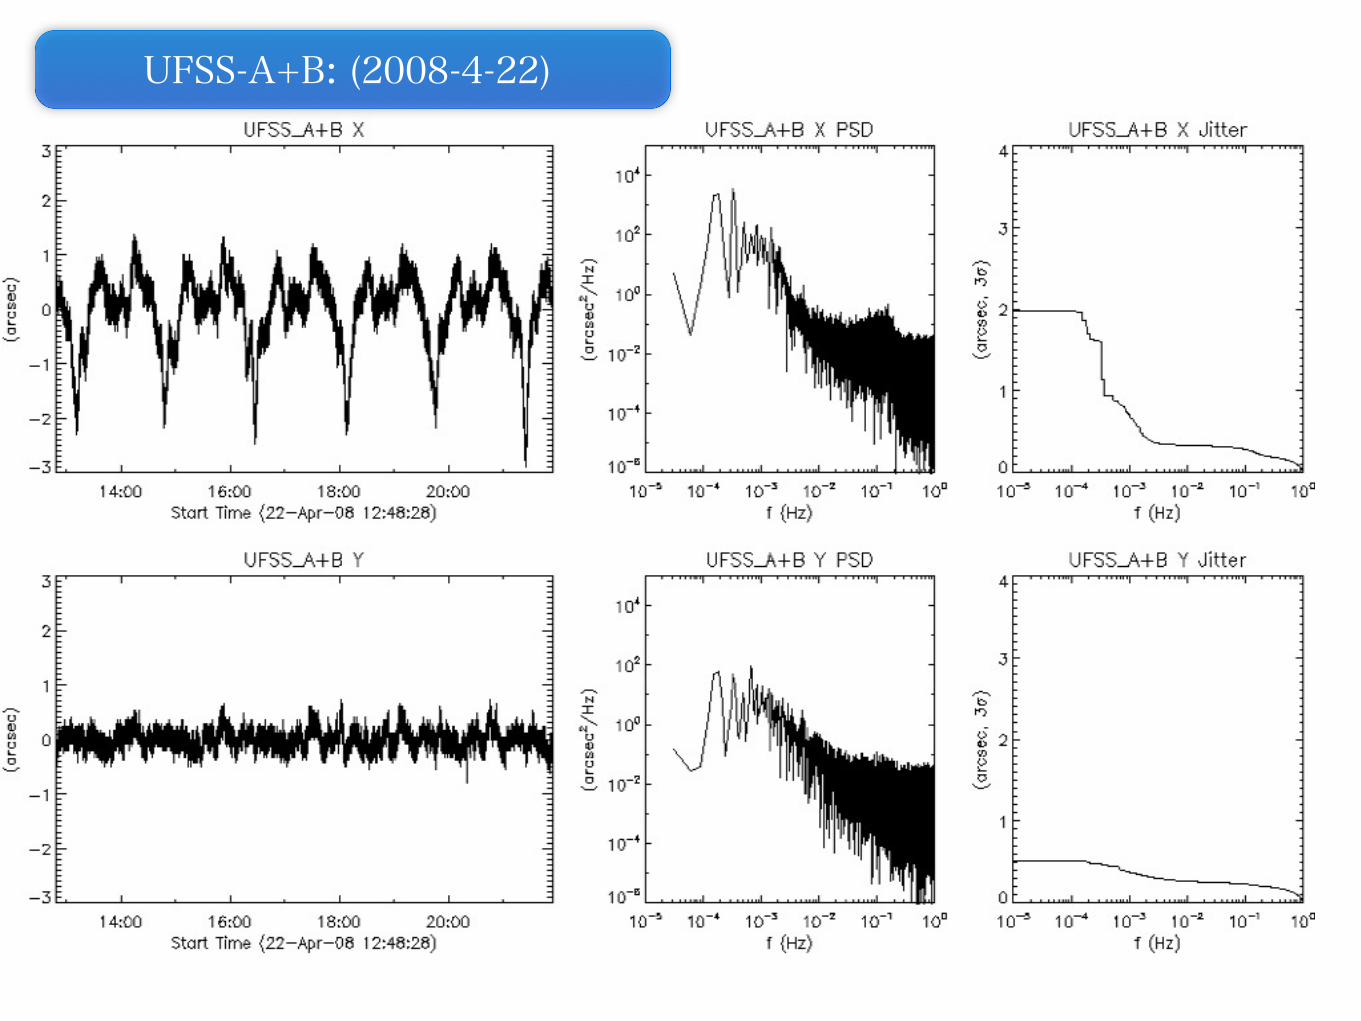
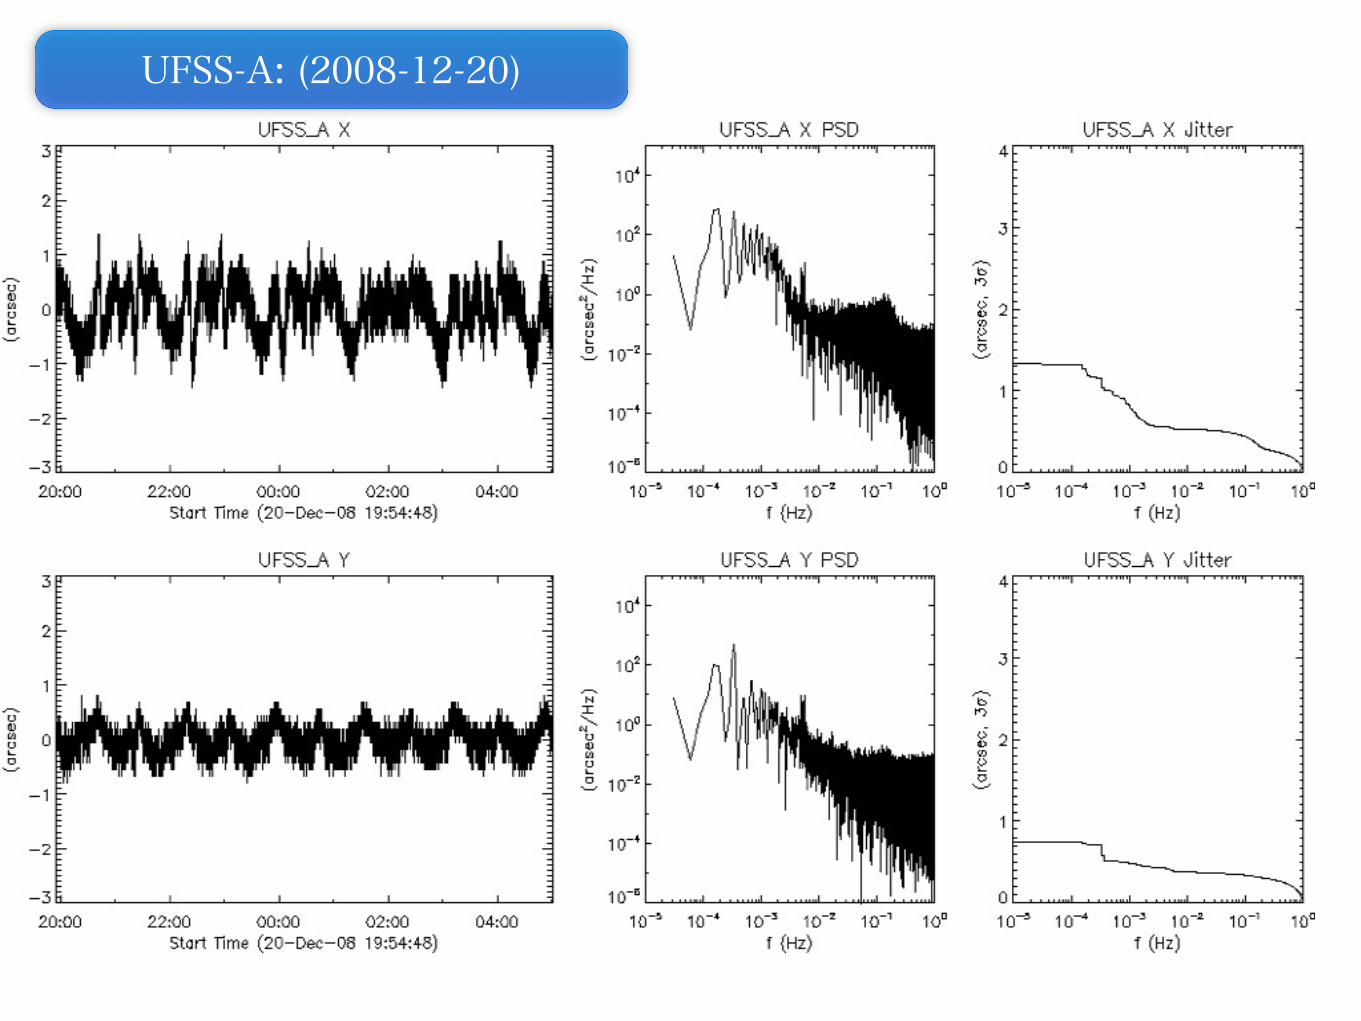
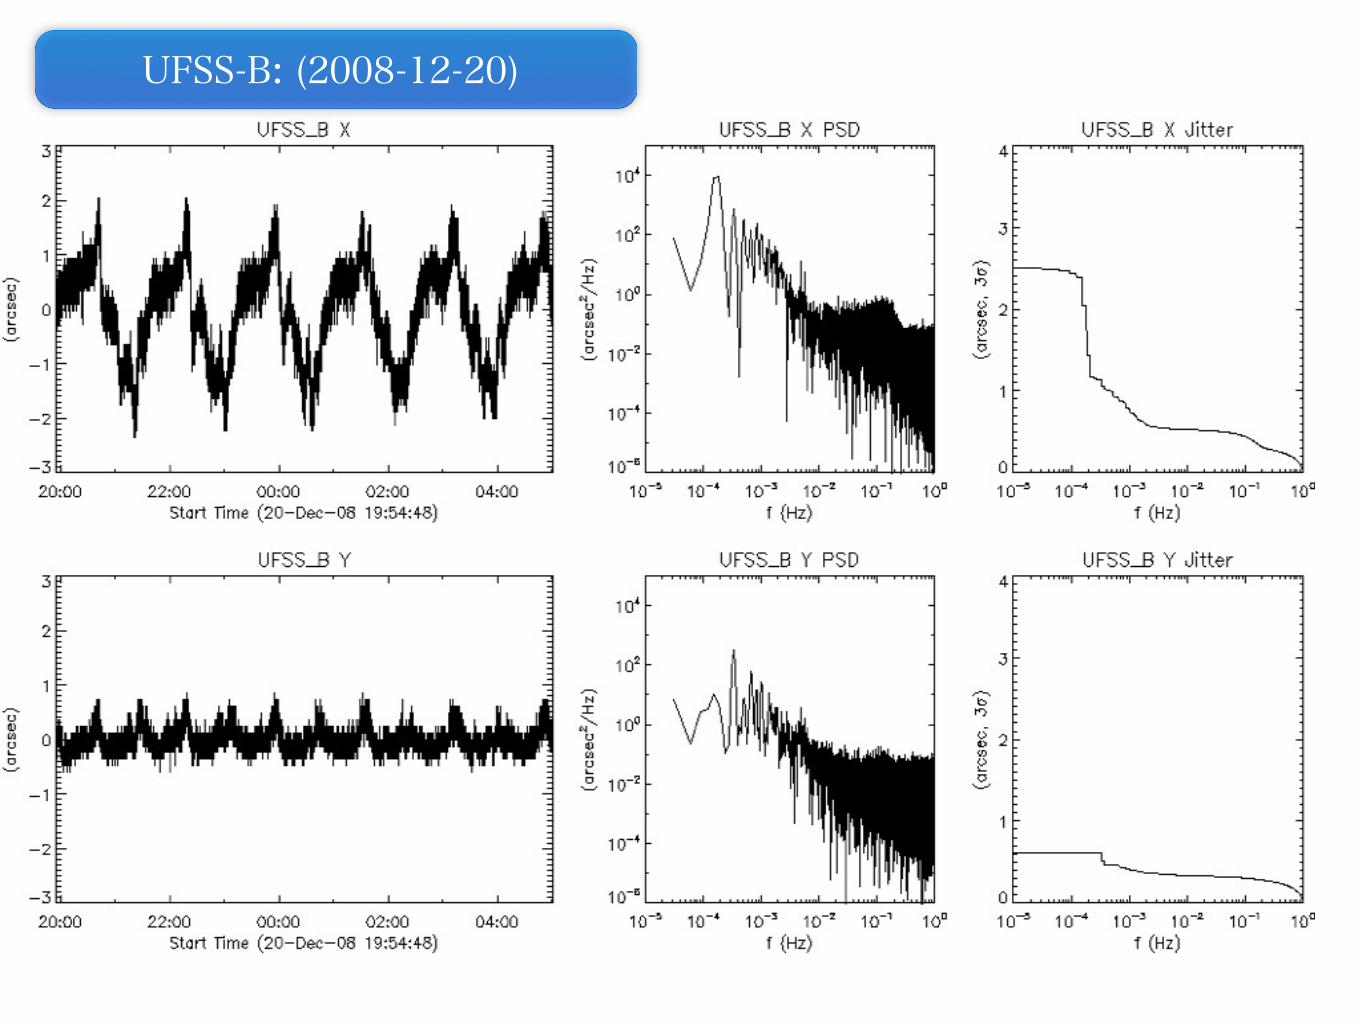
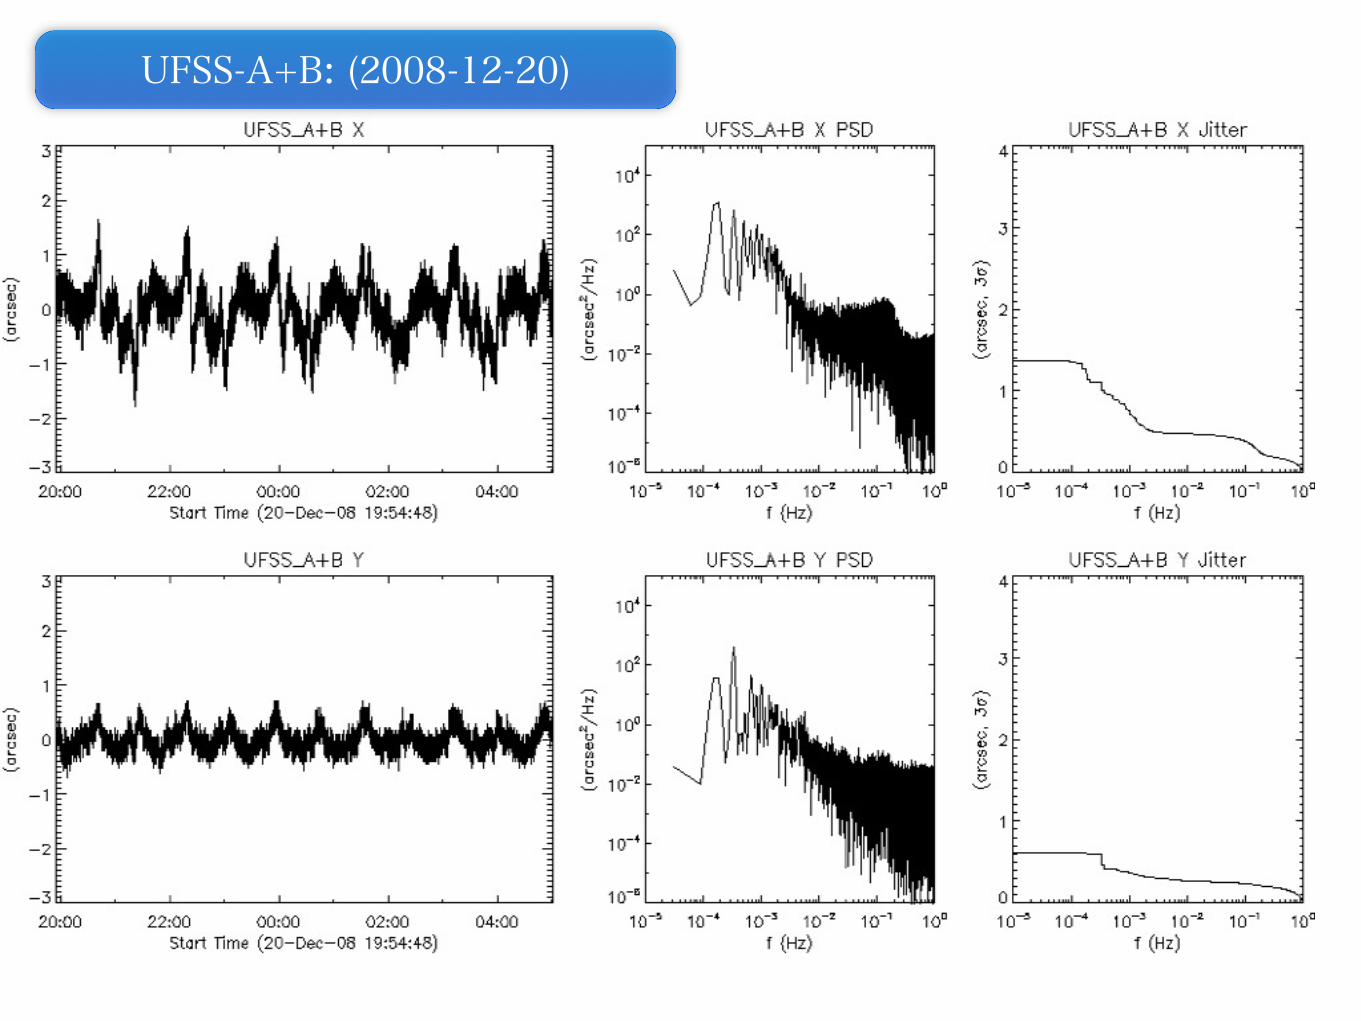
Features and Major Sources for Disturbances in the jitter of UFSS:
5x10⁻³ Hz= 200 sec cycle
0.1 Hz
Y-axis
X-axis
- f < 10-3 Hz: orbital modulation + its higher frequency (2f,4f,6f …) - f ~ 0.1 Hz : position sensor can control the disturbances with f < 0.1 Hz
[f ~ 5x10⁻³ Hz: unidentified (but, the contribution to the jitter is small)]
Power Spectrum Density for Jitter Disturbances (UFSS)
orbital modulations

0.1 Hz
IRU-A IRU-B1
0.1 Hz
Y-axis
X-axis
Y-axis
X-axis
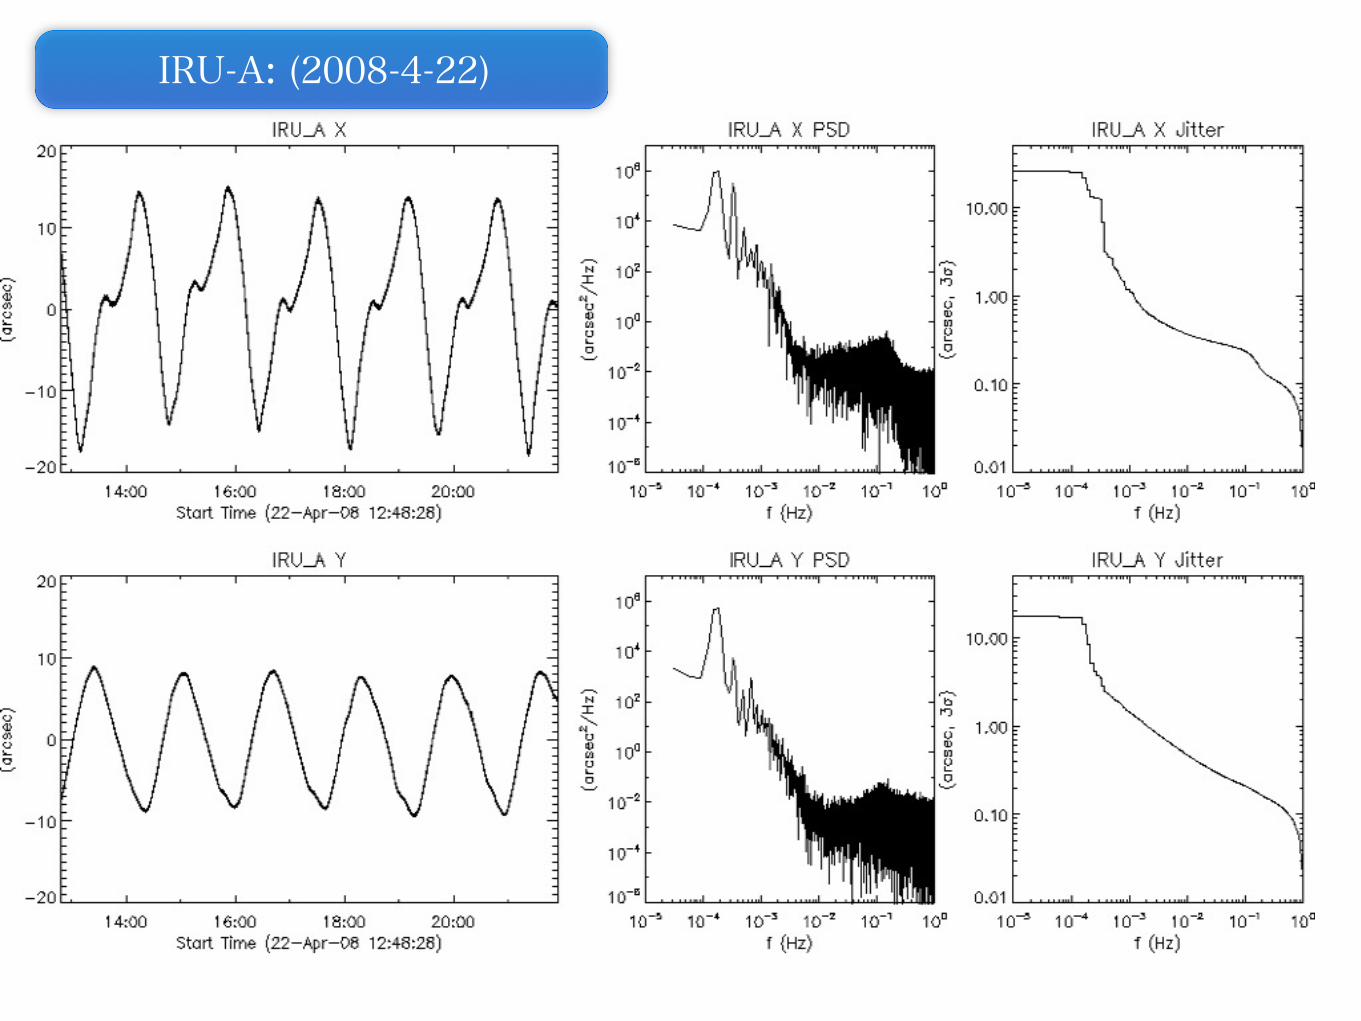
- f < 10-3 Hz: orbital modulation + its higher frequency (2f,4f,6f …) - f ~ 0.1 Hz : position sensor can control the disturbances with f < 0.1 Hz
[no peak around f ~ 5x10⁻³ Hz which can be seen in UFSS data]
Features and Major Sources for Disturbances in the jitter of IRU:
Power Spectrum Density for Jitter Disturbances (IRU)
orbital modulations
orbital modulations
The characters of PSD in the case IRU are almost same as that in UFSS
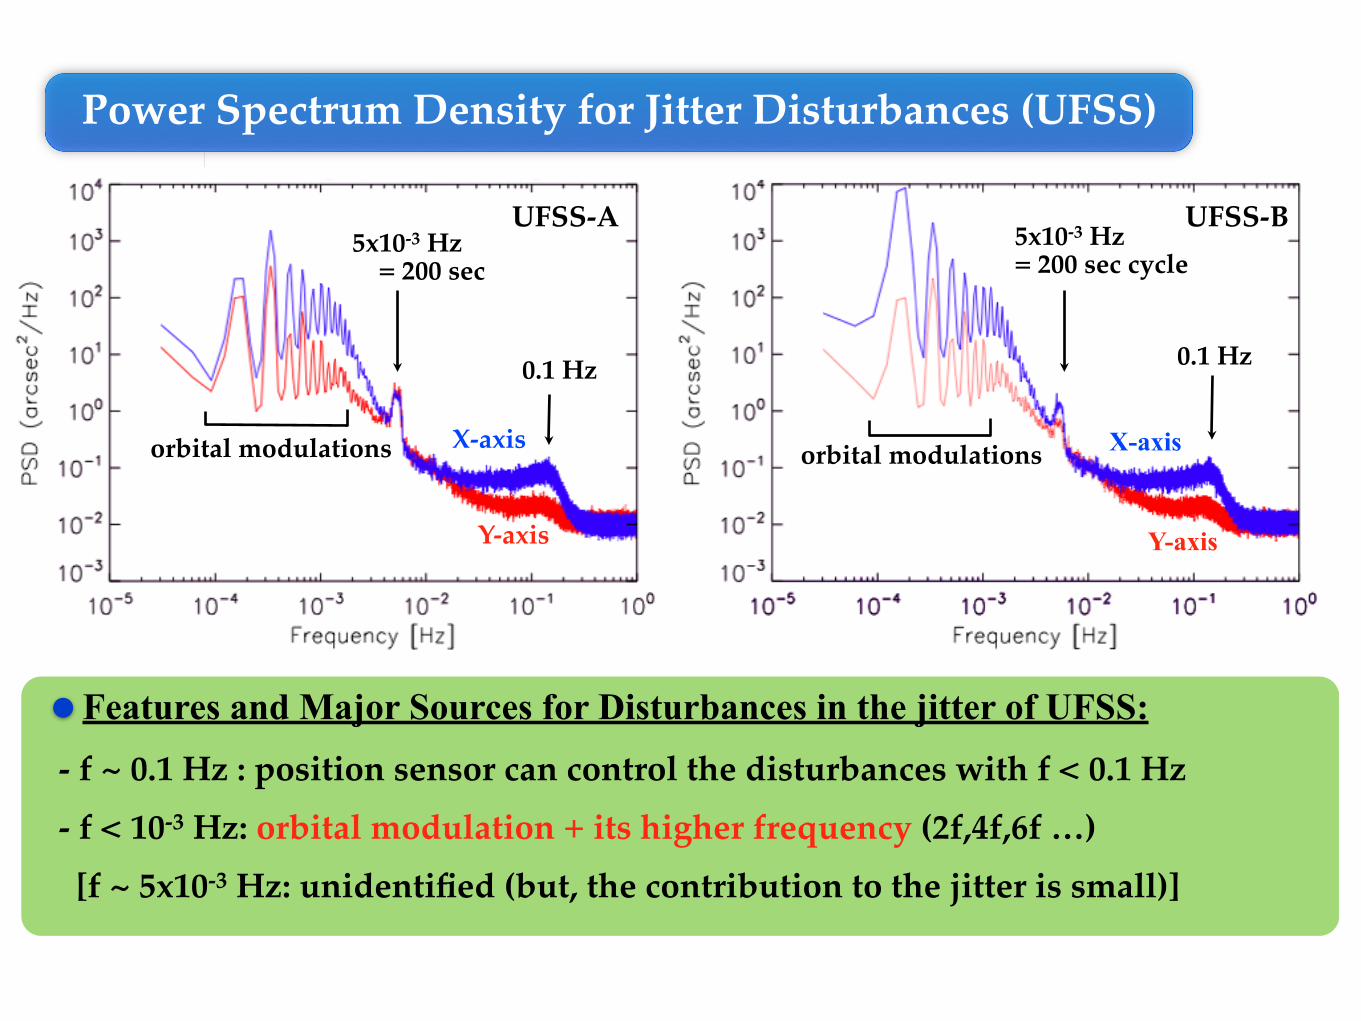
Characteristics in the long term variation:- There is a seasonal variation in the orbital modulation as expected.
- The modulation around 0.1 Hz increases secularly (we don’t know why...).
Secular variation of the pointing error
: shade term (Apr. to Aug.) → large error, but it become smaller during Oct.-Jan.
modulation around 0.1Hz
(IRU-A)2007 2008 2009 (A.D.)
Evolution of Orbital modulation(10-4 Hz < f < 10-3 Hz)
(10-2 Hz < f < 100 Hz)
Start Time (May 2007)

SOT Diagnostic data
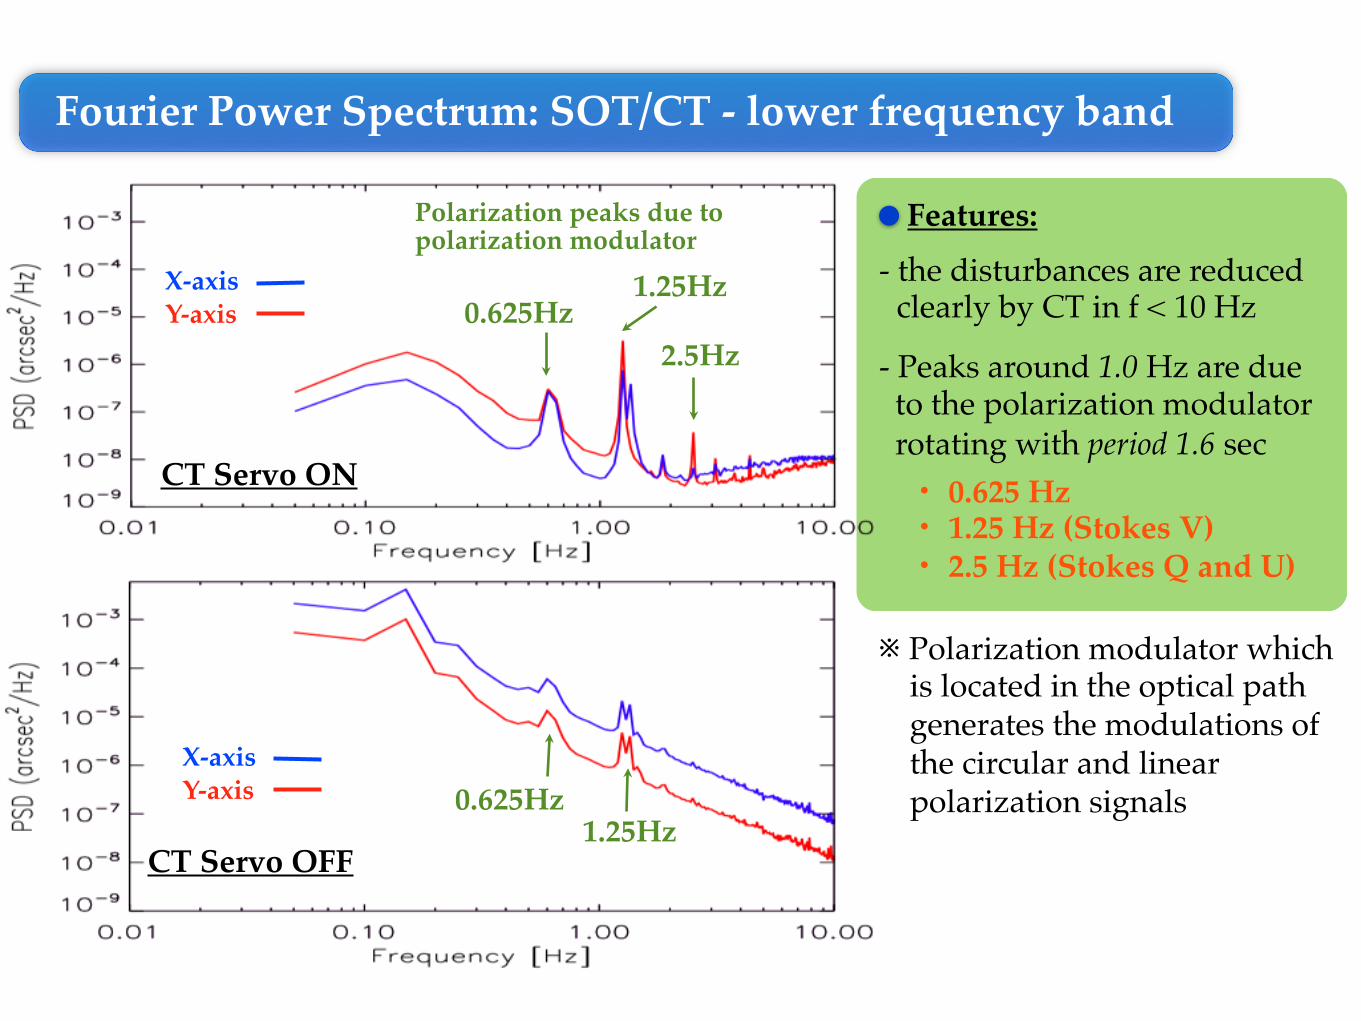
CT Servo ON
Polarization peaks due topolarization modulator
0.625Hz1.25Hz
2.5Hz
0.625Hz1.25Hz
CT Servo OFF
- the disturbances are reduced
- Peaks around 1.0 Hz are due
rotating with period 1.6 sec
clearly by CT in f < 10 Hz
to the polarization modulator
Features:
・ 0.625 Hz・ 1.25 Hz (Stokes V)・ 2.5 Hz (Stokes Q and U)
Y-axisX-axis
Y-axisX-axis
Fourier Power Spectrum: SOT/CT - lower frequency band
※ Polarization modulator whichis located in the optical path
polarization signals
generates the modulations ofthe circular and linear
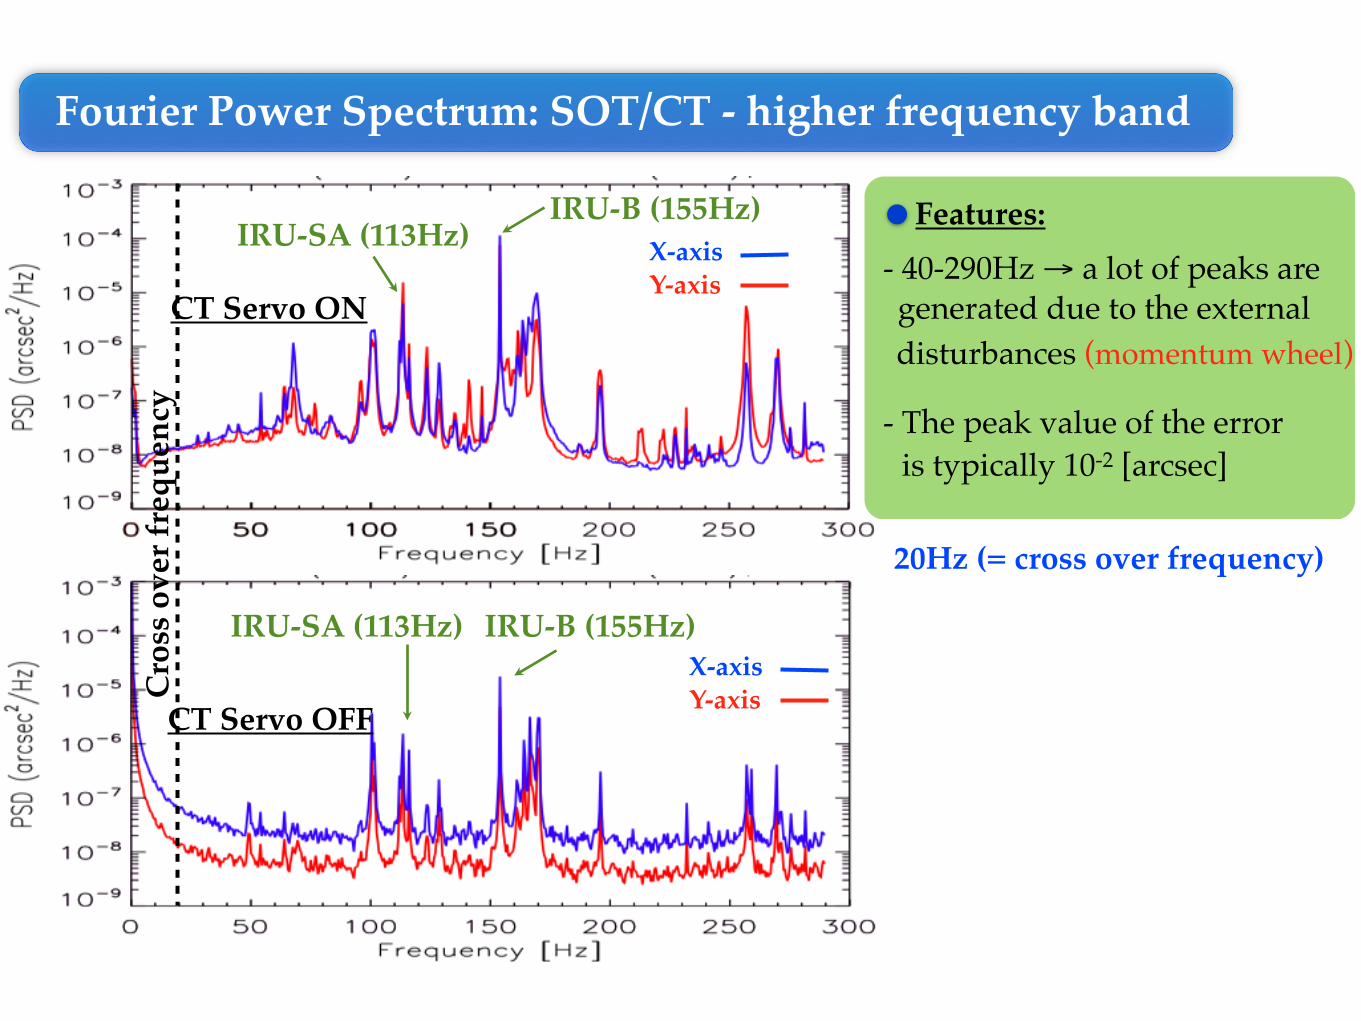
IRU-SA (113Hz) IRU-B (155Hz)
CT Servo ON
IRU-SA (113Hz)IRU-B (155Hz)
CT Servo OFF
Y-axisX-axis
Y-axisX-axis
- 40-290Hz → a lot of peaks are
- The peak value of the error
generated due to the external
is typically 10-2 [arcsec]
Features:
Fourier Power Spectrum: SOT/CT - higher frequency band
disturbances (momentum wheel)
20Hz (= cross over frequency)
Cro
ss o
ver f
requ
ency
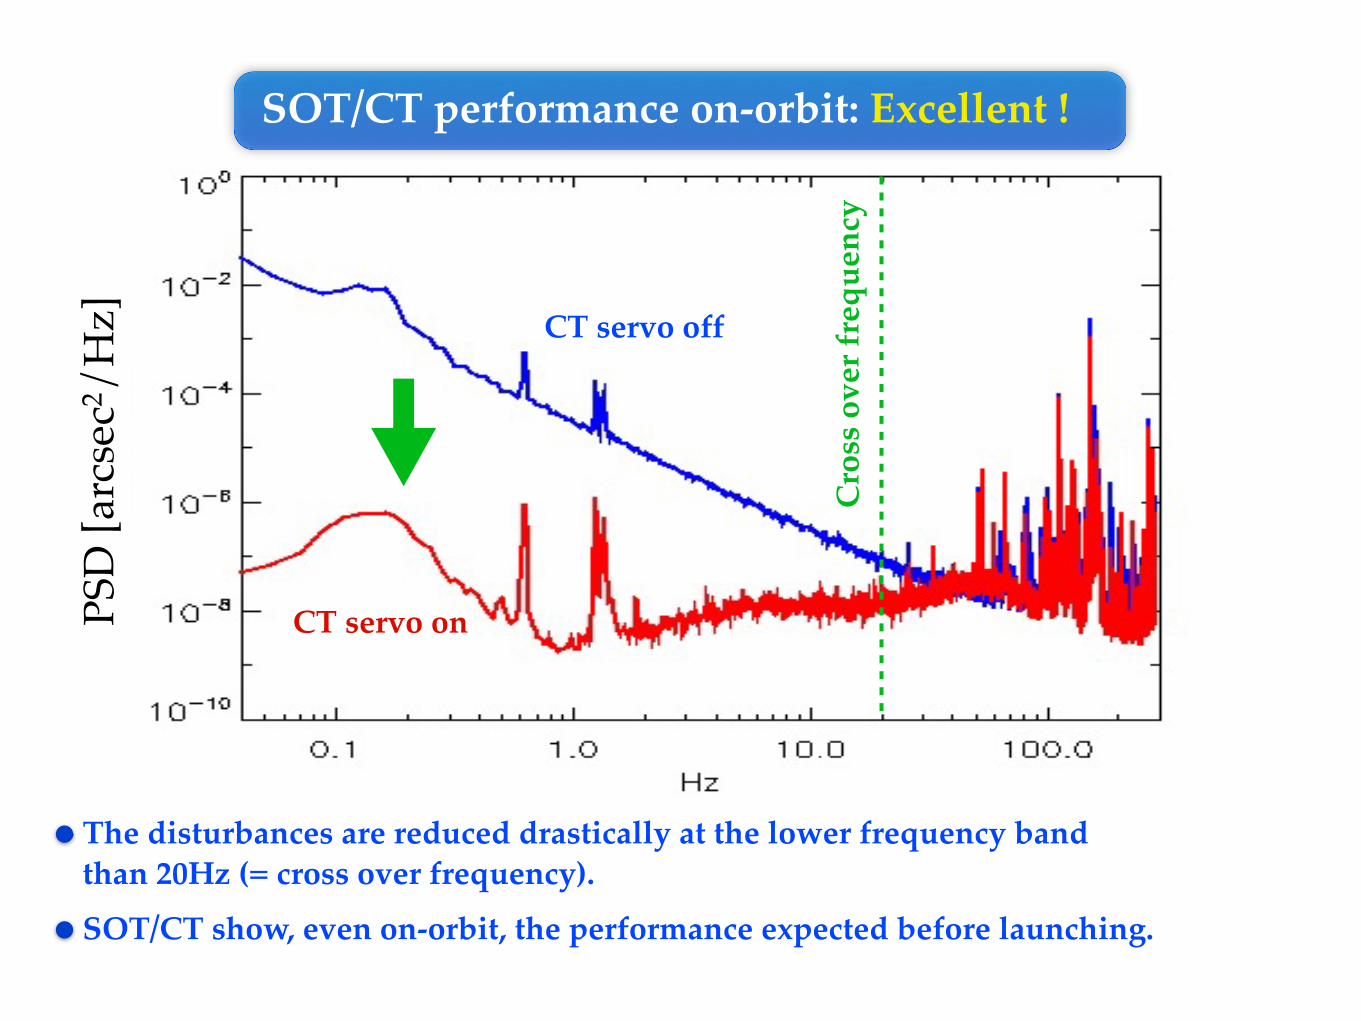
- The disturbances are reduced drastically at the lower frequency band
SOT/CT performance on-orbit: Excellent !
SOT/CT show, even on-orbit, the performance expected before launching.
than 20Hz (= cross over frequency).
CT servo off
CT servo onPSD
[arc
sec2 /
Hz]
Cro
ss o
ver f
requ
ency
Requirements for Solar-C V.S.
Performance of Hinode on-orbit
- Raise Issues in realizing Solar-C (Option-B)- Asses the achievement of Hinode Satellite
Hinode SOTHinode EIS
Hinode XRT
UFSS
IRU CT (servo off)
CT (servo on)
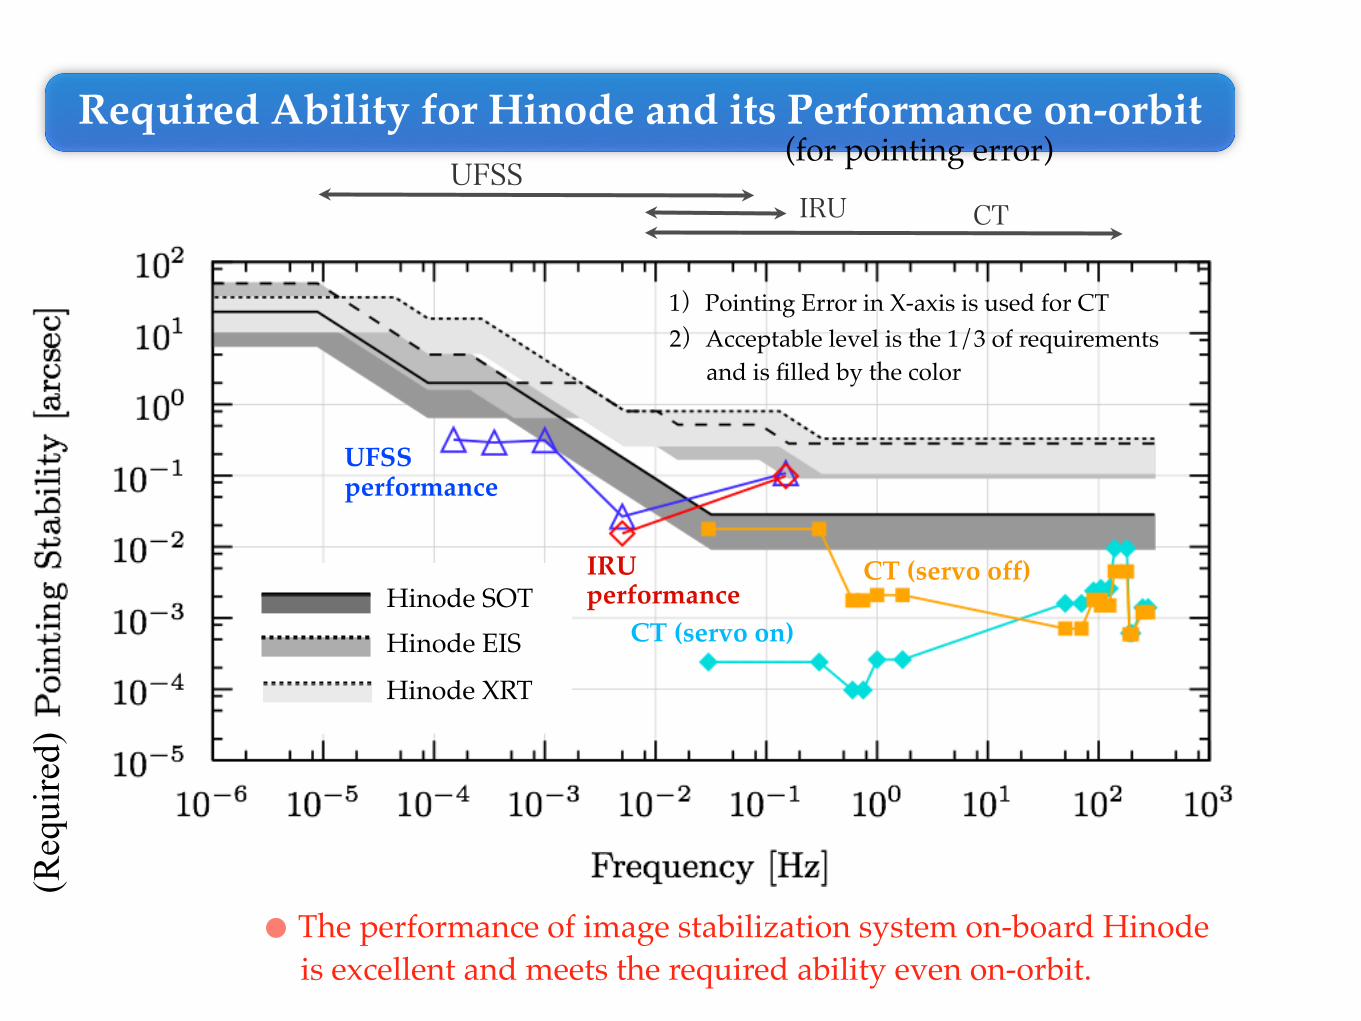
Required Ability for Hinode and its Performance on-orbitUFSS
IRU CT
The performance of image stabilization system on-board Hinode
2)Acceptable level is the 1/3 of requirements1)Pointing Error in X-axis is used for CT
is excellent and meets the required ability even on-orbit.
performance
performance
and is filled by the color
(for pointing error)
(Req
uire
d)

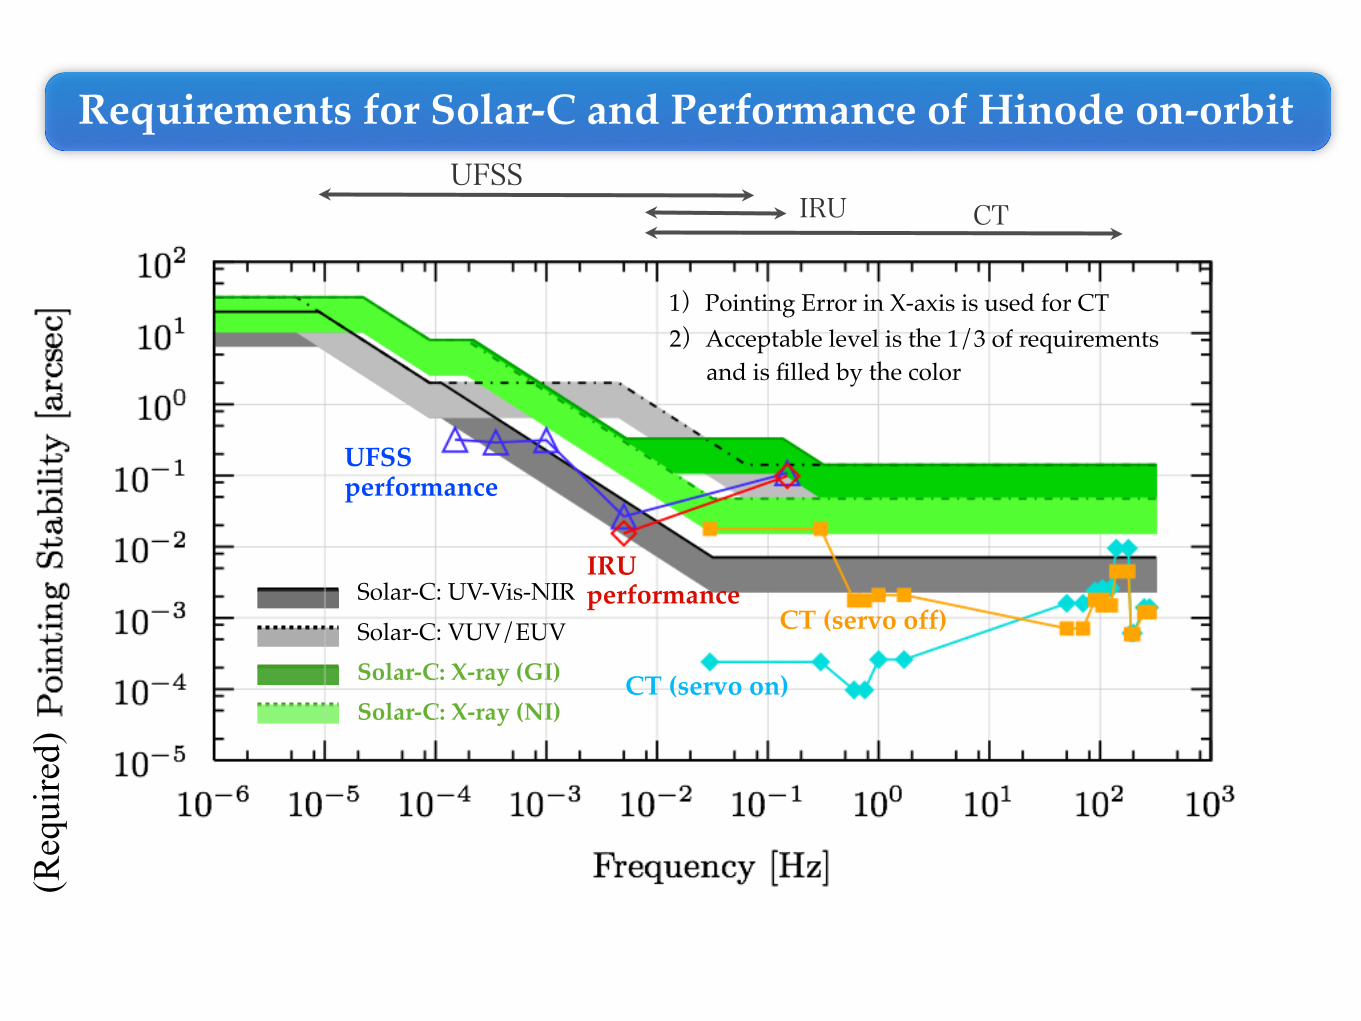
IRUSolar-C: UV-Vis-NIRSolar-C: VUV/EUVSolar-C: X-ray (GI)Solar-C: X-ray (NI)
UFSSIRU CT
Requirements for Solar-C and Performance of Hinode on-orbit
2)Acceptable level is the 1/3 of requirements1)Pointing Error in X-axis is used for CT
and is filled by the color
UFSS
IRU
CT (servo off)
CT (servo on)
performance
performance
The performance of Hinode around 0.1 Hz does not meet the requirement for X-ray (NI)The performance of Hinode around 100 Hz does not meet the ability for UV-Vis-NIR
※GI: Grazing IncidenceNI: Normal Incidence
Issues:
(for pointing error)
(Req
uire
d)
IRU
Solar-C: UV-Vis-NIRSolar-C: VUV/EUVSolar-C: X-ray (GI)Solar-C: X-ray (NI)
UFSSIRU CT
Requirements for Solar-C and Performance of Hinode on-orbit
2)Acceptable level is the 1/3 of requirements1)Pointing Error in X-axis is used for CT
and is filled by the color
UFSS
IRU
CT (servo off)
CT (servo on)
performance
performance
(Req
uire
d)

IRU
Solar-C: UV-Vis-NIRSolar-C: VUV/EUVSolar-C: X-ray (GI)Solar-C: X-ray (NI)
UFSSIRU CT
Requirements for Solar-C and Performance of Hinode on-orbit
2)Acceptable level is the 1/3 of requirements1)Pointing Error in X-axis is used for CT
and is filled by the color
UFSS
IRU
CT (servo off)
CT (servo on)
performance
performance
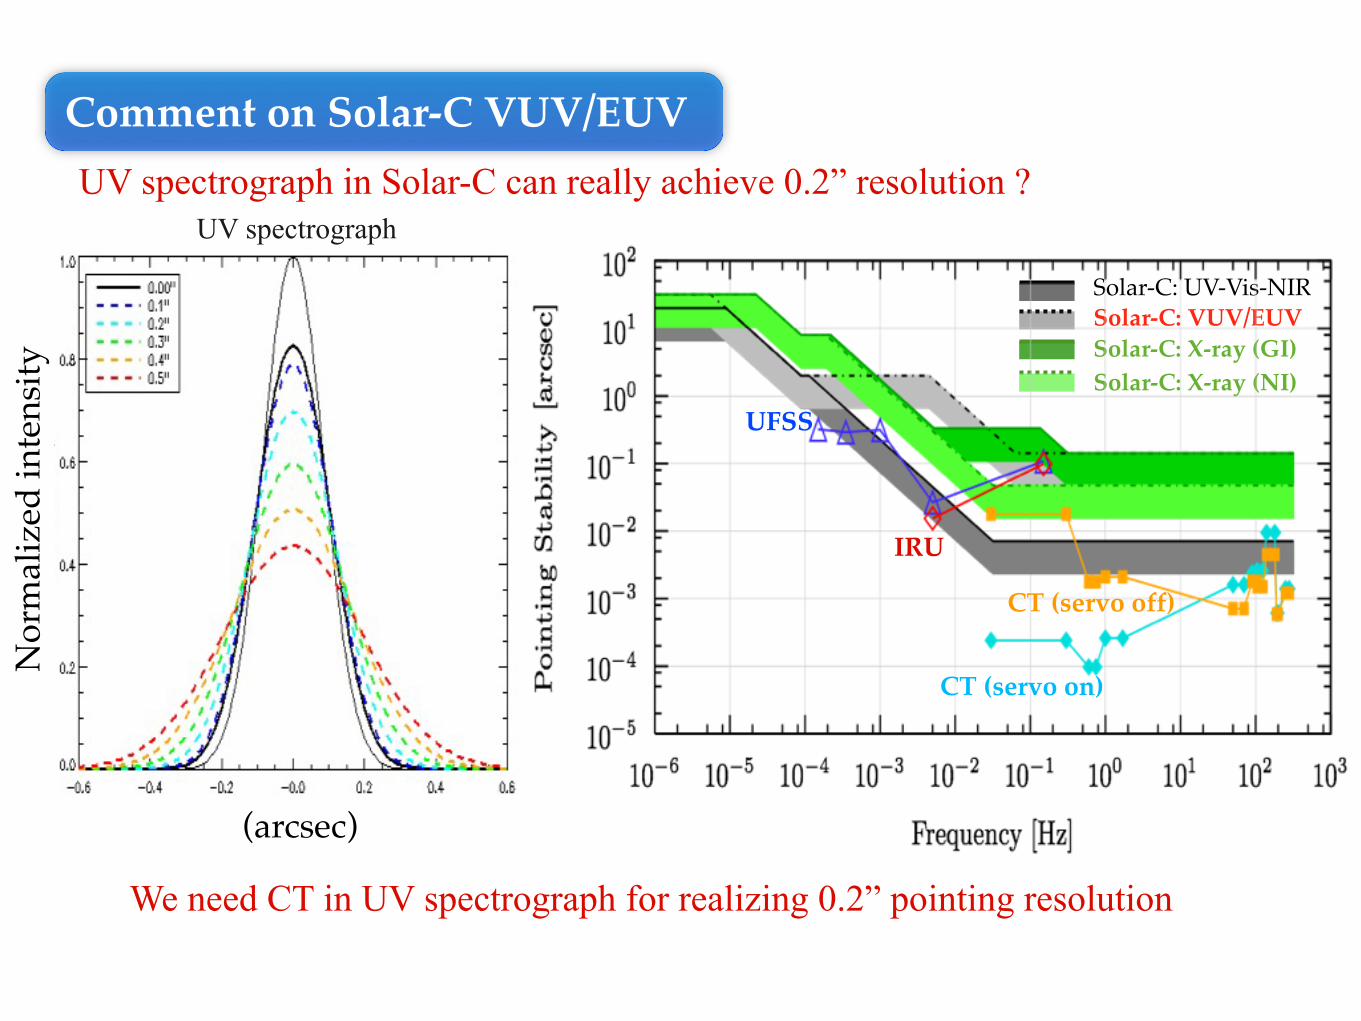
If UV spectrograph with 0.2” spatial resolution is assumed, the required ability forVUV/EUV become more severe (0.3 arcsec → 0.05 arcsec).
(Req
uire
d)

In the band f > 20Hz, we should reduce the disturbances generated by MW or extend the cross over frequency up to 300 Hz in order to meets the requirement.
The major disturbance source in UFSS/IRU is the orbital modulations in the band f < 10-3Hz. They are generated due to the change of thermal environment, not due to the characteristics of the position control sensors.
We should consider seriously the thermal structure of Solar-C
In the band 0.01Hz < f < 1Hz, the performance meets the required abilities for UV-Vis-NIR, VUV/EUV and X-ray (GI) at least, but not for X-ray (NI).
CT would be needed for X-ray (NI) with required ability
Summary: Toward Solar-C with required ability for Option-B
The disturbances in ~ 0.1 Hz seems to have serious impacts on Solar-C. It must be reduced in designing the position control sensor for Solar-C.
CT would be needed for UV spectrograph with 0.2” spatial resolution
IRU
Solar-C: UV-Vis-NIRSolar-C: VUV/EUVSolar-C: X-ray (GI)Solar-C: X-ray (NI)
UFSSIRU CT
2)Acceptable level is the 1/3 of requirements1)Pointing Error in X-axis is used for CT
and is filled by the color
UFSS
IRU
CT (servo off)
CT (servo on)
performance
performance
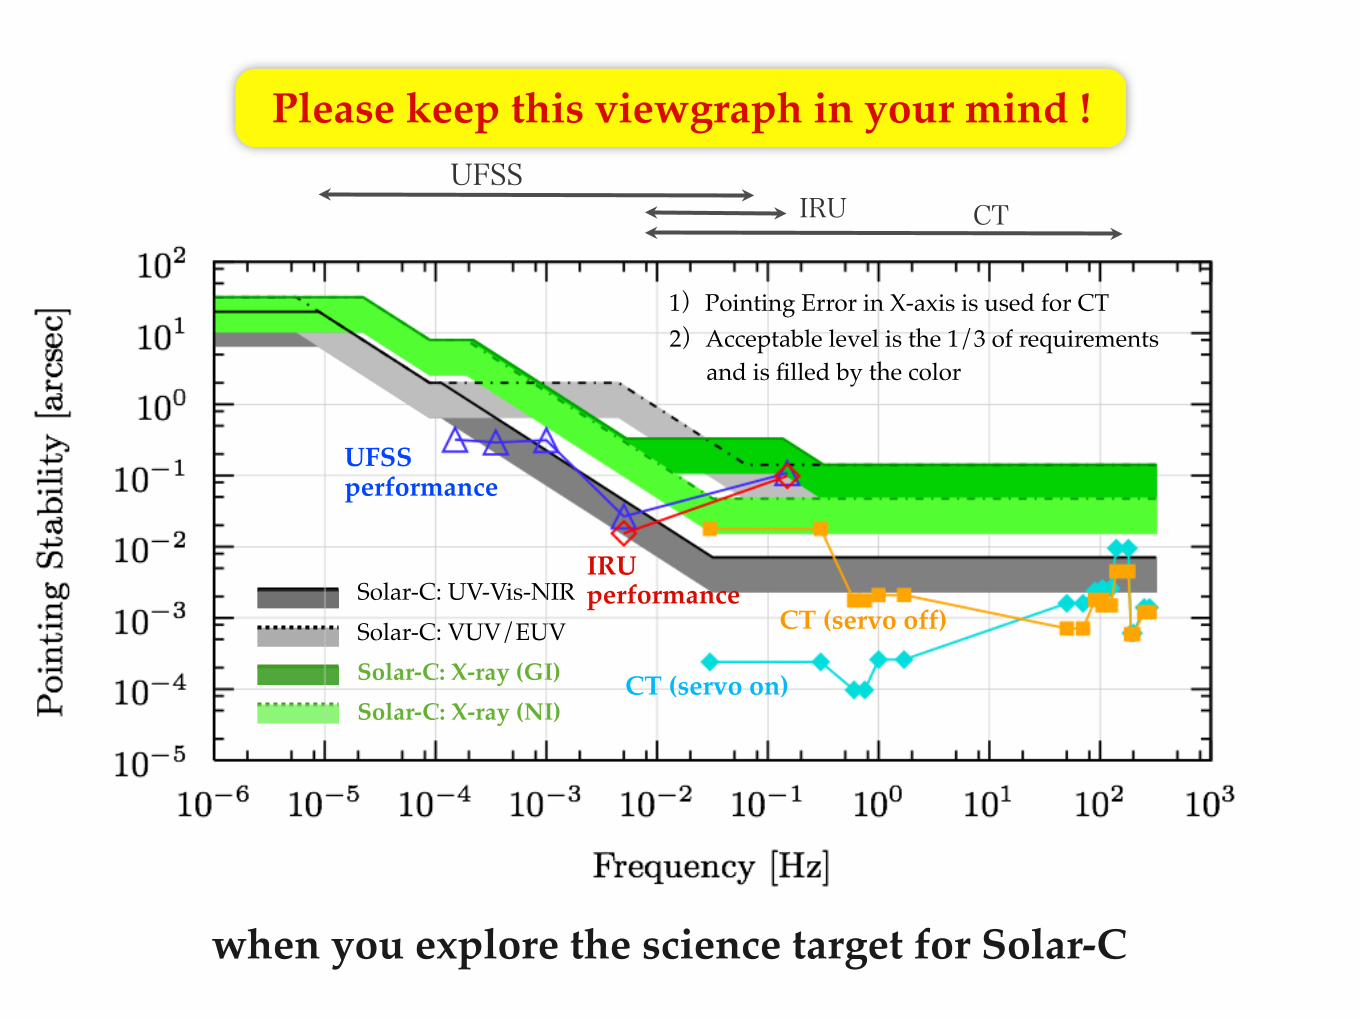
Please keep this viewgraph in your mind !
when you explore the science target for Solar-C
Appendix

UFSS, IRU: - 40 data sets [from November 2006 to April 2009 (full disk only)] - Sampling: 0.5 sec (successive data more than 9 hours) - drift component is removed (by using the linear fitting)
IRU-A : FRIG floated rate integrating gyro (made by JAE),IRU-B1: TDG tuned dry gyro (made by MPC)
※)
We analyze the jitter in telemetry date of UFSS, IRU and diagnostic data of SOT/CT
・Specify the distinguished peak from Fourier Power Spectrum (PSD)・Evaluate the amplitude of the major disturbances (= Pointing Error)
Instruments on board Hinode and Data Sets Position Control Sensors and Correlation Tracker on board Hinode
・Ultra Fine Sun Sensor [UFSS (-A,-B)], (10-5 Hz < f < 10-1 Hz)・Inertia Reference Unit [IRU (-A, -B1)], (10-2 Hz < f < 10-1 Hz)・Correlation Tracker [SOT/CT], (10-2 Hz < f < 290 Hz)
SOT/CT: - diagnostic data of CT servo on/off [focus on Dec. 2007] - Sampling: 580 Hz (df = 0.5 Hz for averaging)
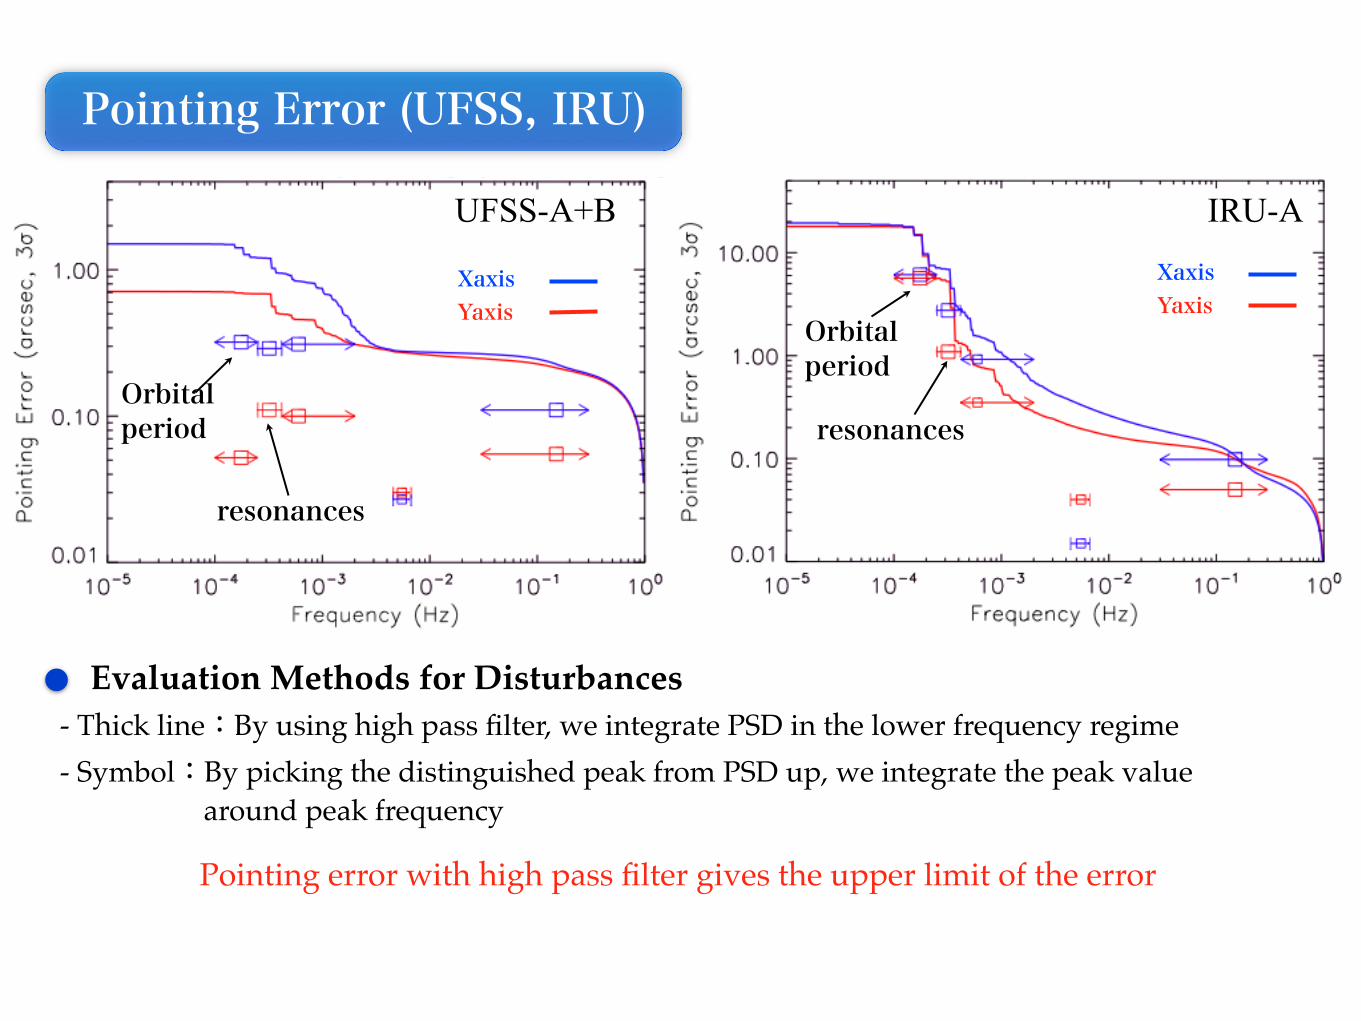
Pointing Error (UFSS, IRU)
UFSS-A+B IRU-A
Evaluation Methods for Disturbances- Thick line:By using high pass filter, we integrate PSD in the lower frequency regime- Symbol:By picking the distinguished peak from PSD up, we integrate the peak value
Pointing error with high pass filter gives the upper limit of the error
Orbital period
Orbitalperiod
resonances
resonances
XaxisYaxis
around peak frequency
XaxisYaxis

Pointing Error (arcsec)
10-2
Short term variation of higher frequency peaks around 100Hz (t < 20sec)
~ 60 Hz
~ 100 Hz
~ 120 Hz
~ 160 Hz
10-1
~ 260 Hz
Short term variation of higher frequency peaks
- no remarkable variation in short term

Long term variation for pointing error in CT Servo off
20061027 20061108 20070316
20071215 20071216
Y-axisX-axis

PSD from diagnostic data in CT servo off (100sec data)
Ex = 0.032 [arcsec]
Ey = 0.045 [arcsec]
20061108
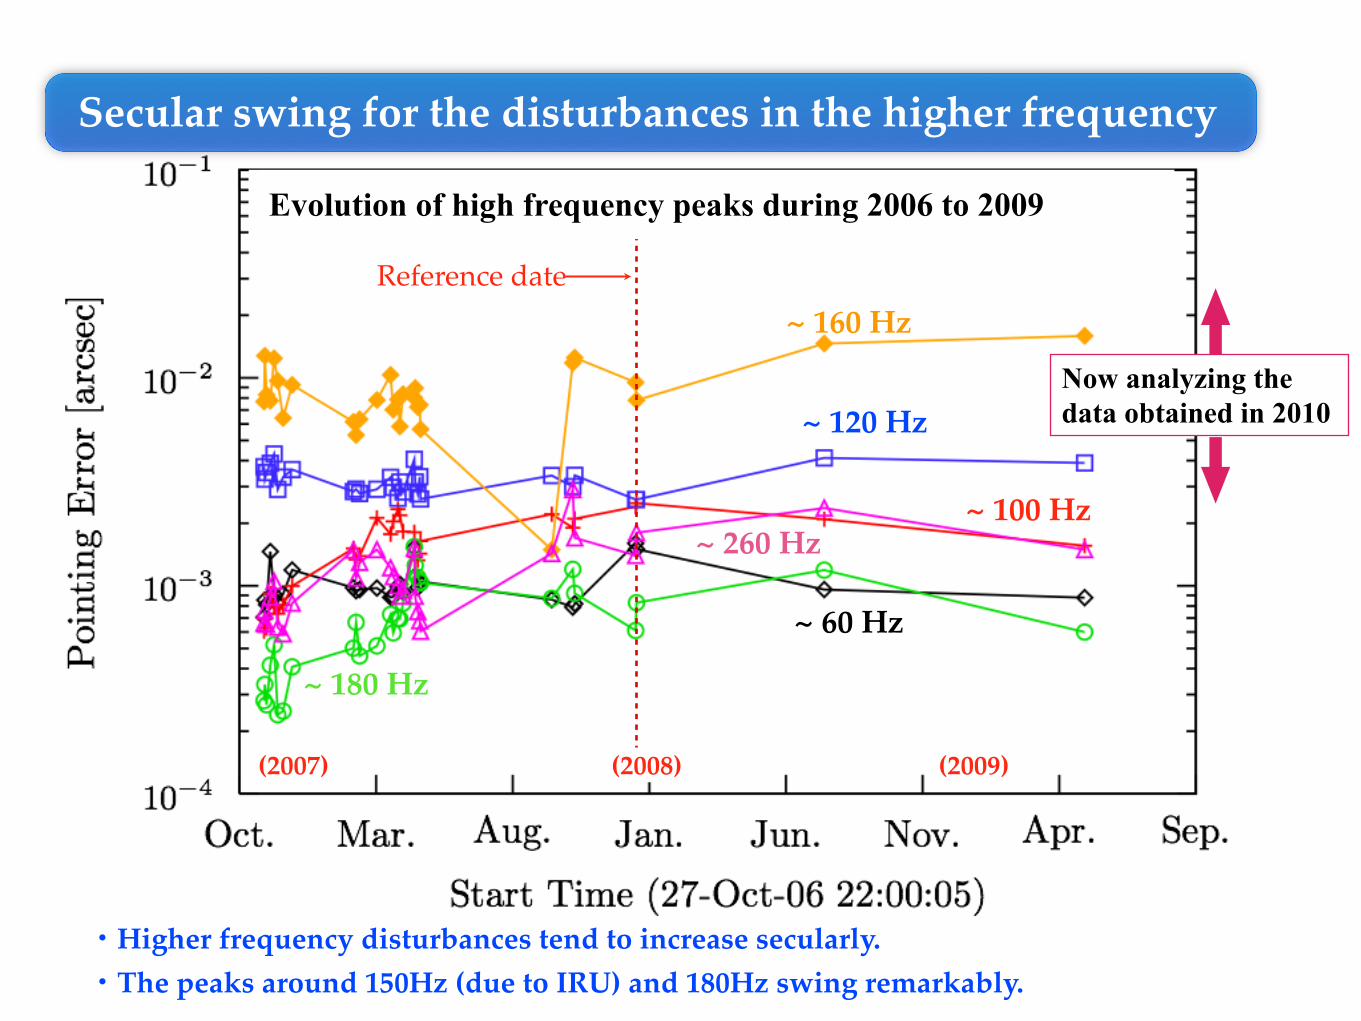
Secular swing for the disturbances in the higher frequency
~ 160 Hz
~ 120 Hz
~ 60 Hz
~ 100 Hz~ 260 Hz
~ 180 Hz
(2007) (2008) (2009)
Reference date
・The peaks around 150Hz (due to IRU) and 180Hz swing remarkably.
Evolution of high frequency peaks during 2006 to 2009
・Higher frequency disturbances tend to increase secularly.
Now analyzing the data obtained in 2010

X-axis (0.05-0.3Hz)
Y-axis (0.05-0.3Hz)
X-axis (0.6-0.75Hz)
Y-axis (0.6-0.75Hz)
・There is no significant secular variation in lower frequency band.
(2007)
Secular swing for the disturbances in the lower frequency
Solar-C: UV-Vis-NIRSolar-C: VUV/EUVSolar-C: X-ray (GI)Solar-C: X-ray (NI)
UFSS
IRU
CT (servo off)
CT (servo on)
Comment on Solar-C VUV/EUVUV spectrograph in Solar-C can really achieve 0.2” resolution ?
(arcsec)
UV spectrograph
Nor
mal
ized
inte
nsity
We need CT in UV spectrograph for realizing 0.2” pointing resolution
Appendix 2:Data Sets (UFSS/IRU)
2008-4-22
25
UFSS-A: (2008-4-22)
26
UFSS-B: (2008-4-22)
27
UFSS-A+B: (2008-4-22)
28
IRU-A: (2008-4-22)

29
IRU-B1: (2008-4-22)

2008-12-20
31
UFSS-A: (2008-12-20)
32
UFSS-B: (2008-12-20)
33
UFSS-A+B: (2008-12-20)

34
IRU-A: (2008-12-20)

35
IRU-B1: (2008-12-20)
Appendix 3:data sets (SOT/CT)
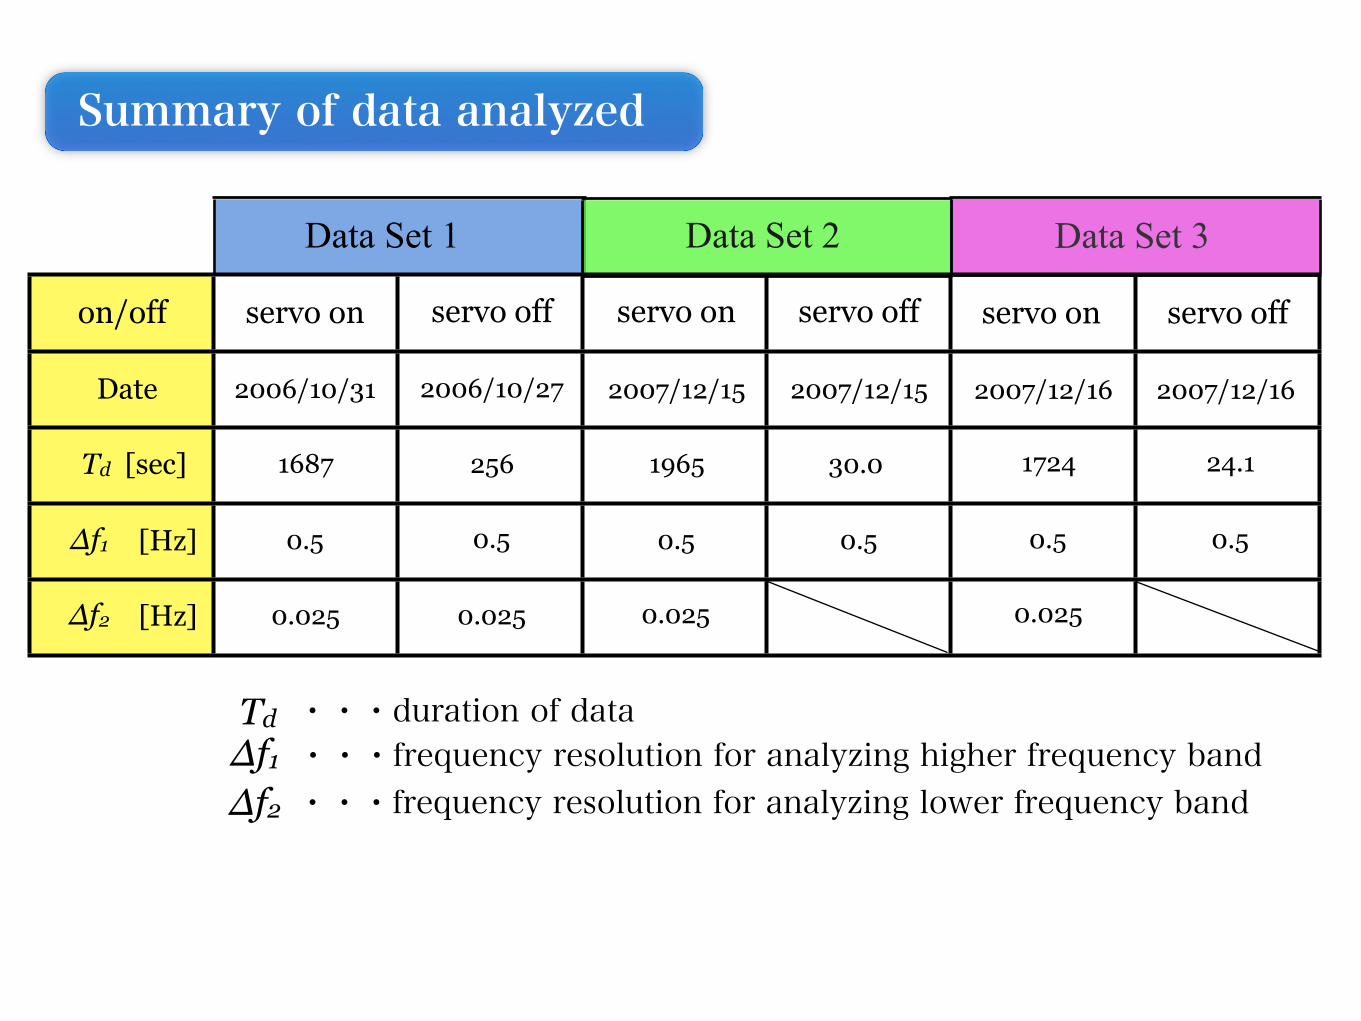
Δf1
Δf2
・・・frequency resolution for analyzing higher frequency band ・・・frequency resolution for analyzing lower frequency band
Td ・・・duration of data
servo on servo off servo on servo off
Data Set 1 Data Set 2
Date 2006/10/31 2006/10/27 2007/12/15 2007/12/15
Td [sec]
Δf1
Δf2
[Hz]
[Hz]
0.5 0.5 0.5 0.5
0.025 0.025 0.025
1687 256 1965 30.0
Data Set 3
servo on servo off
2007/12/16 2007/12/16
0.5 0.5
0.025
1724 24.1
on/off
Summary of data analyzed

Data Set 1
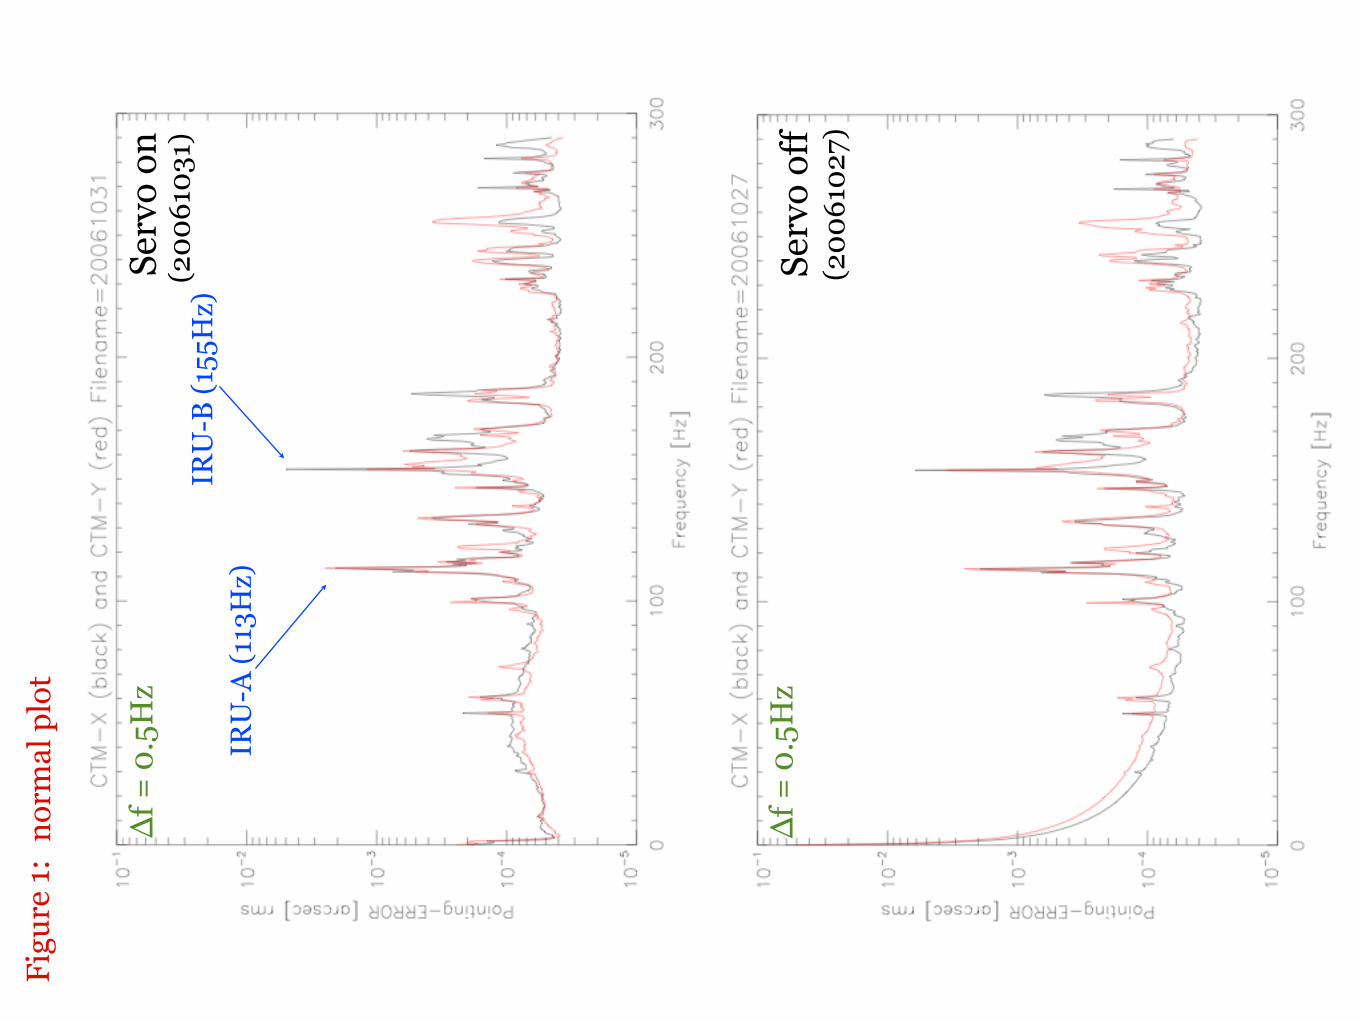
IRU
-A (1
13H
z)IR
U-B
(155
Hz)
Serv
o on
Serv
o of
f
Figu
re 1
:
(200
6103
1)
(200
6102
7)
norm
al p
lot
Δf =
0.5
Hz
Δf =
0.5
Hz

Serv
o on
Serv
o of
f
(200
6103
1)
(200
6102
7)
Figu
re 2
:lo
gari
thm
plo
t of F
ig.1
Δf =
0.5
Hz
Δf =
0.5
Hz
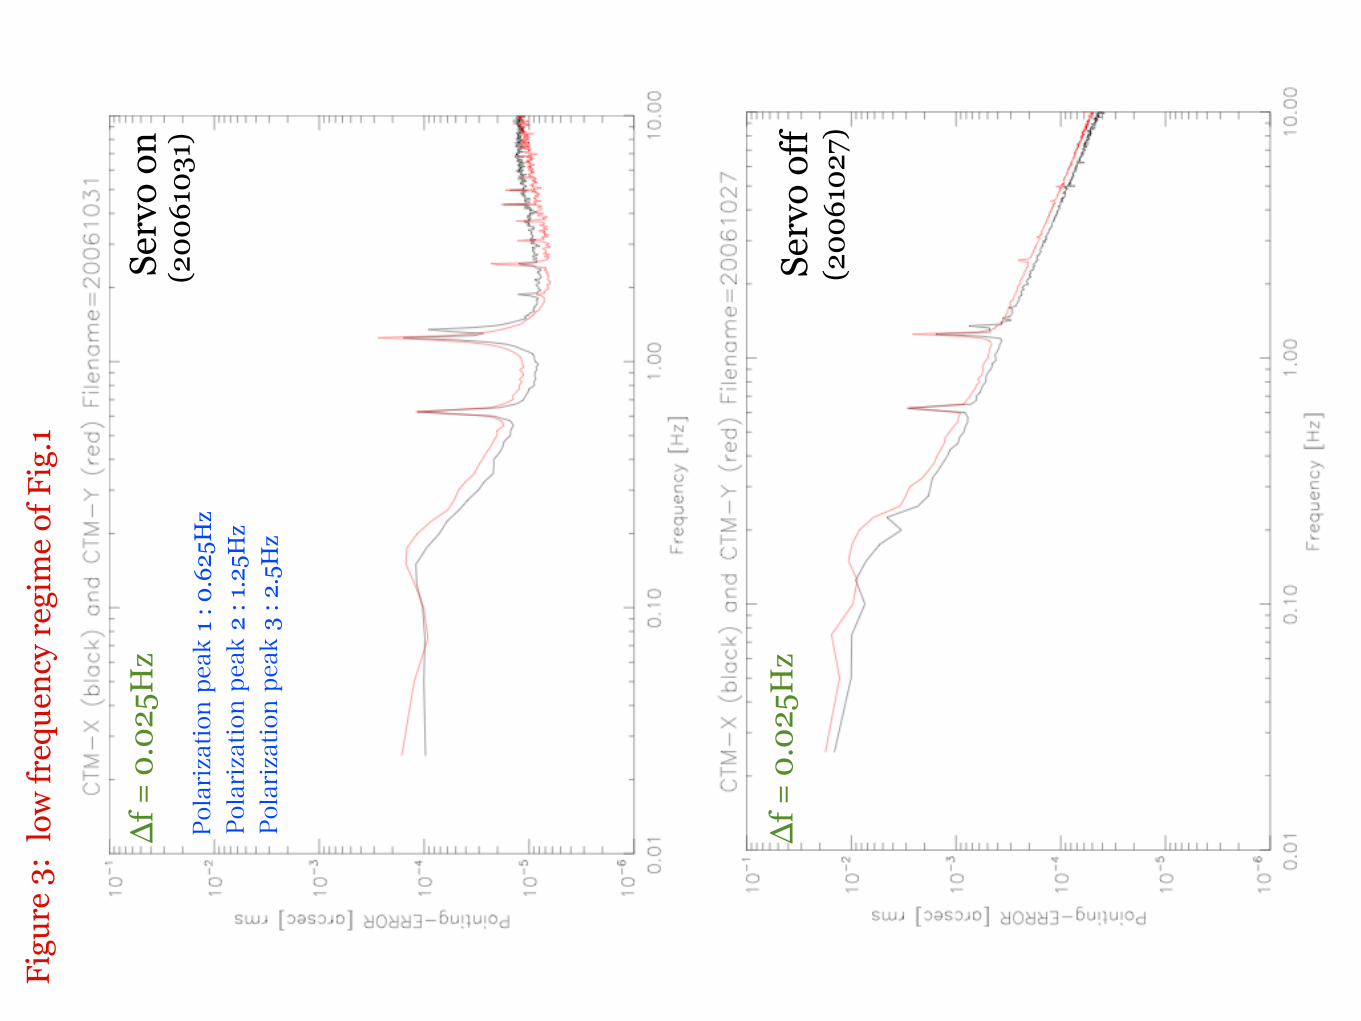
Serv
o on
Serv
o of
f
(200
6103
1)
(200
6102
7)
Δf =
0.0
25H
z
Δf =
0.0
25H
z
Figu
re 3
:lo
w fr
eque
ncy
regi
me
of F
ig.1
Polarization peak 1
: 0.6
25H
zPolarization peak 2
: 1.
25H
zPolarization peak 3
: 2.
5Hz

Figure 4: Bode plot
G = 20log10(Aon/Aoff)Aon: amplitude in servo onAoff: amplitude in servo off
G: Gain

Data Set 2
Serv
o on
Serv
o of
f
Figu
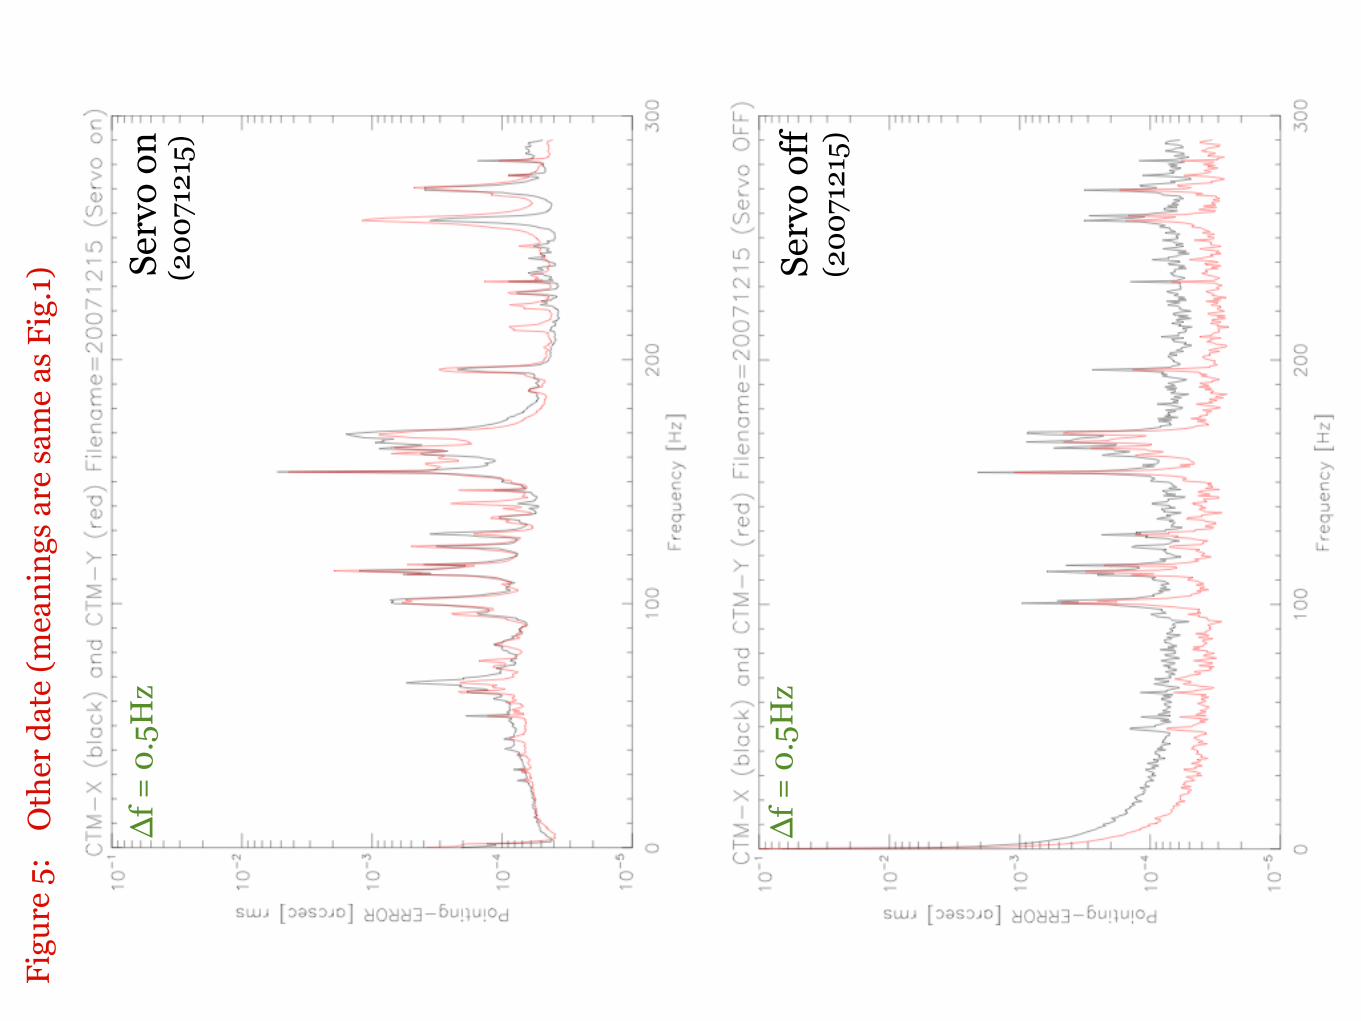
re 5
:
(200
7121
5)
(200
7121
5)
Oth
er d
ate
(mea
ning
s ar
e sa
me
as F
ig.1
)
Δf =
0.5
Hz
Δf =
0.5
Hz
Serv
o on
Serv
o of
f
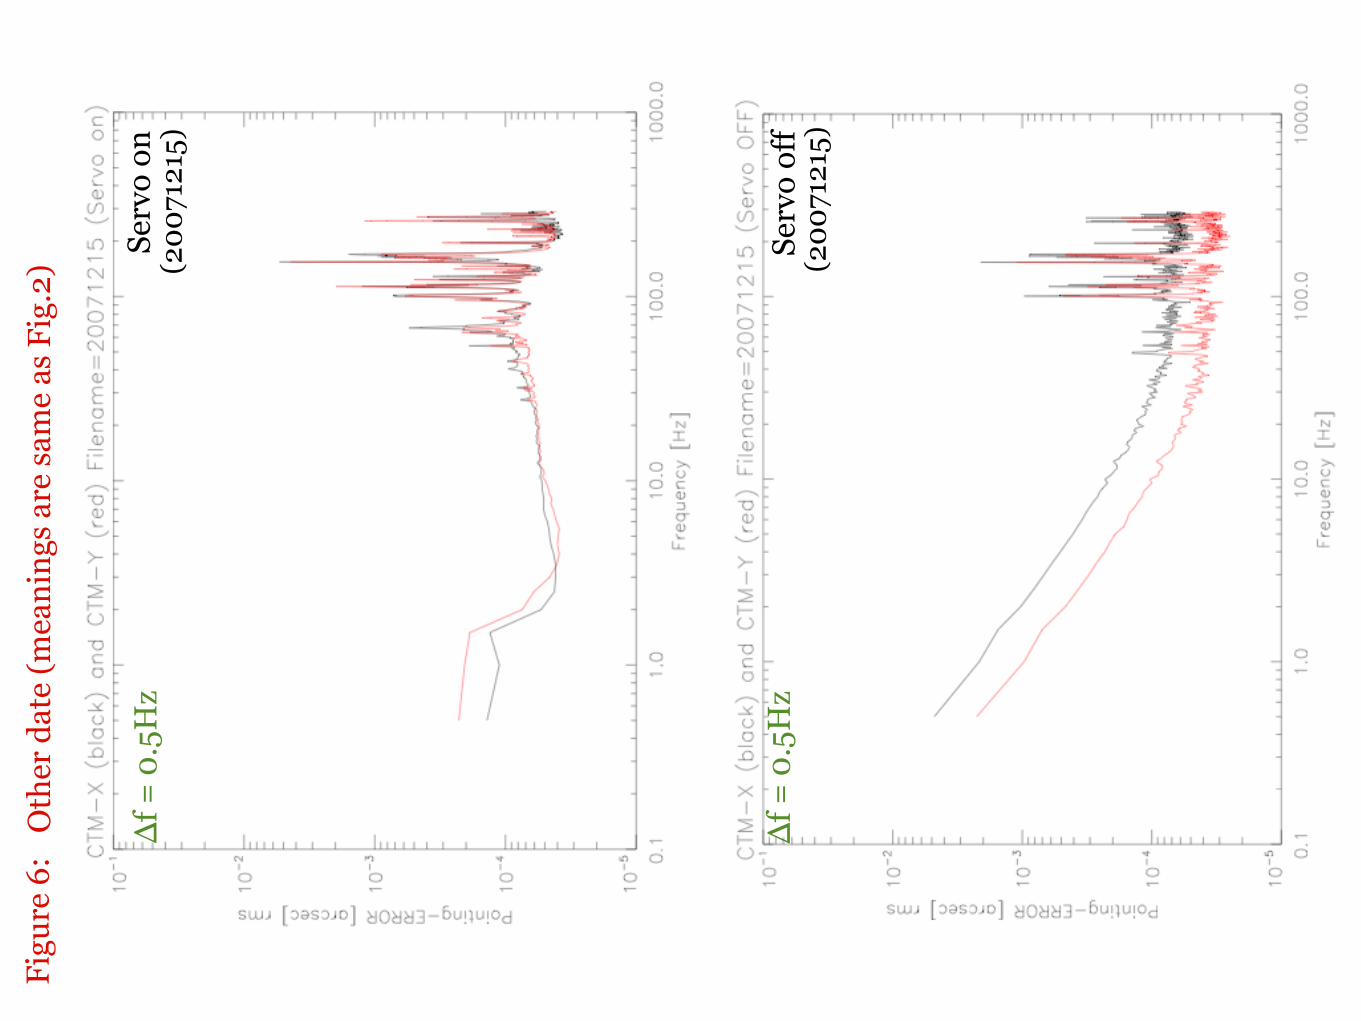
Figu
re 6
:
(200
7121
5)
(200
7121
5)
Oth
er d
ate
(mea
ning
s ar
e sa
me
as F
ig.2
)
Δf =
0.5
Hz
Δf =
0.5
Hz

Figure 7: Bode plot
G = 20log10(Aon/Aoff)Aon: amplitude in servo onAoff: amplitude in servo off
G: Gain
Data Set 3

Serv
o on
Serv
o of
f
(200
7121
6)
(200
7121
6)
Δf =
0.5
Hz
Δf =
0.5
Hz
Figu
re 8
:O
ther
dat
e (m
eani
ngs
are
sam
e as
Fig
.1)
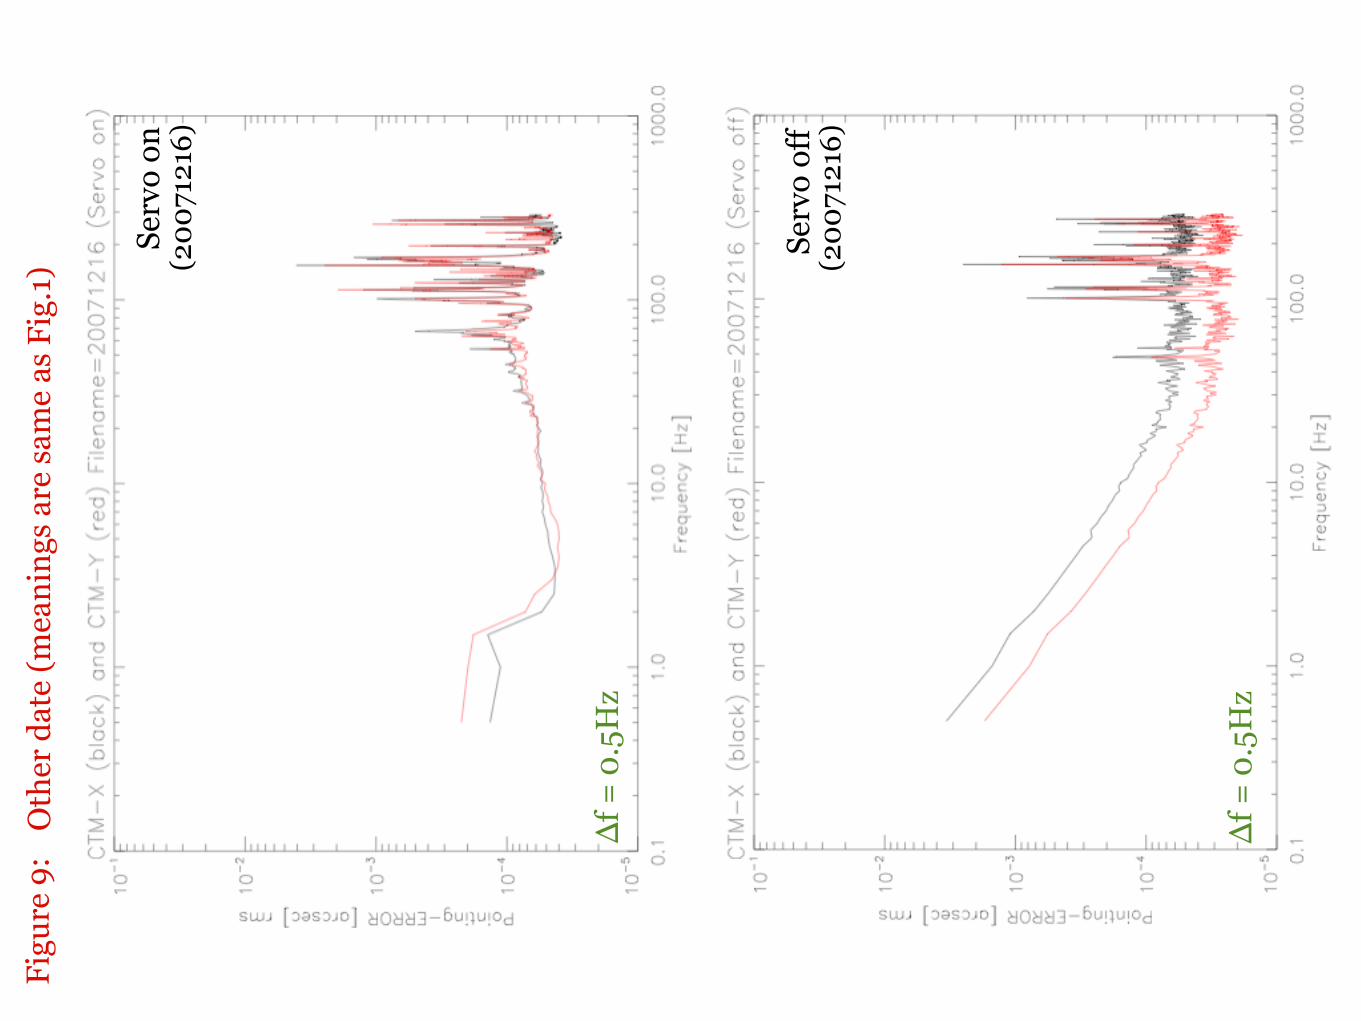
Serv
o on
Serv
o of
f
(200
7121
6)
(200
7121
6)
Δf =
0.5
Hz
Δf =
0.5
Hz
Figu
re 9
:O
ther
dat
e (m
eani
ngs
are
sam
e as
Fig
.1)

Figure10: (Bode plot)
G = 20log10(Aon/Aoff)Aon: amplitude in servo onAoff: amplitude in servo off
G: Gain


![Do You Know Hinode?. Communicating Solar Satellite Hinode Data to the Public Kentaro Yaji[Rikkyo University/Japan] CAP2010 Conference (2010/3/15-19,Cape.](https://static.fdocuments.in/doc/165x107/56649e585503460f94b514c4/do-you-know-hinode-communicating-solar-satellite-hinode-data-to-the-public.jpg)