Pocket Guide - Northwest Power and Conservation … 2 > POCKET GUIDE Fast Facts Abut the columbia...
24
Fast Facts About the Columbia River Basin POCKET GUIDE 2013 Edition
Transcript of Pocket Guide - Northwest Power and Conservation … 2 > POCKET GUIDE Fast Facts Abut the columbia...
Fast Facts About the Columbia River Basin
Pocket Guide
2013 Edition
PAGe 2 > POCKET GUIDE Fast Facts Abut the columbia River Basin < PAGe 3
The Northwest Power and Conservation Council was authorized by congress through the 1980 Pacific Northwest electric Power Planning and conservation Act (Northwest Power Act)
Fast Facts Abut the columbia River Basin < PAGe 3
to give the citizens of Idaho, Montana, Oregon, and Washington a stronger voice in determining the future of key resources common to all four states – namely, the electricity generated at, and fish and wildlife affected by, the columbia River Basin hydropower dams.
the council is a unique organization that helps the Pacific Northwest make critical decisions that balance the multiple uses of the columbia River and its tributaries.

PAGe 4 > POCKET GUIDE Fast Facts Abut the columbia River Basin < PAGe 5
Public ResponsibilitiesThe principal duties of the Council under the Act are to:
1. Develop a regional power plan to assure the Northwest an adequate, efficient, economical, and reliable power supply.
2. Develop a fish and wildlife program as part of the power plan to protect, mitigate, and enhance fish and wildlife affected by hydroelectric development in the Columbia River Basin, and make annual funding recommendations to the Bonneville Power Administration for projects to implement the program.
3. Encourage broad public participation in these processes and inform the public about regional issues.

Fast Facts Abut the columbia River Basin < PAGe 5
council organizationThe Council was authorized by Congress through enactment of the 1980 Northwest Power Act (Public Law 96-501) and approved by a vote of the legislatures of all four states. The governor of each state appoints two members to serve on the Council.The Council is funded by wholesale power revenues from the Bonneville Power Administration, the federal agency that markets the electricity generated at federal dams in the Columbia River Basin.The plans the Council develops and approves are implemented by numerous agencies, including: the Bonneville Power Administration; the U.S. Army Corps of Engineers; the Bureau of Reclamation; the Federal Energy Regulatory Commission; electric utilities; and state energy regulatory agencies.State, tribal, and local governments often work closely with the Council as it develops its power and fish and wildlife plans, and these entities also implement measures in those plans. The power plan and fish and wildlife program are updated at least every five years.
PAGe 6 > POCKET GUIDE Fast Facts Abut the columbia River Basin < PAGe 7
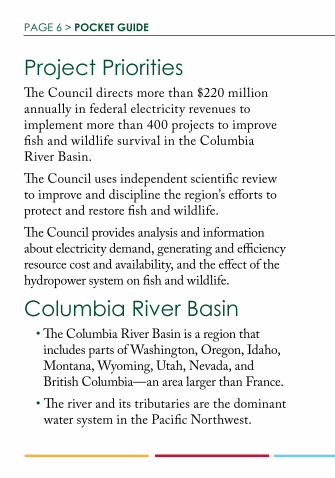
Project PrioritiesThe Council directs more than $220 million annually in federal electricity revenues to implement more than 400 projects to improve fish and wildlife survival in the Columbia River Basin.The Council uses independent scientific review to improve and discipline the region’s efforts to protect and restore fish and wildlife.The Council provides analysis and information about electricity demand, generating and efficiency resource cost and availability, and the effect of the hydropower system on fish and wildlife.
columbia River Basin• The Columbia River Basin is a region that
includes parts of Washington, Oregon, Idaho, Montana, Wyoming, Utah, Nevada, and British Columbia—an area larger than France.
• The river and its tributaries are the dominant water system in the Pacific Northwest.

Fast Facts Abut the columbia River Basin < PAGe 7
• The Columbia River is 1,214 miles long.• The Columbia River originates at Columbia
Lake in British Columbia, and about 25 percent of the river flow comes from Canada.
• The largest major tributary is the Snake River, which is 1,036 miles long.
• The Columbia River is a snow-charged river that fluctuates seasonally in volume.
• Average annual runoff at its mouth is about 192 million acre-feet.
• The highest volumes of water flow between April and September. The lowest volumes flow from December to February.
• From its source at 2,650 feet above sea level, the river falls an average of more than two feet per mile before reaching the ocean.
• Humans have lived along the river for more than 10,000 years, with a large increase in population when the Euro-American settlers arrived in the 1800s.

PAGe 8 > POCKET GUIDE Fast Facts Abut the columbia River Basin < PAGe 9
Fish and WildlifeFour species of Pacific salmon—chum, sockeye, coho, and Chinook—and two anadromous trout—steelhead and sea-run cutthroat—are found in the Columbia River Basin.Salmon and steelhead have existed in the river for about 12 million years.Historic annual runs of salmon and steelhead were believed to have numbered between 11 and 16 million fish. Fish counting at Bonneville
Fast Facts Abut the columbia River Basin < PAGe 9
Dam began in 1938 when the dam was com-pleted. In the first five years of counting, the salmon and steelhead runs averaged 597,350 fish per year at the dam. Today, the runs number between 1 million and 2 million per year. This does not include runs in Columbia tributaries downstream of the dam. Also, salmon harvests are lower today than when the dam was built.
By the early 20th century, spring and summer runs of Chinook salmon had been depleted through overharvest and habitat degradation.
Columbia River Basin resident fish spend their entire life cycle in freshwater and include warm water species such as bass and walleye, and coldwater species such as cutthroat trout, bull trout, and kokanee. Hydropower development also affected a diverse mix of wildlife, including song birds, deer, elk, moose, turtles, squirrels, rabbits, and many other species. The Council’s fish and wildlife program is intended to mitigate the impact of hydropower on these species, as well as on anadromous fish such as salmon and steelhead.
PAGe 10 > POCKET GUIDE Fast Facts Abut the columbia River Basin < PAGe 11
Seattle
Portland
Boise
Helena
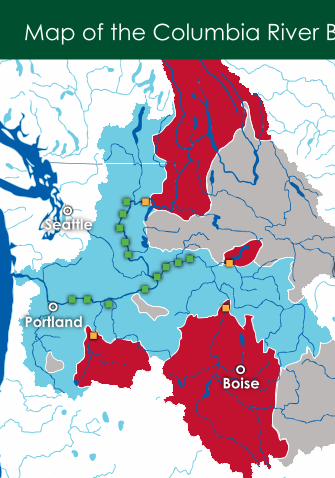
Map of the columbia River Basin

Fast Facts Abut the columbia River Basin < PAGe 11
of the original salmon and steelhead habitat available in the columbia River Basin, 55 percent of the area and 31 percent of the stream miles have been blocked by dam construction.
Seattle
Portland
Boise
Helena
Map of the columbia River Basin
Areas blocked by dams Areas blocked by natural obstructions Areas open to anadromous fish Major dams that block fish passage Major dams that allow fish passage

PAGe 12 > POCKET GUIDE Fast Facts Abut the columbia River Basin < PAGe 13
In 1988, the Council designated 44,000 miles of river reaches in the basin as “protected areas” where hydroelectric development is prohibited in order to protect fish and wildlife.
Regional Power SystemIn this guide we rely on two terms to measure electricity generation and supply: capacity and annual energy. Capacity is the maximum rate that a power plant can generate electricity at full-load operation. Annual energy is the quantity of electricity that a power plant can produce over the course of a year. Capacity is measured in million-watt units called megawatts. Annual energy is measured in units called average megawatts.In total, interconnected power plants in the Pacific Northwest can provide 61,300 megawatts of capacity. About 56 percent (33,400 megawatts) is at hydroelectric dams. These same power plants can provide about 33,700 average megawatts of annual energy (48 percent, or 16,200 average megawatts from
Fast Facts Abut the columbia River Basin < PAGe 13
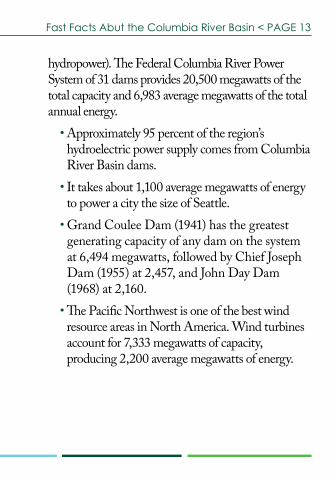
hydropower). The Federal Columbia River Power System of 31 dams provides 20,500 megawatts of the total capacity and 6,983 average megawatts of the total annual energy.• Approximately 95 percent of the region’s
hydroelectric power supply comes from Columbia River Basin dams.
• It takes about 1,100 average megawatts of energy to power a city the size of Seattle.
• Grand Coulee Dam (1941) has the greatest generating capacity of any dam on the system at 6,494 megawatts, followed by Chief Joseph Dam (1955) at 2,457, and John Day Dam (1968) at 2,160.
• The Pacific Northwest is one of the best wind resource areas in North America. Wind turbines account for 7,333 megawatts of capacity, producing 2,200 average megawatts of energy.
PAGe 14 > POCKET GUIDE Fast Facts Abut the columbia River Basin < PAGe 15
Natural Gas Baseload
Natural Gas Peaking
Nuclear
Other
Wind
Biomass
Coal
Hydro
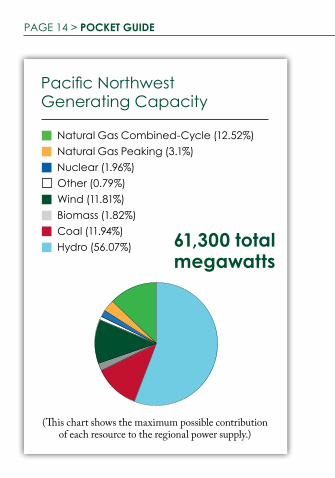
Pacific Northwest Generating capacity
61,300 total megawatts
Natural Gas Combined-Cycle (12.52%) Natural Gas Peaking (3.1%) Nuclear (1.96%) Other (0.79%) Wind (11.81%)Biomass (1.82%)Coal (11.94%)Hydro (56.07%)
(This chart shows the maximum possible contribution of each resource to the regional power supply.)
Fast Facts Abut the columbia River Basin < PAGe 15
Irrigation
Industrial
Commercial
Residential
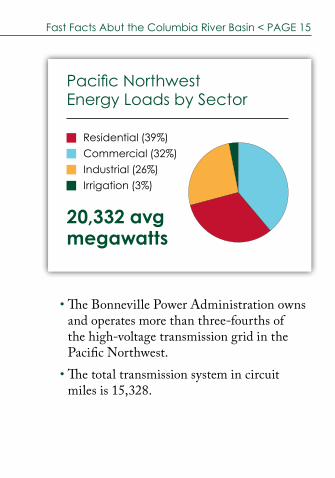
Pacific Northwest energy Loads by Sector
20,332 avg megawatts
Residential (39%)Commercial (32%) Industrial (26%) Irrigation (3%)
• The Bonneville Power Administration owns and operates more than three-fourths of the high-voltage transmission grid in the Pacific Northwest.
• The total transmission system in circuit miles is 15,328.
PAGe 16 > POCKET GUIDE Fast Facts Abut the columbia River Basin < PAGe 17
Energy EfficiencySince 1978, the region has reduced electricity demand by more than 5,000 average megawatts through energy efficiency measures.Expressed as electricity, 5,000 average megawatts is enough for all of Idaho and Montana. This efficiency saved Northwest ratepayers nearly $3.1 billion in 2011, compared to the average cost of generated electricity.During the last 25 years, energy efficiency met about half of the increase in the region’s electricity demand.As of 2011, energy efficiency comprised 16 percent of the region’s electricity resources.
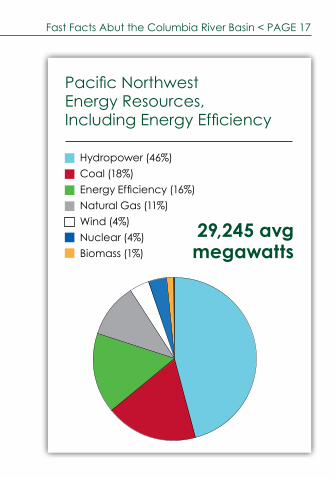
The chart to the right shows the average annual contribution to the regional power supply by major
resource. The total is more than the annual loads shown on page 15 because 1) the hydropower total includes
non-firm energy consumed outside the Northwest, and 2) energy efficiency is a resource that reduces loads, not
power that is consumed.
Fast Facts Abut the columbia River Basin < PAGe 17
Petroleum & Pet Coke
Biomass
Nuclear
Wind
Natural Gas
Energy E�ciency
Coal
Hydro
Pacific Northwest energy Resources, Including Energy Efficiency
29,245 avg megawatts
Hydropower (46%)Coal (18%)Energy Efficiency (16%)Natural Gas (11%)Wind (4%)Nuclear (4%)Biomass (1%)

PAGe 18 > POCKET GUIDE Fast Facts Abut the columbia River Basin < PAGe 19

Fast Facts Abut the columbia River Basin < PAGe 19
The average cost of energy efficiency is less than 1.8 cents per kilowatt-hour, which is about half of the cost of electricity from the most efficient natural gas-fired power plant.New cost-effective energy efficiency amounting to 5,900 average megawatts is achievable through 2030, according to the council’s power plan—enough to meet about 85 percent of forecasted demand growth during this period.Northwest utility investments in energy efficiency in 2011 ($420 million) represented 8 percent of the total national investment ($5.23 billion) but just 5 percent of the national population.
PAGe 20 > POCKET GUIDE Fast Facts Abut the columbia River Basin < PAGe 21
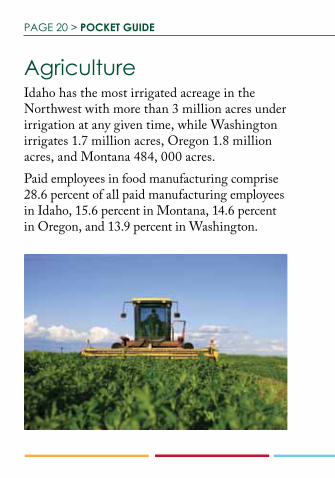
AgricultureIdaho has the most irrigated acreage in the Northwest with more than 3 million acres under irrigation at any given time, while Washington irrigates 1.7 million acres, Oregon 1.8 million acres, and Montana 484, 000 acres.Paid employees in food manufacturing comprise 28.6 percent of all paid manufacturing employees in Idaho, 15.6 percent in Montana, 14.6 percent in Oregon, and 13.9 percent in Washington.
Fast Facts Abut the columbia River Basin < PAGe 21
NavigationThe Columbia and Snake rivers form a 465-mile transportation system with 36 deepwater and inland barge ports. The 43-foot-deep navigation channel for ocean-going vessels extends 106 miles from the ocean to Vancouver, Washington on the Columbia River, and at 40 feet for an additional 11 miles on the Willamette River into Portland. A 359-mile inland barge system takes cargo upriver into Idaho.
Annual foreign waterborne commerce averages 42 million tons, and was valued at $20 billion in 2010. The Columbia River is the nation’s largest export wheat gateway, with 40 percent of all U.S. exports. The river handles cargo from 43 states.
PAGe 22 > POCKET GUIDE Fast Facts Abut the columbia River Basin < PAGe 23
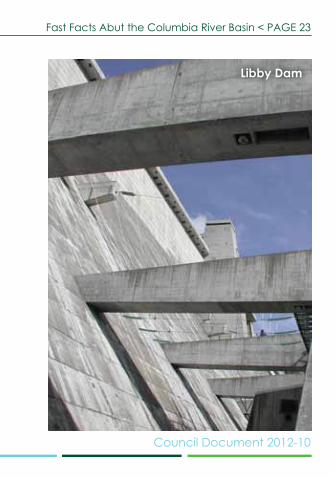
Flood controlIn 1948 flood control became a priority after Vanport, Oregon, north of Portland along the Columbia River, was destroyed by a flood. The Army Corps of Engineers responded by developing a multiple-use reservoir storage plan for the Columbia River Basin.In February 1996, the region was reminded of the importance of flood control. Government agencies and non-federal dam operators worked together to reduce flood damage by an estimated $3.2 billion.Major flood-control projects are Mica, Keenleyside, and Duncan dams in Canada, and Libby, Hungry Horse, Grand Coulee, and Dworshak in the United States.
Fast Facts Abut the columbia River Basin < PAGe 23
Libby Dam
Council Document 2012-10
www.nwcouncil.org
851 SW Sixth Avenue, Suite 1100 Portland, Oregon 97204-1348
T: 503.222.5161 T: 800.452.5161 (toll free)
F: 503.820.2370