CIVIL AVIATION SAFETY AUTHORITY OF PNG PNG Civil Aviation ...
Upload
alex-robertCategory
view
333download
5
LABORATORY MANUAL FOR DRILLING FLUIDS
AND CEMENTS AND RIG FLOOR SIMULATION
PNG 451 – OIL WELL DRILLING LABORATORY
Petroleum and Natural Gas Engineering
The Pennsylvania State University
9th Edition, 2010
Copyrighted @ 2010 PSU

FIELD TESTING OF DRILLING FLUIDS
INTRODUCTION
Every drill operation depends directly upon the properties of the drilling fluid. The properties
of the drilling fluid should be such as to promote safe and speedy drilling and completion of the
well with the maximum productive capacity. The use of drilling muds of controlled properties
frequently requires considerable sums of money. These expenditures must be justified and it is
well to examine the role of the drilling fluid to determine its necessary properties. The general
functions of a drilling fluid are:
1. Cooling and lubricates the bit and drill pipe.
2. Removing cuttings from the hole.
3. Preventing settling of cuttings in the hole when circulation stops and allowing dropping
of cuttings in the surface circulating system.
4. Depositing an impermeable wall cake.
5. Overcoming formation pressures to prevent influx of oil, gas, or water.
6. Preventing caving of the formation.
7. Preventing contamination of the producing formation.
8. Allowing good electric logs to be taken.
9. Reducing casting and cementing costs.
10. Preventing drill pipe corrosion.
Of all the mud systems in use today, the fresh water type is the basic, most universally used
mud system. The remaining mud systems have been developed to overcome drilling conditions
which fresh water muds have difficulty in handling or for which they are totally unfitted.
However, as we shall see, it is probably impossible for any one mud system to satisfy all the
necessary functions of a drilling fluid. Consequently, the choice of mud type for a specific
instance is governed by those functions which are the most critical to the well in question, and
some sacrifice of other desirable properties must be made.
Prepared as a guide, this section first discusses field tests that evaluate drilling fluids,
especially muds, by measuring certain properties of the drilling fluid and its filtrate. To associate
these tests more closely with drilling conditions, the significance of each test as a factor of
proper mud control, and, in turn, the importance of mud control to successful drilling, are
pointed out briefly. Second, this section details a series of experiments to help the student better
understand drilling muds.
2

TEST PROCEDURES
DENSITY (Mud Weight)
It is extremely important that the density of the drilling mud be known throughout the
drilling operation. This is true whether drilling through gas, oil, or saltwater sands; shale, where
relatively high density may be required; or into low pressure production zones, where low
density colloidal mud is advantageous. Frequent density tests aid in preserving a safety factor by
disclosing any changes taking place in the unit weight of the mud. The most practical instrument
for measuring mud density is the Mud Balance.
Mud Balance
The Mud Balance provides a simple method for the accurate determination of mud density.
Durably constructed, it consists principally of a base and graduated arm with cup, lid, knife edge,
rider, level, and counterweight.
Procedure:
1. Remove lid and fill cup to the top with sample to be tested. (When testing mud, first
remove air and other gases from sample using the Baroid Mud Dearator.)
2. Replace lid and rotate until firmly seated, making sure some sample squeezes out the vent
hole.
3. Wipe sample from exterior of balance.
4. Place balance on base with knife edges on fulcrum rest.
5. Move rider until instrument is in balance, as determined by level.
6. Read sample density at end of rider nearest fulcrum.
Results:
The instrument must first be calibrated by using distilled water as the sample. After
measuring the density of the water, dry the cup and then measure the density of the mud.
Calculate the true mud density (corrected for balance error) using the following formula:
densitymudTrue
densitymud
waterdistilledofdensityTrue
waterdistilledof MeasureddensityMeasured =
The density of distilled water is 8.33 pounds/gallon or 62.4 pounds/cubic foot.
(Alternately, balance error of the Mud Balance can be eliminated by adding or removing lead
shot from the counterweight.)
In most parts of the world mud weight is expressed in pounds per gallon (ppg). In California,
3

many companies use pounds per cubic foot.
VISCOSITY
Viscosity is a measure of the internal resistance of a fluid to flow: the greater the resistance,
the higher the viscosity. For drilling operations, viscosity of mud must be controlled and a
standard means of measuring viscosity provided. Hole size, hole condition, pumping rate,
drilling rate, cutting size, cavings, presence or absence of shale separators, mud weight, design of
the pit systems, and gel characteristics of the mud are factors influencing the specification of the
viscosity of any given mud.
The development of satisfactory instruments for measuring the viscosity of drilling muds has
been the subject of much effort. This is due largely to the fact that drilling fluids are
fundamentally thixotropic and the viscosity characteristics of such materials cannot be described
by means of a single measurement. The indicated viscosity as obtained on any instrument is valid
only for that rate of shear and will differ when measured at a different rate of shear. Two
instruments for determining will be described: the Marsh Funnel Viscosimeter and the Baroid
Rheometer (which is similar in operation to a Fann V-G Meter.)
Marsh Funnel Viscosimeter
The Marsh Funnel Viscosimeter is used for routine viscosity determinations on nearly every
drilling rig. The measurement obtained is influenced considerably by rate of gelation and by
density which varies the hydrostatic head of the column of mud in the funnel. Because of these
4

variations, the viscosities obtained with the Marsh Funnel cannot be correlated directly with
those found using rotational viscosimeters. Marsh Funnel viscosities are of little quantitative use
but have general comparative value.
Procedure:
1. Hold funnel in upright position with index finger over outlet. (Instead of holding funnel,
it may be placed in a ring stand.)
2. Pour the test sample freshly taken from the mud system, through the screen in top of
funnel until mud level just reaches the underside of the screen. (The funnel now contains
1500 cc of mud.)
3. Immediately remove finger from outlet tube and measure number of seconds for one
quart (946 cc) of the sample to run out. This time in seconds is recorded as the Marsh
Funnel Viscosity of the mud. Also report the temperature of the sample.
Baroid Rheometer
The Baroid Rheometer is a rotational viscosimeter with which one, two, or multiple point
viscosities. Its fixed speeds of 3 (GEL), 100, 200, 300, and 600 RPM are switch selectable with
the RPM knob. In addition, the same switch, when set to the VAR position, enables the operator
to select any speed between 3 and 625 RPM by annually adjusting the VARIABLE knob.
Procedure:
1. Place a recently agitated sample in the mud cup, and tilt the instrument head into the
field. Adjust the head with the knurled knob until the rotor sleeve is immersed to the
scribed line.
2. Stir the sample for about 15 seconds at 600 RPM.
5

3. Read the meter deflection at the following RPM’s: 3 (GEL), 10, 25, 50, 75, 100, 200,
300, and 600. (NOTE: The meter whose deflection is to be read is labeled VISCOSITY.
This label is incorrect. The meter deflection indicates shear stress; to calculate viscosity,
see below.)
Results:
1. The plastic viscosity (PV), in cp, is calculated by:
Plastic Viscosity Pµ=!"!= 300600
2. The apparent viscosity at each RPM, in cp, is calculated by:
Apparent Viscosity A
RPMµ=!# 300300=
3. The Bingham yield point (YP), in pounds/100 square feet, is calculated by:
Bingham Yield Point Pµ"!300=
4. Plot vs. RPM, as shown in Gatlin.
SHEAR OR GEL STRENGTH
The gel strength of drilling muds is a measure of the minimum shearing stress necessary to
produce slip wise movement. Two readings are generally taken: the first, immediately after
agitation of the mud in the cup; the second, after the mud in the cup has been quiescent for a
period of ten minutes. The readings are referred to as the initial gel strength and the ten - minute
gel strength, respectively. Both gel strength readings so determined will be zero for non-
thixotropic fluids, such as water and brines, no matter how viscous but the difference in the
readings may be appreciable for suspensions such as drilling muds. The difference is considered
to be a measurement of the thixotropic of the mud system. Hole size, type of formations, depth,
temperature and pressure of formation fluids or gases, and amount of weight material in the mud
are factors that must be considered in prescribing desirable gel-strength properties of the mud.
The Marsh Funnel has been used to some degree to obtain a measure of the gel strength of
muds. In making the gel strength test the viscosity time in seconds is first determined with
minimum delay between filling the funnel and making the measurement as described previously.
The funnel is then refilled and allowed to stand quiet for ten minutes, after which the
viscosity is again measured. The time difference in seconds between the first and second
measurements gives the gel strength in seconds. This method is not recommended and is given
largely for historical reference. The Baroid Rheometer is commonly used to measure gel
strength.
6

Baroid Rheometer
Procedure:
1. Stir a sample at 600 RPM for about 15 seconds.
2. Turn the RPM knob to STOP; allow the desired rest time (10 seconds for ten second Gel
strength; 10 minutes for ten minutes Gel strength) and then turn.
3. Switch the RPM knob to the GEL position; the maximum deflection of the dial before the
gel breaks is the Gel strength in pounds/100 square feet.
FILTRATION PROPERTIES
The filtration properties of drilling muds are a measure of the ability of the solid components
of the muds to form a thin, low-permeability filter cake. The lower the permeability, the thinner
the filter cake and the lower the volume of filtrate from muds of comparable solids
concentration. This property is dependent upon the amount and physical state of the colloidal
material in the mud. It has been shown repeatedly in the field that when mud of sufficient
colloidal content is used, drilling difficulties are minimized. In contrast, a mud low in colloids
and high in inert solids deposits a thick filter cake on the walls of the hole. A thick filter cake
restricts the passage of tools and allows an excessive amount of filtrate to pass into the
formation, thus providing a potential cause of caving and differential pressure wall sticking.
Lack of proper walling properties may result in further trouble such as difficulty in running
casing, creating a swabbing effect which may cause the formation to cave or swab reservoir
contents into the hole, and difficulty in securing a water shutoff because of channeling of
7

cement. The filtration properties will be studied with two pieces of equipment: The Filter press
and the Mud Sticking Tester.
Filter Press
The filtration, water loss, or wall building test is conduced with a Filter press. The test
consists of measuring the rate at which filtrate (the continuous liquid phase of the mud) is forced
from the sample under a specified pressure of 100 psig. Both the filtrate volume (ml) and the
mud cake thickness (32nd
of an inch) are reported. The Filter Press consists of a mud reservoir
mounted on a frame, a filtering medium, a means of catching and measuring the filtrate, and
provisions for a pressure source. The filtering medium is a sheet of especially hardened filter
paper which fits on a screen in the base cap.
Procedure:
1. Assemble the following dry pans in this order: base cap, screen, a sheet of filter paper,
rubber gasket, and cell. Secure the cell to the base cap.
2. Fill the cell with the sample to be tested to within ¼ “ of the top. Set the unit in place in
the filter press frame. Check the top cap to make sure the gasket is in place. Place the top
cap on the cell and secure the unit in place with the T-screw.
3. Place a dry graduated cylinder under the filtrate tube.
4. With the regulator T-screw in its maximum outward position (closed position), open the
valve to the cell. Apply a pressure of 100-psig to the filter cell by rapidly screwing the
regulator T-screw into the regulator. Timing of the test should begin now.
5. Record the initial filtrate loss; then record the filtrate loss every minute for the first 7.5
minutes (also record the loss at 7.5 minutes); then record the loss at 10, 15, 20, 25, and 30
minutes (end of test).
6. Close the valve to the cell rapidly and open the safety-bleeder valve. Return the regulator
T-screw to its maximum outward position.
Results:
1. Plot filtrate volume vs. square root of time (as shown in Gatlin, p.74). Determine the
collected 30 minutes filter loss.
2. The filter cake thickness is determined after the cell has been disassembled. The filter
paper with the cake deposited on it is removed from the base cap, and excess mud is
gently washed from the cake with a gentle stream of water. The filter cake thickness is
measured and reported in thirty-seconds of an inch.
3. Properties of the filter cake such as texture, hardness, flexibility, etc., may be reported.
8

Mud Sticking Tester
The sticking tendency of a mud filter cake is measured with the Baroid Mud Sticking Tester.
The torque required to free a steel disk in contact with a mud filter cake is measured and used in
the calculation of the “sticking coefficient.” The sticking coefficient is an indication of the force
required to rotate (or free) a section of drill pipe in contact with the wall cake in the borehole.
The sticking coefficient can be used to evaluate the cake lubricity of various muds.
Procedure:
1. Start with a clean apparatus. Be especially sure that the torque plate is clean, Scour the
face of the plate with abrasive cleanser until the plate shines and rinse thoroughly with
water. Then dry carefully.
2. Place filter paper, rubber gasket, the slip ring on screen inside chamber. Screw hold-down
ring over gaskets, using ring wrench.
3. Insert threaded end of one of the valve stems into bottom center hole of cell and turn
hand tight.
4. Fill cell with mud sample to the scribed line.
5. Set cell on stand mating the four tips into stand holes.
6. Slip torque plate stem through lid with polished surface facing up looking at inside of lid.
7. Put lid onto cell with stem of torque plate standing up through “O” ringed center hole of
9

lid. Tighten cell lid with Spanner Wrench, using torque plate level for a backup.
8. Insert the other valve stem in cell lid and tighten hand tight (closing valve).
9. Set CO2 assembly over top end of valve stem and insert locking pin.
10. Turn relief valve on CO2 assembly to closed position. Back out regulator handle.
11. Insert CO2 cartridge into knurled CO2 holder, and tighten holder onto head puncturing
cartridge.
12. Place graduate under cell and turn lower valve stem a quarter turn back from hand tight,
thus opening the valve.
13. Turn regulator handle in until 500 psi is read gage.
14. Pull plate stem up and hold there while opening top valve stem by turning stem a quarter
turn back from hand tight.
15. Record the time for the start of test.
16. Allow the mud to filter to desired cake thickness or filtrate volume, then push torque
plate down using the torque plate lever. To do this, catch the groove in the bar in the
column top cross support and hold plate down until pressures equalize allowing plate to
stick.
17. Record filtrate volume and time.
18. Allow plate to stick for 5 minutes or more. Put socket on torque wrench. Zero dial on
torque wrench. Place the torque wrench and socket on the hex top of the torque plate
stem, and measure the torque wrench while watching dial. With free hand, for a backup,
use the torque plate level wedged between columns above cell platform.
19. Record set time (i.e. plate sticking time), filtrate volume, and maximum torque.
20. Repeat steps 18 and 19 for additional readings.
21. Back off regulator handle and then open bleed-off valve.
22. Pull pin, remove CO2 assembly and remove top valve stem. Loosen cell lid with Spanner
Wrench, unscrew lid, and pour mud out of cell.
23. Disassemble apparatus and wash thoroughly, being careful not to scratch the torque plate.
Results:
1. The sticking coefficient is the ratio of the force necessary to initiate sliding of the plate to
the normal force on the plate, and is given by:
10

Sticking Coefficient PA
T
##5.1=
where: T = maximum torque, in inch-pounds.
A = plate area, in square inches.
P = differential pressure, in psi
For this instrument, A = 3.14 in2and P = 500 psi (as specified in step 13).
2.Plot sticking coefficient versus set time.
HYDROGEN ION CONCENTRATION
The degree of acidity or alkalinity of drilling mud is indicated by the hydrogen ion
concentration that is commonly expressed in terms of pH. The hydrogen ion concentration of a
drilling mud exerts considerable influence on its properties and hence is of interest to the
petroleum engineer. pH control is also important in corrosion control, usually pH is kept above
10 for this reason.
Water dissociates slightly into hydrogen ions and hydroxyl ions. It can be shown that at a
given temperature the product of the concentrations of these ions is a constant. That is:
(H+) (OH
-) = K = l x 10
-14(at 25 C)
In pure water the concentrations of these two ions are equal and each is 10-7
moles per liter.
The addition of an acid will increase the concentration of hydrogen ions with a corresponding
decrease in hydroxyl ion concentration. Thus, if a water solution contains one mole per liter of
hydrogen ions, then the hydroxyl ion concentration must be 10-14
moles per liter by the above
expression for the dissociation of water. Conversely if the solution is made basic there will be a
corresponding decrease in hydrogen ion concentration. The product of the two ion
concentrations will, however, remain constant. The pH of a solution is a measure of its hydrogen
ion concentration. pH is defined as:
pH ( )++ "=©
℘= HH
log1
log
Thus in pure water ( H+) = (OH
-) = 10
-7 and the pH is 7. A solution containing one mole of
hydrogen ion per liter would have (H+) = l and the pH is 0.
The pH measurement is used as an aid in determining the need for chemical control of the
mud as well as indicating the presence of contaminants such as cement, gypsum, etc. The
opening pH for any drilling muds is commonly measured with an electronic pH Meter.
11

pH Meter
The electromatic hydrogen ion determination offers a fast, accurate determination of pH. The
operation of these meters involves the generation of an electric potential in a glass and calomel
electrode system by the solution under test. The electrical potential is amplified by means of a
vacuum-tube system and the reading is indicated directly on a meter.
Procedure:
1. Check battery by turning selector to BAT CK.
2. Turn selector to STANDBY position. Selector must be kept in this position while rinsing,
removing, or inserting electrodes to prevent damage to delicate electronic components.
3. Remove plastic end cap and soak electrode in distilled water a few minutes, then wipe
with soft tissue.
4. Add sufficient buffer solution to a test tube to cover the electrode when inserted (use
buffer of pH in range expected of mud pH). Insert electrode.
5. Set temperature knob to the solution temperature.
6. Turn selector to READ, IMPORTANT, Do not electrode in your hand while taking
reading. Remove hand at least 12 inches away. Local radio transmission and electric
fields often conduct through the human body and cause shifts in readings.
7. Set meter to pH of buffer with STANDARIZE knob.
8. Turn selector to STANDBY. Note: By noting reading in this position, electronics drift
can be compensated by bringing the meter back to this reading with STANDARDIZE
knob, thus avoiding frequent buffering.
9. Remove electrode and rinse with distilled water.
10. Insert electrode into solution to be tested.
11. Turn selector to READ.
12. Stir carefully to assure fresh solution. Wait adequate time for a steady reading. Make sure
temperature knob is set correctly. Remove hand from electrode before reading.
13. Turn selector to STANDBY = = before removing electrode from solution.
14. To run next sample, repeat steps 9 through 11.
15. When finished, turn selector to OFF. Rinse electrode in distilled water and wipe clean
with soft tissue.
16. Before storing, wet electrode with a few drops of pH 7 buffer and replace plastic
protector.
12

RESISTIVITY
Control of the resistivity of a mud and mud filtrate while drilling may be desirable to permit
better evaluation of formation characteristics from electric logs. A salt mud (low resistivity) will
prevent the obtaining of a good, definitive SP curve. The determination of resistivity is
essentially the measurement of resistance to flow of electrical current through a known
configuration of a sample. Measured resistance is converted to resistivity by use of a cell
constant. The cell constant is fixed by the configuration of the sample in the cell and is
determined by calibration with standard solutions of known resistivity. The resistivity is
expressed in ohm-meters.
Any type of cell and instrument which is sufficiently accurate to permit determination of
resistivity within five percent of the correct value may be used. If the instrument indicates the
sample resistance in ohms, the cell constant must be known. The resistivity in ohm-meters is
obtained by multiplying the resistance in ohms by the cell constant in square meters per meter. If
the instrument is a type of direct-reading resistivity meter, the cell constant has been adjusted to
a particular value or accounted for in the circuitry of the meter. Such an instrument measures the
sample resistance and converts it to the resistivity so that the reading is taken directly in ohm-
meters.
Baroid Resistivity Meter
The Baroid Resistivity Meter is a transistorized electrical meter for measuring the resistivity
of fluids, slurries, or semi-solids having resistivities of 0.01 to 10 ohmmeters. (The instrument
reads directly in ohm-meters.) Conductivity of the medium being measured is obtained by taking
the reciprocal of the resistivity measurement.
13

Procedure: Filtrate and Mud
1. Fill cell with fluid, being careful to remove all air bubbles (fill and exhaust fluid two or
three times to thoroughly wet the surface).
2. Connect cell to the meter.
3. Press the black button and adjust for full scale reading on the meter.
4. While keeping the black button depressed, press the red button.
5. The reading on the meter is the resistivity of the fluid. (When testing mud, it may be
necessary to allow 3 to 5 minutes after putting mud in the cell before taking a reading to
allot the cell and mud to reach temperature equilibrium.)
6. Record the resistivity reading and the cell temperature.
7. Remove the cell and clean with distilled water. (Pipe cleaners can be used to remove mud
that cannot be flushed out with water.)
Procedure: Mud Cake
1. Remove excess water from filter cake.
2. Fill the slot on top of the cell with mud cake.
3. Press black button and adjust for full scale.
4. While keeping the black button depressed, press red button.
5. The reading on the meter is the resistivity of the mud cake.
6. Record the resistivity of the mud cake and the cell temperature.
7. Remove the cell and clean thoroughly with distilled water.
14

Note:
1. Use only fresh or distilled water (mild soaps only when necessary) to clean the cell. Do
not use any type of solvent. Do not scratch the inner surface of the cell when using a pipe
cleaner.
2. When full-scale reading cannot be obtained when the black button is depressed, the
battery needs to be replaced. Use a 22.5 V Burgess U-15 or equivalent. Be sure to
observe polarity when replacing the battery in order to prevent damage to the transistor.
15

FIELD TESTING OF OIL WELL CEMENTS
INTRODUCTION
The discovery of Portland cement dates back to 1824 when Joseph Aspdin, an English
mason, was issued a patent covering gray, rock-like material called “cement”. This cement was
produced by feeding a finely ground mixture of limestone, clay, into a rotating kiln at 2600 F. As
this mixture traveled through the kiln it was convened into cement clinker. The clinker was then
stored in bins and later ground with gypsum (retarded setting time and added strength) to form
the final cement.
It was not until the early 1900’s, through, that the use of cement in oil well operations was
introduced. In 1903, Frank F. Hill used a cement slurry to shut off down-hole water just above an
oil sand in the Lompoc field in California. Since that time no other production operation has
played as important a role in the producing life of an oil well.
Basically, oil-well cementing is a process of mixing a cement-water slurry and pumping
down steel casing to critical points located in the annulus around the casing, in the open hole
below or in fractured formations. This operation is referred to as primary cementing. Its main
functions are to (1) support the casing, (2) seal off non-productive formations, and (3) retard
corrosion by minimizing casing contact with saline formation waters.
Secondary cementing deals with completion and remedial repairs on a well after the
producing zone is reached. Squeeze-cementing, the most common form of secondary cementing,
involves applying hydraulic pressure to force or “squeeze” a cement slurry in contact with a
formation, either in open hole or through perforations in the casing. By squeezing cement at
given depths (1) hydrocarbon producing zones can be segregated from those formations
producing other fluids, (2) casing leaks can be repaired or, (3) thief zones sealed.
In oil-field practices cement is exposed to an infinite variety of environments; therefore,
cements with various qualities are needed. To provide for these growing needs the American
Petroleum Institute annually produces a list of cements, API Standards 10A, Specifications for
Oil-Cements and Cement Additives for manufactures and users. They are listed in the API
Standards 10A dated April 1977 as follows:
Class A: Intended for use from surface to 6,000 ft (1830 m) depth when special properties
are not required. Available only in ordinary type.
Class B: Intended for use from surface to 6,000 ft (1830 m) depth when conditions require
moderate to high sulfate-resistance. Available in both moderate and high sulfate-resistant types.
Class C: Intended for use from surface to 6,000 ft (1830 m) depth when conditions require
high early strength. Available in ordinary and moderate and high sulfate-resistant types.
Class D: Intended for use from 6,000 ft to 10,000 ft (1830 m to 3050 m) depth under
16

conditions of moderately high temperatures and pressures. Available in both moderate and high
sulfate-resistance types.
Class E: Intended for use from 10,000 ft to 14,000 ft (3050 m to 4270 m) depth under
conditions of high temperatures and pressures. Available in both moderate and high sulfate-
resistant types.
Class F: Intended for use from 10,000 ft to 16,000 ft (3050 m to 4880 m) depth under
conditions of extremely high temperatures and pressures. Available in both moderate and high
sulfate-resistant types.
Class G: Intended for use as a basic cement from surface to 8,000 ft (2440 m) depth as
manufactured, or can be used with accelerators and retarders to cover a wide range of well
depths and temperatures. No additions other than calcium sulfate or water, or both, shall be
interground or blended with the clinker during manufacture of Class G cement. Available in
moderate and high sulfate-resistance types.
Class H: Intended for use as a basic cement from surface to 8,000 ft (2440 m) depth as
manufactured, and can be used with accelerators and retarders to cover a wide range of well
depths and temperatures. No addition other than calcium sulfate or water, or both, shall be
interground or blended with the clinker during manufacture of Class H cement. Available in
moderate and high (Tentative) sulfate-resistant types.
Class J: Intended for use as manufactured from 12,000 ft to 16,000 ft (3650 m to 4880 m)
depth under conditions of extremely high temperatures and pressures or can be used with
accelerators and retarders to cover a range of well depths and temperatures. No additions of
retarder other than calcium sulfate, or water, or both, shall be interground or blended with the
clinker during manufacture of Class J cement.
Although the API lists nine different classes of cement, only five (A, B, C, G, H) are
available from manufacturers in the United States. These five cements with the addition of
chemicals called additives (see Appendix B) can change cement properties to meet most well
conditions. Class G and H cements are very similar and are the most commonly used. G is used
in California and H in the Gulf Coast Areas.
As in our discussion of drilling fluids, we will first examine field test that evaluates critical
properties of oil field cements. These tests are outlined for standardization in API RP 10B. Then,
several experiments are presented to expose the student to the measurement of such properties as
compressive strength, thickening time, etc. and their role in providing adequate cement control.
17

TEST PROCEDURES
WATER CONTENT OF SLURRY
Water is added to cement to make the slurry pumpable and provide for hydration (the
chemical reaction), although only 25.0 % water by weight of cement may be needed for
hydration, normal water content is higher to provide for pumpability.
Minimum and maximum water content values are determined for given cement in the
following manner.
Minimum Water Content
The minimum amount of water for any class of cement is defined as that amount of which
can be used without producing a slurry of consistency greater than 3O Uc2 as measured by a
consistometer (the consistometer operation is described in the section labeled Thickening Time).
If less than the minimum amount of water is used, the friction in the annulus plus the hydrostatic
pressure may be high enough to break down weak formations. In addition, since the water-
cement ratio is low, the loss of a small amount of water to thief zones or tubing leaks may cause
the cement to set prematurely. On the other hand, it may be necessary to use the minimum water
content where maximum slurry weight or strength is required or to control lost circulation.
*All cement additives are given as a percent of the dry cement weight.
Procedure:
1. The required quantity of water shall be placed in the Waring blender at slow speed and
the cement sample added.
2. After all the cement has been added to the water, cover the container and stir at high
speed for 35 seconds.
3. Pour the slurry immediately into the atmospheric consistometer and stir at 80F for a
period of 20 minutes, at which time the consistency shall be recorded.
4. Several runs with various water contents should be made and plotted to determine the
amount of water at which a consistency of 30 Uc is obtained and, therefore, the minimum
water content.
Maximum Water Content
The maximum water content is defined as that quantity of water that can be mixed with a
given cement without causing the separation of more than 2.5 ml of free-floating water when the
slurry is allowed to stand for 2 hours at room temperature in a 250 ml graduate. If more than the
maximum amount of water is used, cement particles will settle out of the slurry to the extent that
free-water pockets and low-strength cement will exist within the cement column. The maximum
2Universal consistency units (Uc) are dimensionless units formerly referred to as “poises”.
18

water content should never be exceeded unless bentonite gel or a similar material is blended with
the cement to tie up excess water.
Procedure:
1. Prepare cement slurry as previously described.
2. Pour the slurry immediately into an atmospheric consistometer and stir at 80 ºF for 20
minutes.
3. Then remix the slurry an additional 35 seconds at high speed.
4. Fill a 250 ml graduate cylinder with slurry, seal with a rubber stopper, and let stand for 2
hours.
5. Remove the supernatant water developed by standing with a pipette and measure in a
graduated cylinder.
6. Several runs with various water contents should be made and plotted to determine which
water content yields 2.5 ml of free water on standing 2 hours. This is the maximum water
content for the tested cement.
DENSITY
The density of cement slurry is, except for squeeze jobs, slightly heavier than the mud in the
hole. This minimizes chances of either a blowout or lost circulation occurring during cementing
and aids in removing drilling mud from the hole.
The density can be controlled by the amount of water (between minimum and maximum
stated above) added to the slurry. In addition, for lower densities -10.8 to 16.5 lb/gal, materials
that “hold” large volumes of water such as bentonite, diatomaceous earth or expanded perlite are
often used. For greater densities 15.6 to 22 lb/gal, weighting materials such as hematite and
barite are commonly used.
In field operations, slurry density is customarily monitored with a standard mud balance.
Automated weighting devices, however, fitted into the discharge line between the mixing unit
and the wellhead, give a more uniform weight record and are becoming an accepted practice.
Mud Balance
The Mud Balance provides a simple method for the accurate determination of mud density.
Durably constructed, it consists principally of a base and graduated arm with cup, lid, knife edge,
rider, level, and counterweight.
19

Procedure:
1. Remove lid and fill cup to the top with sample to be tested. Puddle the sample 25 times
with a glass rod to remove entrapped air.
2. Replace lid and rotate until firmly seated, making sure some sample squeezes out the vent
hole.
3. Wipe sample from exterior of balance.
4. Place balance on base with knife edges on fulcrum rest.
5. Move rider until instrument is in balance, as determined by level.
6. Read sample density at end of rider nearest fulcrum.
Results:
The instrument must first be calibrated by using distilled water as the sample. After
measuring the density of the water, dry the cup and then measure the density of the mud.
Calculate the true mud density (corrected for balance error) using the following formula:
densitymudTrue
densitymud
waterdistilledofdensityTrue
waterdistilledof MeasureddensityMeasured =
The density of distilled water is 8.33 pounds/gallon or 62.4 pounds/cubic foot. (Alternately,
balance error of the Mud Balance can be eliminated by adding or removing lead shot from the
counterweight.)
STRENGTH TESTS
One major performance criterion of oil-well cement is in its strength. Cement must (1) secure
and support easing in the hole, (2) set quickly to reduce rig waiting on cement (WOC) time, and
(3) withstand the shock of continued drilling and perforating.
There is no universal agreement on strength requirements for oil-well cements; however, it is
generally accepted in the industry that a compressive strength of 500 psi is adequate for most
operations. Three variables - cement type, temperature, and pressure - affect the setting time and
ultimate compressive strength. Since temperature and pressure of the well are predetermined we
must alter the cement’s composition to minimize WOC time yet provide adequate strength.
Early strength is increased with the addition of accelerators such as calcium chloride,
ammonium chloride and ‘minimum water’. In hot or high pressure formations it may be useful to
retard the cement’s setting time with lignosulfonate, CMHEC, and “maximum” water. But also
in high temperature formations, cement compositions may retrogress (lose strength) after
reaching a high value.
20

Cements containing retarders for high temperature applications seem particularly subject to
strength retrogression. Although remaining compressive strength may be adequate for many
applications, the addition of 35% silica flour to the slurry provides a way to maintain
compressive strength.
Versa Tester
The Versa Tester is a hydraulic loading apparatus which compresses cement specimens until
they fail (fracture). Unlike the machines used in sophisticated testing which load specimens
mechanically at a constant rate (1000-4000 psi/min) you must hand load specimens in the Versa
Tester. When adding pressure to your specimens take care to load the samples slowly. Also note
that reliable strength tests depend upon careful observance of all specified requirements and
procedures. Improper centering of specimens in the Versa Tester can result in oblique fractures
yielding low-strength results.
Procedure: 3
1. Prepare the cement slurry to be tested as previously described.
2. Place the slurry in the lightly greased molds and puddle each mold.25 times.
3. After pudding, remove the excess slurry from the top of each mold using a straightedge.
4. Specimens can be cured at atmospheric temperature or in an oven for periods of 8, 24, 48
and 72 hours.
5. When samples are to be tested at ages of less than 24 hours, remove the samples from the
oven approximately 30 minutes before testing.
6. Set the sample to be tested on the Versa Tester platform centered under the hydraulic
piston.
7. Close the valve on the hydraulic pump and lower the piston onto the sample.
8. Add pressure slowly onto the sample by pumping and record the maximum pressure.
Have another person watch the gauge as you load the sample. (It will return to 0 pounds
when the sample fails). Note: the gauge reads pounds and you must convert to psi by
dividing by the average cement cross-sectional area.
( ) topofAreabottomofArea2
1area +=Average
Results:
The compressive strength (psi) of the sample tested is measured as the maximum pressure
prior to failure on the Versa Tester. Strengths of 500 psi are normally necessary prior to
returning to drilling operations. By measuring strengths at various times the WOC can be
estimated.
3Always wear eye protection when testing cement’s compressive strength.
21

THICKENNING TIME
Cement slurry must remain pumpable until it is in place, within some margin of error. This
limit of pumpability i.e. thickening time is defined as when the slurry reaches a viscosity of 100
poises.
Thickening time is a function of both temperature and pressure as shown below.
It must be established to ensure adequate pumping time for slurry placement. Avoid cements
with excessive thickening times to prevent; delays in resuming drilling operations, settling and
separation of cement slurry components, formation of free-water, pockets, loss of hydrostatic
head and gas cutting.
Consistometer
Thickening time is measured using a pressurized or atmospheric (our model) consistometer.
As the apparatus applies heat and pressure to the slurry, simulating cement flow in a well, a
continuous consistency measurement is recorded as a strip chart. The limit of pumpability is
reached when the torque on the paddle in the slurry cup reaches 100 Uc. Please note that these
measurements are made in metal vessels which prevent any fluid loss. Your time valves will be
higher than they might be opposite a permeable zone, after partial dehydration.
Procedure:
Care shall be taken to see that the apparatus is clean. After each test the inside of the cell and
the paddles, particularly the outside edges should be cleaned and brushed. Surfaces that come in
contact with the slurry shall be given a thin coating of waterproof grease or light oil before each
test.
1. Fill the bath with water. Place the empty cells in the water bath and bring the bath to the
testing temperature. After the bath has reached this temperature set the heat control and
turn the switch to low.
2. Test the paddle for excessive friction by running the cylinder assembled, but without
cement inside, for a few minutes. If the paddle is bent to such an extent that it rubs on the
side, an appreciable movement will be shown by the indicator. The two bearings in the
slurry indicating lid should be checked periodically for excessive friction. These defects,
if found, should be corrected before starting additional tests.
3. With the paddle out, fill each cylinder of the consistometer with 500 cc (the line scribed
the cylinder). Some space has been left between the scribed line the lid for increased
volume when the paddle is inserted in the cylinder and when the slurry is heated. The
slurry is poured into the cylinder, the paddle inserted, and the lid put on, being careful
that the slotted shaft engages the pin in the lid, The cylinder is then placed in the
consistometer, and the viscosity (Uc) is read on the scale. The scale is divided into 10
units, with each division representing 10 Units of Consistency. A reading of 3 would be
30 Units of Slurry Consistency, etc.
22

4. Start the motor and a stop watch and take readings every 10 minutes for the first hour and
at every 30 minutes thereafter until the cement starts to stiffen.
5. When either sample has reached a consistency of 70 Uc, turn off the motor and remove
the cylinder for cleaning, if the other cement slurry has not started to set, the test may be
continued with only one cell in place.
6. BE CERTAIN THAT EACH CELL IS CLEANED IMMEDIATELY AFTER IT IS
REMOVED.
Observe the following precautions:
1. Watch the indicators during a test run. Do not allow the cement to remain in the
containers after a consistency of 10 has been reached.
2. Check and clean the bearings before each test.
3. Watch the temperature control.
4. Never turn the heater on unless the bath is fitted with water.
5. Cover the water surface with a film of oil to prevent rusting.
6. Do not mix parts. Each container is a separate unit.
7. Remove the cement immediately after removing the cylinder.
8. Never use force or pry the gears when placing a cylinder.
9. Do not clean the cylinders or paddles with acid.
10. Slide the cylinder bracket out, place the cylinder, and push forward to engage the gears.
11. Be sure that the end of the thermometer is submerged.
12. Be sure that the pointers read zero before starting the test.
13. Be sure that the indicator cord lies on the outside circumference of the cylinder top.
Results:
The results of tests are read directly from the indicator and no calculations are necessary so
long as the machine is in calibration. However, the consistency readings may be plotted on
common graph paper with the consistency as the ordinate and time as the abscissa.
The general shape of the consistency-time curve plotted as described above presents an
excellent picture of a particular cement as far as its setting characteristics are concerned. A visual
comparison of the curves of several cements will usually disclose characteristic differences with
regard to a particular cementing application.
There are certain features common to all consistency-time curves. The cement slurry
generally has a fairly low initial consistency. As stirring is continued, this value usually drops a
little more. It then begins to increase at very gradual rate. However, as time goes on, the rate of
23

increase of consistency is accelerated to such an extent that the latter part of the curve is quite
steep. This acceleration varies with different cements and with different testing temperatures.
From the standpoint of the majority of oil-well cementing requirements, a proper cement
slurry should reveal the following characteristics on a consistency curve produced with a
Halliburton Consistometer at temperatures corresponding to well conditions.
1. Initial consistency between 10 and 30 Uc (Units of Consistency)
2. Consistency to remain below 40 Uc for 3 hours from time of introductions into
consistometer.
3. Sharp break toward higher consistency after 3 hours.
4. Tangent to curve should be practically vertical when curve reaches consistency of 100
Uc. This feature is indicative of the rapidity with which the cement will develop strength
after initial set.
Note:
It is understood that units of measurement of viscosity should properly apply only to true
fluids, and that a cement slurry is not a true fluid; however, the effective resistance to flow
offered by a cement slurry can be conveniently measured by a Halliburton Consistometer and,
hence, the advantage of expressing the consistency of a cement slurry in terms of Units of
Consistency (Uc)
FLUID LOSS
The water loss of neat cement is extremely high. Consequently, when a slurry contacts a
porous formation from which the mud cake has been removed, it may quickly become
dehydrated and undergo a flash set. This problem is common in cementing deep liners and in
squeeze cementing.
In the 1960’s, significant progress was made in developing cement additives that lower fluid
loss with a high molecular weight, synthetic polymer but these additives are usually affected by
temperature. Generally, thickening time is retarded and, at low temperature, this retardation may
have to be offset by accelerators. Bentonite and CMHEC are also used to reduce filtrate loss.
Cement Filter Press
To measure filtrate characteristics of cement slurries, the API specifies a standardized 30-
minute test at 100 psi.
The API procedure employs a filter assembly consisting of a frame, a cylinder, and a 325-
mesh screen supported by a 60-mesh screen as the filtration medium. The heating jacket makes it
possible to simulate formation temperatures.
24

Procedure:
1. The filter press cylinder shall be filled with the cement to be tested, capped, and secured
in the frame.
2. Place a dry graduated cylinder under the drain tube to receive the filtrate.
3. Close the relief valve and pressure the system to 100 psi with the gas supplied.
4. Timed from the initial pressure application, filtrate readings shall be taken at ¼, ½, 1, 2,
and 5 minutes and thereafter at 5-minutes intervals until 30 minutes have elapsed.
5. If dehydration occurs before the end of the 30-minutes test period, the time required to
dehydrate the sample shall be observed.
6. Release the pressure on the filter pressure and clean with water making sure the screen is
properly washed.
Results:
The API filter loss of all cement slurries without additives is high-in excess of 1,000 ml.
When all the filtrate is received in the test cell in less than 30 minutes, the following equation is
used to calculate the hypothetical 30-minute fluid-loss valve.
t477.5
30 tFF =
where F30 = quantity of filtrate in 30 minutes
Ft = quantity of filtrate at time t.
t = time in minutes
Cement slurries having laboratory fluid-loss values of 50 to 150 ml in 30 minutes are
commonly used in squeeze cementing. In cementing deep liners, the API filter loss may be as
high as 300 ml.
PERMEABILITY
Although in designing cement slurries only slight emphasis is given to the permeability of set
cement, there are means of measuring it for both water and gas. The API has specified a standard
system that involves the use of a permeameter, which we will not use in this course.
Set cements have very low permeabilities - much lower, in fact, than those of most producing
formations. Data have shown that at temperatures less than 200 F the permeability of cement
decreases with age and temperature. After 7 days of curing, the permeability is usually too low to
measure.
The permeability of set cement to gas is normally higher than to water, but measurements of
25

the former are less reliable because it is difficult to obtain good representative samples for
measuring gas flow. Cements that have set for 3 to 7 days have a gas permeability of less than
0.1 md. Dolomite and limestone have an average of 2 to 3 md and oolitic limestones usually
have a very low permeability. Sandstone has gas permeability ranging from 0.1 to 2,000 md.
Silica flour, besides inhibiting strength retrogression, also reduces the permeability of set
cements. For example, cements cured at 350 F displayed a permeability of 1 md but with the
addition of 35% silica flour was reduced to less than 0.001 md.
RHEOLOGICAL PROPERTIES
A common cause of failure in primary cementing is incomplete displacement of drilling
muds, which can leave vertical, mud filled channels of cement. This mud may be displaced later
under producing conditions to create open channels that permit formation fluids to migrate
upward behind the casing.
Two basic forces are associated with drilling and displacement during primary cementing.
They are differential pressure and cement-on-mud (fluid-on-fluid) drag forces. To effectively
displace muds, oil well cements must exert a combination of differential pressure and drag forces
of sufficient magnitude to overcome forces resisting displacement.
Mud and oil well cement slurries being non-Newtonian in nature (viscosity changes with
shear rate) has led to several mathematical models beings used in predicting flow properties and
interrelationships of such muds and cements. The Bingham Plastic Model and the Power Law
Model are most commonly used. The former has been utilized since the mid-1940’s, power Law
Model Equations - presented in the late 1950’s - are more generally used than those of the
Bingham Model and will be presented here. Such models attempt to describe the relationship of
shear rate and shear stress for muds and slurries. Extremely useful in analyzing the displacement
process, they are not precise techniques and should be used only as an indicator to acceptable
displacement conditions.
Baroid Rheometer
The Baroid Rheometer is used to measure the consistency index (K) and flow behavior index
(n) of cements. Field models have two speeds to develop shear rate to 300 and 600 rpm, while
our lab model has constant variation from 0 to 600 rpm.
Procedure:
1. Prepare the prescribed slurry in the Waring Blender in accordance with the previous
procedure described in the section titled Minimum Water Content.
2. The cement shall then be stirred at slow speed for a period of 10 minutes.
3. Transfer slurry to sample cup with minimum time lag. With rotor turning at 600 rpm,
26

place rotor into the cup containing the slurry up to the level at the designated line on the
sleeve.
4. The initial reading at 600 rpm shall be taken 60 seconds after continuous rotation. Then
lower the rotor speed to 300 rpm, rotate for 60 seconds and read.
Remove the sample and clean rheometer with water.
Results:
The pressure at any point in the well bore is the sum of the hydrostatic pressure and the
frictional pressure. The hydrostatic pressure is the pressure exerted on the formations, casings,
and down-hole equipment by the weight of the fluid or fluids above them, Friction pressure is
generated by the resistance of the fluids to the movement.
P = Ph + Pf
where: P = Total pressure at any point in the well bore
Ph = hydrostatic pressure
Pf = friction pressure
The hydrostatic pressure is: Ph = 0.052 L
Where: Ph = hydrostatic pressure, psi
= fluid density, lb/gal
L = length of the fluid column, ft (vertical depth)
The friction pressure is not easy to calculate since it depends on the rheological behavior of
the fluid as it is exposed to shear caused by pumping. For general purposes, the following
calculation approach to friction pressure is perhaps appropriate. It assumes that the cement slurry
behaves as a power-law fluid.
Calculate the flow-characteristic parameters by using the equations:
N = (3.32) log10 (600-rpm reading/300-rpm reading)
K = (1.0660 (300-rpm reading)/[(100) (511)n]
To determine friction pressure, calculate the Reynolds number, NRe, from the following
equations:
For annulus:
NRe = (547) (dw – do)n (Q)
2-n ( )/[(1,647)
n (dw
2– do
2)
2-n (K)]
For casing:
NRe = (547) (Q)2-n
( )/[(1 ,647)n (di)
4-3n (K)]
where Q = Pumping rate, bbl/min
= Fluid density, lb/gal
di = Casing ID, in.
27

dw = Hole diameter, in.
do = Casing OD, in.
Nre = Reynolds number, dimensionless.
Using the n-valve and Reynolds number, estimate a friction factor from the figure above.
Friction pressure is then determined by:
For casing:
Pfc = (11.5) (L) ( ) (Q2) (f)/di
5
For annulus:
Pfa = (11.5) (L) ( ) (Q2) (f)/[dw-do) (dw
2– do
2)
2]
where: f = Friction factor, dimensionless
Pfc = Friction pressure in casing, psi
Pfa = Friction pressure in annulus, psi
Notice that the above calculations must be performed for every fluid using the corresponding
n, K, and . Also, the L’s will be different for each both inside and outside the casing.
Pressure: Once all the individual hydrostatic and friction pressures are calculated for each
fluid in the casing and annulus, the total hydrostatic and frictional pressures for the casing and
annulus can be calculated by simple addition. Next, the surface and bottom-hole pressures can be
calculated:
Ps = Pf + Pa - Pc
PB = Pfa + Pa
where: Ps = Surface pumping pressure, psi.
PB = Bottom hole, circulating pressure, psi
Pa = Total hydrostatic pressure in annulus, psi
Pc = Total hydrostatic pressure in casing, psi
Pf = Total friction pressure (casing and annulus), psi
Hydraulic horsepower: The following equation can be used to calculate the hydraulic
horsepower needed to circulate the well at the given rate:
Hhp = 0.0245 (Ps) (Q)
where: Hhp = Hydraulic horsepower
Ps = Surface pumping pressure, psi
Q = Pump rate, bbl/min
Turbulent flow rate: Cement placement under turbulent flow conditions is an effective
technique for achieving a good cement job. The pumping rate for turbulent flow may be
determined from the following procedure.
28

First, determine n and k for the cement slurry as outlined above. Then determine the upper
critical Reynolds number for turbulent flow, from the friction-factor chart (notice that the upper
critical Reynolds number changes with n, and varies from about 2,900 to 3,500. A good average
number is 3,000).
Calculate the turbulent flow rate from the equation:
Q2-n
= (NRe) (1,647)n (dw
2– do
2)
2-n(k)/[(547) (dw – do)
n ( )]
Where: Q = Flow rate, bbl/min
NRe = Reynolds number, dimensionless
n = Fluid-flow behavior index, dimensionless
K = Fluid consistency index, lb-sec/sq ft
dw = Diameter of well bore, in.
do = 0D of casing, in
The value obtained for Q is the minimum rate at which the cement must be pumped to
achieve turbulent flow.
29

FIELD TESTING OF DRILLING FLUIDS
Laboratory Experiment No. 1
Properties of Fresh Water Muds
Object:
Become familiar with the mud testing apparatus and procedures by investigating the
properties of fresh water muds.
Theory:
Certain clay mineral, when ground to colloidal size and contacted with water, readily hydrate
(adsorb water) to form stable colloids. Different clay minerals have different abilities to adsorb
water. The more water adsorbed by the clay, the higher the viscosity of the resulting mud will be.
In general, simple water-clay systems are suitable for shallow or upper hole drilling in areas
where contaminating beds are not a problem. Unfortunately, fresh water muds are easily subject
to contamination and the muds develop objectionable properties (as we shall see in later
experiments).
Procedure:
Each group of the lab section will test different drilling mud clays. Description of clay types
is included in Appendix A. The lab instructor will prepare the muds for you in the following
manner:
1. Add the required amount of clay to the required amount of fresh (distilled) water.
2. Stir 10 minutes with the mixer
3. Age the mud overnight.
GROUP MUD NAMEMUD 1
(gr. clay/cc water)
MUD 2
(gr. clay/cc water)
1 Aquagel* 50/1000 100/1000
2 Zeogel* 50/1000 100/1000
3 Quick-Gel* 25/1000 50/1000
*These materials are Baroid trade names. Their functions are described in Appendix A.
Each group will test their two muds for the following properties using the equipment and
procedures described in the previous section:
1. Density (Mud Balance).
2. Marsh Funnel viscosity (Marsh Funnel).
3. Apparent viscosity, plastic viscosity, yield point, 10-sec gel strength, 10-min gel strength
(Baroid Rheometer).
30

4. Fluid loss, mud cake thickness (Filter Press).
5. pH (Litmus Paper).
6. Mud, mud filtrate, and mud cake resistivity (Resistivity Meter).
Note the following:
1. Blend mud for 5 minutes before making first test.
2. Return the sample to the sample container after measuring each property EXCEPT fluid
loss and re-stir it by hand.
3. Perform the fluid loss test LAST.
4. For Mud 1, do complete 30-min filtration test. For Mud 2, do a 7.5-min filtration test and
report the corrected 30-min loss.
Results:
1) Tabulate the following mud properties:
a) Mud density (ppg).
b) Apparent viscosity (cp) @ 10, 50, 100, 200, 300, and 600 RPM.
c) Plastic viscosity (cp).
d) Yield point (lbs/100 sq. ft.).
e) 10-sec gel strength (lbs/100 sq. ft.).
f) 10-min gel strength (lbs/100 sq. ft.).
g) pH.
h) Corrected 30-min fluid loss (ml).
i) Filter cake thickness (in.).
j) Mud resistivity (ohm-m).
k) Mud filtrate resistivity (ohm-m).
l) Mud cake resistivity (ohm-m).
2) Plot the following mud properties vs. % of clay in the mud:
a) Mud density (ppg).
b) Hastic viscosity (cp).
c) Yield point (lbs/l00 sq.ft.).
d) 10-min gel strength (lbs/100 sq.ft.).
e) Corrected 30-min fluid loss (ml).
3) Summarize the results of doing the following experiments:
a) Increasing the concentration of general purpose bentonite clay in a fresh water-based mud
(Group 1).
b) Increasing the concentration of high-yield bentonite clay in a fresh water-based mud
(Group 2).
c) Increasing the concentration of attapulgite clay in a fresh water-based mud (Group 3).
4) Compare the results of using general purpose bentonite clay, high-yield bentonite clay, and
attapulgite clay to build a fresh water-based mud.
31

FIELD TESTING OF DRILLING FLUIDS
Laboratory Experiment No. 2
Effects of Sodium Salts on Fresh Water Muds
Object:
To investigate the effects of salt on fresh water muds and to evaluate aids in overcoming the
adverse effects caused by salt contamination.
Theory:
Clay particles dispersed in water are in the form of sheets which possess electrical charges
(unsatisfied valences). The presence of these charges gives fresh water muds their excellent
viscous, thixotropic, and filtration properties. Salt concentrations, however, neutralize the
electric charges and cause flocculation (formation of particle aggregates which are larger than
colloidal size) of the clay particles. As a result, the mud may be valueless for its usual functions.
Salt contamination can be due to two different factors, each having different effects on the
mud. First, formations containing salt water are frequently encountered in the drilling of wells. If
the mud weight is too low, salt water intrusion may occur with adverse effects on the mud
viscosity. In some wells salt formations are encountered either as beds or salt plugs. Second, salt
contamination may be due to the presence of salt in the water used to mix the mud (especially
true when sea water is used). Whatever the reason, contamination of mud by salt is a frequent
phenomenon and the full effect of this compound is of considerable importance.
Procedure:
Your lab instructor has prepared the muds for you in the following manner:
Group 1
Mud 1: Add 50.0 gr. of Aquagel to 1000.0 cc of water, stir with mixer for 10 minutes, age mud
overnight.
Mud 2: Dissolve 10.0 gr. of sodium chloride (NaCl) in 990.0 cc of water to make a 1.0 % salt
solution, add 50.0 gr. of Aquagel and stir with mixer for 10 minutes. Age mud
overnight.
Mud 3: Dissolve 50.0 gr. of NaCl in 950.0 cc of water to make a 5.0 % salt solution, add 50.0 gr.
of Aquagel. Proceed as in Mud 2/Group 1.
Mud 4: Dissolve 150 gr. of NaCl in 850 cc of water to make a 15.0 % salt solution. Add 50.0 gr.
of Aquagel. Proceed as in Mud 2/Group 1.
32

Group 2
Mud 1: Same as Mud 1/Group 1.
Mud 2: Add 50.0 gr. Aquagel to 990.0 cc of water, stir with mixer for 10 minutes. Add 10.0 gr.
of sodium chloride (NaC1) and stir with mixer for 10 minutes. Age mud overnight.
Mud 3: Proceed as in Mud 2/Group 2 but use 50.0 gr. of Aquagel, 950.0 cc of water and 50.0 gr.
of NaC1.
Mud 4: Proceed as in Mud 2/Group 2 but use 50.0 gr. of Aquagel, 850.0 cc of water and 150 gr.
of NaCl.
Group 3
Mud 1: Same as Mud 1/Group 1.
Mud 2: Dissolve 50.0 gr. of sodium chloride (NaC1) in 950.0 cc of water to make a 5.0 % salt
solution. Add 50.0 gr. of Aquagel, 6.0 gr. of Q-Broxin* and stir with mixer for 10
minutes. Age mud overnight.
Mud 3: Proceed as in Mud 2/Group 3 but use 50.0 gr. of NaCl, 950.0 cc of water, 50.0 gr. of
Aquagel and 6.0 gr. of Impermex*.
Mud 4: Proceed as in Mud 2/Group 3 but use 50.0 gr. of NaCl, 950.0 cc of water, 50.0 gr. of
Aquagel and 6.0 gr. of Loloss*.
*Description included in Appendix A.
Each group will test their 4 muds for the following properties:
1. Density (Mud Balance).
2. Apparent viscosity, plastic viscosity, yield point, 10-sec gel strength, 10-min gel strength
(Baroid Rheometer).
3. Fluid loss, mud cake thickness (Filter Press).
4. pH (Litmus Paper).
5. Mud, mud filtrate, and mud cake resistivity (Resistivity Meter).
Note the following:
1. Blend mud for 5 minutes before making first test.
2. Return the sample to the sample container after each test and re-stir it by hand.
3. Perform the fluid loss test LAST.
4. Do a 7.5-min filtration test and report the corrected 30-min loss.
33

Results:
1) Tabulate the following mud properties:
a) Mud density (ppg).
b) Plastic viscosity (cp).
c) Yield point (lbs/100 sq. ft.).
d) 10-sec gel strength (lbs/100 sq. ft.).
e) 10-min gel strength (lbs/100 sq. ft.).
f) pH.
g) Corrected 30-min fluid loss (ml).
h) Filter cake thickness (in.).
i) Mud resistivity (ohm-m).
j) Mud filtrate resistivity (ohm-m).
2) Plot the following mud properties vs. % of NaCl (Group 1), % of NaCl (Group 2), and % of
Additive (Group 3):
a) Plastic viscosity (cp)
b) Yield point (lbs/l00 sq. ft.).
c) 10-sec gel strength (lbs/l00 sq. ft.).
d) 10-min gel strength (lbs/100 sq.ft.).
e) Corrected 30-min fluid loss (ml).
f) Mud resistivity (ohm-m)
g) Mud filtrate resistivity (ohm-m)
3) Summarize the results of doing the following experiments:
a) Increasing the salt contamination of fresh water muds due to salt in the mixing water
(Group 1).
b) Increasing the salt contamination of fresh water muds due to salt encountered in the
borehole (Group 2).
c) Adding viscosity and filtration control agents to salt contaminated mud (Group 3).
4) Compare the results of salt contamination in fresh water muds due to salt in the mixing water
due to salt encountered in the borehole.
34

FIELD TESTING OF DRILLING FLUIDS
Laboratory Experiment No. 3
Viscosity Reducing Agents
Object:
Evaluate the performance of several mud thinners.
Theory:
Viscosity reducing agents are necessary to the handling of water-based muds. Fresh water-
based muds normally contain bentonite clay for the purpose of developing desirable viscous and
low fluid loss properties. High concentrations of clay compounds, other low-specific-gravity
solids such as drill cuttings, or soluble salts may be responsible for undesirable mud viscosity,
gel strength, and fluid loss in fresh water-based mud systems.
The problem of calcium contamination can frequently be handled successfully through the
use of chemical agents who precipitate the contaminant and restore satisfactory properties to the
mud. High viscosity, gel strength, and fluid loss caused by non-precipitable salts such as NaCl or
by excess concentrations of solids may be treated by diluting the mud with water (reduces both
salt and solids concentrations) or by mechanical methods (reduces solids concentration only).
These actions, however, also result in a decrease in both the Bentonite concentration and mud
weight. Therefore, Bentonite usually has to be added back to the mud to restore desired
rheological and fluid loss properties and weighting material usually has to be added back to the
mud to restore required density. Such treatment is often unsatisfactory or uneconomical and
other means are frequently used to obtain a reduction in viscosity, gel strength, and fluid loss
without requiring the supplementary use of Bentonite and weighting material.
An alternative to water dilution and mechanical separation is treatment with viscosity
reducing agents. A viscosity reducing agent, usually very expensive, may be defined as any
additive to water-based muds capable of reducing viscosity and gel strength by means other than
dilution or precipitation of the agent responsible for the abnormal viscosity. This definition
eliminates water as a viscosity reducer although it is frequently the most advantageous and the
least expensive agent to use and is sometimes the only additive which will give the required
effect. This definition also eliminates such compounds as sodium bicarbonate, soda ash, barium
carbonate, etc., which all reduce mud viscosity by precipitating calcium or by regulating the mud
pH.
The chemicals which have been found effective as viscosity reducers consist of a relatively
narrow set of compounds. Practically, they are the molecularly dehydrated phosphates and
polyphosphates, the plant tannins, the lignosulfonate wood by-products, and the mineral lignins.
The ability of viscosity reducers is strictly limited and their addition to the mud above the
low concentrations required for particle saturation will not result in further viscosity reduction. In
35

fact, often the reserve is true and viscosity increases.
Procedure:
Your lab instructor has prepared the muds for you in the following manner:
Group 1
Mud 1: Add 50.0 gr. of Aquagel to 600.0 cc of water and stir with mixer for 10 minutes. Age
mud overnight.
Mud 2: Add 50.0 gr. of Aquagel to 600.0 cc of water, stir with mixer for 10 minutes. Add 0.4 gr.
of CC-16* and stir with mixer for 10 minutes. Age mud overnight.
Mud 3: Proceed as in Mud 2/Group 1 but use 1.0 gr. of CC-16.
Mud 4: Proceed as in Mud 2/Group 1 but use 4.0 gr. of CC-16.
Group 2
Mud 1: Same as Mud 1/Group 1.
Mud 2: Proceed as in Mud 2/Group 1 but use 0.4 gr. of Barafos* instead of CC-16.
Mud 3: Proceed as in Mud 3/Group 1 but use 1.0 gr. of Barafos instead of CC-16.
Mud 4: Proceed as in Mud 4/Group 1 but use 4.0 gr. of Barafos instead of CC-16.
Group 3
Mud 1: Same as Mud 1/Group 1.
Mud 2: Proceed as in Mud 2/Group 1 but use 0.15 gr. of SAPP* instead of CC-16.
Mud 3: Proceed as in Mud 3/Group 1 but use 0.25 gr. of SAPP instead of CC-16.
Mud 4: Proceed as in Mud 4/Group 1 but use 0.30 gr. of SAPP instead of CC-16.
*Description included in Appendix A.
Each group will test their 4 muds for the following properties:
1. Density (Mud Balance).
2. Plastic viscosity, yield point, 10-sec gel strength, 10-min gel strength (Baroid
Rheometer).
3. Fluid loss (Filter Press).
4. pH (Litmus Paper).
Note the following:
1. Blend mud for 5 minutes before making first test.
2. Return the sample to the sample container after each test and re-stir it by hand.
3. Perform the fluid loss test LAST.
4. Do a 7.5-min filtration test and report the corrected 30-min loss.
36

Results:
1) Tabulate the following mud properties:
a) Mud density (ppg).
b) Plastic viscosity (cp).
c) Yield point (lbs/100 sq. ft.).
d) 10-sec gel strength (lbs/100 sq. ft.).
e) 10-min gel strength (lbs/100 sq. ft.).
f) pH.
g) Corrected 30-min fluid loss (ml).
2) Plot the following mud properties vs. % of thinner in the mud:
a) Plastic viscosity (cp)
b) Yield point (lbs/l00 sq. ft.).
c) 10-sec gel strength (lbs/l00 sq. ft.).
d) 10-min gel strength (lbs/100 sq. ft.).
e) Corrected 30-min fluid loss (ml).
3) Summarize the results of doing the following experiments:
a) Increasing the concentration of the thinner CC-16 in a fresh water-based mud (Group 1).
b) Increasing the concentration of the thinner Barafos in a fresh water-based mud (Group 2).
c) Increasing the concentration of the thinner SAPP in a fresh water-based mud (Group 3).
4) Compare the results of adding the thinners CC-16, Barafos, and SAPP to a fresh water-based
mud.
37

FIELD TESTING OF DRILLING FLUIDS
Laboratory Experiment No. 4
High Temperature Effects
Object:
Evaluate the effects of high temperature on drilling muds.
Theory:
The filtration properties of drilling mud are a measure of the ability of the solid components
of the mud to form a thin, low-permeability filter-cake. The lower the permeability, the thinner
the filter cake and the lower the volume of filtrates from mud of comparable solids
concentration. This property is dependent upon the amount and physical state of the colloidal
material in the mud. It has been shown repeatedly in the filed that when mud of sufficient
colloidal content is used, drilling difficulties are minimized. In contrast a mud low in colloids
and high in inert solids deposits a thick filter cake on the walls of the hole. A thick filter cake
restricts the passage of tools and allows an excessive amount of filtrate to pass into the
formation, thus providing a potential result in further trouble such as difficulty in running casing,
creating a swabbing effect which may cause the formation to cave or swab reservoir contents
into the hole, and difficulty in securing a water shutoff because of channeling of cement.
In previous laboratories the filtration properties of drilling mud were tested at a specified
pressure of 100 psig, and room temperature. In this laboratory the filtration properties of a
drilling mud will be tested at high temperatures as may be encountered at the bottom of the hole.
Procedure:
Each group of the lab section will test different mud clays. Description of each of the clays is
included in Appendix A. The lab instructor will prepare the muds for you in the following
manner:
1. Add the required amount of clay to the required amount of fresh (distilled) water.
2. Stir 10 minutes with the mixer
3. Age the mud overnight.
GROUP MUD NAMEMUD 1
(gr. clay/cc water)
MUD 2
(gr. clay/cc water)
1 Aguagel* 50/1000 100/1000
2 Zeogel* 50/1000 100/1000
3 Quick-Gel* 25/1000 50/1000
*These materials are Baroid trade names. Their functions are described in Appendix A.
38

Each group will test their muds at two temperatures according to the following manner:
A. Preheating the Heating Jacket
1. Connect the power cord to the proper line voltage as indicated on the nameplate.
2. Turn the thermostat to near mid-scale.
3. Place the metal stem dial thermometer in the thermometer well of the heating jacket.
4. The pilot light will turn on when the heating jacket temperature has reached the
thermostat setting.
5. Readjust the thermostat as necessary to obtain the desired test temperature. (Just below 3
is 200 ºF.)
B. Loading the Filtration Cell
***SAFETY NOTE***. The filtration Cell Assembly constitutes a Pressure Vessel. The
SAFETY PRECAUTIONS listed should be followed to assure safe operation.
• Cell material should be compatible with the test sample.
• Cell bodies that show signs of stress cracking, severe pitting, or have damaged set
screw holes must not be used.
• Cell caps showing evidence of the set screw seat being pulled or deformed must not
be used.
• Damaged or “Hardware Store” set screws must not be used.
1. Loosen the six socket head set screws and remove the cell end cap by pulling it straight
out of the cell, using the valve stem as a handle.
2. Check “O” rings on the valve stems, cell body and cap. Replace any damaged or brittle
‘O” rings. Replacement of “O” rings is normally required after test run above a
temperature of 350 ºF.
3. Repeat 1 and 2 above for the other end cap.
4. Reassemble the end cap and valve stem which is going to be the non-filter end. (The filter
end is the end with two little holes in the jacket.) Make sure the six socket set screws are
securely tightened and the valve stem is tight.
5. Carefully fill the cell with sample to be tested. Allow ½” to ¾” from the top for
expansion when the sample is to be heated.
6. Position the filter on the “O” ring in the cell body. Place the screen on the filter paper,
course side up.
7. Install the end cap making sure the set screw seats in the cap are aligned with the set
screws in the body. Tighten set screws firmly, then install and tighten the valve stem.
8. Invert and lower the filtration cell assembly into the heating jacket (filter end down) and
rotate so that the pin is in the bottom of the cell. This prevents the cell rotating when the
39

valve stems are opened or closed.
C. Pressurizing the Filtration Cell
1. Attach the high pressure hose connected to the 1500 psi gauge side of the manifold, to the
top, or inlet, valve stem and insert the locking pin.
2. Close the bleeder valve on the valve stem adapter manifold.
3. Check the “T” screws on the pressure regulators to be sure that they are unscrewed
(counterclockwise) and no pressure will be applied.
4. Open the valve on the Nitrogen bottle slowly and carefully. The bottle pressure will be
registered on the middle manifold gauge.
5. Turn the “T” screw on the left hand regulator clockwise until the desired cell pressure is
registered on the gauge.
D. Conducting the Filtration Test
1. Place a graduated cylinder under the cell lower valve stem.
2. Check the temperature of the cell by placing the metal stem dial thermometer in the
thermometer well of the cell. As soon as the desired temperature is reached, the test may
be started.
3. With an adjustable wrench, open the inlet valve stem ½ turn. If the pressure on the cell
pressure gauge of nitrogen manifold has changed from the desired setting, readjust the
regulator. If the adjustment is to lower the pressure, momentarily open the bleed valve to
reduce the pressure.
4. Set a timer for 30 minutes or other desired filtration test time.
5. With an adjustable wrench, open the lower valve stem on the bottom of the filtration cell
½ turn. This is the start of the test.
E. Test Conclusion and Disassembly
1. Disconnect the filter press-heating jacket from the power source.
2. Close the filtration cell (upper) valve stem.
3. Release the “T” screws (turn counterclockwise) of the test filtration.
4. Open the bleed valve on the test cell manifold to de-pressurize the system.
5. Remove the upper valve stem locking pin and remove the adapter manifold from the top
valve stem.
6. The pressurized cell assembly may be left in the heating jacket or it may be removed to
another location for air cooling, or it can be removed from the heating jacket and rapidly
40

cooled with running water.
7. After the cell and the sample in the cell are cool, the cell may be opened. Make sure the
open end of the valve stem is pointed away. Then, using the adjustable wrench, open the
top valve stem (the one on the opposite end of the cell from the filter) about ½ turn and
allow the pressure to bleed off. Make sure all pressure has bled off.
**WARNING**
• Do not attempt to remove the cell cap if any pressure remains in the cell.
• Removing the cell cap while the cell is pressurized could result in serious injury.
8. Once sure that all the pressure has been release, loosen the six socket set screws in the
end
cap and using the valve stem as a handle, pull the end cap out of the cell.
9. The sample may now be emptied and examined as desired.
Results:
1) Tabulate the following properties:
a) Corrected 30-min. fluid loss (ml)
b) Filter cake thickness.
2) Graph the following properties vs. temperature:
a) Corrected 30-min. fluid loss (ml)
3) Summarize the effects of increasing temperature on the mud and compare the results of each
mud system.
41

FIELD TESTING OF CEMENTS
Laboratory Experiment No. 5
Regular Cement, Cement Extenders and Cement Weighting Materials
Object:
Investigate the effects of cement extenders and weighting materials on regular neat cement.
Theory:
Lightweight cement slurries are used to reduce hydrostatic pressure on weak formations and
to lower slurry cost. Basically, lightweight slurries are made by adding more water to lighten the
mixture and then adding cement extenders, such as bentonite clay, which keep the solids from
separating. Bentonite is compatible with all additives and may be used to formulate specific
cement systems.
High-density slurries are used to cement high-pressure wells where increased hydrostatic
head is required to prevent formation gas, oil, or water from entering the borehole during
cementing operations. Barite (s.g. = 4.23) is a commonly used weighting material and can be
used to increase cement slurry density up to 18.0 ppg.
Procedure:
Each group will prepare two 500 ml samples of their three cements at the beginning of lab.
Prepare each 500 ml sample in the following manner:
Group 1
Cement 1: Regular cement (32.0 % water). Add 640.0 gr. of cement to 296.0 cc of water already
in blender and mix at high speed for 35 seconds.
Cement 2: Regular (35.0 % water). Add 583.2 gr. of cement to 315.0 cc of water already in
blender and mix at high speed for 35 seconds.
Cement 3: Regular cement (40.0 % water). Add 507.4 gr. of cement to 339.0 cc of water already
in blender and mix at high speed for 35 seconds.
Group 2
Cement 1: Regular cement with 4.0 % bentonite (40.0 % water). Dry mix 19.5 gr. of bentonite
with 487.1 gr. of cement and mix with 338.0 cc of water already in blender at high
speed for 35 seconds.
Cement 2: Regular cement with 8.0 % bentonite (46.0 % water). Dry mix 31.5 gr. of bentonite
with 393.2 gr. of cement and mix with 363.0 cc of water already in blender at high
42

speed for 35 seconds.
Cement 3: Regular cement with 12.0 % bentonite (51.0 % water). Dry mix 39.6 gr. of bentonite
with 329.7 gr. of cement and mix with 380 cc of water already in blender at high
speed for 35 seconds.
Group 3
Cement 1: Regular cement with 5.0 % barite (31.0 % water). Dry mix 31.1 gr. of barite with
621.7 gr. of cement and mix with 295.0 cc of water already in blender at high speed
for 35 seconds.
Cement 2: Regular cement with 15.0 % barite (30.0 % water). Dry mix 88.2 gr. of barite with
588.3 gr. of cement and mix with 292.0 cc of water already in blender at high speed
for 35 seconds.
Cement 3: Regular cement with 50.0 % barite (28.0 % water). Dry mix 247.5 gr. of barite with
495.1 gr. of cement and mix with 284.0 cc of water already in blender at high speed
for 35 seconds.
Each group will test their 3 cements for the following properties:
1. Density (Mud Balance).
2. Plastic viscosity, yield point (Baroid Rheometer).
3. Fluid loss (Filter Press).
4. Compressive strength (Versa Tester).
Note the following:
1. Perform the fluid loss test LAST.
2. Do a 10-min filtration test and report the corrected 30-min loss.
3. Do the compressive strength determination on 3 molds after waiting 24 hours.
4. Include Cement 1/Group 1 as the 0.0 % additive point in all the tabulations and graphs.
Results:
1) Tabulate the following mud properties:
a) Cement density (ppg).
b) Plastic viscosity (cp)
c) Yield point (lbs/100 sq. ft.).
d) Dehydration time (min).
e) Corrected 30-min fluid loss (ml).
f) Compressive strength (psi).
2) Plot the following cement properties vs. (1) % of water (Group 1), (2) % of bentonite (Group
2), and (3) % barite (Group 3) in the slurry:
a) Cement density (ppg)
b) Plastic viscosity (cp)
43

c) Yield point (lbs/l00 sq. ft.).
d) Corrected 30-min fluid loss (ml).
e) Compressive strength (psi).
3) Summarize the results of doing the following experiments:
a) Increasing the water concentration of regular cement (Group 1).
b) Increasing the bentonite concentration of regular cement (Group 2). [Note: Water content
increases according to API minimum requirements.]
c) Increasing the barite concentration of regular cement (Group 3). [Note: Water content
increases according to API minimum requirements.]
4) Compare the results of using water without bentonite and water with bentonite to extend the
cement.
44

FIELD TESTING OF CEMENTS
Laboratory Experiment No. 6
Cement Accelerators and Retarders
Object:
Investigate the effects of cement accelerators and retarders on neat cement.
Theory:
Most operations wait for cement to reach a minimum strength of 500-psi before resuming
operations. At temperatures below 100 ºF, common cement may require a day or two to develop
500-psi compressive strength.
Low concentrations of cement accelerators (2-4 % by weight of cement) are used to shorten
the setting time of cement and promote rapid strength development, thus reducing waiting-on-
cement (WOC) time. Calcium chloride and sodium chloride are the most common accelerators.
With its accelerated thickening time and compressive strength development, calcium chloride
is used in whipstock plugs, lost-circulation plugs, and squeeze slurries.
Increased well depths and formation temperatures require the use of cement retarders to
extend the pumpability of cements. Besides retardation, most retarders affect cement viscosity to
some extent. Lignosulfonates and celluloses (which we will discuss in our next experiment) are
mild dispersant.
Calcium lignosulfonates, derived from wood-pulping processes, are the most common
retarders. They are available as either a brown powder or liquid. Their effectiveness is limited to
temperatures less than 100 ºF.
Procedure:
Each group will prepare two samples of their three cements at the beginning of lab. Each
sample will be slightly greater than 500 ml. Prepare each 500 ml sample in the following
manner.
Group 1
Cement 1: Regular cement with 1.0 % calcium chloride (CaCl) (28.0 % water). Dissolve 7.0 gr.
of calcium chloride in 280.0 cc of water already in blender. Add 700.0 gr. of cement
and mix at high speed for 35 seconds.
Cement 2: Regular cement with 2.5 % calcium chloride (28.0 % water). Similar to Cement 1 but
using 17.5 gr. of calcium chloride.
45

Cement 3: Regular cement with 4.0 % calcium chloride (28.0 % water). Same as Cement 1
except use 28.0 gr. of calcium chloride.
Group 2
Cement 1: Regular cement with 1.0 % sodium chloride (NaCl) (28.0 % water). Dissolve 7.0 gr.
of sodium chloride in 280.0 cc of water already in blender. Add 700.0 gr. of cement
and mix at high speed for 35 seconds.
Cement 2: Regular cement with 2.5 % sodium chloride (28.0 % water). Same as Cement 1
except use 17.5 gr. of sodium chloride.
Cement 3: Regular cement with 4.0 % sodium chloride (28.0 % water). Same as Cement 1
except use 28.0 gr. of sodium chloride.
Group 3
Cement 1: Regular cement with 0.1 % Lignin HR4 retarder (28.0 % water). Dissolve 1.4 gr. of
retarder in 280.0 cc of water already in blender. Add 700.0 gr. of cement and mix at
high speed for 35 seconds.
Cement 2: Regular cement with 0.25 % Lignin HR4 retarder (28.0 % water). Same as Cement 1
except use 1.75 gr. retarder.
Cement 3: Regular cement with 0.5 % Lignin HR4 retarder (28.0 % water). Same as Cement 1
except use 3.5 gr. retarder.
Each group will test their 3 cements for the following properties:
1. Density (Mud Balance).
2. Fluid loss (Filter Press).
3. Compressive strength (Versa Tester).
Note the following:
1. Perform the fluid loss test LAST.
2. Do a 10-min filtration test and report the corrected 30-min loss.
3. Do the compressive strength determination on 3 molds after waiting 24 hours.
4. Include Cement 1/Group 1 from Laboratory Experiment No. 4 as the 0.0 % additive point
in all the tabulations and graphs.
Results:
1) Tabulate the following mud properties:
a) Cement density (ppg).
b) Plastic viscosity (cp)
c) Yield point (lbs/100 sq. ft.).
46

d) Dehydration time (min).
e) Corrected 30-min fluid loss (ml).
f) Compressive strength (psi).
2) Plot the following cement properties vs. (1) % of calcium chloride (Group 1), (2) % of
sodium chloride (Group 2), and (3) % Lignin HR4 retarder (Group 3) in the slurry:
a) Cement density (ppg)
b) Plastic viscosity (cp)
c) Yield point (lbs/l00 sq. ft.).
d) Corrected 30-min fluid loss (ml).
e) Compressive strength (psi).
3) Summarize the results of doing the following experiments:
a) Increasing the calcium chloride content of regular cement (Group 1).
b) Increasing the sodium chloride content of regular cement (Group 2).
c) Increasing the Lignin HR4 Retarder content of regular cement (Group 3).
4) Compare the results of using calcium chloride as cement accelerators.
47

FIELD TESTING OF CEMENTS
Laboratory Experiment No. 7
Water Loss Additives and Dispersants
Object:
Investigate the effects of water loss additives and dispersants on neat cement.
Theory:
Fluid-loss additives improve primary cement jobs because they have the ability to:
1. Prevent cement degradation in the annulus. This helps prevent stuck pipe, helps prevent
loss of returns, and helps to bring cement to the desired height.
2. Prevent gas migration. The viscosity and gelation properties of slurries containing fluid-
loss additives help solve this problem.
3. Improve bonding. The bonding qualities of cements containing fluid-loss additives are
also very good.
4. Minimize formation damage. By reducing the amount of filtration lost into sensitive
formations, fluid-loss additives help insure better formation productivity.
Fluid-loss additives are polymers. The most common are cellulose derivatives and they are
also used to control the rate of dehydration when squeezing. This is especially true when
squeezing perforations.
Dispersants reduce slurry viscosity, allow slurry turbulence at lower pump rates, allow
heavier slurries with less water and less weighting materials, and help provide fluid-loss control
for densified slurries. The most common dispersants are aryl sulfonates used in concentrations of
0.3 % to 2.0 % by weight of cement.
Neat cement slurries with densities above 17 ppg are difficult to mix. By using a high
molecular weight polymer, however, slurries may be densified to 18 ppg without using a
weighting material. For slurries heavier than 18 ppg a combination of dispersant and weighting
agent is used.
Procedure:
Each group will prepare two of their three cements at the beginning of lab. Prepare each 500
ml sample in the following manner:
Group 1
Cement 1: Regular cement with 0.5 % aryl alkyl sulfonate (CFR-2) (28.0 % water). Dry mix 3.5
gr. of CFR-2 with 700.0 gr. of cement and mix with 280.0 cc of water already in
48

blender at high speed for 35 seconds.
Cement 2: Regular cement with 1.0 % aryl alkyl sulfonate (CFR-2) (28.0 % water). Same as
Cement 1 except use 7.0 gr. of CFR-2.
Cement 3: Regular cement with 2.0 % aryl alkyl sulfonate (CFR-2) (28.0 % water). Same as
Cement 1 except use 14.0 gr. of CFR-2.
Group 2
Cement 1: Regular cement with 2.0 % organic polymer (28.0 % water). Mix 14.0 cc of organic
polymer with 280.0 cc of water already in blender. Add 700.0 gr. of cement and mix
at high speed for 35 seconds.
Cement 2: Regular cement with 6 % organic polymer (28.0 % water). Same as Cement 1 except
use 42.0 cc of organic polymer.
Cement 3: Regular cement with 10% organic polymer (28% water). Same as Cement 1 except
use 70.0 cc of organic polymer.
Group 3
Cement 1: Regular cement with 0.1 % cellulose (Flocelle) (28.0 % water). Dry mix 0.1 gr. of
Flocelle with 700.0 gr. of cement and mix with 280.0 cc of water already in blender
at high speed for 35 seconds.
Cement 2: Regular cement with 1.0 % cellulose (28.0 % water). Same as Cement 1 except use
7.0 gr. of Flocelle.
Cement 3: Regular cement with 2.0% cellulose (28.0 % water).Same as Cement 1 except use
14.0gr. of Flocelle.
Each group will test their cements for the following properties:
1. Density (Mud Balance).
2. Plastic viscosity, yield point (Baroid Rheometer)
3. Fluid loss (Filter Press).
4. Compressive strength (Versa Tester).
Note the following:
1. Perform the fluid loss test LAST.
2. Do a 10-min filtration test and report the corrected 30-min loss.
3. Do the compressive strength determination on 3 molds after waiting 24 hours.
4. Include Cement 1/Group 1 from Laboratory Experiment No. 4 as the 0.0 % additive point
in all the tabulations and graphs.
49

Results:
1) Tabulate the following mud properties:
a) Cement density (ppg).
b) Plastic viscosity (cp)
c) Yield point (lbs/100 sq. ft.).
d) Dehydration time (min).
e) Corrected 30-min fluid loss (ml).
f) Compressive strength (psi).
2) Plot the following cement properties vs. (1) % of CFR-2, (2) % of organic polymer, and (3)
% of Flocelle in the slurry:
a) Cement density (ppg)
b) Plastic viscosity (cp)
c) Yield point (lbs/l00 sq. ft.).
d) Corrected 30-min fluid loss (ml).
e) Compressive strength (psi).
3) Summarize the results of doing the following experiments:
a) Increasing the aryl alkyl sulfonate content of regular cement (Group 1).
b) Increasing the organic polymer content of regular cement (Group 2).
c) Increasing the cellulose content of regular cement (Group 3).
4) Compare the results of using organic polymer and Flocelle as water loss control additives.
50

SURFACE BOPSTACK WELL CONTROL
Laboratory Exercise No. 8
Simulator Orientation
Object:
Become acquainted with the components of the CS Inc. DS-20FS/W/P rig floor simulator.
Theory:
The results of a hydrocarbon well blowout can be disastrous. Natural gas or crude flowing
uncontrollably at the surface can take human life, destroy millions of dollars worth of equipment,
and cause irreparable damage to the environment.
Drilling rig personnel must be properly trained to prevent the occurrence of blowouts. Rig
floor simulators allow rig personnel to practice well control procedures, to test the principles and
theory underlying these procedures, and to become familiar with the equipment used during well
control operations. Before the simulator can be effectively utilized, however, the student must
have an understanding of its components and operation.
Procedure:
The lab instructor will conduct a tour of Penn State’s rig floor simulator, a DS-20FS/W/P.
The following topics will be covered.
1. Rig components used during normal drilling operations.
2. Rig components used during well control operations.
3. Simulator representations of actual rig components.
4. Simulator components used to program and control simulator operations.
IMPORTANT:
1. The DS-20FS/W/P is a sensitive piece of machinery.
2. Special care must be taken not to damage simulator components.
3. DO NOT touch any control on the instructor’s program panel.
4. DO NOT lean against or stand on any simulator component.
5. DO NOT set textbook, notebooks, or coats on any simulator component.
6. DO NOT force open any valves if they appear to be stuck.
51

7. DO NOT excessively tighten any valves to close them.
8. DO NOT raise the Kelly bushing more than halfway to the ceiling.
9. The general rule to use is WHEN IN DOUBT ASK THE LAB INSTRUCTOR BEFORE
PROCEEDING.
Results:
1) Reproduce the list of “DO’s” and ‘DON’T’s” for proper simulator operation that the lab
instructor covers at the beginning of lab. The list will be posted and reviewed by the lab
instructor at the beginning of each lab meeting and WILL BE STRICTLY ENFORCED!
2) Make a line drawing of each of the simulator components listed below showing the position
of each gauge or control found on the component. Use a different piece of paper for each
component and make the drawings large enough so that space is available to label each gauge
and control. Include a sentence or two for each label that describes the function of that
particular part.
i) Drawworks console.
ii) Driller’s console.
iii) Brake handle and foot throttle.
iv) Surface BOP stack control panel.
v) Remote choke panel.
vi) Remote mud box.
vii) Drill pipe visual display.
viii) Choke manifold.
ix) Standpipe manifold.
3) Draw a schematic of the drilling mud circulation system on the simulator. Show the path
followed by the mud during normal drilling operations. Show the path followed by the mud
during well control operations.
52

SURFACE BOP STAC WELL CONTROL
Laboratory Exercise No. 9
Simulator Operation
Object:
Practice working the controls of the CS Inc. DS-20FS/W/P rig floor simulator to observe the
effects of different mud densities on the rate of penetration (ROP).
Theory:
The rate at which the drill bit can penetrate the formation rock is an important economic
consideration during drilling operations. An optimal penetration rate reduces the amount of time
the rig spends on location and thus minimizes the cost of leasing the rig.
The ROP is a function of many factors including bit type, weight-on-bit (WOB), bit RPM,
rock strength, differential pressure, etc. Differential pressure refers to the difference between the
pressure exerted by the drilling mud at total depth and the formation pressure at that depth.
Differential pressure is a function of mud density because muds having different densities
will exert different pressures at the same depth. A correlation between mud density and ROP can
be obtained by changing mud weights and measuring the ROP while through the same
formation.
Procedure:
The lab instructor will first review the rules that must be followed whenever operating the
simulator.
At the start of the exercise the bit should be hanging slightly above bottom and rotating
slowly. In addition, the mud pump should be turned on so that the drilling mud is slowly
circulating. All well parameters such as total depth, hoe size, drill pip capacity, etc., and all
drilling parameters such as WOB, rotary speed, pump speed, etc., will be given to you by the lab
instructor at this time. Initial mud weight will be 19.0 ppg.
One student will be designated the driller and it will be the driller’s responsibility to run the
bit to bottom and to drill ahead while making sure the that the specified drilling parameters are
held as constant as possible. The driller should follow the procedure given below:
1. With the bit still hanging off bottom, bring the mud pump up to the proper strokes per
minute (SPM).
2. Remove tie-down chain from the brake handle and lift up on the brake handle until the
drill pipe begins to slowly fall into the hole.
53
3. Make sure the bit is still rotating slowly and watch the WOB indicator. When the bit
touches bottom the WOB indicator will show the bit taking on weight. Slowly increase
the WOB to the proper value while steadily increasing bit RPM.
4. Stop the drill pipe from falling when the proper WOB is reached by pushing down on the
brake handle. Double check mud pump SPM and bit RPM to make sure they are at the
proper values.
5. Wait for the geolograph to make a tick mark. Another tick mark will be made when 1
foot of hole has been drilled. The time between tick marks should be measured and the
ROP (ft/hr) calculated. Also, record the drill pipe pressure.
6. After 1 foot of hole has been drilled in this manner the bit should be returned to its
original position. Decrease the bit RPM to zero. Lift up on the brake handle and step on
the foot throttle. Raise the bit until the WOB falls to zero. Adjust the bit RPM and the
mud pump SPM to their standby levels.
Another student will now be designated the driller and follow the same procedure for a mud
weight of 17.0 ppg. Continue in this manner, decreasing the mud weight in increments of 2.0
ppg, until all of the students have had a turn at the controls.
Results:
1) Plot ROP (ft/hr) vs. mud density (ppg).
2) Plot ROP (ft/hr) vs. differential pressure (psi).
3) Summarize the effects of decreasing mud density on ROP.
54

SURFACE BOP STAC WELL CONTROL
Laboratory Exercise No. 10
The Soft Shut-In Procedure
Object:
Practice detecting gas kicks and shutting in the well using the soft shut - in procedure.
Theory:
When the bit passes through an impermeable cap rock into a porous and permeable formation
a drilling break can occur. A drilling break is simply a sudden, sharp increase in the penetration
rate. It indicates that you are in a situation in which a blowout could occur because a porous and
permeable formation could contain abnormally pressured gas. It does not indicate that a kick is
occurring. It is merely a warning signal that tells you to proceed with caution.
Two other indicators, however, will tell you that a kick is definitely occurring. The primary
indicator is a flow rate increase in the mud return line. A flow rate increase will always occur
before the secondary indicator, an increase in the mud pit volume is noticeable. The flow rate
meter and mud pit gain/loss indicator monitor the values of these two positive kick indicators,
respectively.
A flow check should be performed as follows if there is ever a doubt about whether or not the
well is kicking:
1. Stop rotating and pull the bit off bottom.
2. Shut off the mud pumps.
3. Check for flow. A kick is definitely occurring if the well continues to flow after the mud
pump has been shut off and the well should be immediately shut in.
Shutting the well in stops the influx of abnormally pressured gas into the wellbore because
the abnormal formation pressure is balanced by the increase in shut-in drill pipe and shut-in
casing pressure. The well should be shut in using the soft shut-in procedure. This procedure
allows the pressure in the wellbore to build up slowly and minimizes the possibility of pressure
surges that could damage the casing and surface equipment or fracture the formation.
Procedure:
The lab instructor will first review the rules that must be followed whenever operating the
simulator.
At the start of the exercise the bit should be hanging slightly above bottom and rotating
55

slowly. In addition, the mud pump should be turned on so that the drilling mud is slowly
circulating. All well parameters and drilling parameters will be given to you by the lab instructor
at this time.
One student will be designated the driller, one will be designated the choke operator, and one
will be designated the BOP operator. After the flow rate and mud pit volume increase, alarms are
set in a manner described by the lab instructor, the driller will begin to drill ahead and should
watch closely for the occurrence of any kick indicators.
Once the driller decides that a kick is occurring the well should be shut in following the soft
shut-in procedure:
1. The driller stops rotation, picks up the drill pipe until the WOB falls to zero, and
continues to pick up the drill pipe until the Kelly bushing is 3’ - 4’ above the rotary table.
2. The driller shuts off the mud pumps.
3. The BOP operator (1) opens the choke line valve on the BOP stack, and (2) closes the
annular preventer. Both pieces of equipment are operated by first depressing the master
air valve shut-off switch and then moving the equipment control switch to the open or
closed position. Both switches should be engaged until the red light goes off or comes on
to signal that equipment is open or closed, respectively.
4. The choke operator closes the remote choke.
5. Let the pressures stabilize and read the shut-in drill pipe and shut-in casing pressures.
This procedure should be repeated until everyone has had a chance to be the driller, choke
operator, and BOP operator.
Results:
1) Describe the 3 kick indicators used in this exercise.
2) Describe the flow check procedure.
3) Describe the soft shut-in procedure.
56

SURFACE BOP STAC WELL CONTROL
Laboratory Exercise No. 11
The Wait and Weight Method
Object:
Practice killing a well using the wait and weight method of well control.
Theory:
Most methods of well control have at least three characteristics in common: (1) the gas kick
is circulated out to the hole, (2) additional formation gas is prevented from entering the wellbore,
and (3) the drilling mud density is increased so that the hydrostatic pressure exerted by the mud
column will counterbalance the abnormal formation pressure.
Once the proper kill weight mud has been completely circulated through the system the well
is said to be killed or dead and normal drilling operations can be resumed (with caution!).
One of the most important aspects of well control is to prevent the influx of additional gas
into the wellbore. This is accomplished by keeping the pressure exerted by the mud column in
the drill pipe at the bottom of the hole constant while the gas kick is being circulated to the
surface.
Shutting in the well temporarily stops more gas from flowing into the wellbore because the
abnormal formation pressure is balanced by the mud hydrostatic pressure plus the shut-in drill
pipe pressure. In fact, the value of the shut-in drill pipe pressure is exactly equal to the pressure
differential between the abnormal formation pressure and the mud hydrostatic pressure.
During the wait and weight, while the kick is being circulated to the surface the choke is
adjusted so that the circulating bottom hole pressure balances the abnormal formation pressure.
The circulating bottom hole pressure can be calculated by adding the hydrostatic pressure of the
mud in the drill string to the circulating drill pipe pressure.
Several terms should be defined at this point:
1. Kill rate pressure or slow circulating rate pressure - This is the drill pipe pressure
required to circulate original weight mud through the wellbore at a reduced pump speed
called the kill rate. The kill rate pressure must be measured before the well kicks.
2. Shut-in drill pipe pressure - This is the extra pressure required to control the kicking
formation.
3. Initial circulation pressure - This is the value that the circulating drill pipe pressure
should have at the start of the wait and weight procedure. It is equal to the kill rate
pressure plus the shut-in drill pipe pressure.
57

The object of the wait and weight method is to circulate kill weight mud into the well
through the drill pipe, to circulate the gas kick out of the hole through the annulus, and to keep
the abnormal formation pressure balanced by the mud column pressure in the drill pipe all at the
same time.
As soon as the mud pits are filled with kill weight mud the choke is opened and the mud
pump is brought up to the kill rate. The choke is quickly adjusted so that the drill pipe pressure
gauge reads a value equal to the initial circulating pressure.
As more kill weight mud is circulated down through the drill pipe the pressure exerted by the
column of mud in the drill pipe is increased because the lighter original mud is displaced by the
high density kill mud. The circulating drill pipe pressure must be reduced accordingly or else the
increased bottom hole pressure could become great enough to fracture the formation when the
kill weight mud finally reaches the bottom of the hole and begins to displace original mud out of
the annulus.
When the kill mud reaches the bit the drill pipe pressure is reduced to a value called the final
circulating pressure. Drill pipe pressure is held constant at the final circulating pressure during
the remainder of the kill procedure because there is now only one type of mud in the drill string
and the hydrostatic pressure there is constant. The well should be dead when kill weight mud
reaches the surface through the annulus.
Procedure:
The lab instructor will first review the rules that must be followed whenever operating the
simulator.
At the start of the exercise the bit should be hanging slightly off bottom and slowly rotating.
In addition, the mud pump should be turned on so that the mud is slowly circulating. All well
parameters and all drilling parameters will be given to you by the lab instructor at this time.
Everyone should fill in the prerecorded information portion of the wait and weight kill sheet.
One student will then be designated the driller, one the choke operator, and one the BOP
operator.
First, the kill rate pressure should be measured. Bring the mud pump SPM up to the first kill
rate record that kill rate pressure. Then, adjust the pump SPM to the second kill rate pressure and
record that kill rate pressure. Follow the same procedure to measure and record the two kill rate
pressures for the second mud pump.
The driller should then start to drill ahead and watch for kick indicators. As soon as the kick
is detected, the well should be shut in following the soft shut-in procedure. Read and record the
shut-in drill pipe pressure and shut-in casing pressure after they have stabilized. Record the pit
volume increase. Follow the directions on the kill sheet increase, final circulating pressure,
surface-to-bit strokes, and bit-to-surface strokes.
58
Fill in the circulating drill pipe pressure schedule at the bottom of the kill sheet. Dial up the
the proper kill weight mud on the remote mud box. You are now ready to kill the well by the
wait and weight method.
The Wait and Weight method is outlined below:
1. Starting with the well completely shut-in, the choke operator will first crack open the
choke and then the driller will slowly but steadily bring the mud pump up to the kill rate.
The choke operator should keep the casing pressure constant by opening or closing the
choke as the pump is brought up to speed.
2. As soon as the mud pump is at the kill rate the choke operator should adjust the choke so
that the drill pipe pressure equals the initial circulating pressure.
3. The driller will continue to pump kill mud into the hole at the kill rate. At the same time
the choke operator will reduce the drill pipe pressure from the initial circulating pressure
to the final circulating pressure according to the pressure reduction scheduled at the
bottom of the well control worksheet.
4. The choke operator will maintain the final circulating pressure after the kill weight mud
reaches the bit until the kill weight mud appears at the surface.
5. When the kill mud reaches the surface the crew should do a soft shut-in and check the
shut-in drill pipe and casing pressures. The well is assumed to be dead only if both
pressures are zero.
As many people as possible should have a chance to operate the choke during this exercise.
The entire exercise should be repeated with different people at the various stations if time allows.
Results:
1) Describe the wait and weight method of well control.
2) Complete the wait and weight worksheet for your well control problem.
3) List the advantages and disadvantages of the wait and weight method.
59

CEMENT HEAD LABORATORY
Laboratory Exercise No. 12
Cement a Casing String
Object:
Evaluate the techniques of cementing casing in a well.
Theory:
Different cementing equipment and placement techniques are used for cementing casing
strings, cementing liner strings, setting cement plugs, and squeeze cementing. A casing string is
different from a liner string in the fact that the casing extends to the surface, while the liner is
attached to the subsurface casing previously cemented in the hole. Cement plugs are placed in
open hole or in casing before abandoning a lower portion of the well. Cement is squeezed into
lost-circulation zones, abandoned casing perforation, or a leaking cemented zone to stop
undesired fluid movement.
Cementing Casing
When the casing string is ready to be cemented the cement slurry is prepared in a special
cementing unit for the type of the job (truck mounted for land jobs, skid mounted for offshore).
The cement slurry is pumped from the unit to a special cementing head screwed into the top
joint of casing. When cementing begins, the bottom rubber wiper plug is released from the plug
container ahead of the cement slurry. The plug wipes the mud from the casing ahead of the slurry
to minimize contamination of the cement with the mud. The plug reaches the float collar and
stops. Continuing to pump cement causes a diaphragm in the plug to rupture (a spike will occur
in the pump pressure). This allows the cement slurry to be displaced through the plug and into
the annulus. After the desired volume of cement slurry is pumped into the casing, the top wiper
plug is released from the plug container. The top plug displaces the cement plug by pumping
drilling mud into the casing behind the top plug. When the top plug reaches the bottom plug a
pressure increase will be encountered which signifies the end of the displacement operation.
Procedure:
1. The lab instructor will provide everyone with the depth, hole diameter, and casing size.
2. The volume of the annulus must be calculated using this data (use a safety factor of 1.2).
3. This will be the volume of cement slurry that is needed to be pumped.
4. The number of strokes required to pump this volume must then be calculated.
60

At the start of the exercise the mud pumps will be on so that the mud is slowly circulating.
Stop circulation and pick up off the bottom. Assume that the casing string is now at the correct
depth to be cemented. Unhook the Kelly and hook up to the cement head. Load the bottom plug
into the cement head and then load the top plug.
Open the cement head valve to allow flow of the cement slurry and turn on the cement
pumps. Remove the pin supporting the top plug to allow it to lead the slurry to the float collar.
When a spike is seen in the pump pressure the plug has reached the float collar. Pump until the
total number of strokes needed for the desired cement volume is obtained. At this time release
the top plug, discontinue pumping cement and resume pumping mud until the top plug reaches
the bottom plug. Look for a spike in the pump pressure and shut the mud pumps down.
Results:
1) Describe the method of cementing the casing.
2) Compare the method completed in the lab with other methods used in the industry.
3) Describe other uses of cementing.
61

APPENDIX A
MUD ADDITIVES
62

MUD ADDITIVES1
Mud control can be divided into three basic categories: the control of mud weight, the control
of viscosity and gel strength, and the control of water loss. Various mud additives have been
developed for each of these areas of control.
Control of Mud Weight
Mud weight control is almost synonymous with the control of solids. The mud weight
requirements should be based on that weight required to control formation pressures.
For under-pressured reservoirs (i.e. formations with pore pressures less than 0.433 psi/foot
depth) mud weight can be reduced to levels below the fresh water gradient by using oil, oil and
fresh water, or by aerating the fluid column. The use of air (or natural gas) alone as a drilling
fluid is also an acceptable practice, although this technique is restricted to areas where there are
no high volume water sands to be penetrated.
Weighted muds are defined as those where barite or some other high density solid has been
added to increase mud weight.
Control of Viscosity and Gel Strength
The control of viscosity or mud thickness will of course depend on the operator’s objectives.
Viscosity may be maintained at high levels to ensure adequate hole cleaning. Additives, such as
some of the polymers, may be added to increase the mud thickness for adequate hole cleaning
while keeping the mud weight and total solids content at low levels. With weighted muds some
operators have used polymers for increasing thickness in order to keep clay solids that provide
support for the barite, to a minimum.
In general, if there are no specific hole requirements, the operator prefers to use the thinnest
possible drilling fluid. Thinning is also emphasized when using weighted muds close to the
fracture gradient of exposed formations.
When more viscosity is desired it may be obtained by (1) adding Bentonite, (2) flocculating
the clay solids, and (3) adding polymers designed for the purpose. Bentonite is the primary
viscosity builder in the mud system. If fresh water is being used Bentonite will increase viscosity
rapidly with only small increases in mud weight. Flocculation of the clays in a fresh water mud is
also a quick and cheap method of increasing viscosity. The flocculation can usually be done by
adding lime or cement.
Another method for thickening mud is the use of specific polymers.
1Moore, Preston L., Drilling Practices Manual, The Petroleum Publishing Co.
63

There are several different polymers available. Basically, they can be divided into three
groups; (1) the polymers that thicken the mud by acting on the clay solids, (2) polymers that are
colloidal in nature and essentially provide a substitute for bentonite, and (3) the polymers that
thicken the liquid phase and do not react with bentonite.
Viscosity control is generally in terms of reducing mud thickness. Methods used for control
include mechanical aids, water dilution and chemical thinners. The most widely used of these
methods is the chemical thinners. Table 1 includes some of the more common mud thinners.
Table 1. Drilling mud thinners Chemical pH of 1% solution Limitations
Sodium acid
pyro Phosphate4.3
Decomposed and forms flocculating agent above 175 F.
Not effective in the presence of large quantities of
calcium
Sodium
tetraphosphate8.0 Same as 1.0
Chrome
Lignosulfonate7.0
Material starts to decompose at temperatures above 300
F. pH needs to be at least 9.0.
Liginite 3.2Material starts to decompose at temperatures above 350
F. pH needs to be at least 9.0.
Tannin 5.0 Not very effective if pH of mud is less than 11.0.
SurfactantsMany types, temperature stability above 300 F may be a
problem. Most are more expensive than other materials
Control of Water Loss (Filtration Control)
The filtration rate is generally controlled for the following two reasons: (1) to control the
thickness and characteristics of the filter cake which is deposited on permeable formations and
(2) to limit the total filtrate that enters underground formations.
Filter cake thickness and the friction between the filter cake and the drill string relate to the
problems of (1) differential pressure sticking, (2) torque and drag while drilling and tripping the
drill string, (3) running of wireline tools and casing strings and (4) sidewall coring. An increase
in filter cake thickness increases the area of contact between the drill string and the filter cake
and for a given friction coefficient increases the danger of sticking the drill string and also
increases the torque and drag on the drill string.
The running of wireline tools and casing is restricted by the reduction in hole size as the filter
cake gets thicker. A thick filter cake may prevent any formation recovery on a wireline test. For
these problems the operator is not concerned with the actual loss of filtrate. The filtrate loss is
used to indicate the potential thickness of the filter cake.
The problems of differential pressure sticking and torque and drag are related primarily to
high weight drilling muds in deep high temperature environments.
64

Operators are concerned with the total filtrate entering underground formations for the
following reasons: (1) some believe that shale sloughing is caused by filtrate invasion into the
shales, (2) they believe results of formation evaluation methods may be affected by filtrate
invasion, and (3) they believe formation productivity is often affected by filtrate invasion,
especially in low permeability sands. Additives of common usages to control filtration are shown
in Table 2.
Table 2. Additives for the control of filtration rate Bentonite Provides a better basic filter cake
Metal lignosulfonatesReduces filtration by deflocculating the mud also increases the viscosity of
the filtrate. Starts braking down at 300 F. Not very effective above 350 F.
Lignite
Reduces filtration rate by deflocculating and plugging open spaces in filter
cake. Starts breaking down at 300 F. Effective to reduced degrees above
400 F.
Sodium Carboxymethylcellulose,
CMC
Reduces filtration rate by coating solids and sometimes by minimizing
flocculation. Starts breaking down at 300 F.
Starch
Reduces filtration rate by coating solids. Will spoil in a fresh water
environment where pH is less than 11.5. Also a salt concentration of
250,000 ppm will prevent spoiling in any pH water. Breaks down rapidly
when temperature exceeds 275 F.
Baroid Mud Additives
Baroid Petroleum Services Division N.L. Industries, Inc distributes all the additives used in
the mud experiments in the first portion of this lab manual. Brief descriptions of the Baroid mud
additives are shown in Table 3.
Table 3. Baroid mud additives Additive Material Use Features
AQUAGEL
Selected, finely
ground bentonite
clay.
General purpose gel-forming
colloid used to adjust viscosity,
gel strength, and reduce filtrate
loss.
A universally used mud project for both
rotary and cable tool drilling. Yields 100
barrels of 15 centipoises drilling mud per ton
of AQUAGEL.
BARAFOS
Sodium tetra
phosphate in dry
granular form.
A polyphosphate mud thinner.An effective dispersing agent for clays; has
little effect on pH of muds.
BAROID
Processed barite
(barium
sulphate).
Increasing mud density and
making low-solids muds.
Recognized as the industry’s standard mud
weighting material.
CC-16
Modified lignite
in black, free-
flowing power
form.
Thinning and filtration control
in fresh water muds.
Low unit cost. High solubility in normal pH
muds. Stable at high drilling temperatures.
Eliminates or reduces the need for adding
raw caustic soda at the rig. Good tolerance
for soluble contaminants. Complements other
thinners and reduces the need for special
filtration control agents.
65

Table 3. Baroid mud additives (cont.)Additive Material Use Features
GALENA
Pulverized lead
ore with a
specific gravity
of about 6.8
For making ultra-heavy drilling
muds to kill wells of
abnormally high pressure. Also
used to weight cement slurries.
Makes mud weighing up to 321b/gal.
IMPERMEX
Specially
processed, pre-
gelatinized starch
power.
An organic colloid for reducing
filtrate loss of any drilling mud.
Allows continued use of mud that would
otherwise be discarded because of
contamination by salts, acids, cement,
gypsum, anhydrite, and other deleterious
substances. Produces minimum filtration rate
in fresh or salt water.
LOLOSSModified guar
gum.
To control viscosity and
filtration in low-solids muds.
An effective means of controlling viscosity
and filtration in either fresh water or salt
water low-solids mud, while reducing the
amount of formation solids dispersed in these
muds. Particularly effective in brine
workover fluids.
Q-BROXIN
Ferrochrome
lignosulfonate,
non-caking, light
brown, water
soluble powder.
A chemical thinner for drilling
muds, especially for muds
contaminated with salt,
gypsum, or both, or as a general
utility thinner.
Permits use of gyp muds for deep drilling;
allows use of salt water for mud makeup;
emulsifies oil in mud.
QUICK-
GEL
High-yield
bentonite.
To make high viscosity mud
faster than with ordinary clays.
Used particularly in drilling
seismic shot holes and water
wells.
High yield (200 bbl/ton), Easy and fast to
mix. Low cost. Improves wall building. Aids
in preventing lost circulation. Does not
ferment. Reduces water loss. Only half as
much needs to be transported compared to
other bentonites.
SAPPSodium acid
pyrophosphate.
As a thinner, dispersant which
also adds pH control.
Used to lower pH of contaminated muds. Is
very sensitive to concentration.
ZEOGELDry ground
attapulgite clay.
As a suspending agent in
drilling muds of any salt
concentration.
Yields 130 barrels of 15 centipoise mud per
ton in saturated salt water.
66

Tab
le 4
. M
ate
rials
fo
r D
rill
ing
Flu
id S
yst
em
s F
resh
Wate
rM
ud
sF
resh
Wate
rM
ud
s (c
on
t.)
Pro
du
ct T
rad
e N
am
eD
escr
ipti
on
Ma
ker
or
Dis
trib
uto
rP
rod
uct
Tra
de
Na
me
Des
crip
tio
nM
ak
er o
r D
istr
ibu
tor
Alk
atan
Cau
stic
qu
ebra
cho
Mag
cob
arH
igh
Yie
ld
Su
b-b
ento
nit
eM
agco
bar
Aq
uag
elW
yom
ing b
ento
nit
eB
aro
id D
iv.
Nat
ion
alL
ead C
o.
Hy
dro
gel
Ben
ton
ite
Bro
wn
Mu
d C
o.
Atl
as G
el
Wy
om
ing b
ento
nit
eA
tlas
Mud C
om
pan
yH
exap
hos
Phosp
hat
e#W
estv
aco
Atl
as L
ig
Lig
nit
ic c
om
pound
Atl
as M
ud C
om
pan
yH
ydro
pel
Em
uls
ifie
das
phal
t#A
mer
ican
Bit
um
ul
& A
sphal
t
Bar
afo
sS
od
ium
tetr
aph
osp
hat
eB
aro
id D
iv.
Nat
ion
al L
ead C
o.
Hy
dro
carb
Cau
stic
car
bon
ox
Bar
oid
Div
. N
atio
nal
Bar
ium
Car
bo
nit
e B
ariu
m c
arb
onat
eM
agco
bar
Hy
dro
tan
Cau
stic
tannin
Bar
oid
Div
. N
atio
nal
Bar
ium
Car
bo
nit
e B
ariu
m c
arb
on
ate
Mil
whit
e M
ud
Sal
es C
om
pan
yH
.Q.M
. S
tarc
hG
rain
-bas
ed s
tarc
h#
Gib
ralt
er M
iner
als
Bar
oco
Su
b-b
ento
nit
eB
aro
id D
iv.
Nat
ion
alL
ead C
o.
Imp
erm
exP
reg
elat
iniz
ed s
tarc
hB
aro
id D
iv.
Nat
ion
alL
ead C
o.
Ben
exS
odiu
m p
oly
acry
late
#C
her
okee
Lab
ora
tori
esIm
per
mex
Pre
serv
ativ
eF
orm
ald
ehy
de
com
poun
dB
aroid
Div
. N
atio
nal
Lea
d C
o.
Bic
arb.
of
So
da
Bic
arb
onat
e o
f so
da
*#
Ker
o-X
Def
oam
ing
agen
tB
aro
id D
iv.
Nat
ion
alL
ead C
o.
Cau
stic
Soda
So
diu
m h
ydro
xid
e*#
Kw
ik-T
hik
Extr
ahig
h-y
ield
ben
tonit
e M
agco
bar
Car
bo
no
xO
rgan
icth
inner
Bar
oid
Div
. N
atio
nal
Lea
d C
o.
Kem
ical
Qu
ick
lim
e #
Dri
l-K
em
Co
ntr
olg
elB
ento
nit
eM
ud
Co
ntr
ol
Lab
ora
tori
esK
emb
reak
Cal
ciu
mli
gn
osu
lfo
nat
eM
arat
ho
n C
hem
ical
Co
rp.
Cas
oP
ota
ssiu
m s
tear
ate
Mud C
ontr
ol
Lab
ora
tori
esK
ylo
Sodiu
mpoly
acry
late
#M
innes
ota
Min
ing &
Mfg
.
Contr
ol
M-D
D
rill
ing d
eter
gen
tM
ud C
ontr
ol
Lab
ora
tori
esL
igco
Min
eral
lig
nit
eM
ilw
hit
e M
ud
Sal
es C
o.
Contr
olt
anL
ignit
eM
ud
Contr
ol
Lab
ora
tori
esL
ime
Cal
cium
hy
dro
xid
e#*
Contr
olc
alC
alci
um
lig
nosu
lfonat
eM
ud
Contr
ol
Lab
ora
tori
esL
ube-
Flo
Gro
und g
ilso
nit
e #G
ibra
lter
Min
eral
s
Cel
lex
So
diu
mca
rbo
xy
met
hy
l-
cel
lulo
se
Bar
oid
Div
. N
atio
nal
Lea
d C
o.
Lu
bri
-fil
m
Lig
no
x
Ex
trem
e P
ress
ure
lu
bri
cant
Cal
cium
lig
nosu
lfonat
e
Mil
whit
e M
ud
Sal
es C
o.
Bar
oid
Div
. N
atio
nal
Lea
d C
o.
Contr
olo
idP
regel
atin
ized
star
chM
ud C
ontr
ol
Lab
ora
tori
esL
ig-N
o-S
ol
Modif
ied
lignosu
lfat
esA
lpin
e M
ud S
ervic
e
Co
ntr
ols
ol
No
nio
nic
su
rfac
tan
tM
ud
Co
ntr
ol
Lab
ora
tori
esM
acco
gel
Wy
om
ing b
ento
nit
eM
acco
Co
rp.
C-M
-CS
odiu
mca
rboxym
ethy
l-
cell
ulo
se
#E
.I.
duP
ont
Mag
cogel
Mag
cophos
Wy
om
ing b
ento
nit
e
So
diu
m t
etra
ph
osp
hat
e
Mag
cob
ar
Mag
cob
ar
Cro
nox 2
11
Fre
sh w
ater
corr
osi
on
inh
ibit
or
Un
ited
En
gin
eeri
ng
Co
rp.
Mc
Qu
ebra
cho
May
Gel
Qu
ebra
cho
Wy
om
ing b
ento
nit
e
Mag
cob
ar
May
Bro
ther
s, I
nc.
Cy
pan
So
diu
mpo
lyac
ryla
te#A
mer
ican
Cy
anam
id C
orp
. M
ay C
lay
Sub-b
ento
nit
eM
ay B
roth
ers,
Inc.
Cal
tro
lC
alci
um
chlo
ride
Mil
wh
ite
Mu
d S
ales
Co.
May
lig
Min
eral
lig
nit
eM
ay B
roth
ers,
Inc.
Cal
ciu
m C
hlo
ride
Cal
ciu
mch
lori
de
*#
May
star
chP
reg
elat
iniz
ed s
tarc
hM
ay B
roth
ers,
Inc.
Do
wci
de
G
Bac
teri
cid
e#
Do
w C
hem
ical
Co
.M
ayco
lC
alci
um
chlo
ride
May
Bro
ther
s, I
nc.
Dri
sco
se (
Sev
. G
rad
es)
So
diu
m c
arb
oxy
met
hy
l-
cell
ulo
se
#D
rill
ing S
pec
ialt
ies,
Inc.
Mac
o-H
ex.
Mac
cofl
os
Mac
co-L
ig
Com
ple
x p
hosp
hat
es M
iner
al
lig
nit
e
Mac
co C
orp
.
Dak
oli
teP
roce
ssed
lig
nit
e#
No
rth
ern
Ch
emic
al S
ales
M
iko
l S
tarc
hP
reg
elat
iniz
ed s
tarc
h#
Arc
her
-Dan
iels
-Mid
lan
d
Em
uls
ifie
r S
MB
Ino
rgan
ic e
mu
lsif
ier
Bar
oid
Div
. N
atio
nal
Lea
d C
o.
Mil
gel
Wy
om
ing b
ento
nit
eM
ilw
hit
e M
ud
Sal
es C
o.
Em
uls
ite
Cau
stic
lig
nit
eM
agco
bar
Mil
Gra
ph
ite
Gra
ph
ite
Mil
wh
ite
Mu
d S
ales
Co.
E P
Mu
dlu
be
Ex
trem
e p
ress
ure
lu
bri
cant
Bar
oid
Div
. N
atio
nal
Lea
d C
o.
Mil
star
chP
reg
elat
iniz
ed s
tarc
hM
ilw
hit
e M
ud
Sal
es C
o.
Foxit
Po
lyel
ectr
oly
teM
agco
bar
Mil
Flo
Modif
ied
poly
flav
inoid
com
p.
Mil
whit
e M
ud S
ale
Co.
Gra
ph
ite
Gra
ph
ite
lub
rica
nt
*#
Mu
d-B
acT
risN
itro
(bac
teri
cide)
#C
om
mer
cial
Solv
ents
Co
rp.
Gre
en B
and
Su
b-b
ento
nit
eM
ilw
hit
e M
ud S
ales
Corp
.M
ud F
loc
Clo
ccula
nt
Mud
Con
trol
Lab
ora
tori
es
Gy
psu
mG
ypsu
m*#
Mil
-Nat
an1-2
Cau
stic
queb
rach
oM
ilw
hit
e M
ud S
ales
Co.
Mil
Qu
ebra
cho
Queb
rach
o (
pure
)M
ilw
hit
e M
ud S
ales
Co.
My
-Lo
-Jel
Pre
gel
atin
ized
star
chM
agco
bar
_____________________________________________________
_____________________
*S
ever
al p
ack
agin
g c
om
pan
ies
#S
ever
al d
istr
ibu
tin
g c
om
pan
ies
Pal
cota
nL
ign
osu
lfo
nat
e#
Pac
ific
Lu
mb
er C
om
pan
y
67

Tab
le 4
. M
ate
rials
fo
r D
rill
ing
Flu
id S
yst
em
s (c
on
t.)
Fre
sh W
ate
r M
ud
s (c
on
t.)
Fre
sh W
ate
r M
ud
s (c
on
t.)
Pro
du
ct T
rad
e N
am
eD
escr
ipti
on
Ma
ker
or
Dis
trib
uto
rP
rod
uct
Tra
de
Na
me
Des
crip
tio
nM
ak
er o
r D
istr
ibu
tor
Pal
cota
n 9
50
Red
wood b
ark e
xtr
act
#P
acif
ic L
um
ber
Com
pan
yT
SP
PT
reat
sodiu
m p
yro
phosp
hat
e##B
lock
son C
hem
ical
Pel
tex
Modif
ied
lignosu
lfonat
eA
lam
oL
um
ber
Co.
T-8
Shal
e co
ntr
ol
mud
Mag
cobar
P-9
5C
alif
orn
iacl
ayM
acco
Co
rp.
Un
i-C
alM
od
ifie
dal
ky
l ar
yl
sulf
on
ate
Mil
wh
ite
Mu
d S
ales
Co.
Po
lyto
ne
Tre
ated
lig
nit
e#
Lo
s A
ng
eles
Ch
emic
alU
ni-
Gel
Wy
om
ing b
ento
nit
eU
nit
edE
ng
inee
rin
g C
orp
.
Py
ro,
Anhy
dro
us
Py
rophosp
hat
e#W
estv
aco
Viz
-Thin
Fer
ro-c
hro
mel
ignosu
lfonat
e#C
row
n Z
elle
rbac
h C
orp
.
Par
aform
aldeh
yde
Work
over
Cla
yL
ow
yie
ld w
ork
over
cla
yM
ilw
hit
e M
ud S
ales
Co.
Pre
serv
ativ
e P
araf
orm
ald
ehy
de
*#
Wy
o-J
el 2
00
B
ento
nit
eA
rch
er-D
anie
ls-M
idla
nd
Ph
osp
hat
eC
om
ple
xp
ho
sph
ates
*#
X-C
or
Co
rro
sio
nin
hib
ito
rB
aro
id D
iv.
Nat
ion
al L
ead C
o.
QB
TQ
ueb
rach
o-b
ased
thin
ner
Mud
Contr
ol
Lab
ora
tori
esX
P-2
0C
hro
me
Lig
nit
eM
agco
bar
Q-B
rox
inF
erro
chro
me
lign
osu
lfo
nat
eB
aro
id D
iv.
Nat
ion
alL
ead C
o.
Q-X
Queb
rach
o
com
pound
Queb
rach
o c
om
pound
Mag
cobar
Sa
lt W
ate
r M
ud
s
Queb
rach
oQ
ueb
rach
o*
#A
la-S
ol
Att
apulg
ite
clay
A
lam
o L
um
ber
Co.
Qu
alex
So
diu
m c
arb
oxy
met
hy
l-A
lpin
e G
elA
ttap
ulg
ite
clay
Alp
ine
Mu
d S
ervic
e
ce
llu
lose
#
E.
I. D
uP
on
t A
tlas
Sal
t G
el
Att
apu
lgit
e cl
ayA
tlas
Mu
d C
o.
Qu
ick
-Gel
Ex
tra
hig
h y
ield
ben
ton
ite
Bar
oid
Div
. N
atio
nal
Lea
d C
o.
Atl
oso
l S
A
nio
nic
-no
nio
nic
su
rfac
tant
Atl
as C
hem
ical
In
d.
Ray
Flo
H
emlo
ck e
xtr
act
#R
ayonie
r, I
nc.
Att
apulg
us
150
Att
apulg
ite
clay
Min
. &
Chem
. P
hil
ipp
RD
111
Pro
cess
ed l
ignosu
lfonat
e#In
tern
atio
nal
Min
.&
Chem
.C
eox
Em
uls
ifie
rM
ud
Contr
ol
Lab
ora
tori
es
Ran
ger
Pu
re Q
ueb
rach
oP
reu
Qu
ebra
cho
May
Bro
ther
s,In
c.C
on
tro
lfo
amD
efo
amer
Mu
dC
on
tro
lL
abo
rato
ries
Sap
pS
odiu
m a
cid p
yro
pho
sphat
e*#
Cro
nox 6
09
Corr
osi
on i
nhib
itor
Un
ited
En
gin
eeri
ng
Corp
.
Sp
erse
ne
Ch
rom
eli
gn
osu
lfo
nat
eM
agco
bar
Def
oam
er N
o.
23
Mu
d d
efo
amer
Bar
oid
Div
. N
atio
nal
Lea
d C
o.
Sh
ale-
Ban
Shal
eco
ntr
ol
com
po
und
Bar
oid
Div
. N
atio
nal
Lea
d C
o.
Em
uls
ifie
rS
Nonio
nic
emuls
ifie
r#
Mu
d E
ngin
eeri
ng
Sup
pli
es
Soda
Ash
S
oda
ash
*#
F-S
Cla
yA
ttap
ulg
ite
clay
U
nit
edE
ngin
eeri
ng C
orp
.
So
diu
m B
ich
rom
ate
So
diu
m b
ich
rom
ate
*#
Flo
rig
elA
ttap
ulg
ite
clay
Flo
rid
in C
o.
So
ltex
Mu
d l
ub
rica
nt
#D
rill
ing S
pec
ialt
ies
Co
. F
lori
gel
H-Y
A
ttap
ulg
ite
clay
Flo
rid
in C
o.
Super
-Col
Extr
ahig
h y
ield
ben
tonit
e M
ilw
hit
e M
ud S
ales
Co.
Hev
iwat
erM
ud d
isper
sant
Dow
ell
Div
., D
ow
Chem
.
Super
ligco
Cau
stic
lignit
eM
ilw
hit
e M
ud S
ales
Co.
May
sal
Cla
yA
ttap
ulg
ite
clay
M
ay B
roth
ers,
Inc.
Shal
e-R
ezH
igh
pre
ssure
lubri
cant
Bro
wn M
ud C
o.
Sal
tS
odiu
m c
hlo
ride
*#
Sodap
hos
Phosp
hat
e#W
estv
aco
Sal
tG
elA
ttap
ulg
ite
clay
M
agco
bar
Su
per
ben
Wy
om
ing b
ento
nit
eS
up
erb
ar S
ales
Sal
t-D
rill
Hem
lock
bar
k e
xtr
act
#R
ayo
nie
r, I
nc.
Super
yie
ldS
ub-b
ento
nit
eS
uper
bar
Sal
esS
alt
Wat
er G
elA
ttap
ulg
ite
clay
Mil
whit
e M
ud S
ales
Co.
Super
Queb
rach
oQ
ueb
rach
o m
ixtu
reS
uper
bar
Sal
esS
uper
Sal
Att
apulg
ite
clay
Super
bar
Sal
es
Super
Thin
M
iner
al l
ignit
eS
uper
bar
Sal
es
Su
per
Sta
rch
Pre
gel
atin
ized
sta
rch
Su
per
bar
Sal
es
Sm
ento
xC
emen
tco
nta
min
atio
nA
ir/G
as
Dri
llin
g M
ate
rials
tre
atin
g a
gen
tB
aro
id D
iv.
Nat
ion
al L
ead
Co
.A
fro
xF
oam
ing
agen
t#
Atl
as C
hem
ical
In
du
stri
es
Tan
nex
Qu
ebra
cho c
om
po
un
d
Bar
oid
Div
. N
atio
nal
Lea
d C
o.
Atl
as C
orr
osi
on
In
hib
ito
r 1
00
P
ola
r o
rgan
icA
tlas
Mu
d C
o.
Tan
coQ
ueb
rach
o c
om
pound
Mil
whit
e M
ud S
ales
Co.
Am
-9C
hem
ical
gro
ut
#A
mer
ican
Cy
anam
id
Tan
nat
hin
Lig
nit
eM
agco
bar
G-2
Foam
ing a
gen
t D
ow
ell
Div
., D
ow
Chem
ical
To
wer
-Gel
Wy
om
ing b
ento
nit
eB
lack
Hil
ls B
ento
nit
eG
afen
Fa-
1
Fo
amin
g a
gen
t fr
esh
to
mo
d.
salt
An
tara
Chem
ical
Tre
atC
aust
iciz
ed l
ignit
eA
tlas
Mu
d C
o.
Gaf
en F
a-5
F
oam
ing
ag
ent,
satu
rate
d s
alt
An
tara
Chem
ical
________________________
___________________________________________________
*S
ever
al p
ack
agin
g c
om
pan
ies
#S
ever
al d
istr
ibu
tin
g c
om
pan
ies
68

Tab
le 4
. M
ate
rials
fo
r D
rill
ing
Flu
id S
yst
em
s (c
on
t.)
Air
/Gas
Dri
llin
gM
ate
rials
(con
t.)
Inv
ert
Em
uls
ion
an
d O
ilM
ud
s(c
on
t.)
Pro
du
ct T
rad
e N
am
eD
escr
ipti
on
Ma
ker
or
Dis
trib
uto
rP
rod
uct
Tra
de
Na
me
Des
crip
tio
nM
ak
er o
r D
istr
ibu
tor
Gaf
en F
a-7
Fo
amin
g a
gen
t, f
resh
& s
alin
eA
nta
ra C
hem
ical
Inv
erti
nE
mu
lsif
ier
Do
wel
l D
iv.,
Dow
Ch
emic
al
Hal
lib
urt
on-S
orb
Wat
erab
sorb
ing a
gen
tH
alli
bu
rto
n C
o.
Jel-
Oil
Oil
mu
dM
agco
bar
Ho
wco
-Su
ds
Su
rfac
tant,
fo
amin
g a
gen
tH
alli
bu
rto
n C
o.
Ken
Oil
O
il m
ud
#K
en C
orp
.
Hy
dro
-Lok
Wat
er S
huto
ff p
last
ic s
lurr
yH
alli
burt
on C
o.
Ken
-X C
once
ntr
ate
1
Inver
tE
muls
ifie
r#K
en C
orp
.
Oil
fos
Def
locc
ula
tin
gag
ent
#M
on
san
toC
hem
ical
Ken
-X C
on
cen
trat
e 2
S
tab
iliz
er (
wei
ght)
#K
en C
orp
.
OK
Liq
uid
F
oam
ing A
gen
t #P
roct
or
& G
amble
K
en-X
Conce
ntr
ate
3
Sta
bil
izer
(te
mper
ature
)#
Ken
Corp
.
Sy
nfo
amF
oam
ing A
gen
t M
ud C
ontr
ol
Lab
ora
tori
esO
B M
ixfi
x
Vis
cosi
ty r
educe
rO
il B
ase,
Inc.
Ter
git
ol
NP
-35
Nony
l phen
yl
poly
ethy
lene
OB
Gel
T
o i
ncr
ease
vis
cosi
tyO
il B
ase,
Inc.
gly
col
eth
er#
Un
ion
Car
bid
eC
hem
ical
sP
etro
ton
eO
il m
ud
su
spen
din
g a
gen
tB
aroid
Div
. N
atio
nal
Lea
d C
o.
Ter
git
ol
NP
X
Nony
l phen
yl
poly
ethy
lene
Pep
tom
agic
Cru
de
oil
-bas
edfl
uid
Oil
Bas
e, I
nc.
gly
col
eth
er#
Un
ion
Car
bid
eC
hem
ical
sP
erm
-Bas
eO
il m
ud
co
nce
ntr
ate
Mac
co C
orp
.
Ter
git
ol
TM
NT
rim
ethy
ln
ony
l et
her
of
Per
m-W
ate
Cal
ciu
m c
arb
onat
eM
acco
Co
rp.
po
lyet
hy
lene
gly
col
#U
nio
n C
arb
ide
Ch
emic
als
Pro
tect
om
agic
Oil
dis
per
sed a
sph
alt
Oil
Bas
e, I
nc.
Wel
l-F
oam
FS
Fo
amin
g a
gen
t W
ell
Co
mp
leti
on
s, I
nc.
Pro
tect
o-M
ul
Co
nce
ntr
ate
for
inv
ert
Wel
l-F
oam
3
Fo
amin
g a
gen
t W
ell
Co
mp
leti
on
s, I
nc.
e
mu
lsio
n
Mag
cob
ar
Wel
l-F
oam
917
Corr
osi
on i
nhib
itor
Wel
l C
om
ple
tions,
Inc.
N
o-B
loc
Inver
tem
uls
ion f
luid
M
agco
bar
Wel
l-P
arch
Dry
in a
nd
an
ti-b
alli
n a
gen
tW
ell
Co
mp
leti
on
s, I
nc.
Sp
ecia
l A
dd
itiv
e 4
7
To
im
pro
ve
susp
ensi
on
pro
per
ties
Oil
Bas
e, I
nc.
Spec
ial
Addit
ive
58
To i
mpro
ve
susp
ensi
on,
gel
pro
per
ties
Oil
Bas
e, I
nc.
Th
erm
-Oil
Inv
ert
Em
uls
ion
co
nce
ntr
ate
Mil
wh
ite
Mu
d S
ales
Co.
Inver
t E
mu
lsio
n a
nd
Oil
Mu
ds
Low
Soli
ds
Mu
ds
Atl
as-I
nver
t 4
00
Poly
oxy
ethy
lene
pro
duct
A
tlas
Mud C
o.
All
oid
Pre
gel
atin
ized
star
chA
lpin
e M
ud
Ser
vic
e
Bla
ck M
agic
Sup
erm
ixF
luid
fo
r hig
hte
mp
. w
ells
O
il B
ase,
Inc.
An
ti-F
oam
Cap
ryl
alco
hol
Mil
wh
ite
Mu
d S
ales
Co.
Bla
ck M
agic
Pre
mix
O
il f
luid
, n
ot
hig
h w
eig
ht
Oil
Bas
e, I
nc.
Atl
as E
mu
lso
500
No
n-i
on
ic s
urf
acta
nt
Atl
as M
ud
Co
.
Ch
emic
al V
A
ddit
ive
to B
lack
Mag
ic,
im
pro
ve
gel
Oil
Bas
e, I
nc.
Atl
as D
rill
ing
Surf
acta
nt
Anio
nic
surf
acta
nt
Atl
as M
ud C
o.
Ch
emic
al W
Tre
atin
gag
ent
for
Bla
ck M
agic
Oil
Bas
e, I
nc.
Atl
asfl
oc
Flo
ccu
lati
ng g
um
Atl
as M
ud
Co
.
Co
ntr
ol
Inver
tO
il m
ud
co
nce
ntr
ate
Mu
d C
on
tro
l L
abo
rato
ries
Bar
aflo
cC
lay
flo
ccula
nt
Bar
oid
Div
. N
atio
nal
Lea
d C
o.
Co
ntr
ol
Em
uls
ion
Oil
N
on
ion
ic s
urf
acta
nt
Mu
d C
on
tro
l L
abo
rato
ries
Dri
llte
xG
uar
gu
m#
T.
M.
Du
che
& S
on
s, I
nc.
Dri
loil
Oil
mu
d c
once
ntr
ate
Bar
oid
Div
. N
atio
nal
Lea
d C
o.
Dri
sco
seS
od
ium
car
bo
xy
met
hy
l-
cell
ulo
se
#D
rill
ing S
pec
ialt
ies
Dri
ltre
atO
il m
ud
sta
bil
izer
Bar
oid
Div
. N
atio
nal
Lea
d C
o.
Lo
loss
Gu
m G
uar
B
aro
id D
iv.
Nat
ion
alL
ead C
o.
Du
rato
ne
Oil
mu
d f
iltr
atio
n c
on
trol
ag
ent
Bar
oid
Div
. N
atio
nal
Lea
d C
o.
Lu
be
Flo
w
Sh
ale
con
tro
l#
Gib
ralt
erM
iner
als
Eco
no
mag
icC
rud
e-o
il b
ased
com
ple
tio
n f
luid
Oil
Bas
e, I
nc.
Mac
-O-M
ul
No
n-i
on
ic s
urf
acta
nt,
emu
lsif
ier
Mac
co C
orp
.
E-Z
Mu
l B
aro
id D
iv.
Nat
ion
alL
ead C
o.
Mu
dfl
oc
Hig
hly
act
ive
flocc
ula
tin
g
agen
t
Mud C
ontr
ol
Lab
ora
tori
es
Gel
ton
eO
il m
ud
gel
lin
gag
ent
Bar
oid
Div
. N
atio
nal
Lea
d C
o.
Sep
aran
Flo
ccu
lati
ng a
gen
tM
ilw
hit
e M
ud
Sal
es C
o.
Ho
t L
ime
Var
ifat
lim
e*
#
Inv
erm
ul
Oil
mu
d e
mu
lsif
ier
Bar
oid
Div
. N
atio
nal
Lea
d C
o.
________________________
___________________________________________________
*S
ever
al p
ack
agin
g c
om
pan
ies
#
Sev
eral
dis
trib
uti
ng
co
mp
anie
s
Em
uls
ifie
r fo
r C
aCl
solu
tio
ns
in
oil
69
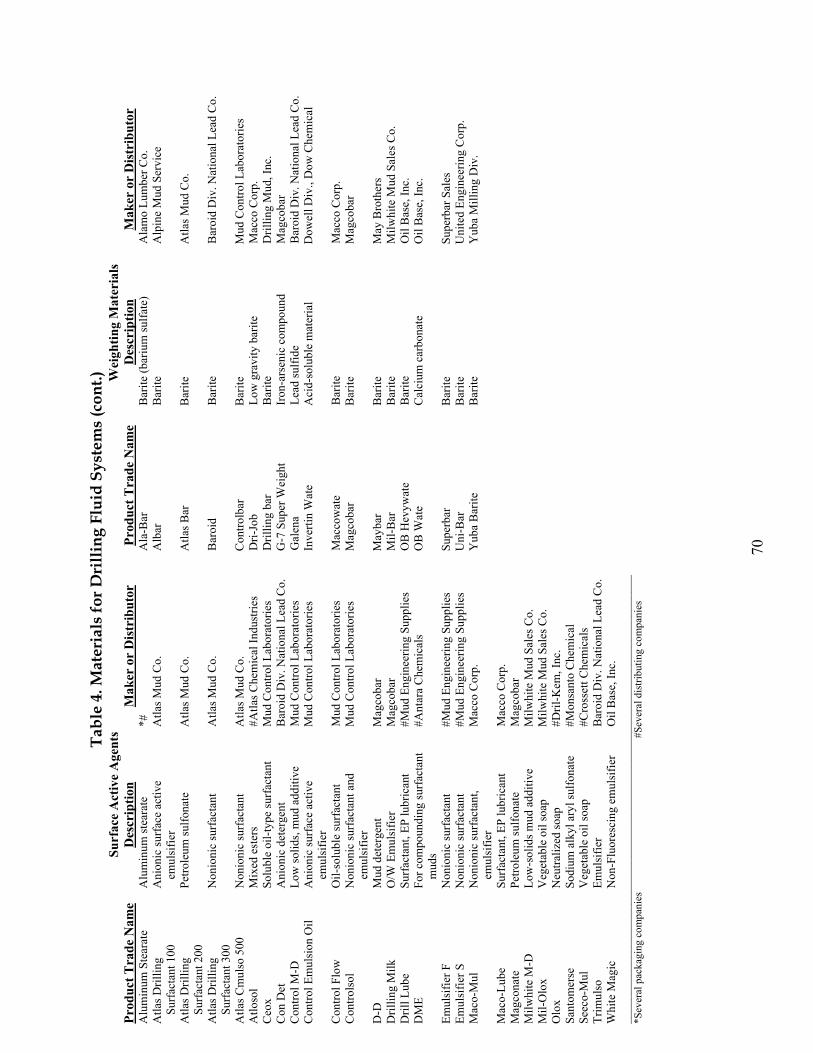
Tab
le 4
. M
ate
rials
fo
r D
rill
ing
Flu
id S
yst
em
s (c
on
t.)
Su
rface
Act
ive
Agen
ts
Wei
gh
tin
g M
ate
ria
ls
Pro
du
ct T
rad
e N
am
eD
escr
ipti
on
Ma
ker
or
Dis
trib
uto
rP
rod
uct
Tra
de
Na
me
Des
crip
tio
nM
ak
er o
r D
istr
ibu
tor
Alu
min
um
Ste
arat
eA
lum
inu
m s
tear
ate
*#
Ala
-Bar
Bar
ite
(bar
ium
su
lfat
e)A
lam
o L
um
ber
Co
.
Atl
asD
rill
ing
Su
rfac
tan
t 1
00
An
ion
icsu
rfac
e ac
tiv
e
em
uls
ifie
r
Atl
as M
ud
Co
. A
lbar
Bar
ite
Alp
ine
Mu
d S
ervic
e
Atl
as D
rill
ing
Su
rfac
tan
t 2
00
Pet
role
um
sulf
onat
eA
tlas
Mud C
o.
Atl
as B
ar
Bar
ite
Atl
as M
ud C
o.
Atl
as D
rill
ing
Su
rfac
tan
t 3
00
No
nio
nic
su
rfac
tan
tA
tlas
Mu
d C
o.
Bar
oid
Bar
ite
Bar
oid
Div
. N
atio
nal
Lea
d C
o.
Atl
as C
muls
o 5
00
Nonio
nic
surf
acta
nt
Atl
as M
ud C
o.
Contr
olb
arB
arit
eM
ud C
ontr
ol
Lab
ora
tori
es
Atl
oso
lM
ixed
est
ers
#A
tlas
Ch
emic
al I
nd
ust
ries
Dri
-Jo
bL
ow
gra
vit
y b
arit
eM
acco
Co
rp.
Ceo
xS
olu
ble
oil
-ty
pe
surf
acta
nt
Mu
d C
on
tro
l L
abo
rato
ries
Dri
llin
g b
ar
Bar
ite
Dri
llin
g M
ud
, In
c.
Co
n D
et
An
ion
ic d
eter
gen
tB
aro
id D
iv.
Nat
ion
al L
ead C
o.
G-7
Su
per
Wei
ght
Iro
n-a
rsen
ic c
om
po
un
dM
agco
bar
Co
ntr
ol
M-D
L
ow
so
lid
s, m
ud a
dd
itiv
e M
ud
Co
ntr
ol
Lab
ora
tori
esG
alen
aL
ead s
ulf
ide
Bar
oid
Div
. N
atio
nal
Lea
d C
o.
Contr
ol
Em
uls
ion O
ilA
nio
nic
surf
ace
acti
ve
em
uls
ifie
r
Mud C
ontr
ol
Lab
ora
tori
esIn
ver
tin W
ate
Aci
d-s
olu
ble
mat
eria
l D
ow
ell
Div
., D
ow
Chem
ical
Co
ntr
ol
Flo
wO
il-s
olu
ble
su
rfac
tant
Mu
d C
on
tro
l L
abo
rato
ries
Mac
cow
ate
Bar
ite
Mac
co C
orp
.
Co
ntr
ols
ol
Non
ion
ic s
urf
acta
nt
and
em
uls
ifie
r
Mud C
ontr
ol
Lab
ora
tori
esM
agco
bar
Bar
ite
Mag
cobar
D-D
Mud
det
ergen
tM
agco
bar
May
bar
Bar
ite
May
Bro
ther
s
Dri
llin
g M
ilk
O
/W E
mu
lsif
ier
Mag
cob
arM
il-B
arB
arit
eM
ilw
hit
e M
ud
Sal
es C
o.
Dri
llL
ub
eS
urf
acta
nt,
EP
lub
rica
nt
#M
ud
En
gin
eeri
ng
Su
pp
lies
O
B H
evy
wat
eB
arit
eO
il B
ase,
Inc.
DM
EF
or
com
poundin
g s
urf
acta
nt
muds
#A
nta
ra C
hem
ical
sO
B W
ate
Cal
ciu
mca
rbo
nat
eO
il B
ase,
Inc.
Em
uls
ifie
r F
N
onio
nic
surf
acta
nt
#M
ud E
ngin
eeri
ng S
uppli
es
Super
bar
Bar
ite
Super
bar
Sal
es
Em
uls
ifie
r S
N
onio
nic
surf
acta
nt
#M
ud E
ngin
eeri
ng S
uppli
es
Uni-
Bar
Bar
ite
Unit
edE
ngin
eeri
ng
Corp
.
Mac
o-M
ul
No
nio
nic
su
rfac
tan
t,
em
uls
ifie
r
Mac
co C
orp
.Y
ub
a B
arit
eB
arit
eY
ub
a M
illi
ng
Div
.
Mac
o-L
ub
eS
urf
acta
nt,
EP
lub
rica
nt
Mac
co C
orp
.
Mag
con
ate
Pet
role
um
sulf
on
ate
Mag
cob
ar
Mil
whit
e M
-D
Low
-soli
ds
mud a
ddit
ive
Mil
whit
e M
ud S
ales
Co.
Mil
-Olo
xV
eget
able
oil
soap
M
ilw
hit
e M
ud S
ales
Co.
Olo
xN
eutr
aliz
ed s
oap
#D
ril-
Kem
, In
c.
San
tom
erse
Sodiu
m a
lky
lar
yl
sulf
onat
e#M
onsa
nto
Chem
ical
See
co-M
ul
Veg
etab
le o
il s
oap
#C
ross
ett
Ch
emic
als
Tri
mu
lso
Em
uls
ifie
rB
aro
id D
iv.
Nat
ion
alL
ead C
o.
Wh
ite
Mag
ic
No
n-F
luo
resc
ing e
mu
lsif
ier
Oil
Bas
e, I
nc.
_____________________________________________________
______________________
*S
ever
al p
ack
agin
g c
om
pan
ies
#
Sev
eral
dis
trib
uti
ng
co
mp
anie
s
70

Tab
le 4
. M
ate
rials
fo
r D
rill
ing
Flu
id S
yst
em
s (c
on
t.)
Lost
Cir
cula
tion
Ad
dit
ives
Lo
st C
ircu
lati
on
Ad
dit
ives
(co
nt.
)
Pro
du
ct T
rad
e N
am
eD
escr
ipti
on
Ma
ker
or
Dis
trib
uto
rP
rod
uct
Tra
de
Na
me
Des
crip
tio
nM
ak
er o
r D
istr
ibu
tor
Ala
-Fib
erF
ibro
us
mat
eria
l A
lam
o L
um
ber
Co
.L
eath
er S
eal
Lat
her
fib
ers
Bar
oid
Div
. N
atio
nal
Lea
d C
o.
Ala
-Fla
ke
Sh
red
ded
cel
loph
ane
flak
esA
lam
o L
um
ber
Co
.L
eath
-OL
eath
er f
iber
s M
ilw
hit
e M
ud
Sal
es C
o.
Ala
-Mic
aS
hre
dded
mic
a A
lam
o L
um
ber
Co.
Mag
co-F
iber
Shre
dded
wood f
iber
M
agco
bar
Ala
-Plu
gG
rad
ed w
aln
ut
shel
lsA
lam
o L
um
ber
Co
.M
agco
-Mic
aG
rad
ed m
ica
Mag
cob
ar
Als
eal
Can
e, w
ood f
iber
ble
nd
Alp
ine
Mud S
ervic
eM
aste
rbri
dge
Extr
a-co
urs
e al
mond s
hel
lsM
aste
rsea
l S
ales
Corp
.
Atl
as F
iber
S
ugar
can
e bag
asse
Atl
as M
ud C
o.
Mas
terp
lug
Shap
ed r
ubber
M
aste
rsea
l S
ales
Corp
.
Atl
as M
ica
Siz
ed m
ica
Atl
asM
ud C
o.
Mas
ters
eal
Alm
ond
shel
lsM
aste
rsea
l S
ales
Corp
.
Ala
-Shel
lP
ecan
shel
lsA
lam
o L
um
ber
Co.
May
fiber
Can
e, w
ood f
iber
ble
nd
May
Bro
ther
s
Alf
lake
Shre
dded
cel
loph
ane
flak
esA
lpin
e M
ud
Ser
vic
eM
ayfl
akes
Shre
dded
cel
lophan
e fl
akes
May
Bro
ther
s
Alp
ine
Mic
aG
rad
ed m
ica
Alp
ine
Mu
d S
ervic
eM
aym
ica
Gra
de
mic
aM
ay B
roth
ers
Asp
en F
iber
A
spen
fib
ers
#A
spen
Fib
er C
o.
Mic
atex
Mic
aB
aro
id D
iv.
Nat
ion
alL
ead C
o.
Bar
k-S
eal
Shre
dd
ed t
ree
bar
k
Alp
ine
Mud
Ser
vic
eM
il-C
edar
Plu
g
Ced
ar w
oo
d f
iber
s M
ilw
hit
e M
ud
Sal
es C
o.
Bea
ver
Dam
G
round g
ilso
nit
e G
ibra
lter
Min
eral
sM
il-F
iber
Sugar
can
e bag
asse
Mil
whit
e M
ud S
ales
Co.
Bri
stex
Ho
g b
rist
les
#B
rist
ex C
o.
Mil
flak
eS
hre
dd
ed c
ello
ph
ane
flak
esM
ilw
hit
e M
ud
Sal
es C
o.
Bri
stex
-Sea
lH
og
bri
stle
s an
d c
ott
on
lint
#B
rist
exC
o.
Mil
mic
aG
rad
ed m
ica
Mil
wh
ite
Mu
d S
ales
Co.
Cel
-Fla
kes
Gro
und
cell
ophan
eU
nit
edE
ngin
eeri
ng C
orp
. M
il-P
lug
Pulv
eriz
ed w
alnut
shel
ls
Mil
wh
ite
Mu
d S
ales
Co.
Cel
l-O
-Phan
eS
hre
dded
cel
loph
ane
flak
es#A
rno
ld &
Cla
rke
Mil
Sea
l W
ood c
hip
s M
ilw
hit
e M
ud S
ales
Co.
Cel
l-O
-Sea
lS
hre
dded
cel
lophan
e fl
akes
Mag
cobar
Mil
-Wool
Fib
rous
min
eral
wood
Mil
whit
e M
ud S
ales
Co.
Ced
ar S
eal
Ced
ar f
iber
#D
ril-
Kem
, In
c.M
ud F
iber
C
ane
fiber
sM
agco
bar
Cer
t-N
-Cea
lD
elay
ed a
ctio
n b
ento
nit
e,
gra
n.
Mat
.#M
acco
Corp
.
Mic
a
Nu
t P
lug
Siz
ed m
ica
Gro
und
wal
nut
shel
ls
#U
.S.
Mic
a C
o.Jo
lex
Mic
a
Mag
cob
ar
Ch
ek-L
oss
Siz
ed n
eop
rene
rubber
Mil
whit
e M
ud S
ales
Co.
Oil
Pat
ch
Gro
und w
alnut
shel
lsM
ud
Con
trol
Lab
ora
tori
es
Ch
ip-S
eal
Sh
red
ded
wo
od
fib
erM
agco
bar
Pal
co S
eal
Pro
cess
ed r
edw
oo
d f
iber
s #
Pac
ific
Lu
mb
er C
o.
Con
trol
Fib
erF
ibro
us
mat
eria
l M
ud C
ontr
ol
Lab
ora
tori
es
Phen
o-S
eal
Gro
und
pla
stic
#
Con
trol
Wood
Aci
d-s
olu
ble
min
eral
wood
Mud
Contr
ol
Lab
ora
tori
es
Poly
flak
eO
ilso
luble
fil
m
Bar
oid
Div
. N
atio
nal
Lea
d C
o.
Cott
onse
ed H
ull
s C
ott
onse
ed h
ull
s*#
Poly
-Plu
gF
iber
s an
d p
last
icC
her
okee
Lab
ora
tori
es
Chem
ical
W
Agen
t to
form
gel
pil
lsO
il B
ase,
Inc.
Poz-
Plu
gW
ood c
hip
s #P
oz-
Plu
g C
orp
.
Ch
rom
e L
eath
erS
hre
dd
ed l
eath
erA
lam
o L
um
ber
Co
.P
lug
-Git
Wo
od
fib
ers
Bar
oid
Div
. N
atio
nal
Lea
d C
o.
Dic
k’s
Mud S
eal
Gro
und n
aner
#D
ick’s
Mud S
eal
Co.
Pla
stic
Sea
l G
round f
orm
ica
Ala
mo L
um
ber
Co.
Fea
ther
Sto
p
Fea
ther
sM
ilw
hit
e M
ud S
ales
Co.
Rubber
Sea
l G
round r
ubber
A
tlas
Mud C
o.
Fib
er-S
eal
Ble
nd
edfi
ber
sM
agco
bar
Sea
lfla
kes
Fra
gm
ente
d c
ellu
lose
Mu
d C
on
tro
l L
abo
rato
ries
Fib
erte
xC
ane
fib
ers
Bar
oid
Div
. N
atio
nal
Lea
d C
o.
Sil
vac
elF
ir a
nd
bal
sum
fib
er#
Way
erhau
ser
Tim
ber
Co
.
Fo
rmap
lug
Cla
y-c
emen
tM
agco
bar
Sto
p-I
tC
edar
wo
od f
iber
s #
Tex
as C
edar
Sea
l C
o.
Form
asea
lA
ir b
low
n a
sphal
tO
il B
ase,
Inc.
Str
ata-
Sea
lE
xpan
ded
per
lite
#G
reat
Lak
es C
arbon C
orp
.
Fla
xse
alG
round
fla
x s
hiv
eA
rcher
-Dan
iels
-Mid
land
Super
Fib
er
Can
e, w
ood f
iber
sS
up
erbar
Sal
es
Hy
-Sea
lG
rou
nd
pap
erB
aro
id D
iv.
Nat
ion
al L
ead C
o.
Su
per
Sea
l S
hre
dd
ed c
ello
phan
e fl
akes
Su
per
bar
Sal
es
Jelf
lake
Cel
lop
han
e fl
akes
#D
ow
ell
Div
. D
ow
Chem
ical
Su
per
Mic
a G
rad
ed m
ica
Su
per
bar
Sal
es
Ko-S
eal
Gra
nula
ted c
orn
cobs
Mud
Contr
ol
Lab
ora
tori
esS
uper
bri
dge
Expan
ded
per
lite
Mud
Contr
ol
Lab
ora
tori
es
Kin
g S
eal
Tex
tile
fib
ers
Ala
mo
Lu
mber
Co
.T
uff
ern
ell
Wal
nu
t sh
ells
Mac
co C
orp
.
Kre
vic
e K
log
Dro
p b
ags
of
gra
nula
r
ben
tonit
eB
aro
id D
iv.
Nat
ion
alL
ead C
o.
Wal
l-N
ut
Wal
nu
t P
lug
Nuts
hel
ls
Wal
nut
shel
ls
Bar
oid
Div
. #D
ugdal
e &
Sons
Nat
ion
al L
ead C
o.
Lea
ther
Flo
c L
eath
erfi
ber
sM
agco
bar
___________________________________________________________________________
*S
ever
al p
ack
agin
g c
om
pan
ies
#S
ever
al d
istr
ibu
tin
g c
om
pan
ies
71

APPENDIX B
CEMENT ADDITIVES
72

CEMENT ADDITIVES1
Cement additive materials may be classified as follows:
1. Extenders
2. Accelerators
3. Retarders
4. Weighting Materials
5. Lost Circulation Control
6. Dispersants
7. Water Loss Control
8. Special Materials
Extenders
The use of extenders in cement has allowed the reduction of the slurry density, increase in
the slurry yield, and reduction of cost. Water is the primary extender; however, if the
recommended water content of the cement is exceeded, there is free water. The addition of
extenders will alleviate this problem. Another reason for using extenders in cement is to reduce
the hydrostatic pressure on the formation. The widely used extenders are:
1. Bentonite (montmorillonite)
2. Natural Pozzolan
3. Artificial Pozzolan (Flyash)
4. Perlites (Expanded)
5. Diatomaceous Earth
6. Sodium Silicate
7. Kolite and Gilsonite
Bentonite
Bentonite or commonly referred to as gel may be dry blended with the cement or prehydrated
in the mix water. The API recommended water is 5.3% for each 1% bentonite added to the dry
cement. If the bentonite is prehydrated in the mix water, you may use one fourth the amount of
bentonite dry blended (that is 1:4 ratio). Bentonite may be used from 2 to 25% by weight of
cement; however, it is normally used in the range of 2 to 16%. Table 5 shows the effect of
bentonite on the slurry properties of typical Class H cement.
1 Calvert, D.B., Cementing Materials, Cementing Symposium, Ardmore, OK, May 1977..
73

Table 5. Effect of bentonite on the slurry properties of Class H cement (using 38% water by weight of cement)
Bentonite (%) Water Content (gal/sk) Slurry Weight (lb/gal) Slurry Yield (Cu ft/sk)
0 4.29 16.45 1.05
2 5.49 15.4 1.22
4 6.69 14.7 1.39
8 9.07 14.1 1.56
12 11.48 12.9 2.08
The addition of bentonite reduces the compressive strength and normally will reduce the
thickening time.
Natural Pozzolan
Natural pozzolans have been used for a number of years blended with cement and bentonite
to design reduced weight cement systems. It is used primarily in the California operations.
Artificial Pozzolan (Flyash)
Artificial pozzolan or flyash as it’s commonly referred to has been used widely in the
cementing operations. It normally is blended with cement and bentonite to develop the
lightweight systems.
Perlite (Expanded)
Perlite is a volcanic material that is crushed and then heated to expand it. Perlites were
widely used in field operations; however, it is used very little today.
Diatomaceous Earth
Diatomaceous earth is a special grade of material that may be used to design low density
cement systems. It normally is used at a concentration of 10 to 40% by weight of cement. A
density of about 11 lb/gal using 40% diatomaceous earth by weight of cement.
Sodium Silicate
Sodium silicate has been used in the past few years as a lightweight material because it
allows for large quantities of water to be added while using only small amounts of the additive. It
normally is used at a ratio of 1 to 3% by weight of cement.
Kolite and Gilsonite
Kolite is a graded coal whereas gilsonite is an asphalt material. They both may be used to
reduce the density; however, their primary use is as a lost circulation material.
74

Accelerators
Accelerators are normally used at low temperature conditions to accelerate the thickening
time and increase the early strength development of the cement. The commonly used accelerators
are:
1. Calcium chloride
2. Sodium chloride
3. Calcium sulfate
4. Sodium silicate
Calcium Chloride
Calcium chloride is the most widely used cement accelerator used in field operations. It is
used normally at a concentration of 2 to 4% by weight of cement. It may be added to the dry
cement or it may be mixed in the mix water. Calcium chloride does not affect the ultimate
compressive strength of the set cement. Table 6 shows the effect of calcium chloride on strength
development of set cement.
Table 6. Effect of Calcium Chloride on Set Cement 60°F 80°F 110°FCalcium
Chloride (%) 6 hrs. 12 hrs. 6 hrs. 12 hrs. 6 hrs. 12 hrs.
0 Not set 80 60 450 425 925
2 140 650 350 1190 1350 2500
Sodium Chloride
Sodium chloride is also an effective accelerator for cement systems. It normally is used at a
concentration of 3 to about 10% by weight of mix water to obtain total acceleration. It should
also be noted that at high concentrations (20% by weight of water) sodium chloride becomes a
retarder.
Calcium Sulfate
The himihydrate form (plaster of paris) is the most common calcium sulfate used. It may be
used up to 100% by weight of cement. Very short thickening times may be obtained with these
systems.
Sodium Silicate
The DiacelR cement systems developed by Phillips is the primary use of sodium silicate as an
accelerator. It is used mainly when CMHEC (carboxmethyl hydroxyethyl cellulose) water loss
control material has been added to the system.
75R Trademark

Retarders
Retarders are used in cement systems where bottomhole temperatures are such that adequate
thickening times cannot be obtained with neat cements. Retarders should be compatible with
other additives that might be used in cement systems.
Retarders are designed not only to retard the set of cement, but they may function to increase
or decrease viscosity. The common retarders are:
1. Lignin materials
2. Organic blends
3. Celluloses
4. Inorganic materials
Lignin
Lignin is the retarder most commonly used. They are effective over a wide range of
temperature; however, without a retarder supplement, they are not used at bottomhole circulating
temperatures above about 200°F. The lignin will also reduce slurry viscosity. Normal use is from
0.1 to 1.0% by weight of cement depending on the class of cement. Table 7 shows the effect of
lignin retarder on a Class H cement system.
Table 7. Effect of Lignin Retarder on a Typical Class H Cement Thickening Time (hours: min) API Casing Cementing Tests for
Simulated Well Depth (ft) of:Retarder
(%)8,000 10,000 12,000 14,000
0.0 1:56 1:26 1:09 1:00
0.2 2:15 2:12 1:38 1:25
0.3 3:38 2:40 2:14 1:58
0.4 4:42 3:36 3:10 2:58
Organic Materials
The organic retarders are offered to the industry by all the service companies. Most of these
retarder systems are property in nature and the cement systems are designed for specific well
conditions.
Celluloses
Cellulose materials were initially developed as water loss control materials for cement;
however, it is also found that retardation could also be obtained with these materials. A
secondary function of the cellulose materials is that they will increase the viscosity of the slurry.
The most common cellulose used is CMHEC.
76

Inorganic Materials
Saturated sodium chloride water or salt saturated cement is the most common inorganic
retarder used. Salt saturated cements retard over a wide temperature and at low temperatures may
cause extended thickening times. Formation properties will normally determine salt
concentration.
Weighting Materials
In some areas, normal cement densities are not capable of controlling down hole well
conditions. An increase in the slurry density will require the addition of a weighting material. An
acceptable weighting material should not (1) affect the overall properties of the slurry, (2) not
interfere with well operations and (3) be chemically inert. The most common weighting materials
are:
1. Hematite (Iron oxide)
2. Ilmenite (Iron - titanium oxide)
3. Barite (Barium sulfate)
Hematite
Hematite is an iron oxide with a specific gravity of approximately 5. It is the most widely
used weighting agent in field operations. It is used at a concentration of about 5 pounds to 50
pounds per sack of cement depending on well conditions. It is in the fine to semi-fine particle
size range and may require additional mix water to be added.
Ilmenite
Ilmenite is an iron-titanium oxide with a specific gravity of approximately 4.6. It is used
from about 5 pounds to 50 pounds per sack; however, it is considered to be a coarse ground
particle and slurry properties should be considered.
Barite
Barite is a fine grind barium sulfate with a specific gravity of approximately 4.3. Barite is not
widely used in cement slurry design today because of its fine grid and high water requirement.
Lost Circulation Control
Lost circulation or loss of returns is a problem that is encountered in cementing operations
during placement of slurry in fractured zones (either natural or induced) and/or cavernous type
formations. Lost circulation may be controlled in different ways; however, a reduction in slurry
77

density combined with a budging material and many times a flake material is effective. The most
common lost circulation materials are:
1. Kolite
2. Gilsonite
3. Cellophane flakes
Kolite
Kolite is a graded coal that has been prepared as an aid in lost circulation. It may be used
over a concentration range of 1 to 25 pounds per sack, but common use range is 5 to 20 pounds.
Kolite does require that additional water be used for mixing and for each 25 pounds of kolite, an
additional one gallon of mix water should be used.
Gilsonite
Gilsonite is an asphalt material which is mined and graded to a specific particle size range to
aid in lost circulation control. It may be used at a concentration of 5 to 50 pounds per sack.
Normal usage range is 5 to 25 pounds. The water requirement for gilsonite is for each 25 pounds
added to the system, an additional one gallon of water should be used.
Cellophane Flakes
Cellophane flakes are used in conjunction with the granular type materials to aid in building
a bridging system. They are normally used at a concentration of to ½ pound per sack of
cement. There are also a number of specialty cement systems designed to aid in lost circulation
control. The most common are (1) Gypsum cement (Calseal or Gypseal), (2) Gypsum - Portland
cement blends, (3) gel cement and (4) Diesel oil - cement or diesel oil - bentonite blends. Well
conditions in most cases will indicate which system may be best to solve the lost circulation
problem.
Dispersants
The use of dispersants allowed the application of turbulent flow cementing be performed at
practical pump rates. Slurries containing dispersants have a reduced viscosity which allows
lower pressures on the formation during placement of the slurry. The common dispersants are:
1. Alkyl aryl sulfonates (powder and liquid)
2. Lignin
3. Inorganic salts
4. Organic acids
78

Alkyl aryl Sulfonates
The sulfonates are the most widely used dispersants because of the wide temperature range
and overall effect on slurry properties. Another major benefit of dispersants in cement is the
ability to design reduced water or densified cements. Typical Class H cement may be increased
in weight to about 17.5 pounds per gallon using a dispersant and no weighting material. Table 8
shows the effect of a sulfonate dispersant or critical pump rate (Qc) at given well conditions.
Table 8. Effect of sulfonate dispersant or critical pump rate (Qc)
Cement System Dispersant (%)Critical Pump Rate, Qc 4-1/2”
Pipe in 7-7/8” Hole
Class H cement 0 17 BPM
Class H cement 1.0 4 BPM
Pozzolan: Cement Blend 0 22 BPM
Pozzolan: Cement Blend 1.0 5 BPM
The sulfonate dispersants are compatible with most cement materials; however, salt
concentrations (greater than 18% by weight of water) will have a detrimental effect and should
be tested before use.
Lignin
Lignins have a thinning effect on many cement systems; however, they also retard at low
temperatures and, therefore, are limited somewhat in their overall use. The most common use of
lignin as dispersants is in the high-gel cement systems.
Inorganic Salts
Sodium chloride is the most common inorganic salt used as a dispersant. It is most effective
in the pozzolan; cement blends, bentonite and diatomaceous earth systems.
Organic Acids
Organic acids are used primarily as retarders in cement; however, they will also show a
thinning effect on many cement systems. Well conditions will dictate their use in most cases.
Water Loss Control Materials
A neat cement system when tested under API conditions (Fluid Loss) will show a 30-minute
loss of greater than 1000 cc. The loss of cement filtrate may cause formation damage, premature
setting of the cement, inability to place the cement, and unsuccessful squeeze cement operations.
A water loss control material allows for the development of a filter cake on the formation face,
thereby control of the slurry properties. The most common materials are:
79

1. Cellulose materials
2. Polymers (Liquid)
Cellulose materials
The cellulose materials are the most widely used in water loss control. They are effective in
most cement systems used in the field. Their usage range will vary from 0.5 to 1.5% by weight
of cement. Cellulose presently used may be affected by the common inorganic salts (calcium
chloride, sodium chloride and potassium chloride).
Polymers (Liquid)
A very effective water loss control material was introduced in the late 1960’s which must he
added to the mix water. It is effective over a wide temperature range and has little effect on the
slurry properties from the standpoint of thickening time and compressive strength. It is normally
used in the range of 0.1 to 0.5 gallons per sack of cement.
Special Materials
There are a number of additives that are used in cement slurry design to build specific
properties.
Mud decontaminates are used to decrease the effect of lignin type muds on the set properties
of the cement. They are normally used at a concentration of 1.0% by weight of cement.
The use of fine silica (silica sand and silica flour) is normally added to a cement system
which is to be exposed to high temperatures (may vary depending on cement system) to prevent
loss of strength. Fine silica is compatible with all API cements and normally will be used as a
concentration of 20 to 40% by weight of cement. Additional water is usually required for mixing
when fine silica is used.
There are other materials which have application such as latex, radioactive tracers, fibers,
special lightweight cements, expanding cement, washes, spacers, and antifoam materials.
There is considerable information developed by the service companies in regard to the
properties of the cementing materials that are discussed in this article. Some of the materials may
vary in chemical nature; however, they are designed to perform for your specific well conditions.
Attached is one of the most recent comparative listings of cement materials used by the
cementing service companies.
80

Tab
le 9
. C
EM
EN
T P
RO
DU
CT
CO
MP
AR
ISO
N -
CH
AR
TC
OM
PE
TIT
IVE
EQ
UIV
AL
EN
TS
Cla
ssif
ica
tion
Magci
bar
Hall
ibu
rto
nD
ow
ell
B.J
.W
esla
nP
rod
uct
ion
Des
crip
tio
nA
ccel
erat
ors
CaC
l 2C
aCl 2
S-1
A-7
CaC
l 2C
alci
um
Chlo
ride
MC
A-L
CaC
l 2D
-77
A-7
L-
Liq
uid
Acc
eler
ator
MA
-2H
A-5
D-4
3A
-BW
A-4
Inorg
anic
Acc
eler
ators
Dia
cel
A
Dia
cel
A
D-5
7D
iace
lA
Dia
cel
A
Sodiu
m S
ilic
ate
Sal
tS
alt
D-4
4A
-5S
alt
Sodiu
mC
hlo
ride
Ret
arder
sM
LR
-1H
R-7
-K
emb
reak
WR
-1L
ow
Tem
per
atu
re R
etar
der
HL
R-3
HR
-4D
-13
R-5
WR
-2L
ow
Tem
per
ature
Ret
arder
MH
R-8
HR
-12
D-2
8R
-11
WR
-6H
igh T
emper
ature
Ret
arder
MH
R-9
HR
-15
D-9
3M
-6W
R-7
Hig
h T
emper
ature
Supple
men
t
MF
LR
-7D
iace
l L
WL
D-8
R-6
Dia
cel
LW
LD
iace
l L
WL
CM
HE
C
MH
R-6
00
HR
-20
D-9
9-
-E
xtr
eme
Hig
h T
emper
ature
ML
R-L
HR
-6L
D-8
1R
-14L
WR
-L1
Low
Tem
per
ature
Liq
uid
Ret
arder
MH
R-L
HR
-13L
-R
-14
L-
Hig
h T
emper
ature
Liq
uid
Ret
arder
Flu
id L
oss
Addit
ive
MF
L-4
Hal
ad 9
,14
D-6
0D
-19
CF
-1F
luid
Loss
Contr
ol
Addit
ive
MF
L-5
Hal
ad 9
,14
D-5
9D
-22
CF
-2F
luid
Loss
Contr
ol
Addit
ive
MF
LR
-7D
iace
l L
WL
D-8
R-6
Dia
cel
LW
LD
iace
l L
WL
CM
HE
C
MF
L-L
CF
R-2
, L
A-2
D
-73
--
Liq
uid
Flu
id L
ost
Ad
dit
ive
Turb
ule
nce
Induce
rsM
CD
-3C
FR
-2T
IC I
I D
-45
D-3
1T
F-4
Cem
ent
Dis
per
sant
MC
D-4
CF
R-1
TIC
I D
-65
-T
F-5
Cem
ent
Dis
per
sant
MC
D-L
CF
R-2
D-8
0D
-31-L
-L
iquid
Cem
ent
Dis
per
sant
H-T
LW
Ble
nd
s M
ult
iden
se1
:1 H
-TL
W1
:1 H
-TL
W1
:1 H
-TL
WT
alc
Var
iou
s H
-TL
W B
len
ds
Ex
ten
der
sM
-Gel
Ho
wco
Gel
Ben
ton
ite
BJ
Gel
Ben
ton
ite
Cem
enti
ng
Gra
de
Ben
ton
ite
Gil
son
ite
Gil
son
ite
D-2
4,
D-9
2D
-7G
ilso
nit
eE
xte
nder
and
Lost
Cir
cula
tio
n
Th
rift
yM
ixE
conoli
teD
-79
A-2
Thri
fty
-Lit
eC
hem
ical
Exte
nder
Th
rift
y M
ix-L
Eco
no
lite
-LD
-75
A-3
L-
Liq
uid
Ch
emic
al E
xte
nd
er
Mag
co P
oz
A
Po
zmix
A
Lit
epoz
3
Dia
mix
F
Fo
zmen
t A
A
rtif
icia
l P
ozz
ola
ns
Mag
co P
ox 1
80
Pozm
ix 1
40
Lit
epoz
180
T
her
moss
et-
Pozz
ola
n –
Lim
e M
ixtu
res
Eco
noble
nd
How
coli
ght
Lit
epoz
300
-T
hri
fty
men
tC
lass
II-
Poz
Ble
nds
Anti
-Foam
Agen
ts
MF
P-5
NF
-PD
-46
D-6
AF
-8P
ow
der
ed A
nti
foam
Agen
ts
MF
P-L
D-A
ir 2
D
-47
D-2
1A
F-L
Liq
uid
Anti
foam
Agen
ts
Th
ixo
tro
pic
Cem
ent
Th
ixo
cem
Th
ixo
mix
Reg
.F
ill-
up
Th
ixo
tro
pic
Th
ixo
men
tT
hix
otr
op
ic C
emen
t S
lurr
ies
Sil
ica
San
d
MS
-1S
ilic
a F
lour
D-6
6D
-8S
F-3
Min
us
200 M
esh S
ilic
a F
lour
MS
-2S
ilic
a F
lour
Coar
seD
-30
D-S
CS
F-4
Okla
hom
a #1 S
and
Wei
ghti
ng M
ater
ial
Nag
cobar
Bar
ite
D-3
1W
-1B
arit
eB
arit
e
MW
-2H
i-D
ense
3D
-76
W-5
WM
-2H
emat
ite
MW
-1H
i-D
ense
2D
-18
W-3
Ilm
enit
eIl
men
ite
Spac
ers
& W
ashes
MH
W-1
Mud-F
lush
CW
-7,
CW
-100
Mud-C
lean
WM
W-1
Mud T
hin
ner
-Spac
er
MC
S-2
SA
M-4
,5S
pac
er 1
000
Mud-S
wee
pA
PS
-1W
ater
Bas
ed M
ud S
pac
er
MC
S-3
SM
A-4
,5O
il B
ase
Spac
erO
il B
ase
Mud
Sw
eep
AP
S-1
Oil
Bas
ed M
ud
Spac
er
Lo
st C
ircu
lati
on
Gil
son
ite
Gil
son
ite
D-2
4D
-7G
ilso
nit
eG
ran
ula
r N
atu
ral
Hy
dro
carb
on
Cel
lo-S
eal
Flo
cele
D-2
9C
ello
-Fla
ke
Cel
l-O
-Sea
lC
ello
ph
ane
Fla
kes
Kw
ik-S
eal
-K
wik
-Sea
lK
wik
-Sea
lK
wik
-Sea
lG
rad
edP
arti
cle
Siz
es
Nut
Plu
g
Wal
nut
Shel
ls
D-4
2T
uf-
plu
gT
uf-
plu
gG
round
Wal
nut
Shel
ls
Mu
d D
eco
nta
min
ant
Har
d-S
et 1
M
ud
Kil
-1
K-2
1F
irm
Set
I
Sh
ur
Set
I
Mu
d K
ill
Pat
ente
d b
y G
ulf
Oil
Har
d-S
et I
I M
ud
Kil
-2
K-2
1F
irm
Set
II
Sh
ur
Set
II
Mu
d K
ill
Pat
ente
d b
y G
ulf
Oil
Lat
exM
CL
-2L
AP
-1D
-15
D-5
CL
X-1
Lat
exA
ddit
ive
81

APPENDIX C
RESULTS AND DATA SHEETS
82

Date
:
PN
G 4
51 -
OIL
WE
LL D
RIL
LIN
G L
AB
OR
AT
OR
Y
DA
TA
SH
EE
T 1
Experim
ent
#1:
Pro
pert
ies o
f fr
esh w
ate
r m
uds
Gro
up
No.:
Gro
up
1)
3)
Mem
be
rs:
2)
4)
C.F
.R
ea
din
g(s
ec)
10
rp
m50
rp
m1
00
rp
m2
00
rp
m3
00
rp
m6
00
rp
m1
0se
c1
0 m
in
1 2 1 2 1 23
Gro
up
No.
Mu
d
No.
Mars
hall
Fu
nn
el
Rh
eo
me
ter
(lb
/sq.
ft.)
Ge
l str
en
gth
(lb
/sq.
ft.)
1
Mud b
ala
nce (
ppg)
2
83

Da
te:
PN
G 4
51 -
OIL
WE
LL D
RIL
LIN
G L
AB
OR
AT
OR
Y
DA
TA
SH
EE
T2
Experi
ment #1: P
ropert
ies o
f fr
esh w
ate
r m
uds
Gro
up N
o.:
Gro
up
1)
3)
Mem
bers
:
2)
4)
Spurt
V1
V2
V3
V4
V5
V6
V7
V7
.5V
10
V1
5V
20
V2
5V
30
(in
)M
ud
Filtr
ate
Ca
ke
1 2 1 2 1 2
Gro
up
No.
Mud
No.
Mud
resis
tivity
(ohm
-m)
3
Filte
r pre
ss loss (
ml)
Cake
thic
k.
pH
1 2
84

PN
G 4
51
- O
IL W
EL
L D
RIL
LIN
G L
AB
OR
AT
OR
Y
RE
SU
LT
SH
EE
T
Exp
erim
en
t #
1:
Pro
pe
rtie
s o
f fr
esh
wa
ter
mu
ds
Gro
up
No
.:
Gro
up
1)
3)
Me
mb
ers
:
2)
4)
10
rpm
50 r
pm
100 r
pm
200
rpm
300 r
pm
600
rpm
1 2 1 2 1 2
10 s
ec
10
min
Mud
Filtr
ate
Cake
1 2 1 2 1 2
1 2 32 3
Gro
up N
o.
Mud
No.
1
Mud
density
(ppg)
Pla
stic
vis
cosity
(cp)
Gro
up N
o.
Mud
No.
Appare
nt
Vis
cosity (
cp)
Gel str
ength
(lb/s
q.
ft.)
pH
30-m
in
fluid
loss
(ml)
Cake
thic
kness
(1/3
2's
in)
Yie
ld
poin
t
(lb/f
t2)
Mud r
esis
tivity
(ohm
-m)
85

Da
te:
PN
G 4
51 -
OIL
WE
LL D
RIL
LIN
G L
AB
OR
AT
OR
Y
DA
TA
SH
EE
T 1
Expe
rim
en
t #
2:
Eff
ects
of
so
diu
m s
alts o
n f
resh w
ate
r m
uds
Gro
up
No
.:
Gro
up
1)
3)
Me
mbe
rs:
2)
4)
C.F
.R
ea
din
g1
00
rpm
300
rpm
60
0 r
pm
10
sec
10
min
(in)
1 2 3 4 1 2 3 4 1 2 3 4
Ca
ke
thic
k.
2
Mu
d b
ala
nce
(p
pg
)G
roup
No
.
Mu
d
No.
3
Rheom
ete
r (lb/s
q. ft
.)
1
Gel str
en
gth
(lb/s
q.
ft.)
pH
86

Date
:
PN
G 4
51 -
OIL
WE
LL
DR
ILLIN
G L
AB
OR
AT
OR
Y
DA
TA
SH
EE
T 2
Experi
ment
#2:
Eff
ects
of
sodiu
m s
alts o
n f
resh w
ate
r m
uds
Gro
up N
o.:
Gro
up
1)
3)
Mem
bers
:
2)
4)
Sp
urt
V1
V2
V3
V4
V5
V6
V7
V7.5
V1
0V
15
V2
0V
25
V3
0M
ud
Filtr
ate
Ca
ke
1 2 3 4 1 2 3 4 1 2 3 4
Filte
r pre
ss loss (
ml)
Mud
re
sis
tivity
(ohm
-m)
2 3
Mud
No.
Gro
up
No.
1
87

PN
G 4
51
- O
IL W
EL
L D
RIL
LIN
G L
AB
OR
AT
OR
Y
RE
SU
LT
SH
EE
T
Exp
erim
en
t #
2:
Eff
ects
of
sod
ium
sa
lts o
n f
resh
wate
r m
ud
sG
rou
p N
o.:
Gro
up
1)
3)
Me
mb
ers
:
2)
4)
10 s
ec
10
min
Mud
Filtr
ate
1 2 3 4 1 2 3 4 1 2 3 4
pH
30-m
in
fluid
loss
(ml)
Cake
thic
kness
(1/3
2's
in)
Mud r
esis
tivity
(ohm
-m)
Gel str
ength
(lb/s
q.
ft.)
1 2 3
Yie
ld
poin
t
(lb/f
t2)
Gro
up N
o.
Mud
No.
Mud
density
(ppg)
Pla
stic
vis
cosity
(cp)
88

Da
te:
PN
G 4
51 -
OIL
WE
LL D
RIL
LIN
G L
AB
OR
AT
OR
Y
DA
TA
SH
EE
T 1
Experi
ment #3: V
iscosity r
educin
g a
gents
Gro
up
No
.:
Gro
up
1)
3)
Mem
bers
:
2)
4)
C.F
.R
ea
din
g3
00
rp
m6
00
rpm
10
se
c1
0 m
inS
purt
V1
V2
V3
V4
V5
V6
V7
V7
.5
1 2 1 2 1 2
pH
Filte
r pre
ss loss (
ml)
Gro
up
No.
Mud
No
.
1
Mud b
ala
nce (
ppg)
Rheom
ete
r (l
b/s
q.
ft.)
Gel str
ength
(lb
/sq.
ft.)
2 3
89

PN
G 4
51 -
OIL
WE
LL D
RIL
LIN
G L
AB
OR
AT
OR
Y
RE
SU
LT
SH
EE
T
Experi
ment #3: V
iscosity
reducin
g a
gents
Gro
up N
o.:
Gro
up
1)
3)
Mem
bers
:
2)
4)
10 s
ec
10 m
in
1 2 3 4 1 2 3 4 1 2 3 4
2 3
Gro
up N
o.
Mud
No.
Mud
density
(ppg)
Pla
stic
vis
cosity
(cp)
Yie
ld
poin
t
(lb/f
t2)
Gel str
ength
(lb/s
q.
ft.)
pH
30-m
in
fluid
loss
(ml)
Cake
thic
kness
(1/3
2's
in)
1
90

91
Date
:
PN
G 4
51
- O
IL W
EL
LD
RIL
LIN
G L
AB
OR
AT
OR
Y
DA
TA
SH
EE
T
Expe
rim
en
t #
5: R
egu
lar
ce
me
nts
, ce
men
t exte
nd
ers
and
ce
men
t w
eig
htin
g m
ate
rials
Gro
up
No
.:
Gro
up
1)
3)
Me
mb
ers
:
2)
4)
C.F
.R
ea
din
g300 r
pm
600 r
pm
10
se
c10
min
Spurt
V1
V2
V3
V4
V5
V6
V7
V7
.5V
10
1 2 3 1 2 3 1 2 3
d1(i
n)
d2(i
n)
lbs.
d1
(in
)d2
(in
)lb
s.
d1
(in)
d2
(in)
lbs.
1 2 3 1 2 3 1 2 3
2 3
Filte
r pre
ss lo
ss (
ml)
Sam
ple
No.1
Sa
mp
le N
o.2
Sam
ple
No.3
Ve
rsa
Teste
r
1
Gro
up
No
.
Cem
en
t
No.
3
Gro
up
No
.
Cem
en
t
No.
Ge
lstr
eng
th
(lb
/sq
. ft
.)
1
Mud b
ala
nce
(ppg
)
Rh
eom
ete
r
(lb
/sq
. ft
.)
2

PN
G 4
51 -
OIL
WE
LL D
RIL
LIN
G L
AB
OR
AT
OR
Y
RE
SU
LT
SH
EE
T
Experi
ment
#5: R
egula
r ce
ments
, ce
ment exte
nders
and c
em
ent w
eig
htinG
roup
No
.:
Gro
up
1)
3)
Mem
bers
:
2)
4)
10 s
ec
10 m
in
1 2 3 1 2 3 1 2 4
31 2
Gro
up N
o.
Cem
ent
No.
Mud
density
(ppg)
Pla
stic
vis
cosity
(cp)
Yie
ld
poin
t
(lb/f
t2)
Gel str
ength
(lb/s
q.
ft.)
Dehydra
tio
n T
ime
(min
)
30-m
in
fluid
loss
(ml)
Co
mpre
ssi
ve s
trength
(psi)
92

93
Date
:
PN
G 4
51
- O
IL W
EL
LD
RIL
LIN
G L
AB
OR
AT
OR
Y
DA
TA
SH
EE
T
Expe
rim
en
t #
6: C
em
ent
acce
lera
tors
and
reta
rde
rs
Gro
up
No
.:
Gro
up
1)
3)
Me
mb
ers
:
2)
4)
C.F
.R
ea
din
g300 r
pm
600 r
pm
10
se
c10
min
Spurt
V1
V2
V3
V4
V5
V6
V7
V7
.5V
10
1 2 3 1 2 3 1 2 3
d1(i
n)
d2(i
n)
lbs.
d1
(in
)d2
(in
)lb
s.
d1
(in)
d2
(in)
lbs.
1 2 3 1 2 3 1 2 3
1 2 3
Cem
en
t
No.
Ve
rsa
Teste
r
Sam
ple
No.1
Sam
ple
No.2
Sam
ple
No.3
1 2 3
Gro
up
No
.
Gro
up
No
.
Cem
en
t
No.
Mud b
ala
nce
(ppg
)
Rh
eom
ete
r
(lb
/sq
. ft
.)
Ge
lstr
eng
th
(lb
/sq
. ft
.)F
ilte
r pre
ss lo
ss (
ml)

PN
G 4
51 -
OIL
WE
LL D
RIL
LIN
G L
AB
OR
AT
OR
Y
RE
SU
LT
SH
EE
T
Experi
ment
#6: C
em
ent accele
rato
rs a
nd r
eta
rders
Gro
up N
o.:
Gro
up
1)
3)
Mem
bers
:
2)
4)
10 s
ec
10 m
in
1 2 3 1 2 3 1 2 4
2 3
De
hydra
tio
n T
ime
(min
)
30-m
in
fluid
loss
(ml)
Com
pre
ssi
ve s
trength
(psi)
1
Mud
den
sity
(ppg)
Pla
stic
vis
cosity
(cp)
Yie
ld
poin
t
(lb/f
t2)
Gel str
ength
(lb/s
q.
ft.)
Gro
up N
o.
Cem
ent
No.
94

95
Date
:
PN
G 4
51
- O
IL W
EL
LD
RIL
LIN
G L
AB
OR
AT
OR
Y
DA
TA
SH
EE
T
Expe
rim
en
t #
7:
Wate
r lo
ss
ad
ditiv
es a
nd
dis
pe
rsa
nts
Gro
up
No
.:
Gro
up
1)
3)
Me
mb
ers
:
2)
4)
C.F
.R
ea
din
g300 r
pm
600 r
pm
10
se
c10
min
Spurt
V1
V2
V3
V4
V5
V6
V7
V7
.5V
10
1 2 3 1 2 3 1 2 3
d1(i
n)
d2(i
n)
lbs.
d1
(in
)d2
(in
)lb
s.
d1
(in)
d2
(in)
lbs.
1 2 3 1 2 3 1 2 3
1 2 3
Gro
up
No
.
Cem
en
t
No.
Ve
rsa
Teste
r
Sam
ple
No.1
Sam
ple
No.2
Sam
ple
No.3
Filte
r pre
ss lo
ss (
ml)
1 2 3
Gro
up
No
.
Cem
en
t
No.
Mud b
ala
nce
(ppg
)
Rh
eom
ete
r
(lb
/sq
. ft
.)
Ge
lstr
eng
th
(lb
/sq
. ft
.)

PN
G 4
51 -
OIL
WE
LL D
RIL
LIN
G L
AB
OR
AT
OR
Y
RE
SU
LT
SH
EE
T
Experi
ment
#7: W
ate
r lo
ss a
dditiv
es a
nd d
ispers
ants
Gro
up N
o.:
Gro
up
1)
3)
Mem
bers
:
2)
4)
10 s
ec
10 m
in
1 2 3 1 2 3 1 2 4
1 2 3
Gel str
ength
(lb/s
q.
ft.)
De
hydra
tio
n T
ime
(min
)
30-m
in
fluid
loss
(ml)
Com
pre
ssi
ve s
trength
(psi)
Cem
ent
No.
Mud
density
(ppg)
Pla
stic
vis
cosity
(cp)
Yie
ld
poin
t
(lb/f
t2)
Gro
up N
o.
96