PNB MetLife Factsheet 31-May-2018
34
Monthly Fund Performance June 2018 Edition Ulip Fund THE LINKED INSURANCE PRODUCTS DO NOT OFFER ANY LIQUIDITY DURING THE FIRST FIVE YEARS OF THE CONTRACT.THE POLICYHOLDER WILL NOT BE ABLE TO SURRENDER/WITHDRAW THE MONIES INVESTED IN LINKED INSURANCE PRODUCTS COMPLETELY OR PARTIALLY TILL THE END OF THE FIFTH YEAR. IN THIS POLICY, THE INVESTMENT RISK IN INVESTMENT PORTFOLIO IS BORNE BY THE POLICYHOLDER
Transcript of PNB MetLife Factsheet 31-May-2018

Monthly Fund Performance June 2018 Edition
Ulip Fund
THE LINKED INSURANCE PRODUCTS DO NOT OFFER ANY LIQUIDITY DURING THE FIRST FIVE YEARS OF THE CONTRACT.THE POLICYHOLDER WILL NOT BE ABLE TO
SURRENDER/WITHDRAW THE MONIES INVESTED IN LINKED INSURANCE PRODUCTS COMPLETELY OR PARTIALLY TILL THE END OF THE FIFTH YEAR.
IN THIS POLICY, THE INVESTMENT RISK IN INVESTMENT PORTFOLIO IS BORNE BY THE POLICYHOLDER

Glossary
Sanjay Kumar
Chief Investment Officer
Month gone by – A snapshot
Global equity markets remained under pressure in June amid trade concerns, geo-political worries andrising crude oil prices. While developed market index remained broadly flat, emerging market (EM) indexfell sharply by 5%. Indian equity markets outperformed the broader EM pack with Nifty ending flat in Juneeven as mid-caps continue to decline. Domestic bond yields firmed further amid a unanimous 25bps ratehike, surging crude oil prices and depreciating INR.
World Bank expects global growth to peak in 2018
The World Bank expects global economic growth to remain robust at 3.1% in 2018 before slowing gradually over the next two years.This is largely on account of gradual removal of monetary stimulus by global central banks and escalating trade concerns. India’seconomic growth is expected to improve to 7.3% in FY19 and 7.5% in FY20 largely driven by robust private consumption. The keydownside risks to global growth include financial market volatility, policy uncertainty, rising trade protectionist sentiments and geo-political risks.
RBI hikes policy rate by 25bps
The RBI’s Monetary Policy Committee (MPC) unanimously decided to hike the policy rate by 25bps – the first hike since January 2014.This was largely led by recent surge in core inflation (inflation excluding food and fuel) with risks tilted to the upside, even aseconomic growth recovery remains on track. However, the MPC reiterated its “neutral” stance amid global and domestic uncertaintyand remains committed to achieving medium-term inflation target of 4% on a durable basis.
Monsoon expected to improve in July
According to India Meteorological Department (IMD), cumulative rainfall in the country in June was at 5% deficit. However, the IMDexpects monsoon to revive in July, retaining their estimate of “normal” rainfall at 97% of long-period average (LPA) for the 2018monsoon season (June-September).
Fixed income market performance
Fixed income market remains weak: Fixed income markets remained weak in June, largely led by 1) surge in crude oil pricesfollowing a lower-than-expected increase in oil output in the wake of Iran sanctions and disruptions in a few other oil producingcountries, 2) a unanimous 25bps rate hike by RBI, 3) weak INR (-7% YTD) and 4) worries around inflation and fiscal deficit. The foreigninstitutional investors (FIIs) have remained net sellers for five consecutive months, with net outflows at US$ 1.6bn in June. The 10-year g-sec yield ended 8bps higher at 7.9% and is up 80bps from April-low level.
Bond yields expected to remain firm: Increasing macro-economic headwinds have strengthened expectations of more rate hikeseven as RBI has maintained a “neutral” stance. This, along with demand-supply mismatch, is likely to keep bond yields firm in thenear-term. The key factors that are likely to impact fixed income markets include 1) decision on MSP (Minimum Support Price) hikes,3) movement in crude oil prices, 3) trend of GST collections, 4) inflation trajectory and 5) monetary policy actions by global centralbanks, particularly US Fed.
Equity market performance
Equity market continues to consolidate: Equity markets remained in the consolidation mode. The weakness was largely on accountof 1) rising macro-economic concerns amid surging crude oil prices, 2) hardening bond yields, and 3) global trade concerns. The FIIsremained net sellers for third consecutive month, while domestic flows remained fairly robust. While Nifty index ended broadly flat inJune (+2% YTD), Mid-cap index declined by 4% (-13% YTD).
Equity market to remain weak in near-term; medium-term outlook positive: Rising domestic macro-economic headwinds andpolitical uncertainty are likely to keep equity markets under pressure in the near-term. On the global front, evolving geo-politicalenvironment and monetary policy actions by global central banks remain crucial for equity markets. In the medium-term, improvingeconomic growth outlook and continued revival in corporate earnings bode well for equity markets.
Back
From the CIO’s desk

Economic indicators
Consumer Price Index (CPI) Inflation (%) 2.2 4.4 4.9 0.5 2.7
Gross Domestic product (GDP Growth) % 6.1 7.0 7.7 0.7 1.6
Index of Industrial Production (IIP) (%) 3.2 7.5 4.9 -2.6 1.7
Brent crude oil (USD/barrel) 48 70 79 13% 66%
Domestic Markets
Nifty Index 9,521 10,114 10,714 6% 13%
BSE Mid-cap Index 14,644 15,963 15,451 -3% 6%
10-year G-Sec Yield (%) 6.5 7.4 7.9 50 bps 140 bps
30-year G-Sec Yield (%) 7.1 7.6 8.1 50 bps 100 bps
10-year AAA PSU Corporate Bond Yield (%) 7.5 8.1 8.6 50 bps 110 bps
Exchange rate (USD/INR) * 64.6 65.2 68.5 -5% -6%
Global Markets
Dow Jones (U.S.) 21,350 24,103 24,271 1% 14%
FTSE (U.K.) 7,313 7,057 7,637 8% 4%
Shanghai Stock Exchange Composite Index (China) 3,192 3,169 2,847 -10% -11%
Nikkei 225 (Japan) 20,033 21,159 22,305 5% 11%
QoQ ChangeJune 2018Mar 2018June 2017Indicators YoY Change
Source: Central Statistics Organisation (CSO), RBI, Bloomberg. *Negative growth number signals depreciation while positive growth number signals appreciation.
Glossary
10-year government bond yield trend
Equity Market performance
Back
Economic and market snapshot
6.4
7.7
7.1
7.9
6.0
6.2
6.4
6.6
6.8
7.0
7.2
7.4
7.6
7.8
8.0
Jun-17 Aug-17 Oct-17 Dec-17 Feb-18 Apr-18 Jun-18
10-year benchmark yield(%)
Source: Bloomberg
10,714
15,451
6,000
7,600
9,200
10,800
12,400
14,000
15,600
17,200
18,800
20,400
Jun-17 Aug-17 Oct-17 Dec-17 Feb-18 Apr-18 Jun-18
NIFTY BSE Mid-cap Index
Source: Bloomberg


The time to consider Critical Illness Insurance is NowAs we celebrate world Cancer day in February, we would like to highlight insurance covers with options
for critical illness. The best way to illustrate this is through an ex; Mayank Desai, a marketing executive,
was diagnosed with cancer and had a long and painful recovery. While the insurance company took
care of the hospital bills, Desai’s family had to undergo financial stress to meet household expenses as
he stayed home and recuperated.
Desai’s case is by no means unique as an increasing number of people are falling prey to critical illness
at younger age. At the same time, the cost of health care is rising and crippling Indian households.
Keeping this scenario in mind, investing in a comprehensive health insurance plan to safeguard the
interest of the family, has become imperative.
One needs to understand the structure and the benefits of different health insurance products before
investing. Health insurance plans can be broadly classified in two categories, namely indemnity based
and benefits based. Under an indemnity based plan the insured is paid the entire amount that he
spends on medical treatment, provided it is equal to or less than the sum assured. Benefits based plans
are mainly critical illness plans under which the insured can claim the entire sum assured for the
treatment of a critical illness specified in the policy, irrespective of actual costs incurred.
Investing in mediclaim can prove extremely useful in case of minor ailments. However, they become
futile in case the insured contracts a critical illness such as cancer which demands much larger expenses
over a longer term. A critical illness plan can prove extremely beneficial in this case as the lump sum
received by the insured can be used to get the illness treated by best professionals. Also the sum
assured, if in excess of the medical treatment, can be used to take care of the household expenses
during the time of the illness.
Investors can also go for an endowment based life insurance policy from an insurer with a Critical Illness
(CI) rider as it will give them a comprehensive insurance cover. This is to say that the sum assured can
be claimed by the insured in case he survives through the term or by his family in case he does not. In
addition, with a CI rider to the policy, the medical expenses will also be covered in case a critical illness
is contracted during the term, over and above the sum assured.
In addition to providing a cover for medical expenses, health insurance products also attract tax
benefits. Investing in comprehensive health insurance therefore will not only provide investor the
peace of mind but also the freedom to plan their finances to meet more fundamental financial goals.

MARKET OVERVIEW OUR POPULAR PRODUCTS
MetInvestMonthly Fund Performance Newsletter
FUND CATEGORY
EQUITY BALANCED
Balancer II
DEBT
Protector IIFlexicap
Multiplier II
Multiplier III
Virtue II
Multiplier
Virtue
Accelerator
Balancer
Moderator
Preserver II
Liquid
Protector
Preserver
Discontinued Policy
CREST (THEMATIC FUND)
Mid Cap Fund
Premier Multi-Cap Fund
Balanced Opportunities Bond Opportunities Fund

Liquid
PreserverII
ProtectorII
BondOpport-unities
Balancer II
Balancedopp
MultiplierIII
Crest
MultiplierII
Virtue II
Midcap
Flexicap
Premiermulti
Risk - Return Matrix
Glossary Back
LOW MEDIUM HIGH
Ret
urn
Risk
Open Funds - Funds that are open for sales to new customers
Preserver
Protector
Moderator
Balancer
Accelerator
Multiplier
Virtue
LOW MEDIUM HIGH
Risk
Ret
urn
Closed Funds - Funds that are closed for sales to new customers
4 | Page

Flexi Cap (Open Fund)
Fund Details
AUM as on 30-06-2018
Portfolio Return Asset Classes F&U Actual
Equity 60-100%Cash & Money Market 0-40%
Portfolio ComponentsPortfolio return -0.9% -0.8% 10.2% 13.2% 8.8% 9.6%Benchmark* -1.0% -1.5% 11.1% 14.5% 9.6% 9.0% Security Net Assets
Note: Past returns are not indicative of future performance. TOP 10 EQUITY SECURITIESINFOSYS LTD. 6.8%H D F C BANK LTD. 6.4%
Asset Under Management (AUM) (Rs crores) RELIANCE INDUSTRIES LTD. 5.6%I T C LTD. 4.5%HOUSING DEVELOPMENT FINANCE CORPN. LTD. 3.8%LARSEN & TOUBRO LTD. 3.2%KOTAK BANKING ETF 2.8%KOTAK MAHINDRA BANK LTD. 2.7%MAHINDRA & MAHINDRA LTD. 2.7%SBI-ETF NIFTY BANK 2.6%Others 53.2%TOTAL 94.2%
CASH AND MONEY MARKET 5.8%PORTFOLIO TOTAL 100.0%
Sector Allocation (As per NIC Classification*)
NAV Movement
*NIC Classification – Industrial sectors as defined under National Industrial Classification 2008
NAV as on 30-06-2018
Rs. 21.9206
Last 3 Years
Since Inception
94.2%5.8%
Last 1 Month
Date of Inception: December 22,2009
NA
V (
In R
s.)
Last 6 Months
Last 1Year
Last 2Years
Since05-Jan-10
* Benchmark return has been computed by applying benchmark weightages on S&P BSE 200 for Equity
Fund Manager Funds managed by the Fund Manager
9.6%9.7%
As on June 30, 2018
SFIN No: ULIF01315/12/09FLEXICAPFN117
Amit Shah Equity - 6 | Debt - 0 | Balanced - 2
Rs. 649 crore
As on June 30, 2018
ReturnsAbsolute Return CAGR Return
UNIT-LINKED Fund
Investment Objective: To generate long-term capital appreciation from an actively
managed portfolio of diversified stocks across the market capitalization spectrum.
Investment Philosophy: The fund will target 100% investments in Equities to meet the
stated objectives.
Cash and Money Market
38(6%)
Equity611
(94%)
24%
12%
8%
7%6%
6%
5%
5%
5%
4%
18%
FINANCIAL AND INSURANCE ACTIVITIES
COMPUTER PROGRAMMING, CONSULTANCY ANDRELATED ACTIVITIES
MUTUAL FUND
MANUFACTURE OF MOTOR VEHICLES, TRAILERS ANDSEMI-TRAILERS
MANUFACTURE OF COKE AND REFINED PETROLEUMPRODUCTS
INFRASTRUCTURE SECTOR
MANUFACTURE OF CHEMICALS AND CHEMICALPRODUCTS
CIVIL ENGINEERING
MANUFACTURE OF TOBACCO PRODUCTS
MANUFACTURE OF PHARMACEUTICALS, MEDICINALCHEMICAL AND BOTANICAL PRODUCTS
Others
8
10
12
14
16
18
20
22
24
Dec-09 May-11 Oct-12 Mar-14 Aug-15 Jan-17 Jun-18
5 | Page

Multiplier II (Open Fund)
Fund Details
AUM as on 30-06-2018
Portfolio Return Asset Classes F&U Actual
Equities 60-100%Money Market Instruments 0-40%
Portfolio ComponentsPortfolio return 0.2% 1.7% 12.1% 11.9% 7.5% 8.3%Benchmark* -0.2% 1.7% 12.5% 13.7% 8.6% 8.7% Security Net Assets
Note: Past returns are not indicative of future performance. TOP 10 EQUITY SECURITIESH D F C BANK LTD. 8.6%INFOSYS LTD. 8.1%
Asset Under Management (AUM) (Rs crores) RELIANCE INDUSTRIES LTD. 6.9%I T C LTD. 5.5%HOUSING DEVELOPMENT FINANCE CORPN. LTD. 5.4%LARSEN & TOUBRO LTD. 3.9%MAHINDRA & MAHINDRA LTD. 3.7%KOTAK MAHINDRA BANK LTD. 3.6%SBI-ETF NIFTY BANK 3.3%KOTAK BANKING ETF 3.3%Others 43.3%TOTAL 95.7%
CASH AND MONEY MARKET 4.3%PORTFOLIO TOTAL 100.0%
Sector Allocation (As per NIC Classification*)
NAV Movement
*NIC Classification – Industrial sectors as defined under National Industrial Classification 2008
NAV as on 30-06-2018
Rs. 19.6063
Last 3 Years
Since Inception
95.7%4.3%
Last 1 Month
Date of Inception: December 21,2009
NA
V (
In R
s.)
Last 6 Months
Last 1Year
Last 2Years
Since05-Jan-10
* Benchmark return has been computed by applying benchmark weightages on Nifty 50 for Equity
Fund Manager Funds managed by the Fund Manager
8.2%9.4%
As on June 30, 2018
SFIN No: ULIF01115/12/09MULTIPLIE2117
Amit Shah Equity - 6 | Debt - 0 | Balanced - 2
Rs. 684 crore
As on June 30, 2018
ReturnsAbsolute Return CAGR Return
UNIT-LINKED Fund
Investment Objective: To generate long term capital appreciation by investing in
diversified equities.
Investment Philosophy: The fund will target 100% investments in Equities to meet the
stated objectives.
Cash and Money Market
30(4%)
Equity654
(96%)
24%
14%
10%9%
8%
6%
4%
4%
4%
4%
13%FINANCIAL AND INSURANCE ACTIVITIES
COMPUTER PROGRAMMING, CONSULTANCY AND RELATEDACTIVITIES
MUTUAL FUND
MANUFACTURE OF MOTOR VEHICLES, TRAILERS ANDSEMI-TRAILERS
MANUFACTURE OF COKE AND REFINED PETROLEUMPRODUCTS
MANUFACTURE OF TOBACCO PRODUCTS
MANUFACTURE OF CHEMICALS AND CHEMICAL PRODUCTS
INFRASTRUCTURE SECTOR
CIVIL ENGINEERING
MANUFACTURE OF PHARMACEUTICALS, MEDICINALCHEMICAL AND BOTANICAL PRODUCTS
Others
8
10
12
14
16
18
20
22
Dec-09 May-11 Oct-12 Mar-14 Aug-15 Jan-17 Jun-18
6 | Page

Multiplier III Fund (Open Fund)
Fund Details
AUM as on 30-06-2018
Portfolio Return Asset Classes F&U Actual
Equities 60-100%Money Market Instruments 0-40%
Portfolio ComponentsPortfolio return -0.2% 1.1% 12.2% - - 11.5%Benchmark* -0.2% 1.7% 12.5% - - 12.1% Security Net Assets
Note: Past returns are not indicative of future performance. TOP 10 EQUITY SECURITIESINFOSYS LTD. 7.9%H D F C BANK LTD. 7.0%
Asset Under Management (AUM) (Rs crores) RELIANCE INDUSTRIES LTD. 6.8%I T C LTD. 5.0%LARSEN & TOUBRO LTD. 4.5%HOUSING DEVELOPMENT FINANCE CORPN. LTD. 4.4%SBI-ETF NIFTY BANK 4.2%HINDUSTAN UNILEVER LTD. 3.7%MAHINDRA & MAHINDRA LTD. 3.7%KOTAK MAHINDRA BANK LTD. 3.5%Others 40.9%TOTAL 91.5%
CASH AND MONEY MARKET 8.5%PORTFOLIO TOTAL 100.0%
Sector Allocation (As per NIC Classification*)
NAV Movement
*NIC Classification – Industrial sectors as defined under National Industrial Classification 2008
* Benchmark return has been computed by applying benchmark weightages on Nifty 50
NAV as on 30-06-2018
Rs. 12.3288
Date of Inception: July 26,2016
NA
V (
In R
s.)
Last 6 Months
Last 1Year
Last 2Years
Last 3Years
Since Inception
Amit Shah Equity - 6 | Debt - 0 | Balanced - 2
Rs. 6.4 crore
As on June 30, 2018
ReturnsAbsolute Return CAGR Return
91.5%8.5%
Last 1 Month
Fund Manager Funds managed by the Fund Manager
As on June 30, 2018
SFIN No: ULIF01809/10/15MULTIPLIE3117
UNIT-LINKED Fund
Investment Objective: To generate long term capital appreciation by investing in
diversified equities (predominantly large caps).
Investment Philosophy: The fund will target 100% investments in Equities to meet
the stated objectives.
Cash and Money Market
0.5(8%)
Equity5.9
(92%)
24%
14%
10%7%
6%
6%
5%
5%
3%
3%
17%
FINANCIAL AND INSURANCE ACTIVITIES
COMPUTER PROGRAMMING, CONSULTANCY ANDRELATED ACTIVITIES
MUTUAL FUND
MANUFACTURE OF COKE AND REFINED PETROLEUMPRODUCTS
MANUFACTURE OF CHEMICALS AND CHEMICALPRODUCTS
MANUFACTURE OF MOTOR VEHICLES, TRAILERS ANDSEMI-TRAILERS
CIVIL ENGINEERING
MANUFACTURE OF TOBACCO PRODUCTS
MANUFACTURE OF PHARMACEUTICALS, MEDICINALCHEMICAL AND BOTANICAL PRODUCTS
INFRASTRUCTURE SECTOR
Others
8
9
10
11
12
13
14
Jul-16 Nov-16 Mar-17 Jul-17 Nov-17 Mar-18 Jun-18
7 | Page

CREST (THEMATIC FUND) (Open Fund)
Fund Details
AUM as on 30-06-2018
Portfolio Return Asset Classes F&U Actual
Equities 60%-100%Debt 0%Money Market 0%-40%
Portfolio return -0.5% - - - - 4.6% Portfolio ComponentsBenchmark* -1.2% - - - - 3.5%
Note: Past returns are not indicative of future performance. Security Net AssetsTOP 10 EQUITY SECURITIESINFOSYS LTD. 6.2%
Asset Under Management (AUM) (Rs crores) H D F C BANK LTD. 5.1%RELIANCE INDUSTRIES LTD. 4.6%HOUSING DEVELOPMENT FINANCE CORPN. LTD. 3.3%I T C LTD. 3.0%KOTAK MAHINDRA BANK LTD. 2.8%MAHINDRA & MAHINDRA LTD. 2.5%HINDUSTAN UNILEVER LTD. 2.4%LARSEN & TOUBRO LTD. 2.3%GODREJ CONSUMER PRODUCTS LTD. 2.2%Others 56.3%TOTAL 90.5%
CASH AND MONEY MARKET 9.5%PORTFOLIO TOTAL 100.0%
Sector Allocation (As per NIC Classification*)
NAV Movement
*NIC Classification – Industrial sectors as defined under National Industrial Classification 2008
* Benchmark return has been computed by applying benchmark weightages on Nifty 50 (2/3rd) and Nifty Next 50 (1/3rd) for Equity
NAV as on 30-06-2018
Rs. 10.4595
9.5%
Date of Inception: March 21,2018
NA
V (
In R
s.)
Last 6 Months
Last 1Year
Last 2Years
Last 3Years
Since Inception
Amit Shah Equity - 6 | Debt - 0 | Balanced - 2
Rs. 3.6 crore
As on June 30, 2018
ReturnsAbsolute Return CAGR Return
90.5%0.0%
Last 1 Month
Fund Manager Funds managed by the Fund Manager
As on June 30, 2018
SFIN No: ULIF02201/01/18CRESTTHEMF117
UNIT-LINKED Fund
Investment Objective: To generate wealth by investing in companies which will benefit
from the present evolving economic environment such as rising consumerism (C),
strengthening government reforms (RE), increasing contribution of services (S) in the
economy and new technologies (T).Investment Philosophy: The fund will target 100% investments in Equities to meet the
stated objectives
Cash and Money Market
0.4(9%)
Equity3.2
(91%)
23%
12%
10%
7%5%4%
4%
3%
3%
3%
26%
FINANCIAL AND INSURANCE ACTIVITIES
COMPUTER PROGRAMMING, CONSULTANCY ANDRELATED ACTIVITIES
MANUFACTURE OF CHEMICALS AND CHEMICALPRODUCTS
MANUFACTURE OF MOTOR VEHICLES, TRAILERS ANDSEMI-TRAILERS
MANUFACTURE OF COKE AND REFINED PETROLEUMPRODUCTS
MUTUAL FUND
MANUFACTURE OF ELECTRICAL EQUIPMENT
MANUFACTURE OF TOBACCO PRODUCTS
MANUFACTURE OF PHARMACEUTICALS, MEDICINALCHEMICAL AND BOTANICAL PRODUCTS
INFRASTRUCTURE SECTOR
Others
9.8
10
10.2
10.4
10.6
10.8
Mar-18 Apr-18 Apr-18 May-18 May-18 Jun-18 Jun-18
8 | Page

Premier Multi-Cap Fund (Open Fund)
Fund Details
AUM as on 30-06-2018
Portfolio Return Asset Classes F&U Actual
Equities 60%-100%Debt 0%Money Market 0%-40%
Portfolio return -0.1% - - - - 5.5% Portfolio ComponentsBenchmark* -1.6% - - - - 2.4%
Note: Past returns are not indicative of future performance. Security Net AssetsTOP 10 EQUITY SECURITIESRELIANCE INDUSTRIES LTD. 6.1%
Asset Under Management (AUM) (Rs crores) INFOSYS LTD. 5.0%HOUSING DEVELOPMENT FINANCE CORPN. LTD. 5.0%I T C LTD. 4.2%H D F C BANK LTD. 4.0%LARSEN & TOUBRO LTD. 3.0%TATA CONSULTANCY SERVICES LTD. 2.8%KOTAK MAHINDRA BANK LTD. 2.6%MARUTI SUZUKI INDIA LTD. 2.5%HINDUSTAN UNILEVER LTD. 2.4%Others 47.6%TOTAL 85.2%
CASH AND MONEY MARKET 14.8%PORTFOLIO TOTAL 100.0%
Sector Allocation (As per NIC Classification*)
NAV Movement
*NIC Classification – Industrial sectors as defined under National Industrial Classification 2008
* Benchmark return has been computed by applying benchmark weightages on Nifty 500
NAV as on 30-06-2018
Rs. 10.5547
14.8%
Date of Inception: March 21,2018
NA
V (
In R
s.)
Last 6 Months
Last 1Year
Last 2Years
Last 3Years
Since Inception
Deb Bhattacharya Equity - 3 | Debt - 2 | Balanced - 6
Rs. 1.7 crore
As on June 30, 2018
ReturnsAbsolute Return CAGR Return
85.2%0.0%
Last 1 Month
Fund Manager Funds managed by the Fund Manager
As on June 30, 2018
SFIN No: ULIF02101/01/18MULTICAPFN117
UNIT-LINKED Fund
Investment Objective: To generate wealth by investing in companies across market
capitalisation spectrum with a blend of large-cap and mid-cap companies.
Investment Philosophy: The fund will target 100% investments in Equities to meet
the stated objectives
Cash and Money Market
0.2(15%)
Equity1.5
(85%)
22%
10%
7%
7%6%5%
4%
4%
4%
3%
28%
FINANCIAL AND INSURANCE ACTIVITIES
COMPUTER PROGRAMMING, CONSULTANCY ANDRELATED ACTIVITIES
MANUFACTURE OF MOTOR VEHICLES, TRAILERS ANDSEMI-TRAILERS
MANUFACTURE OF COKE AND REFINED PETROLEUMPRODUCTS
MUTUAL FUND
INFRASTRUCTURE SECTOR
MANUFACTURE OF PHARMACEUTICALS, MEDICINALCHEMICAL AND BOTANICAL PRODUCTS
MANUFACTURE OF TOBACCO PRODUCTS
MANUFACTURE OF CHEMICALS AND CHEMICALPRODUCTS
CIVIL ENGINEERING
Others
9
9.5
10
10.5
11
11.5
12
Mar-18 Apr-18 Apr-18 May-18 May-18 Jun-18 Jun-18
9 | Page

Virtue II (Open Fund)
Fund Details
AUM as on 30-06-2018
Portfolio Return Asset Classes F&U Actual
Equities 60-100%Money Market Instruments 0-40%
Portfolio ComponentsPortfolio return -0.4% -3.0% 14.3% 15.6% 9.9% 10.4%
Security Net AssetsNote: Past returns are not indicative of future performance. TOP 10 EQUITY SECURITIES
INFOSYS LTD. 7.1%RELIANCE INDUSTRIES LTD. 5.1%
Asset Under Management (AUM) (Rs crores) HINDUSTAN UNILEVER LTD. 3.1%EXIDE INDUSTRIES LTD. 2.8%MARUTI SUZUKI INDIA LTD. 2.8%BRITANNIA INDUSTRIES LTD. 2.6%LARSEN & TOUBRO LTD. 2.2%DABUR INDIA LTD. 2.2%TECH MAHINDRA LTD. 1.9%M R F LTD. 1.7%Others 52.3%TOTAL 83.9%
CASH AND MONEY MARKET 16.1%PORTFOLIO TOTAL 100.0%
Sector Allocation (As per NIC Classification*)
NAV Movement
*NIC Classification – Industrial sectors as defined under National Industrial Classification 2008
NAV as on 30-06-2018
Rs. 23.1124
Date of Inception: January 12,2010
NA
V (
In R
s.)
Last 6 Months
Last 1Year
Last 2Years
Last 3Years
Since Inception
Amit Shah Equity - 6 | Debt - 0 | Balanced - 2
Rs. 122 crore
As on June 30, 2018
ReturnsAbsolute Return CAGR Return
83.9%16.1%
Last 1 Month
Fund Manager Funds managed by the Fund Manager
As on June 30, 2018
SFIN No: ULIF01215/12/09VIRTUE2FND117
UNIT-LINKED Fund
Investment Objective: To generate long term capital appreciation by investing in
diversified equities of companies promoting healthy life style and enhancing quality
of life.Investment Philosophy: The fund will target 100% investments in Equities to meet
the stated objectives.
Cash and Money Market
20(16%)
Equity102
(84%)
13%
12%
8%
6%
6%6%5%
5%
4%
3%
32%
COMPUTER PROGRAMMING, CONSULTANCY ANDRELATED ACTIVITIES
MANUFACTURE OF CHEMICALS AND CHEMICALPRODUCTS
INFRASTRUCTURE SECTOR
MANUFACTURE OF MOTOR VEHICLES, TRAILERS ANDSEMI-TRAILERS
MANUFACTURE OF ELECTRICAL EQUIPMENT
MANUFACTURE OF FOOD PRODUCTS
MANUFACTURE OF COKE AND REFINED PETROLEUMPRODUCTS
MANUFACTURE OF PHARMACEUTICALS, MEDICINALCHEMICAL AND BOTANICAL PRODUCTS
CIVIL ENGINEERING
MANUFACTURE OF BASIC METALS
Others
8
10
12
14
16
18
20
22
24
26
Jan-10 Jun-11 Nov-12 Apr-14 Aug-15 Jan-17 Jun-18
10 | Page
Mid Cap Fund (Open Fund)
Fund Details
AUM as on 30-06-2018
Portfolio Return Asset Classes F&U Actual
Equities 60%-100%Debt 0%Money Market 0%-40%
Portfolio return -2.7% - - - - -0.7% Portfolio ComponentsBenchmark* -3.5% - - - - -3.6%
Note: Past returns are not indicative of future performance. Security Net AssetsTOP 10 EQUITY SECURITIESEXIDE INDUSTRIES LTD. 3.3%
Asset Under Management (AUM) (Rs crores) M R F LTD. 3.2%PETRONET L N G LTD. 2.9%MAHINDRA & MAHINDRA FINANCIAL SERVICES LTD. 2.6%SHRIRAM TRANSPORT FINANCE CO. LTD. 2.6%PIRAMAL ENTERPRISES LTD. 2.0%DABUR INDIA LTD. 2.0%BHARAT FORGE LTD. 2.0%HAVELLS INDIA LTD. 2.0%DIVIS LABORATORIES LTD. 1.8%Others 59.0%TOTAL 83.4%
CASH AND MONEY MARKET 16.6%PORTFOLIO TOTAL 100.0%
Sector Allocation (As per NIC Classification*)
NAV Movement
*NIC Classification – Industrial sectors as defined under National Industrial Classification 2008
* Benchmark return has been computed by applying benchmark weightages on S&P BSE Midcap Index
NAV as on 30-06-2018
Rs. 9.9274
16.6%
Date of Inception: March 21,2018
NA
V (
In R
s.)
Last 6 Months
Last 1Year
Last 2Years
Last 3Years
Since Inception
Amit Shah Equity - 6 | Debt - 0 | Balanced - 2
Rs. 1.4 crore
As on June 30, 2018
ReturnsAbsolute Return CAGR Return
83.4%0.0%
Last 1 Month
Fund Manager Funds managed by the Fund Manager
As on June 30, 2018
SFIN No: ULIF02501/01/18MIDCAPFUND117
UNIT-LINKED Fund
Investment Objective: To provide long term capital appreciation from an actively
managed portfolio of diversified stocks from the midcap segment of the market
Investment Philosophy: The fund will target 100% investments in Equities to meet
the stated objectives
Cash and Money Market
0.2(17%)
Equity1.2
(83%)
18%
9%
8%
7%
6%5%4%
3%3%
2%
35%
FINANCIAL AND INSURANCE ACTIVITIES
MANUFACTURE OF PHARMACEUTICALS, MEDICINALCHEMICAL AND BOTANICAL PRODUCTS
MANUFACTURE OF ELECTRICAL EQUIPMENT
MANUFACTURE OF CHEMICALS AND CHEMICALPRODUCTS
COMPUTER PROGRAMMING, CONSULTANCY ANDRELATED ACTIVITIES
INFRASTRUCTURE SECTOR
MANUFACTURE OF RUBBER AND PLASTICS PRODUCTS
MANUFACTURE OF FABRICATED METAL PRODUCTS,EXCEPT MACHINERY AND EQUIPMENT
MANUFACTURE OF MOTOR VEHICLES, TRAILERS ANDSEMI-TRAILERS
MANUFACTURE OF BASIC METALS
Others
9
9.5
10
10.5
11
11.5
12
Mar-18 Apr-18 Apr-18 May-18 May-18 Jun-18 Jun-18
11 | Page

Balancer II (Open Fund)
Fund Details
AUM as on 30-06-2018 NAV as on 30-06-2018
Rs. 19.498Portfolio Return
Asset Classes F&U Actual
Government & Other Debt Securities 0-60%Equity 0-60%Cash & Money Market 0-40%
Portfolio return 0.1% 0.4% 6.4% 9.7% 8.1% 8.2%Benchmark* 0.0% 1.0% 6.9% 10.1% 8.1% 8.2% Portfolio Components
Note: Past returns are not indicative of future performance.
Security Rating Net AssetsGOVERNMENT SECURITIES
Asset Under Management (AUM) (Rs crores) 9.2% GOI 2030 Sovereign 3.0%6.68% GOI 2031 Sovereign 1.8%8.38% SDL 2026 Sovereign 1.4%8.27% SDL 2026 Sovereign 1.4%8.25% SDL 2025 Sovereign 1.4%7.17% GOI 2028 Sovereign 1.3%7.16% GOI 2023 Sovereign 1.2%8.25% SDL 2026 Sovereign 0.5%8.4% GOI 2025 Sovereign 0.0%TOTAL 11.9%
TOP 10 CORPORATE BONDSINDIABULLS HOUSING FINANCE LTD AAA 5.6%RURAL ELECTRIFICATION CORPN. LTD. AAA 5.5%
Sector Allocation (As per NIC Classification*) POWER GRID CORPN. OF INDIA LTD. AAA 4.9%SHRIRAM TRANSPORT FINANCE CO. LTD. AA+ 4.0%L I C HOUSING FINANCE LTD. AAA 4.0%DEWAN HOUSING FINANCE CORPN. LTD. AAA 2.7%INDIAN RAILWAY FINANCE CORPN. LTD. AAA 2.5%RELIANCE GAS TRANSPORTATION INFRASTRUCTURE AAA 1.7%SUNDARAM FINANCE LTD AAA 1.3%POWER FINANCE CORPN. LTD. AAA 1.3%Others 1.0%TOTAL 34.5%
TOP 10 EQUITY SECURITIESH D F C BANK LTD. 5.2%INFOSYS LTD. 3.9%RELIANCE INDUSTRIES LTD. 3.2%I T C LTD. 2.6%HOUSING DEVELOPMENT FINANCE CORPN. LTD. 2.4%KOTAK MAHINDRA BANK LTD. 2.3%MAHINDRA & MAHINDRA LTD. 1.9%
*NIC Classification – Industrial sectors as defined under National Industrial Classification 2008 LARSEN & TOUBRO LTD. 1.8%Credit Rating Profile HINDUSTAN UNILEVER LTD. 1.6%
TATA CONSULTANCY SERVICES LTD. 1.2%Others 20.2%TOTAL 46.5%
CASH AND MONEY MARKET 7.1%PORTFOLIO TOTAL 100.0%
Maturity by Profile NAV Movement
Date of Inception: December 20,2009
NA
V (
In R
s.)
* Benchmark return has been computed by applying benchmark weightages on CRISIL Composite Bond Fund Index for Debt and Nifty 50 for Equity
Amit Shah Equity - 6 | Debt - 0 | Balanced - 2
Modified Duration(Debt and Money Market)
4.3
7.1%Last 3 Years
Since Inception
Last 6 Months
Last 1Year
Last 2Years
Since05-Jan-10
Deb Bhattacharya Equity - 3 | Debt - 2 | Balanced - 6
Fund Manager Funds managed by the Fund Manager
Rs. 366 croreAs on June 30, 2018
ReturnsAbsolute Return CAGR Return
As on June 30, 2018
SFIN No: ULIF01015/12/09BALANCER2F117
8.1%8.6%
46.4%46.5%Last 1
Month
UNIT-LINKED Fund
Investment Objective: To generate capital appreciation and current income, through
a judicious mix of investments in equities and fixed income securities.
Investment Philosophy: The fund will target 50% investments in Equities and 50%
investments in Government & other debt securities to meet the stated objectives.
Cash and Money Market
26(7%)
Debt170
(46%)
Equity170
(47%)
23%
18%
12%
12%
7%
4%
3%
3%
3%
2%
13%FINANCIAL AND INSURANCE ACTIVITIES
INFRASTRUCTURE SECTOR
HOUSING SECTOR
GOVERNMENT OF INDIA
COMPUTER PROGRAMMING, CONSULTANCYAND RELATED ACTIVITIES
MANUFACTURE OF MOTOR VEHICLES,TRAILERS AND SEMI-TRAILERS
MANUFACTURE OF CHEMICALS AND CHEMICALPRODUCTS
MANUFACTURE OF COKE AND REFINEDPETROLEUM PRODUCTS
MANUFACTURE OF TOBACCO PRODUCTS
CIVIL ENGINEERING
Others
AAA66%
Government Securities
26%
AA+8%
< 1 Year12%
1 to 3 years5%
3 to 7 Years30%
> 7 Years53%
9
11
13
15
17
19
21
Dec-09 May-11 Oct-12 Mar-14 Aug-15 Jan-17 Jun-18
12 | Page

Balanced Opportunities Fund (Open Fund)
Fund Details
AUM as on 30-06-2018 NAV as on 30-06-2018
Rs. 10.3464Portfolio Return
Asset Classes F&U Actual
Equities 40%-75%Debt 25%-60%Money Market 0%-35%
Portfolio return -0.3% - - - - 3.5%Benchmark* -0.9% - - - - 1.5% Portfolio Components
Note: Past returns are not indicative of future performance.
Security Rating Net AssetsGOVERNMENT SECURITIES
Asset Under Management (AUM) (Rs crores) 7.16% GOI 2023 Sovereign 31.9%7.88% GOI 2030 Sovereign 11.3%TOTAL 43.2%
TOP 10 EQUITY SECURITIESH D F C BANK LTD. 4.8%INFOSYS LTD. 3.6%KOTAK MAHINDRA BANK LTD. 2.5%RELIANCE INDUSTRIES LTD. 2.5%HOUSING DEVELOPMENT FINANCE CORPN. LTD. 2.2%LARSEN & TOUBRO LTD. 2.0%I T C LTD. 1.9%HINDUSTAN UNILEVER LTD. 1.8%MAHINDRA & MAHINDRA LTD. 1.6%
Sector Allocation (As per NIC Classification*) TATA CONSULTANCY SERVICES LTD. 1.5%Others 29.8%TOTAL 54.4%
CASH AND MONEY MARKET 2.4%PORTFOLIO TOTAL 100.0%
*NIC Classification – Industrial sectors as defined under National Industrial Classification 2008
Credit Rating Profile
Maturity by Profile NAV Movement
Date of Inception: March 21,2018
NA
V (
In R
s.)
* Benchmark return has been computed by applying benchmark weightages on CRISIL Composite Bond Fund Index for Debt and Nifty 500 for Equity
Amit Shah Equity - 6 | Debt - 0 | Balanced - 2
Modified Duration(Debt and Money Market)
4.6
2.4%Last 6 Months
Last 1Year
Last 2Years
Last 3Years
Since Inception
Deb Bhattacharya Equity - 3 | Debt - 2 | Balanced - 6
54.4%43.2%Last 1
Month
As on June 30, 2018
SFIN No: ULIF02301/01/18BALANCEOPP117
Fund Manager Funds managed by the Fund Manager
Rs. 0.7 croreAs on June 30, 2018
ReturnsAbsolute Return CAGR Return
UNIT-LINKED Fund
Investment Objective: To generate capital appreciation and current income
through a judicious mix of investments in equities and fixed income securities.
Investment Philosophy: The fund will target 60% investments in Equities and 40%
investments in Debt securities to meet the stated objectives
Cash and Money Market0.02(2%)
Debt0.30
(43%)Equity0.38
(54%)
43%
18%
8%
4%
4%
3%
3%
2%
2%2%
11%GOVERNMENT OF INDIA
FINANCIAL AND INSURANCE ACTIVITIES
COMPUTER PROGRAMMING, CONSULTANCY ANDRELATED ACTIVITIES
MANUFACTURE OF CHEMICALS AND CHEMICALPRODUCTS
MANUFACTURE OF MOTOR VEHICLES, TRAILERS ANDSEMI-TRAILERS
MANUFACTURE OF COKE AND REFINED PETROLEUMPRODUCTS
CIVIL ENGINEERING
INFRASTRUCTURE SECTOR
MANUFACTURE OF PHARMACEUTICALS, MEDICINALCHEMICAL AND BOTANICAL PRODUCTS
MANUFACTURE OF TOBACCO PRODUCTS
Others
Government Securities
100%
< 1 Year4%
3 to 7 Years71%
> 7 Years25%
9.8
10
10.2
10.4
10.6
10.8
11
Mar-18 Apr-18 Apr-18 May-18 May-18 Jun-18 Jun-18
13 | Page

Protector II (Open Fund)
Fund Details
AUM as on 30-06-2018 NAV as on 30-06-2018
Rs. 18.826
Portfolio Return Asset Classes F&U Actual
Government & Other Debt Securities 60-100%Cash & Money Market 0-40%
Portfolio ComponentsPortfolio return 0.2% -0.4% 0.0% 5.2% 6.5% 7.8%Benchmark* 0.3% 0.2% 1.3% 6.3% 7.6% 7.7% Security Rating Net Assets
Note: Past returns are not indicative of future performance. TOP 10 GOVERNMENT SECURITIES6.68% GOI 2031 Sovereign 10.1%7.17% GOI 2028 Sovereign 4.7%
Asset Under Management (AUM) (Rs crores) 6.79% GOI 2027 Sovereign 2.7%7.61% GOI 2030 Sovereign 1.4%8.38% SDL 2026 Sovereign 1.0%8.22% SDL 2026 Sovereign 0.5%8.17% SDL 2025 Sovereign 0.4%7.98% SDL 2025 Sovereign 0.4%8.4% GOI 2024 Sovereign 0.4%7.59% GOI 2026 Sovereign 0.3%Others 2.3%TOTAL 24.3%
TOP 10 CORPORATE BONDSRELIANCE PORTS & TERMINALS LTD. AAA 9.5%POWER FINANCE CORPN. LTD. AAA 6.7%
Sector Allocation (As per NIC Classification*) DEWAN HOUSING FINANCE CORPN. LTD. AAA 6.4%INDIABULLS HOUSING FINANCE LTD AAA 5.4%RURAL ELECTRIFICATION CORPN. LTD. AAA 4.5%POWER GRID CORPN. OF INDIA LTD. AAA 3.7%IDFC BANK LIMITED AAA 3.4%TATA SONS LTD. AAA 3.4%H D F C BANK LTD. AAA 3.3%BAJAJ FINANCE LTD. AAA 3.0%Others 19.2%TOTAL 68.5%
CASH AND MONEY MARKET 7.2%PORTFOLIO TOTAL 100.0%
*NIC Classification – Industrial sectors as defined under National Industrial Classification 2008
Credit Rating Profile
Maturity by Profile NAV Movement
* Benchmark return has been computed by applying benchmark weightages on CRISIL Composite Bond Fund Index for Debt
Modified Duration(Debt and Money Market)
4.6
Date of Inception: January 11,2010
NA
V (
In R
s.)
Last 6 Months
Last 1Year
Last 2Years
Last 3Years
Since Inception
Deb Bhattacharya Equity - 3 | Debt - 2 | Balanced - 6
Rs. 1008 crore
As on June 30, 2018
ReturnsAbsolute Return CAGR Return
92.8%7.2%
Last 1 Month
Fund Manager Funds managed by the Fund Manager
As on June 30, 2018
SFIN No: ULIF00915/12/09PROTECTOR2117
UNIT-LINKED Fund
Investment Objective: To earn regular income by investing in high quality fixed
income securities
Investment Philosophy: The fund will target 100% investments in Government &
other debt securities to meet the stated objectives
Cash and Money Market
73(7%)
Debt935
(93%)
29%
24%
22%
14%
4%
7%
INFRASTRUCTURE SECTOR
GOVERNMENT OF INDIA
FINANCIAL AND INSURANCEACTIVITIES
HOUSING SECTOR
MANUFACTURE OF BASIC METALS
Others
AAA/A1+64%
Government Securities
26%
AA+/AA10%
< 1 Year8% 1 to 3 years
7%
3 to 7 Years31%
> 7 Years54%
5
10
15
20
25
Jan-10 Jun-11 Nov-12 Apr-14 Sep-15 Jan-17 Jun-18
14 | Page

Bond Opportunities Fund (Open Fund)
Fund Details
AUM as on 30-06-2018 NAV as on 30-06-2018
Rs. 9.9209
Portfolio Return Asset Classes F&U Actual
Equities 0%Debt 80%-100%Money Market 0%-20%
Portfolio return 0.2% - - - - -0.8% Portfolio ComponentsBenchmark* 0.3% - - - - 0.2%
Note: Past returns are not indicative of future performance. Security Rating Net AssetsGOVERNMENT SECURITIES7.16% GOI 2023 Sovereign 52.7%
Asset Under Management (AUM) (Rs crores) 7.17% GOI 2028 Sovereign 28.5%TOTAL 81.3%
CASH AND MONEY MARKET 18.7%PORTFOLIO TOTAL 100.0%
Sector Allocation (As per NIC Classification*)
*NIC Classification – Industrial sectors as defined under National Industrial Classification 2008
Credit Rating Profile
Maturity by Profile NAV Movement
* Benchmark return has been computed by applying benchmark weightages on CRISIL Composite Bond Fund Index
Modified Duration(Debt and Money Market)
4.0
18.7%
Date of Inception: March 21,2018
NA
V (
In R
s.)
Last 6 Months
Last 1Year
Last 2Years
Last 3Years
Since Inception
Deb Bhattacharya Equity - 3 | Debt - 2 | Balanced - 6
Rs. 0.47 crore
As on June 30, 2018
ReturnsAbsolute Return CAGR Return
0.0%81.3%
Last 1 Month
Fund Manager Funds managed by the Fund Manager
As on June 30, 2018
SFIN No: ULIF02401/01/18BONDOPPORT117
UNIT-LINKED Fund
Investment Objective: To provide higher accrual along with safety arising from high
allocation to corporate bonds. The fund will invest up to 100% of the corpus in debt
and money market securitiesInvestment Philosophy: The fund will target 100% investments in Debt securities to
meet the stated objectives
Cash and Money Market0.09
(19%)
Debt0.38
(81%)
81%
19%
GOVERNMENT OF INDIA
Others
Government Securities
100%
< 1 Year18%
3 to 7 Years53%
> 7 Years29%
99.2
9.49.69.810
10.2
10.410.610.8
11
Mar-18 Apr-18 Apr-18 May-18 May-18 Jun-18 Jun-18
15 | Page

Preserver II (Open Fund)
Fund Details
AUM as on 30-06-2018 NAV as on 30-06-2018
Rs. 17.9293
Portfolio Return Asset Classes F&U Actual
Govt & Govt Guaranteed Secs 60-100%Money Market Investments 0-40%
Portfolio ComponentsPortfolio return 0.2% -0.1% -0.5% 5.0% 6.2% 7.1%Benchmark* 0.3% 0.9% 2.3% 6.2% 7.8% 8.2% Security Rating Net Assets
Note: Past returns are not indicative of future performance. GOVERNMENT SECURITIES6.84% GOI 2022 Sovereign 22.6%7.35% GOI 2024 Sovereign 21.2%
Asset Under Management (AUM) (Rs crores) 7.16% GOI 2023 Sovereign 15.2%8.39% SDL 2024 Sovereign 11.8%7.68% GOI 2023 Sovereign 11.6%8.4% GOI 2024 Sovereign 6.4%8.27% GOI 2020 Sovereign 4.8%8.13% GOI 2021 Sovereign 0.1%TOTAL 93.6%
CASH AND MONEY MARKET 6.4%PORTFOLIO TOTAL 100.0%
Sector Allocation (As per NIC Classification*)
*NIC Classification – Industrial sectors as defined under National Industrial Classification 2008
Credit Rating Profile
Maturity by Profile NAV Movement
* Benchmark return has been computed by applying benchmark weightages on ISEC Mibex for Government & Govt. Guaranteed Securities
Modified Duration(Debt and Money Market)
3.9
Date of Inception: January 11,2010
NA
V (
In R
s.)
Last 6 Months
Last 1Year
Last 2Years
Last 3Years
Since Inception
Himanshu Shethia Equity - 0 | Debt - 6 | Balanced - 4
Rs. 64 crore
As on June 30, 2018
ReturnsAbsolute Return CAGR Return
93.6%6.4%
Last 1 Month
Fund Manager Funds managed by the Fund Manager
As on June 30, 2018
SFIN No: ULIF00815/12/09PRESERVER2117
UNIT-LINKED Fund
Investment Objective: To generate income at a level consistent with preservation
of capital, through investments in securities issued or guaranteed by central and
state Governments.Investment Philosophy: The fund will target 100% investments in Government &
Govt. Guaranteed Securities to meet the stated objectives
Cash and Money Market
4(6%)
Debt60
(94%)
94%
6%
GOVERNMENT OF INDIA
Others
Government Securities
100%
< 1 Year6% 1 to 3 years
5%
3 to 7 Years89%
910
11
12
13
14
15
16
17
18
19
Jan-10 Jun-11 Nov-12 Apr-14 Sep-15 Jan-17 Jun-18
16 | Page

Liquid Fund (Open Fund)
Fund Details
AUM as on 30-06-2018 NAV as on 30-06-2018
Rs. 10.9571
Portfolio Return Asset Classes F&U Actual
Money Market Instruments 0-100%
Portfolio ComponentsPortfolio return 0.4% 2.4% 4.8% - - 4.9%Benchmark* 0.5% 2.9% 5.9% - - 6.0% Security Net Assets
Note: Past returns are not indicative of future performance. CASH AND MONEY MARKET 100.0%PORTFOLIO TOTAL 100.0%
Asset Under Management (AUM) (Rs crores)
Sector Allocation (As per NIC Classification*)
*NIC Classification – Industrial sectors as defined under National Industrial Classification 2008
Credit Rating Profile
Maturity by Profile NAV Movement
* Benchmark return has been computed by applying benchmark weightages on CRISIL CBLO index
Modified Duration(Debt and Money Market)
0.2
Date of Inception: July 26,2016
NA
V (
In R
s.)
Last 6 Months
Last 1Year
Last 2Years
Last 3Years
Since Inception
Himanshu Shethia Equity - 0 | Debt - 6 | Balanced - 4
Rs. 0.45 crore
As on June 30, 2018
ReturnsAbsolute Return CAGR Return
100.0%
Last 1 Month
Fund Manager Funds managed by the Fund Manager
As on June 30, 2018
SFIN No: ULIF01909/10/15LIQUIDFUND117
UNIT-LINKED Fund
Investment Objective: To generate stable returns by investing in very short term
debt and money market instruments.
Investment Philosophy: The fund will target 100% investments in Government &
other debt securities to meet the stated objectives.
Cash and Money Market0.45
(100%)
65%
35%
GOVERNMENT OF INDIA
Others
Government Securities
100%
< 1 Year100%
9.5
10
10.5
11
11.5
12
Jul-16 Nov-16 Mar-17 Jul-17 Nov-17 Mar-18 Jun-18
17 | Page

Multiplier (Closed Fund)
Fund Details
AUM as on 30-06-2018
Portfolio Return Asset Classes F&U Actual
Listed Equities 80-100%Money Market Investments 0-40%
Portfolio ComponentsPortfolio return 0.3% 1.7% 11.8% 11.4% 7.0% 11.6%Benchmark* -0.2% 1.7% 12.5% 13.7% 8.6% 13.0% Security Net Assets
Note: Past returns are not indicative of future performance. TOP 10 EQUITY SECURITIESRELIANCE INDUSTRIES LTD. 9.1%H D F C BANK LTD. 8.6%
Asset Under Management (AUM) (Rs crores) INFOSYS LTD. 7.6%I T C LTD. 5.4%LARSEN & TOUBRO LTD. 4.5%HOUSING DEVELOPMENT FINANCE CORPN. LTD. 4.1%SBI-ETF NIFTY BANK 3.9%MARUTI SUZUKI INDIA LTD. 3.7%R*SHARES BANK BEES ETF 3.6%TATA CONSULTANCY SERVICES LTD. 3.5%Others 42.7%TOTAL 96.6%
CASH AND MONEY MARKET 3.4%PORTFOLIO TOTAL 100.0%
Sector Allocation (As per NIC Classification*)
NAV Movement
*NIC Classification – Industrial sectors as defined under National Industrial Classification 2008
* Benchmark return has been computed by applying benchmark weightages on Nifty 50 for Equity
NAV as on 30-06-2018
Rs. 43.4152
Date of Inception: February 07,2005
NA
V (
In R
s.)
Last 6 Months
Last 1Year
Last 2Years
Last 3Years
Since Inception
Deb Bhattacharya Equity - 3 | Debt - 2 | Balanced - 6
Rs. 1741 crore
As on June 30, 2018
ReturnsAbsolute Return CAGR Return
96.6%3.4%
Last 1 Month
Fund Manager Funds managed by the Fund Manager
As on June 30, 2018
SFIN No: ULIF00625/01/05MULTIPLIER117
UNIT-LINKED Fund
Investment Objective: To generate long term capital appreciation by investing in
diversified equities.
Investment Philosophy: The fund will target 100% investments in Equities to meet
the stated objectives.
Cash and Money Market
59(3%)
Equity1682(97%)
24%
13%
10%10%
9%
5%
5%
4%
4%
4%
12%FINANCIAL AND INSURANCE ACTIVITIES
COMPUTER PROGRAMMING, CONSULTANCY ANDRELATED ACTIVITIES
MANUFACTURE OF COKE AND REFINED PETROLEUMPRODUCTS
MUTUAL FUND
MANUFACTURE OF MOTOR VEHICLES, TRAILERS ANDSEMI-TRAILERS
MANUFACTURE OF TOBACCO PRODUCTS
MANUFACTURE OF PHARMACEUTICALS, MEDICINALCHEMICAL AND BOTANICAL PRODUCTS
CIVIL ENGINEERING
MANUFACTURE OF CHEMICALS AND CHEMICALPRODUCTS
INFRASTRUCTURE SECTOR
Others
5
10
15
20
25
30
35
40
45
50
Feb-05 May-07 Jul-09 Oct-11 Jan-14 Apr-16 Jun-18
18 | Page
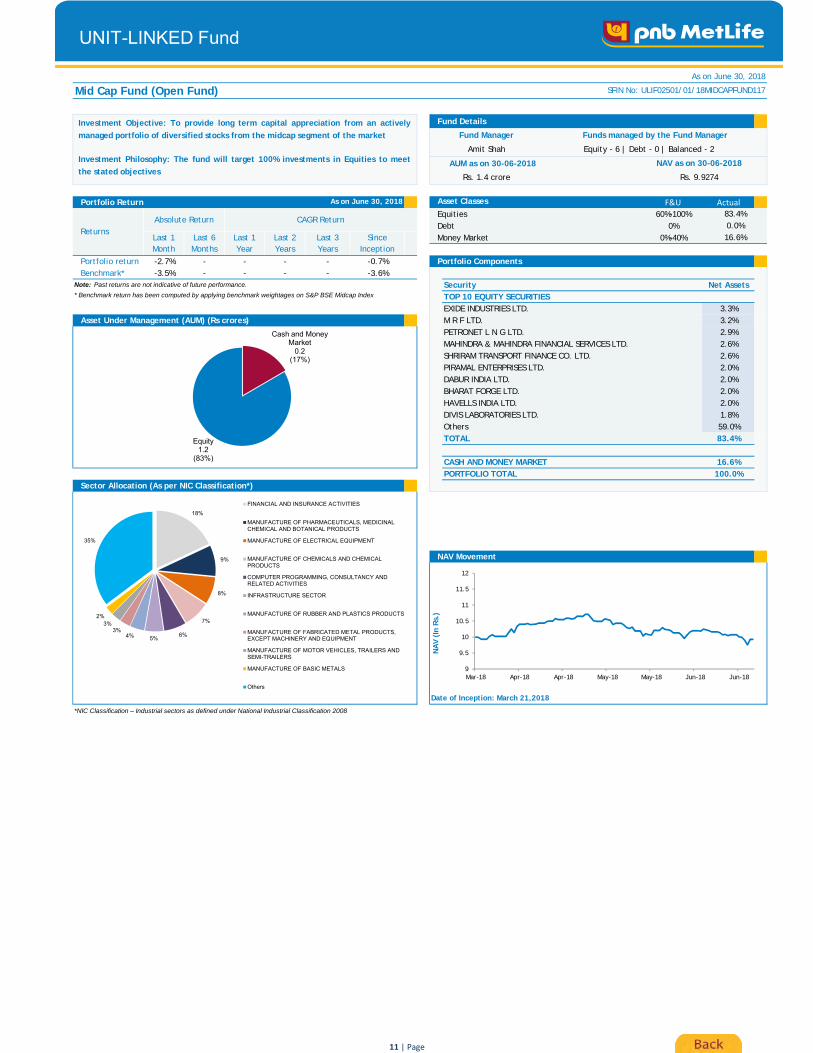
Virtue (Closed Fund)
Fund Details
AUM as on 30-06-2018
Portfolio Return Asset Classes F&U Actual
Listed Equities 60-100%Money Market Instruments 0-40%
Portfolio ComponentsPortfolio return -1.0% -5.5% 11.1% 13.0% 7.6% 7.9%
Security Net AssetsNote: Past returns are not indicative of future performance. TOP 10 EQUITY SECURITIES
RELIANCE INDUSTRIES LTD. 7.4%INFOSYS LTD. 7.0%
Asset Under Management (AUM) (Rs crores) MARUTI SUZUKI INDIA LTD. 3.9%BRITANNIA INDUSTRIES LTD. 3.0%WABCO INDIA LTD. 2.7%GRASIM INDUSTRIES LTD. 2.7%HINDUSTAN UNILEVER LTD. 2.7%ULTRATECH CEMENT LTD. 2.2%TATA CONSULTANCY SERVICES LTD. 2.1%LARSEN & TOUBRO LTD. 2.1%Others 54.1%TOTAL 89.9%
CASH AND MONEY MARKET 10.1%PORTFOLIO TOTAL 100.0%
Sector Allocation (As per NIC Classification*)
NAV Movement
*NIC Classification – Industrial sectors as defined under National Industrial Classification 2008
NAV as on 30-06-2018
Rs. 21.8602
Date of Inception: February 27,2008
NA
V (
In R
s.)
Last 6 Months
Last 1Year
Last 2Years
Last 3Years
Since Inception
Deb Bhattacharya Equity - 3 | Debt - 2 | Balanced - 6
Rs. 91 crore
As on June 30, 2018
ReturnsAbsolute Return CAGR Return
89.9%10.1%
Last 1 Month
Fund Manager Funds managed by the Fund Manager
As on June 30, 2018
SFIN No: ULIF00719/02/08VIRTUEFUND117
UNIT-LINKED Fund
Investment Objective: To generate long term capital appreciation by investing in
diversified equities of companies promoting healthy life style and enhancing quality
of life.Investment Philosophy: The fund will target 100% investments in Equities to meet
the stated objectives.
Cash and Money Market
9(10%)
Equity82
(90%)
14%
10%
10%
10%
8%5%5%
4%
4%
4%
26%
COMPUTER PROGRAMMING, CONSULTANCY ANDRELATED ACTIVITIES
MANUFACTURE OF CHEMICALS AND CHEMICALPRODUCTS
INFRASTRUCTURE SECTOR
MANUFACTURE OF COKE AND REFINED PETROLEUMPRODUCTS
MANUFACTURE OF MOTOR VEHICLES, TRAILERS ANDSEMI-TRAILERS
MANUFACTURE OF ELECTRICAL EQUIPMENT
MANUFACTURE OF PHARMACEUTICALS, MEDICINALCHEMICAL AND BOTANICAL PRODUCTS
MANUFACTURE OF OTHER NON-METALLIC MINERALPRODUCTS
MANUFACTURE OF FOOD PRODUCTS
MANUFACTURE OF BASIC METALS
Others
5
10
15
20
25
Feb-08 Nov-09 Aug-11 Apr-13 Jan-15 Oct-16 Jun-18
19 | Page

Accelerator (Closed Fund)
Fund Details
AUM as on 30-06-2018 NAV as on 30-06-2018
Rs. 41.4527Portfolio Return
Asset Classes F&U Actual
Govt & Govt Guaranteed Secs 0-40%Infrastructure and Social Sector Secs 0-40%Listed Equities 60-95%
Portfolio return 0.1% 1.4% 9.6% 10.6% 7.1% 11.2% Long Term Bonds 0-60%Benchmark* -0.1% 1.4% 10.3% 12.3% 8.4% 12.1% Short Term Bonds 0-35%
Note: Past returns are not indicative of future performance. Money Market Investments 0-40%
Portfolio ComponentsAsset Under Management (AUM) (Rs crores)
Security Rating Net AssetsGOVERNMENT SECURITIES9.23% GOI 2043 Sovereign 2.7%6.68% GOI 2031 Sovereign 1.1%TOTAL 3.7%
CORPORATE BONDSDEWAN HOUSING FINANCE CORPN. LTD. AAA 7.1%POWER FINANCE CORPN. LTD. AAA 2.3%SUNDARAM FINANCE LTD AAA 1.4%INDIABULLS HOUSING FINANCE LTD AAA 0.9%TOTAL 11.8%
Sector Allocation (As per NIC Classification*) TOP 10 EQUITY SECURITIESH D F C BANK LTD. 6.8%RELIANCE INDUSTRIES LTD. 6.6%INFOSYS LTD. 6.1%HOUSING DEVELOPMENT FINANCE CORPN. LTD. 5.2%I T C LTD. 5.1%KOTAK MAHINDRA BANK LTD. 3.9%TATA CONSULTANCY SERVICES LTD. 3.8%MAHINDRA & MAHINDRA LTD. 3.4%LARSEN & TOUBRO LTD. 3.0%HINDUSTAN UNILEVER LTD. 3.0%Others 27.4%TOTAL 74.2%
CASH AND MONEY MARKET 10.3%PORTFOLIO TOTAL 100.0%
*NIC Classification – Industrial sectors as defined under National Industrial Classification 2008
Credit Rating Profile
Maturity by Profile NAV Movement
Deb Bhattacharya Equity - 3 | Debt - 2 | Balanced - 6
Modified Duration(Debt and Money Market)
3.3
74.2%
Himanshu Shethia Equity - 0 | Debt - 6 | Balanced - 4
Rs. 209 croreAs on June 30, 2018
Date of Inception: February 07,2005
NA
V (
In R
s.)
* Benchmark return has been computed by applying benchmark weightages on CRISIL Composite Bond Fund Index for Debt and Nifty 50 for Equity
9.4%0.0%10.3%
Last 6 Months
Last 1Year
Last 2Years
Last 3Years
Since Inception
ReturnsAbsolute Return CAGR Return
3.7%2.3%Last 1
Month
Fund Manager Funds managed by the Fund Manager
As on June 30, 2018
SFIN No: ULIF00525/01/05ACCELERATO117
UNIT-LINKED Fund
Investment Objective: To achieve capital appreciation by investing predominantly
in equities, with limited investment in fixed income securities.
Investment Philosophy: The fund will target 80% investments in Equities and 20%
investments in Government & other debt securities to meet the stated objectives.
Cash and Money Market
22(10%)
Debt32
(15%)
Equity155
(74%)
24%
13%
8%
8%6%
6%
5%
5%
4%
3%
18%
FINANCIAL AND INSURANCE ACTIVITIES
COMPUTER PROGRAMMING, CONSULTANCY ANDRELATED ACTIVITIES
HOUSING SECTOR
MANUFACTURE OF COKE AND REFINED PETROLEUMPRODUCTS
INFRASTRUCTURE SECTOR
MANUFACTURE OF MOTOR VEHICLES, TRAILERS ANDSEMI-TRAILERS
MANUFACTURE OF TOBACCO PRODUCTS
MANUFACTURE OF CHEMICALS AND CHEMICALPRODUCTS
GOVERNMENT OF INDIA
MANUFACTURE OF PHARMACEUTICALS, MEDICINALCHEMICAL AND BOTANICAL PRODUCTS
Others
AAA76%
Government Securities
24%
< 1 Year23%
3 to 7 Years47%
> 7 Years30%
5
10
15
20
25
30
35
40
45
Feb-05 May-07 Jul-09 Oct-11 Jan-14 Apr-16 Jun-18
20 | Page

Balancer (Closed Fund)
Fund Details
AUM as on 30-06-2018 NAV as on 30-06-2018
Rs. 34.536Portfolio Return
Asset Classes F&U Actual
Govt & Govt Guaranteed Secs 10-60%Infrastructure and Social Sector Secs 0-60%Listed Equities 35-65%
Portfolio return 0.2% 1.1% 6.8% 8.8% 6.9% 9.7% Long Term Bonds 0-60%Benchmark* 0.0% 1.0% 6.9% 10.1% 8.1% 10.5% Short Term Bonds 0-35%
Note: Past returns are not indicative of future performance. Money Market Instruments 0-40%
Portfolio ComponentsAsset Under Management (AUM) (Rs crores)
Security Rating Net AssetsTOP 10 GOVERNMENT SECURITIES7.17% GOI 2028 Sovereign 5.4%7.16% GOI 2023 Sovereign 2.6%9.23% GOI 2043 Sovereign 1.3%6.57% GOI 2033 Sovereign 1.1%8.24% GOI 2027 Sovereign 1.1%7.59% GOI 2029 Sovereign 0.6%6.68% GOI 2031 Sovereign 0.6%8.83% GOI 2023 Sovereign 0.5%8.17% GOI 2044 Sovereign 0.4%8.43% SDL 2019 Sovereign 0.4%Others 0.6%
Sector Allocation (As per NIC Classification*) TOTAL 14.7%
CORPORATE BONDSDEWAN HOUSING FINANCE CORPN. LTD. AAA 8.0%RELIANCE GAS TRANSPORTATION INFRASTRUCTURE AAA 6.7%RURAL ELECTRIFICATION CORPN. LTD. AAA 3.9%POWER FINANCE CORPN. LTD. AAA 3.4%INDIABULLS HOUSING FINANCE LTD AAA 2.3%SUNDARAM FINANCE LTD AAA 1.6%POWER GRID CORPN. OF INDIA LTD. AAA 1.3%HDB FINANCIAL SERVICES LIMITED AAA 1.3%L&T INFRA DEBT FUND LTD AAA 1.3%TOTAL 29.8%
TOP 10 EQUITY SECURITIESH D F C BANK LTD. 5.3%HOUSING DEVELOPMENT FINANCE CORPN. LTD. 4.2%INFOSYS LTD. 4.1%RELIANCE INDUSTRIES LTD. 4.0%
*NIC Classification – Industrial sectors as defined under National Industrial Classification 2008 I T C LTD. 3.2%Credit Rating Profile KOTAK MAHINDRA BANK LTD. 2.4%
TATA CONSULTANCY SERVICES LTD. 2.4%MAHINDRA & MAHINDRA LTD. 2.2%LARSEN & TOUBRO LTD. 1.9%HINDUSTAN UNILEVER LTD. 1.9%Others 17.3%TOTAL 48.9%
CASH AND MONEY MARKET 6.7%PORTFOLIO TOTAL 100.0%
Maturity by Profile NAV Movement
Deb Bhattacharya Equity - 3 | Debt - 2 | Balanced - 6
Modified Duration(Debt and Money Market)
4.2
48.9%
Himanshu Shethia Equity - 0 | Debt - 6 | Balanced - 4
Rs. 376 croreAs on June 30, 2018
Date of Inception: February 08,2005
NA
V (
In R
s.)
* Benchmark return has been computed by applying benchmark weightages on CRISIL Composite Bond Fund Index for Debt and Nifty 50 for Equity
11.9%1.3%6.7%
Last 6 Months
Last 1Year
Last 2Years
Last 3Years
Since Inception
ReturnsAbsolute Return CAGR Return
14.7%16.6%Last 1
Month
Fund Manager Funds managed by the Fund Manager
As on June 30, 2018
SFIN No: ULIF00425/01/05BALANCERFN117
UNIT-LINKED Fund
Investment Objective: To generate capital appreciation and current income,
through a judicious mix of investments in equities and fixed income securities.
Investment Philosophy: The fund will target 50% investments in Equities and 50%
investments in Government & other debt securities to meet the stated objectives.
Cash and Money Market
25(7%)
Debt167
(44%)
Equity184
(49%)
19%
19%
15%10%
8%
5%
4%
3%
3%
2%
12%INFRASTRUCTURE SECTOR
FINANCIAL AND INSURANCE ACTIVITIES
GOVERNMENT OF INDIA
HOUSING SECTOR
COMPUTER PROGRAMMING, CONSULTANCYAND RELATED ACTIVITIES
MANUFACTURE OF COKE AND REFINEDPETROLEUM PRODUCTS
MANUFACTURE OF MOTOR VEHICLES,TRAILERS AND SEMI-TRAILERS
MANUFACTURE OF TOBACCO PRODUCTS
MANUFACTURE OF CHEMICALS ANDCHEMICAL PRODUCTS
CIVIL ENGINEERING
Others
AAA67%
Government Securities
33%
< 1 Year13%
3 to 7 Years48%
> 7 Years39%
5
10
15
20
25
30
35
40
Feb-05 May-07 Jul-09 Oct-11 Jan-14 Mar-16 Jun-18
21 | Page

Moderator (Closed Fund)
Fund Details
AUM as on 30-06-2018 NAV as on 30-06-2018
Rs. 27.5523Portfolio Return
Asset Classes F&U Actual
Govt & Govt Guaranteed Secs 10-60%Infrastructure and Social Sector Secs 0-60%Listed Equities 10-30%
Portfolio return 0.2% 0.2% 2.5% 6.0% 6.1% 7.9% Long Term Bonds 0-60%Benchmark* 0.2% 0.5% 3.6% 7.8% 7.8% 8.6% Short Term Bonds 0-35%
Note: Past returns are not indicative of future performance. Money Market Investments 0-40%
Portfolio ComponentsAsset Under Management (AUM) (Rs crores)
Security Rating Net AssetsGOVERNMENT SECURITIES7.17% GOI 2028 Sovereign 12.0%7.16% GOI 2023 Sovereign 8.7%6.68% GOI 2031 Sovereign 8.0%7.35% GOI 2024 Sovereign 5.8%8.13% GOI 2021 Sovereign 0.2%TOTAL 34.8%
CORPORATE BONDSDEWAN HOUSING FINANCE CORPN. LTD. AAA 9.0%L&T INFRA DEBT FUND LTD AAA 8.7%POWER FINANCE CORPN. LTD. AAA 6.9%
Sector Allocation (As per NIC Classification*) HDB FINANCIAL SERVICES LIMITED AAA 6.0%INDIABULLS HOUSING FINANCE LTD AAA 5.4%TOTAL 36.0%
TOP 10 EQUITY SECURITIESH D F C BANK LTD. 2.1%HOUSING DEVELOPMENT FINANCE CORPN. LTD. 1.9%INFOSYS LTD. 1.7%RELIANCE INDUSTRIES LTD. 1.6%I T C LTD. 1.3%KOTAK MAHINDRA BANK LTD. 1.2%TATA CONSULTANCY SERVICES LTD. 1.0%MAHINDRA & MAHINDRA LTD. 0.9%HINDUSTAN UNILEVER LTD. 0.8%LARSEN & TOUBRO LTD. 0.8%Others 7.5%TOTAL 20.8%
CASH AND MONEY MARKET 8.3%*NIC Classification – Industrial sectors as defined under National Industrial Classification 2008 PORTFOLIO TOTAL 100.0%
Credit Rating Profile
Maturity by Profile NAV Movement
Deb Bhattacharya Equity - 3 | Debt - 2 | Balanced - 6
Modified Duration(Debt and Money Market)
4.1
20.8%
Himanshu Shethia Equity - 0 | Debt - 6 | Balanced - 4
Rs. 17 croreAs on June 30, 2018
Date of Inception: February 08,2005
NA
V (
In R
s.)
* Benchmark return has been computed by applying benchmark weightages on CRISIL Composite Bond Fund Index for Debt and Nifty 50 for Equity
14.4%6.0%8.3%
Last 6 Months
Last 1Year
Last 2Years
Last 3Years
Since Inception
ReturnsAbsolute Return CAGR Return
34.8%15.6%Last 1
Month
Fund Manager Funds managed by the Fund Manager
As on June 30, 2018
SFIN No: ULIF00325/01/05MODERATORF117
UNIT-LINKED Fund
Investment Objective: To earn regular income by investing in high quality fixed
income securities and to generate capital appreciation by investing a limited
portion in equity.Investment Philosophy: The fund will target 20% investments in Equities and 80%
investments in Government & other debt securities to meet the stated objectives.
Cash and Money Market
2(8%)
Debt12
(71%)
Equity3
(21%)
35%
17%14%
13%
3%
2%2%
1%1%1%
11% GOVERNMENT OF INDIA
INFRASTRUCTURE SECTOR
HOUSING SECTOR
FINANCIAL AND INSURANCE ACTIVITIES
COMPUTER PROGRAMMING, CONSULTANCY ANDRELATED ACTIVITIES
MANUFACTURE OF COKE AND REFINED PETROLEUMPRODUCTS
MANUFACTURE OF MOTOR VEHICLES, TRAILERS ANDSEMI-TRAILERS
MANUFACTURE OF TOBACCO PRODUCTS
MANUFACTURE OF CHEMICALS AND CHEMICALPRODUCTS
MANUFACTURE OF PHARMACEUTICALS, MEDICINALCHEMICAL AND BOTANICAL PRODUCTS
Others
AAA51%
Government Securities
49%
< 1 Year15%
3 to 7 Years52%
> 7 Years33%
5
10
15
20
25
30
Feb-05 May-07 Jul-09 Oct-11 Jan-14 Mar-16 Jun-18
22 | Page

Protector (Closed Fund)
Fund Details
AUM as on 30-06-2018 NAV as on 30-06-2018
Rs. 24.2706
Portfolio Return Asset Classes F&U Actual
Govt & Govt Guaranteed Secs 25-90%Infrastructure and Social Sector Secs 0-60%Long Term Bonds 10-60%Short Term Bonds 0-45%
Portfolio return 0.2% -0.4% 0.1% 4.8% 6.2% 6.8% Money Market Investments 0-40%Benchmark* 0.3% 0.2% 1.3% 6.3% 7.6% 6.9%
Note: Past returns are not indicative of future performance. Portfolio Components
Security Rating Net AssetsAsset Under Management (AUM) (Rs crores) GOVERNMENT SECURITIES
7.17% GOI 2028 Sovereign 16.5%6.68% GOI 2031 Sovereign 11.6%7.16% GOI 2023 Sovereign 4.3%8.33% GOI 2026 Sovereign 1.5%7.35% GOI 2024 Sovereign 1.4%9.23% GOI 2043 Sovereign 0.3%8.43% SDL 2019 Sovereign 0.2%TOTAL 35.8%
TOP 10 CORPORATE BONDSPOWER GRID CORPN. OF INDIA LTD. AAA 8.2%RELIANCE PORTS & TERMINALS LTD. AAA 7.8%DEWAN HOUSING FINANCE CORPN. LTD. AAA 7.3%
Sector Allocation (As per NIC Classification*) TATA SONS LTD. AAA 6.7%INDIABULLS HOUSING FINANCE LTD AAA 6.6%POWER FINANCE CORPN. LTD. AAA 6.2%SHRIRAM TRANSPORT FINANCE CO. LTD. AA+ 3.6%RELIANCE GAS TRANSPORTATION INFRASTRUCTURE AAA 3.5%INFRASTRUCTURE LEASING & FINANCIAL SERVICES AAA 2.3%IDFC BANK LIMITED AAA 0.4%TOTAL 52.5%
CASH AND MONEY MARKET 11.7%PORTFOLIO TOTAL 100.0%
*NIC Classification – Industrial sectors as defined under National Industrial Classification 2008
Credit Rating Profile
Maturity by Profile NAV Movement
Date of Inception: February 04,2005
NA
V (
In R
s.)
* Benchmark return has been computed by applying benchmark weightages on CRISIL Composite Bond Fund Index for Debt
Modified Duration(Debt and Money Market)
4.2
17.9%6.7%11.7%
Last 6 Months
Last 1Year
Last 2Years
Last 3Years
Since Inception
Himanshu Shethia Equity - 0 | Debt - 6 | Balanced - 4
Rs. 135 crore
As on June 30, 2018
ReturnsAbsolute Return CAGR Return
35.8%27.9%
Last 1 Month
Fund Manager Funds managed by the Fund Manager
As on June 30, 2018
SFIN No: ULIF00225/01/05PROTECTORF117
UNIT-LINKED Fund
Investment Objective: To earn regular income by investing in high quality fixed
income securities
Investment Philosophy: The fund will target 100% investments in Government &
other debt securities to meet the stated objectives
Cash and Money Market
16(12%)
Debt119
(88%)
36%
28%
14%
11%
11%
GOVERNMENT OF INDIA
INFRASTRUCTURE SECTOR
HOUSING SECTOR
FINANCIAL AND INSURANCEACTIVITIES
Others
AAA55%
Government Securities
41%
AA+4%
< 1 Year15%
1 to 3 years2%
3 to 7 Years39%
> 7 Years44%
5
10
15
20
25
30
Feb-05 Apr-07 Jul-09 Oct-11 Jan-14 Apr-16 Jun-18
23 | Page
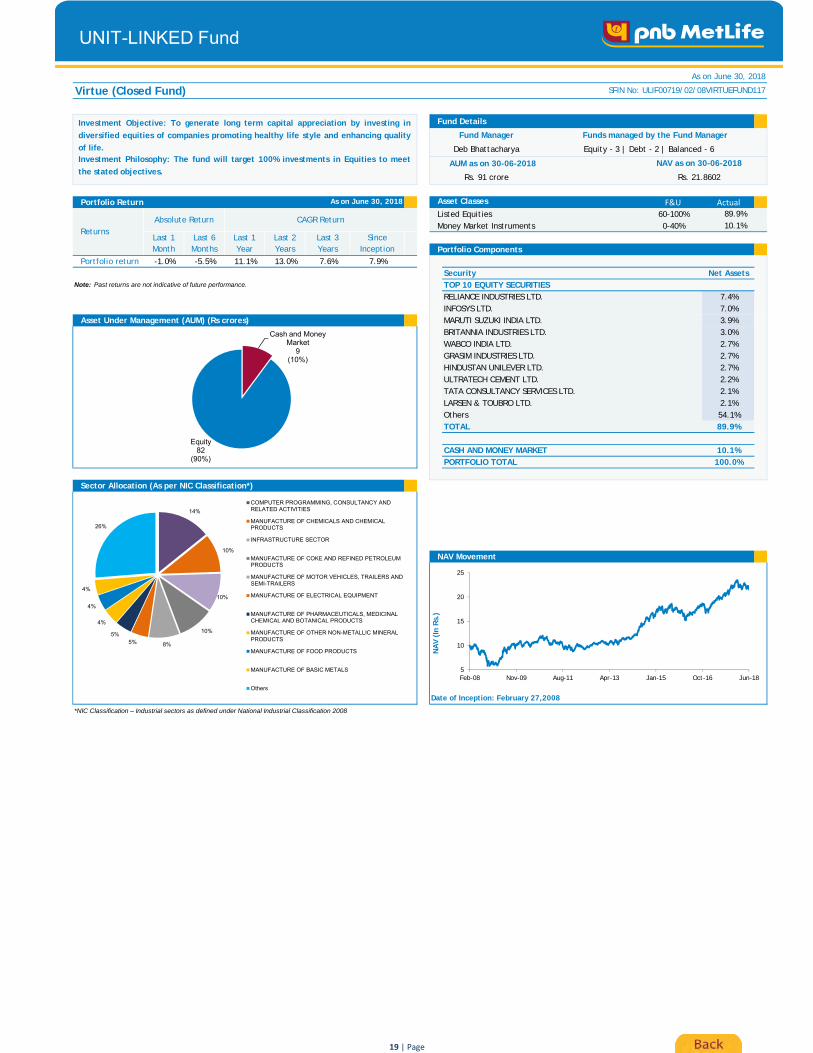
Preserver (Closed Fund)
Fund Details
AUM as on 30-06-2018 NAV as on 30-06-2018
Rs. 22.2602
Portfolio Return Asset Classes F&U Actual
Govt & Govt Guaranteed Secs 80-100%Money Market Investments 0-40%
Portfolio ComponentsPortfolio return 0.2% 0.1% -0.3% 4.8% 6.1% 6.2%Benchmark* 0.3% 0.9% 2.3% 6.2% 7.8% 7.6% Security Rating Net Assets
Note: Past returns are not indicative of future performance. TOP 10 GOVERNMENT SECURITIES7.16% GOI 2023 Sovereign 21.1%7.35% GOI 2024 Sovereign 18.8%
Asset Under Management (AUM) (Rs crores) 7.68% GOI 2023 Sovereign 17.6%8.39% SDL 2024 Sovereign 12.1%8.27% GOI 2020 Sovereign 11.5%6.84% GOI 2022 Sovereign 7.8%8.6% GOI 2028 Sovereign 2.1%7.99% SDL 2025 Sovereign 1.3%8.33% GOI 2026 Sovereign 1.1%8.13% GOI 2021 Sovereign 0.5%Others 0.3%TOTAL 94.1%
CASH AND MONEY MARKET 5.9%PORTFOLIO TOTAL 100.0%
Sector Allocation (As per NIC Classification*)
*NIC Classification – Industrial sectors as defined under National Industrial Classification 2008
Credit Rating Profile
Maturity by Profile NAV Movement
* Benchmark return has been computed by applying benchmark weightages on ISEC Mibex for Government & Govt. Guaranteed Securities
Modified Duration(Debt and Money Market)
3.8
Date of Inception: February 10,2005
NA
V (
In R
s.)
Last 6 Months
Last 1Year
Last 2Years
Last 3Years
Since Inception
Himanshu Shethia Equity - 0 | Debt - 6 | Balanced - 4
Rs. 62 crore
As on June 30, 2018
ReturnsAbsolute Return CAGR Return
94.1%5.9%
Last 1 Month
Fund Manager Funds managed by the Fund Manager
As on June 30, 2018
SFIN No: ULIF00125/01/05PRESERVERF117
UNIT-LINKED Fund
Investment Objective: To generate income at a level consistent with preservation
of capital, through investments in securities issued or guaranteed by central and
state Governments.Investment Philosophy: The fund will target 100% investments in Government &
Govt. Guaranteed Securities to meet the stated objectives
Cash and Money Market
4(6%)
Debt58
(94%)
94%
6%
GOVERNMENT OF INDIA
Others
Government Securities
100%
< 1 Year6% 1 to 3 years
11%
3 to 7 Years78%
> 7 Years5%
5
10
15
20
25
Feb-05 May-07 Jul-09 Oct-11 Jan-14 Apr-16 Jun-18
24 | Page

Discontinued Policy Fund
Fund Details
AUM as on 30-06-2018 NAV as on 30-06-2018
Rs. 16.8257
Portfolio Return Asset Classes F&U Actual
Government Securities 0-25%Money Market Instruments 0-100%
Portfolio ComponentsPortfolio return 0.5% 2.8% 5.7% 5.9% 6.3% 7.2%
Security Net AssetsNote: Past returns are not indicative of future performance. CASH AND MONEY MARKET 100.0%
PORTFOLIO TOTAL 100.0%
Asset Under Management (AUM) (Rs crores)
Sector Allocation (As per NIC Classification*)
*NIC Classification – Industrial sectors as defined under National Industrial Classification 2008
Credit Rating Profile
Maturity by Profile NAV Movement
Modified Duration(Debt and Money Market)
0.4
Date of Inception: December 21,2010
NA
V (
In R
s.)
Last 6 Months
Last 1Year
Last 2Years
Last 3Years
Since Inception
Himanshu Shethia Equity - 0 | Debt - 6 | Balanced - 4
Rs. 607 crore
As on June 30, 2018
ReturnsAbsolute Return CAGR Return
0.0%100.0%
Last 1 Month
Fund Manager Funds managed by the Fund Manager
As on June 30, 2018
SFIN No: ULIF01721/12/10DISCONTINU117
UNIT-LINKED Fund
Investment Objective: To generate income at a level consistent with the
preservation of capital, along with a minimum interest of 4% per annum.
Investment Philosophy: The fund will target 100% investments in Government &
other debt securities to meet the stated objectives.
Cash and Money Market
607(100%)
96%
4%
GOVERNMENT OF INDIA
Others
Government Securities
100%
< 1 Year100%
9
10
11
12
13
14
15
16
17
18
Dec-10 Mar-12 Jun-13 Sep-14 Dec-15 Mar-17 Jun-18
25 | Page

Quantitative Indicators
Macroeconomic Indicators
• Macroeconomics - Macroeconomics is the branch of economics that studies the behavior and performance of aneconomy as a whole. It focuses on the aggregate changes in the economy such as unemployment, growth rate,gross domestic product and inflation. Macroeconomics analyzes all aggregate indicators that influence theeconomy. Government and corporations use macroeconomic models to help in formulating of economic policiesand strategies.
• Gross Domestic Product (GDP) - GDP is one of the primary indicators used to gauge the health of a country'seconomy. It represents the total value of all goods and services produced over a specific time period. It can bestated in real terms or nominal terms (which includes inflation).
• Gross value added (GVA) - GVA is a productivity metric that measures the contribution to an economy, producer,sector or region. Gross value added provides a value for the amount of goods and services that have beenproduced, less the cost of all inputs and raw materials that are directly attributable to that production.
• Index of Industrial Production (IIP) – The index represents the production growth of various sectors in India. Theindex focuses on mining, electricity and manufacturing. The ongoing base year for calculation of index is 2004-2005.
• HSBC Purchasers Managers’ Index (PMI) - Three types of indices – Manufacturing, Services and Composite Indexare published on a monthly basis after surveys of private sector companies. An index reading above 50 indicates anoverall increase in that variable, while below 50 shows an overall decrease.
• Inflation – Inflation measures the change in the prices of a basket of goods and services in a year. From acalculation standpoint, it is the percentage change in the value of the Wholesale Price Index (WPI) / ConsumerPrice Index (CPI) on a year-on-year basis. It occurs due to an imbalance between demand and supply, changes inproduction and distribution cost or increase in taxes on products. When economy experiences inflation, i.e. whenthe price level of goods and services rises, the value of currency reduces.
• Standard Deviation (SD) - It shows how much the variation or dispersion of a fund’s daily returns has from itsaverage. Lesser SD indicates that the daily returns are moving closer to the average. A higher SD indicates thatdaily returns are widely spread over a large range of value.
• Beta – It indicates how the fund is performing relative to its benchmark. If beta of a fund is higher than itsbenchmark, which is considered 1, it indicates risk-return trade-off is better and vice-versa.
• Sharpe Ratio – It measures the risk-reward ratio as it indicates whether higher returns come with higher or lowerrisk. Greater the ratio, better is the risk-adjusted performance.
• Average Maturity – It is the weighted average period of all the maturities of debt securities in the portfolio.
• Modified Duration (MD) – It is the measurable change in the value of a security in response to a change in interestrates.
• Bond yield – Bond yield is the amount of return an investor realizes on a bond. Several types of bond yields exist,including nominal yield (interest paid divided by the face value of the bond) and current yield (annual earnings ofthe bond divided by its current market price). Yield to maturity (YTM), a popular measure where in addition tocoupon return it also additionally incorporates price decline/increase to face value of the bond over the maturityperiod.
Back26 | Page
Glossary
Back
Market Indices
Fixed Income Indicators
• Nifty 50 Index – It is a well diversified 50 stock index accounting for 22 sectors of the economy. It is used for avariety of purposes such as benchmarking fund portfolios, index based derivatives and index funds.
• CRISIL Composite Bond Fund Index - It seeks to track the performance of a debt portfolio that includesgovernment securities and AAA/AA rated corporate bonds.
• Repo Rate - The rate at which the RBI lends money to commercial banks is called repo rate. It is an instrument ofmonetary policy. Whenever shortage of funds banks has, they can borrow from the RBI.
• Cash Reserve Ratio (CRR) - CRR is the amount of funds which the banks need to keep with the RBI. If the RBIdecides to increase the CRR, the available amount with the banks comes down. The RBI uses the CRR to drain outexcessive money from the system.
27| Page
Macroeconomic Indicators
• Nominal interest rate - Nominal interest rate is the interest rate that does not take inflation impact into account.It is the interest rate that is quoted on bonds and loans.
• Real interest rate - Real interest rate adjusts for the inflation and gives the real rate of a bond or a loan.
• Monetary Policy – Monetary policy is the macroeconomic policy laid down by the Central bank. It involvesmanagement of money supply and interest rates to achieve macroeconomic objectives like inflation, consumption,growth and liquidity. Depending on growth-inflation dynamics, the central bank can either pursue an easy or atight monetary policy. An expansionary/easy/ accommodative monetary policy involves expansion of moneysupply, mainly by keeping interest rates low, to boost economic growth. A contractionary/tight monetary policyinvolves reduction in money supply to control inflation in the economy.
• Liquidity - The Central bank of a country has to maintain an appropriate level of liquidity to help meet the creditdemand of the country as well as maintain price stability. This is done by way of direct monetary policy tools suchas policy rates and cash reserves to be maintained with it by banks. It is also done by indirect means such as Openmarket Operations (OMO) which involve sale and purchase of Government securities.
• Fiscal Deficit – This takes place when India's expenditure rises than its revenue. To fill this gap, the Governmentraises debt by issuing Government/ sovereign bonds. Fiscal deficit is usually compared with GDP to understand thefinancial position of the country. Rising fiscal deficit to GDP ratio is not good for the country, which requiresimmediate attention to cut expenditure and/or increase the source of revenue.
• Current Account Deficit (CAD) - Current account deficit is a measurement of a country’s trade where the value ofimports of goods and services as well as net investment income or transfer from abroad is greater than the valueof exports of goods and services for a country. This indicates that the country is a net debtor of foreign currency,which increases the pressure on the country's existing foreign currency reserves. Current account surplus is theopposite of this.
• Investment - In private investment, the funds come from a private, for-profit business. A few examples of privateinvestment are a private company’s manufacturing plant, a commercial office building, or a shopping mall. Inpublic investment, the money exchanged comes from a governmental entity such as a city, state, country, etc. Itwould involve roads, airports, dams and other public infrastructure.
Glossary

Back28| Page
Others
• Goods and Services Tax (GST) – The GST is one of the biggest indirect tax reforms, with an aim to make India oneunified common market. It is a single tax on the supply of goods and services, right from the manufacturer to theconsumer. Credits of input taxes paid at each stage will be available in the subsequent stage of value addition,which makes GST essentially a tax only on value addition at each stage. The final consumer will thus bear only theGST charged by the last dealer in the supply chain, with set-off benefits at all the previous stages.
• Foreign institutional investors (FIIs) - FIIs are those institutional investors who invest in the assets belonging to adifferent country other than that where these organizations are based. These are the big companies such asinvestment banks, mutual funds etc, which invest considerable amount of money in Indian equity and fixedincome markets, and consequently have a strong bearing on the respective market movement and currency.
• Domestic institutional investors (DIIs)- DIIs are those institutional investors who undertake investment insecurities and other financial assets of the country they are based in. Institutional investment is defined to be theinvestment done by institutions or organizations such as banks, insurance companies, and mutual fund houses inthe financial or real assets of a country.
• Emerging market (EM) economy- An emerging market economy describes a nation's economy that is progressingtoward becoming more advanced, usually by means of rapid growth and industrialization. These countriesexperience an expanding role both in the world economy and on the political frontier.
• Organization of the Petroleum Exporting Countries (OPEC)- The OPEC was formed in 1960 to unify andcoordinate members’ petroleum policies. This was aimed at ensuring the stability of oil markets in order to securean efficient, economic, and regular supply of petroleum to customers as well as a steady income to producerswith a fair return. Members of OPEC include Iran, Iraq, Syria, Kuwait, Saudi Arabia, Bahrain, Qatar, the UnitedArab Emirates (or UAE), Oman, and Yemen. The OPEC countries produce 40% of the world’s crude oil.
• Federal Open Market Committee (FOMC)- The FOMC is the monetary policymaking body of the Federal ReserveSystem. The FOMC is composed of 12 members – seven members of the Board of Governors and five of the 12Reserve Bank presidents.
• International Monetary Fund (IMF)- The IMF, formed in 1945, is an international organization of 189 countries,headquartered in Washington, D.C. The key objectives include fostering global monetary cooperation, securingfinancial stability, facilitating international trade, promoting high employment and sustainable economic growth,and reducing poverty around the world.
Fixed Income Indicators
• Marginal Standing Facility (MSF) – It is a rate at which the RBI provides overnight lending to commercial banksover and above the repo window (repo rate). The interest rate charged is higher than the repo rate and hence it isused when there is considerable shortfall in liquidity.
• Statutory Liquidity ratio (SLR) – In India, commercial banks are required to maintain a certain percentage of theirtotal deposits (net demand and time liabilities) in notified Government securities to ensure safety and liquidity ofdeposits. This percentage is known as the SLR rate. If the RBI or Central Bank reduces the SLR rate, it means thathigher liquidity will be available to banks for their lending activity and vice-versa.
Glossary

Back29 | Page
ULIP
• MetLife Smart PlatinumUIN : 117L066V02
Traditional Products
• PNB MetLife Guaranteed Income Plan UIN :117N097V03
• PNB MetLife Mera Heart and Cancer Care UIN: 117N100V01
• PNB MetLife Endowment Savings Plan PlusUIN : 117N099V01
An income benefit plan that provides you the customizability of choosingyour premium payment term and policy term, while providing guaranteedregular income to cherish little joys in life along with lump sum benefit atmaturity to help you turn your big dreams into reality.
A tailor-made health insurance plan that provides you withcomprehensive cover against different stages of cancer and heartdiseases, without a survival period. It also provides an inbuilt life coverand an option to get your premiums back (net of claims paid) at maturity.
A Unit Linked Whole life plan for your changing life stage needs. Alongwith 6 Unit Linked Funds & investment strategies like auto rebalancingand Systematic Transfer Option, this plan has free unlimited switchesonline, which allows you to manage your investments with changingmarket conditions.
A plan that helps you accumulate your savings for your financial needs atevery stage of life. Additionally, it provides life cover to protect yourfamily along with an option to protect your goals against critical illnesses.
• PNB MetLife Mera Jeevan Suraksha Plan UIN :117N102V01
A comprehensive protection plan with life and terminal illness cover thatprovides flexible pay out options to protect and fulfil your family’s future.
• PNB MetLife Mera Term Plan UIN: 117N092V02
A customizable protection plan which gives the option to stay protected tillage 99. Four pay out options and coverage for spouse make it a trulyflexible offering. Additional protection is also available through riders
• PNB MetLife Whole Life Wealth PlanUIN: 117L118V01
PNB MetLife Whole Life Wealth Plan is a whole life unit linked plan thatprovides tailor-made solutions to accumulate wealth along with lifeprotection, including an option where wealth creation doesn’t take aback seat even during critical illness.
Our Popular Products

About Us
PNB MetLife India Insurance Company Limited (PNB MetLife) is one of the fastest growing lifeinsurance companies in the country, having as its shareholders, MetLife International Holdings LLC.(MIHL), Punjab National Bank Limited (PNB), Jammu & Kashmir Bank Limited (JKB), M. Pallonji andCompany Private Limited and other private investors, with MIHL and PNB being the majorityshareholders. PNB MetLife has been present in India since 2001.
PNB MetLife brings together the financial strength of a leading global life insurance provider, MetLife,Inc., and the credibility and reliability of PNB, one of India's oldest and leading nationalised banks.The vast distribution reach of PNB together with the global insurance expertise and product range ofMetLife makes PNB MetLife a strong and trusted insurance provider.
PNB MetLife is present in over 110 locations across the country and serves customers in more than8,000 locations through its bank partnerships with PNB, JKB and Karnataka Bank Limited.
PNB MetLife provides a wide range of protection and retirement products through its Agency sales ofover 6,000 financial advisors and multiple bank partners, and provides access to Employee Benefitplans for over 1,200 corporate clients in India. The company continues to be consistently profitableand has declared profits for last five Financial Years.
For more information, visit www.pnbmetlife.com
Customer Helpline No.
SMS HELP to 5607071(Special SMS Charges Apply)
1800-425-6969 (Toll Free) (Within India only)
IVR available 24*7 with your policy details
Contact Us
Back

PNB MetLife India Insurance Co. Ltd.(Insurance Regulatory and Development Authority of India
(IRDAI of India), Life Insurance Registration No.117)Registered Office: Unit No. 701, 702 & 703,
7th Floor, West Wing, Raheja Towers, 26/27 M G Road, Bangalore-560001.
Toll Free: 1-800-425-6969www.pnbmetlife.com
PNB MetLife India Insurance Company Limited, Registered office address: Unit No. 701, 702 & 703, 7th Floor, West Wing, RahejaTowers, 26/27 M G Road, Bangalore-560001, Karnataka. IRDAI Registration number 117. CI No: U66010KA2001PLC028883, Call us Toll-free at 1-800-425-6969, Website: www.pnbmetlife.com, Email: [email protected]. or write to us 1st Floor, Techniplex -1,Techniplex Complex, Off Veer Savarkar Flyover, Goregaon (West), Mumbai – 400062. Phone: +91-22-41790000, Fax: +91-22-41790203.LD/2018-19/078 EC078.
• For more details on risk factors, terms and conditions, please read product sales brochure carefully before concluding a sale• Unit-Linked Life Insurance products are different from the traditional insurance products and are subject to the risk factors• The premium paid in Unit-Linked Life Insurance Policies are subject to investment risks associated with capital markets and the NAVsof the Units may go up or down based on the performance of Fund and factors influencing the capital market and the insured isresponsible for his/her decisions • The name of the Insurance Company and the name of the Unit-Linked Life Insurance contract doesnot in any way indicate the quality of the contract, its future prospects or returns. Please know the associated risks and the applicablecharges, from your Insurance agent or the Intermediary or the Policy Document • The various Funds offered are the names of theFunds and do not in any way indicate the quality of these plans, their future prospects and returns. The Unit-Linked Funds don't offera guaranteed or assured return • The premium shall be adjusted on the due date even if it has been received in advance.
The fund update provided by PNB MetLife India Insurance Company Limited (“PNB MetLife”) is for general informational purposes only.This information is not intended as investment advice, or as an endorsement, recommendation or sponsorship of any company,security, or fund. The opinions and analyses included in the information are based from sources believed to be reliable and written ingood faith, but no representation or warranty, expressed or implied is made as to their accuracy, completeness or correctness. PNBMetLife cannot and do not assess or guarantee the suitability or profitability of any particular investment, or the potential value ofany investment or informational source. You should seek the advice of a qualified securities professional before making anyinvestment. The information contained herein does not suggest or imply and should not be construed, in any manner, a guarantee offuture performance. Past performance does not guarantee future results.
"The products on Nifty 50 Index is not sponsored, endorsed, sold or promoted by India Index Services & Products Limited (IISL). IISLdoes not make and expressly disclaims any representation or warranty, express or implied (including warranties of merchantability orfitness for particular purpose or use) regarding the advisability of investing in the products linked to Nifty 50 Index or particularly inthe ability of the Nifty 50 Index to track general stock market performance in India. Please read the full Disclaimers in relation to theNifty 50 Index in the Offer Document / Prospectus / Information Statement".
Indices provided by CRISIL
CRISIL Indices are the sole property of CRISIL Limited (CRISIL). CRISIL Indices shall not be copied, retransmitted or redistributed in anymanner for any commercial use. CRISIL has taken due care and caution in computation of the Indices, based on the data obtained fromsources, which it considers reliable. However, CRISIL does not guarantee the accuracy, adequacy or completeness of the Indices and isnot responsible for any errors or for the results obtained from the use of the Indices. CRISIL especially states that it has no financialliability whatsoever to the users of CRISIL Indices.
Compound annual growth rate (CAGR) is rounded to nearest 0.1%
Back
“The marks “PNB” and “MetLife” are the registered trademarks of Punjab National Bank and Metropolitan Life Insurance Company, respectively. PNB MetLife India Insurance CompanyLimited is a licensed user of these marks”
BEWARE OF SPURIOUS / FRAUD PHONE CALLS!
IRDAI is not involved in activities like selling insurance policies, announcing bonus or investment of premiums. Public receiving such phone calls are requested tolodge a police complaint.