
PNAS PLUS Structural rearrangements preceding …Structural rearrangements preceding dioxygen...
9
Structural rearrangements preceding dioxygen formation by the water oxidation complex of photosystem II Han Bao and Robert L. Burnap 1 Department of Microbiology and Molecular Genetics, Oklahoma State University, Stillwater, OK 74078 Edited by Pierre A. Joliot, Institut de Biologie Physico-Chimique, Paris, France, and approved September 29, 2015 (received for review June 19, 2015) Photosynthetic water oxidation is catalyzed by the Mn 4 CaO 5 clus- ter of photosystem II. Recent studies implicate an oxo bridge atom, O5, of the Mn 4 CaO 5 cluster, as the “slowly exchanging” substrate water molecule. The D1-V185N mutant is in close vicinity of O5 and known to extend the lag phase and retard the O 2 release phase (slow phase) in this critical last S + 3 → S 0 transition of water oxida- tion. The pH dependence, hydrogen/deuterium (H/D) isotope ef- fect, and temperature dependence on the O 2 release kinetics for this mutant were studied using time-resolved O 2 polarography, and comparisons were made with WT and two mutants of the putative proton gate D1-D61. Both kinetic phases in V185N are independent of pH and buffer concentration and have weaker H/D kinetic isotope effects. Each phase is characterized by a parallel or even lower activation enthalpy but a less favorable activation en- tropy than the WT. The results indicate new rate-determining steps for both phases. It is concluded that the lag does not represent inhibition of proton release but rather, slowing of a previously unrecognized kinetic phase involving a structural rearrangement or tautomerism of the S 3 + ground state as it approaches a config- uration conducive to dioxygen formation. The parallel impacts on both the lag and O 2 formation phases suggest a common origin for the defects surmised to be perturbations of the H-bond network and the water cluster adjacent to O5. photosynthesis | water oxidation | oxygen release kinetics | photosystem II | activation energy O xygenic photosynthesis depends on the light-driven water- plastoquinone oxidoreductase, photosystem II (PSII), which catalyzes the complete oxidation of H 2 O molecules to O 2 . The electrons extracted from H 2 O oxidation are the reductant for autotrophic metabolism, and the liberated protons contribute to the transmembrane proton motive force powering ATP pro- duction (reviewed in refs. 1–4). The byproduct, O 2 , has trans- formed our Earth’s atmosphere and makes heterotrophic life in the biosphere possible. A metal cluster, the Mn 4 CaO 5 , functions as the catalytic site of H 2 O oxidation and is buried in a protein domain of PSII referred to as the H 2 O oxidation complex (WOC). The primary photochemical electron donor of the reaction center (RC) complex is a dimeric chlorophyll moiety designated P 680 that is coordinated by the pseudosymmetrically arranged D1 and D2 polypeptides. Together, the D1/D2 heterodimer are re- sponsible for the coordination of most of the photochemically active cofactors of the RC. Photoexcitation of P 680 initiates transmem- brane charge separation with the activated electron moving to plastoquinone species, Q A and Q B , on the acceptor side of the RC. The resultant electron hole ðP +• 680 Þ functions as the powerful oxidant for the extraction of electrons from substrate H 2 O bound to the Mn 4 CaO 5 (Fig. 1A). However, the oxidation of the Mn 4 CaO 5 oc- curs through a redox active tyrosyl of the D1 protein, D1-Tyr161 (Y Z ), located between P 680 and the metal cluster. Thus, Y Z func- tions as a secondary donor to the photochemical RC and the pri- mary oxidant of the Mn 4 CaO 5 . Oxidation of Y Z creates a neutral tyrosine radical Y • Z because of a coupled proton transfer from the tyrosine to the nearby D1-His190, which is H-bonded to Y Z . Accordingly, Y Z oxidation leads to the formation of the positive charged pair Y • Z His190 + by moving the proton within the H bond (5–9). According to the “proton rocking” mechanism, this proton returns to Y Z on its reduction by the Mn 4 CaO 5 cluster. The transient formation of the positive charge in the immediate vi- cinity of the cluster may have a critical electrostatic effect in promoting proton transfer and/or H-bond rearrangements else- where in the WOC. Charge separation in the photochemical RC is a single- electron process, but it must be coupled with the four-electron oxidation: 2H 2 O→O 2 + 4e − + 4H + . PSII solves the valence mismatch problem by accumulating oxidizing equivalents within the Mn 4 CaO 5 cluster as deduced from early observations of period 4 oscillatory O 2 release under flash illumination (10) that led to the formulation of a model invoking storage (S) states consisting as four semistable states produced by flash illumina- tion (S 0 , S 1 , S 2 , and S 3 ) and a transient state (S 4 ) (11). O 2 for- mation and release occurs during the S 3 → S 0 transition, with a hypothetical intermediate S 4 that forms on oxidation of S 3 fol- lowed by the formation of O 2 and the reduction of Mn 4 CaO 5 by substrate H 2 O (11). Proton release to the lumen of the thyla- koids occurs at specific points during the catalytic cycle (re- viewed in ref. 12). Deprotonation minimizes the accumulation of positive charge on the Mn 4 CaO 5 cluster and provides a “redox leveling” effect that ensures that successive withdrawals of electrons from the metal center remain energetically feasible through all of the S states of the catalytic cycle. Detailed analyses have revealed an alternation of electron transfer and proton transfer events (13, 14), leading to the reformulation for the cycle, where the indices n and + refer to the electrostatically neutral and positive states, respectively, relative to the S 1 n state (Fig. 1D). Because of the paucity of identified reaction in- Significance The oxidation of water by photosystem II underpins autotrophic productivity in the Earth’s biosphere and represents a blueprint for developing sustainable, carbon-neutral technologies. Pres- ently, the crucial catalytic steps leading to O 2 formation remain obscure, although high-resolution kinetic and structural in- formation has led to discussion of possible chemical intermedi- ates. By genetically manipulating the inner surface polarity of a protein cavity holding a water cluster adjacent to the catalytic metal center, a previously unobserved intermediate is revealed. The results have implications for the understanding of the nat- ural mechanism as well as the highly desirable biomimetic de- vices currently envisioned of solar energy production. Author contributions: H.B. and R.L.B. designed research, performed research, analyzed data, and wrote the paper. The authors declare no conflict of interest. This article is a PNAS Direct Submission. 1 To whom correspondence should be addressed. Email: [email protected]. This article contains supporting information online at www.pnas.org/lookup/suppl/doi:10. 1073/pnas.1512008112/-/DCSupplemental. www.pnas.org/cgi/doi/10.1073/pnas.1512008112 PNAS | Published online October 27, 2015 | E6139–E6147 BIOPHYSICS AND COMPUTATIONAL BIOLOGY PNAS PLUS Downloaded by guest on March 4, 2020
Transcript of PNAS PLUS Structural rearrangements preceding …Structural rearrangements preceding dioxygen...

Structural rearrangements preceding dioxygenformation by the water oxidation complex ofphotosystem IIHan Bao and Robert L. Burnap1
Department of Microbiology and Molecular Genetics, Oklahoma State University, Stillwater, OK 74078
Edited by Pierre A. Joliot, Institut de Biologie Physico-Chimique, Paris, France, and approved September 29, 2015 (received for review June 19, 2015)
Photosynthetic water oxidation is catalyzed by the Mn4CaO5 clus-ter of photosystem II. Recent studies implicate an oxo bridge atom,O5, of the Mn4CaO5 cluster, as the “slowly exchanging” substratewater molecule. The D1-V185N mutant is in close vicinity of O5 andknown to extend the lag phase and retard the O2 release phase(slow phase) in this critical last S+3 →S0 transition of water oxida-tion. The pH dependence, hydrogen/deuterium (H/D) isotope ef-fect, and temperature dependence on the O2 release kinetics forthis mutant were studied using time-resolved O2 polarography,and comparisons were made with WT and two mutants of theputative proton gate D1-D61. Both kinetic phases in V185N areindependent of pH and buffer concentration and have weaker H/Dkinetic isotope effects. Each phase is characterized by a parallel oreven lower activation enthalpy but a less favorable activation en-tropy than the WT. The results indicate new rate-determining stepsfor both phases. It is concluded that the lag does not representinhibition of proton release but rather, slowing of a previouslyunrecognized kinetic phase involving a structural rearrangementor tautomerism of the S3
+ ground state as it approaches a config-uration conducive to dioxygen formation. The parallel impacts onboth the lag and O2 formation phases suggest a common origin forthe defects surmised to be perturbations of the H-bond networkand the water cluster adjacent to O5.
photosynthesis | water oxidation | oxygen release kinetics | photosystem II |activation energy
Oxygenic photosynthesis depends on the light-driven water-plastoquinone oxidoreductase, photosystem II (PSII), which
catalyzes the complete oxidation of H2O molecules to O2. Theelectrons extracted from H2O oxidation are the reductant forautotrophic metabolism, and the liberated protons contribute tothe transmembrane proton motive force powering ATP pro-duction (reviewed in refs. 1–4). The byproduct, O2, has trans-formed our Earth’s atmosphere and makes heterotrophic life inthe biosphere possible. A metal cluster, the Mn4CaO5, functionsas the catalytic site of H2O oxidation and is buried in a proteindomain of PSII referred to as the H2O oxidation complex(WOC). The primary photochemical electron donor of the reactioncenter (RC) complex is a dimeric chlorophyll moiety designatedP680 that is coordinated by the pseudosymmetrically arranged D1and D2 polypeptides. Together, the D1/D2 heterodimer are re-sponsible for the coordination of most of the photochemically activecofactors of the RC. Photoexcitation of P680 initiates transmem-brane charge separation with the activated electron moving toplastoquinone species, QA and QB, on the acceptor side of the RC.The resultant electron hole ðP+•
680Þ functions as the powerful oxidantfor the extraction of electrons from substrate H2O bound to theMn4CaO5 (Fig. 1A). However, the oxidation of the Mn4CaO5 oc-curs through a redox active tyrosyl of the D1 protein, D1-Tyr161(YZ), located between P680 and the metal cluster. Thus, YZ func-tions as a secondary donor to the photochemical RC and the pri-mary oxidant of the Mn4CaO5. Oxidation of YZ creates a neutraltyrosine radical Y•
Z because of a coupled proton transfer from thetyrosine to the nearby D1-His190, which is H-bonded to YZ.
Accordingly, YZ oxidation leads to the formation of the positivecharged pair Y•
Z His190+ by moving the proton within the H bond(5–9). According to the “proton rocking” mechanism, this protonreturns to YZ on its reduction by the Mn4CaO5 cluster. Thetransient formation of the positive charge in the immediate vi-cinity of the cluster may have a critical electrostatic effect inpromoting proton transfer and/or H-bond rearrangements else-where in the WOC.Charge separation in the photochemical RC is a single-
electron process, but it must be coupled with the four-electronoxidation: 2H2O→O2 + 4e− + 4H+. PSII solves the valencemismatch problem by accumulating oxidizing equivalents withinthe Mn4CaO5 cluster as deduced from early observations ofperiod 4 oscillatory O2 release under flash illumination (10) thatled to the formulation of a model invoking storage (S) statesconsisting as four semistable states produced by flash illumina-tion (S0, S1, S2, and S3) and a transient state (S4) (11). O2 for-mation and release occurs during the S3 → S0 transition, with ahypothetical intermediate S4 that forms on oxidation of S3 fol-lowed by the formation of O2 and the reduction of Mn4CaO5 bysubstrate H2O (11). Proton release to the lumen of the thyla-koids occurs at specific points during the catalytic cycle (re-viewed in ref. 12). Deprotonation minimizes the accumulation ofpositive charge on the Mn4CaO5 cluster and provides a “redoxleveling” effect that ensures that successive withdrawals ofelectrons from the metal center remain energetically feasiblethrough all of the S states of the catalytic cycle. Detailed analyseshave revealed an alternation of electron transfer and protontransfer events (13, 14), leading to the reformulation for thecycle, where the indices n and + refer to the electrostaticallyneutral and positive states, respectively, relative to the S1
n state(Fig. 1D). Because of the paucity of identified reaction in-
Significance
The oxidation of water by photosystem II underpins autotrophicproductivity in the Earth’s biosphere and represents a blueprintfor developing sustainable, carbon-neutral technologies. Pres-ently, the crucial catalytic steps leading to O2 formation remainobscure, although high-resolution kinetic and structural in-formation has led to discussion of possible chemical intermedi-ates. By genetically manipulating the inner surface polarity of aprotein cavity holding a water cluster adjacent to the catalyticmetal center, a previously unobserved intermediate is revealed.The results have implications for the understanding of the nat-ural mechanism as well as the highly desirable biomimetic de-vices currently envisioned of solar energy production.
Author contributions: H.B. and R.L.B. designed research, performed research, analyzeddata, and wrote the paper.
The authors declare no conflict of interest.
This article is a PNAS Direct Submission.1To whom correspondence should be addressed. Email: [email protected].
This article contains supporting information online at www.pnas.org/lookup/suppl/doi:10.1073/pnas.1512008112/-/DCSupplemental.
www.pnas.org/cgi/doi/10.1073/pnas.1512008112 PNAS | Published online October 27, 2015 | E6139–E6147
BIOPH
YSICSAND
COMPU
TATIONALBIOLO
GY
PNASPL
US
Dow
nloa
ded
by g
uest
on
Mar
ch 4
, 202
0

termediates in the S+3 → Sn0 transition, the mechanism of wateroxidation by PSII still remains elusive. In this step, the O-O bondis formed, O2 and two protons are released, and at one substrate,water binds to the Mn4CaO5 cluster. Possible intermediates inthis poorly understood final stage are depicted in Fig. 1C. A 30-to 250-μs lag phase preceding the release of O2 and the reductionof the Mn4CaO5 has been assigned to the release of a proton(step 2 in Fig. 1C) (5, 13–19). Step 3 in Fig. 1C refers to theoxidation of the Mn cluster by Y•
Z and has been observed toinitiate 250 μs after the excitation of the S3
+ ground state (18).The initiation of step 3 marks the end of the lag phase and leadsto formation of the transient and chemically undefined S4 state.It should be pointed out that the lag phase is multiphasic (13),and thus, step 2 and perhaps, step 3 in Fig. 1C consist of morethan one process—a point that is significant to the experimentsdescribed below. Mutational analysis (16, 20–23) and sub-stitution of the Ca2+ and Cl− cofactors (24) result in a slowdownsof the S+3 → Sn0 transition, including an increase in the duration ofthe lag phase. These slowdowns in the lag phase could be at-tributed to an impairment of proton release to the solvent bulk,but as shown in this work, they may be better ascribed to aslowdown of some other molecular rearrangement that precedes
the release of O2 and becomes rate-determining in the mutantsstudied here.As shown in Fig. 1A, the Mn4CaO5 cluster resembles a dis-
torted chair, where four oxygen atoms link the three Mn atomsand one Ca atom together by μ-oxo bridges to form the cuboidalunit. The fourth dangling Mn (Mn4) is located outside the cubeand linked to one of the Mn corners (Mn3) by a μ-oxo bridgeligation (O4) and a fifth bridging μ-oxo (O5) to the Ca (25, 26).The bonding arrangement of O5 is proposed to be flexible andconsequently, provides flexibility to the entire structure (27): TheS2
+ state may exist in two nearly isoenergetic configurations assuggested by the alternative EPR signals (27): a low-spin opencube, where O5 is bonded to Mn4 and not Mn1 as depicted inFig. 1A, or the high-spin, closed cube state, where O5 is bondedto Mn1 and not Mn4. The slowly exchanging substrate water isassigned to O5, and the envisioned structural flexibility wouldaccount for the unexpectedly fast rate of exchange of O5 withexternal water (28). The Mn4CaO5 cluster is ligated to the D1and CP43 subunits of PSII by six carboxylate ligands and onehistidine. Other than the first sphere ligands, the geometry of theMn4CaO5 cluster is also maintained by second sphere amino acidsand a number of water molecules situated in the cavity of the
Fig. 1. (A) Mutations constructed in Synechocystis sp. PCC6803 to D1 residue Val185 (rendered with yellow sticks) and Val185Asn substitution showing onepossible configuration of the amide extending into the water cavity H bonding (red dashes) with the water molecules (cyan spheres) close to oxo bridge atom,O5 (bright blue), of the Mn4CaO5 cluster. Rudimentary analysis of crystal structure with PyMol indicates multiple rotamer configurations of the asparagineside chain without steric clashes, except displacements of the water molecules. The amide moiety introduces four potential H-bonding sites: two acceptor(-C = O) and two donor (-NH2) sites. Other energetically feasible rotamers may interact with the essential chloride anion cofactor (Cl1; green). (B) A largeretardation of O2 release kinetics during S+3 → Sn0 was found in D1-V185N mutant (23), similar to D1-D61N and D1-D61A mutants (16, 20, 32). (C) Proposedintermediates after excitation of PSII in the S+3 Y
•Z state. Step 1: oxidation of YZ by P680+ forming S+3 Y
•Z. Step 2: loss of the proton forming Sn3Y
•Z. Step 3: reduction
of Y•Z/oxidation of the Mn cluster. Step 4: reduction of the cluster by oxidation of substrate. Step 5: O-O bond formation. Step 6: H2O binding and O2 release.
The S4 state. (D) Representation of the entire S-state cycle, emphasizing the alternating electron and proton removal from the cluster. Classic Kok S-statescorrespond to those shown in red outline.
E6140 | www.pnas.org/cgi/doi/10.1073/pnas.1512008112 Bao and Burnap
Dow
nloa
ded
by g
uest
on
Mar
ch 4
, 202
0

catalytic site. Water molecules not only are substrate but also,participate in a reticulated H-bond network (HBN), interactingthe first and second sphere ligands of the Mn4CaO5 cluster andforming paths connecting the cluster with the external aqueousphase of the thylakoid lumen (reviewed in ref. 29). This HBNincludes the participation of second sphere ligand D1-Asp61,which may be the initial residue of a main proton egress pathwaythrough its interaction with a water molecule designated W1 (30).Recently, point mutations were generated to interfere with thewater molecules surrounding the Mn4CaO5 cluster by altering theshape and polarity of the protein surface facing the aqueouspockets (23). Mutations of a valine, D1-V185, exhibit the mostinteresting phenotypes. D1-Val185 is part of the broad channel,because it passes the Mn4CaO5 cluster and is in the close vicinityof O5 (31) (Fig. 1A). The D1-V185N mutation has a strong effecton the oxygen evolution. In contrast to the short lag (<250 μs) andshort half-lifetime of 1−2 ms of the S+3 → Sn0 transition in the WT,the mutant has a drastically prolonged lag phase followed by adrastically slowed rate of oxygen release (Fig. 1B; see below),which opens a new window for the study of the reaction pathwayduring the dioxygen-forming stage of the catalytic cycle. Here, wecarefully characterized the pH and temperature dependence anddeuterium isotope effect on the O2 release kinetics of the D1-V185N mutant and made comparison with the WT and D1-D61Nand D1-D61A mutants (16, 20, 32). The goal is to gain insight intothe nature of the elusive intermediates formed during the lag andO2 release phases of the S+3 → Sn0 transition.
ResultsThe O2 release kinetics associated with the S3 to S0 transition canbe monitored by measuring polarographic transients with a bareplatinum electrode resulting from flashes given to a thin film ofthylakoid membranes centrifugally deposited on the platinumsurface. The bare platinum electrode allows very high time res-olution measurements of O2 evolution by PSII under flashinglight. The polarographic transient generated after flash illu-mination features an initial lag phase followed by a sigmoidal riseto a maximum value (slow phase) and a slow decay toward thepreflash level. Quantitative description of the kinetics of O2 evo-lution was facilitated by implementation of a physical model (16,33) that takes into account the production of O2 from PSII, thediffusive processes governing the concentration of O2 at theplatinum electrode surface, and the electrode reaction consumingO2 at that surface. Because the occurrence of a lag phase beforethe onset of the rise of the O2 signal has been observed, mostnotably in the mutant, the O2 production terms of the kineticmodel include an intermediate, designated I for the sake of gen-erality (Scheme 1):
S3 !k1 I !k2 S0 +O2.
The model used for fitting the O2 release curves divides thevolume of the deposited PSII sample and the buffer above it intolayers. The simulated lines and parameters of the O2 releasesignals are indicated in Fig. S1 and Table S1. The signal from theoxygen electrode is proportional to the O2 concentration in thelowest layer in contact with the surface of the electrode. Eq. 1is used to calculate the concentration of O2 in the bottom layer(x = 0) of the thylakoid membrane sample at each time point t.Rel refers to the rate constant of O2 consumed by the electrode.D represents the value of the O2 diffusion constant. The delay inthe rise of the electrode signal is described by the rate constantk1 and an additional time offset (toffset in Eq. 1); toffset and k1(sigmoidal rise) are used to simulate the overall delay resultingfrom both the O2 reduction reaction at the electrode and delayedO2 production in PSII (additional discussion of the O2 release
model is in SI Materials and Methods). The overall delay is re-ferred to as lag phase or lag hereafter:
½O2�tx=0 = ½O2�t−Δtx=0 +�½O2�t−Δtx=1 − ½O2�t−Δtx=0
��DΔx
�2
Δt+k1k2
k1 − k2
�S03�
×he−k2ðt−toffsetÞ − e−k1ðt−toffsetÞ
iΔt −Rel½O2�t−Δtx=0 Δx.
[1]
pH Dependence of O2 Release Kinetics on S+3 → Sn0. It was recentlyshown that the D1-V185N mutant (23), similar to D1-D61 mu-tations (D61N and D61A), displays a large retardation of thekinetics of O2 release during the S+3 → Sn0 (16, 20, 32). Comparedwith the WT, D1-V185N exhibits an extension of lag phase and aslowdown of the slow phase (Figs. 1 and 2). The lag phase is ofparticular interest, because it has been ascribed to a proton re-lease event on formation of S+3 Y
•Z in the WT PSII (step 2 in Fig.
1C) (5–9). In spinach WT preparations, the lag phase is extendedat low pH and by D2O substitution, indicating a deprotonationof the Mn complex after Y•
Z formation but before the onsetof electron transfer and O-O bond formation (13, 14, 19). Toidentify the nature of the unusually long period of lag in theD1-V185N, the kinetics of O2 evolution were recorded under arange of pH conditions (Fig. 2). The pH effect was investigatedat room temperature (27 °C) and for the WT, lower temperature(6 °C). At room temperature, the lag phase of the WT is too fastto be sufficiently resolved for analysis of its pH dependence inour polarographic system (Fig. S2). By lowering temperature, theperiod of lag in the WT is significantly extended, allowing betterdiscrimination of the differences in the lag phase as a function ofpH. We observed a pronounced pH dependence of the lag-phaseduration in the WT at 6 °C (Fig. 2A). The effects of pH on timeconstants of the lag and slow phases, which were determined bycurve fitting of O2 release transients at different pH regimes, aresummarized in Table 1 (details of curve fitting are in SI Materialsand Methods and ref. 16). It shows that the period of lag of the
Fig. 2. O2 release kinetics of (A) WT, (B) D1-V185N, (C) D1-D61N, and(D) D1-D61A thylakoid membranes measured at pH 5.0 (red), 6.5 (black), and7.5 (blue). The O2 release transients shown are the averages of six trials. Eachtrial is the averaged polarographic signal resulting from 240 successiveflashes from a red light-emitting diode, excluding the first 3 initial flashes.The measurements were taken at (A) 6 °C and (B–D) 27 °C.
Bao and Burnap PNAS | Published online October 27, 2015 | E6141
BIOPH
YSICSAND
COMPU
TATIONALBIOLO
GY
PNASPL
US
Dow
nloa
ded
by g
uest
on
Mar
ch 4
, 202
0
WT detected at low temperature (6 °C) increases from 1.8 to 2.7ms by lowering pH from 7.5 to 5.0. This strong pH dependenceof the lag is consistent with earlier observations with spinachpreparations indicating that the higher [H+] creates a proton“back-pressure,” limiting the rate of a requisite deprotonation(13, 14, 19). In contrast, the lag-phase duration of 1.4 ms in D1-V185N is pH-independent and much longer than the WT asshown in Fig. 2 and Table 1. Additional evidence for the pHindependence of the mutant is the absence of a buffer concen-tration effect on the kinetics (Fig. S3). Taken together, the re-sults indicate that the lag phase of D1-V185N is not rate limitedby proton transfer processes and that there is no H+ productback-pressure effect on the lag phase in D1-V185N in contrast tothe WT. Of course, rate-limiting internal proton transfer that isnot affected by external pH cannot be ruled out.D1-D61 is a residue that is located at the beginning of a
proposed proton exit pathway in PSII and proposed to facilitateproton release from WOC (Fig. 1A). To make a comparison withV185N, the pH dependence of lag phase in D1-D61N and D1-D61A mutants was also investigated. D1-D61N is a well-studiedmutant that has been found to have long lag and slow O2 releasekinetics similar to D1-V185N (20, 23, 32). The lag time in D1-D61N at pH 6.5 is 1.2 ms, which is shorter than the 1.4 ms of lagin D1-V185N. However, unlike the pH-independent lag ofV185N, the lag of D61N became much longer at both high andlow pH compared with pH 6.5 (Fig. 2C and Table 1) as observedpreviously (16). In contrast, the pH dependence of the lag phasein D61A has a similar trend as the WT, albeit that the lag is
greatly extended in comparison. The different pH-dependentbehavior of the lag phase between D61N and D61A suggests thatthe asparagine and alanine substitutions perturb the proton re-lease mechanism differently. This difference may relate to thefact that the asparagine substitution retains both H-bond donorand acceptor functionality but lacks proton exchange capability.In contrast, the alanine substitution is incapable of offering polarinteractions, but its smaller size may allow water to intercede atthat location and provide a channel to communicate protons.Interestingly, similar pH dependence trends occur for the slow-phase kinetics (steps 3–6 in Fig. 1C) as with the lag phases foreach of the PSII variants. For the WT, the slow phase, like thelag phase, has a strong pH dependence (Fig. 2A, Table 1, andFig. S2), which is more clearly evident in the low-temperature(6 °C) experiment. In contrast, no pH dependence of slow phaseis observed in D1-V185N as observed for the lag. The D1-D61Nand D1-D61A mutants also exhibited pH dependencies thatmirrored the pH effects on their lag phases: more alkaline pHvalues favored faster O2 kinetics for D1-D61A, whereas a non-linear response was obtained for D1-D61N.
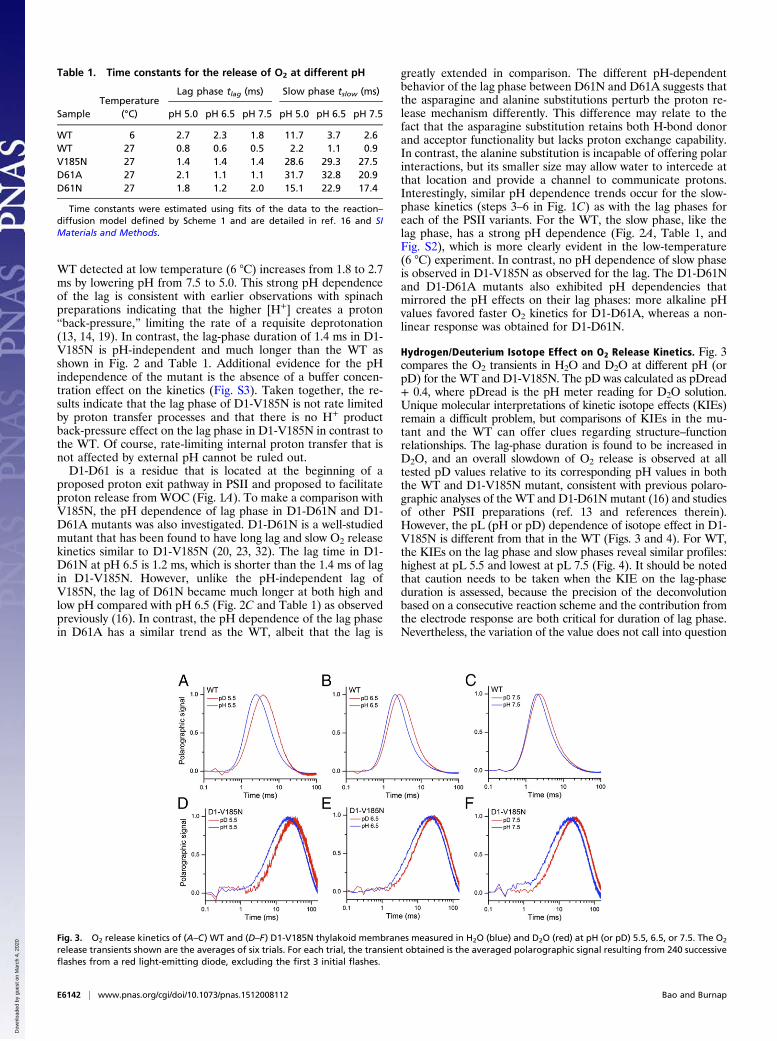
Hydrogen/Deuterium Isotope Effect on O2 Release Kinetics. Fig. 3compares the O2 transients in H2O and D2O at different pH (orpD) for the WT and D1-V185N. The pD was calculated as pDread+ 0.4, where pDread is the pH meter reading for D2O solution.Unique molecular interpretations of kinetic isotope effects (KIEs)remain a difficult problem, but comparisons of KIEs in the mu-tant and the WT can offer clues regarding structure–functionrelationships. The lag-phase duration is found to be increased inD2O, and an overall slowdown of O2 release is observed at alltested pD values relative to its corresponding pH values in boththe WT and D1-V185N mutant, consistent with previous polaro-graphic analyses of the WT and D1-D61N mutant (16) and studiesof other PSII preparations (ref. 13 and references therein).However, the pL (pH or pD) dependence of isotope effect in D1-V185N is different from that in the WT (Figs. 3 and 4). For WT,the KIEs on the lag phase and slow phases reveal similar profiles:highest at pL 5.5 and lowest at pL 7.5 (Fig. 4). It should be notedthat caution needs to be taken when the KIE on the lag-phaseduration is assessed, because the precision of the deconvolutionbased on a consecutive reaction scheme and the contribution fromthe electrode response are both critical for duration of lag phase.Nevertheless, the variation of the value does not call into question
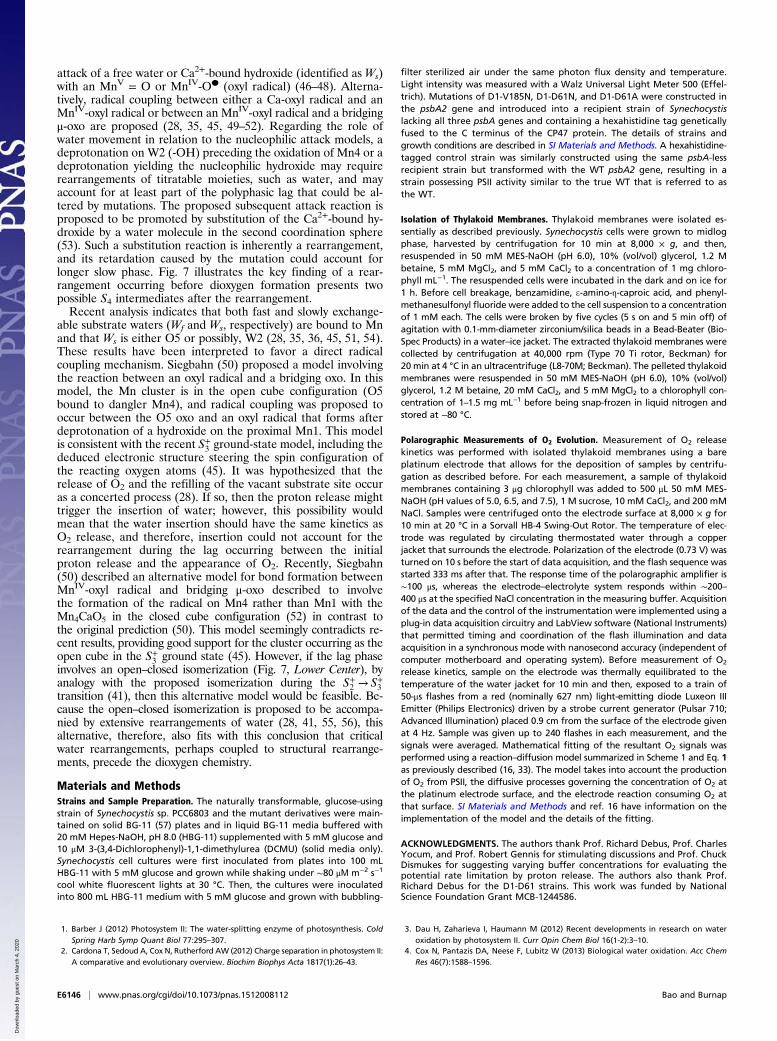
Table 1. Time constants for the release of O2 at different pH
SampleTemperature
(°C)
Lag phase tlag (ms) Slow phase tslow (ms)
pH 5.0 pH 6.5 pH 7.5 pH 5.0 pH 6.5 pH 7.5
WT 6 2.7 2.3 1.8 11.7 3.7 2.6WT 27 0.8 0.6 0.5 2.2 1.1 0.9V185N 27 1.4 1.4 1.4 28.6 29.3 27.5D61A 27 2.1 1.1 1.1 31.7 32.8 20.9D61N 27 1.8 1.2 2.0 15.1 22.9 17.4
Time constants were estimated using fits of the data to the reaction–diffusion model defined by Scheme 1 and are detailed in ref. 16 and SIMaterials and Methods.
Fig. 3. O2 release kinetics of (A–C) WT and (D–F) D1-V185N thylakoid membranes measured in H2O (blue) and D2O (red) at pH (or pD) 5.5, 6.5, or 7.5. The O2
release transients shown are the averages of six trials. For each trial, the transient obtained is the averaged polarographic signal resulting from 240 successiveflashes from a red light-emitting diode, excluding the first 3 initial flashes.
E6142 | www.pnas.org/cgi/doi/10.1073/pnas.1512008112 Bao and Burnap
Dow
nloa
ded
by g
uest
on
Mar
ch 4
, 202
0

the pH dependence of the isotope effect on the lag. This pLdependence of the WT suggests that a titratable group(s) with apKa < pH 6 needs to be deprotonated to accept rate-determiningprotons from the WOC and that the protonation of this grouppresents the higher KIE (∼2.4). At higher pH values, this grouptends to its deprotonated state, and the correspondingly lowerKIE likely reflects the switch of rate limitation by a differentprocess (Fig. 4). Indeed, for pL 7.5, the deuterium KIE of the lagphase in the WT disappears so that another process, perhaps achemical process or structural rearrangement, governs the lagperiod at higher pH. This KIE is also the case for the slow phase inthe WT, where a chemical or structural rearrangement step gov-erns the rate of the O2 release phase at higher pH. In contrast,both the lag and slow phases in D1-V185N have almost constantKIEs of ∼1.4 and ∼1.2, respectively, because pL is varied (Fig. 4).In principal, KIEs in this range can reflect proton transfer throughwater (34), but the absence of a pH dependence, as shown in theprevious section, argues against this possibility, at least as far as itbeing a communication of the proton to the exterior of the pro-tein. However, the rate of proton transfer through water is itselfgoverned by rotational rearrangements of water, and this conclu-sion is the basis for the estimated KIE of 1.4 (34). Therefore, theobserved KIEs for these kinetic phases in the mutant could moresimply reflect rearrangements of water. This interpretation wouldbe consistent with the analysis of the thermal activation parame-ters, indicating changes in the entropic term of the activationenergy described below. Moreover, the fact that both the lag andslow phases have similar pH dependence trends and similarlychanged KIE characteristics suggests that the lag and slow phases(step 2 and steps 3–6, respectively, in Fig. 1C) may have similarlyperturbed mechanistic features.
Temperature Dependence of O2 Release Kinetics: Change of Rate-Determining Step During Dioxygen Formation in D1-Val185Asn. Toevaluate the thermal activation characteristics of the S+3 → Sn0transition in the mutants, the temperature dependence of the O2release kinetics was studied. The polarographic transients werecollected over a range of temperatures from 3 °C to 33 °C. Fig. 5Ashows that the lag time and half-rise time of polarographictransient gradually increase as temperature falls in the WT andD1-V185N (Fig. S4 shows D61N and D61A mutants). Arrheniusplots of the lag phase yielded an activation energy (Ea) of 31.0 kJ/mol in the WT, which is consistent with previous results (20).Correspondingly, the preexponential frequency factor, A0, for thelag in theWT was estimated as 3.2 × 10⁸ s−1 (Fig. 6A and Table 2),with the caveat that the relatively narrow range of feasible ex-perimental temperatures limits the accuracy of the frequencyfactor coefficient estimate and thus, the estimate of the entropy ofactivation, ΔSǂ, discussed below. The activation energy of the lagof V185N (30.0 kJ/mol) is similar to that of the WT, whereas thefrequency factor of V185N (7.0 × 10⁷ s−1) is lower than the WT,accounting for the fact that, despite the similar activation energy,the approach of the reaction coordinates to the transition state
occurs much less frequently and hence, the reaction proceeds at alower rate. In general, the frequency factor (A0) of the Arrheniusequation reflects the nature of the rate-limiting process. The lowerfrequency factor in the D1-V185N suggests that the amino acidsubstitution changes the rate-determining step (RDS) governingthe lag phase (step 2 in Fig. 1C). The lower activation energies andfrequency factors were also observed in D61 mutants. The mostsignificant difference in activation energy was obtained in D61A,which has no H-bonding capacity, because a carboxyl is replacedby a methyl group. Here, the energy barrier is only 16.7 kJ/mol,and the frequency is three magnitudes lower than the WT, againsuggesting a new RDS. This activation energy is slightly greaterthan the energy of pure diffusion controlled process (13 kJ/mol).The Arrhenius plot of rate constant of slow phase (kox) is shown
in Fig. 6B, and the derived activation parameters are listed inTable 3. Over the temperature range from 3 °C to 33 °C, the datafit with a straight line yield an activation energy of 45.8 kJ/mol forthe WT, which is in good agreement with previous reports (ref. 20and references therein). Surprisingly, the activation energy forD1-V185N is only 22.3 kJ/mol, which is only one-half that of theWT. However, the corresponding frequency factor of 1.9 × 10⁵ isfive orders of magnitude lower than the WT, accounting for thelarge decrease in the rate of O2 formation. The lower frequencyfactor in the D1-V185N suggests that the amino acid substitutionresults in the change in RDS during one of the steps associatedwith Mn rereduction, dioxygen redox chemistry, and water in-sertion (step 4 in Fig. 1C). The corresponding Eyring treatment(Tables 2 and 3 and Fig. S5) indicates that the new rate limitationin D1-V185N is characterized by a lower activation enthalpy (ΔHǂ)and a much less favorable entropy of activation (ΔSǂ). For both ofthe D1-D61 mutants, the retardation in the O2 release phase is alsolargely because of less favorable ΔSǂ, suggesting that the muta-tional defects impose a greater requirement to reorganize the re-actants to achieve the optimal reaction configuration similar to theD1-V185N mutant.
DiscussionIn previous work, mutations designed to perturb the aqueouschannels surrounding the Mn4CaO5 of PSII were described (23).Among these, mutations at the hydrophobic D1-V185 located inthe proximity of O5, a strong candidate for the slowly exchangingsubstrate water (Ws) (35, 36), proved to have the most dramaticeffects on the catalytic properties of the Mn4CaO5. The bulkyphenyalanine substitution (D1-V185F) permitted assembly of Mnclusters that could advance at least to the S+2 state but were oth-erwise inactive with respect to O2 evolution. The asparaginesubstitution (D1-V185N), further studied here, exhibited dramaticslowdowns of both the lag phase and the O2 release phase of theS+3 → Sn0 transition. These observations are reminiscent of muta-tions at nearby D1-D61, which also greatly retard both kineticphases (16, 20, 32). From a structural perspective, both D61and V185 interact with a cluster of water, including W1, W2, W3,and W4 that form an HBN connecting the polar atoms of YZ, Cl
−,
Fig. 4. KIE of (A) the lag phase and (B) the slow phase as a function of pL(pH or pD) for WT (black square) and V185N (red circles).
Fig. 5. Normalized oxygen release kinetics of (A) WT and (B) V185N undervarious temperatures over the range from 3 °C to 33 °C.
Bao and Burnap PNAS | Published online October 27, 2015 | E6143
BIOPH
YSICSAND
COMPU
TATIONALBIOLO
GY
PNASPL
US
Dow
nloa
ded
by g
uest
on
Mar
ch 4
, 202
0

and the atoms Mn4, Ca, and O5 of the Mn4CaO5 (Fig. 1). Becausethe carboxyl group of D1-D61 very likely mediates the egress ofprotons from the Mn4CaO5, it is reasonable to suppose that D1-V185N also interferes with proton release during the S+3 → Sn0transition. However, this slowdown of the S+3 → Sn0 transitionproved to have characteristics suggesting a more complex molec-ular rearrangement, perhaps including but not limited toproton movement.
pH-Independent Lag Phase in V185N. Little is known of the site oforigin and the egress pathway of the released proton, althoughan extensive HBN connected with the D1-D61 is proposed to beinvolved (16, 29, 30, 37, 38). Computational analyses suggest thatan H bond-mediated proton donation to the D1-D61 carboxylatefrom W1, one of two waters coordinated with dangler Mn4,occurs on oxidation of the WOC in the higher S states (39–41).The fact that mutations of D1-D61 produce large extension ofthe lag is consistent with the idea that this carboxylate mediates arate-limiting proton release during S+3 Y
•Z → Sn3Y
•Z through this
residue. However, a similarly protracted lag phase exists in theD1-V185N mutant, and its duration is insensitive to both pH andbuffer concentration (Fig. 2, Fig. S3, and Table 1). Likewise, theO2 release phase is only weakly dependent on pH and inde-pendent of buffer concentration. This pH independence inD1-V185N contrasts with the WT, where we were able to con-firm previous results (13, 19), indicating that low pH creates, ineffect, a proton back-pressure that becomes rate-limiting for theS+3 → Sn0 transition. Therefore, the long lag in the D1-V185Nmutant is caused by another RDS that may be distinct fromproton transfer per se. Two possibilities could account for this:option i is that proton release from the WOC to the bulk phaseremains fast but that another process, such as a molecularrearrangement within the WOC, becomes rate-limiting, andoption ii is that the proton is transferred within PSII but notreleased to solution. In this case, transfer is scarcely affected bypH of bulk phase because of its isolation within the PSII. Bothoptions are consistent with the altered thermal activation prop-erties that clearly indicate an alternative RDS (Fig. 6 and Table2). However, these two possibilities are not mutually exclusive: ifa mutationally impaired molecular rearrangement involves therepositioning of water molecules (or another titratable group),then the hindered repositioning could impair an internal protontransfer. The results of the hydrogen/deuterium (H/D) KIE isotopeexperiments (Figs. 4 and 5) shed light on the nature of the defect andpoint to the impaired movement of water as the origin of the defect inthe lag phase. The monotonic KIE of 1.4 across the range of pL forthe lag phase is exactly the value anticipated for either a protontransfer process or a process that depends on the reorganization of
water molecules (34). Although the proton transfer per se also hasan expected KIE of 1.4, actual proton transfers occur in the pi-cosecond time domain, and it is the slower rearrangement of waterthat limits the formation of productive Grotthuss proton con-duction pathways where mobile water is involved (34). Becausethe asparagine is not titratable, it is unlikely that it competes withtitratable groups along the native proton transfer pathway.Moreover, the slowdown seems dominated by an entropic penalty(Fig. 6 and Table 2). Therefore, it is more likely that the mutationalters the HBN in a manner that disturbs the organization of watermolecules and thereby, imposes a kinetic requirement for a moredrastic rearrangement of the water and possibly, other moietiesto enable proton transfer (or proton tautomerization within theWOC). This proposal is represented schematically in Fig. 7. Thisinterpretation is consistent with findings that the S+3 → Sn3 transi-tion is multiphasic, even in the WT, although the additional ki-netic phases remain to be defined and could involve secondarymovements of protons (ref. 13 and references therein).
Perturbations in the Water Cluster Underlie the Mutational Slowdownsof Both Phases of S+3 → Sn0 Transition. If a structural rearrangementinvolving water movement becomes the new RDS governing thelag phase in D1-V185N, how does the mutation affect both the lagand slow phases in a seemingly correlated fashion? In other words,as with other cases where chemical or mutational alteration resultsin the slowdown of the S+3 → Sn3 transition, it is not just the lagphase or just the slow phase that is affected, but it is both that areretarded (16, 20, 42). Other than reinforcing the above conclu-sions on the imposition of a new RDS involving rearrangement ofwater in the lag phase, the thermal activation experiments areconsistent with the pH and KIE experiments in revealing that thelag and slow phases share similar defects as a result of the mu-tations. Remarkably, the activation enthalpy barrier, ΔHǂ, for thelag is virtually unchanged compared with the WT (both ∼28 kJmol−1) and is actually lower for the slow phase, where ΔHǂ is one-half the WT value (20 vs. 44 kJ mol−1). Instead, the slowdowns ofboth the lag and slow phases of the S+3 → Sn3 transition are becauseof less favorable entropies of activation, ΔSǂ (Tables 2 and 3).These trends also apply to the D1-D61 mutants, although subtledifferences exist as briefly discussed below. These increased en-tropic penalties can be interpreted to mean that the mutationalslowdowns (lag and slow phases) result from the additional timerequired for the reactants to reorganize to realize the optimaltransition-state configuration(s). We imagine that the mutationcreates a nonoptimal S+3 ground-state configuration of reactantsthat imposes a slower reorganization step required to reach thetransition states on each of these phases and that this correspondsto the less favorable entropy of reaction, ΔS‡. Accordingly, themutation results in an altered S+3 ground state, where the reactantsare misconfigured and must reorganize to reach the transitionstate required for passage through the lag phase. Likewise, a similarreorganization penalty is imposed in D1-V185N to reach thetransition state required for passage through the O2-forming phase.Analogous alterations of the thermal activation characteristics have
Fig. 6. Arrhenius plots for (A) the lag phase and (B) the slow phase of O2
release in WT (black) and mutants D1-V185N (red), D1-D61N (blue), and D1-D61A (pink). The symbols correspond to experimental data, and the dashedlines are obtained from linear fits of these points. Rate vs. temperature dataare plotted as ln k= lnA0 − Ea=RT. Ln is the natural logarithm of both sides ofArrhenius’ equation, where k is the estimated rate constant, A0 is the pre-exponential “frequency factor” term, and Ea is the activation energyobtained from the y intercept and slope.
Table 2. Kinetic parameters of the lag phase for WT and mutantthylakoid membranes
Ea (kJ·mol−1) A (s−1) tlag* (ms)ΔSǂ
(J·mol−1 K−1)ΔHǂ
(kJ·mol−1)
WT 31.0 3.2 × 10⁸ 0.6 −89.9 28.7V185N 30.0 7.0 × 10⁷ 1.4 −101.5 27.9D61N 24.1 9.0 × 10⁶ 1.2 −120.3 21.5D61A 16.7 4.9 × 10⁵ 1.1 −144.1 14.3
The uncertainties in the activation energies are of the order of ±1.*The values for the individual time constants are measured at 27 °C.
E6144 | www.pnas.org/cgi/doi/10.1073/pnas.1512008112 Bao and Burnap
Dow
nloa
ded
by g
uest
on
Mar
ch 4
, 202
0

been observed in other enzyme systems. For example, certain mu-tations of β-gal reduce catalytic rates because of a conformationalperturbation affecting the active site that causes the appearance of anew RDS (43). In that case, the effects of the mutation were re-versed by the binding of an antibody that stabilizes the nativeconformation of the enzyme. In the absence of antibody, the mutantenzyme was characterized by a decrease in the preexponential termof the Arrhenius equation and a correspondingly less favorable ΔSǂ,which is interpreted to indicate that the enzyme (without antibody)may pass through a larger spectrum of conformation states beforearriving at the transition-state configuration. The stimulatory effectof the antibody is caused by a narrowing of this spectrum of ac-cessible conformational states and allows the antibody-constrainedenzyme to find the transition state more quickly, because it samples asmaller conformation space. However, the best comparison is withaltered forms of PSII itself: the substitution of Ca2+ with quasifunc-tional Sr2+ slows both phases of the S+3 → Sn0 transition because ofa decrease in ΔS‡, albeit to different extents for the fast and slowphases compared with D1-V185N (42). It was argued that there aredifferences between coordination geometry and chemistry betweenCa2+ and Sr2+ with respect to a less favorable ΔSǂ of the dissoci-ation of coordinated H2O. It was proposed that the slowdownsreflect the less favorable entropic term associated with delivery ofH2O from Sr2+ (rather than Ca2+) to one of the Mn atoms ofthe cluster. In the case of the D1-V185N mutation, an alteration inthe structure of the water cluster is a distinct possibility, because themutation introduces a strong H-bonding moiety in a place where
there was none. Interestingly, the Sr2+/Br−-substituted PSII sam-ples seem to retain rapid proton release (supplemental figure 8 inref. 36), despite longer lag and slower release phases measuredpolarographically (24). By analogy, we might expect proton re-lease to be rapid on Y•
Z His190+ formation in D1-V185N butthat the protracted lag corresponds to another process, suchas the movement of water and a corresponding rearrangementof the HBN. This interpretation is consistent with the conclu-sion that the mutation imposes new RDSs for both the lag andO2 release phases.
Effects of D1-D61 Mutations Distinct from D1-V185N.Despite outwardsimilarities in slowing down of the lag and O2 release phases of theS+3 → Sn0 transition, the D1-D61 mutations proved to be distinctfrom the D1-V185N mutant with respect to their pH and thermalactivation characteristics (Tables 1–3). Unlike the D1-V185Nmutation, where the enthalpy of activation for the lag phase is virtuallyunchanged, theΔHǂ values for both D1-D61 mutants are significantlydecreased compared with the WT, with the replacement ofthe carboxyl group with a methyl group in D1-D61A being the mostdecreased. Molecular simulations suggest that the D1-D61 carboxylmay adopt different conformations and different H-bonding inter-actions/protonation states that may relate to the proposed role asa mediator of proton efflux (39, 44), and FTIR studies using theD1-D61A mutant are consistent with these predictions (29).Therefore, we tentatively assign the decrease in the ΔHǂ values inthe D1-D61 mutants as reflecting the loss of bonding interactions ofthe carboxyl group that must normally be broken during the lagphase. This assignment is consistent with D1-D61 acting as a gatethat involves proton transfer and provides directionality by adoptingdifferent H-bond and ionic configurations with adjacent groupsdepending on the state of the enzyme (44).
Implications for the Mechanism of O2 Formation. The S3 groundstate (S+3 YZ) seems to exist with four Mn ions in the IV oxidationstate, each having octahedral local geometry, and the O5 oxobonded to Mn4, which puts the overall arrangement of theMn4CaO5 as being in the “open cube” configuration, structurallyanalogous to the S2
+ low-spin conformational isomer (45). Pres-ently, there are two classes of dioxygen formation mechanismsthat are most actively discussed: models involving nucleophilic
Fig. 7. Representative models for the S+3Y•Z → Sn0 transition, accounting for the deduced structural rearrangement occurring before dioxygen formation. The
nature of the rearrangement affected by the mutations remains to be defined chemically and may include a structural isomerization and/or a proton tau-tomerization likely involving the movement of water molecules (in the text). The structure in Left represents the recently deduced S3
+ structure (45) imme-diately after oxidation of YZ and highlights bridging oxo, O5, that is close to the site of the D1-V185N mutation. Two alternative mechanisms involving either(Upper Center) nucleophilic attack or (Lower Center) radical coupling are shown for the formation of the transient S4 state. Please note that there are anumber of proposed O-O bond formation trajectories for either the nucleophilic attack model (46–48) or radical coupling model (28, 35, 45, 49–52). Experi-mental evidence for an S4 intermediate state is not yet available, and possibilities include the limiting cases of a metal-centered MnV ≡ O intermediate speciesor a ligand-centered oxidation intermediate as an MnIV-O● radical. Similarly, there have been multiple radical coupling type mechanisms proposed between O5and an Mn-O radical species involving either an open or closed cubane structure (28, 50, 52, 54). The binding of at least one H2O molecule during Sn3 → Sn0 issuggested by water exchange experiments (36), and impeded movement could account for the slowdown in the O2 release phase of the S+3 → Sn0 transition.
Table 3. Kinetic parameters of O2 release (slow phase) for WTand mutant thylakoid membranes
Ea (kJ·mol−1) A (s−1) tslow* (ms)ΔSǂ
(J·mol−1 K−1)ΔHǂ
(kJ·mol−1)
WT 45.8 5.2 × 10¹⁰ 1.1 −47.1 43.7V185N 22.3 1.9 × 10⁵ 29.3 −150.9 20.1D61N 44.2 1.5 × 10⁹ 22.9 −77.4 41.8D61A 35.3 3.3 × 10⁷ 32.8 −109.2 32.9
The uncertainties in the activation energies are of the order of ±2.*The values for the individual time constants are measured at 27 °C.
Bao and Burnap PNAS | Published online October 27, 2015 | E6145
BIOPH
YSICSAND
COMPU
TATIONALBIOLO
GY
PNASPL
US
Dow
nloa
ded
by g
uest
on
Mar
ch 4
, 202
0
attack of a free water or Ca2+-bound hydroxide (identified as Ws)with an MnV = O or MnIV-O● (oxyl radical) (46–48). Alterna-tively, radical coupling between either a Ca-oxyl radical and anMnIV-oxyl radical or between an MnIV-oxyl radical and a bridgingμ-oxo are proposed (28, 35, 45, 49–52). Regarding the role ofwater movement in relation to the nucleophilic attack models, adeprotonation on W2 (-OH) preceding the oxidation of Mn4 or adeprotonation yielding the nucleophilic hydroxide may requirerearrangements of titratable moieties, such as water, and mayaccount for at least part of the polyphasic lag that could be al-tered by mutations. The proposed subsequent attack reaction isproposed to be promoted by substitution of the Ca2+-bound hy-droxide by a water molecule in the second coordination sphere(53). Such a substitution reaction is inherently a rearrangement,and its retardation caused by the mutation could account forlonger slow phase. Fig. 7 illustrates the key finding of a rear-rangement occurring before dioxygen formation presents twopossible S4 intermediates after the rearrangement.Recent analysis indicates that both fast and slowly exchange-
able substrate waters (Wf and Ws, respectively) are bound to Mnand that Ws is either O5 or possibly, W2 (28, 35, 36, 45, 51, 54).These results have been interpreted to favor a direct radicalcoupling mechanism. Siegbahn (50) proposed a model involvingthe reaction between an oxyl radical and a bridging oxo. In thismodel, the Mn cluster is in the open cube configuration (O5bound to dangler Mn4), and radical coupling was proposed tooccur between the O5 oxo and an oxyl radical that forms afterdeprotonation of a hydroxide on the proximal Mn1. This modelis consistent with the recent S+3 ground-state model, including thededuced electronic structure steering the spin configuration ofthe reacting oxygen atoms (45). It was hypothesized that therelease of O2 and the refilling of the vacant substrate site occuras a concerted process (28). If so, then the proton release mighttrigger the insertion of water; however, this possibility wouldmean that the water insertion should have the same kinetics asO2 release, and therefore, insertion could not account for therearrangement during the lag occurring between the initialproton release and the appearance of O2. Recently, Siegbahn(50) described an alternative model for bond formation betweenMnIV-oxyl radical and bridging μ-oxo described to involvethe formation of the radical on Mn4 rather than Mn1 with theMn4CaO5 in the closed cube configuration (52) in contrast tothe original prediction (50). This model seemingly contradicts re-cent results, providing good support for the cluster occurring as theopen cube in the S+3 ground state (45). However, if the lag phaseinvolves an open–closed isomerization (Fig. 7, Lower Center), byanalogy with the proposed isomerization during the S+2 → S+3transition (41), then this alternative model would be feasible. Be-cause the open–closed isomerization is proposed to be accompa-nied by extensive rearrangements of water (28, 41, 55, 56), thisalternative, therefore, also fits with this conclusion that criticalwater rearrangements, perhaps coupled to structural rearrange-ments, precede the dioxygen chemistry.
Materials and MethodsStrains and Sample Preparation. The naturally transformable, glucose-usingstrain of Synechocystis sp. PCC6803 and the mutant derivatives were main-tained on solid BG-11 (57) plates and in liquid BG-11 media buffered with20 mM Hepes-NaOH, pH 8.0 (HBG-11) supplemented with 5 mM glucose and10 μM 3-(3,4-Dichlorophenyl)-1,1-dimethylurea (DCMU) (solid media only).Synechocystis cell cultures were first inoculated from plates into 100 mLHBG-11 with 5 mM glucose and grown while shaking under ∼80 μΜ m−2 s−1
cool white fluorescent lights at 30 °C. Then, the cultures were inoculatedinto 800 mL HBG-11 medium with 5 mM glucose and grown with bubbling-
filter sterilized air under the same photon flux density and temperature.Light intensity was measured with a Walz Universal Light Meter 500 (Effel-trich). Mutations of D1-V185N, D1-D61N, and D1-D61A were constructed inthe psbA2 gene and introduced into a recipient strain of Synechocystislacking all three psbA genes and containing a hexahistidine tag geneticallyfused to the C terminus of the CP47 protein. The details of strains andgrowth conditions are described in SI Materials and Methods. A hexahistidine-tagged control strain was similarly constructed using the same psbA-lessrecipient strain but transformed with the WT psbA2 gene, resulting in astrain possessing PSII activity similar to the true WT that is referred to asthe WT.
Isolation of Thylakoid Membranes. Thylakoid membranes were isolated es-sentially as described previously. Synechocystis cells were grown to midlogphase, harvested by centrifugation for 10 min at 8,000 × g, and then,resuspended in 50 mM MES-NaOH (pH 6.0), 10% (vol/vol) glycerol, 1.2 Mbetaine, 5 mM MgCl2, and 5 mM CaCl2 to a concentration of 1 mg chloro-phyll mL−1. The resuspended cells were incubated in the dark and on ice for1 h. Before cell breakage, benzamidine, e-amino-η-caproic acid, and phenyl-methanesulfonyl fluoride were added to the cell suspension to a concentrationof 1 mM each. The cells were broken by five cycles (5 s on and 5 min off) ofagitation with 0.1-mm-diameter zirconium/silica beads in a Bead-Beater (Bio-Spec Products) in a water–ice jacket. The extracted thylakoid membranes werecollected by centrifugation at 40,000 rpm (Type 70 Ti rotor, Beckman) for20 min at 4 °C in an ultracentrifuge (L8-70M; Beckman). The pelleted thylakoidmembranes were resuspended in 50 mM MES-NaOH (pH 6.0), 10% (vol/vol)glycerol, 1.2 M betaine, 20 mM CaCl2, and 5 mM MgCl2 to a chlorophyll con-centration of 1–1.5 mg mL−1 before being snap-frozen in liquid nitrogen andstored at −80 °C.
Polarographic Measurements of O2 Evolution. Measurement of O2 releasekinetics was performed with isolated thylakoid membranes using a bareplatinum electrode that allows for the deposition of samples by centrifu-gation as described before. For each measurement, a sample of thylakoidmembranes containing 3 μg chlorophyll was added to 500 μL 50 mM MES-NaOH (pH values of 5.0, 6.5, and 7.5), 1 M sucrose, 10 mM CaCl2, and 200 mMNaCl. Samples were centrifuged onto the electrode surface at 8,000 × g for10 min at 20 °C in a Sorvall HB-4 Swing-Out Rotor. The temperature of elec-trode was regulated by circulating thermostated water through a copperjacket that surrounds the electrode. Polarization of the electrode (0.73 V) wasturned on 10 s before the start of data acquisition, and the flash sequence wasstarted 333 ms after that. The response time of the polarographic amplifier is∼100 μs, whereas the electrode–electrolyte system responds within ∼200–400 μs at the specified NaCl concentration in the measuring buffer. Acquisitionof the data and the control of the instrumentation were implemented using aplug-in data acquisition circuitry and LabView software (National Instruments)that permitted timing and coordination of the flash illumination and dataacquisition in a synchronous mode with nanosecond accuracy (independent ofcomputer motherboard and operating system). Before measurement of O2
release kinetics, sample on the electrode was thermally equilibrated to thetemperature of the water jacket for 10 min and then, exposed to a train of50-μs flashes from a red (nominally 627 nm) light-emitting diode Luxeon IIIEmitter (Philips Electronics) driven by a strobe current generator (Pulsar 710;Advanced Illumination) placed 0.9 cm from the surface of the electrode givenat 4 Hz. Sample was given up to 240 flashes in each measurement, and thesignals were averaged. Mathematical fitting of the resultant O2 signals wasperformed using a reaction–diffusion model summarized in Scheme 1 and Eq. 1as previously described (16, 33). The model takes into account the productionof O2 from PSII, the diffusive processes governing the concentration of O2 atthe platinum electrode surface, and the electrode reaction consuming O2 atthat surface. SI Materials and Methods and ref. 16 have information on theimplementation of the model and the details of the fitting.
ACKNOWLEDGMENTS. The authors thank Prof. Richard Debus, Prof. CharlesYocum, and Prof. Robert Gennis for stimulating discussions and Prof. ChuckDismukes for suggesting varying buffer concentrations for evaluating thepotential rate limitation by proton release. The authors also thank Prof.Richard Debus for the D1-D61 strains. This work was funded by NationalScience Foundation Grant MCB-1244586.
1. Barber J (2012) Photosystem II: The water-splitting enzyme of photosynthesis. ColdSpring Harb Symp Quant Biol 77:295–307.
2. Cardona T, Sedoud A, Cox N, Rutherford AW (2012) Charge separation in photosystem II:A comparative and evolutionary overview. Biochim Biophys Acta 1817(1):26–43.
3. Dau H, Zaharieva I, Haumann M (2012) Recent developments in research on wateroxidation by photosystem II. Curr Opin Chem Biol 16(1-2):3–10.
4. Cox N, Pantazis DA, Neese F, Lubitz W (2013) Biological water oxidation. Acc ChemRes 46(7):1588–1596.
E6146 | www.pnas.org/cgi/doi/10.1073/pnas.1512008112 Bao and Burnap
Dow
nloa
ded
by g
uest
on
Mar
ch 4
, 202
0

5. Ahlbrink R, et al. (1998) Function of tyrosine Z in water oxidation by photosystemII: Electrostatical promotor instead of hydrogen abstractor. Biochemistry 37(4):1131–1142.
6. Haumann M, Mulkidjanian A, Junge W (1999) Tyrosine-Z in oxygen-evolving photo-system II: A hydrogen-bonded tyrosinate. Biochemistry 38(4):1258–1267.
7. Hays AM, Vassiliev IR, Golbeck JH, Debus RJ (1998) Role of D1-His190 in proton-cou-pled electron transfer reactions in photosystem II: A chemical complementation study.Biochemistry 37(32):11352–11365.
8. Rappaport F, et al. (2009) Probing the coupling between proton and electron transferin photosystem II core complexes containing a 3-fluorotyrosine. J Am Chem Soc131(12):4425–4433.
9. Saito K, Shen J-R, Ishida T, Ishikita H (2011) Short hydrogen bond between redox-active tyrosine Y(Z) and D1-His190 in the photosystem II crystal structure. Biochemistry50(45):9836–9844.
10. Joliot P, Barbieri G, Chabaud R (1969) Un nouveau modele des centres photochimiquedu systeme II. Photochem Photobiol 10(5):309–329.
11. Kok B, Forbush B, McGloin M (1970) Cooperation of charges in photosynthetic O2evolution-I. A linear four step mechanism. Photochem Photobiol 11(6):457–475.
12. Bao H, Dilbeck PL, Burnap RL (2013) Proton transport facilitating water-oxidation: Therole of second sphere ligands surrounding the catalytic metal cluster. Photosynth Res116(2-3):215–229.
13. Klauss A, Haumann M, Dau H (2015) Seven steps of alternating electron and protontransfer in photosystem II water oxidation traced by time-resolved photothermalbeam deflection at improved sensitivity. J Phys Chem B 119(6):2677–2689.
14. Klauss A, Haumann M, Dau H (2012) Alternating electron and proton transfer steps inphotosynthetic water oxidation. Proc Natl Acad Sci USA 109(40):16035–16040.
15. Rappaport F, Blanchard-Desce M, Lavergne J (1994) Kinetics of electron transfer andelectrochromic change during the redox transitions of the photosynthetic oxygen-evolving complex. Biochim Biophys Acta 1184(2-3):178–192.
16. Dilbeck PL, et al. (2012) The D1-D61N mutation in Synechocystis sp. PCC 6803 allowsthe observation of pH-sensitive intermediates in the formation and release of O₂ fromphotosystem II. Biochemistry 51(6):1079–1091.
17. Razeghifard MR, Pace RJ (1999) EPR kinetic studies of oxygen release in thylakoidsand PSII membranes: A kinetic intermediate in the S3 to S0 transition. Biochemistry38(4):1252–1257.
18. HaumannM, et al. (2005) Photosynthetic O2 formation tracked by time-resolved x-rayexperiments. Science 310(5750):1019–1021.
19. Gerencsér L, Dau H (2010) Water oxidation by photosystem II: H(2)O-D(2)O exchangeand the influence of pH support formation of an intermediate by removal of a protonbefore dioxygen creation. Biochemistry 49(47):10098–10106.
20. Clausen J, Debus RJ, Junge W (2004) Time-resolved oxygen production by PSII:Chasing chemical intermediates. Biochim Biophys Acta 1655(1-3):184–194.
21. Razeghifard MR, Wydrzynski T, Pace RJ, Burnap RL (1997) Yz. reduction kinetics in theabsence of the manganese-stabilizing protein of photosystem II. Biochemistry 36(47):14474–14478.
22. Burnap RL, Shen JR, Jursinic PA, Inoue Y, Sherman LA (1992) Oxygen yield andthermoluminescence characteristics of a cyanobacterium lacking the manganese-stabilizing protein of photosystem II. Biochemistry 31(32):7404–7410.
23. Dilbeck PL, Bao H, Neveu CL, Burnap RL (2013) Perturbing the water cavity sur-rounding the manganese cluster by mutating the residue D1-valine 185 has a strongeffect on the water oxidation mechanism of photosystem II. Biochemistry 52(39):6824–6833.
24. Boussac A, et al. (2004) Biosynthetic Ca2+/Sr2+ exchange in the photosystem II oxygen-evolving enzyme of Thermosynechococcus elongatus. J Biol Chem 279(22):22809–22819.
25. Umena Y, Kawakami K, Shen JR, Kamiya N (2011) Crystal structure of oxygen-evolvingphotosystem II at a resolution of 1.9 Å. Nature 473(7345):55–60.
26. Suga M, et al. (2015) Native structure of photosystem II at 1.95 A resolution viewed byfemtosecond X-ray pulses. Nature 517(7532):99–103.
27. Pantazis DA, Ames W, Cox N, Lubitz W, Neese F (2012) Two interconvertible structuresthat explain the spectroscopic properties of the oxygen-evolving complex of photo-system II in the S2 state. Angew Chem Int Ed Engl 51(39):9935–9940.
28. Cox N, Messinger J (2013) Reflections on substrate water and dioxygen formation.Biochim Biophys Acta 1827(8-9):1020–1030.
29. Debus RJ (2015) FTIR studies of metal ligands, networks of hydrogen bonds, andwater molecules near the active site Mn₄CaO₅ cluster in Photosystem II. BiochimBiophys Acta 1847(1):19–34.
30. Debus RJ (2014) Evidence from FTIR difference spectroscopy that D1-Asp61 influencesthe water reactions of the oxygen-evolving Mn4CaO5 cluster of photosystem II.Biochemistry 53(18):2941–2955.
31. Ho FM, Styring S (2008) Access channels and methanol binding site to the CaMn4
cluster in Photosystem II based on solvent accessibility simulations, with implicationsfor substrate water access. Biochim Biophys Acta 1777(2):140–153.
32. Hundelt M, Hays AM, Debus RJ, Junge W (1998) Oxygenic photosystem II: The mu-tation D1-D61N in Synechocystis sp. PCC 6803 retards S-state transitions without af-fecting electron transfer from YZ to P680+. Biochemistry 37(41):14450–14456.
33. Lavorel J (1992) Determination of the photosynthetic oxygen release time by am-perometry. Biochim Biophys Acta 1101(1):33–40.
34. Agmon N (1995) The Grotthuss mechanism. Chem Phys Lett 244(5-6):456–462.35. Rapatskiy L, et al. (2012) Detection of the water-binding sites of the oxygen-evolving
complex of Photosystem II using W-band 17O electron-electron double resonance-detected NMR spectroscopy. J Am Chem Soc 134(40):16619–16634.
36. Nilsson H, Rappaport F, Boussac A, Messinger J (2014) Substrate-water exchange inphotosystem II is arrested before dioxygen formation. Nat Commun 5:4305.
37. Ferreira KN, Iverson TM, Maghlaoui K, Barber J, Iwata S (2004) Architecture of thephotosynthetic oxygen-evolving center. Science 303(5665):1831–1838.
38. Service RJ, Hillier W, Debus RJ (2014) Network of hydrogen bonds near the oxygen-evolving Mn(4)CaO(5) cluster of photosystem II probed with FTIR difference spec-troscopy. Biochemistry 53(6):1001–1017.
39. Amin M, et al. (2015) Proton-coupled electron transfer during the S-state transitionsof the oxygen-evolving complex of photosystem II. J Phys Chem B 119(24):7366–7377.
40. Retegan M, Cox N, Lubitz W, Neese F, Pantazis DA (2014) The first tyrosyl radicalintermediate formed in the S2-S3 transition of photosystem II. Phys Chem Phys 16(24):11901–11910.
41. Narzi D, Bovi D, Guidoni L (2014) Pathway for Mn-cluster oxidation by tyrosine-Z inthe S2 state of photosystem II. Proc Natl Acad Sci USA 111(24):8723–8728.
42. Rappaport F, Ishida N, Sugiura M, Boussac A (2011) Ca2+ determines the entropychanges associated with the formation of transition states during water oxidation byPhotosystem II. Energy Environ Sci 4(7):2520–2524.
43. Messerw,Melchers F (1970) Genetic analysis of mutants producing defective β-galactosidasewhich can be activated by specific antibodie. Mol Gen Genet 109(2):152–161.
44. Rivalta I, et al. (2011) Structural-functional role of chloride in photosystem II.Biochemistry 50(29):6312–6315.
45. Cox N, et al. (2014) Photosynthesis. Electronic structure of the oxygen-evolvingcomplex in photosystem II prior to O-O bond formation. Science 345(6198):804–808.
46. Pecoraro VL, Baldwin MJ, Caudle MT, Hsieh W-Y, Law N (1998) A proposal for wateroxidation in Photosystem II. Pure Appl Chem 70(4):925–929.
47. McEvoy JP, Brudvig GW (2006) Water-splitting chemistry of photosystem II. Chem Rev106(11):4455–4483.
48. Vinyard DJ, Khan S, Brudvig GW (October 8, 2015) Photosynthetic water oxidation:Binding and activation of substrate waters for O-O bond formation. Faraday Discuss.
49. Messinger J (2004) Evaluation of different mechanistic proposals for water oxidationin photosynthesis on the basis of Mn4OxCa structures for the catalytic site and spec-troscopic data. Phys Chem Phys 6(20):4764–4771.
50. Siegbahn PE (2013) Water oxidation mechanism in photosystem II, including oxida-tions, proton release pathways, O-O bond formation and O2 release. Biochim BiophysActa 1827(8-9):1003–1019.
51. Pérez Navarro M, et al. (2013) Ammonia binding to the oxygen-evolving complex ofphotosystem II identifies the solvent-exchangeable oxygen bridge (μ-oxo) of themanganese tetramer. Proc Natl Acad Sci USA 110(39):15561–15566.
52. Li X, Siegbahn PE (2015) Alternative mechanisms for O2 release and O-O bond for-mation in the oxygen evolving complex of photosystem II. Phys Chem Phys 17(18):12168–12174.
53. Sproviero EM, Gascón JA, McEvoy JP, Brudvig GW, Batista VS (2008) Quantum mechanics/molecular mechanics study of the catalytic cycle of water splitting in photosystem II. J AmChem Soc 130(11):3428–3442.
54. Nilsson H, Krupnik T, Kargul J, Messinger J (2014) Substrate water exchange in pho-tosystem II core complexes of the extremophilic red alga Cyanidioschyzon merolae.Biochim Biophys Acta 1837(8):1257–1262.
55. Bovi D, Narzi D, Guidoni L (2013) The S2 state of the oxygen-evolving complex of pho-tosystem II explored by QM/MM dynamics: Spin surfaces and metastable states suggest areaction path towards the S3 state. Angew Chem Int Ed Engl 52(45):11744–11749.
56. Siegbahn PEM (2013) Substrate water exchange for the oxygen evolving complex inPSII in the S1, S2, and S3 states. J Am Chem Soc 135(25):9442–9449.
57. Rippka R, Deruelles J, Waterbury JB, Herdman M, Stanier RY (1979) Generic assign-ments, strain histories and properties of pure cultures cyanobacteria. J Gen Microbiol111:1–61.
Bao and Burnap PNAS | Published online October 27, 2015 | E6147
BIOPH
YSICSAND
COMPU
TATIONALBIOLO
GY
PNASPL
US
Dow
nloa
ded
by g
uest
on
Mar
ch 4
, 202
0


![arXiv:1411.5680v2 [cond-mat.soft] 20 Mar 2015 › pdf › 1411.5680v2.pdf · Two-Dimensional Clusters of Colloidal Spheres: Ground States, Excited States, and Structural Rearrangements](https://static.fdocuments.in/doc/165x107/5f26a1aaa2ede248560ffc36/arxiv14115680v2-cond-matsoft-20-mar-2015-a-pdf-a-1411-two-dimensional.jpg)


![36 [1,n]-sigmatropic rearrangements](https://static.fdocuments.in/doc/165x107/55504a55b4c9058f768b5083/36-1n-sigmatropic-rearrangements.jpg)


