PMS Navigator May 2019|Issue 32 -...
32
May 2019|Issue 32 PMS Navigator
Transcript of PMS Navigator May 2019|Issue 32 -...

May 2019|Issue 32
PMS Navigator
Benefits of Investing through PMS platform
Fund manager & managed PMS Strategies
Performance update of PMS offerings
Portfolio Analysis & Fees Structure

Benefits of Investing through PMS platformBenefits of Investing through PMS platform
o Value proposition for Investors
o PMS Strategies revolve around
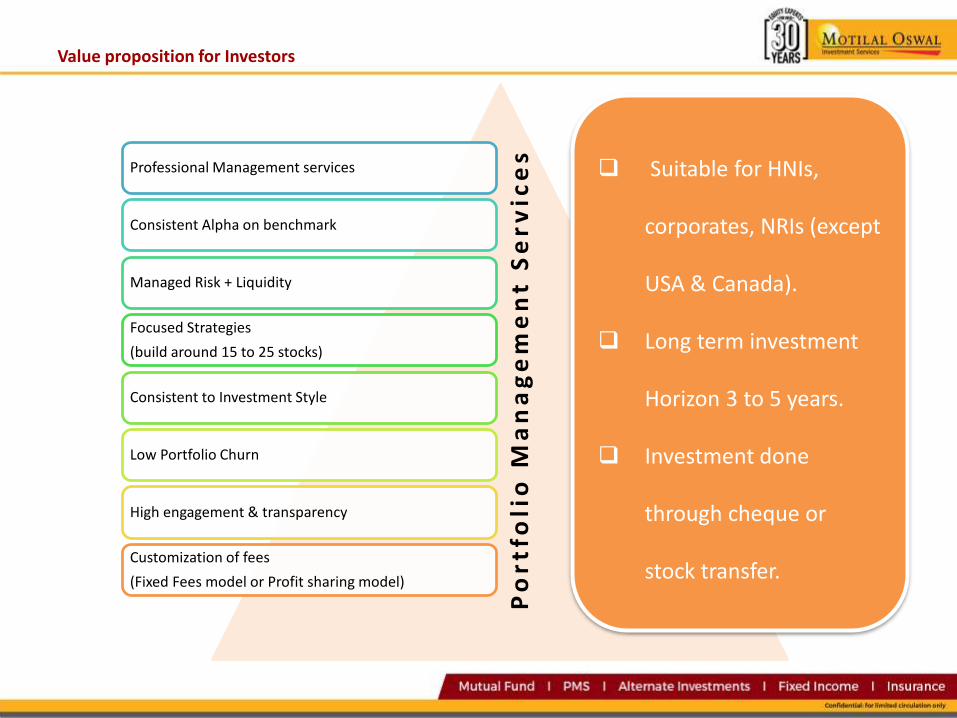
Value proposition for Investors
Professional Management services
Consistent Alpha on benchmark
Managed Risk + Liquidity
Focused Strategies
(build around 15 to 25 stocks)
Consistent to Investment Style
Low Portfolio Churn
High engagement & transparency
Customization of fees
(Fixed Fees model or Profit sharing model)
Po
rtf
oli
o M
an
ag
em
en
t S
er
vic
es
Suitable for HNIs,
corporates, NRIs (except
USA & Canada).
Long term investment
Horizon 3 to 5 years.
Investment done
through cheque or
stock transfer.

PMS Strategies revolve around….
Earnings Growth
Longevity
ValuationQuality of Managem
ent
Margin of Safety
Size of opportuni
ty
Solid Business Model
Own Skin in the Game
Credit & investment cycle
Demand recovery

Fund manager & managed PMS Strategies
o Fund Manager & managed PMS strategy.
o Our bouquet of PMS offerings

Fund Manager & managed PMS strategy
ASK Investment Managers - India Entrepreneur Portfolio.
MOAMC PMS:- We have offering of MOAMC’s 6 portfolios: Dynamic Allocation PMS | Value Strategy | India Opportunity Portfolio | Next
Trillion Dollar Opportunity Strategy | India Opportunity Portfolio V2 | Business Opportunity Portfolio
Raamdeo Agrawal Co-Founder & Joint MD,
MOFSL
Manish SonthaliaHead Equity PMS & AIF,
MOAMC (Fund Manager)
Bharat ShahExecutive Director,
ASK Group
Prateek AgarwalBusiness Head & CIO,
ASK Investment Managers
Sumeet JainPortfolio Manager,
ASK Investment Managers
Shrey LoonkerFund Manager, MOAMC
Taher BadshahCIO-Equities,
INVESCO India
INVESCO India Investment Managers-DAWN PMS
Pankaj MurarkaFounder & CIO,
Renaissance Investment Managers
Amit NigamFund Manager, INVESCO India
Susmit PatodiaCo Fund Manager, MOAMC

Our bouquet of PMS offerings
Data as on 30th April 2019
VALUE NTDOP IOP IOP V2 BOP IEP D.A.W.NRenaissance Midcap
Portfolio
Renaissance Opportunity
Portfolio
AMCMotilal Oswal
AMCMotilal Oswal
AMCMotilal Oswal
AMCMotilal
Oswal AMCMotilal Oswal
AMC
ASK Investment Managers
Invesco Asset Management
Renaissance IM Renaissance IM
Fund ManagerShrey LoonkerSusmit Patodia
Manish Sonthalia
Manish Sonthalia
Manish Sonthalia
Manish Sonthalia
Prateek Agarwal
Taher BadshahPankaj Murarka Pankaj Murarka
Sumeet Jain Amit Nigam
AUM (Cr.) Approx.
2,223 8,787 3,468 570 226 8,063 542 26 22
Earning Growth Style
Superior Business Model
Quality of Management
Company's Promoter
Stake
Valuation
Focused Portfolio
No. of Stocks 21 26 24 20 22 20 22 20 15
Market Cap Style
Large Cap Multi Cap Mid & Small
CapMid & Small
CapMulti Cap Multi Cap Multi Cap Mid Cap Multi Cap
(44L : 56 M&S)
(53 L : 48 M&S) (66L: 34 M&S) (59L : 36 M&S)
Investment Style
Medium Medium High High Medium MediumMedium to
HighHigh Medium

Portfolio Management Services
o MOAMC Dynamic Allocation PMS
o Renaissance Midcap Portfolio
o Renaissance Opportunity Portfolio
o MOAMC Value
o MOAMC NTDOP
o MOAMC IOP
o MOAMC IOP V2
o MOAMC BOP
o ASK IEP
o Invesco DAWN
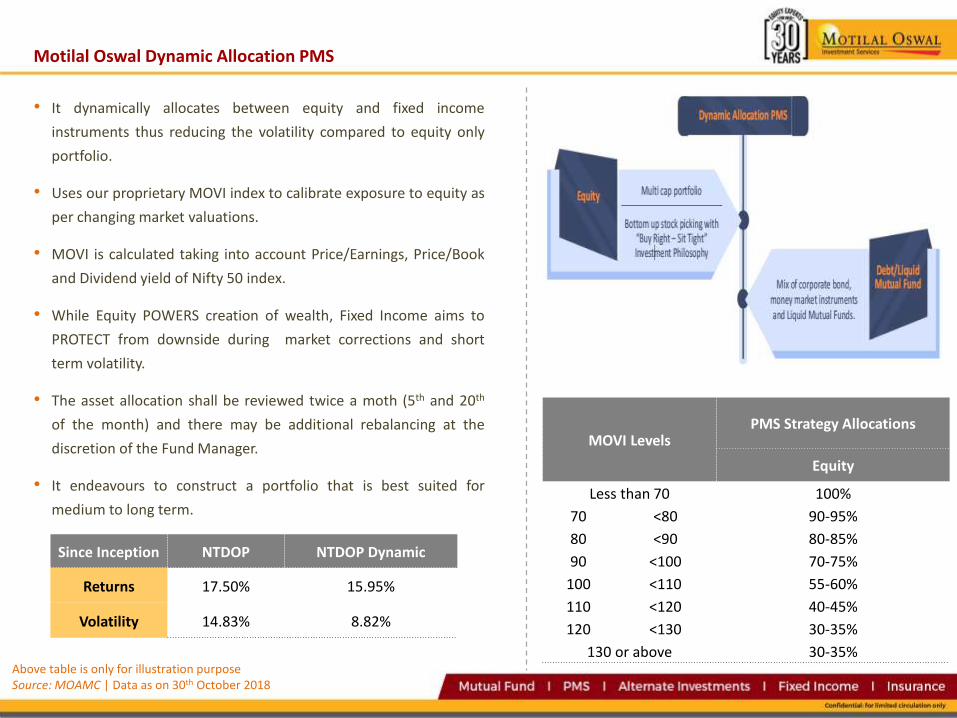
• It dynamically allocates between equity and fixed income
instruments thus reducing the volatility compared to equity only
portfolio.
• Uses our proprietary MOVI index to calibrate exposure to equity as
per changing market valuations.
• MOVI is calculated taking into account Price/Earnings, Price/Book
and Dividend yield of Nifty 50 index.
• While Equity POWERS creation of wealth, Fixed Income aims to
PROTECT from downside during market corrections and short
term volatility.
• The asset allocation shall be reviewed twice a moth (5th and 20th
of the month) and there may be additional rebalancing at the
discretion of the Fund Manager.
• It endeavours to construct a portfolio that is best suited for
medium to long term.
Above table is only for illustration purposeSource: MOAMC | Data as on 30th October 2018
MOVI Levels PMS Strategy Allocations
Equity
Less than 70 100%
70 <80 90-95%
80 <90 80-85%
90 <100 70-75%
100 <110 55-60%
110 <120 40-45%
120 <130 30-35%
130 or above 30-35%
Since Inception NTDOP NTDOP Dynamic
Returns 17.50% 15.95%
Volatility 14.83% 8.82%
Motilal Oswal Dynamic Allocation PMS

Renaissance Midcap Portfolio
• Sustainable Quality Growth at Reasonable Price (SQGARP)
• The fund invests into midcap companies that can become large caps
in the future.
• Focused on companies with business leadership and it is a low
mortality portfolio
• It comprises of 20 stocks
• Added Magma Fincorp Ltd and exited Multi Commodity Exchange of
India Ltd in the last month.
Inception Date Benchmark Fund Manager
01-Jan-18Nifty Free Float
Midcap 100Mr. Pankaj Murarka
Portfolio (Top 10 Stocks)
Scrip Name (%) of Market value
Syngene International Ltd 9.00
DCB Bank Ltd 8.00
Federal Bank Ltd 8.00
Info Edge (India) Ltd 7.00
Team Lease Services Ltd 6.00
Aditya Birla Fashion & Retail Ltd 5.00
Just Dial Ltd 5.00
Motilal Oswal Financial Services Ltd 5.00
Bank of Baroda Ltd 4.00
Indian Hotels Company Ltd 4.00
Top 5 sectors
Sector Name (%) of Market value
Banking & Finance 33.00
Pharmaceuticals 13.00
IT Consulting & Software 12.00
FMCG 9.00
Hotels 8.00
Source: Renaissance IM | Data as on 30th April 2019
Performance(%ge) Value of 1 cr. Invested
PeriodRenaissanceMidcap PMS
Nifty Midcap
100
RenaissanceMidcap PMS
Nifty Midcap
100
1 Month -0.80 -3.30 0.99 0.97
6 Months 8.60 1.80 1.09 1.02
1 Year -3.20 -12.90 0.97 0.87
Since Inception -4.80 -16.90 0.94 0.78

Renaissance Opportunities Portfolio
• Sustainable Quality Growth at Reasonable Price (SQGARP)
• A concentrated portfolio that invests in companies across
businesses which are at different states of their business lifecycles
capable of delivering sustainable, market-leading growth and are
at a reasonable prices.
• Comprises of 15 stocks
• Added Indian Hotels Co Ltd and Cummins India Ltd. Exited
Syngene International Ltd and Divi’s Laboratories Ltd. in the last
month.
Inception Date Benchmark Fund Manager
01-Jan-18 Nifty 200 Mr. Pankaj Murarka
Portfolio (Top 10 Stocks)
Scrip Name (%) of Market value
Sun Pharmaceuticals Industries Ltd 9.00
Axis Bank Ltd 8.00
State Bank of India 8.00
HDFC Bank Ltd 7.00
ICICI Bank Ltd 7.00
Larsen & Toubro Ltd 7.00
Reliance Industries Ltd 7.00
Tata Motors Ltd 7.00
Aditya Birla Fashion & Retail Ltd 6.00
Info Edge (India) Ltd. 6.00
Top 5 sectors
Sector Name (%) of Market value
Banking & Finance 36.00
Capital Goods & Engineering 12.00
FMCG 11.00
IT Consulting & Software 10.00
Pharmaceuticals 9.00
Source: Renaissance IM | Data as on 30th April 2019.
Performance(%ge) Value of 1 cr. Invested
PeriodRenaissance
Opp PMSNifty 200
RenaissanceOpp PMS
Nifty 200
1 Month 1.30 0.20 1.01 1.00
6 Months 10.00 10.20 1.10 1.10
1 Year 8.50 4.00 1.09 1.04
Since Inception 5.40 4.80 1.07 1.06

MOAMC Value Strategy
• Buy Right & Sit Tight approach to stock investing
• Value PMS has delivered 22.45% annualized returns since
inception versus 16.44% of Nifty 50; INR 1 Cr. invested in Value
PMS in March 2003 is worth INR 26.12 Cr versus INR 11.61 Cr. in
Nifty 50.
• Focused portfolio approach with 21 stocks in its portfolio.
• Added Dr Reddys Laboratories Ltd, exited Interglobe Aviation Ltd
and increased allocation in Ipca Labs Ltd. in the last month.
Performance(%ge) Value of 1 cr. Invested
PeriodValue
StrategyNifty 50
ValueStrategy
Nifty 50
1 Month 0.90 1.07 1.01 1.01
3 Months 9.79 8.47 1.10 1.08
6 Months 12.96 13.11 1.13 1.13
1 Year -1.51 9.39 0.98 1.09
2 Years 5.29 12.37 1.11 1.26
3 Years 9.84 14.39 1.33 1.50
4 Years 6.60 9.47 1.29 1.44
5 Years 14.48 11.90 1.97 1.75
Since Inception 22.45 16.44 26.12 11.61
Inception Date Benchmark Fund Manager
25-Mar-03 Nifty 50 IndexMr. Shrey LoonkerMr. Susmit Patodia
Portfolio (Top 10 Stocks)
Scrip Name (%) of Market value
HDFC Bank Ltd. 12.57
Kotak Mahindra Bank Ltd. 8.30
Bajaj Finserv Ltd. 7.97
HDFC Life Insurance Company Ltd. 6.68
BPCL Ltd. 6.48
ICICI Bank Ltd. 5.73
Larsen & Toubro Ltd. 5.67
ICICI Lombard General Insurance Company Ltd.
5.49
Bharat Forge Ltd. 4.18
Maruti Suzuki India Ltd. 3.95
Top 5 sectors
Sector Name (%) of Market value
Banking & Finance 52.93
Auto & Auto Ancillaries 12.07
Oil and Gas 9.74
Engineering and Electricals 5.67
Pharmaceuticals 5.16
Source: MOAMC | Data as on 30th April 2019

MOAMC Next Trillion Dollar Opportunity Strategy (NTDOP)
• The strategy aims to deliver superior returns by investing in
focused themes which are part of the next trillion dollar GDP
growth opportunity. Themes: CONSUMPTION | BANKING &
FINANCIAL SERVICES | INFRASTRUCTURE & RELATED SERVICES.
• The portfolio consist of 26 stocks.
• In last 10 years, NTDOP PMS has delivered positive return of
26.11% versus 13.76% of Nifty 500.
• Trimmed allocation in City Union Bank Ltd. and increased
allocation in ICICI Bank Ltd. in the last month.
Performance(%ge) Value of 1 cr. Invested
Period NTDOP NIFTY 500 NTDOP NIFTY 500
1 Month -1.31 0.01 0.99 1.00
3 Months 5.18 7.34 1.05 1.07
6 Months 4.11 10.41 1.04 1.10
1 Year -3.69 1.77 0.96 1.02
2 Years 5.15 8.47 1.11 1.18
3 Years 15.62 13.62 1.55 1.47
4 Years 13.28 9.39 1.65 1.43
5 Years 23.06 12.96 2.82 1.84
Since Inception 16.48 5.80 5.70 1.90
Inception Date Benchmark Fund Manager
5-Dec-07 NIFTY 500 Index Mr. Manish Sonthalia
Portfolio (Top 10 Stocks)
Scrip Name (%) of Market value
Kotak Mahindra Bank Ltd. 12.35
Voltas Ltd. 9.56
Page Industries Ltd. 8.57
Bajaj Finance Ltd. 5.44
City Union Bank Ltd. 4.88
L&T Technology Services Ltd. 4.86
Eicher Motors Ltd. 4.54
Tech Mahindra Ltd. 4.12
Bosch Ltd. 4.01
Max Financial Services Ltd. 3.67
Top 5 sectors
Sector Name (%) of Market value
Banking & Finance 32.59
FMCG 15.99
Diversified 13.16
Auto & Auto Ancillaries 11.52
Infotech 8.97
Source: MOAMC | Data as on 30th April 2019

MOAMC India Opportunity Portfolio (IOP)
• The Strategy aims to generate long term capital appreciation by
creating a focused portfolio of high growth stocks having the
potential to grow more than the nominal GDP for next 5-7 years
• The Strategy at present has a concentration in 24 stocks.
• Focus Theme for Next Five year: REVIVAL IN CAPEX CYCLE | MAKE
IN INDIA | THIRD TRILLION DOLLAR OPPORTUNITIES
• In last 5 years, IOP PMS has delivered positive return of 16.04%
versus 10.46% of Nifty Smallcap100.
Performance(%ge) Value of 1 cr. Invested
Period IOPNIFTY Small
Cap100IOP
NIFTY SmallCap100
1 Month -1.54 -3.07 0.98 0.97
3 Months 6.06 5.46 1.06 1.05
6 Months 7.49 6.68 1.07 1.07
1 Year -15.55 -22.91 0.84 0.77
2 Years -6.52 -6.79 0.87 0.87
3 Years 13.16 7.53 1.45 1.24
4 Years 9.25 4.32 1.42 1.18
5 Years 16.04 10.46 2.10 1.64
Since Inception 12.45 6.99 2.95 1.86
Inception Date Benchmark Fund Manager
15-Feb-10Nifty Smallcap 100
IndexMr. Manish Sonthalia
Portfolio (Top 10 Stocks)
Scrip Name (%) of Market value
Development Credit Bank Ltd. 11.19
TTK Prestige Ltd. 7.51
AU Small Finance Bank Ltd. 7.31
Gabriel India Ltd. 6.46
Aegis Logistics Ltd. 6.41
Mahanagar Gas Ltd. 5.86
Birla Corporation Ltd. 5.73
Kajaria Ceramics Ltd. 5.55
Blue Star Ltd. 4.77
Alkem Laboratories Ltd. 4.72
Top 5 sectors
Sector Name (%) of Market value
Banking & Finance 27.93
Consumer Durables 13.07
Pharmaceuticals 12.85
Oil & Gas 12.27
Cement & Infrastructure 8.60
Source: MOAMC | Data as on 30th April 2019

MOAMC India Opportunity Portfolio V2 (IOP V2)
Inception Date Benchmark Fund Manager
5-Feb-18Nifty Smallcap 100
IndexMr. Manish Sonthalia
Portfolio (Top 10 Stocks)
Scrip Name (%) of Market value
Ipca Lab Ltd. 9.31
Cholamandalam Investment And Finance Company Ltd.
7.97
Bajaj Electricals Ltd. 7.13
Bata India Ltd. 7.04
Larsen And Toubro Infotech Ltd. 6.93
Godrej Agrovet Ltd. 6.83
Coffee Day Enterprises Ltd. 6.40
JK Lakshmi Cement Ltd. 6.05
Sobha Ltd. 5.79
Sundram Fasteners Ltd 4.95
Top 5 sectors
Sector Name (%) of Market value
Banking & Finance 15.67
Electricals & Electronics 14.94
Pharmaceuticals 10.53
Agriculture 10.39
Infotech 8.35
• The Strategy aims to deliver superior returns by investing in stocks
from sectors that can benefit from India's emerging businesses.
• The Strategy at present has a concentration in 20 stocks.
• Investments with Long term perspective.
• Four basic themes- AFFORDABLE HOUSING | MARKET SHARE
GAIN BY NBFCS & PRIVATE SECTOR BANKS FROM PSU BANKS |
GROWTH IN RURAL ECONOMY | SHIFT FROM UNORGANIZED TO
ORGANIZED SECTOR
• Investment Approach: “Buy & Hold” strategy
Source: MOAMC | Data as on 30th April 2019
Performance(%ge) Value of 1 cr. Invested
Period IOP V2Nifty
Smallcap 100IOP V2
Nifty Smallcap 100
1 Month -3.64 -3.07 0.96 0.97
3 Months 8.10 5.46 1.08 1.05
6 Months 1.85 6.68 1.02 1.07
1 Year -20.00 -22.91 0.80 0.77
Since Inception -8.11 -18.46 0.90 0.78

MOAMC Business Opportunities Portfolio (BOP)
Inception Date Benchmark Fund Manager
16-Jan-18 Nifty 500 Index Mr. Manish Sonthalia
Portfolio (Top 10 Stocks)
Scrip Name (%) of Market value
Hindustan Unilever Ltd. 8.99
Bata India Ltd. 7.93
Bajaj Finance Ltd. 7.28
HDFC Bank Ltd. 7.06
ICICI Lombard General Insurance Company Ltd.
6.52
Godrej Agrovet Ltd. 5.23
Titan Company Ltd. 5.17
Kotak Mahindra Bank Ltd. 5.16
Exide Industries Ltd. 4.80
Britannia Industries Ltd. 4.63
Top 5 sectors
Sector Name (%) of Market value
Banking & Finance 32.70
FMCG 18.79
Retail 14.78
Agriculture 7.45
Engineering & Electricals 5.91
• The Portfolio will be constructed based on in-depth research leading
to bottom-up stock picking with a view of equities from 3-4 years
perspective.
• It aims to predominantly invest in Small and Midcap stocks with a
focus on identifying potential winners.
• The Strategy at present has a concentration in 22 stocks.
• Five basic themes- AFFORDABLE HOUSING | MARKET SHARE GAIN
BY NBFCS & PRIVATE SECTOR BANKS FROM PSU BANKS | RISE IN
CONSUMER DISCRETIONARY | AGRICULTURE & GST BENEFICIARIES.
• Investment Approach: “Buy & Hold” strategy
Source: MOAMC | Data as on 30th April 2019
Performance(%ge) Value of 1 cr. Invested
Period BOP Nifty 500 BOP Nifty 500
1 Month -1.35 0.01 0.99 1.00
3 Months 5.73 7.34 1.06 1.07
6 Months 11.64 10.41 1.12 1.10
1 Year -3.60 1.77 0.96 1.02
Since Inception -0.40 0.42 0.99 1.01

ASK India Entrepreneur Portfolio (IEP)
• The strategy is market cap agnostic and builds portfolio which has
companies with more than 25% promoter holdings, high ROCE &
high non-dilutive compounded EPS. Identify business with
competitive advantage that is significant sized (min. 100 Cr. PBT).
The Strategy is built primarily on entrepreneur concept.
• The portfolio consist of 20 stocks.
• Investments with Long term perspective.
• In last 6 years, IEP PMS has delivered positive return of 22.43%
versus 12.89% of BSE 500.
Performance(%ge) Value of 1 cr. Invested
Period IEP BSE 500 IEP BSE 500
1 Month -0.16 -0.07 1.00 1.00
3 Months 8.26 7.06 1.08 1.07
6 Months 10.92 10.17 1.11 1.10
1 Year 1.76 1.63 1.02 1.02
2 Years 9.93 8.53 1.21 1.18
3 Years 14.95 13.68 1.52 1.47
4 Years 11.86 9.34 1.57 1.43
5 Years 21.15 12.88 2.61 1.83
Since Inception 18.90 9.36 4.97 2.29
Inception Date Benchmark Fund Manager
25-Jan-10BSE 500 IndexNifty 50 Index
Mr. Prateek Agrawal Mr. Sumit Jain
Portfolio (Top 10 Stocks)
Scrip Name (%) of Market value
Bajaj Finserv Ltd. 7.91
Bajaj Finance Ltd. 7.91
Havells India Ltd. 6.23
IndusInd Bank Ltd. 5.99
Cholamandalam Investment and Finance Company Ltd.
5.89
Asian Paints Ltd. 5.82
P I Industries Ltd. 5.82
Page Industries Ltd. 5.58
Britannia Industries Ltd. 5.57
Kotak Mahindra Bank Ltd. 5.55
Top 5 sectors
Sector Name (%) of Market valueBanking & Finance 33.25FMCG 24.87Auto & Auto Ancillaries 13.46Electronics 6.23Agro Chemicals 5.82
Source: ASK IM | Data as on 30th April 2019 (market cap data is as per SEBIclassification

INVESCO Dawn Strategy
• Focus on mean reversion & value style
• High impetus on quality business models & management
• Bottom up stock picking approach without bias towards market
cap or sector
• Catalyst for investing – Cyclical recovery, earning recovery and
Under owned to Value style
• Focused portfolio approach and currently has 22 stocks in its
portfolio.
• Added Bharti Airtel Ltd and trimmed allocation in Reliance
Industries Ltd. in the last month.
Source: INVESCO AMC | Data as on 30th April 2019
Inception Date Benchmark Fund Manager
28- Aug-17 S&P BSE 500Mr. Taher Badshah
Mr. Amit Nigam
Portfolio (Top 10 Stocks)
Scrip Name (%) of Market value
ICICI Bank Ltd. 10.68
Infosys Ltd. 5.99
ITC Ltd. 5.97
Axis Bank Ltd. 5.90
Exide Industries Ltd. 5.11
Reliance Industries Ltd. 5.07
Tech Mahindra Ltd. 4.91
Gujarat State Petronet Ltd. 4.90
Cipla Ltd. 4.28
IndusInd Bank Ltd. 4.25
Top 5 sectors
Sector Name (%) of Market value
Financials 31.10
Industrials 11.95
Information Technology 10.90
Consumer Staples 9.50
Healthcare 8.19
Performance(%ge) Value of 1 cr. Invested
Period DAWN BSE 500 DAWN BSE 500
1 Month -1.08 -0.07 0.99 1.00
3 Months 6.00 7.06 1.06 1.07
6 Months 8.40 10.17 1.08 1.10
1 Year 2.45 1.63 1.02 1.02
Since Inception 5.93 7.19 1.09 1.10
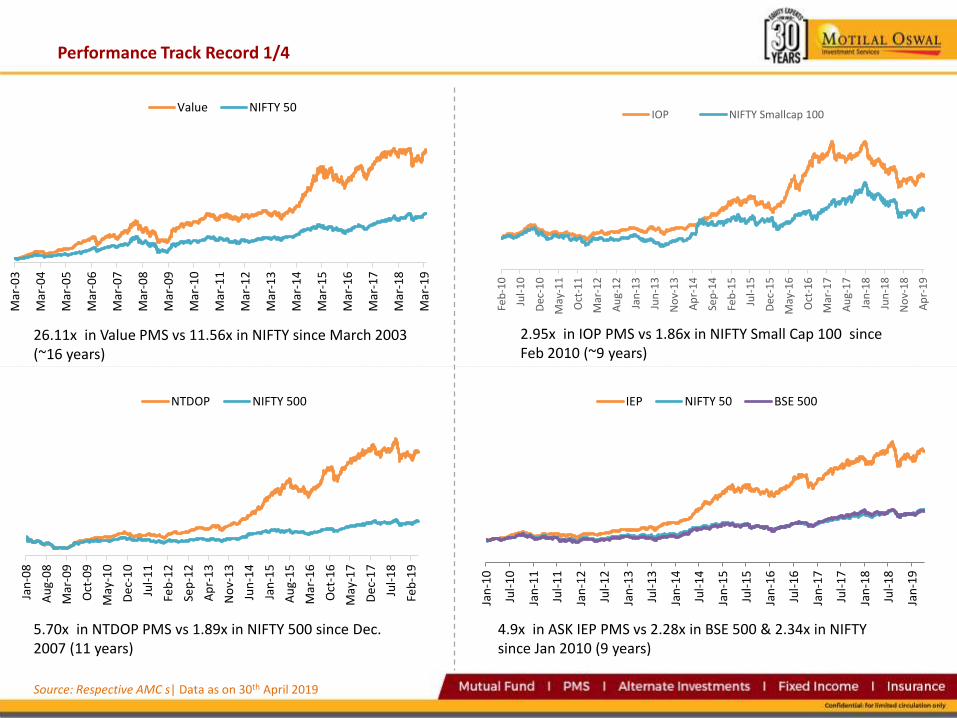
Performance Track Record 1/4
Source: Respective AMC s| Data as on 30th April 2019
26.11x in Value PMS vs 11.56x in NIFTY since March 2003 (~16 years)
2.95x in IOP PMS vs 1.86x in NIFTY Small Cap 100 since Feb 2010 (~9 years)
4.9x in ASK IEP PMS vs 2.28x in BSE 500 & 2.34x in NIFTY since Jan 2010 (9 years)
5.70x in NTDOP PMS vs 1.89x in NIFTY 500 since Dec. 2007 (11 years)
Jan
-10
Jul-
10
Jan
-11
Jul-
11
Jan
-12
Jul-
12
Jan
-13
Jul-
13
Jan
-14
Jul-
14
Jan
-15
Jul-
15
Jan
-16
Jul-
16
Jan
-17
Jul-
17
Jan
-18
Jul-
18
Jan
-19
IEP NIFTY 50 BSE 500
Mar
-03
Mar
-04
Mar
-05
Mar
-06
Mar
-07
Mar
-08
Mar
-09
Mar
-10
Mar
-11
Mar
-12
Mar
-13
Mar
-14
Mar
-15
Mar
-16
Mar
-17
Mar
-18
Mar
-19
Value NIFTY 50
Jan
-08
Au
g-0
8
Mar
-09
Oct
-09
May
-10
De
c-1
0
Jul-
11
Feb
-12
Sep
-12
Ap
r-1
3
No
v-1
3
Jun
-14
Jan
-15
Au
g-1
5
Mar
-16
Oct
-16
May
-17
De
c-1
7
Jul-
18
Feb
-19
NTDOP NIFTY 500
Feb
-10
Jul-
10
Dec
-10
May
-11
Oct
-11
Mar
-12
Au
g-1
2
Jan
-13
Jun
-13
No
v-1
3
Ap
r-1
4
Sep
-14
Feb
-15
Jul-
15
Dec
-15
May
-16
Oct
-16
Mar
-17
Au
g-1
7
Jan
-18
Jun
-18
No
v-1
8
Ap
r-1
9
IOP NIFTY Smallcap 100

Performance Track Record 2/4
Source: Respective AMC s| Data as on 30th April 2019
-100%
-50%
0%
50%
100%
150%
200%
1 year 3 years 5 years 1 year 3 years 5 years
Value PMS Nifty 50
Maximum Minimum Average
-100%
-50%
0%
50%
100%
150%
1 year 3 years 5 years 1 year 3 years 5 years
NTDOP Nifty 500
Maximum Minimum Average
-60%
-40%
-20%
0%
20%
40%
60%
80%
100%
120%
1 year 3 years 5 years 1 year 3 years 5 years
IOP Nifty Small Cap 100
Maximum Minimum Average
-40%
-20%
0%
20%
40%
60%
80%
100%
1 year 3 years 5 years 1 year 3 years 5 years
ASK IEP BSE 500
Maximum Minimum Average

Performance Track Record 3/4
VALUE NIFTY 50 IOP NIFTY Smallcap 100
FY-08 29% 24% -- --
FY-09 -29% -36% -- --
FY-10 81% 74% 9% 4%
FY-11 12% 11% 8% -1%
FY-12 3% -9% -1% -6%
FY-13 0% 7% 0% -7%
FY-14 21% 18% 21% 18%
FY-15 61% 27% 53% 52%
FY-16 -10% -9% -9% -13%
FY-17 19% 19% 60% 43%
FY-18 9% 10% 5% 12%
FY-19 3% 15% -9% -14%
FY-20 4% 16% -11% -17%
VALUE NIFTY 50 IOP NIFTY Smallcap 100
CY-06 24% 40% -- --
CY-07 52% 55% -- --
CY-08 -44% -52% -- --
CY-09 74% 76% -- --
CY-10 20% 18% 28% 18%
CY-11 -12% -25% -25% -34%
CY-12 23% 28% 36% 37%
CY-13 3% 7% 2% -8%
CY-14 58% 31% 48% 55%
CY-15 0% -4% 5% 7%
CY-16 2% 3% 26% 2%
CY-17 30% 29% 52% 57%
CY-18 -5% 3% -27% -29%
CY-19* 5% 8% 2% 0%
Fin
anci
al Y
ear
on
ye
ar P
erf
orm
ance
Cal
end
ar Y
-O-Y
Pe
rfo
rman
ce
Calen
dar Y
-O-Y
Pe
rform
ance
Finan
cial Ye
ar on
year P
erfo
rman
ce
Source: Respective AMC s| Data as on 30th April 2019. *FY-20 (Apr), CY-19 (Jan-Apr)
NTDOP NIFTY 500 ASK IEP BSE 500
CY-06 -- -- -- --
CY-07 -- -- -- --
CY-08 -53% -55% -- --
CY-09 110% 89% -- --
CY-10 23% 14% 29% 19%
CY-11 -19% -27% -13% -27%
CY-12 57% 32% 30% 31%
CY-13 18% 4% 22% 3%
CY-14 78% 38% 70% 37%
CY-15 16% -1% 8% -1%
CY-16 13% 4% 6% 4%
CY-17 43% 36% 37% 36%
CY-18 -6% -3% -2% -5%
CY-19* 0% 5% 4% 5%
NTDOP NIFTY 500 ASK IEP BSE 500
FY-08 -25% -25% -- --
FY-09 -38% -40% -- --
FY-10 117% 88% 1% 4%
FY-11 10% 7% 22% 7%
FY-12 12% -9% 3% -9%
FY-13 16% 5% 13% 5%
FY-14 40% 18% 34% 17%
FY-15 72% 34% 73% 33%
FY-16 2% -8% -5% -8%
FY-17 38% 24% 24% 24%
FY-18 11% 11% 15% 12%
FY-19 5% 8% 11% 8%
FY-20 3% 8% 11% 8%

Performance Track Record 4/4
VALUE NIFTY 50 IOP NIFTY Smallcap 100
Q4FY16 -2% -3% -5% -14%
Q1FY17 7% 7% 10% 19%
Q2FY17 7% 4% 27% 6%
Q3FY17 -9% -5% -5% -6%
Q4FY17 14% 12% 20% 21%
Q1FY18 3% 4% 13% 5%
Q2FY18 4% 3% -1% 4%
Q3FY18 6% 8% 12% 20%
Q4FY18 -4% -4% -17% -14%
Q1FY19 2% 6% -6% -8%
Q2FY19 -5% 2% -11% -14%
Q3FY19 2% -1% 5% 5%
Q4FY19 4% 7% 4% 3%
Q1FY20 1% 1% -2% -3%
VALUE NIFTY 50 IOP NIFTY Smallcap 100
Apr-18 6% 6% 6% 8%
May-18 -1% 0% -4% -7%
Jun-18 -3% 0% -7% -8%
Jul-18 3% 6% 2% 4%
Aug-18 2% 3% 3% 3%
Sept-18 -9% -6% -15% -20%
Oct-18 -5% -5% 0% -1%
Nov-18 6% 5% 2% 3%
Dec-18 1% 0% 3% 4%
Jan-19 -4% 0% -4% -5%
Feb- 19 1% 0% -2% -3%
Mar- 19 8% 8% 9% 12%
Apr- 19 1% 1% -2% -3%
NTDOP NIFTY 500 ASK IEP BSE 500
Q4FY16 -4% -4% -2% -4%
Q1FY17 12% 8% 10% 8%
Q2FY17 16% 6% 10% 6%
Q3FY17 -10% -6% -11% -6%
Q4FY17 17% 14% 14% 14%
Q1FY18 6% 4% 6% 4%
Q2FY18 5% 3% 5% 3%
Q3FY18 10% 10% 9% 10%
Q4FY18 -9% -6% -4% -6%
Q1FY19 4% 3% 7% 3%
Q2FY19 -2% -1% -4% -1%
Q3FY19 1% 1% 4% 1%
Q4FY19 1% 5% 4% 1%
Q1FY20 -1% 0% 0% 0%
NTDOP NIFTY 500 ASK IEP BSE 500
Apr-18 7% 7% 9% 7%
May-18 -1% -2% 2% -2%
Jun-18 -2% -2% -3% -2%
Jul-18 6% 5% 8% 5%
Aug-18 5% 4% 2% 3%
Sept-18 -11% -9% -13% -9%
Oct-18 -3% -4% -3% -4%
Nov-18 3% 4% 7% 4%
Dec-18 1% 1% 0% 1%
Jan-19 -5% -2% -4% -2%
Feb- 19 -1% -1% 2% -1%
Mar- 19 8% 8% 6% 8%
Apr- 19 -1% 0% 0% 0%
Q-O
-Q P
erfo
rman
ce u
pd
ate
M-O
-M P
erf
orm
ance
M-O
-M P
erfo
rman
ceQ
-O-Q
Pe
rform
ance
up
date
Source: Respective AMC s| Data as on 30th April 2019. *FY-20 (Apr), CY-19 (Jan-Apr)

Portfolio Analysis & Fees Structure
o Peer group comparison
o Stock Universe of our PMS offerings
o Portfolio Market Cap Style
o Risk Return analysis
o Fee Schedule

Peer group comparison 1/2
Data as on 30th April 2019| Source: ACE MF
Scheme Name 6 Months1
Year3
Years5
Years
Edelweiss Large Cap Fund 12.86 3.95 13.54 14.47
ICICI Prudential Bluechip Fund 10.13 5.03 14.48 14.48
IDFC Large Cap Fund 11.33 3.45 12.83 10.73
Invesco India Largecap Fund 13.92 3.62 12.56 14.37
Canara Robeco Bluechip Equity Fund 12.94 7.10 14.04 13.27
HSBC Large Cap Equity Fund 13.90 2.67 13.98 12.38
UTI Mastershare 11.93 3.52 12.33 13.55
Reliance Large Cap Fund 12.83 8.24 16.90 16.82
SBI Bluechip Fund 13.20 0.17 11.43 15.49
L&T India Large Cap Fund 13.60 3.36 12.06 13.26
Aditya Birla Sun Life Frontline Equity Fund 11.31 2.56 12.52 14.13
DSP Top 100 Equity Fund 14.60 1.63 11.22 11.86
Kotak Bluechip Fund - Dividend 15.02 4.69 11.87 13.98
Tata Large Cap Fund 13.93 4.67 11.76 12.64
Franklin India Bluechip 11.16 2.92 10.15 12.74
DHFL Pramerica Large Cap Fund Fund 12.49 3.48 11.47 13.42
HDFC Top 100 Fund 13.56 11.62 16.56 14.39
BNP Paribas Large Cap Fund 14.40 3.94 10.34 14.53
IDBI India Top 100 Equity Fund 12.31 -1.00 8.63 11.79
Category avg 13.23 3.59 12.33 13.26
Nifty 50 15.20 9.39 14.37 11.89
Value Strategy 12.96 -1.51 9.84 14.48
Scheme Name 6 Months1
Year3
Years5
Years
UTI Equity Fund 12.47 2.21 13.09 14.64
Invesco India Multicap Fund 5.89 -9.35 10.93 16.51
Canara Robeco Equity Diversified Fund 13.87 6.56 15.54 13.91
Principal Multi Cap Growth Fund 7.42 -5.29 15.73 15.96
SBI Magnum Multi Cap Fund 14.87 1.52 13.95 18.33
L&T Equity Fund 7.78 -3.73 12.02 13.70
IDFC Multi Cap Fund 10.05 -3.31 9.59 14.92
HSBC Multi Cap Equity Fund 10.30 -4.41 11.27 13.77
DSP Equity Fund 16.18 1.47 14.59 15.56
Aditya Birla Sun Life Equity Fund 10.39 -0.64 14.92 17.26
Reliance Multi Cap Fund 13.23 4.17 13.44 14.55
ICICI Prudential Multicap Fund 9.08 6.17 13.96 16.06
BNP Paribas Multi Cap Fund 10.65 -3.02 11.09 15.29
Franklin India Equity Fund 10.76 1.01 10.62 15.70
Kotak Standard Multicap Fund 14.87 7.01 16.45 18.65
JM Multicap Fund 12.60 2.49 15.86 16.26
HDFC Equity Fund 12.41 8.13 16.26 14.61
Category avg 10.70 -1.32 13.31 15.54
Nifty 500 12.37 1.77 13.61 12.95
NTDOP Strategy 4.11 -3.69 15.62 23.06
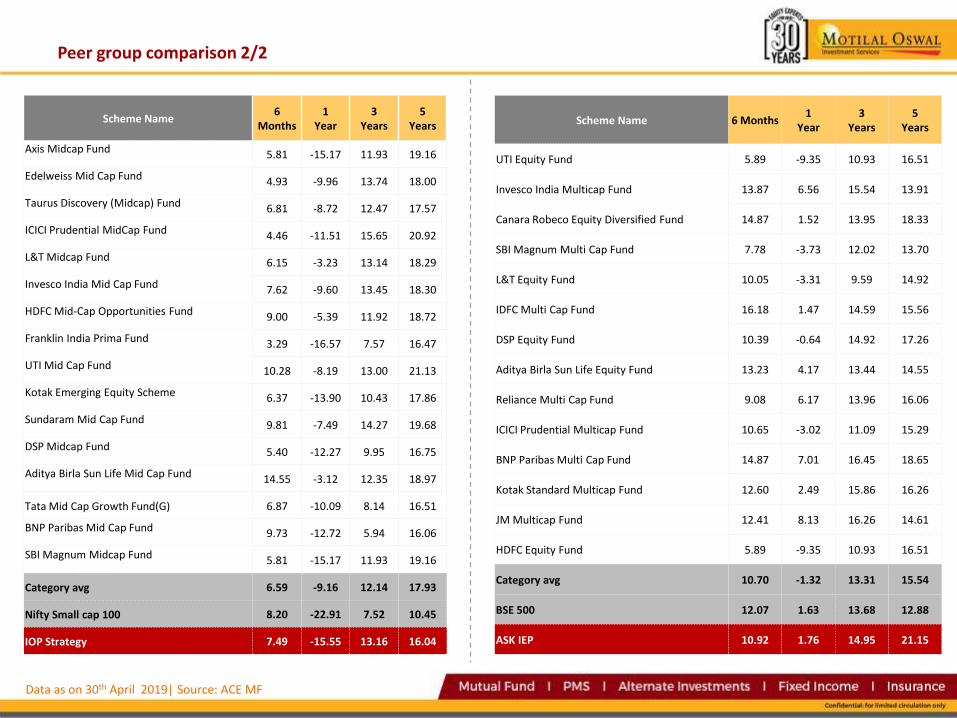
Peer group comparison 2/2
Scheme Name6
Months1
Year3
Years5
Years
Axis Midcap Fund 5.81 -15.17 11.93 19.16
Edelweiss Mid Cap Fund 4.93 -9.96 13.74 18.00
Taurus Discovery (Midcap) Fund 6.81 -8.72 12.47 17.57
ICICI Prudential MidCap Fund 4.46 -11.51 15.65 20.92
L&T Midcap Fund 6.15 -3.23 13.14 18.29
Invesco India Mid Cap Fund 7.62 -9.60 13.45 18.30
HDFC Mid-Cap Opportunities Fund 9.00 -5.39 11.92 18.72
Franklin India Prima Fund 3.29 -16.57 7.57 16.47
UTI Mid Cap Fund 10.28 -8.19 13.00 21.13
Kotak Emerging Equity Scheme 6.37 -13.90 10.43 17.86
Sundaram Mid Cap Fund 9.81 -7.49 14.27 19.68
DSP Midcap Fund 5.40 -12.27 9.95 16.75
Aditya Birla Sun Life Mid Cap Fund 14.55 -3.12 12.35 18.97
Tata Mid Cap Growth Fund(G) 6.87 -10.09 8.14 16.51
BNP Paribas Mid Cap Fund 9.73 -12.72 5.94 16.06
SBI Magnum Midcap Fund 5.81 -15.17 11.93 19.16
Category avg 6.59 -9.16 12.14 17.93
Nifty Small cap 100 8.20 -22.91 7.52 10.45
IOP Strategy 7.49 -15.55 13.16 16.04
Scheme Name 6 Months1
Year3
Years5
Years
UTI Equity Fund 5.89 -9.35 10.93 16.51
Invesco India Multicap Fund 13.87 6.56 15.54 13.91
Canara Robeco Equity Diversified Fund 14.87 1.52 13.95 18.33
SBI Magnum Multi Cap Fund 7.78 -3.73 12.02 13.70
L&T Equity Fund 10.05 -3.31 9.59 14.92
IDFC Multi Cap Fund 16.18 1.47 14.59 15.56
DSP Equity Fund 10.39 -0.64 14.92 17.26
Aditya Birla Sun Life Equity Fund 13.23 4.17 13.44 14.55
Reliance Multi Cap Fund 9.08 6.17 13.96 16.06
ICICI Prudential Multicap Fund 10.65 -3.02 11.09 15.29
BNP Paribas Multi Cap Fund 14.87 7.01 16.45 18.65
Kotak Standard Multicap Fund 12.60 2.49 15.86 16.26
JM Multicap Fund 12.41 8.13 16.26 14.61
HDFC Equity Fund 5.89 -9.35 10.93 16.51
Category avg 10.70 -1.32 13.31 15.54
BSE 500 12.07 1.63 13.68 12.88
ASK IEP 10.92 1.76 14.95 21.15
Data as on 30th April 2019| Source: ACE MF

Stock Universe of our PMS offerings
Source: Respective AMCs| Data as on 30th April 2019
• Duplication of stocks are limited across our offerings.
• Concentrated portfolio with 15 to 25 stocks ideas.
• Exposure to companies in line with investment theme.
Stock Universe No. of Stocks
Universe of Stocks 190
Unique no. of Stocks 135
Stocks common 41
Strategies(Total No. of
stocks)ASK IEP (20) BOP (22)
Invesco DAWN (22)
IOP (24) IOP V2 (20) NTDOP (26)Renaissance
Midcap Portfolio(20)
Renaissance Opportunities Portfolio (15)
Value PMS (21)
ASK IEP (20) 12 (50%) 3 (19%) 1 (6%) 0 (0%) 1 (6%) 4 (23%) 0 (0%) 1 (6%) 3 (18%)
BOP (22) 3 (17%) 7 (30%) 2 (9%) 1 (5%) 5 (20%) 3 (17%) 1 (2%) 2 (12%) 4 (22%)
Invesco DAWN (22)
1 (4%) 2 (9%) 12 (46%) 0 (0%) 0 (0%) 3 (19%) 0 (0%) 6 (35%) 4 (27%)
IOP (24) 0 (0%) 1 (5%) 0 (0%) 14 (58%) 0 (0%) 4 (15%) 1 (11%) 0 (0%) 2 (12%)
IOP V2 (20) 1 (8%) 5 (28%) 0 (0%) 0 (0%) 13 (54%) 1 (9%) 0 (0%) 0 (0%) 1 (9%)
NTDOP (26) 4 (31%) 3 (20%) 3 (10%) 4 (8%) 1 (3%) 10 (40%) 1 (2%) 4 (22%) 6 (30%)
Renaissance Midcap (20)
0 (0%) 1 (4%) 0 (0%) 1 (8%) 0 (0%) 1 (8%) 14 (63%) 3 (16%) 0 (0%)
Renaissance Opp. (15)
1 (6%) 2 (13%) 6 (39%) 0 (0%) 0 (0%) 4 (22%) 3 (18%) 2 (16%) 7 (44%)
Value PMS (21) 3 (18%) 4 (33%) 4 (14%) 2 (5%) 1 (3%) 6 (25%) 0 (0%) 7 (41%) 6 (20%)
Note : Unique stocks & allocation mentioned in highlighted cells

Portfolio Market Cap Style
Source: Capital Line | Data as on 30th April 2019 | Weighted average market cap capitalization | Market Capitalization as per SEBI categorization
Large Cap: 1st to 100th company | Mid Cap: 101st to 250th company | Small Cap: 250 onward
18,56,256.05
7,20,177.16
1,01,321.07
12,82,426.35
7,73,880.22
15,27,594.82
85,035.83
1,19,977.46
23,28,005.30
Value
NTDOP
IOP V2
BOP
IEP
DAWN
IOP
Renaissance Midcap PMS
Renaissance Opp. PMS
Market Cap (Cr.)
80%
44%
53%
66%
59%
1%
4%
75%
15%
52%
43%
28%
31%
18%
26%
50%
23%
4%
56%
20%
3%
18%
73%
45%
5%
6%
1%
2%
Value
NTDOP
IOP V2
BOP
IEP
DAWN
IOP
Renaissance Midcap PMS
Renaissance Opp. PMS
Large Cap Mid Cap Small Cap Cash

Risk Return analysis
Risk return parameter of all the strategy based on its benchmark
Data as on 30th April 2019. Risk free rate has been taken as 7%.
Risk parameter VALUE IOP IEP NTDOP Interpretation
Standard Deviation 15% 12% 10% 12%Lower the better
(volatility Risk)
Beta (Slope) 0.81 0.83 0.53 0.51Lowe the better
(Market Risk)
Jensen's (Alpha) 5% 5% 12% 15%
Higher the betterSharpe Ratio 0.57 0.94 1.47 1.45
Treynor 10% 13% 26% 33%
Up-Market Capture Ratio 1.22 1.01 1.64 1.72Considering benchmark is 1, greater than 1 means fund has outperformed the index during the up-
market
Down-Market Capture Ratio
0.68 0.38 -0.13 0.38Considering benchmark is 1, lesser than 1 means
fund has outperformed the index during the down-market
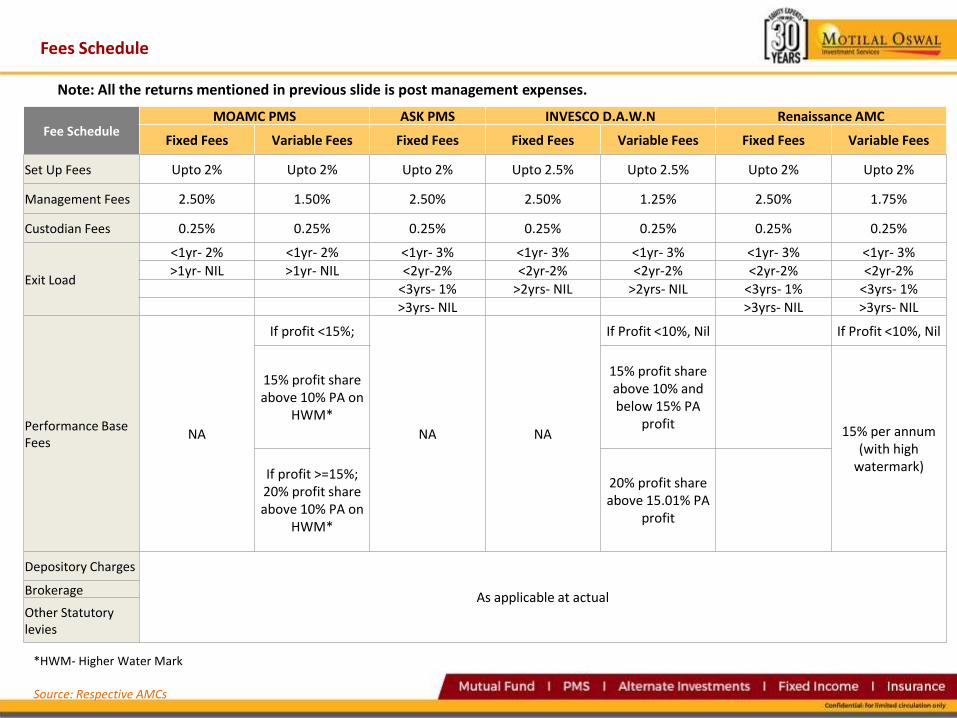
Fees Schedule
Note: All the returns mentioned in previous slide is post management expenses.
*HWM- Higher Water Mark
Source: Respective AMCs
Fee ScheduleMOAMC PMS ASK PMS INVESCO D.A.W.N Renaissance AMC
Fixed Fees Variable Fees Fixed Fees Fixed Fees Variable Fees Fixed Fees Variable Fees
Set Up Fees Upto 2% Upto 2% Upto 2% Upto 2.5% Upto 2.5% Upto 2% Upto 2%
Management Fees 2.50% 1.50% 2.50% 2.50% 1.25% 2.50% 1.75%
Custodian Fees 0.25% 0.25% 0.25% 0.25% 0.25% 0.25% 0.25%
Exit Load
<1yr- 2% <1yr- 2% <1yr- 3% <1yr- 3% <1yr- 3% <1yr- 3% <1yr- 3%
>1yr- NIL >1yr- NIL <2yr-2% <2yr-2% <2yr-2% <2yr-2% <2yr-2%<3yrs- 1% >2yrs- NIL >2yrs- NIL <3yrs- 1% <3yrs- 1%>3yrs- NIL >3yrs- NIL >3yrs- NIL
Performance Base Fees
NA
If profit <15%;
NA NA
If Profit <10%, Nil If Profit <10%, Nil
15% profit share above 10% PA on
HWM*
15% profit share above 10% and below 15% PA
profit15% per annum
(with high watermark)
If profit >=15%; 20% profit share above 10% PA on
HWM*
20% profit share above 15.01% PA
profit
Depository Charges
As applicable at actualBrokerage
Other Statutory levies

Thank You !
Motilal Oswal Securities Ltd. (MOSL)* Member of NSE, BSE, MCX, NCDEX, CIN no.: U65990MH1994PLC079418.Registered Office Address: Motilal Oswal Tower, Rahimtullah Sayani Road, Opposite Parel ST Depot, Prabhadevi, Mumbai-400025; Tel No.: 022-3980 4263; Website www.motilaloswal.com. Correspondence Adds: Palm Spring Centre, 2nd Floor, Palm Court Complex, New Link Road, Malad (West), Mumbai- 400 064. Tel No: 022 3080 1000. Registration Nos.: Motilal Oswal Securities Ltd. (MOSL)*: INZ000158836 (BSE/NSE/MCX/NCDEX); CDSL: IN-DP-16-2015; NSDL: IN-DP-NSDL-152-2000; Research Analyst: INH000000412. AMFI: ARN 17397; Investment Adviser: INA000007100; IRDA Corporate Agent: CA0541. Motilal Oswal Asset Management Company Ltd. (MOAMC): PMS (Registration No.: INP000000670); PMS and Mutual Funds are offered through MOAMC which is group company of MOSL. Motilal Oswal Wealth Management Ltd. (MOWML): PMS (Registration No.: INP000004409) is offered through MOWML, which is a group company of MOSL. Motilal Oswal Securities Ltd. is a distributor of Mutual Funds, PMS, Fixed Deposit, Bond, NCDs, Insurance Products and IPOs. Real Estate is offered through Motilal OswalReal Estate Investment Advisors II Pvt. Ltd. which is a group company of MOFSL. Private Equity is offered through Motilal Oswal Private Equity Investment Advisors Pvt. Ltd which is a group company of MOFSL. Research & Advisory services is backed by proper research. Please read the Risk Disclosure Document prescribed by the Stock Exchanges carefully before investing. There is no assurance or guarantee of the returns. Details of Compliance Officer: Name: Neeraj Agarwal, Email ID: [email protected], Contact No.:022-38281085. * MOSL has been amalgamated with Motilal Oswal Financial Services Limited (MOFSL) w.e.f August 21, 2018 pursuant to order dated July 30, 2018 issued by Hon'ble National Company Law Tribunal, Mumbai Bench. The existing registration no(s) of MOSL would be used until receipt of new MOFSL registration numbers. Investment in securities market are subject to market risks, read all the related documents carefully before investing.

Awards & Accolades