PMP Exam Preparation Workshop Project Quality Management · Organizational Project Management...
107
1 Project Quality Management PMP Exam Preparation Workshop Copyright © 2015 PMI SOC
Transcript of PMP Exam Preparation Workshop Project Quality Management · Organizational Project Management...
1
Project Quality Management
PMP Exam Preparation
Workshop
Copyright © 2015 PMI SOC
2 2
Learning Objectives
By the end of this session you will understand:
• The PM Quality Processes
• The PM Process Groups
• Project Quality Management
– Inputs
– Tools & Techniques
– Outputs
Copyright © 2015 PMI SOC
3 3
Agenda
• Introduction
• Plan Quality Management
• Perform Quality Assurance
• Control Quality
• Sample Exam Questions
Copyright © 2015 PMI SOC
4 4
Introduction to Project Quality Management
Experts define Quality based on:
• Conformance to requirements: Project’s processes and
products meet specifications.
• Fitness for use: A product can be used as it was intended.
The concept addresses both:
– Management of the project
– Deliverables of the project
Every project should have a Quality Management Plan.
PMBOK 5E Ref #8.0
Copyright © 2015 PMI SOC
5 5
Quality vs. Grade
Quality is “the degree to which a set of inherent characteristics
fulfill requirements.” (PMBOK Guide 5th Edition definition –
glossary). It includes stated and implied needs.
Grade is a category assigned to products or services having the
same functional use but different technical characteristics.
For example, a software product can be of: High Quality (no
defects) and Low Grade (a limited number of features), or of Low
Quality (many defects) and High Grade (numerous features)
PMBOK 5E Ref #8.0
Copyright © 2015 PMI SOC
6 6
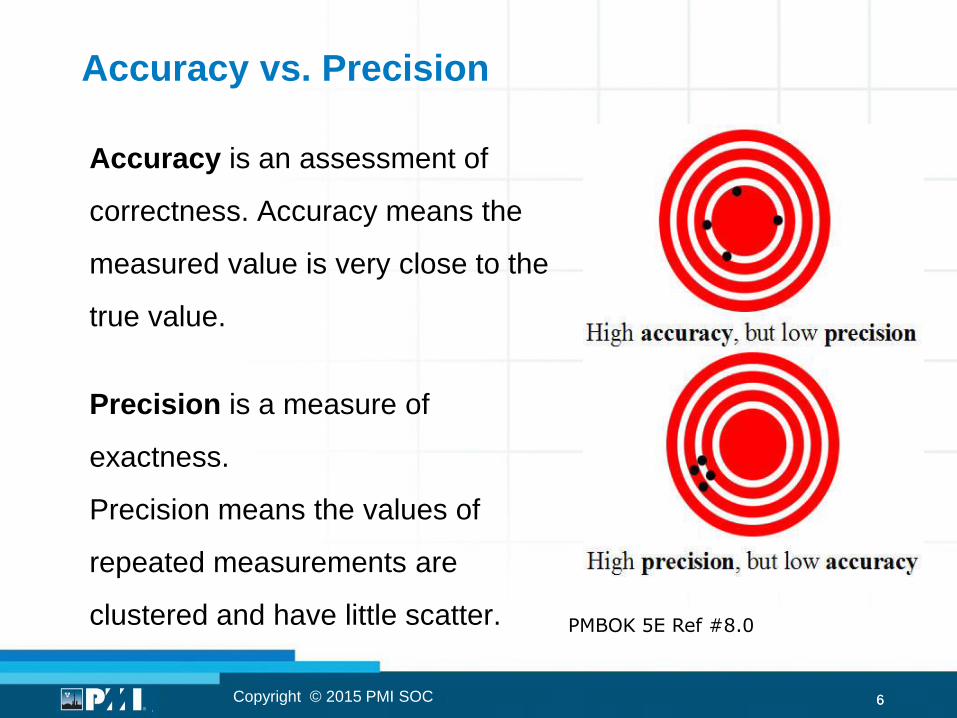
Accuracy vs. Precision
Accuracy is an assessment of
correctness. Accuracy means the
measured value is very close to the
true value.
Precision is a measure of
exactness.
Precision means the values of
repeated measurements are
clustered and have little scatter.
PMBOK 5E Ref #8.0
Copyright © 2015 PMI SOC
7 7
Project Quality Management
• The Project Manager and Project Team are
responsible for managing the level of Quality and
Grade
• The Project Team must determine appropriate
levels of Accuracy and Precision
PMBOK 5E Ref #8.0
Copyright © 2015 PMI SOC
8 8
Project Quality Management
Modern quality management complements project
management by recognizing the importance of:
Customer Satisfaction: Understanding, evaluating, defining,
and managing requirements to meet customer expectations.
The product or service must satisfy real needs.
Prevention over Inspection: Quality is planned, designed,
and built into the deliverables – not inspected in. The cost of
preventing mistakes is generally much less than the cost of
correcting them when they are found by inspection.
PMBOK Ref #8.0
Copyright © 2015 PMI SOC
9 9
Project Quality Management – cont’d
Management Responsibility: Management is responsible
for providing the resources needed to succeed.
Continuous Improvement: Initiatives such as the plan-do-
check-act cycle as defined by Shewhart/Deming; quality
initiatives such as TQM and Lean Six Sigma; process
improvement models such as Malcolm Baldrige,
Organizational Project Management Maturity Model (OPM3);
and, Capability Maturity Model Integrated (CMMI).
Cost of Quality (COQ): Total cost of conformance and non-
conformance work. PMBOK 5E Ref #8.0
Copyright © 2015 PMI SOC
10 10
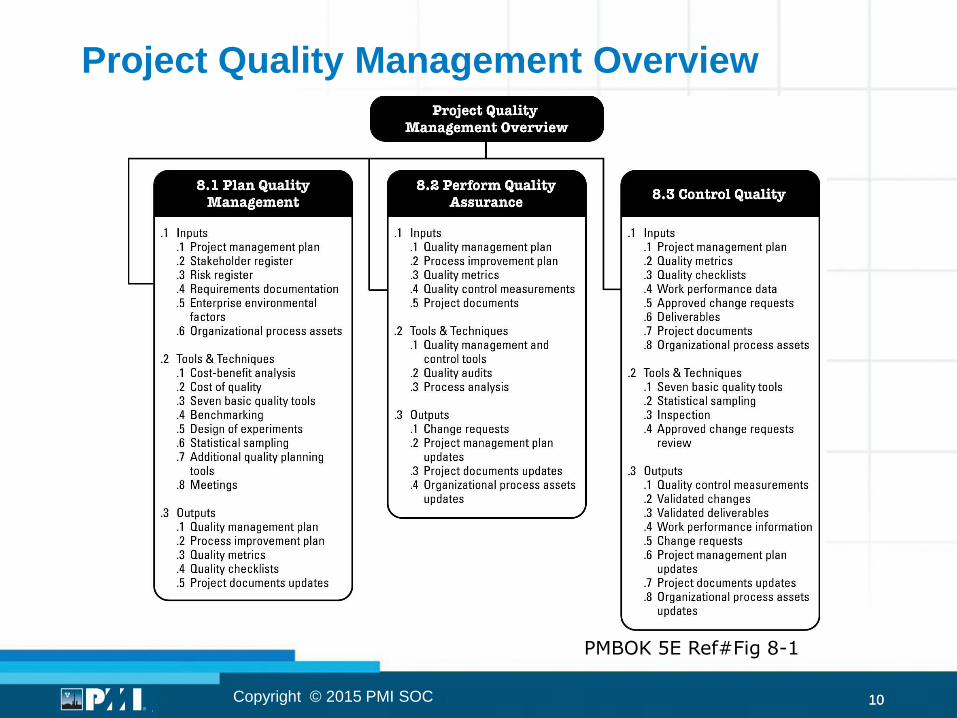
PMBOK 5E Ref#Fig 8-1
Project Quality Management Overview
Copyright © 2015 PMI SOC
11 11
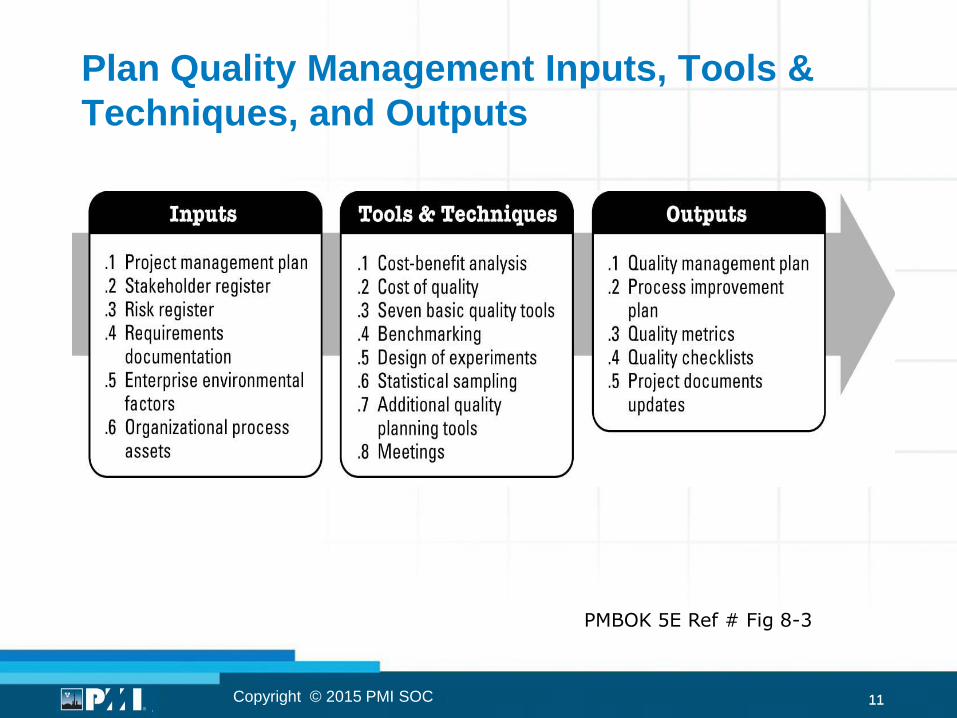
Plan Quality Management Inputs, Tools &
Techniques, and Outputs
PMBOK 5E Ref # Fig 8-3
Copyright © 2015 PMI SOC
12 12
Plan Quality Management
Plan Quality Management process:
• Identifies quality standards relevant to the project
• Documents how the project will demonstrate
compliance to the quality requirements
PMBOK 5E Ref #8.1
Copyright © 2015 PMI SOC
13 13
Plan Quality Management
Plan Quality Management process:
Key benefit of this process: It provides guidance and
direction on how quality will be managed and
validated throughout project.
Fundamental quality tenet: Quality is planned,
designed and built in – not inspected in.
PMBOK 5E Ref #8.1
Copyright © 2015 PMI SOC
14 14
Plan Quality Management - Inputs
Project Management Plan
• Scope baseline
• Schedule baseline
• Cost baseline
• Other management plans
PMBOK 5E Ref #8.1.1
Copyright © 2015 PMI SOC
15 15
Plan Quality Management - Inputs
• Stakeholder Register
• Risk Register
• Requirements Documentation
• Enterprise Environmental Factors
• Organizational Process Assets
PMBOK 5E Ref #8.1.1
Copyright © 2015 PMI SOC
16 16
Plan Quality Management - Tools & Techniques
• Cost-Benefit Analysis
• Cost of Quality (COQ)
• Seven Basic Quality Tools
• Benchmarking
• Design of Experiments (DOE)
• Statistical Sampling
• Additional Quality Planning Tools
• Meetings
PMBOK 5E Ref #8.1.2
Copyright © 2015 PMI SOC
17 17
Quality Management must consider cost to benefit trade offs
• Benefits of quality management include:
– less rework
– higher productivity
– lower costs
– Increased stakeholder satisfaction
– Increased profitability
• Costs of quality management include:
– All costs associated with Quality Management activities
Cost-Benefit Analysis
Copyright © 2015 PMI SOC
PMBOK 5E Ref #8.1.2
18 18
Cost of quality includes all costs incurred over the life of
the product or service through:
– Investment in preventing nonconformance to
requirements
– Appraising the product or service for conformance to
requirements
– Failing to meet requirements (rework)
Copyright © 2015 PMI SOC
Cost of Quality (COQ)
PMBOK 5E Ref #8.1.2
19 19
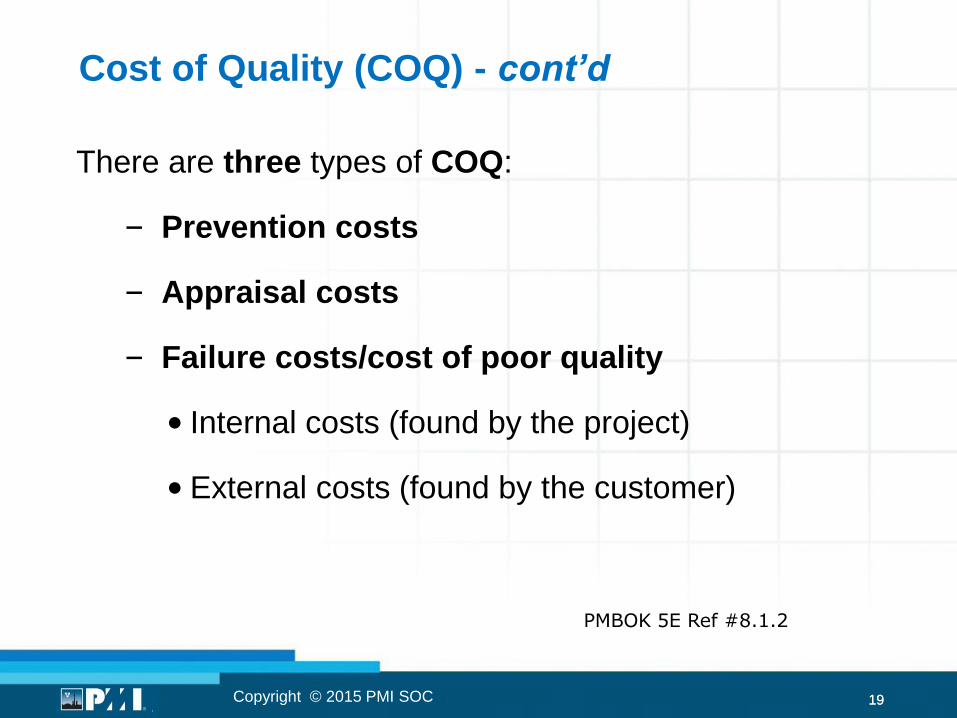
Cost of Quality (COQ) - cont’d
There are three types of COQ:
– Prevention costs
– Appraisal costs
– Failure costs/cost of poor quality
• Internal costs (found by the project)
• External costs (found by the customer)
Copyright © 2015 PMI SOC
PMBOK 5E Ref #8.1.2
20 20 Copyright © 2015 PMI SOC
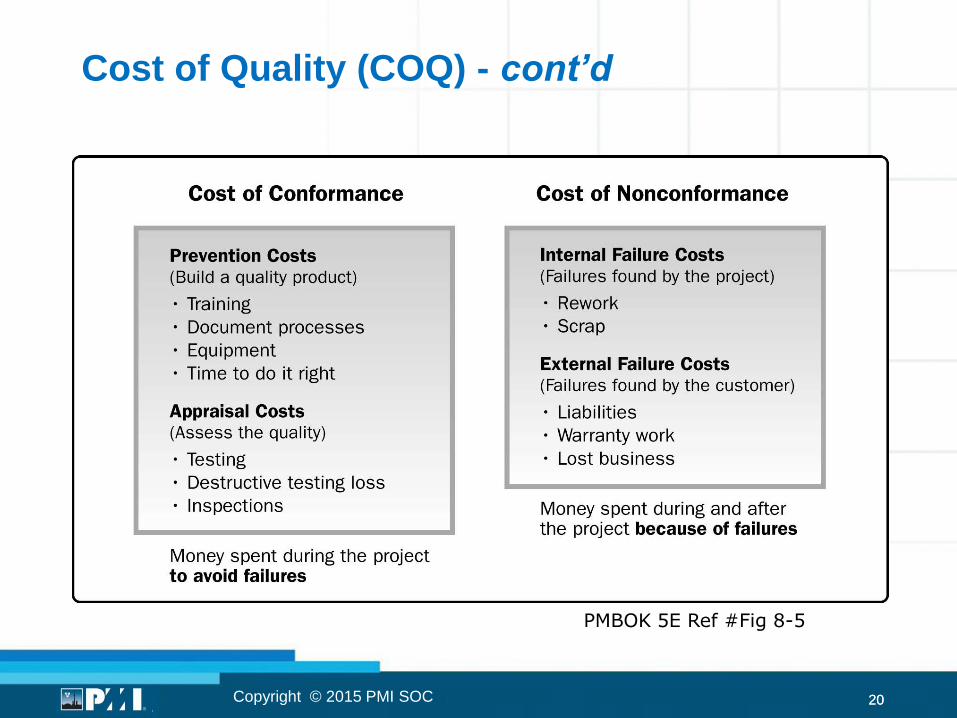
Cost of Quality (COQ) - cont’d
PMBOK 5E Ref #Fig 8-5
21 21
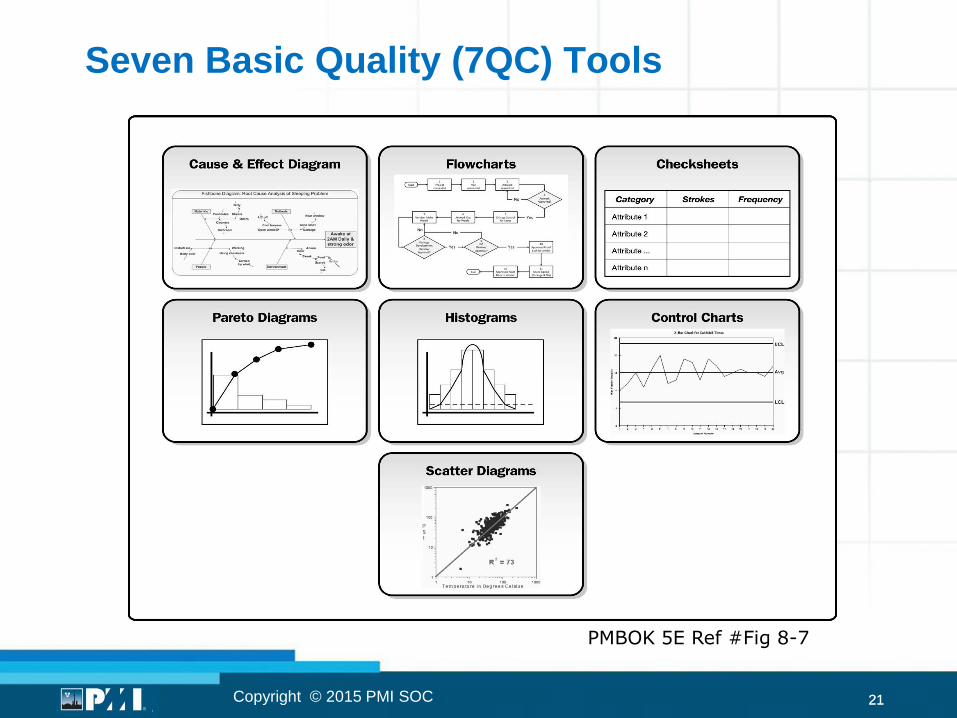
Seven Basic Quality (7QC) Tools
PMBOK 5E Ref #Fig 8-7
Copyright © 2015 PMI SOC
22 22
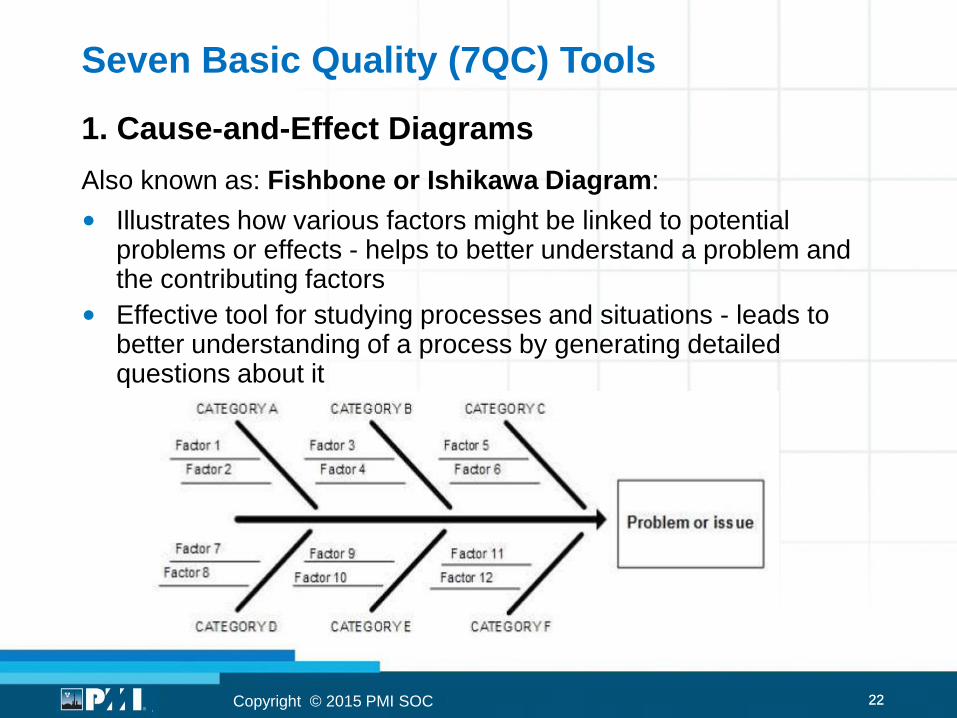
1. Cause-and-Effect Diagrams
Also known as: Fishbone or Ishikawa Diagram:
• Illustrates how various factors might be linked to potential problems or effects - helps to better understand a problem and the contributing factors
• Effective tool for studying processes and situations - leads to better understanding of a process by generating detailed questions about it
Seven Basic Quality (7QC) Tools
Copyright © 2015 PMI SOC
23 23
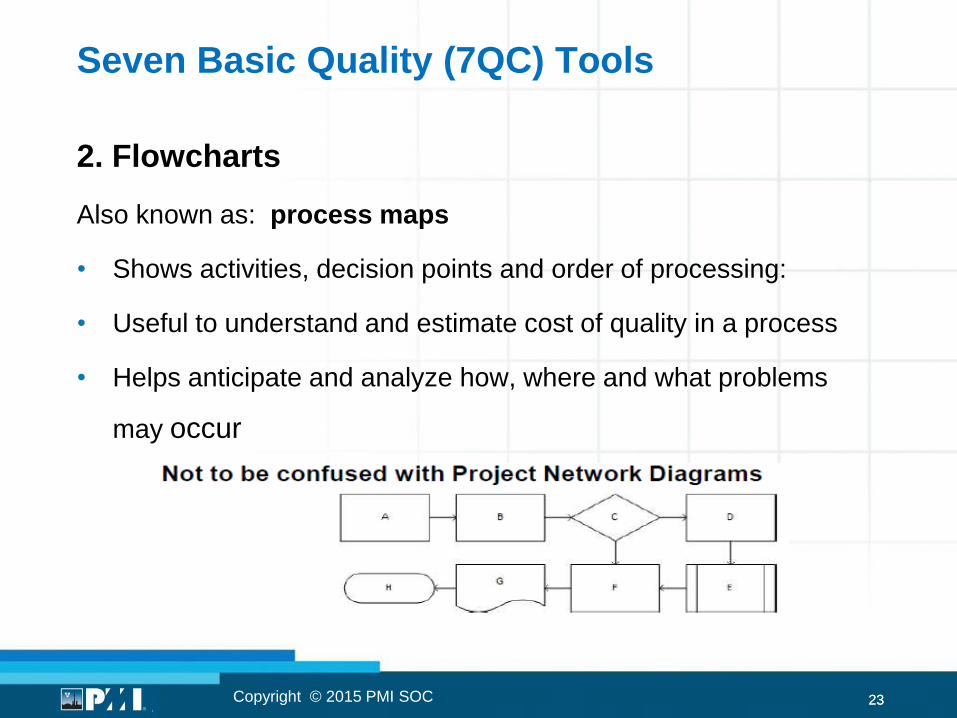
2. Flowcharts
Also known as: process maps
• Shows activities, decision points and order of processing:
• Useful to understand and estimate cost of quality in a process
• Helps anticipate and analyze how, where and what problems
may occur
Copyright © 2015 PMI SOC
Seven Basic Quality (7QC) Tools
24 24
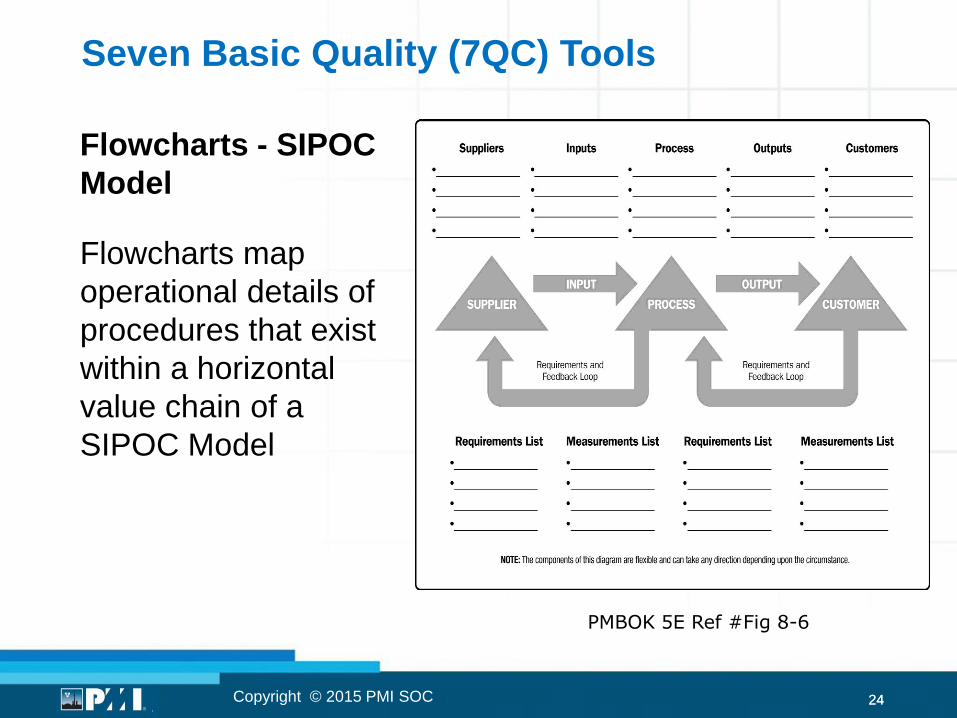
Flowcharts - SIPOC
Model
Flowcharts map
operational details of
procedures that exist
within a horizontal
value chain of a
SIPOC Model
Seven Basic Quality (7QC) Tools
Copyright © 2015 PMI SOC
PMBOK 5E Ref #Fig 8-6
25 25
Seven Basic Quality (7QC) Tools
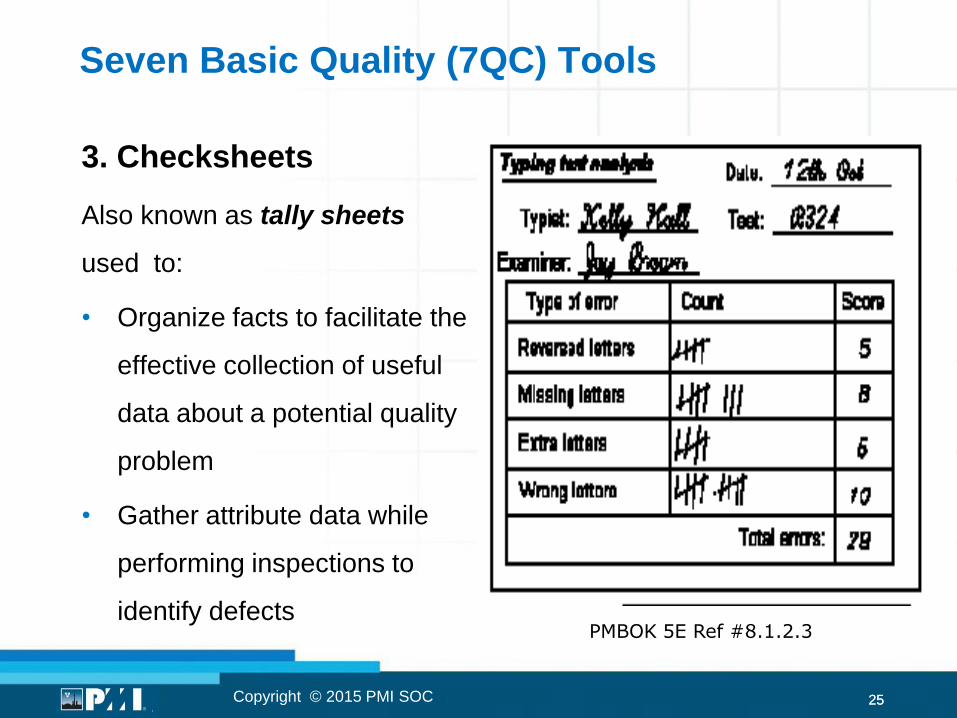
3. Checksheets
Also known as tally sheets
used to:
• Organize facts to facilitate the
effective collection of useful
data about a potential quality
problem
• Gather attribute data while
performing inspections to
identify defects
Copyright © 2015 PMI SOC
PMBOK 5E Ref #8.1.2.3
26 26
Seven Basic Quality (7QC) Tools
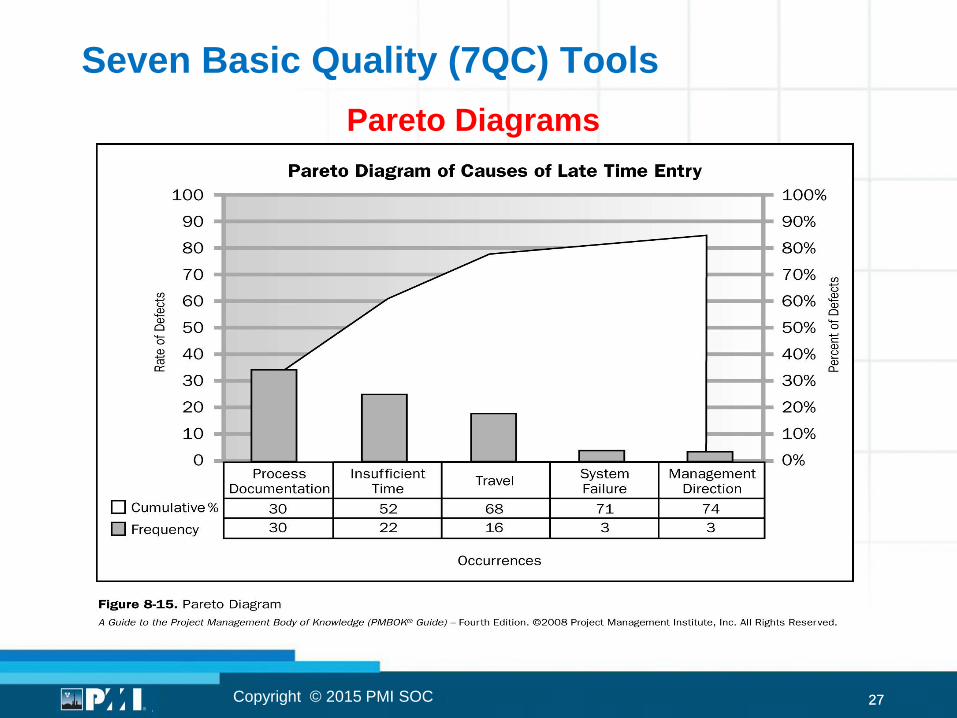
4. Pareto Diagrams
• Special form of vertical bar chart used to identify vital few
sources responsible for causing most of a problem’s effects
• Categories on horizontal axis are a valid probability distribution
that accounts for 100% of possible observations
• Frequencies for each cause decrease in magnitude until ‘other’
accounts for non-specified causes
• Typically organized into categories that measure frequencies
or consequences
Copyright © 2015 PMI SOC
PMBOK 5E Ref #8.1.2.3
27 27
Seven Basic Quality (7QC) Tools
Copyright © 2015 PMI SOC
Pareto Diagrams
28 28
Seven Basic Quality (7QC) Tools
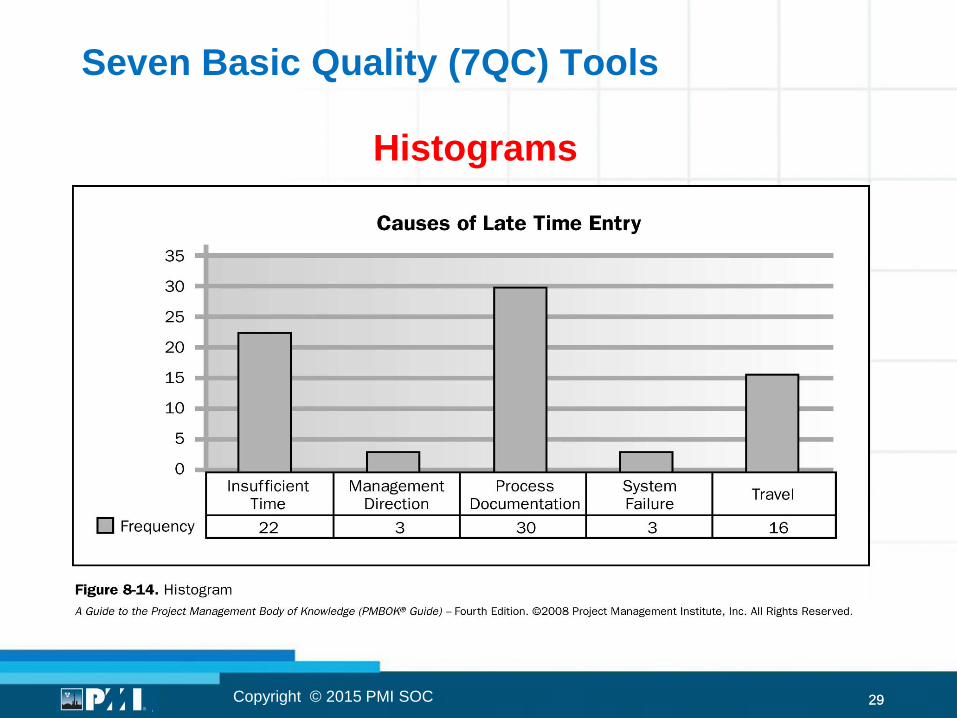
5. Histograms
• Special form of bar chart
• Used to describe the central tendency, dispersion,
and shape of a statistical distribution
• Does not consider the influence of time on the
variation that exists within a distribution (unlike the
control chart)
Copyright © 2015 PMI SOC
PMBOK 5E Ref #8.1.2.3
29 29 Copyright © 2015 PMI SOC
Histograms
Seven Basic Quality (7QC) Tools
30 30
Seven Basic Quality (7QC) Tools
6. Control Charts
• Visually display if the process (measurements) are in control
• Help to predict trends
• Main use of control charts is to prevent defects, rather than to
detect or reject them
• The upper control limit and lower control limit are generally +/- 3
sigma around a process mean set at 0 sigma
• Upper (maximum) and lower (minimum) values are based on
contract requirements. The values are set by Project Manager
and appropriate stakeholders to reflect the points at which
corrective action will be taken to prevent exceeding specification
limits.
Copyright © 2015 PMI SOC
PMBOK 5E Ref #8.1.2.3
31 31
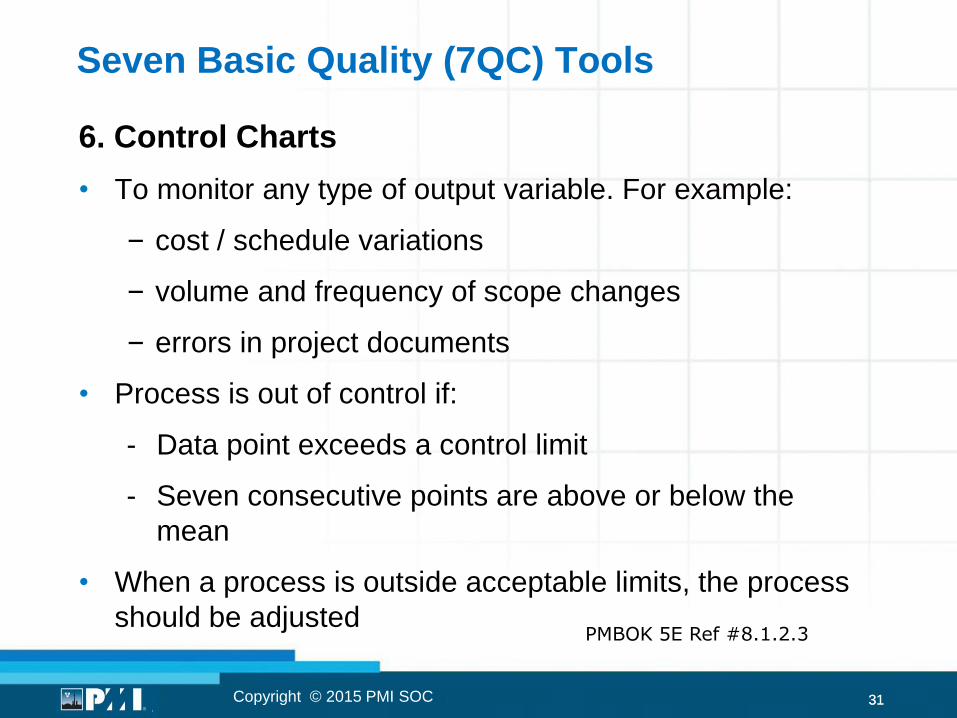
Seven Basic Quality (7QC) Tools
6. Control Charts
• To monitor any type of output variable. For example:
– cost / schedule variations
– volume and frequency of scope changes
– errors in project documents
• Process is out of control if:
- Data point exceeds a control limit
- Seven consecutive points are above or below the
mean
• When a process is outside acceptable limits, the process
should be adjusted
Copyright © 2015 PMI SOC
PMBOK 5E Ref #8.1.2.3
32 32
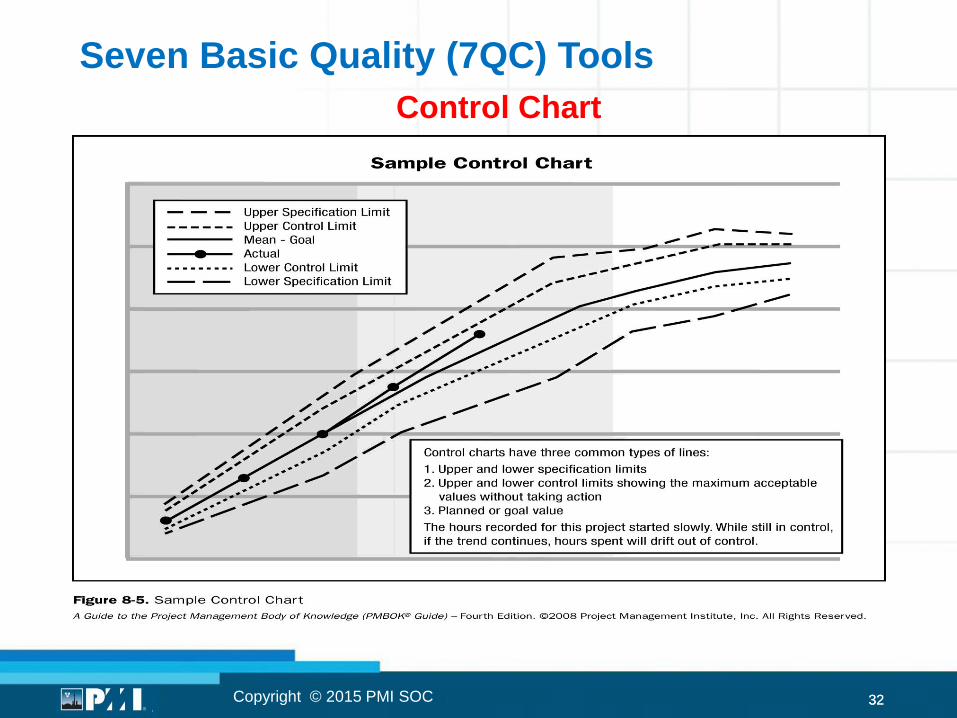
Seven Basic Quality (7QC) Tools
Control Chart
Copyright © 2015 PMI SOC
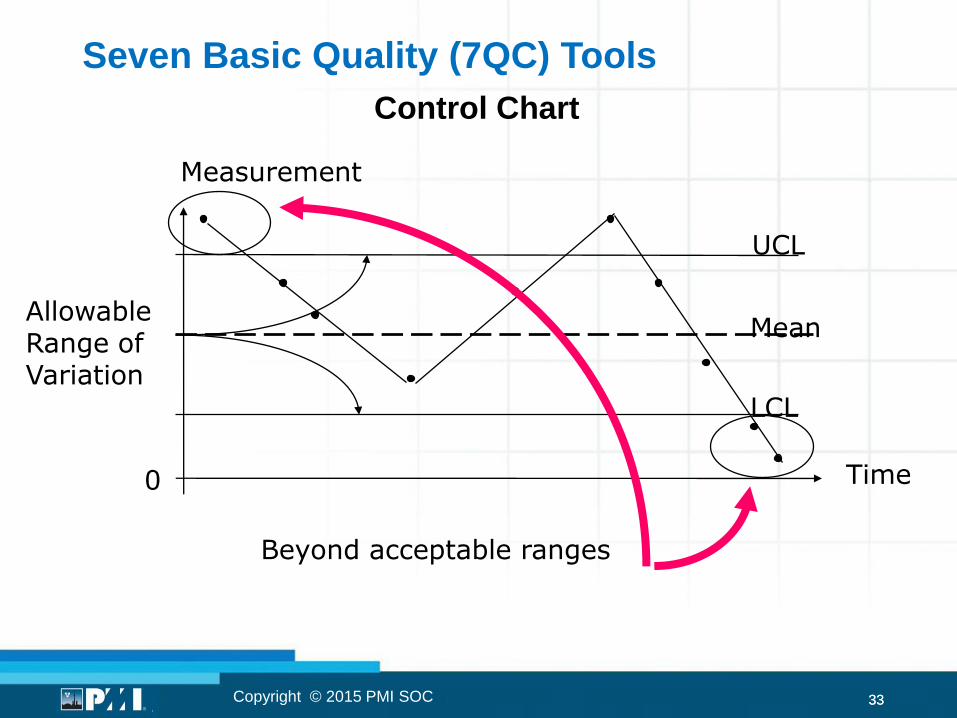
33 33
Control Chart
Measurement
Time 0
UCL
LCL
Mean Allowable Range of Variation
Beyond acceptable ranges
Copyright © 2015 PMI SOC
Seven Basic Quality (7QC) Tools
34 34
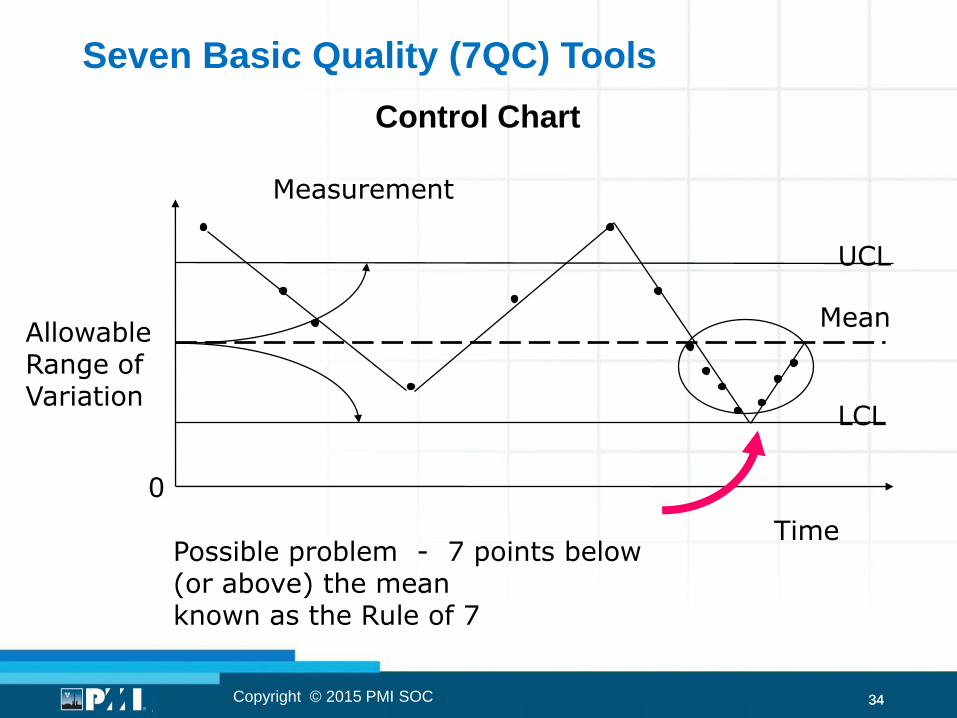
Control Chart
Measurement
Time
0
UCL
LCL
Mean Allowable Range of Variation
Possible problem - 7 points below (or above) the mean known as the Rule of 7
Copyright © 2015 PMI SOC
Seven Basic Quality (7QC) Tools
35 35
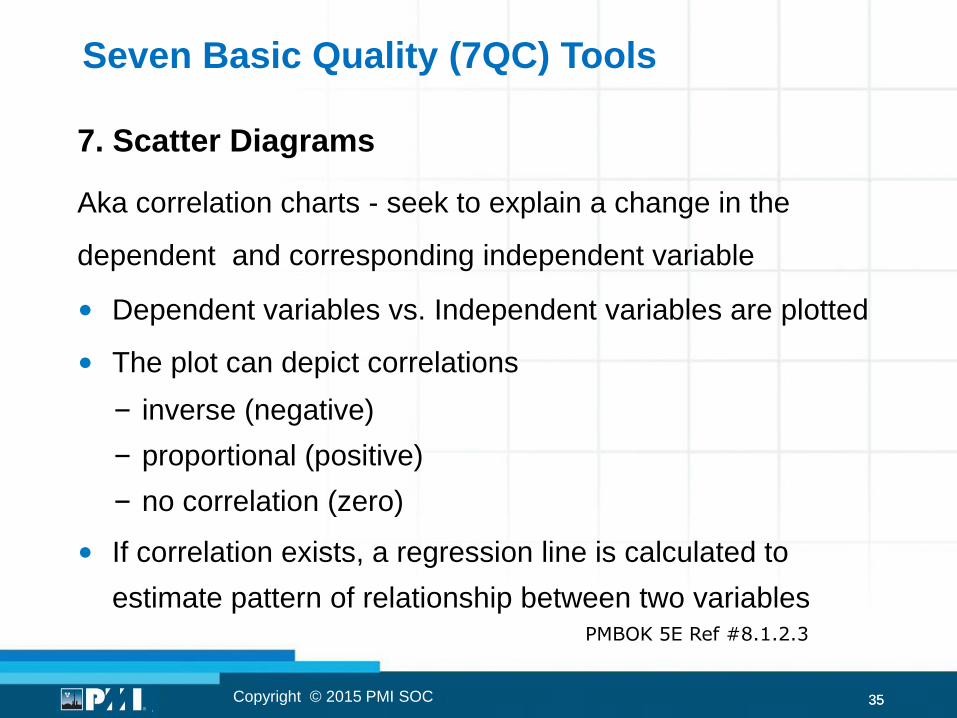
7. Scatter Diagrams
Aka correlation charts - seek to explain a change in the
dependent and corresponding independent variable
• Dependent variables vs. Independent variables are plotted
• The plot can depict correlations
– inverse (negative)
– proportional (positive)
– no correlation (zero)
• If correlation exists, a regression line is calculated to
estimate pattern of relationship between two variables
Copyright © 2015 PMI SOC
Seven Basic Quality (7QC) Tools
PMBOK 5E Ref #8.1.2.3
36 36
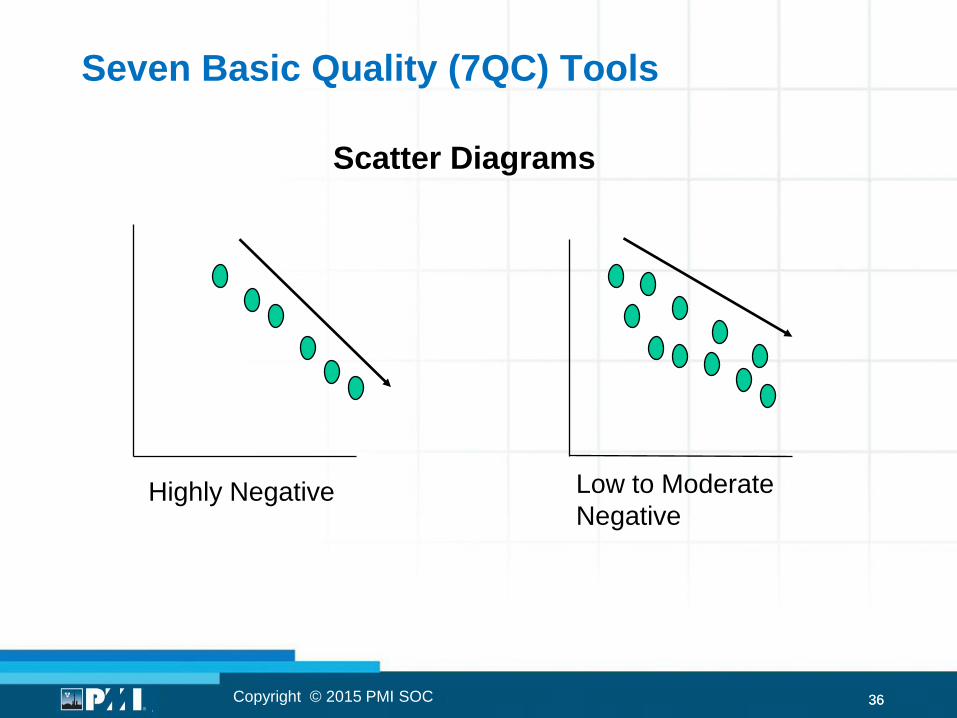
Highly Negative Low to Moderate
Negative
Copyright © 2015 PMI SOC
Seven Basic Quality (7QC) Tools
Scatter Diagrams
37 37 Copyright © 2015 PMI SOC
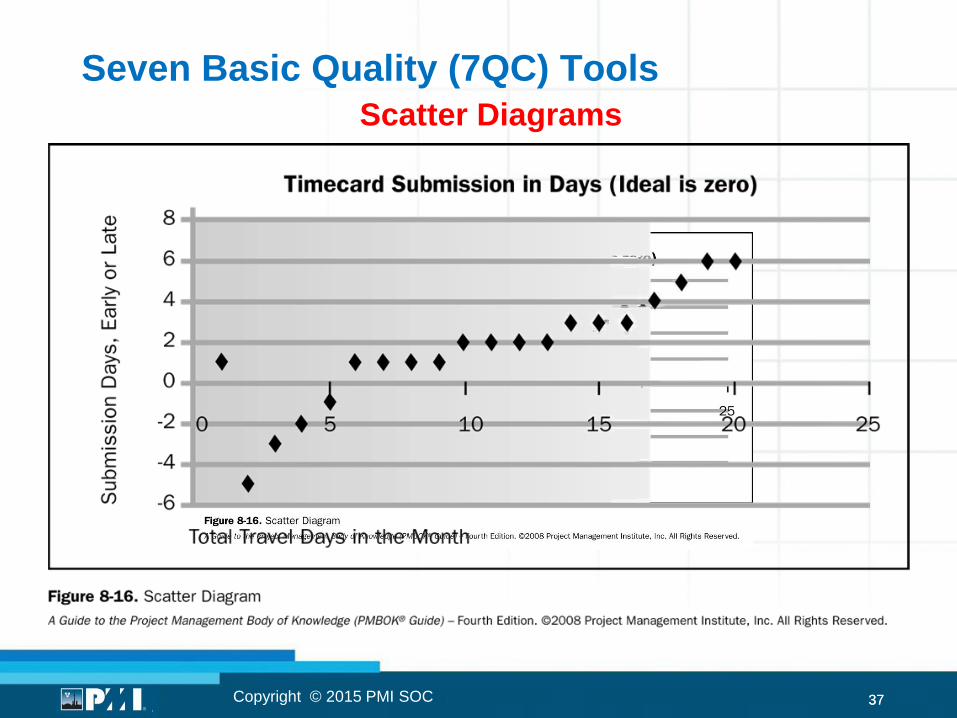
Seven Basic Quality (7QC) Tools
Scatter Diagrams
38 38
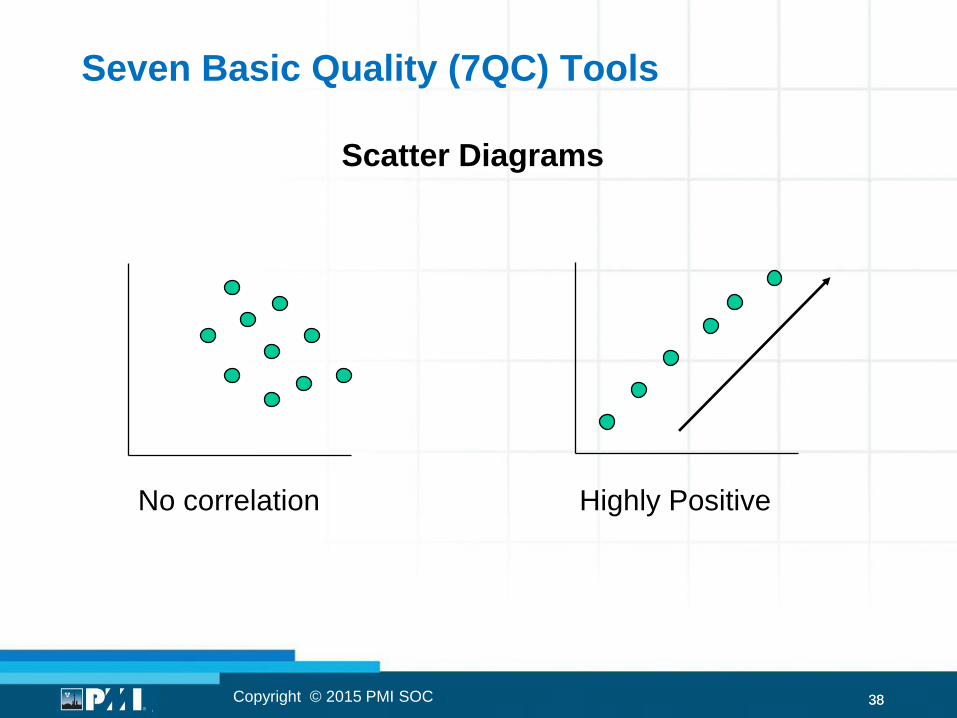
No correlation Highly Positive
Copyright © 2015 PMI SOC
Seven Basic Quality (7QC) Tools
Scatter Diagrams
39 39
• Compares actual measurements to those of other
projects
• Provides a basis by which performance can be
measured
• These other projects can be within the performing organization or outside of it and can be within the same or in other application area
• Allows analogies from projects in different area
Benchmarking
Copyright © 2015 PMI SOC
PMBOK 5E Ref #8.1.2.4
40 40
• Statistical method for products under development
• Framework for systematically changing elements of a
process
• Helps highlight influencing factors that reveal the presence of interactions and synergy among the factors
• Helps identify which factors may influence a product
variables
• Helps with optimization of products or processes
Design of Experiment (DOE)
Copyright © 2015 PMI SOC
PMBOK 5E Ref #8.1.2.5
41 41
• Involves choosing part of a population of interest for inspection
For example, selecting ten engineering drawings at random from a list of seventy-five
• Sample frequency sizes should be determined for including number of tests, expected scrap etc. (Cost of Quality)
Statistical Sampling
Copyright © 2015 PMI SOC
PMBOK 5E Ref #8.1.2.6
42 42
Used to better define the situation and manage quality:
– Brainstorming
– Force Field Analysis
– Nominal Group Technique
– Quality Management and Control Tools
Additional Quality Planning Tools
Copyright © 2015 PMI SOC
PMBOK 5E Ref #8.1.2.7
43 43
Meetings
• Teams hold planning meetings to develop the
Quality Management Plan
• Attendees include anyone responsible for Project
Quality Management activities (Project Manager,
Sponsor, Team members, Stakeholders)
Copyright © 2015 PMI SOC
PMBOK 5E Ref #8.1.2.8
44 44
Plan Quality Management - Outputs
• Quality Management Plan
• Process Improvement Plan
• Quality Metrics
• Quality Checklists
• Project Document Updates:
– Stakeholder Register
– Responsibility Assignment Matrix
– WBS and WBS Dictionary
Copyright © 2015 PMI SOC
PMBOK 5E Ref #8.1.3
45 45
Quality Management Plan
• Describes how the project team will implement the
performing organization's quality policy
• Based on requirements, the plan can be:
– Formal or informal
– Detailed or broadly framed
Copyright © 2015 PMI SOC
PMBOK 5E Ref #8.1.3.1
46 46
Process Improvement Plan
• Details the steps for analyzing project management and
product development processes
• Facilitates the identification of waste and non-value adding
activity
• The steps are:
• Process Boundaries - describe the purpose, start,
and end of each process
• Process Configuration - a flowchart of processes
with identified interfaces
• Process Metrics - used to maintain control over
status of processes
• Target for improved performance - guides the
process improvement activities
Copyright © 2015 PMI SOC
PMBOK 5E Ref #8.1.3.2
47 47
Quality Metrics
• Metric
– describes project or product attribute and how the
control quality process measures it
• Measurement
– actual value of a metric parameter
• Quality metrics
– are used in QA and QC processes
Copyright © 2015 PMI SOC
PMBOK 5E Ref #8.1.3.3
48 48
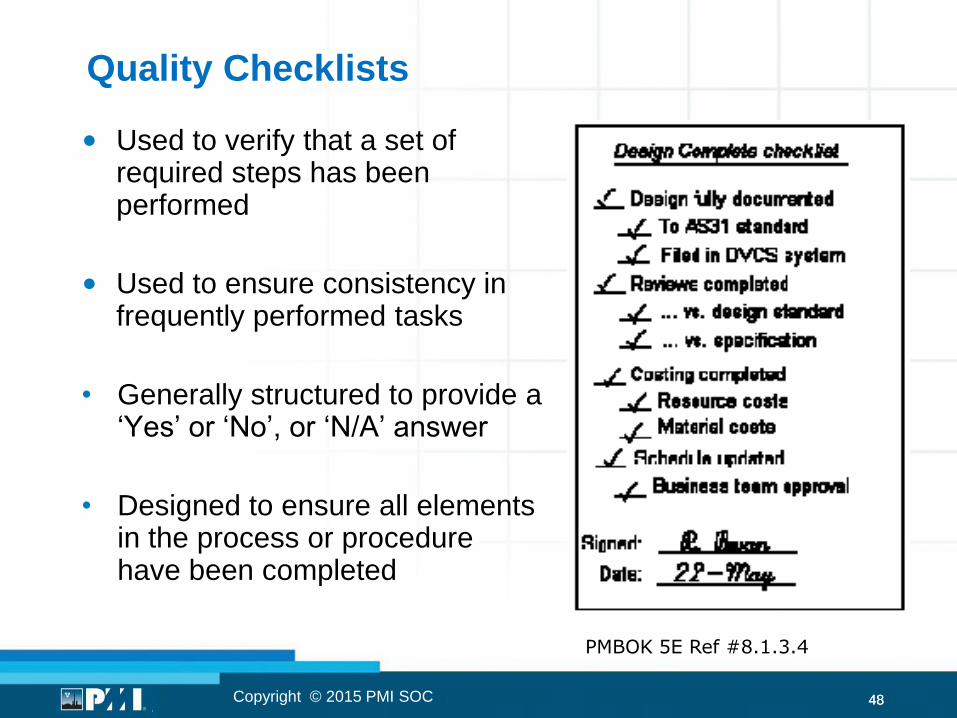
Quality Checklists
• Used to verify that a set of required steps has been performed
• Used to ensure consistency in frequently performed tasks
• Generally structured to provide a ‘Yes’ or ‘No’, or ‘N/A’ answer
• Designed to ensure all elements in the process or procedure have been completed
Copyright © 2015 PMI SOC
PMBOK 5E Ref #8.1.3.4
49 49
Project Documents Updates
Project documents that may be updated include, but not
limited to:
• Stakeholder register
• Responsibility assignment matrix
• WBS and WBS dictionary
Copyright © 2015 PMI SOC
PMBOK 5E Ref #8.1.3.5
50 50
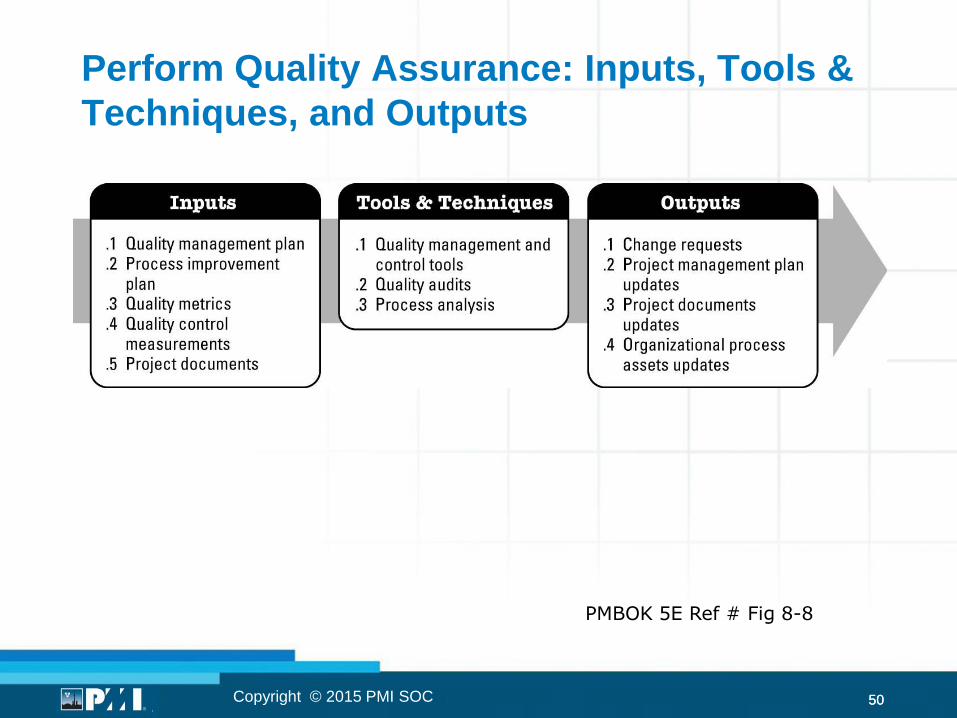
Perform Quality Assurance: Inputs, Tools &
Techniques, and Outputs
Copyright © 2015 PMI SOC
PMBOK 5E Ref # Fig 8-8
51 51
Perform Quality Assurance
• Activity to assure the required level of quality is met
• Often performed by the Quality Assurance Department
• Key benefit is to facilitate improvement of quality
processes
• Provides an umbrella for continuous process improvement
• Builds confidence in quality through prevention of defects
• QA work falls under the conformance work category in
COQ
Copyright © 2015 PMI SOC
PMBOK 5E Ref # 8.2
52 52
Perform Quality Assurance - Inputs
• Quality Management Plan
• Process Improvement Plan
• Quality Metrics
• Quality Control Measurements
• Project Documents
Copyright © 2015 PMI SOC
PMBOK 5E Ref # 8.2.1
53 53
Perform Quality Assurance – Tools & Techniques
• Quality Management and Control Tools
• Quality Audits
• Process Analysis
Copyright © 2015 PMI SOC
PMBOK 5E Ref # 8.2.2
54 54
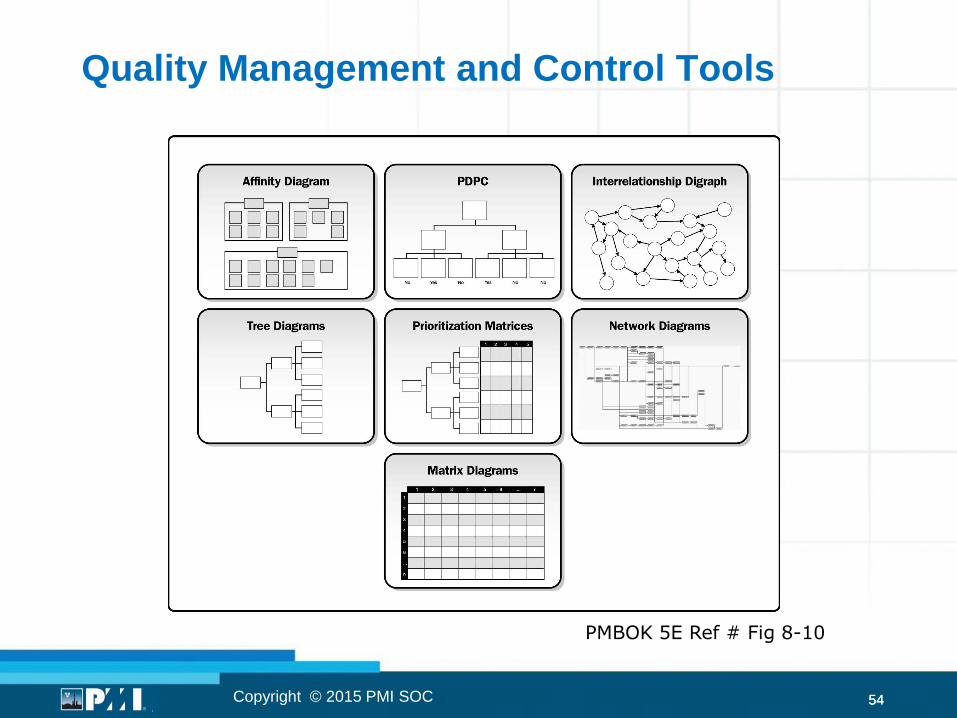
Quality Management and Control Tools
Copyright © 2015 PMI SOC
PMBOK 5E Ref # Fig 8-10
55 55
• Affinity Diagrams
– Similar to mind mapping techniques
– Used to generate ideas that can be linked to form organized thought patterns about a problem
• Process Decision Program Charts (PDPC)
– Used as a method for contingency planning
– Aids in anticipating intermediate steps that derail goal attainment
• Interrelationship Digraphs
– Process for creative problem solving in moderately complex scenarios that possess intertwined logical relationships for up to 50 relevant items
Quality Management and Control Tools
Copyright © 2015 PMI SOC
PMBOK 5E Ref # 8.2.2.1
56 56
• Tree Diagrams
– Known as systematic diagrams
– Used to represent decomposition structures e.g.: WBS, RBS
– Useful to visualize parent-to-child relationships
– Useful as decision trees for establishing expected value
• Prioritization Matrices
– Identifies key issues and suitable alternatives to be
prioritized as a set of decisions for implementation
– Criteria are prioritized and weighted before applied to
available alternatives to obtain a score that ranks the options
Quality Management and Control Tools – cont’d
Copyright © 2015 PMI SOC
PMBOK 5E Ref # 8.2.2.1
57 57
• Activity Network Diagrams
– Known as arrow diagrams
– Include both the AOA and AON formats
– Used with project scheduling methodologies: PERT, critical
path method (CPM) and precedence diagramming method
(PDM)
• Matrix Diagrams
– Used to perform data analysis within the organizational
structure
– Seek to show the strength of relationships between factors,
causes, and objectives that exist between the rows and
columns that form the matrix
Quality Management and Control Tools – cont’d
Copyright © 2015 PMI SOC
PMBOK 5E Ref # 8.2.2.1
58 58
Quality Audits
• Structured, independent processes that determine if
project activities comply with the project’s and
organizational policies, processes and procedures
• Identify all good and best practices used and share
them
• Identify nonconformities, gaps and shortcomings
• Proactively assist to improve implementation of
processes to help the team raise productivity
• Highlight contributions of each audit in the lessons
learned repository
• Once identified, corrective action can be taken
Copyright © 2015 PMI SOC
PMBOK 5E Ref # 8.2.2.2
59 59
• May be scheduled or random
• May be carried out by properly trained in-house auditors
or third parties
• Quality audits confirm the implementation of
– approved change requests
– updates
– corrective actions
– defect repairs
– preventive actions
Quality Audits - cont’d
Copyright © 2015 PMI SOC
PMBOK 5E Ref # 8.2.2.2
60 60
• Analyzes the processes as outlined in the process
improvement plan
• Tries to identify needed improvements from an
organizational and technical standpoint
• Attempts to find the root cause of any issue, so it can
be resolved
Process Analysis
Copyright © 2015 PMI SOC
PMBOK 5E Ref # 8.2.2.3
61 61
Perform Quality Assurance - Outputs
• Change requests: Recommended corrective actions
– Change requests can be used to take corrective
action or preventive action or to perform defect
repair
• Project Management Plan Updates
– Quality, Scope, Schedule, and Cost
management plans
• Project Document Updates
– Quality audit reports, training plans, and process
documentation
• Organizational Process Assets Updates
Copyright © 2015 PMI SOC
PMBOK 5E Ref # 8.2.3
62 62
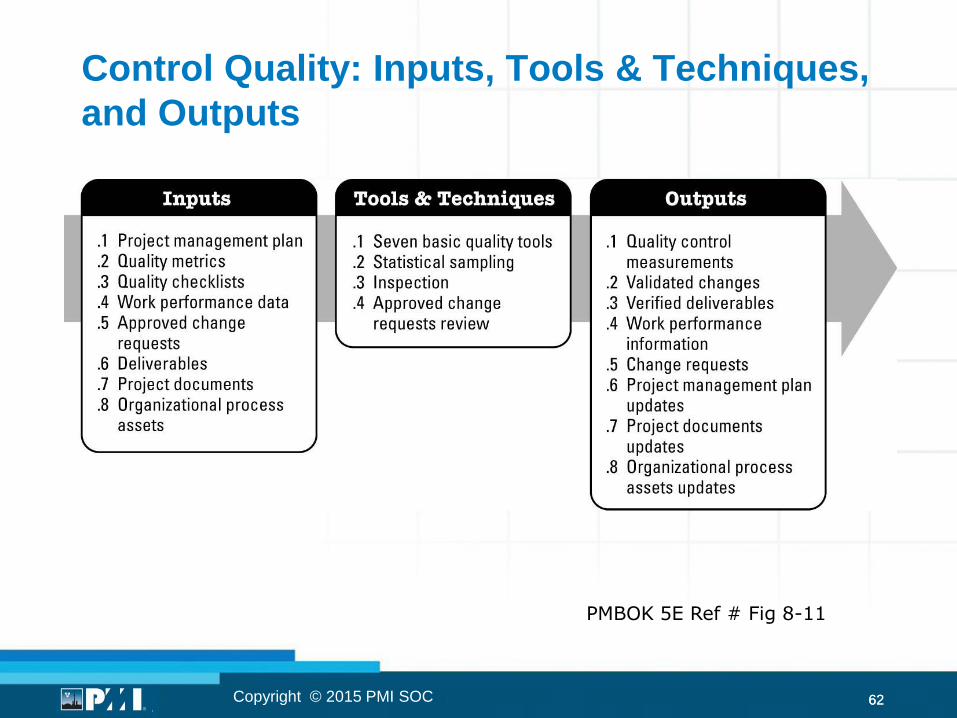
Control Quality: Inputs, Tools & Techniques,
and Outputs
Copyright © 2015 PMI SOC
PMBOK 5E Ref # Fig 8-11
63 63
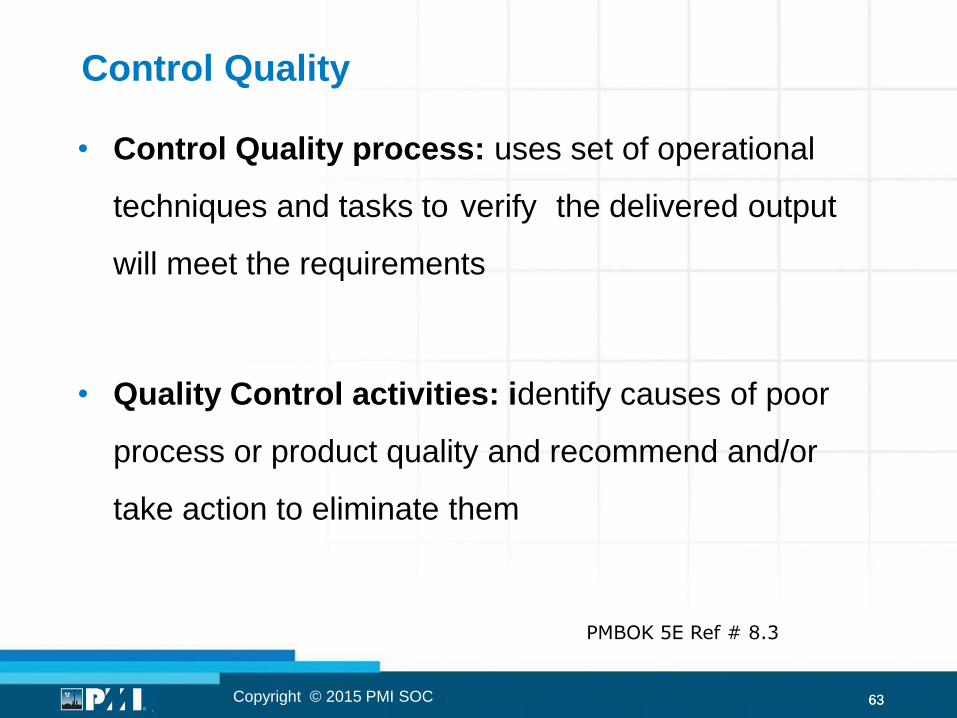
Control Quality
• Control Quality process: uses set of operational
techniques and tasks to verify the delivered output
will meet the requirements
• Quality Control activities: identify causes of poor
process or product quality and recommend and/or
take action to eliminate them
Copyright © 2015 PMI SOC
PMBOK 5E Ref # 8.3
64 64
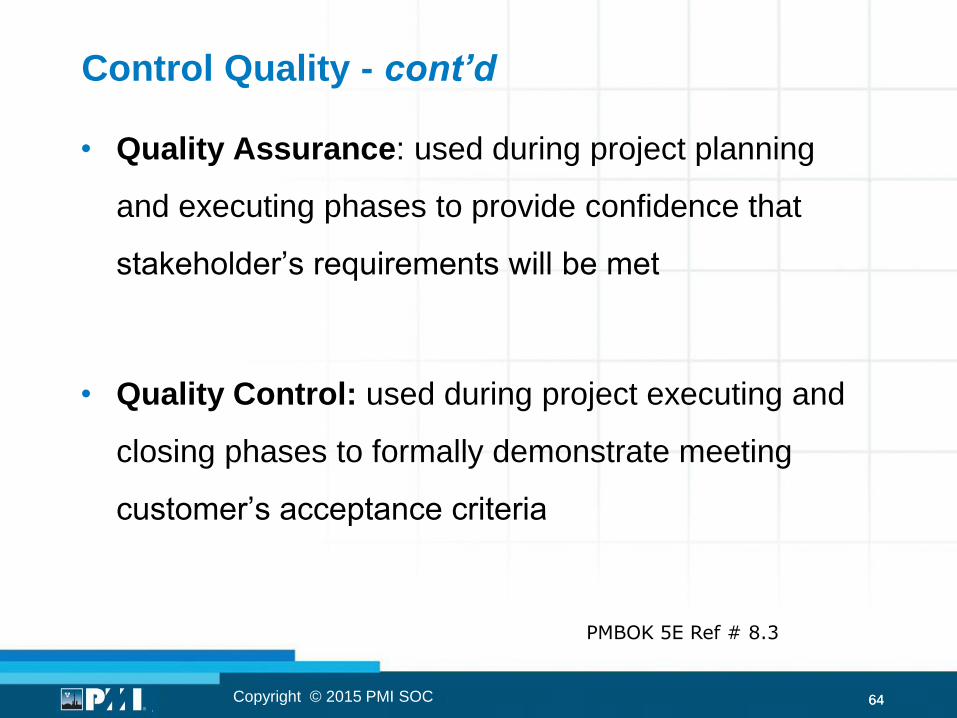
Control Quality - cont’d
• Quality Assurance: used during project planning
and executing phases to provide confidence that
stakeholder’s requirements will be met
• Quality Control: used during project executing and
closing phases to formally demonstrate meeting
customer’s acceptance criteria
Copyright © 2015 PMI SOC
PMBOK 5E Ref # 8.3
65 65
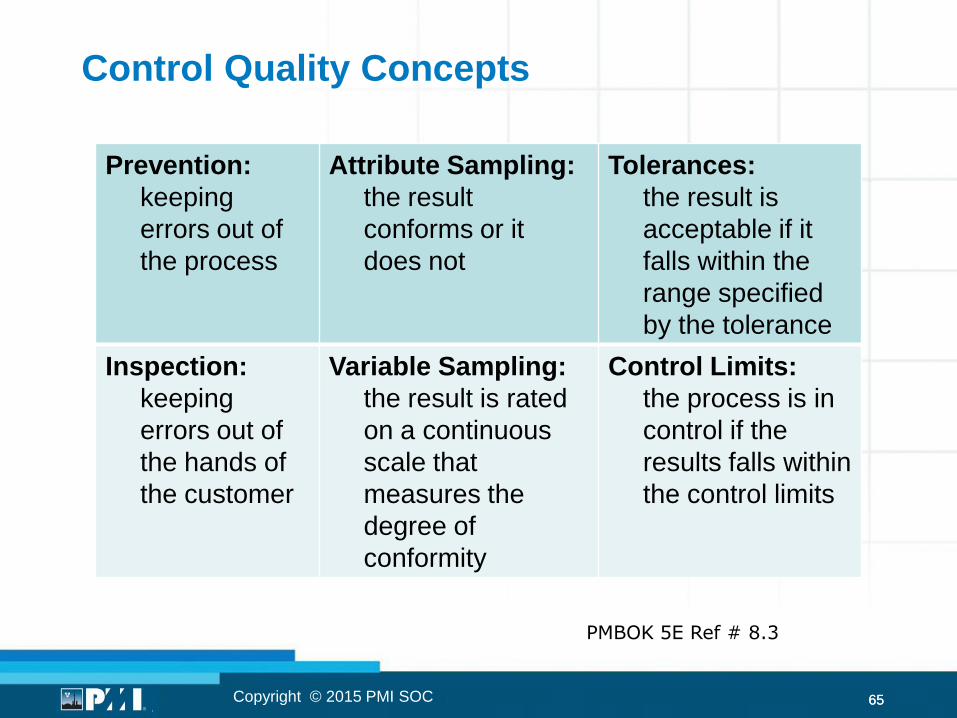
Control Quality Concepts
Prevention:
keeping
errors out of
the process
Attribute Sampling:
the result
conforms or it
does not
Tolerances:
the result is
acceptable if it
falls within the
range specified
by the tolerance
Inspection:
keeping
errors out of
the hands of
the customer
Variable Sampling:
the result is rated
on a continuous
scale that
measures the
degree of
conformity
Control Limits:
the process is in
control if the
results falls within
the control limits
Copyright © 2015 PMI SOC
PMBOK 5E Ref # 8.3
66 66
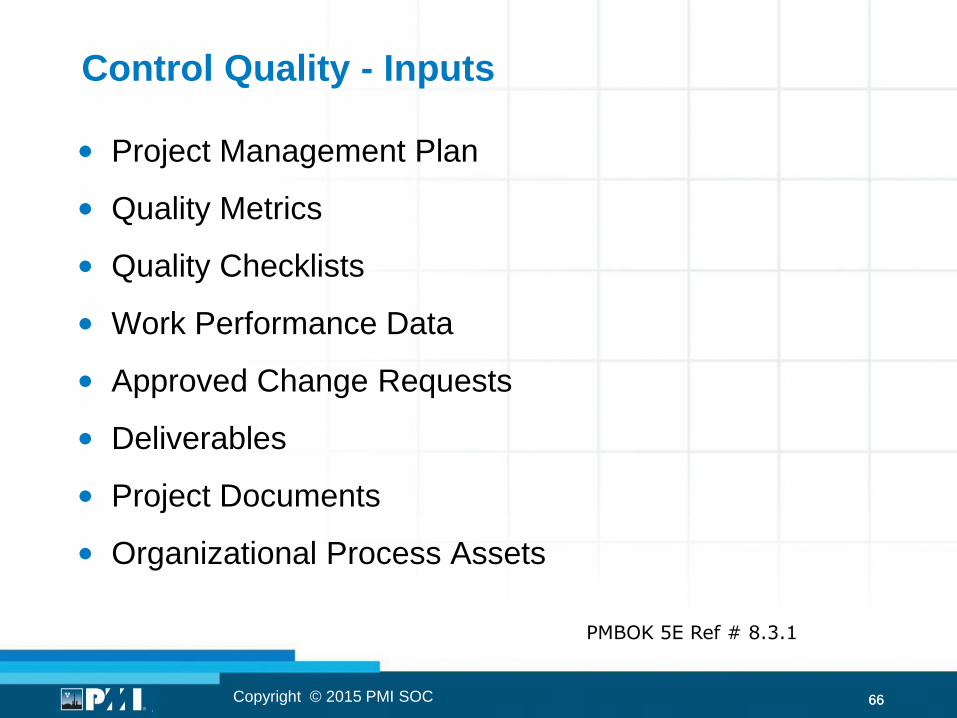
Control Quality - Inputs
• Project Management Plan
• Quality Metrics
• Quality Checklists
• Work Performance Data
• Approved Change Requests
• Deliverables
• Project Documents
• Organizational Process Assets
Copyright © 2015 PMI SOC
PMBOK 5E Ref # 8.3.1
67 67
Control Quality – Tools and Techniques
• Seven Basic Quality Tools
• Statistical Sampling
• Inspection
• Approved Change Requests Review
Copyright © 2015 PMI SOC
PMBOK 5E Ref # 8.3.2
68 68
• Statistic: A descriptive measure of some characteristic of a sample (e.g. width or height)
• Variable: The characteristic being observed
• Random Sample: A selection of items from a universe in such a way that each item in the universe has an equal probability (chance) of being selected as each sample item is drawn
• Mode is the most frequently occurring value
Statistical Sampling (concepts)
Copyright © 2015 PMI SOC
69 69
• Median is the value of the middle item in a sorted
group of items
• Arithmetic Mean is the sum of the values of a
variable divided by the number of values (or average)
• Range is the difference between the largest and the
smallest values of some variable
• Standard Deviation is the square root of the
variance
Statistical Sampling (concepts) - cont’d
Copyright © 2015 PMI SOC
70 70
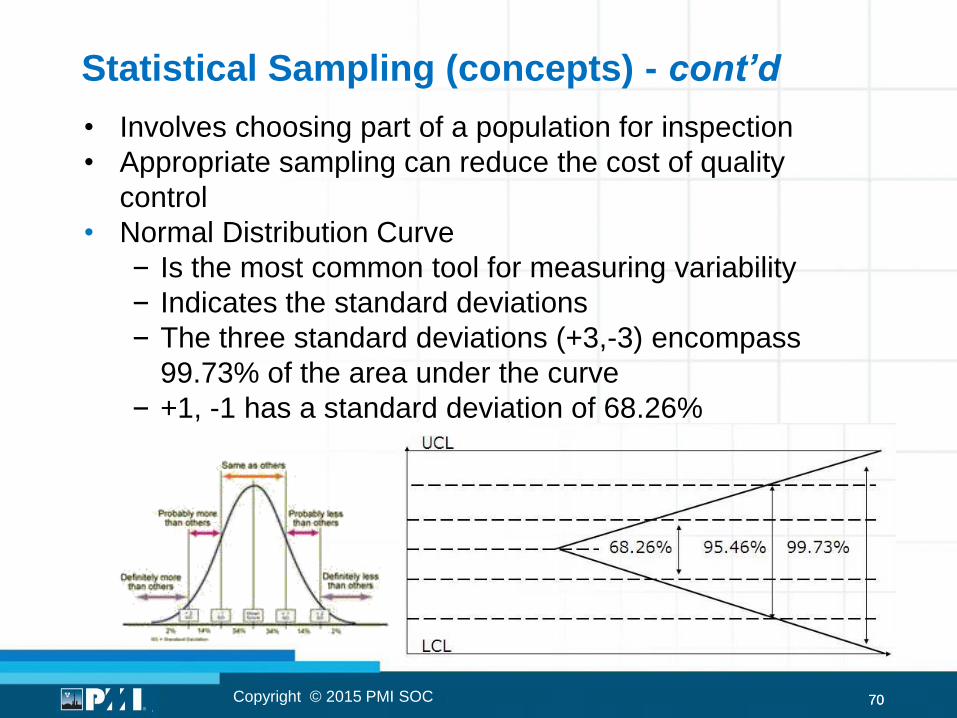
• Involves choosing part of a population for inspection
• Appropriate sampling can reduce the cost of quality
control
• Normal Distribution Curve
– Is the most common tool for measuring variability
– Indicates the standard deviations
– The three standard deviations (+3,-3) encompass
99.73% of the area under the curve
– +1, -1 has a standard deviation of 68.26%
Copyright © 2015 PMI SOC
Statistical Sampling (concepts) - cont’d
71 71
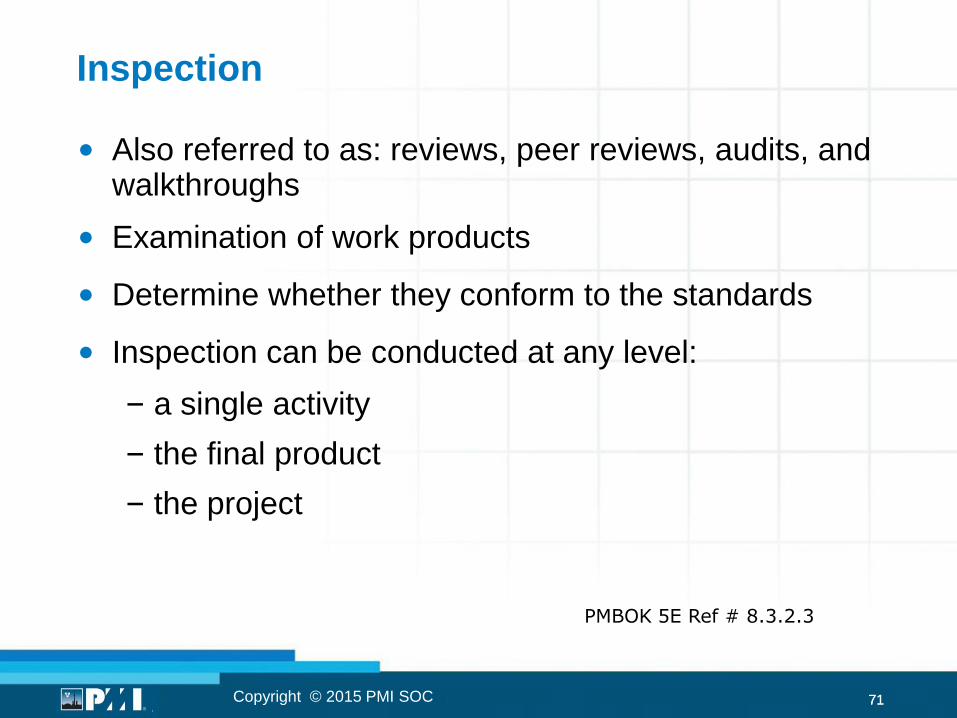
Inspection
• Also referred to as: reviews, peer reviews, audits, and walkthroughs
• Examination of work products
• Determine whether they conform to the standards
• Inspection can be conducted at any level:
– a single activity
– the final product
– the project
Copyright © 2015 PMI SOC
PMBOK 5E Ref # 8.3.2.3
72 72
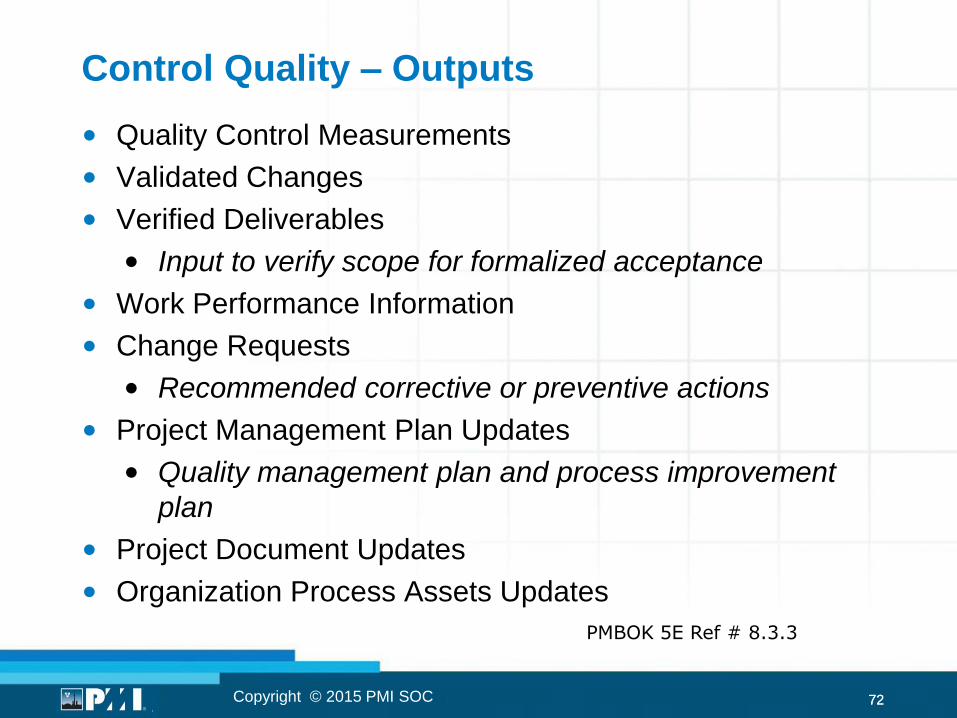
Control Quality – Outputs
• Quality Control Measurements
• Validated Changes
• Verified Deliverables
• Input to verify scope for formalized acceptance
• Work Performance Information
• Change Requests
• Recommended corrective or preventive actions
• Project Management Plan Updates
• Quality management plan and process improvement
plan
• Project Document Updates
• Organization Process Assets Updates
Copyright © 2015 PMI SOC
PMBOK 5E Ref # 8.3.3
73
Supplementary Material
Project Quality Management
Copyright © 2015 PMI SOC
74 74
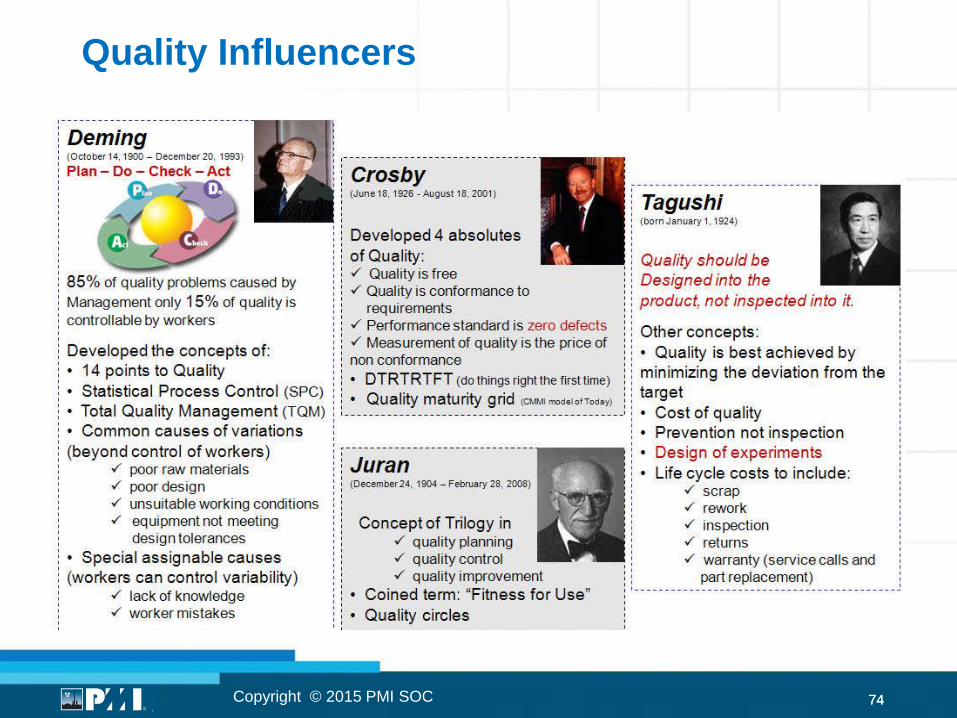
Quality Influencers
Copyright © 2015 PMI SOC
75 75
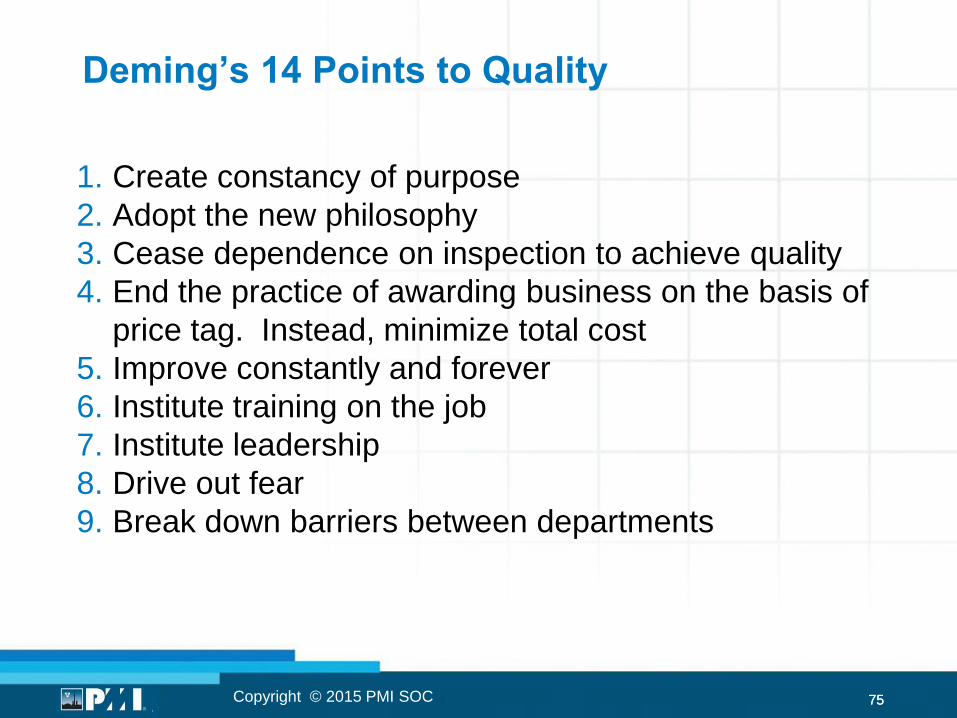
Deming’s 14 Points to Quality
1. Create constancy of purpose
2. Adopt the new philosophy
3. Cease dependence on inspection to achieve quality
4. End the practice of awarding business on the basis of
price tag. Instead, minimize total cost
5. Improve constantly and forever
6. Institute training on the job
7. Institute leadership
8. Drive out fear
9. Break down barriers between departments
Copyright © 2015 PMI SOC
76 76
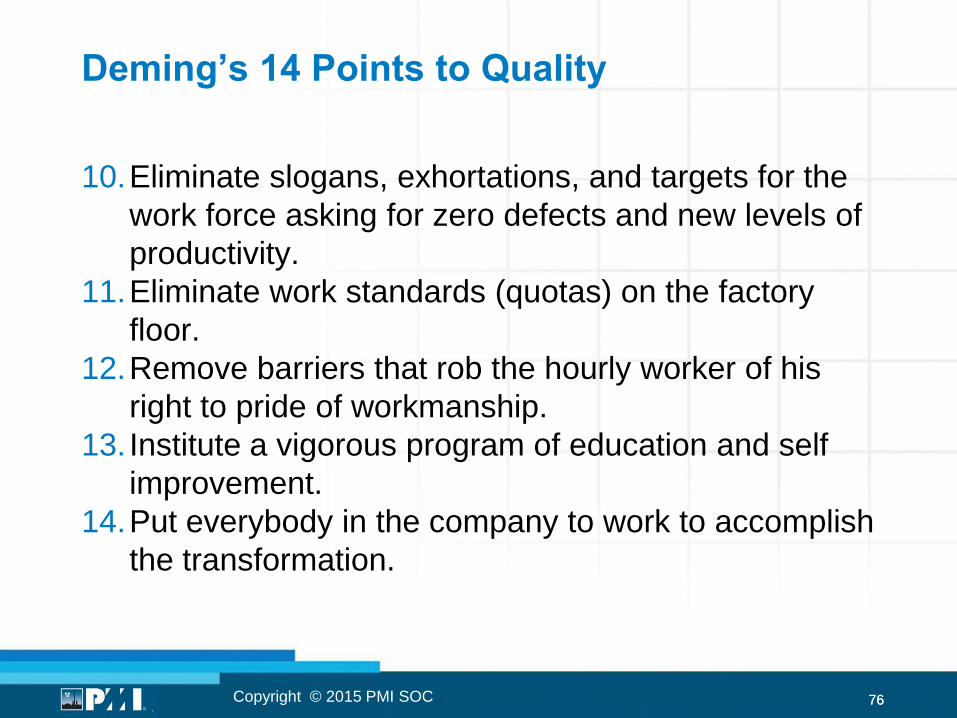
Deming’s 14 Points to Quality
10.Eliminate slogans, exhortations, and targets for the
work force asking for zero defects and new levels of
productivity.
11.Eliminate work standards (quotas) on the factory
floor.
12.Remove barriers that rob the hourly worker of his
right to pride of workmanship.
13. Institute a vigorous program of education and self
improvement.
14.Put everybody in the company to work to accomplish
the transformation.
Copyright © 2015 PMI SOC
77 77
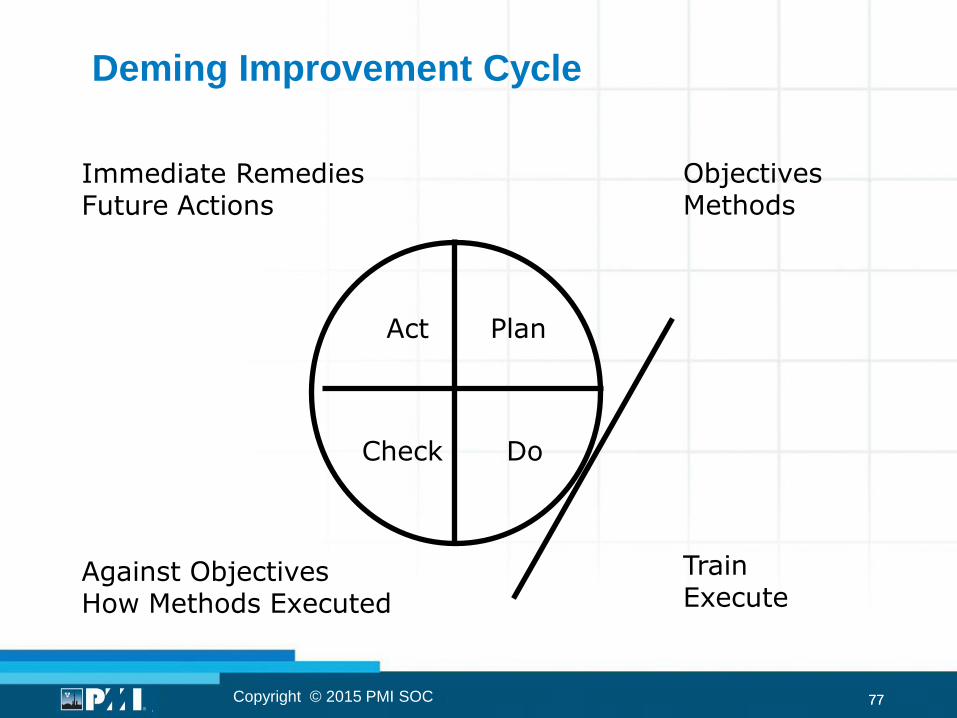
Deming Improvement Cycle
Act Plan
Check Do
Immediate Remedies Future Actions
Against Objectives How Methods Executed
Train Execute
Objectives Methods
Copyright © 2015 PMI SOC
78 78
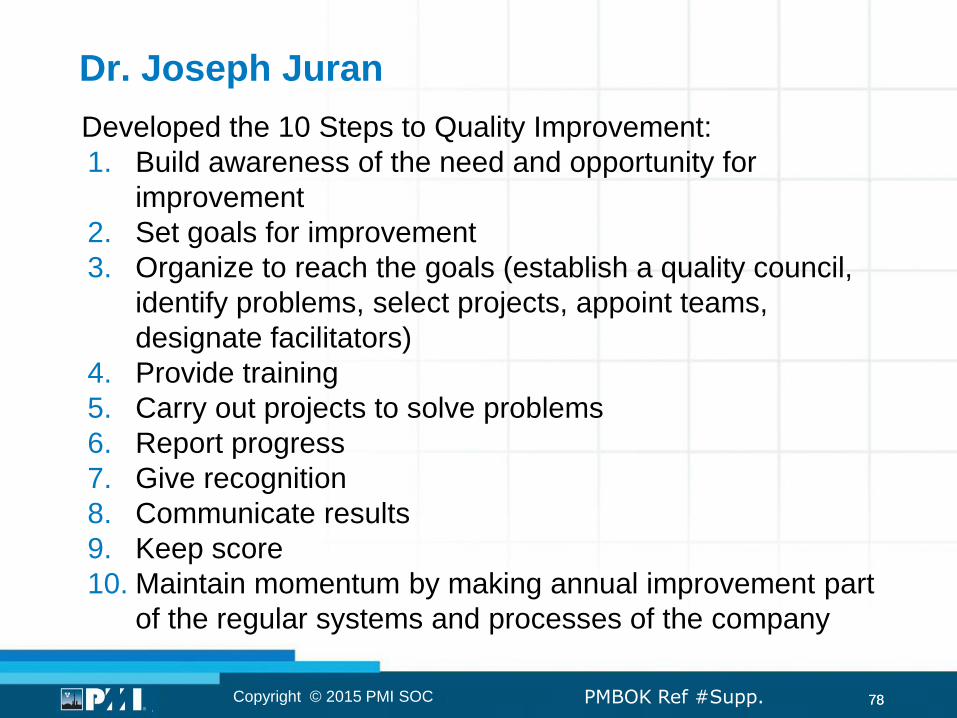
Dr. Joseph Juran
Developed the 10 Steps to Quality Improvement:
1. Build awareness of the need and opportunity for
improvement
2. Set goals for improvement
3. Organize to reach the goals (establish a quality council,
identify problems, select projects, appoint teams,
designate facilitators)
4. Provide training
5. Carry out projects to solve problems
6. Report progress
7. Give recognition
8. Communicate results
9. Keep score
10. Maintain momentum by making annual improvement part
of the regular systems and processes of the company
PMBOK Ref #Supp. Copyright © 2015 PMI SOC
79 79
Dr. Joseph Juran
The five attributes of “fitness for use”:
1. Quality of design (different grades of quality)
2. Quality of conformance (training to keep products in
specifications, tolerances motivations)
3. Availability, reliability and maintainability
4. Safety
5. Field use (the way the product will be used by the
customer)
Copyright © 2015 PMI SOC
80 80
Crosby’s 14 Steps to Quality Improvement
1. Make it clear management is committed to quality
2. Form quality improvement teams with representative
from each department
3. Determine where current and potential quality problems
lie
4. Evaluate cost of quality and explain its use as a
management tool
5. Raise quality awareness and explain its use as a
management tool
6. Take actions to correct problems identified through
previous steps
7. Establish a committee for the zero defect program
8. Train supervisors to actively carry out their part of the
quality improvement program
Copyright © 2015 PMI SOC
81 81
Crosby 14 Steps to Quality Improvement
9. Hold a “zero-defect day” to let employees realize
there has been a change
10.Encourage individuals to establish improvement
goals for themselves and their groups
11.Encourage employees to communicate to
management the obstacles they face in attaining
their improvement goals
12.Recognize and appreciate those who participate
13.Establish quality councils to communicate on a
regular basis
14.Do it again to emphasize a quality management
program never ends
Copyright © 2015 PMI SOC
82 82
Quality Influencers - Other
• KAIZEN = Continuous Improvement (these two definitions are equivalent on the exam)
• JIT (Just in Time) : this is an approach to decrease the amount of inventory that a company carries, thereby decreasing the investment in inventory.
– A “just in time” philosophy directs a company to improve quality (forces attention to quality) because extra materials are not available.
Copyright © 2015 PMI SOC
83 83
Quality Influencers - ISO
The International Organization for Standardization
(ISO) is the world’s largest developer of voluntary
International Standards.
Relevant ISO Standards:
– ISO 9001:2015 Quality management systems --
Requirements
– ISO 9000:2015 Quality management systems --
Fundamentals and vocabulary
– ISO 9004:2009 Managing for the sustained success of
an organization -- A quality management approach
Copyright © 2015 PMI SOC
84 84
Other relevant ISO Standards - cont’d
• ISO 19011:2011 Guidelines for auditing
management systems
• ISO 14001:2015 Environmental management
systems -- Requirements with guidance for use
• ISO 14004:2016 Environmental management
systems -- General guidelines on principles, systems
and support techniques
Quality Influencers - ISO
Copyright © 2015 PMI SOC
85 85
Other relevant ISO Standards:
• ISO 10006:2003 Quality management systems --
Guidelines for quality management in projects
• ISO 21500:2012 Guidance on project management
(See also: PMBOK Fifth Edition page 463)
Quality Influencers – ISO
PMBOK Ref #Supp. Copyright © 2015 PMI SOC
86
Project Quality Management
PMP Exam Preparation
Sample Test Questions
Copyright © 2015 PMI SOC
87 87
Question #1
Quality assurance should be used during the project’s
___________ to provide confidence that the
stakeholder’s requirements will
be met.
A. executing and closing phases
B. monitoring and controlling phases
C.planning and executing phases
D.planning and closing phases
Answer:
Copyright © 2015 PMI SOC
88 88
Question #2
The diagram that identifies the vital few sources that are
responsible for causing most of a problem’s effects, is
called a:
A. Pareto diagram
B. Bar chart
C.Network diagram
D.Critical path
Answer:
Copyright © 2015 PMI SOC
89 89
Question #3
Accuracy is defined as:
A. The degree to which a set of inherent characteristics fulfill requirements
B. Consistency that the value of repeated measurements are clustered and have little scatter
C. Correctness that the measured value is very close to the true value
D. Category assigned to projects or services having the same functional use but different technical characteristics
Answer:
Copyright © 2015 PMI SOC
90 90
Question #4
All below are tools and techniques for Perform Quality
Assurance EXCEPT:
A. Interrelationship digraph
B. Tree diagram
C.Pareto diagram
D.Matrix diagram
Answer:
Copyright © 2015 PMI SOC
91 91
Question #5
Quality standards and requirements should be defined
in the ___________ phase.
A. conceptual
B. planning
C. implementation
D. risk identification
Answer:
Copyright © 2015 PMI SOC
92 92
Question #6
Major cost categories of quality include all of the
following EXCEPT:
A. Appraisal
B. Prevention
C.External failure
D.Computer operations
Answer:
Copyright © 2015 PMI SOC
93 93
Question #7
Quality control should be used during the project
___________ to formally demonstrate customer’s
acceptance criteria has been met.
A. executing and closing phases
B. monitoring and controlling phases
C.planning and executing phases
D.planning and closing phases
Answer:
Copyright © 2015 PMI SOC
94 94
Question #8
Control quality tools and techniques include all of the
following EXCEPT:
A. Flowcharting
B. Pareto diagrams
C.Control charts
D.Estimates of control tendency
Answer:
Copyright © 2015 PMI SOC
95 95
Question #9
Grade is defined as:
A. The degree to which a set of inherent characteristics
fulfill requirements
B. Consistency that the value of repeated
measurements are clustered and have little scatter
C.Correctness that the measured value is very close to
the true value
D.Category assigned to deliverables having the same
functional use but different technical characteristics
Answer:
Copyright © 2015 PMI SOC
96 96
Question #10
Perform quality _____________ is the process of
auditing the quality requirements and the results from
quality control measurements to ensure that appropriate
quality standards and
operational definitions are used.
A. control
B. assurance
C. improvement
D.benchmarking
Answer:
Copyright © 2015 PMI SOC
97 97
Question #11
Inputs to control quality process are all of the following
EXCEPT:
A. Work performance data
B. Project management plan
C.Quality checklists
D.Process improvements
Answer:
Copyright © 2015 PMI SOC
98 98
Question #12
One of the fundamental tenets of quality management is
that quality:
A. Exceeds client expectations
B. Does not cost
C. Is planned, designed, and built into, not inspected in
D. Is assured through careful planning
Answer:
Copyright © 2015 PMI SOC
99 99
Question #13
A mind-mapping technique used to generate ideas that
can be linked to form organized patterns of thought
about a problem:
A. Process decision program chart
B. Affinity diagram
C.Histogram
D.Tree diagram
Answer:
Copyright © 2015 PMI SOC
100 100
Question #14
All of the following are primary benefit(s) of meeting
quality
requirements EXCEPT:
A. Increased profitability
B. Higher productivity
C.Stakeholder satisfaction
D.Fewer change orders
Answer:
Copyright © 2015 PMI SOC
101 101
Question #15
In the quality management discipline, benefits
______________ costs.
A. equal
B. outweigh
C.are less than
D.cannot be evaluated in relation to
Answer:
Copyright © 2015 PMI SOC
102 102
Question #16
"Design of experiments" is a statistical method that
helps:
A. Determine how various elements of a system
interrelate
B. Anticipate what and where quality problems might
occur
C. Identify which factors may influence specific variables
of a product or process under development
D.Establish a standard by which to measure
performance
Answer:
Copyright © 2015 PMI SOC
103 103
Question #17
The objectives of a quality audit may include all of the
below EXCEPT:
A. Identify all nonconformity, gaps and shortcomings
B. Share good practices
C.Aid in contingency planning
D.Highlight audit contributions in the lessons learned
repository
Answer:
Copyright © 2015 PMI SOC
104 104
Question #18
In statistical control processes, the term control limit
identifies ....
A. results rated on a continuous scale that measures
the degree of conformity
B. the boundaries of common variation in a statistically
stable process
C.data contained in the control quality outputs
D.a problem, discover the underlying causes that lead
to it, and develop preventive actions
Answer:
Copyright © 2015 PMI SOC
105 105
Question #19
What does “Cost of Quality" mean?
A. The sacrifice of unessential project objectives to
meet essential quality standards
B. The life cycle cost of the project
C.The costs incurred to ensure quality
D.The cost of meeting project objectives
Answer:
Copyright © 2015 PMI SOC
106 106
Question #20
Quality Control measurements _______
A. compare the processes used to create the
measurements, and validate actual measurements to
determine their level of correctness
B. provide an umbrella for continuous process
improvement for improving the quality of all
processes
C.analyze project management and product
development processes to identify activities that
enhance value
D. reduce frequency of schedule overruns
Answer:
Copyright © 2015 PMI SOC
107
Project Quality Management
PMP Exam Preparation
End of Session
Copyright © 2015 PMI SOC