PMIC Learning Unit 1: What economics is all about
14
1 PMIC Learning Unit 1: What economics is all about All information and diagrams which follow in this learning unit relate to the prescribed textbook: Mohr, P, Fourie, L and associates. 2015. Economics for South African Students. 5th Edition. Pretoria: Van Schaik: Chapter 1 Learning Content: 1. Define the term ‘economics’; 2. Explain why economics is a social science; 3. Distinguish between microeconomics and macroeconomics; 4. Identify positive and normative statements; 5. List the three key elements of the basic economic problem; 6. Explain the concept of scarcity, choice and opportunity cost with the aid of a production possibilities curve; 7. Use a production possibilities curve to distinguish between efficient, inefficient and unattainable combinations of output; 8. Illustrate by using the production possibilities curve, how an improvement in the use of resources or an increase in the quantity of resources affect production; 9. Apply critical reasoning to correlation and causation; 10. Distinguish between levels and rates of change. Introduction and definitions In this learning unit you will learn about concepts that provide the foundation for the study of economics. The most important of these concepts are: scarcity, choice and opportunity cost. The diagram that is used to illustrate these concepts is known as the production possibilities curve (PPC) or the production possibilities frontier (PPF) or production possibilities boundary (PPB) of an economy.
Transcript of PMIC Learning Unit 1: What economics is all about

1
PMIC Learning Unit 1: What economics is all about
All information and diagrams which follow in this learning unit relate to the prescribed textbook:
Mohr, P, Fourie, L and associates. 2015. Economics for South African Students. 5th Edition.
Pretoria: Van Schaik: Chapter 1
Learning Content:
1. Define the term ‘economics’;
2. Explain why economics is a social science;
3. Distinguish between microeconomics and macroeconomics;
4. Identify positive and normative statements;
5. List the three key elements of the basic economic problem;
6. Explain the concept of scarcity, choice and opportunity cost with the aid of a production
possibilities curve;
7. Use a production possibilities curve to distinguish between efficient, inefficient and
unattainable combinations of output;
8. Illustrate by using the production possibilities curve, how an improvement in the use of
resources or an increase in the quantity of resources affect production;
9. Apply critical reasoning to correlation and causation;
10. Distinguish between levels and rates of change.
Introduction and definitions
In this learning unit you will learn about concepts that provide the foundation for the study of
economics. The most important of these concepts are: scarcity, choice and opportunity cost.
The diagram that is used to illustrate these concepts is known as the production possibilities
curve (PPC) or the production possibilities frontier (PPF) or production possibilities boundary
(PPB) of an economy.

2
As you will discover, economics deals with a vast area of study, but at the very basic level it is
the study of nothing more than how scarce resources are used to produce goods and services
that satisfy consumer’s unlimited wants. Because economics studies the actions and reactions
(behaviour) of people as they go about their productive activities, it is known as a social
science.
Refer to Box 1.1 and write your own definition for economics.
__________________________________________________________________________________
__________________________________________________________________________________
__________________________________________________________________________________
On the one hand each and every person has unlimited wants and desires, but on the other
hand, economies and societies only have limited resources to fulfil these unlimited wants and
desires. As a direct result we have to make choices.
Scarcity, choice and opportunity cost
Scarcity
Simply put, there is not enough of everything to satisfy every individual’s needs and wants.
Societies or economies do not have the necessary resources available to meet all wants and
desires of all the members of that society or economy. Our wants are unlimited, but the
resources available to satisfy those wants are most definitely limited.

3
Explain the following concepts by referring to the prescribed textbook:
Wants
__________________________________________________________________________________
__________________________________________________________________________________
Needs
__________________________________________________________________________________
__________________________________________________________________________________
Demand
__________________________________________________________________________________
__________________________________________________________________________________
Briefly explain the TANSTAAFL principle.
__________________________________________________________________________________
__________________________________________________________________________________
Choice and Opportunity Cost
The fact that we have to make choices means that certain wants will go unsatisfied. Thus, we
make sacrifices when we make choices. This is what the economic problem is all about. When
we are faced with a choice there is always a cost involved. If you choose “Good A” then the
cost of choosing “Good A” is the alternative that you had to sacrifice (assuming that you cannot
afford both options). In other words, the cost of “Good A” is not just the price (the explicit cost)
that you paid for it, but rather the price plus the fact that you had to sacrifice the next best
alternative (the implicit cost) – say “Good B”. This cost is what economists call the opportunity
cost.
4
Write a definition for “opportunity cost”. P5
__________________________________________________________________________________
__________________________________________________________________________________
Illustrating scarcity, choice and opportunity cost: The Production
Possibilities Curve (PPC)
Scarcity, choice and opportunity cost can be represented diagrammatically by using the PPC.
The prescribed text uses a scenario dealing with a rural community on the Wild Coast. It is
assumed that this community has two (2) options for food – fishing or farming potatoes. If they
only engage in fishing they are able to fish five (5) baskets of fish per day. If they only engage
in farming they can grow 100 kilograms of potatoes per day. The question though, is what if
the community likes both fish and potatoes? Then they will need to split their resources
between both activities.
Draw and label a PPC for a simple, a two (2) product economy. Fig 1.1 P6
5
Draw a PPC for an improved technique for producing one kind of good. Fig 1.2 P9
Draw and fully label the PPC showing economic growth in an economy i.e. an increase
in the quantity or quality (productivity) of available resources. Fig 1.4 P10
Table 1-2 (P10) of the prescribed textbook gives an excellent summary of the PPC

6
Goods and Services
Consumer Goods and Capital Goods
Consumer goods are goods used or consumed by individuals or households. Examples
include food, clothing, electrical home appliances, shoes, cars, bed linen, shower gel,
shampoo etc. Consumer goods can be divided into three (3) groups.
Briefly explain each of the following, and give at least two (2) examples of each:
Non-durable
__________________________________________________________________________________
Semi-durable
__________________________________________________________________________________
Durable
__________________________________________________________________________________
Capital goods refer to goods that are used in the production of other goods. Prime examples
would include, plant and equipment, machinery etc. Note that capital goods are subject to wear
and tear and as such their value declines over time – this is called depreciation.
Final Goods and Intermediate Goods
Final goods are those goods which are intended for final consumption by individuals,
households or firms. Examples would include anything that you are using or consuming today,
such as the bread from which your sandwich is made, your toothbrush, the shirt you are
wearing, etc.
Intermediate goods are used in the production of other goods. In other words, intermediate
goods are goods that are processed further before being sold to the end users – consumers,

7
households or firms. An example of an intermediate good would be flour. Be careful though: if
flour is used by a baker it is an intermediate good since the baker does not himself consume
the flour; rather he uses it to manufacture bread, cakes, etc. If a household were to purchase
flour then it is classified as a final good, since the intention is to consume that flour in one way
or another.
Private and Public Goods
Private Goods are those goods that are consumed by private individuals or households. The
defining feature of a private good is that consumption by others can be excluded. Examples
include most consumer goods, for example clothes, food, housing, car etc. What this means
is that once the good is yours you have the right to stop others from using it.
Public goods are goods which are used by the community in general. The defining feature of
a public good is that individual consumption cannot be excluded. Consider a traffic light at a
busy intersection. The fact that you are using the traffic light (telling you to stop or go) does
not mean that you exclude others from using that same light for the exact same purpose.
Economic Goods and Free Goods
Economic goods are goods that are made using scarce resources, that is to say there is a
cost involved in the production of an economic good. As you can imagine most goods fall into
this category.
Free goods do not command a price. Good examples would include the air, sun, and sea. The
term “free” relates to the fact that the goods in question are not produced by man - they are
part of nature.

8
Homogeneous and Heterogeneous Goods
Homogeneous goods are goods that are identical in all respects. There are very few examples
of homogeneous goods in the world today. The prescribed text suggests one (1) fine ounce of
gold.
Heterogeneous goods are goods that are different in any number of ways, for example size,
variety, brand, and quality etc.
Economics as a science
Economics is classified as a social science, as it strives to identify patterns in human
behaviour. It is these very patterns that economists use to explain why certain things are
happening and what they anticipate will happen in the future. Economics is also an empirical
science, meaning that actual experiences are measured and studied.
Microeconomics and macroeconomic
Microeconomics focuses on the individual parts of the economy. What makes consumers and
households act in the way they do? What affects demand and supply? What effect will a price
change have on the demand for a good or service? Take a look at Box 1-2 on p. 10 of the
prescribed textbook, and complete the questions below.
List two (2) examples of microeconomic issues:
__________________________________________________________________________________
__________________________________________________________________________________
Macroeconomics on the other hand is concerned with the “big picture”, the economy as a
whole. Macroeconomics focuses on aggregate (total) behaviour / performance.

9
List two (2) examples of macroeconomic issues:
__________________________________________________________________________________
__________________________________________________________________________________
Positive Economics vs. Normative Economics
A positive statement is a statement of fact. A normative statement is based on opinion. P. 12
– 13 of the prescribed textbook gives examples of both positive and normative statements;
ensure that you are able to distinguish between them.
Why economists disagree
One often hears differing opinions from highly qualified economists on how particular issues
should be dealt with. For example, before the monetary policy committee of the South African
Reserve Bank meets to discuss whether to change the repo rate or not, several economists
will be approached for their prediction. More often than not, some will suggest that the rate will
remain unchanged; others will suggest that it will decrease, while another group will suggest
that it will increase.
Why do economists tend to disagree on certain important issues?
__________________________________________________________________________________
__________________________________________________________________________________
__________________________________________________________________________________
__________________________________________________________________________________

10
A few points to note
After reading through section 1.8, try to identify which type of mistake in reasoning has
been made in each of the statements.
1. South Africa’s unemployment problem can be solved by increasing government spending
and reducing interest rates.
__________________________________________________________________________________
2. Everyone should save more, as this will improve South Africa’s economic performance.
__________________________________________________________________________________
3. South African property prices increased dramatically after the bumper tourist season in
2003, so it is obvious that demand by foreigners is the cause of the hike in property prices.
__________________________________________________________________________________
4. Increased police patrols in Cape Flats suburbs is the cause of increased criminal activity
in these areas.
__________________________________________________________________________________
5. When the inflation rate decreases from 6,0% to 4,5%, it means that the general price level
has decreased by 1,5%.
__________________________________________________________________________________
Levels and Rates of Change
When dealing with the empirical side of economics be sure that you understand the difference
between levels and rates of change. Refer to explanation on p. 16 of the prescribed textbook.
Box 1-5 on p. 16 of the prescribed text will help you to understand the difference between
levels and rates of change.

11
Levels and rates of change:
The level of change is simply the difference between the current value and the previous value,
e.g. 220 – 200, which gives a level of change of 20.
To calculate rate of change: (Percentage change)
% ∆ = 𝑁𝑒𝑤 𝑣𝑎𝑙𝑢𝑒 − 𝑂𝑙𝑑 𝑣𝑎𝑙𝑢𝑒
𝑂𝑙𝑑 𝑣𝑎𝑙𝑢𝑒 × 100
For e.g.
% ∆ = 𝑁𝑒𝑤 𝑣𝑎𝑙𝑢𝑒 − 𝑂𝑙𝑑 𝑣𝑎𝑙𝑢𝑒
𝑂𝑙𝑑 𝑣𝑎𝑙𝑢𝑒 × 100
% ∆ = 220 − 200
200 × 100
% ∆ = 10%
From the example above, comment on the difference in performance between Country A
and Country B from 2007 to 2008.
Revision Exercise: Multiple choice questions
1. The economic problem arises from the fact that society exists in a situation of:
a. Unlimited wants and limited money in circulation;
b. Limited wants and limited money in circulation;
c. Unlimited wants and unlimited money in circulation;
d. Unlimited wants and limited resources;
e. Limited wants and unlimited resources.
Country A
($ billions)
Country B
($ billions)
Value of production output 2007 200 800
Value of production output 2008 220 840
Value Increase (level of change) 20
Percentage increase (rate of change) 10%
12
2. Microeconomics is a branch of economics that studies:
a. The determination of national income;
b. The behaviour of individual decision-making units in the economy;
c. The impact of unemployment in South Africa;
d. The effects and consequences of the aggregate behaviour of all decision-making units.
3. Which one (1) of the following statements is an example of a macroeconomic issue?
a. The total production of wine by Nederburg wine estate.
b. A South African firm’s decision to import Hyundai motor vehicles from South Korea.
c. The cost of producing fifty train carriages for Metrorail.
d. The combined decisions of all firms in South Africa.
4. Which one (1) of the following is an example of a positive statement?
a. The South African economy has not been well managed since 1994.
b. Economic growth is the most important macroeconomic objective for South Africa.
c. The rand depreciated against the dollar during December 2015.
d. The South African inflation rate is too high.
5. Which of the following statements is an example of a normative statement?
a. SARB should not allow the rand to depreciate, as it causes the costs of imports to rise.
b. Compared to 20014, the sales of motor vehicles decreased in 20015.
c. In November 2015, the South African inflation rate was 5.0%.
d. An increase in the oil price, combined with a depreciation of the rand, will cause an
increase in the petrol price.
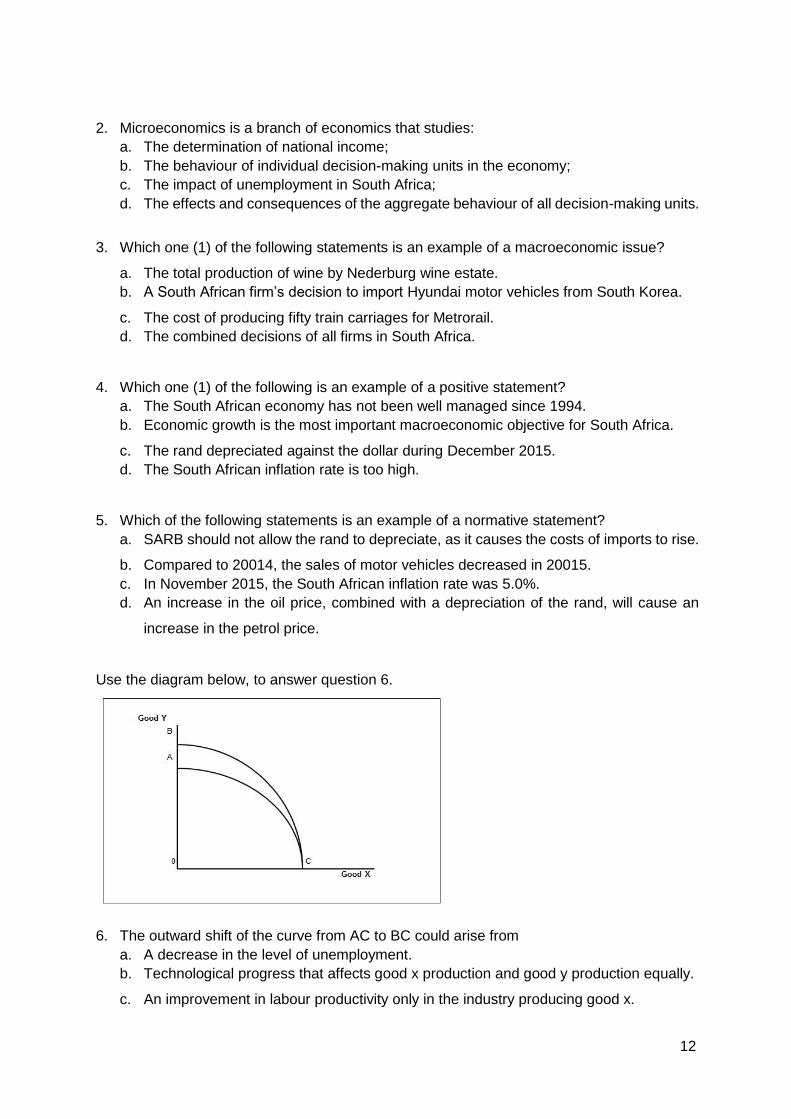
Use the diagram below, to answer question 6.
6. The outward shift of the curve from AC to BC could arise from
a. A decrease in the level of unemployment.
b. Technological progress that affects good x production and good y production equally.
c. An improvement in labour productivity only in the industry producing good x.

13
d. An improvement in labour productivity only in the industry producing good y.
7. A shift in the production possibility curve would be caused by all but one (1) of the
following. Which one (1) of the following events would NOT cause a shift?
a. A rise in the price of one (1) or both of the goods being produced.
b. An improvement in the technology used to produce one (1) of the goods.
c. An improvement in the technology used to produce both the goods.
d. An increase in the quantity of resources available in the economy.
8. Which one (1) of the following would economists NOT regard as being a factor of
production?
a. One hectare of cultivated farmland owned by Sizwe;
b. The tractor used on the farm owned by Sizwe;
c. The profits earned by Sizwe’s farming activities;
d. The labourers employed on Sizwe’s farm.
9. Which of the following is most likely to be an example of a public good?
a. Loaves of bread on sale at a supermarket;
b. The park nearest to your house;
c. A television broadcast of a rugby match on SuperSport;
d. The parking facilities at your local airport.
10. Which of the following would be viewed by economists as a factor of production?
a. The N2 national road between Cape Town and Port Elizabeth.
b. Labour of households.
c. Wages earned by labourers.
d. Arable land which can be used for farming.
11. Which one (1) of the following activities relates to the tertiary sector?
a. The daily catch of the fishermen on the Mary Rose at Struisbaai;
b. The output of the I&J factory in Cape Town;
c. The building of the Rapid Bus Transport lanes in Cape Town;
d. Registration of a home loan by ABSA bank.
12. An economics teacher decides to give up her job at a secondary school where she earns
R180 000 per year. She is offered another full-time job for R210 000 per year or can work
for herself from home as a private consultant. What is the opportunity cost of working
from home?
a. R30 000;
b. R180 000;
c. R210 000;
d. R390 000.

14
Questions 13, 14 and 15 are based on the figure below, which represents production
possibilities curves.
13. The opportunity cost to produce more motorcycles is illustrated by the …
a. Movement from point b to point c.
b. Movement from point a to point c.
c. Shift of curve MN to curve LK.
d. Shift of curve LN to curve LK.
e. Shift of curve MN to curve NL.
14. Unemployment can be illustrated by
a. The movement from point c to point b.
b. The movement from curve LK to curve MN.
c. The movement from curve LN to curve MN.
d. Point d.
e. Point e.
15. Which one (1) of the following statements is INCORRECT?
a. The outward shift of curve MN to curve LK illustrates an increase in potential output.
b. Point a on curve MN and points b and c on curve LN represents attainable
combinations of cars and motorcycles.
c. When comparing output combination a to b, one (1) can see that there must be
higher levels of unemployment at combination a.
d. Without an outward shift of the curve LK point d is unattainable.