PM2.5 and PM10 emissions from agricultural soils by … and PM10 emissions from agricultural soils...
12
PM2.5 and PM10 emissions from agricultural soils by wind erosion q Hongli Li a , John Tatarko b,⇑ , Matthew Kucharski c , Zhi Dong a a Forestry College of Shandong Agricultural University, Tai’an, Shandong, PR China b USDA-ARS Agricultural Systems Research Unit, Fort Collins, CO, United States c USDA-ARS Agricultural Systems Research Unit, Manhattan, KS, United States article info Article history: Available online 6 March 2015 Keywords: Dust emission PM2.5/PM10 ratio Wind tunnel Conventional tillage No-till abstract Soil tillage and wind erosion are two major emission sources of particulate matter less than 2.5 and 10 lm in size (PM2.5 and PM10) from cultivated soils. Samples from fifteen cultivated soils from five states of the US, both crushed (<2.0 mm) and uncrushed (natural aggregation), were tested for PM2.5 and PM10 emissions in a wind tunnel, at 8, 10, and 13 m s 1 wind velocities. In addition, 10 soils were paired as conventional vs. no-till. Results showed that: (1) PM2.5 and PM10 emissions of crushed and uncrushed samples increased with wind speed, with a more rapid and greater emissions trend for crushed samples; after three wind speeds, mean PM2.5 and PM10 emissions from crushed soils were 1.3–8.5 and 1.9–10 times that of uncrushed soils; (2) PM2.5/PM10 ratios of crushed and uncrushed sam- ples were, respectively, 0.11–0.45 and 0.13–0.46, and the mean PM2.5/PM10 ratio of uncrushed samples was higher; (3) PM2.5 and PM10 emissions of tested soils showed a significant negative power function relationship with clay content and PM2.5 and PM10 fractions of the dispersed soil samples, whereas the sand content and <0.42-mm aggregate content of the samples showed a significant linear positive corre- lation with emissions; and (4) although not significant, no-till soils had consistently lower PM2.5 and PM10 emissions than paired conventional tilled soils for uncrushed samples. Published by Elsevier B.V. 1. Introduction Fugitive windblown dust has been recognized as a serious health and environmental issue associated with reduced air quality and visibility (Chepil and Woodruff, 1957; Hagen and Skidmore, 1977; Gillette, 1986; Carvacho et al., 2001), soil nutrient and productivity loss (Zobeck and Fryrear, 1986; Larney et al., 1998), and soil degradation due to nutrient/chemical loading on regional ecological systems (Leys, 1999; Leys and McTainsh, 1999). Fine particles, especially particulate matter of mean aerodynamic dia- meter 10 lm and less (PM10 and PM2.5), are hazardous to human health because they can penetrate pulmonary defenses and lodge deep in the lungs (Ostro et al., 1999; Kjelgaard et al., 2004b). The larger particles in this range (PM10–PM2.5) tend to be deposited in the upper airways of the respiratory tract, whereas PM2.5 can reach and be deposited in the smallest airways in the lungs. Smaller particles are considered more hazardous to health than larger particles (Pope et al., 1995; Schwartz et al., 1996; Klemm et al., 2000), but the larger particles (i.e., PM10) remain subject to regulation (Carvacho et al., 2001). The United States Environmental Protection Agency (US EPA, 1999a) set regulations for PM10 in 1987 and later regulated the mass concentration of PM2.5 (US EPA, 1996). In 2012, the US EPA revised the standard for PM2.5 as 35 lgm 3 for 24 h (US Federal Register, 2013). Pace (2005) listed major sources of fugitive dust emissions as including traffic on paved and unpaved roads, construction, agri- cultural operations, mineral industries, and wind erosion from both agricultural and nonagricultural lands. Many studies have reported PM10 from paved and unpaved roads, but limited field data are available for other categories. PM10 emission rates from wind erosion are related to dust suspension (Roney and White, 2006). Several studies have evaluated PM10 from agricultural operations (Ashbaugh and Eldred, 2004; Kjelgaard et al., 2004a; Pace, 2005), but few research results have been reported for emis- sions from cultivated agricultural soil surfaces, especially for PM2.5 emission. The potential of various soils to contribute to the PM10 component of suspension was investigated by Hagen (2004a) and Carvacho et al. (2001, 2004). Mirzamostafa et al. (1998) proposed three major processes as possible sources of fine particulates from soils. These processes are direct entrainment (emission) of loose particles by the wind, abrasion of immobile aggregates and crusts by saltation impacts, and breakage of mobile saltation and creep-sized aggregates and particles into suspension http://dx.doi.org/10.1016/j.aeolia.2015.02.003 1875-9637/Published by Elsevier B.V. q USDA is an equal opportunity provider and employer. ⇑ Corresponding author at: 2150 Centre Avenue, Bldg. D. Suite 200, Fort Collins, CO 80526, United States. Tel.: +1 785 341 2235; fax: +1 970 492 7310. E-mail address: [email protected] (J. Tatarko). Aeolian Research 19 (2015) 171–182 Contents lists available at ScienceDirect Aeolian Research journal homepage: www.elsevier.com/locate/aeolia
-
Upload
nguyentram -
Category
Documents
-
view
216 -
download
0
Transcript of PM2.5 and PM10 emissions from agricultural soils by … and PM10 emissions from agricultural soils...

Aeolian Research 19 (2015) 171–182
Contents lists available at ScienceDirect
Aeolian Research
journal homepage: www.elsevier .com/locate /aeol ia
PM2.5 and PM10 emissions from agricultural soils by wind erosion q
http://dx.doi.org/10.1016/j.aeolia.2015.02.0031875-9637/Published by Elsevier B.V.
q USDA is an equal opportunity provider and employer.⇑ Corresponding author at: 2150 Centre Avenue, Bldg. D. Suite 200, Fort Collins,
CO 80526, United States. Tel.: +1 785 341 2235; fax: +1 970 492 7310.E-mail address: [email protected] (J. Tatarko).
Hongli Li a, John Tatarko b,⇑, Matthew Kucharski c, Zhi Dong a
a Forestry College of Shandong Agricultural University, Tai’an, Shandong, PR Chinab USDA-ARS Agricultural Systems Research Unit, Fort Collins, CO, United Statesc USDA-ARS Agricultural Systems Research Unit, Manhattan, KS, United States
a r t i c l e i n f o a b s t r a c t
Article history:Available online 6 March 2015
Keywords:Dust emissionPM2.5/PM10 ratioWind tunnelConventional tillageNo-till
Soil tillage and wind erosion are two major emission sources of particulate matter less than 2.5 and10 lm in size (PM2.5 and PM10) from cultivated soils. Samples from fifteen cultivated soils from fivestates of the US, both crushed (<2.0 mm) and uncrushed (natural aggregation), were tested for PM2.5and PM10 emissions in a wind tunnel, at 8, 10, and 13 m s�1 wind velocities. In addition, 10 soils werepaired as conventional vs. no-till. Results showed that: (1) PM2.5 and PM10 emissions of crushed anduncrushed samples increased with wind speed, with a more rapid and greater emissions trend forcrushed samples; after three wind speeds, mean PM2.5 and PM10 emissions from crushed soils were1.3–8.5 and 1.9–10 times that of uncrushed soils; (2) PM2.5/PM10 ratios of crushed and uncrushed sam-ples were, respectively, 0.11–0.45 and 0.13–0.46, and the mean PM2.5/PM10 ratio of uncrushed sampleswas higher; (3) PM2.5 and PM10 emissions of tested soils showed a significant negative power functionrelationship with clay content and PM2.5 and PM10 fractions of the dispersed soil samples, whereas thesand content and <0.42-mm aggregate content of the samples showed a significant linear positive corre-lation with emissions; and (4) although not significant, no-till soils had consistently lower PM2.5 andPM10 emissions than paired conventional tilled soils for uncrushed samples.
Published by Elsevier B.V.
1. Introduction
Fugitive windblown dust has been recognized as a serioushealth and environmental issue associated with reduced air qualityand visibility (Chepil and Woodruff, 1957; Hagen and Skidmore,1977; Gillette, 1986; Carvacho et al., 2001), soil nutrient andproductivity loss (Zobeck and Fryrear, 1986; Larney et al., 1998),and soil degradation due to nutrient/chemical loading on regionalecological systems (Leys, 1999; Leys and McTainsh, 1999). Fineparticles, especially particulate matter of mean aerodynamic dia-meter 10 lm and less (PM10 and PM2.5), are hazardous to humanhealth because they can penetrate pulmonary defenses and lodgedeep in the lungs (Ostro et al., 1999; Kjelgaard et al., 2004b). Thelarger particles in this range (PM10–PM2.5) tend to be depositedin the upper airways of the respiratory tract, whereas PM2.5 canreach and be deposited in the smallest airways in the lungs.Smaller particles are considered more hazardous to health thanlarger particles (Pope et al., 1995; Schwartz et al., 1996; Klemmet al., 2000), but the larger particles (i.e., PM10) remain subject
to regulation (Carvacho et al., 2001). The United StatesEnvironmental Protection Agency (US EPA, 1999a) set regulationsfor PM10 in 1987 and later regulated the mass concentration ofPM2.5 (US EPA, 1996). In 2012, the US EPA revised the standardfor PM2.5 as 35 lg m�3 for 24 h (US Federal Register, 2013).
Pace (2005) listed major sources of fugitive dust emissions asincluding traffic on paved and unpaved roads, construction, agri-cultural operations, mineral industries, and wind erosion fromboth agricultural and nonagricultural lands. Many studies havereported PM10 from paved and unpaved roads, but limited fielddata are available for other categories. PM10 emission rates fromwind erosion are related to dust suspension (Roney and White,2006). Several studies have evaluated PM10 from agriculturaloperations (Ashbaugh and Eldred, 2004; Kjelgaard et al., 2004a;Pace, 2005), but few research results have been reported for emis-sions from cultivated agricultural soil surfaces, especially forPM2.5 emission. The potential of various soils to contribute tothe PM10 component of suspension was investigated by Hagen(2004a) and Carvacho et al. (2001, 2004). Mirzamostafa et al.(1998) proposed three major processes as possible sources of fineparticulates from soils. These processes are direct entrainment(emission) of loose particles by the wind, abrasion of immobileaggregates and crusts by saltation impacts, and breakage of mobilesaltation and creep-sized aggregates and particles into suspension
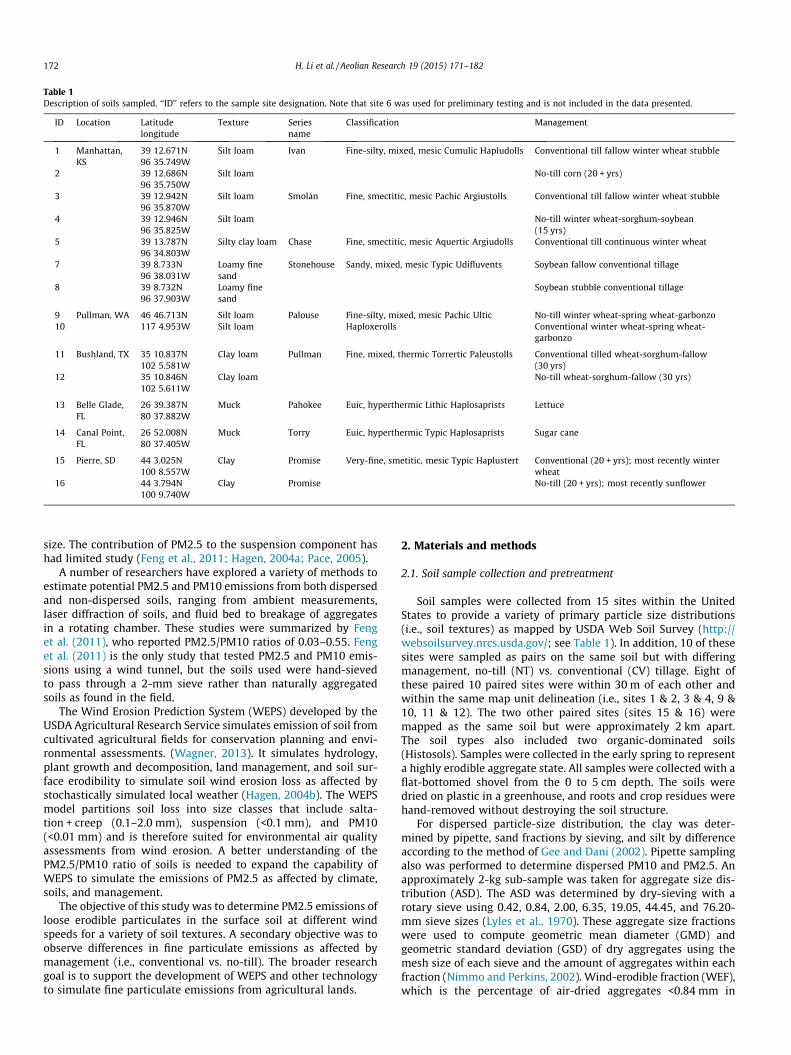
Table 1Description of soils sampled. ‘‘ID’’ refers to the sample site designation. Note that site 6 was used for preliminary testing and is not included in the data presented.
ID Location Latitudelongitude
Texture Seriesname
Classification Management
1 Manhattan,KS
39 12.671N Silt loam Ivan Fine-silty, mixed, mesic Cumulic Hapludolls Conventional till fallow winter wheat stubble96 35.749W
2 39 12.686N Silt loam No-till corn (20 + yrs)96 35.750W
3 39 12.942N Silt loam Smolan Fine, smectitic, mesic Pachic Argiustolls Conventional till fallow winter wheat stubble96 35.870W
4 39 12.946N Silt loam No-till winter wheat-sorghum-soybean(15 yrs)96 35.825W
5 39 13.787N Silty clay loam Chase Fine, smectitic, mesic Aquertic Argiudolls Conventional till continuous winter wheat96 34.803W
7 39 8.733N Loamy finesand
Stonehouse Sandy, mixed, mesic Typic Udifluvents Soybean fallow conventional tillage96 38.031W
8 39 8.732N Loamy finesand
Soybean stubble conventional tillage96 37.903W
9 Pullman, WA 46 46.713N Silt loam Palouse Fine-silty, mixed, mesic Pachic UlticHaploxerolls
No-till winter wheat-spring wheat-garbonzo117 4.953W10 Silt loam Conventional winter wheat-spring wheat-
garbonzo
11 Bushland, TX 35 10.837N Clay loam Pullman Fine, mixed, thermic Torrertic Paleustolls Conventional tilled wheat-sorghum-fallow(30 yrs)102 5.581W
12 35 10.846N Clay loam No-till wheat-sorghum-fallow (30 yrs)102 5.611W
13 Belle Glade,FL
26 39.387N Muck Pahokee Euic, hyperthermic Lithic Haplosaprists Lettuce80 37.882W
14 Canal Point,FL
26 52.008N Muck Torry Euic, hyperthermic Typic Haplosaprists Sugar cane80 37.405W
15 Pierre, SD 44 3.025N Clay Promise Very-fine, smetitic, mesic Typic Haplustert Conventional (20 + yrs); most recently winterwheat100 8.557W
16 44 3.794N Clay Promise No-till (20 + yrs); most recently sunflower100 9.740W
172 H. Li et al. / Aeolian Research 19 (2015) 171–182
size. The contribution of PM2.5 to the suspension component hashad limited study (Feng et al., 2011; Hagen, 2004a; Pace, 2005).
A number of researchers have explored a variety of methods toestimate potential PM2.5 and PM10 emissions from both dispersedand non-dispersed soils, ranging from ambient measurements,laser diffraction of soils, and fluid bed to breakage of aggregatesin a rotating chamber. These studies were summarized by Fenget al. (2011), who reported PM2.5/PM10 ratios of 0.03–0.55. Fenget al. (2011) is the only study that tested PM2.5 and PM10 emis-sions using a wind tunnel, but the soils used were hand-sievedto pass through a 2-mm sieve rather than naturally aggregatedsoils as found in the field.
The Wind Erosion Prediction System (WEPS) developed by theUSDA Agricultural Research Service simulates emission of soil fromcultivated agricultural fields for conservation planning and envi-ronmental assessments. (Wagner, 2013). It simulates hydrology,plant growth and decomposition, land management, and soil sur-face erodibility to simulate soil wind erosion loss as affected bystochastically simulated local weather (Hagen, 2004b). The WEPSmodel partitions soil loss into size classes that include salta-tion + creep (0.1–2.0 mm), suspension (<0.1 mm), and PM10(<0.01 mm) and is therefore suited for environmental air qualityassessments from wind erosion. A better understanding of thePM2.5/PM10 ratio of soils is needed to expand the capability ofWEPS to simulate the emissions of PM2.5 as affected by climate,soils, and management.
The objective of this study was to determine PM2.5 emissions ofloose erodible particulates in the surface soil at different windspeeds for a variety of soil textures. A secondary objective was toobserve differences in fine particulate emissions as affected bymanagement (i.e., conventional vs. no-till). The broader researchgoal is to support the development of WEPS and other technologyto simulate fine particulate emissions from agricultural lands.
2. Materials and methods
2.1. Soil sample collection and pretreatment
Soil samples were collected from 15 sites within the UnitedStates to provide a variety of primary particle size distributions(i.e., soil textures) as mapped by USDA Web Soil Survey (http://websoilsurvey.nrcs.usda.gov/; see Table 1). In addition, 10 of thesesites were sampled as pairs on the same soil but with differingmanagement, no-till (NT) vs. conventional (CV) tillage. Eight ofthese paired 10 paired sites were within 30 m of each other andwithin the same map unit delineation (i.e., sites 1 & 2, 3 & 4, 9 &10, 11 & 12). The two other paired sites (sites 15 & 16) weremapped as the same soil but were approximately 2 km apart.The soil types also included two organic-dominated soils(Histosols). Samples were collected in the early spring to representa highly erodible aggregate state. All samples were collected with aflat-bottomed shovel from the 0 to 5 cm depth. The soils weredried on plastic in a greenhouse, and roots and crop residues werehand-removed without destroying the soil structure.
For dispersed particle-size distribution, the clay was deter-mined by pipette, sand fractions by sieving, and silt by differenceaccording to the method of Gee and Dani (2002). Pipette samplingalso was performed to determine dispersed PM10 and PM2.5. Anapproximately 2-kg sub-sample was taken for aggregate size dis-tribution (ASD). The ASD was determined by dry-sieving with arotary sieve using 0.42, 0.84, 2.00, 6.35, 19.05, 44.45, and 76.20-mm sieve sizes (Lyles et al., 1970). These aggregate size fractionswere used to compute geometric mean diameter (GMD) andgeometric standard deviation (GSD) of dry aggregates using themesh size of each sieve and the amount of aggregates within eachfraction (Nimmo and Perkins, 2002). Wind-erodible fraction (WEF),which is the percentage of air-dried aggregates <0.84 mm in
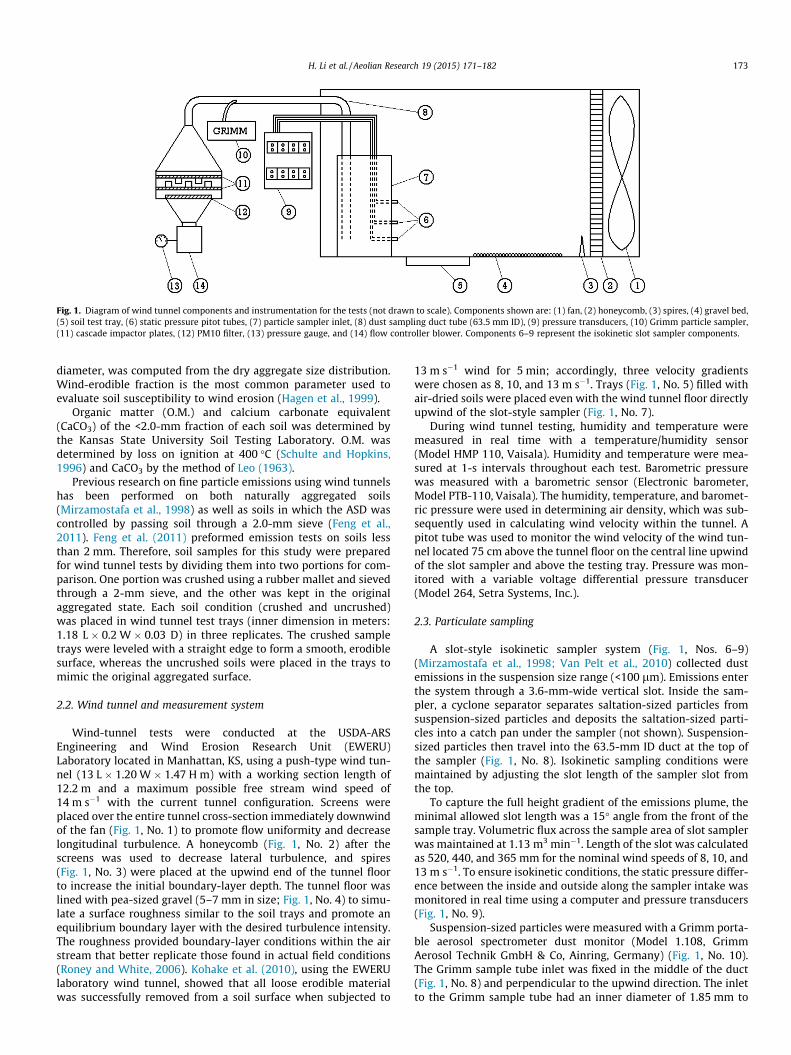
Fig. 1. Diagram of wind tunnel components and instrumentation for the tests (not drawn to scale). Components shown are: (1) fan, (2) honeycomb, (3) spires, (4) gravel bed,(5) soil test tray, (6) static pressure pitot tubes, (7) particle sampler inlet, (8) dust sampling duct tube (63.5 mm ID), (9) pressure transducers, (10) Grimm particle sampler,(11) cascade impactor plates, (12) PM10 filter, (13) pressure gauge, and (14) flow controller blower. Components 6–9 represent the isokinetic slot sampler components.
H. Li et al. / Aeolian Research 19 (2015) 171–182 173
diameter, was computed from the dry aggregate size distribution.Wind-erodible fraction is the most common parameter used toevaluate soil susceptibility to wind erosion (Hagen et al., 1999).
Organic matter (O.M.) and calcium carbonate equivalent(CaCO3) of the <2.0-mm fraction of each soil was determined bythe Kansas State University Soil Testing Laboratory. O.M. wasdetermined by loss on ignition at 400 �C (Schulte and Hopkins,1996) and CaCO3 by the method of Leo (1963).
Previous research on fine particle emissions using wind tunnelshas been performed on both naturally aggregated soils(Mirzamostafa et al., 1998) as well as soils in which the ASD wascontrolled by passing soil through a 2.0-mm sieve (Feng et al.,2011). Feng et al. (2011) preformed emission tests on soils lessthan 2 mm. Therefore, soil samples for this study were preparedfor wind tunnel tests by dividing them into two portions for com-parison. One portion was crushed using a rubber mallet and sievedthrough a 2-mm sieve, and the other was kept in the originalaggregated state. Each soil condition (crushed and uncrushed)was placed in wind tunnel test trays (inner dimension in meters:1.18 L � 0.2 W � 0.03 D) in three replicates. The crushed sampletrays were leveled with a straight edge to form a smooth, erodiblesurface, whereas the uncrushed soils were placed in the trays tomimic the original aggregated surface.
2.2. Wind tunnel and measurement system
Wind-tunnel tests were conducted at the USDA-ARSEngineering and Wind Erosion Research Unit (EWERU)Laboratory located in Manhattan, KS, using a push-type wind tun-nel (13 L � 1.20 W � 1.47 H m) with a working section length of12.2 m and a maximum possible free stream wind speed of14 m s�1 with the current tunnel configuration. Screens wereplaced over the entire tunnel cross-section immediately downwindof the fan (Fig. 1, No. 1) to promote flow uniformity and decreaselongitudinal turbulence. A honeycomb (Fig. 1, No. 2) after thescreens was used to decrease lateral turbulence, and spires(Fig. 1, No. 3) were placed at the upwind end of the tunnel floorto increase the initial boundary-layer depth. The tunnel floor waslined with pea-sized gravel (5–7 mm in size; Fig. 1, No. 4) to simu-late a surface roughness similar to the soil trays and promote anequilibrium boundary layer with the desired turbulence intensity.The roughness provided boundary-layer conditions within the airstream that better replicate those found in actual field conditions(Roney and White, 2006). Kohake et al. (2010), using the EWERUlaboratory wind tunnel, showed that all loose erodible materialwas successfully removed from a soil surface when subjected to
13 m s�1 wind for 5 min; accordingly, three velocity gradientswere chosen as 8, 10, and 13 m s�1. Trays (Fig. 1, No. 5) filled withair-dried soils were placed even with the wind tunnel floor directlyupwind of the slot-style sampler (Fig. 1, No. 7).
During wind tunnel testing, humidity and temperature weremeasured in real time with a temperature/humidity sensor(Model HMP 110, Vaisala). Humidity and temperature were mea-sured at 1-s intervals throughout each test. Barometric pressurewas measured with a barometric sensor (Electronic barometer,Model PTB-110, Vaisala). The humidity, temperature, and baromet-ric pressure were used in determining air density, which was sub-sequently used in calculating wind velocity within the tunnel. Apitot tube was used to monitor the wind velocity of the wind tun-nel located 75 cm above the tunnel floor on the central line upwindof the slot sampler and above the testing tray. Pressure was mon-itored with a variable voltage differential pressure transducer(Model 264, Setra Systems, Inc.).
2.3. Particulate sampling
A slot-style isokinetic sampler system (Fig. 1, Nos. 6–9)(Mirzamostafa et al., 1998; Van Pelt et al., 2010) collected dustemissions in the suspension size range (<100 lm). Emissions enterthe system through a 3.6-mm-wide vertical slot. Inside the sam-pler, a cyclone separator separates saltation-sized particles fromsuspension-sized particles and deposits the saltation-sized parti-cles into a catch pan under the sampler (not shown). Suspension-sized particles then travel into the 63.5-mm ID duct at the top ofthe sampler (Fig. 1, No. 8). Isokinetic sampling conditions weremaintained by adjusting the slot length of the sampler slot fromthe top.
To capture the full height gradient of the emissions plume, theminimal allowed slot length was a 15� angle from the front of thesample tray. Volumetric flux across the sample area of slot samplerwas maintained at 1.13 m3 min�1. Length of the slot was calculatedas 520, 440, and 365 mm for the nominal wind speeds of 8, 10, and13 m s�1. To ensure isokinetic conditions, the static pressure differ-ence between the inside and outside along the sampler intake wasmonitored in real time using a computer and pressure transducers(Fig. 1, No. 9).
Suspension-sized particles were measured with a Grimm porta-ble aerosol spectrometer dust monitor (Model 1.108, GrimmAerosol Technik GmbH & Co, Ainring, Germany) (Fig. 1, No. 10).The Grimm sample tube inlet was fixed in the middle of the duct(Fig. 1, No. 8) and perpendicular to the upwind direction. The inletto the Grimm sample tube had an inner diameter of 1.85 mm to

174 H. Li et al. / Aeolian Research 19 (2015) 171–182
maintain isokinetic conditions. The sampling tube was positionedeight times the diameter of the duct (63.5 � 8 = 508 mm)downwind of any changes in airflow direction and upwind onetimes the diameter of changes in airflow direction. This Grimmspectrometer drew air at a volume-controlled 1.2 L min�1 past alight-scattering laser diode source and divided particulate concen-tration into 15 distinct size classes from 0.23 to 20 lm. The spec-trometer was used throughout wind tunnel testing to determinethe particulate concentration resulting from emissions of the traysamples. It allowed for a real-time view of the particulate concen-trations during testing and partitioning of emissions at each windspeed.
A PM10 High-Volume (Hi-Vol) Sampler (EPA reference method:RFPS-1287-063; Graseby Andersen/GMW Model 1200 High-Volume Air Sampler) was used to separate and collect PM10 sizeparticles (Fig. 1, Nos. 11–14). As ambient air is drawn into the inlet,it is evacuated from the buffer chamber through nine accelerationnozzles into the impaction chamber, where particles >10 lmimpact on greased collection plates. The air containing the PM10particle fraction is then channeled through an additional 16 venttubes and collected on a glass fiber filter.
PM10 as measured by the aerosol spectrometer dust monitorwas found to be highly correlated with that collected on theHi-Vol filter (Fig. 2). The Hi-Vol sampling system is an EPA-ap-proved PM10 sampling method (US EPA, 1999b); however, thehigh correlation between the two methods demonstrates that thedust monitor in this study also provided a good measure ofPM10. Because the Grimm provided an additional separation ofPM2.5 as well as real-time monitoring, we present only PM2.5and PM10 loss as calculated from the Grimm in this paper.
2.4. Wind tunnel experimental procedure
The trays were placed even with the wind tunnel floor directlyupwind of the slot sampler. Prior to a wind tunnel run, the pump ofthe sampler was run 1 min to stabilize the system. The windspeeds were then adjusted at discrete free stream velocities of 8,10, and 13 m s�1 for each tray. This velocity was maintained for5 min during emission testing for uncrushed samples and 2 minfor crushed samples at each wind speed. There was a 1-min inter-val of no wind between the speed changes during which the sys-tem walls were knocked with a wooden dowel to dislodgeparticulates attached to the interior of the system. During the test,the Grimm records particle concentration in 6-s intervals. After thetest was finished, the pump was run for 1 min to evacuate particlesfrom the system. The system was cleaned with compressed airbetween soil trays.
Fig. 2. Comparison of total PM10 as measured by Grimm vs. Hi-Vol sampler for alldata.
Results from the Grimm were expressed in total PM2.5 or PM10emissions loss per effective area. This was calculated using the fol-lowing formula:
E ¼ 1A� kXn
i¼1Ci � Q � Dtð Þ
where
E = emission loss per area (g m�2);A = effective area of tray = 0.00425 m2 (1.181 m traylength � 0.0036 m slot width);k = unit conversion factor (1/60,000,000 g min s�1 lg�1);n = number of 6-s iterationsCi = 6-s sliding average PM concentration as measured by theGrimm (lg m�3);Q = flow rate of PM10 Hi-Vol sampler (m3 min�1)Dt = time interval (6 s).
Because the 8, 10, and 13 m s�1 tests ran in succession on thesame tray, the emission loss per area at each wind speed was thesummation of the loss at lower wind speed. This summationmethod is less than optimal as it masks the emission loss at eachindividual wind speed. The summation was done however toexpedite the wind tunnel testing process, minimize the time forprocessing Hi-Vol filters, and avoid completely cleaning the systembetween changes of wind speed for each run.
2.5. Ambient atmospheric dust monitoring
Atmospheric dust concentration in the study is the backgroundambient dust in the air that is drawn into the wind tunnel. Particleconcentration of the background environment (PM10 and PM2.5)was measured by a MiniVol Tactical Air Sampler (Airmetrics mod-el: TAS-5.0) that was positioned approximately 5 m from theintake of the wind tunnel fan. The sampler was located in an unob-structed area. The PM contents of the atmosphere were calculatedfrom the weight change of the mini-filters, flow rate, and run-time.
The average background concentrations of PM10 and PM 2.5were 0.022 and 0.0019 lg m�3 during research (p = 0.858 forPM2.5, p = 0.893 for PM10), respectively. Difference analysis showsno significant differences (p > 0.05) in atmospheric dust concentra-tion of each interval during the test. All samples were tested underthe same background conditions, and test values were comparable;therefore, the difference in particle concentration obtained by theGrimm dust monitor was assumed to result from differences in soilemissions within the tunnel.
3. Results and discussion
3.1. Physical and chemical properties of tested soils
The general physical and chemical properties of each soil arepresented in Table 2. Clay contents ranged from 1.6% to 82.7%, sandranged from 1.6% to 66.6%, and silt varied from 15.7% to 86.7%. Fineand very fine sand are often used to estimate the amount ofabrader sand on erodible soils, so they are reported here. Organicmatter content ranged from 0.7% to 5.1% for mineral-dominatedsoils and 25.3–64.0 % for organic-dominated soils (Nos. 13 and14). The dry aggregate size distribution (DASD) parameters arepresented for crushed and uncrushed soils in Table 3. Erodiblefaction (EF) ranged from 15.2% to 89.8%. EF is the percentage ofair-dried aggregates with <0.84-mm diameter and is the parameterfound to be most sensitive to a soil’s susceptibility to wind erosion(Hagen et al., 1999). The <0.42-mm percentage ranged from 11.7%to 87.7% and was found in this study to be positively correlatedwith measured PM2.5 and PM10 concentrations (discussed later).
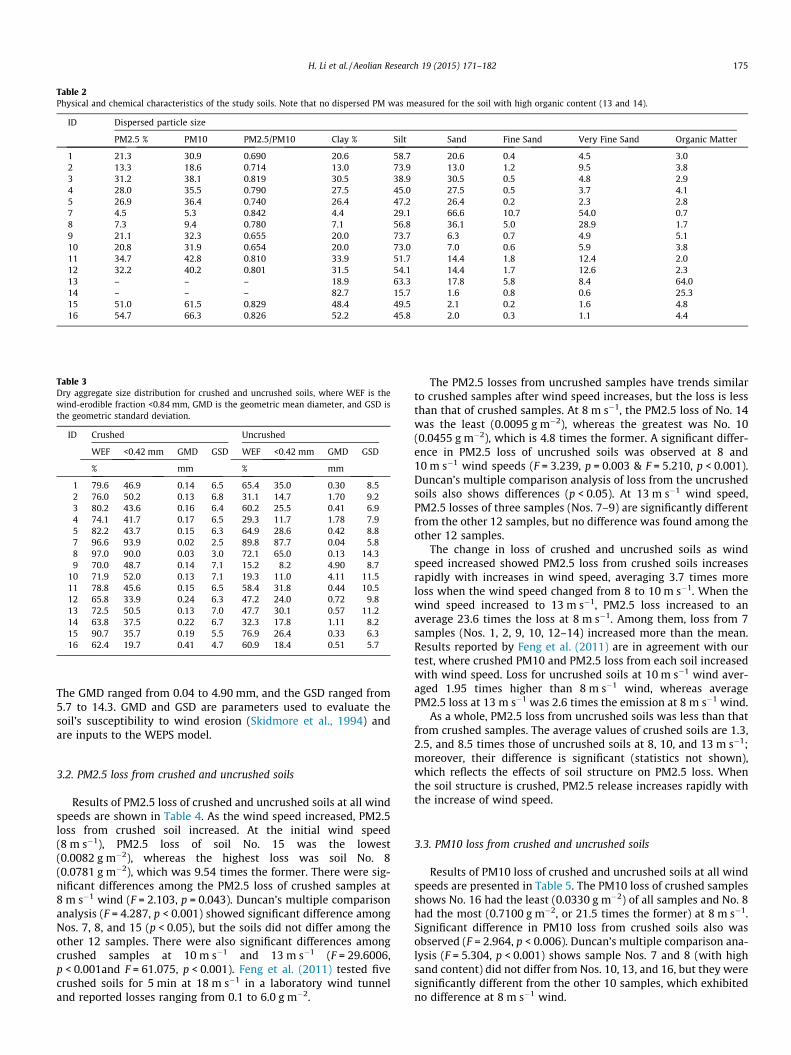
Table 3Dry aggregate size distribution for crushed and uncrushed soils, where WEF is thewind-erodible fraction <0.84 mm, GMD is the geometric mean diameter, and GSD isthe geometric standard deviation.
ID Crushed Uncrushed
WEF <0.42 mm GMD GSD WEF <0.42 mm GMD GSD
% mm % mm
1 79.6 46.9 0.14 6.5 65.4 35.0 0.30 8.52 76.0 50.2 0.13 6.8 31.1 14.7 1.70 9.23 80.2 43.6 0.16 6.4 60.2 25.5 0.41 6.94 74.1 41.7 0.17 6.5 29.3 11.7 1.78 7.95 82.2 43.7 0.15 6.3 64.9 28.6 0.42 8.87 96.6 93.9 0.02 2.5 89.8 87.7 0.04 5.88 97.0 90.0 0.03 3.0 72.1 65.0 0.13 14.39 70.0 48.7 0.14 7.1 15.2 8.2 4.90 8.7
10 71.9 52.0 0.13 7.1 19.3 11.0 4.11 11.511 78.8 45.6 0.15 6.5 58.4 31.8 0.44 10.512 65.8 33.9 0.24 6.3 47.2 24.0 0.72 9.813 72.5 50.5 0.13 7.0 47.7 30.1 0.57 11.214 63.8 37.5 0.22 6.7 32.3 17.8 1.11 8.215 90.7 35.7 0.19 5.5 76.9 26.4 0.33 6.316 62.4 19.7 0.41 4.7 60.9 18.4 0.51 5.7
Table 2Physical and chemical characteristics of the study soils. Note that no dispersed PM was measured for the soil with high organic content (13 and 14).
ID Dispersed particle size
PM2.5 % PM10 PM2.5/PM10 Clay % Silt Sand Fine Sand Very Fine Sand Organic Matter
1 21.3 30.9 0.690 20.6 58.7 20.6 0.4 4.5 3.02 13.3 18.6 0.714 13.0 73.9 13.0 1.2 9.5 3.83 31.2 38.1 0.819 30.5 38.9 30.5 0.5 4.8 2.94 28.0 35.5 0.790 27.5 45.0 27.5 0.5 3.7 4.15 26.9 36.4 0.740 26.4 47.2 26.4 0.2 2.3 2.87 4.5 5.3 0.842 4.4 29.1 66.6 10.7 54.0 0.78 7.3 9.4 0.780 7.1 56.8 36.1 5.0 28.9 1.79 21.1 32.3 0.655 20.0 73.7 6.3 0.7 4.9 5.110 20.8 31.9 0.654 20.0 73.0 7.0 0.6 5.9 3.811 34.7 42.8 0.810 33.9 51.7 14.4 1.8 12.4 2.012 32.2 40.2 0.801 31.5 54.1 14.4 1.7 12.6 2.313 – – – 18.9 63.3 17.8 5.8 8.4 64.014 – – – 82.7 15.7 1.6 0.8 0.6 25.315 51.0 61.5 0.829 48.4 49.5 2.1 0.2 1.6 4.816 54.7 66.3 0.826 52.2 45.8 2.0 0.3 1.1 4.4
H. Li et al. / Aeolian Research 19 (2015) 171–182 175
The GMD ranged from 0.04 to 4.90 mm, and the GSD ranged from5.7 to 14.3. GMD and GSD are parameters used to evaluate thesoil’s susceptibility to wind erosion (Skidmore et al., 1994) andare inputs to the WEPS model.
3.2. PM2.5 loss from crushed and uncrushed soils
Results of PM2.5 loss of crushed and uncrushed soils at all windspeeds are shown in Table 4. As the wind speed increased, PM2.5loss from crushed soil increased. At the initial wind speed(8 m s�1), PM2.5 loss of soil No. 15 was the lowest(0.0082 g m�2), whereas the highest loss was soil No. 8(0.0781 g m�2), which was 9.54 times the former. There were sig-nificant differences among the PM2.5 loss of crushed samples at8 m s�1 wind (F = 2.103, p = 0.043). Duncan’s multiple comparisonanalysis (F = 4.287, p < 0.001) showed significant difference amongNos. 7, 8, and 15 (p < 0.05), but the soils did not differ among theother 12 samples. There were also significant differences amongcrushed samples at 10 m s�1 and 13 m s�1 (F = 29.6006,p < 0.001and F = 61.075, p < 0.001). Feng et al. (2011) tested fivecrushed soils for 5 min at 18 m s�1 in a laboratory wind tunneland reported losses ranging from 0.1 to 6.0 g m�2.
The PM2.5 losses from uncrushed samples have trends similarto crushed samples after wind speed increases, but the loss is lessthan that of crushed samples. At 8 m s�1, the PM2.5 loss of No. 14was the least (0.0095 g m�2), whereas the greatest was No. 10(0.0455 g m�2), which is 4.8 times the former. A significant differ-ence in PM2.5 loss of uncrushed soils was observed at 8 and10 m s�1 wind speeds (F = 3.239, p = 0.003 & F = 5.210, p < 0.001).Duncan’s multiple comparison analysis of loss from the uncrushedsoils also shows differences (p < 0.05). At 13 m s�1 wind speed,PM2.5 losses of three samples (Nos. 7–9) are significantly differentfrom the other 12 samples, but no difference was found among theother 12 samples.
The change in loss of crushed and uncrushed soils as windspeed increased showed PM2.5 loss from crushed soils increasesrapidly with increases in wind speed, averaging 3.7 times moreloss when the wind speed changed from 8 to 10 m s�1. When thewind speed increased to 13 m s�1, PM2.5 loss increased to anaverage 23.6 times the loss at 8 m s�1. Among them, loss from 7samples (Nos. 1, 2, 9, 10, 12–14) increased more than the mean.Results reported by Feng et al. (2011) are in agreement with ourtest, where crushed PM10 and PM2.5 loss from each soil increasedwith wind speed. Loss for uncrushed soils at 10 m s�1 wind aver-aged 1.95 times higher than 8 m s�1 wind, whereas averagePM2.5 loss at 13 m s�1 was 2.6 times the emission at 8 m s�1 wind.
As a whole, PM2.5 loss from uncrushed soils was less than thatfrom crushed samples. The average values of crushed soils are 1.3,2.5, and 8.5 times those of uncrushed soils at 8, 10, and 13 m s�1;moreover, their difference is significant (statistics not shown),which reflects the effects of soil structure on PM2.5 loss. Whenthe soil structure is crushed, PM2.5 release increases rapidly withthe increase of wind speed.
3.3. PM10 loss from crushed and uncrushed soils
Results of PM10 loss of crushed and uncrushed soils at all windspeeds are presented in Table 5. The PM10 loss of crushed samplesshows No. 16 had the least (0.0330 g m�2) of all samples and No. 8had the most (0.7100 g m�2, or 21.5 times the former) at 8 m s�1.Significant difference in PM10 loss from crushed soils also wasobserved (F = 2.964, p < 0.006). Duncan’s multiple comparison ana-lysis (F = 5.304, p < 0.001) shows sample Nos. 7 and 8 (with highsand content) did not differ from Nos. 10, 13, and 16, but they weresignificantly different from the other 10 samples, which exhibitedno difference at 8 m s�1 wind.
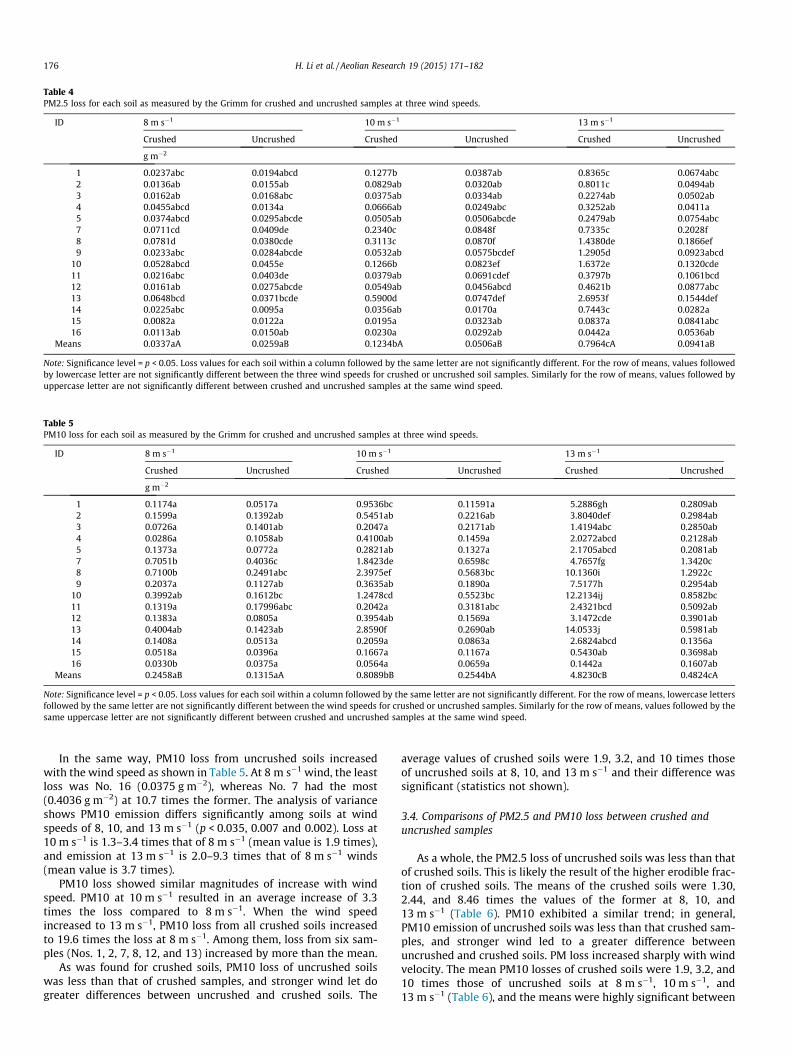
Table 4PM2.5 loss for each soil as measured by the Grimm for crushed and uncrushed samples at three wind speeds.
ID 8 m s�1 10 m s�1 13 m s�1
Crushed Uncrushed Crushed Uncrushed Crushed Uncrushed
g m�2
1 0.0237abc 0.0194abcd 0.1277b 0.0387ab 0.8365c 0.0674abc2 0.0136ab 0.0155ab 0.0829ab 0.0320ab 0.8011c 0.0494ab3 0.0162ab 0.0168abc 0.0375ab 0.0334ab 0.2274ab 0.0502ab4 0.0455abcd 0.0134a 0.0666ab 0.0249abc 0.3252ab 0.0411a5 0.0374abcd 0.0295abcde 0.0505ab 0.0506abcde 0.2479ab 0.0754abc7 0.0711cd 0.0409de 0.2340c 0.0848f 0.7335c 0.2028f8 0.0781d 0.0380cde 0.3113c 0.0870f 1.4380de 0.1866ef9 0.0233abc 0.0284abcde 0.0532ab 0.0575bcdef 1.2905d 0.0923abcd
10 0.0528abcd 0.0455e 0.1266b 0.0823ef 1.6372e 0.1320cde11 0.0216abc 0.0403de 0.0379ab 0.0691cdef 0.3797b 0.1061bcd12 0.0161ab 0.0275abcde 0.0549ab 0.0456abcd 0.4621b 0.0877abc13 0.0648bcd 0.0371bcde 0.5900d 0.0747def 2.6953f 0.1544def14 0.0225abc 0.0095a 0.0356ab 0.0170a 0.7443c 0.0282a15 0.0082a 0.0122a 0.0195a 0.0323ab 0.0837a 0.0841abc16 0.0113ab 0.0150ab 0.0230a 0.0292ab 0.0442a 0.0536ab
Means 0.0337aA 0.0259aB 0.1234bA 0.0506aB 0.7964cA 0.0941aB
Note: Significance level = p < 0.05. Loss values for each soil within a column followed by the same letter are not significantly different. For the row of means, values followedby lowercase letter are not significantly different between the three wind speeds for crushed or uncrushed soil samples. Similarly for the row of means, values followed byuppercase letter are not significantly different between crushed and uncrushed samples at the same wind speed.
Table 5PM10 loss for each soil as measured by the Grimm for crushed and uncrushed samples at three wind speeds.
ID 8 m s�1 10 m s�1 13 m s�1
Crushed Uncrushed Crushed Uncrushed Crushed Uncrushed
g m�2
1 0.1174a 0.0517a 0.9536bc 0.11591a 5.2886gh 0.2809ab2 0.1599a 0.1392ab 0.5451ab 0.2216ab 3.8040def 0.2984ab3 0.0726a 0.1401ab 0.2047a 0.2171ab 1.4194abc 0.2850ab4 0.0286a 0.1058ab 0.4100ab 0.1459a 2.0272abcd 0.2128ab5 0.1373a 0.0772a 0.2821ab 0.1327a 2.1705abcd 0.2081ab7 0.7051b 0.4036c 1.8423de 0.6598c 4.7657fg 1.3420c8 0.7100b 0.2491abc 2.3975ef 0.5683bc 10.1360i 1.2922c9 0.2037a 0.1127ab 0.3635ab 0.1890a 7.5177h 0.2954ab
10 0.3992ab 0.1612bc 1.2478cd 0.5523bc 12.2134ij 0.8582bc11 0.1319a 0.17996abc 0.2042a 0.3181abc 2.4321bcd 0.5092ab12 0.1383a 0.0805a 0.3954ab 0.1569a 3.1472cde 0.3901ab13 0.4004ab 0.1423ab 2.8590f 0.2690ab 14.0533j 0.5981ab14 0.1408a 0.0513a 0.2059a 0.0863a 2.6824abcd 0.1356a15 0.0518a 0.0396a 0.1667a 0.1167a 0.5430ab 0.3698ab16 0.0330b 0.0375a 0.0564a 0.0659a 0.1442a 0.1607ab
Means 0.2458aB 0.1315aA 0.8089bB 0.2544bA 4.8230cB 0.4824cA
Note: Significance level = p < 0.05. Loss values for each soil within a column followed by the same letter are not significantly different. For the row of means, lowercase lettersfollowed by the same letter are not significantly different between the wind speeds for crushed or uncrushed samples. Similarly for the row of means, values followed by thesame uppercase letter are not significantly different between crushed and uncrushed samples at the same wind speed.
176 H. Li et al. / Aeolian Research 19 (2015) 171–182
In the same way, PM10 loss from uncrushed soils increasedwith the wind speed as shown in Table 5. At 8 m s�1 wind, the leastloss was No. 16 (0.0375 g m�2), whereas No. 7 had the most(0.4036 g m�2) at 10.7 times the former. The analysis of varianceshows PM10 emission differs significantly among soils at windspeeds of 8, 10, and 13 m s�1 (p < 0.035, 0.007 and 0.002). Loss at10 m s�1 is 1.3–3.4 times that of 8 m s�1 (mean value is 1.9 times),and emission at 13 m s�1 is 2.0–9.3 times that of 8 m s�1 winds(mean value is 3.7 times).
PM10 loss showed similar magnitudes of increase with windspeed. PM10 at 10 m s�1 resulted in an average increase of 3.3times the loss compared to 8 m s�1. When the wind speedincreased to 13 m s�1, PM10 loss from all crushed soils increasedto 19.6 times the loss at 8 m s�1. Among them, loss from six sam-ples (Nos. 1, 2, 7, 8, 12, and 13) increased by more than the mean.
As was found for crushed soils, PM10 loss of uncrushed soilswas less than that of crushed samples, and stronger wind let dogreater differences between uncrushed and crushed soils. The
average values of crushed soils were 1.9, 3.2, and 10 times thoseof uncrushed soils at 8, 10, and 13 m s�1 and their difference wassignificant (statistics not shown).
3.4. Comparisons of PM2.5 and PM10 loss between crushed anduncrushed samples
As a whole, the PM2.5 loss of uncrushed soils was less than thatof crushed soils. This is likely the result of the higher erodible frac-tion of crushed soils. The means of the crushed soils were 1.30,2.44, and 8.46 times the values of the former at 8, 10, and13 m s�1 (Table 6). PM10 exhibited a similar trend; in general,PM10 emission of uncrushed soils was less than that crushed sam-ples, and stronger wind led to a greater difference betweenuncrushed and crushed soils. PM loss increased sharply with windvelocity. The mean PM10 losses of crushed soils were 1.9, 3.2, and10 times those of uncrushed soils at 8 m s�1, 10 m s�1, and13 m s�1 (Table 6), and the means were highly significant between

Table 6Comparisons of crushed and uncrushed soil loss ratios at three wind speeds.
ID PM2.5 (crushed/uncrushed) PM10 (crushed/uncrushed)
8 m s�1 10 m s�1 13 m s�1 8 m s�1 10 m s�1 13 m s�1
1 1.22 3.30 12.41 2.27 8.23 18.832 0.88 2.59 16.22 1.15 2.46 12.753 0.96 1.12 4.53 0.52 0.94 4.984 3.41 2.67 7.91 2.71 2.81 9.525 1.27 1.00 3.29 1.78 2.13 10.437 1.74 2.76 3.62 1.75 2.79 3.558 2.06 3.58 7.71 2.85 4.22 7.849 0.82 0.93 13.98 1.81 1.92 25.45
10 1.16 1.54 12.40 2.48 2.26 14.2311 0.54 0.55 3.58 0.73 0.64 4.7812 0.59 1.20 5.27 1.72 2.52 8.0713 0.67 0.60 1.00 1.31 1.43 1.4714 0.75 0.79 0.83 0.88 0.86 0.9015 1.74 7.89 17.45 2.81 10.63 23.5016 2.36 2.10 26.37 2.74 2.39 19.79
Means 1.30a 2.44a 8.46b 1.87a 3.18a 10.00b
Note: Significance level = p < 0.05. Values within the row of means followed by thesame letter are not significantly different.
H. Li et al. / Aeolian Research 19 (2015) 171–182 177
13 m s�1 and the other wind speeds (Table 6). This finding suggeststhat the changed soil aggregation (i.e., crushing soil) increasedPM2.5 and PM10 losses.
3.5. The ratio of PM2.5/PM10
Because PM2.5 is a component of PM10, a good approximationof PM2.5 can be obtained by treating PM2.5 as a fixed weight frac-tion of PM10 (Feng et al., 2011; Hagen, 2004a). The PM2.5/PM10emission ratio has been used by many for the evaluation of differ-ent surface soils to release PM2.5 (Cowherd and Kuykendal, 1997;Chandler et al., 2002; Ashbaugh et al., 2003; Carvacho et al., 2004;Feng et al., 2011). Greater values express PM2.5 particle emissionfrom soil and more serious harm to the human body andenvironment.
Table 7 contains the PM2.5/PM10 ratio from crushed anduncrushed samples as the wind speed varied. Overall, PM2.5/PM10ratio of crushed samples ranged from 0.11 to 0.45, and the meansof crushed soils were 0.19, 0.18, and 0.18, respectively, at the 8, 10,and 13 m s�1 wind speeds. The PM2.5/PM10 ratio for uncrushedsoils ranged from 0.13 to 0.46, and the means were 0.27, 0.27,and 0.24, respectively, at 8, 10, and 13 m s�1. Under the action ofwind erosion and abrasion, this study shows PM10 and PM2.5
Table 7The PM2.5/PM10 loss ratio for each crushed and uncrushed soil at three wind speeds.
ID 8 m s�1 10 m s�1 13 m s�1
Crushed Uncrushed Crushed Uncrushed Crushed Uncrushed
1 0.21a 0.39bc 0.14a 0.33bcd 0.16abc 0.26abc2 0.18a 0.19a 0.16a 0.24ab 0.21c 0.26abc3 0.22a 0.18a 0.18a 0.17ab 0.16abc 0.19a4 0.17a 0.23ab 0.18a 0.24ab 0.16abc 0.23ab5 0.26ab 0.43c 0.19a 0.41cd 0.11a 0.38c7 0.12a 0.13a 0.14a 0.15a 0.16abc 0.17a8 0.12a 0.18a 0.13a 0.19ab 0.14ab 0.17a9 0.17a 0.29abc 0.18a 0.32abc 0.17abc 0.32abc
10 0.13a 0.20a 0.11a 0.20abc 0.14ab 0.19a11 0.19a 0.27abc 0.19a 0.25ab 0.16abc 0.22ab12 0.14a 0.33abc 0.14a 0.28ab 0.15abc 0.22ab13 0.17a 0.26abc 0.21a 0.28ab 0.19bc 0.27ab14 0.17a 0.19a 0.18a 0.21ab 0.27d 0.21ab15 0.18a 0.32abc 0.12a 0.30ab 0.16abc 0.22ab16 0.41b 0.42abc 0.45b 0.46d 0.30d 0.34bc
Note: Significance level = p < 0.05. Values within a column followed by the sameletter are not significantly different.
losses of uncrushed soils were lower than those of crushedsamples, but PM2.5 losses constituted a larger proportion ofPM10 in crushed soils. Comparing values among the three windspeeds, the ratios of PM2.5/PM10 are listed in descending order:8 m s�1 < 10 m s�1 < 13 m s�1. This indicates that PM10 emissionincreased faster than PM2.5 as the wind speed increased.
The PM2.5/PM10 ratio of crushed soil was in the range of 0.11–0.45, which is similar to the results of others. Pace (2005) reportedPM2.5/PM10 ratios of 0.2 for agricultural soil. Cowherd andKuykendal (1997) reported that the PM2.5/PM10 ratios variedfrom 0.15 to 0.25 for various fugitive dust categories and notedan average multiplier of about 0.17. Ashbaugh and Eldred (2004)reported the ratio of PM2.5/PM10 to be 0.12 for an agriculturalfield in the San Joaquin Valley of California. Ono (2005) foundthe ratio of PM2.5/PM10 to be ‘‘around or less than 0.10’’ forwindblown dust from the Owens dry lake bed, with the averageratio of PM2.5/PM10 for the source categories found to be 0.10.The PM2.5/PM10 ratios of crushed and uncrushed samples forour study are 0.1–0.45 and 0.13–0.46, respectively, which arelower than the results of Chandler et al. (2002), who reportedvalues of 0.33–0.55. This difference may be associated with thetests being done using a wind tunnel in our study compared withthe chamber method of Chandler et al. (2002).
Of the 15 soils studied, the PM2.5/PM10 ratios at 3 wind speedsranged from 0.11 to 0.45 and had a wider range than the five soilstested by Feng et al. (2011), who found ratios from 0.11 to 0.33 at15 m s�1. This result could be attributed to the wider range of soilsand management practices in the present study.
3.6. Relationship between soil particle and aggregate size distributionand particulate loss
Chepil (1955) verified that sand particles have little or no cohe-siveness and are readily loosened by the force of wind and thatcoarse particles are easily moved by the wind. Silt and clay havegood cohesive properties and form wind-resistant clods thatenhance resistance to wind erosion and add substantial resistanceto abrasion by wind-blown materials. The sand contents of Nos. 7and 8 are 66.6% and 36.1%, whereas the clay plus silt contents ofother samples is greater than 80%, so the cohesiveness of Nos. 7and 8 is weak, as is their ability to resist wind erosion. Thus,PM2.5 and PM10 loss of both sandy samples are higher than theothers, even though their dispersed PM2.5 and PM10 are quitelow (<10%).
The correlation of different soil properties with PM2.5 andPM10 emission of both crushed and uncrushed samples at8 m s�1 are shown in Fig. 3, and the regressions, correlation coeffi-cients, and significance of soil properties and their PM losses aresummarized in Table 8. They show a significant negative correla-tion of both PM2.5 and PM10 loss from crushed samples at8 m s�1, with dispersed PM2.5, PM10, and clay content in the soilsamples, and a power function relationship (Fig. 3a–f). There aresignificant negative correlations between the dispersed PM2.5,PM10 and clay content in the soils and PM10 loss from uncrushedsoils, but only clay content is very significantly negative correlatedwith PM10 loss. In addition, no obvious relationship existsbetween PM2.5 loss and the dispersed PM2.5, PM10, and clay foruncrushed soil. According to the fitted equation, when PM2.5,PM10, and clay content in the soil increase to 10%, PM2.5 andPM10 emissions decrease sharply. When clay contents reach 20%,PM2.5 and PM10 emissions are stabilized.
PM2.5 and PM10 loss from all soils shows a linear negative rela-tionship with silt content in the samples (Fig. 3g and h). Fig. 3ishows a significant linear positive correlation of sand with particlelosses of all samples, except PM2.5 loss of uncrushed samples hasno linear correlation to sand content. The <0.42-mm aggregates are

Fig. 3. The relationship between soil properties and particulate loss of crushed (left) and uncrushed (right) soil at 8 m s�1 wind speed. (a and b): relationship of dispersed soilPM2.5 (%) with particulate loss; (c and d): relationship of soil dispersed soil PM10 (%) with particulate loss; (e and f): relationship of soil clay with particulate loss; (g and h):relationship of soil silt with particulate loss; (i and j): relationship of soil sand with particulate loss; (k and l): relationship of soil aggregates <0.42 mm (%) with particulateloss; (m and n): relationship of soil aggregates <0.84 mm (%) with particulate loss.
178 H. Li et al. / Aeolian Research 19 (2015) 171–182
linearly positively correlated but are significant only for crushedsamples (Fig. 3k and l); in other words, the higher the sand or<0.42 aggregate content, the more PM2.5 and PM10 are lost.
There is a linear positive relationship with <0.84 particle content(Fig. 3m and n), but these correlations are not significant(p > 0.05). As a whole, the correlations of uncrushed samples are

Fig. 3 (continued)
Table 8Regression statistics for PM2.5 and PM10 loss at 8 m s�1 for dispersed particles and aggregate size of crushed and uncrushed soils.
Particle or aggregatesize*
PM2.5 PM10
Regression equation r2 p value Regression equation r2 p value
PM2.5 CU y2.5 = 0.2443x�0.73 0.5337 <0.000 y10 = 5.0069x�1.102 0.7296 <0.000y2.5 = 0.0691x�0.344 0.2729 <0.007 y10 = 1.2497x�0.787 0.6475 <0.001
PM10 CU y2.5 = 0.2837x�0.715 0.5071 <0.000 y10 = 6.1821x�1.076 0.6877 <0.000y2.5 = 0.0719x�0.328 0.2457 <0.012 y10 = 1.6076x�0.798 0.6591 <0.001
Clay CU y2.5 = 0.2403x�0.732 0.5306 <0.011 y10 = 4.915x�1.107 0.7280 <0.003y2.5 = 0.0689x�0.346 0.2739 <0.028 y10 = 1.2229x�0.788 0.6416 <0.005
Silt CU y2.5 = �0.0003x + 0.0477 0.0294 <0.043 y10 = �0.002x + 0.3512 0.0148 <0.045y2.5 = 8E�05x + 0.0218 0.0095 <0.282 y10 = �0.0022x + 0.2456 0. 0893 <0.073
Sand CU y2.5 = 0.0009x + 0.0133 0.4971 <0.000 y10 = 0.0092x + 0.0539 0.5021 <0.000y2.5 = 0.0002x + 0.0216 0.1162 <0.008 y10 = 0.0046x + 0.0425 0.6523 <0.000
<0.42 mm CU y = 0.0009x � 0.0162 0.7666 <0.001 y = 0.0102x � 0.2763 0.8857 <0.001y = 0.0002x + 0.0159 0.0987 <0.048 y = 0.0018x + 0.0329 0.1409 <0.008
<0.84 mm CU y = 0.0004x � 0.094 0.1229 <0.001 y = 0.0036x � 0.279 0.1103 <0.001y = 0.0002x + 0.0159 0.0987 <0.048 y = 0.0018x + 0.0329 0.1409 <0.008
* C-crushed soil, U-uncrushed soil, r2 is the square of correlation coefficient.
H. Li et al. / Aeolian Research 19 (2015) 171–182 179

Fig. 4. The relationship of PM2.5 to PM10 loss from crushed (a) and uncrushed (b) samples at all three wind speeds. Dashed line in (b) represents line fitted with intercept setto 0.
Table 9Comparison of PM2.5 and PM10 loss for conventional (CV) vs. no-till (NT) management at three wind speeds.
State Tillage: 8 m s�1 10 m s�1 13 m s�1
CV NT CV NT CV NT
ID Soil Loss, g m�2
PM2.5 uncrushedKS 1 & 2 0.0194a 0.0155a 0.0387a 0.0320a 0.0674a 0.0494aKS 3 & 4 0.0168a 0.0134a 0.0334a 0.0249a 0.0502a 0.0411aWA 10 & 9 0.0455a 0.0284a 0.0823a 0.0575a 0.1320a 0.0923aTX 11 & 12 0.0403a 0.0275a 0.0691a 0.0456a 0.1061a 0.0877aSD 15 & 16 0.0122a 0.0150a 0.0323a 0.0292a 0.0841a 0.0536a
PM10 uncrushedKS 1 & 2 0.0517a 0.1392a 0.1159a 0.2216a 0.2809a 0.2984aKS 3 & 4 0.1401a 0.1058a 0.2171a 0.1459a 0.2850a 0.2128aWA 10 & 9 0.1612a 0.1127a 0.5523a 0.1890a 0.8582a 0.2954aTX 11 & 12 0.1798a 0.0805a 0.3181a 0.1569a 0.5092a 0.3901aSD 15 & 16 0.0396a 0.0375a 0.1167a 0.0659a 0.3698a 0.1607a
PM2.5/PM10 uncrushedKS 1 & 2 0.3934a 0.1891a 0.3332a 0.2423a 0.2625a 0.2628aKS 3 & 4 0.1779a 0.2262a 0.1693a 0.2409a 0.1908a 0.2298aWA 10 & 9 0.1976a 0.2858a 0.1960a 0.3160a 0.1882a 0.3157aTX 11 & 12 0.2716a 0.3254a 0.2473a 0.2839a 0.2202a 0.2226aSD 15 & 16 0.3169a 0.4157a 0.2972a 0.4600b 0.2237a 0.3396b
PM2.5 crushedKS 1 & 2 0.0237a 0.0136a 0.1277a 0.0829a 0.8365a 0.8011aKS 3 & 4 0.0162a 0.0455a 0.0375a 0.0666a 0.2274a 0.3252aWA 10 & 9 0.0528a 0.0233a 0.1266a 0.0532a 1.6372a 1.2905aTX 11 & 12 0.0216a 0.0161a 0.0379a 0.0549a 0.3797a 0.4621aSD 15 & 16 0.0082a 0.0113a 0.0195a 0.0230a 0.0837a 0.0442b
PM10 crushedKS 1 & 2 0.1174a 0.1599a 0.9536a 0.5451a 5.2886a 3.8040bKS 3 & 4 0.0726a 0.2863b 0.2047a 0.4100a 1.4194a 2.0272aWA 10 & 9 0.3992a 0.2037a 1.2478a 0.3635b 12.2134a 7.5177bTX 11 & 12 0.1319a 0.1383a 0.2042a 0.3954a 2.4321a 3.1472aSD 15 & 16 0.0518a 0.0330a 0.1667a 0.0564b 0.5430a 0.1442b
PM2.5/PM10 crushedKS 1 & 2 0.2055a 0.1792a 0.1416a 0.1647a 0.1583a 0.2126aKS 3 & 4 0.2166a 0.1688a 0.1821a 0.1766a 0.1649a 0.1596aWA 10 & 9 0.1317a 0.1706a 0.1052a 0.1783a 0.1352a 0.1749bTX 11 & 12 0.1896a 0.1365a 0.1918a 0.1425a 0.1560a 0.1485aSD 15 & 16 0.1780a 0.4065b 0.1212a 0.4543b 0.1564a 0.3005b
CV soils are Nos. 1, 3, 10, 11, and 15 and NT soils are Nos. 2, 4, 9, 12, and 16. Significance level = p < 0.05. Values within columns of the same wind speed followed by the sameletter are not significantly different.
180 H. Li et al. / Aeolian Research 19 (2015) 171–182
lower than those of crushed samples, and correlations are betterbetween PM10 loss and the parameters of soil texture.
The different contents of particle size parameters in tested soils(dispersed PM2.5, PM10, clay, silt, and sand) led to great variation
of fugitive dust loss among the samples. Under the same windspeed, sand-sized grains of 0.1–0.15 mm are most easily entrainedand set into saltation, and as they return to the surface in the salta-tion trajectory, they ‘‘splash’’ into the bed, dislodging other grains

H. Li et al. / Aeolian Research 19 (2015) 171–182 181
to saltation and suspension (Bagnold, 1941; Anderson, 1987; Pyeand Tsoar, 1990; Willetts and Rice, 1989); therefore, saltation caus-es increased PM emission and soil loss. On the other hand, the finersoil loss will be restrained because of the cohesion and interparti-cle forces of grains. In general, the higher content of clay and silt inthe soil, the less dust released, so PM2.5 and PM10 concentrationobviously decreased following the increase in dispersed PM2.5,PM10, clay, and silt content, and their relationship demonstratesa negative correlation. Positively correlated relationships werefound between PM2.5 and PM10 emissions and sand and aggregatecontents.
Fig. 4 shows the correlation between total PM2.5 and PM10 lossof crushed (a) and uncrushed (b) samples at all three wind speeds.The results show they are positively and highly correlated (solidlines, R2 = 0.9592 and 0.861) and that PM10 loss increased asPM2.5 increased. The correlation for crushed samples was stronger.According to the fitted relationship of PM2.5 to PM10, PM2.5 canbe estimated by the PM10 emission in wind erosion models suchas WEPS. However, for prediction purposes in WEPS, the data werealso fit to a linear relationship with the intercept set to 0 (dashedline, Fig. 4b). This was done because PM2.5 is a component ofPM10. If the equation for uncrushed soils with intercept set to0.016 (Fig. 4b) was used to predict PM2.5, a value of zero enteredfor PM10 would result in a positive PM2.5, which is meaningless.The slope of the equation (0.1693) is the overall PM2.5/PM10 ratioand is similar to the limited data published by others (Ashbaughet al., 2003; Carvacho et al., 2004; Cowherd and Kuykendal,1997; Feng et al., 2011).
3.7. Management influence on PM emissions
In this study, sample Nos. 2, 4, 9, 12, and 16 are under no-till(NT) management, whereas samples Nos. 1, 3, 10, 11, and 15 areunder conventional (CV) management as paired samples fromthe same soil. Under both CV and NT, 8 m s�1 and 10 m s�1 windshowed PM2.5 and PM10 loss of uncrushed samples were moreinfluenced by clay content. In other words, PM loss was low whensoil has high clay content at the lower wind speeds, but when windspeed is higher (13 m s�1), the loss was influenced more by tillagemanagement. The PM2.5 and PM10 losses under CV were higherthan for NT. Table 9 shows the difference in the PM losses of CVand NT management at 3 speeds. For NT soils, PM2.5 losses ofuncrushed samples were lower than those of crushed samples at8, 10, and 13 m s�1 wind speed, except No. 16 at 8 m s�1. Thisresult is likely due to the lower WEF (<0.84 mm) and larger GMDin NT soils (Table 3). Moreover, most of the PM2.5/PM10 loss ratiosare higher for NT than for CV soils, which may be the result of lessPM10 relative to PM2.5 because GMD is larger than PM2.5 in NTsoils, indicating that NT management forms lager aggregates.
Although few significant differences were found, it is of interestto note that only one NT case out of 15 for uncrushed soils hadhigher PM2.5 loss than CV (Nos. 16 vs. 15 at 8 m s�1). Similarly,NT PM10 losses on uncrushed soils were greater than CV in only3 of 15 cases (Nos. 1 & 2 at 10 and 13 m s�1 and 15 & 16 at8 m s�1). These trends indicate that NT resulted in larger aggregatediameters than CV, which is supported by aggregate data in Table 3and others (Eynard et al., 2004; Blanco-Canqui and Lal, 2008).
PM2.5/PM10 loss ratios were generally higher on CV uncrushedsoils at 8 and 13 m s�1 wind speeds, whereas NT ratios were largerat 10 m s�1. Considering crushed soils, PM2.5 and PM10 lossesgenerally increased for both NT and CV soils as speeds increased.PM2.5 and PM10 did not show a pattern of NT higher than CV,except for one pair of samples (Nos. 10 and 9). No pattern is evi-dent for PM2.5/PM10 ratios of crushed soils.
4. Conclusions
PM2.5 and PM10 losses from samples increased with windspeed no matter the treatment (crushed and uncrushed) ormanagement (CV and NT), but a more rapid and greater trendwas evident for crushed samples. Emissions of PM2.5 and PM10from both crushed and uncrushed soils showed significant linearcorrelation. The PM2.5/PM10 ratio of crushed and uncrushedsamples ranged from 0.11 to 0.45 and 0.13 to 0.46, and thePM2.5 proportion of PM10 is higher from uncrushed samples thanfrom crushed ones. With increased wind speed, PM10 emissionincrease is more apparent than PM2.5 emission. Soil texture influ-enced PM emission, and the emissions from sandy samples (Nos. 7and 8) were higher than from other samples. PM2.5 and PM10emissions of tested soil and dispersed PM2.5, PM10, and clay con-tent in the soil exhibited a significant negative correlation (y = axb).Sand and <0.42-mm aggregate content show a significant linearcorrelation. PM2.5 and PM10 emission were influenced by dis-persed PM2.5, PM10, clay, and sand content of the soil, and theinfluence of clay content was especially significant. For uncrushedsoil samples, PM2.5 and PM10 emissions at low wind speed weremainly affected by clay content. Emissions at high wind speedswere easily affected by NT. PM emissions from CV soils were higherthan from NT soils. No-till management makes small particles formlarger aggregates. The lack of significant differences found betweenNT vs. CV losses, while still showing definite and consistent trends,warrants further study of the effects of NT vs. CV on aggregate sizedistribution and subsequent wind erosion loss. The structuralintegrity of farmland surfaces should be supported as much as pos-sible using NT and stubble farming measures that avoid frequentplowing to reduce soil wind erosion and PM2.5 and PM10 losses.
Acknowledgements
The authors thank Floyd E. Dowell (Agricultural Engineer,USDA-ARS) and Lawrence J. Hagen (retired Agricultural Engineer,USDA-ARS) for their valuable advice throughout this project. Wealso thank Neil Baker, Engineering Aid and Michelle Busch,Biological Aid, both USDA-ARS for their assistance with thelaboratory research. This is contribution number 15-083-J fromthe Kansas Agricultural Experiment Station.
References
Anderson, R.S., 1987. Eolian sediment transport as a stochastic process: the effectsof a fluctuating wind on particle trajectories. J. Geol. 95, 497–512.
Ashbaugh, L.L., Carvacho, O.F., Brown, M.S., Chow, J.C., Watson, J.G., Magliano, K.C.,2003. Soil sample collection and analysis for the fugitive dust characterizationstudy. Atmos. Environ. 37, 1163–1173.
Ashbaugh, L.L., Eldred, R.A., 2004. Loss of particle nitrate from Teflon samplingfilters: effects on measured gravimetric mass in California and in the IMPROVEnetwork. J. Air Waste Manage. Assoc. 54 (1), 93–104.
Bagnold, R.A., 1941. The Physics of Blown Sand and Desert Dunes. Metheun Press,London, 265 pp.
Blanco-Canqui, H., Lal, R., 2008. Principles of Soil Conservation. Springer Verlag,New York, 617 pp.
Carvacho, O.F., Ashbaugh, L.L., Brown, M.S., Flocchini, R.G., 2001. Relationshipbetween San Joaquin Valley soil texture and PMl0 emission potential using theUC Davis dust resuspension test chamber. Trans. ASAE 44 (6), 1603–1608.
Carvacho, O.F., Ashbaugh, L.L., Brown, M.S., Flocchini, R.G., 2004. Measurement ofPM 2.5 emission potential from soil using the UC Davis resuspension testchamber. Geomorphology 59, 75–80.
Chandler, D.G., Saxton, K.E., Kjelgaard, J., Busacca, A.J., 2002. A technique to measurefine-dust emission potentials during wind erosion. Soil Sci. Soc. Am. J. 66, 1127–1133.
Chepil, W.S., 1955. Factors that influence clod structure and erodibility of soil bywind: IV sand, silt and clay. Soil Sci. 80 (2), 155–162.
Chepil, W.S., Woodruff, N.P., 1957. Sedimentary characteristics of dust storms. PartII. Visibility and dust concentration. Am. J. Sci. 255, 104–114.
Cowherd, C., Kuykendal W., 1997. Fine Particle Components of PM10 from FugitiveDust Sources; Paper 97-WP96.04; Presented at the Annual Meeting of the Air &Waste Management Association.

182 H. Li et al. / Aeolian Research 19 (2015) 171–182
Eynard, A., Schumacher, T.E., Lindstrom, M.J., Malo, D.D., 2004. Aggregate sizes andstability in cultivated South Dakota prairie Ustolls and Usterts. Soil Sci. Soc. Am.J. 68, 1360–1365.
Feng, G., Sharratt, B., Wendling, L., 2011. Fine particle emission potential from loamsoils in a semiarid region. Soil Sci. Soc. Am. J. 75, 2262–2270.
Gee, G.W., Dani, O., 2002. Particle-size analysis. In: Dane, J.H., Topp, G.C. (Eds.),Methods of Soil Analysis: Part 4, Physical Methods: SSSA Book Series No. 5.SSSA, Madison, Wisconsin, pp. 255–293.
Gillette, D.A., 1986. Dust production by wind erosion: necessary conditions andestimates of vertical fluxes of dust and visibility reduction by dust. In: El-Baz, F.,Hassan, M.H.A. (Eds.), Physics of Desertification. Martinus Nijhoff Publisher,Dordrecht, The Netherlands, pp. 361–371.
Hagen, L.J., 2004a. Fine particulates (PM10 and PM 2.5) generated by breakage ofmobile aggregates during simulated wind erosion. Trans. ASAE 47 (1), 107–112.
Hagen, L.J., 2004b. Evaluation of the Wind Erosion Prediction System (WEPS)erosion submodel on cropland fields. Environ. Modell. Software 19 (2), 171–176.
Hagen, L.J., Skidmore, E.L., 1977. Wind erosion and visibility problems. Trans. ASAE20 (5), 898–903.
Hagen, L.J., Wagner, L.E., Skidmore, E.L., 1999. Analytical solutions and sensitivityanalyses for sediment transport in WEPS. Trans. ASAE 42 (6), 1715–1721.
Kjelgaard, J., Sharratt, B., Sundram, I., Lamb, B., Claiborn, C., Saxton, K., Chandler, D.,2004a. PM10 emission from agricultural soils on the Columbia Plateau:comparison of dynamic and time-integrated field-scale measurements andentrainment mechanisms. Agric. Forest Meteorol. 125 (3–4), 259–277.
Kjelgaard, J.F., Chandler, D.G., Saxton, D.E., 2004b. Evidence for direct suspension ofloessial soils on the Columbia Plateau. Earth Surf. Processes Landforms. 29 (2),221–236.
Klemm, R.J., Mason Jr., R.M., Heilig, C.M., Neas, L.M., Dockery, D.W., 2000. Is dailymortality associated specifically with fine particles? Data reconstruction andreplication of analyses. J. Air Waste Manage. Assoc. 50 (7), 1215–1222.
Kohake, D.J., Hagen, L.J., Skidmore, E.L., 2010. Wind erodibility of organic soils. SoilSci. Soc. Am. J. 74 (1), 250–257.
Larney, F.J., Bullock, M.S., Janzen, H.H., Ellert, B.H., Olson, E.C.S., 1998. Wind erosioneffects on nutrient redistribution and soil productivity. J. Soil Water Conserv.53, 133–140.
Leo, M.W.M., 1963. Determination of soil carbonates by a rapid gasometric method.Agric. Food Chem. 11 (6), 452–455.
Leys, J., 1999. Wind erosion on agricultural land. In: Goudie, A.S., Livingstone, I.,Stokes, S. (Eds.), Aeolian Environments, Sediments, and Landforms. John Wiley& Sons Ltd., New York, pp. 143–166.
Leys, J., McTainsh, G.H., 1999. Dust and nutrient deposition to riverineenvironments of south-eastern Australia. Z. Geomorph. N.F. 116, 59–76.
Lyles, L., Dickerson, J.D., Disrud, L.A., 1970. Modified rotary sieve for improvedaccuracy. Soil Sci. 109, 207–210.
Mirzamostafa, N., Hagen, L.J., Stone, L.L., Skidmore, E.L., 1998. Soil aggregate andtexture effects on suspension components from wind erosion. Soil Sci. Soc. Am.J. 62, 1351–1361.
Nimmo, J.R., Perkins, K.S., 2002. Aggregate stability and size distribution. In: Dane,J.H., Topp, G.C. (Eds.), Methods of soil analysis. Part 4, SSSA Book Ser. 5. SSSA,Madison, WI, pp. 317–327.
Ono, D., 2005. Ambient PM2.5/PM10 ratios for dust events from the Keeler Dunes.Great Basin Unifi ed Air Pollution Control District, Bishop, CA.
Ostro, B.D., Hurley, S., Lipsett, M.J., 1999. Air pollution and daily mortality in theCoachella Valley, California: a study of PM 10 dominated by coarse particles.Environ. Res. A 81, 231–238.
Pace, T.G., 2005. Examination of the Multiplier Used to Estimate PM2.5 FugitiveDust Emissions from PM10. US EPA Document. <www.epa.gov/ttnchie1/conference/ei14/session5/pace.pdf>.
Pope, C.A., Thun, M.J., Namboodiri, M.M., Dockery, D.W., Evans, J.S., Speizer, F.E.,Heath Jr., C.W., 1995. Particulate air pollution as a predictor of mortality in aprospective study of U.S. adults. Am. J. Respir. Crit. Care Med. 151, 669–674.
Pye, K., Tsoar, H., 1990. Aeolian Sand and Sand Dunes. Unwin Hyman Ltd., London,396 pp.
Roney, J.A., White, B.R., 2006. Estimating fugitive dust emission rates using anenvironmental boundary layer wind tunnel. Atmos. Environ. 40, 7668–7685.
Schwartz, J., Dockery, D.W., Neas, L.M., 1996. Is daily mortality associatedspecifically with fine particles? J. Air Waste Manage. Assoc. 46 (10), 927–939.
Schulte, E.E., Hopkins, B.G., 1996. Estimation of soil organic matter by weight-loss-on-ignition. In: Magdoff, F.R. et al. (Eds.), Soil Organic Matter: Analysis andInterpretation. SSSA Spec. Publ. 46, Madison, WI.
Skidmore, E.L., Hagen, L.J., Armburst, D.V., Durar, A.A., Fryrear, D.W., Potter, K.N.,Wagner, L.E., Zobeck, T.M., 1994. Methods for investigating basic processes andconditions affecting wind erosion. In: Lal, R. (Ed.), Soil Erosion ResearchMethods. Soil and Water Conserv. Soc. Ankeny, IA.
US EPA, 1996. Air Quality Criteria for Particulate Matter. Office of Research andDevelopment. EPA/600/P-95/001aF. Research Triangle Park, NC.
US EPA, 1999a. Compendium of Methods for the Determination of InorganicCompounds in Ambient Air. EPA/625/R-96/010a. Cincinnati, OH.
US EPA, 1999b. Sampling of ambient air for total suspended particulate matter(SPM) and PM10 using high volume (HV) sampler. Compendium Method IO-2.1.US-EPA, Cincinnati, OH.
US Federal Register, 2013. National Ambient Air Quality Standards for ParticulateMatter; Final Rule. Register 40 CFR Part 58, Vol. 78, No. 10 (15 Jan., 2013), pp.3086–3287; <www.gpo.gov>.
Van Pelt, R.S., Zobeck, T.M., Baddock, M.C., Cox, J.J., 2010. Design, construction, andcalibration of a portable boundary layer wind tunnel for field use. Trans. ASABE53 (5), 1413–1422.
Wagner, L.E., 2013. A history of wind erosion prediction models in the United StatesDepartment of Agriculture: The wind erosion prediction system (WEPS).Aeolian Res. 10, 9–24.
Willetts, B.B., Rice, R., 1989. Collisions of quartz grains with a sand bed: theinfluence of incident angle. Earth Surf. Processes Landforms 14, 719–730.
Zobeck, T.M., Fryrear, D.W., 1986. Chemical and physical characteristics ofwindblown sediment. II. Chemical characteristics and total soil and nutrientdischarge. Trans. ASAE 29, 1037–1041.